Brookings, OR Map & Demographics
Brookings Map
Brookings Overview
$43,686
PER CAPITA INCOME
$82,536
AVG FAMILY INCOME
$79,109
AVG HOUSEHOLD INCOME
52.1%
WAGE / INCOME GAP [ % ]
47.9¢/ $1
WAGE / INCOME GAP [ $ ]
0.35
INEQUALITY / GINI INDEX
6,719
TOTAL POPULATION
3,335
MALE POPULATION
3,384
FEMALE POPULATION
98.55
MALES / 100 FEMALES
101.47
FEMALES / 100 MALES
54.5
MEDIAN AGE
2.3
AVG FAMILY SIZE
2.0
AVG HOUSEHOLD SIZE
3,466
LABOR FORCE [ PEOPLE ]
57.9%
PERCENT IN LABOR FORCE
8.2%
UNEMPLOYMENT RATE
Brookings Zip Codes
Brookings Area Codes
Income in Brookings
Income Overview in Brookings
Per Capita Income in Brookings is $43,686, while median incomes of families and households are $82,536 and $79,109 respectively.
| Characteristic | Number | Measure |
| Per Capita Income | 6,719 | $43,686 |
| Median Family Income | 2,231 | $82,536 |
| Mean Family Income | 2,231 | $100,486 |
| Median Household Income | 3,193 | $79,109 |
| Mean Household Income | 3,193 | $91,741 |
| Income Deficit | 2,231 | $0 |
| Wage / Income Gap (%) | 6,719 | 52.15% |
| Wage / Income Gap ($) | 6,719 | 47.85¢ per $1 |
| Gini / Inequality Index | 6,719 | 0.35 |
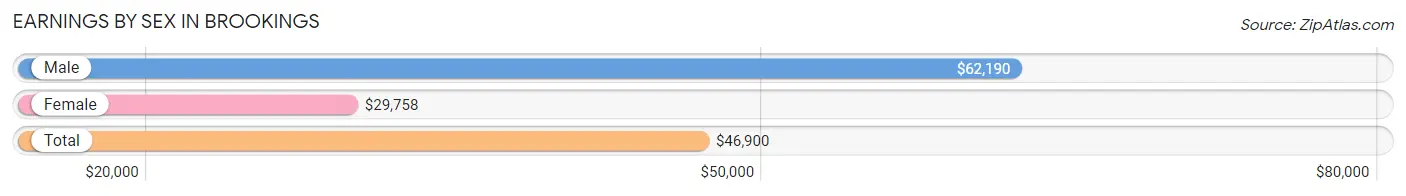
Earnings by Sex in Brookings
Average Earnings in Brookings are $46,900, $62,190 for men and $29,758 for women, a difference of 52.1%.
| Sex | Number | Average Earnings |
| Male | 1,969 (57.2%) | $62,190 |
| Female | 1,476 (42.8%) | $29,758 |
| Total | 3,445 (100.0%) | $46,900 |
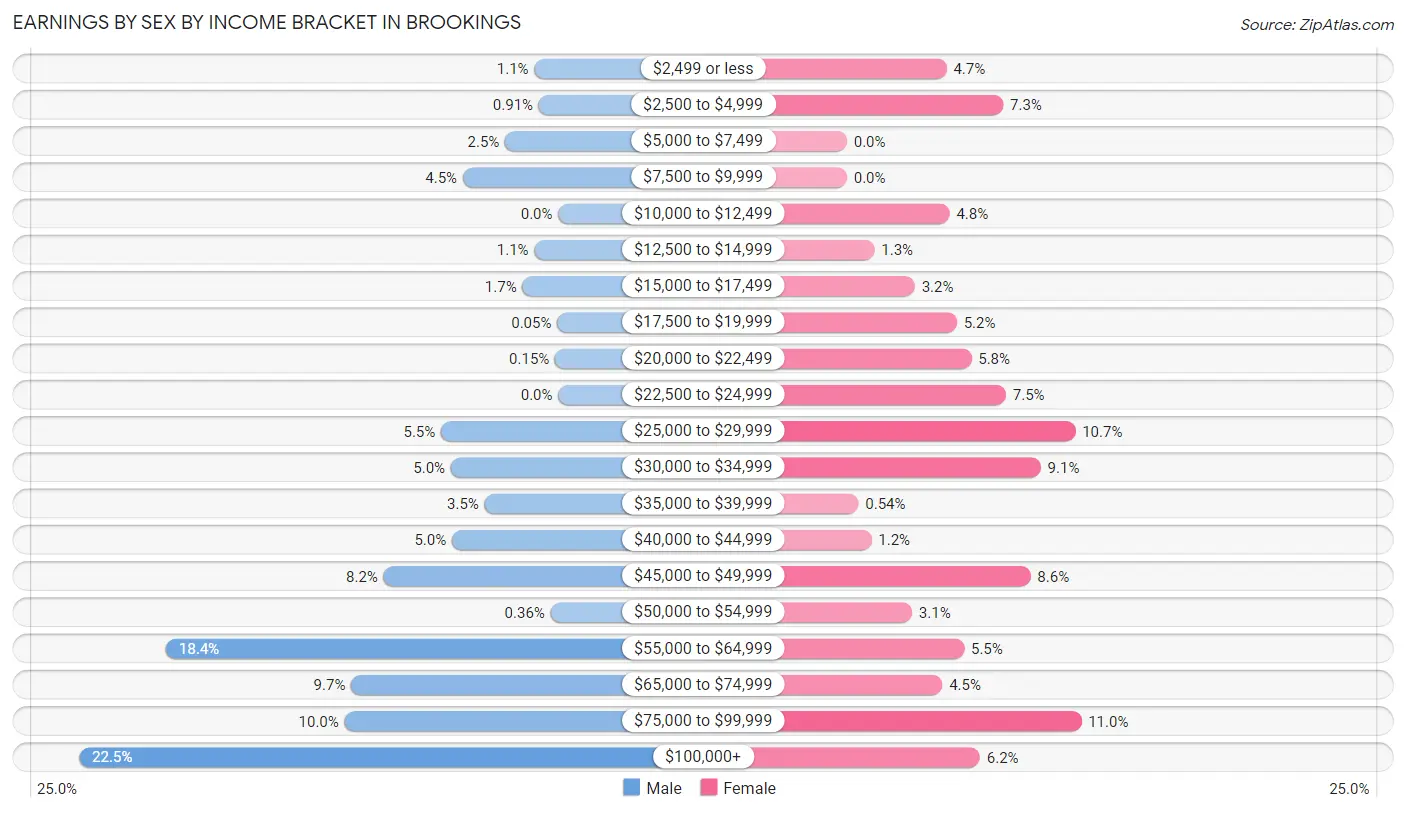
Earnings by Sex by Income Bracket in Brookings
The most common earnings brackets in Brookings are $100,000+ for men (442 | 22.5%) and $75,000 to $99,999 for women (162 | 11.0%).
| Income | Male | Female |
| $2,499 or less | 22 (1.1%) | 69 (4.7%) |
| $2,500 to $4,999 | 18 (0.9%) | 108 (7.3%) |
| $5,000 to $7,499 | 49 (2.5%) | 0 (0.0%) |
| $7,500 to $9,999 | 88 (4.5%) | 0 (0.0%) |
| $10,000 to $12,499 | 0 (0.0%) | 71 (4.8%) |
| $12,500 to $14,999 | 22 (1.1%) | 19 (1.3%) |
| $15,000 to $17,499 | 33 (1.7%) | 47 (3.2%) |
| $17,500 to $19,999 | 1 (0.1%) | 76 (5.1%) |
| $20,000 to $22,499 | 3 (0.2%) | 86 (5.8%) |
| $22,500 to $24,999 | 0 (0.0%) | 110 (7.4%) |
| $25,000 to $29,999 | 108 (5.5%) | 158 (10.7%) |
| $30,000 to $34,999 | 99 (5.0%) | 134 (9.1%) |
| $35,000 to $39,999 | 68 (3.5%) | 8 (0.5%) |
| $40,000 to $44,999 | 98 (5.0%) | 17 (1.1%) |
| $45,000 to $49,999 | 161 (8.2%) | 127 (8.6%) |
| $50,000 to $54,999 | 7 (0.4%) | 45 (3.0%) |
| $55,000 to $64,999 | 362 (18.4%) | 81 (5.5%) |
| $65,000 to $74,999 | 191 (9.7%) | 66 (4.5%) |
| $75,000 to $99,999 | 197 (10.0%) | 162 (11.0%) |
| $100,000+ | 442 (22.5%) | 92 (6.2%) |
| Total | 1,969 (100.0%) | 1,476 (100.0%) |
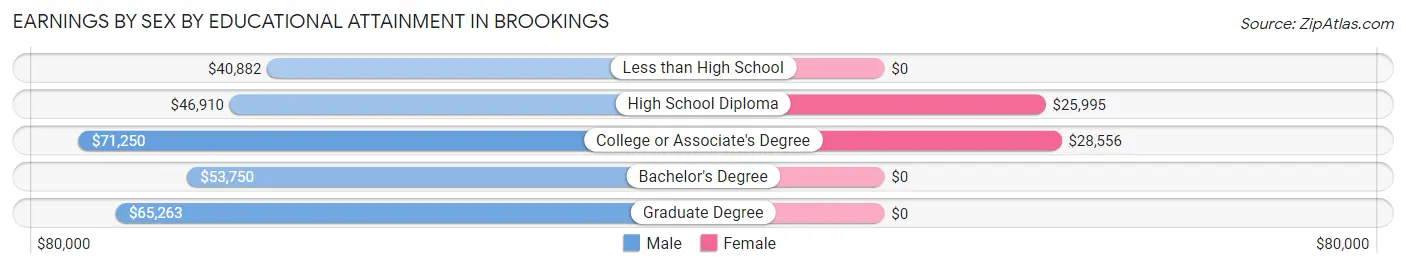
Earnings by Sex by Educational Attainment in Brookings
Average earnings in Brookings are $62,920 for men and $31,149 for women, a difference of 50.5%. Men with an educational attainment of college or associate's degree enjoy the highest average annual earnings of $71,250, while those with less than high school education earn the least with $40,882. Women with an educational attainment of college or associate's degree earn the most with the average annual earnings of $28,556, while those with high school diploma education have the smallest earnings of $25,995.
| Educational Attainment | Male Income | Female Income |
| Less than High School | $40,882 | $0 |
| High School Diploma | $46,910 | $25,995 |
| College or Associate's Degree | $71,250 | $28,556 |
| Bachelor's Degree | $53,750 | $0 |
| Graduate Degree | $65,263 | $0 |
| Total | $62,920 | $31,149 |
Family Income in Brookings
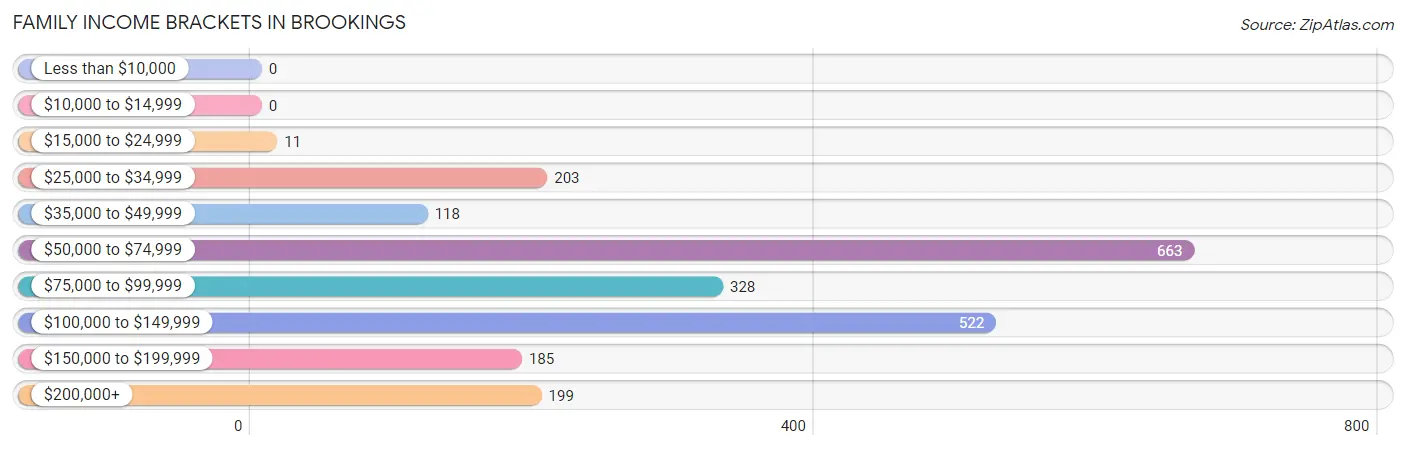
Family Income Brackets in Brookings
According to the Brookings family income data, there are 663 families falling into the $50,000 to $74,999 income range, which is the most common income bracket and makes up 29.7% of all families.
| Income Bracket | # Families | % Families |
| Less than $10,000 | 0 | 0.0% |
| $10,000 to $14,999 | 0 | 0.0% |
| $15,000 to $24,999 | 11 | 0.5% |
| $25,000 to $34,999 | 203 | 9.1% |
| $35,000 to $49,999 | 118 | 5.3% |
| $50,000 to $74,999 | 663 | 29.7% |
| $75,000 to $99,999 | 328 | 14.7% |
| $100,000 to $149,999 | 522 | 23.4% |
| $150,000 to $199,999 | 185 | 8.3% |
| $200,000+ | 199 | 8.9% |
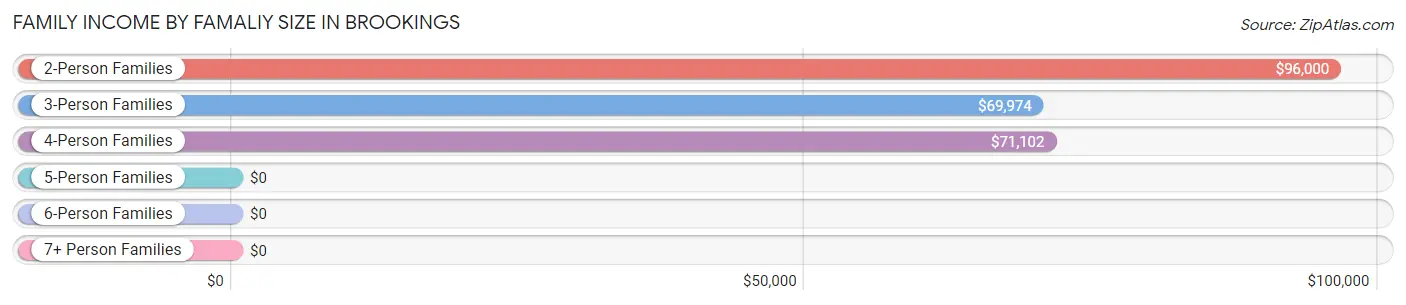
Family Income by Famaliy Size in Brookings
2-person families (1,440 | 64.5%) account for the highest median family income in Brookings with $96,000 per family, while 2-person families (1,440 | 64.5%) have the highest median income of $48,000 per family member.
| Income Bracket | # Families | Median Income |
| 2-Person Families | 1,440 (64.5%) | $96,000 |
| 3-Person Families | 392 (17.6%) | $69,974 |
| 4-Person Families | 306 (13.7%) | $71,102 |
| 5-Person Families | 83 (3.7%) | $0 |
| 6-Person Families | 10 (0.4%) | $0 |
| 7+ Person Families | 0 (0.0%) | $0 |
| Total | 2,231 (100.0%) | $82,536 |
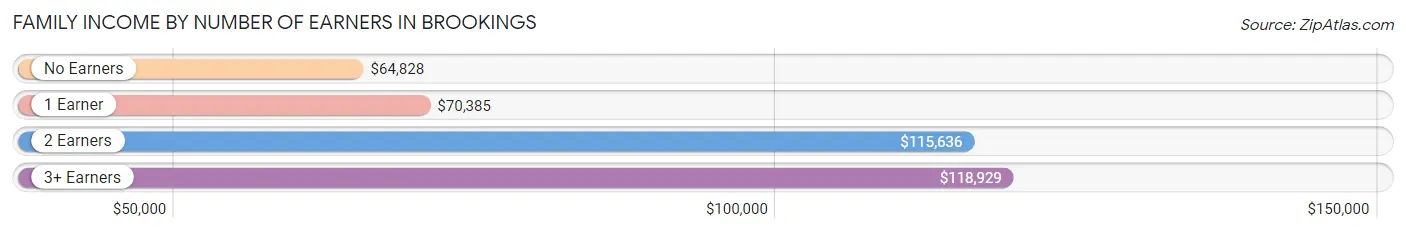
Family Income by Number of Earners in Brookings
The median family income in Brookings is $82,536, with families comprising 3+ earners (104) having the highest median family income of $118,929, while families with no earners (458) have the lowest median family income of $64,828, accounting for 4.7% and 20.5% of families, respectively.
| Number of Earners | # Families | Median Income |
| No Earners | 458 (20.5%) | $64,828 |
| 1 Earner | 798 (35.8%) | $70,385 |
| 2 Earners | 871 (39.0%) | $115,636 |
| 3+ Earners | 104 (4.7%) | $118,929 |
| Total | 2,231 (100.0%) | $82,536 |
Household Income in Brookings
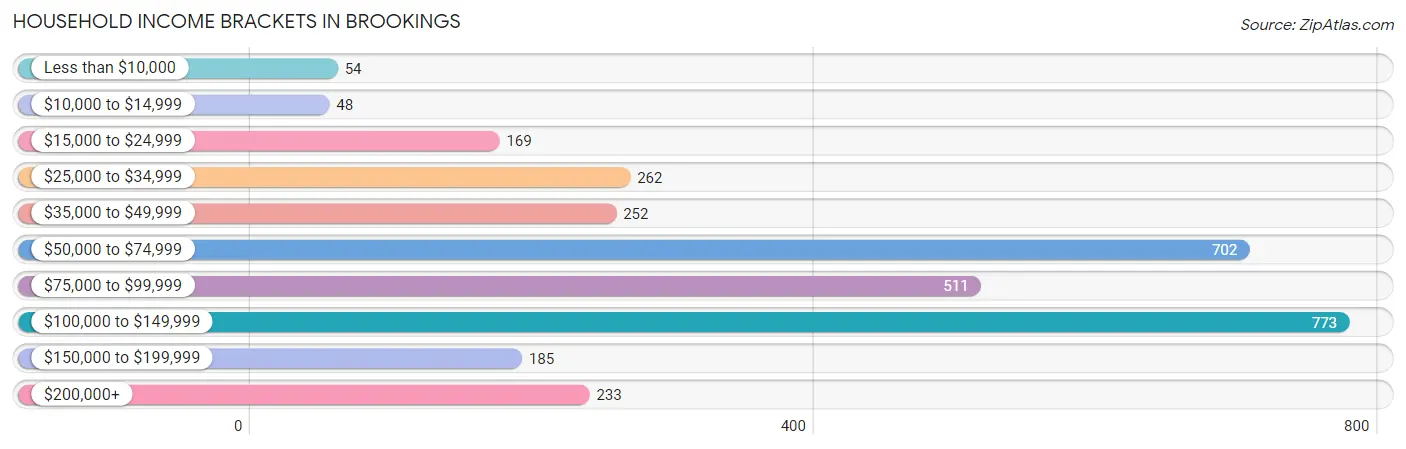
Household Income Brackets in Brookings
With 773 households falling in the category, the $100,000 to $149,999 income range is the most frequent in Brookings, accounting for 24.2% of all households. In contrast, only 48 households (1.5%) fall into the $10,000 to $14,999 income bracket, making it the least populous group.
| Income Bracket | # Households | % Households |
| Less than $10,000 | 54 | 1.7% |
| $10,000 to $14,999 | 48 | 1.5% |
| $15,000 to $24,999 | 169 | 5.3% |
| $25,000 to $34,999 | 262 | 8.2% |
| $35,000 to $49,999 | 252 | 7.9% |
| $50,000 to $74,999 | 702 | 22.0% |
| $75,000 to $99,999 | 511 | 16.0% |
| $100,000 to $149,999 | 773 | 24.2% |
| $150,000 to $199,999 | 185 | 5.8% |
| $200,000+ | 233 | 7.3% |
Household Income by Householder Age in Brookings
The median household income in Brookings is $79,109, with the highest median household income of $86,797 found in the 45 to 64 years age bracket for the primary householder. A total of 1,028 households (32.2%) fall into this category.
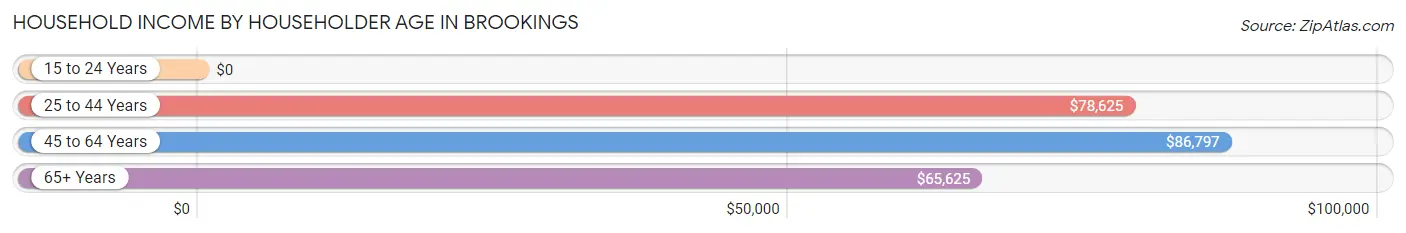
| Income Bracket | # Households | Median Income |
| 15 to 24 Years | 0 (0.0%) | $0 |
| 25 to 44 Years | 1,015 (31.8%) | $78,625 |
| 45 to 64 Years | 1,028 (32.2%) | $86,797 |
| 65+ Years | 1,150 (36.0%) | $65,625 |
| Total | 3,193 (100.0%) | $79,109 |
Poverty in Brookings
Income Below Poverty by Sex and Age in Brookings
With 7.0% poverty level for males and 6.0% for females among the residents of Brookings, 45 to 54 year old males and 25 to 34 year old females are the most vulnerable to poverty, with 65 males (22.0%) and 84 females (18.9%) in their respective age groups living below the poverty level.
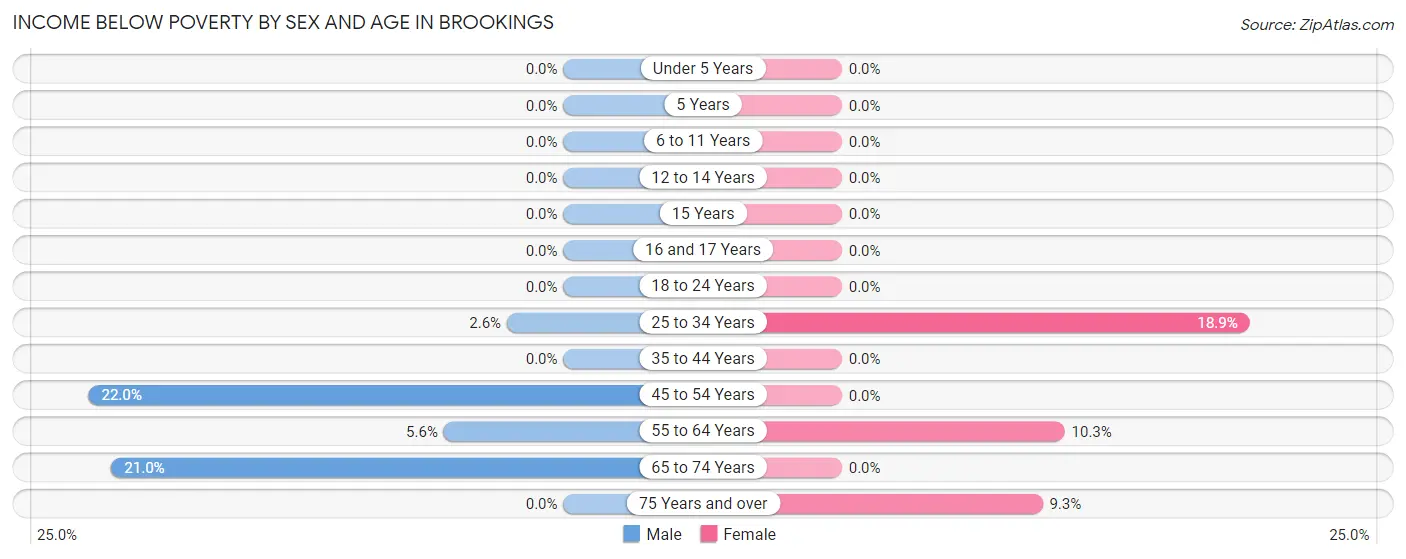
| Age Bracket | Male | Female |
| Under 5 Years | 0 (0.0%) | 0 (0.0%) |
| 5 Years | 0 (0.0%) | 0 (0.0%) |
| 6 to 11 Years | 0 (0.0%) | 0 (0.0%) |
| 12 to 14 Years | 0 (0.0%) | 0 (0.0%) |
| 15 Years | 0 (0.0%) | 0 (0.0%) |
| 16 and 17 Years | 0 (0.0%) | 0 (0.0%) |
| 18 to 24 Years | 0 (0.0%) | 0 (0.0%) |
| 25 to 34 Years | 19 (2.6%) | 84 (18.9%) |
| 35 to 44 Years | 0 (0.0%) | 0 (0.0%) |
| 45 to 54 Years | 65 (22.0%) | 0 (0.0%) |
| 55 to 64 Years | 42 (5.6%) | 77 (10.3%) |
| 65 to 74 Years | 104 (21.0%) | 0 (0.0%) |
| 75 Years and over | 0 (0.0%) | 39 (9.3%) |
| Total | 230 (7.0%) | 200 (6.0%) |
Income Above Poverty by Sex and Age in Brookings
According to the poverty statistics in Brookings, males aged under 5 years and females aged under 5 years are the age groups that are most secure financially, with 100.0% of males and 100.0% of females in these age groups living above the poverty line.
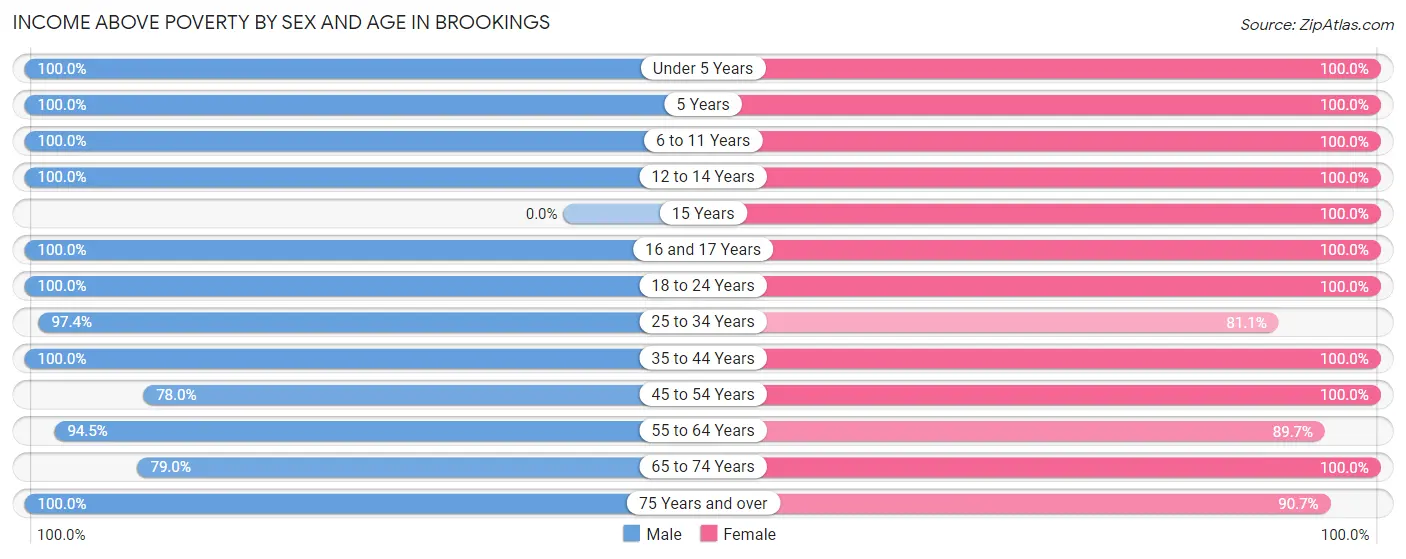
| Age Bracket | Male | Female |
| Under 5 Years | 113 (100.0%) | 130 (100.0%) |
| 5 Years | 23 (100.0%) | 58 (100.0%) |
| 6 to 11 Years | 181 (100.0%) | 86 (100.0%) |
| 12 to 14 Years | 82 (100.0%) | 6 (100.0%) |
| 15 Years | 0 (0.0%) | 43 (100.0%) |
| 16 and 17 Years | 21 (100.0%) | 101 (100.0%) |
| 18 to 24 Years | 72 (100.0%) | 46 (100.0%) |
| 25 to 34 Years | 705 (97.4%) | 360 (81.1%) |
| 35 to 44 Years | 196 (100.0%) | 325 (100.0%) |
| 45 to 54 Years | 230 (78.0%) | 467 (100.0%) |
| 55 to 64 Years | 715 (94.5%) | 668 (89.7%) |
| 65 to 74 Years | 392 (79.0%) | 458 (100.0%) |
| 75 Years and over | 343 (100.0%) | 380 (90.7%) |
| Total | 3,073 (93.0%) | 3,128 (94.0%) |
Income Below Poverty Among Married-Couple Families in Brookings
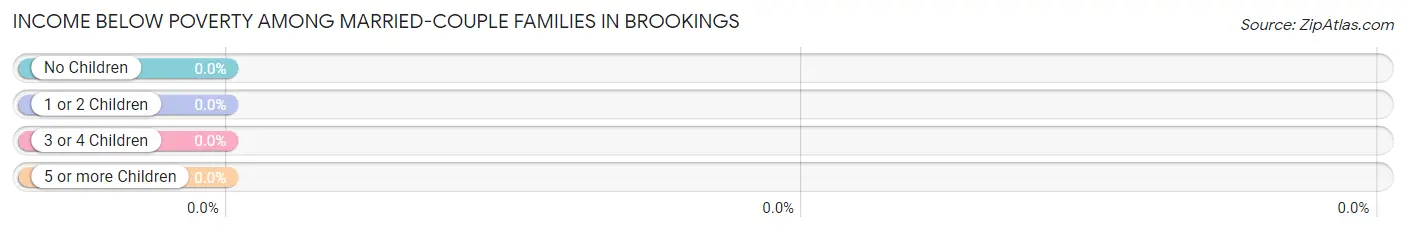
| Children | Above Poverty | Below Poverty |
| No Children | 1,320 (100.0%) | 0 (0.0%) |
| 1 or 2 Children | 402 (100.0%) | 0 (0.0%) |
| 3 or 4 Children | 10 (100.0%) | 0 (0.0%) |
| 5 or more Children | 0 (0.0%) | 0 (0.0%) |
| Total | 1,732 (100.0%) | 0 (0.0%) |
Income Below Poverty Among Single-Parent Households in Brookings
| Children | Single Father | Single Mother |
| No Children | 0 (0.0%) | 0 (0.0%) |
| 1 or 2 Children | 0 (0.0%) | 0 (0.0%) |
| 3 or 4 Children | 0 (0.0%) | 0 (0.0%) |
| 5 or more Children | 0 (0.0%) | 0 (0.0%) |
| Total | 0 (0.0%) | 0 (0.0%) |
Income Below Poverty Among Married-Couple vs Single-Parent Households in Brookings
| Children | Married-Couple Families | Single-Parent Households |
| No Children | 0 (0.0%) | 0 (0.0%) |
| 1 or 2 Children | 0 (0.0%) | 0 (0.0%) |
| 3 or 4 Children | 0 (0.0%) | 0 (0.0%) |
| 5 or more Children | 0 (0.0%) | 0 (0.0%) |
| Total | 0 (0.0%) | 0 (0.0%) |
Race in Brookings
The most populous races in Brookings are White / Caucasian (5,941 | 88.4%), Hispanic or Latino (626 | 9.3%), and Two or more Races (450 | 6.7%).
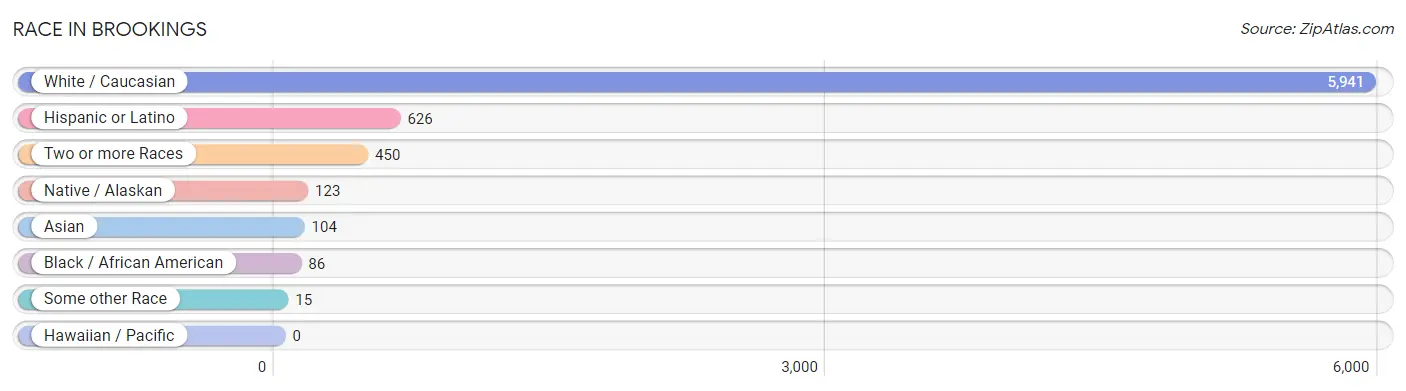
| Race | # Population | % Population |
| Asian | 104 | 1.5% |
| Black / African American | 86 | 1.3% |
| Hawaiian / Pacific | 0 | 0.0% |
| Hispanic or Latino | 626 | 9.3% |
| Native / Alaskan | 123 | 1.8% |
| White / Caucasian | 5,941 | 88.4% |
| Two or more Races | 450 | 6.7% |
| Some other Race | 15 | 0.2% |
| Total | 6,719 | 100.0% |
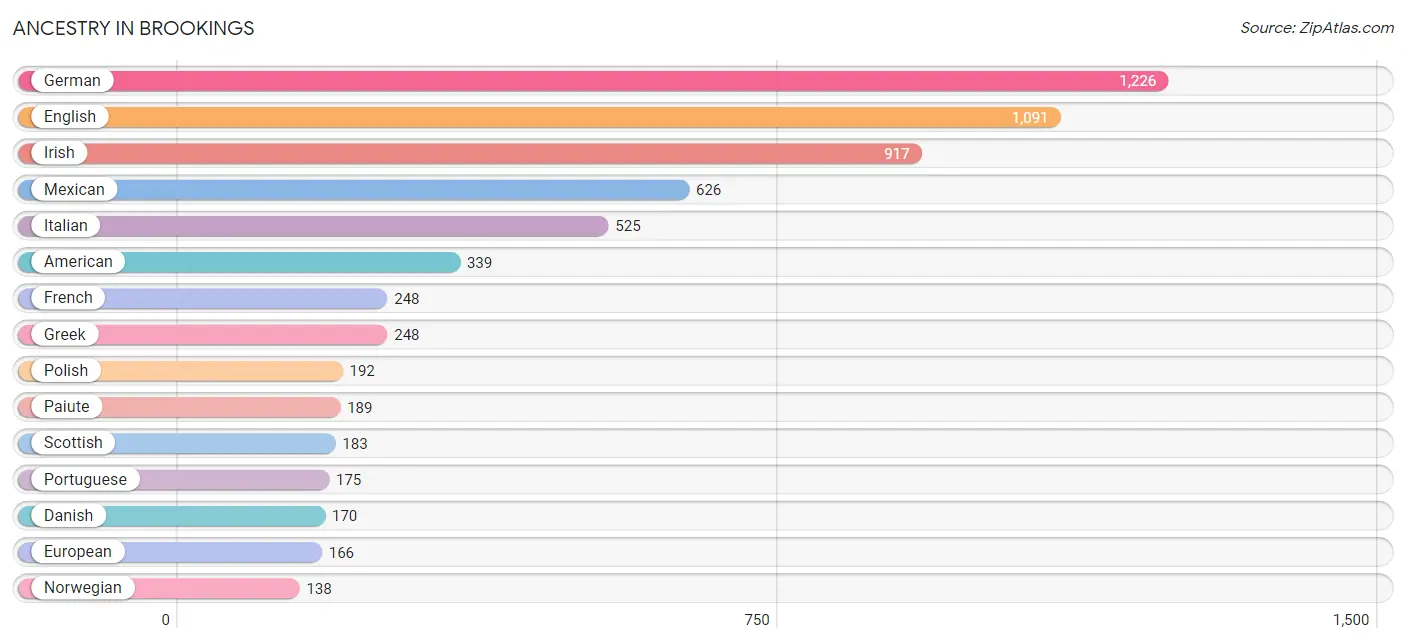
Ancestry in Brookings
The most populous ancestries reported in Brookings are German (1,226 | 18.2%), English (1,091 | 16.2%), Irish (917 | 13.7%), Mexican (626 | 9.3%), and Italian (525 | 7.8%), together accounting for 65.3% of all Brookings residents.
| Ancestry | # Population | % Population |
| Afghan | 10 | 0.2% |
| American | 339 | 5.1% |
| Austrian | 13 | 0.2% |
| Bhutanese | 10 | 0.2% |
| Blackfeet | 8 | 0.1% |
| British | 50 | 0.7% |
| Cambodian | 42 | 0.6% |
| Canadian | 19 | 0.3% |
| Cherokee | 1 | 0.0% |
| Croatian | 97 | 1.4% |
| Czech | 41 | 0.6% |
| Danish | 170 | 2.5% |
| Dutch | 37 | 0.5% |
| Eastern European | 16 | 0.2% |
| English | 1,091 | 16.2% |
| European | 166 | 2.5% |
| Finnish | 59 | 0.9% |
| French | 248 | 3.7% |
| French Canadian | 71 | 1.1% |
| German | 1,226 | 18.2% |
| Greek | 248 | 3.7% |
| Indian (Asian) | 60 | 0.9% |
| Irish | 917 | 13.7% |
| Iroquois | 9 | 0.1% |
| Italian | 525 | 7.8% |
| Korean | 46 | 0.7% |
| Mexican | 626 | 9.3% |
| Native Hawaiian | 23 | 0.3% |
| Northern European | 96 | 1.4% |
| Norwegian | 138 | 2.1% |
| Paiute | 189 | 2.8% |
| Polish | 192 | 2.9% |
| Portuguese | 175 | 2.6% |
| Russian | 38 | 0.6% |
| Scandinavian | 31 | 0.5% |
| Scotch-Irish | 56 | 0.8% |
| Scottish | 183 | 2.7% |
| Swedish | 136 | 2.0% |
| Swiss | 59 | 0.9% |
| Ukrainian | 2 | 0.0% |
| Welsh | 58 | 0.9% | View All 41 Rows |
Immigrants in Brookings
The most numerous immigrant groups reported in Brookings came from Latin America (271 | 4.0%), Central America (180 | 2.7%), Mexico (180 | 2.7%), Asia (148 | 2.2%), and Europe (138 | 2.1%), together accounting for 13.6% of all Brookings residents.
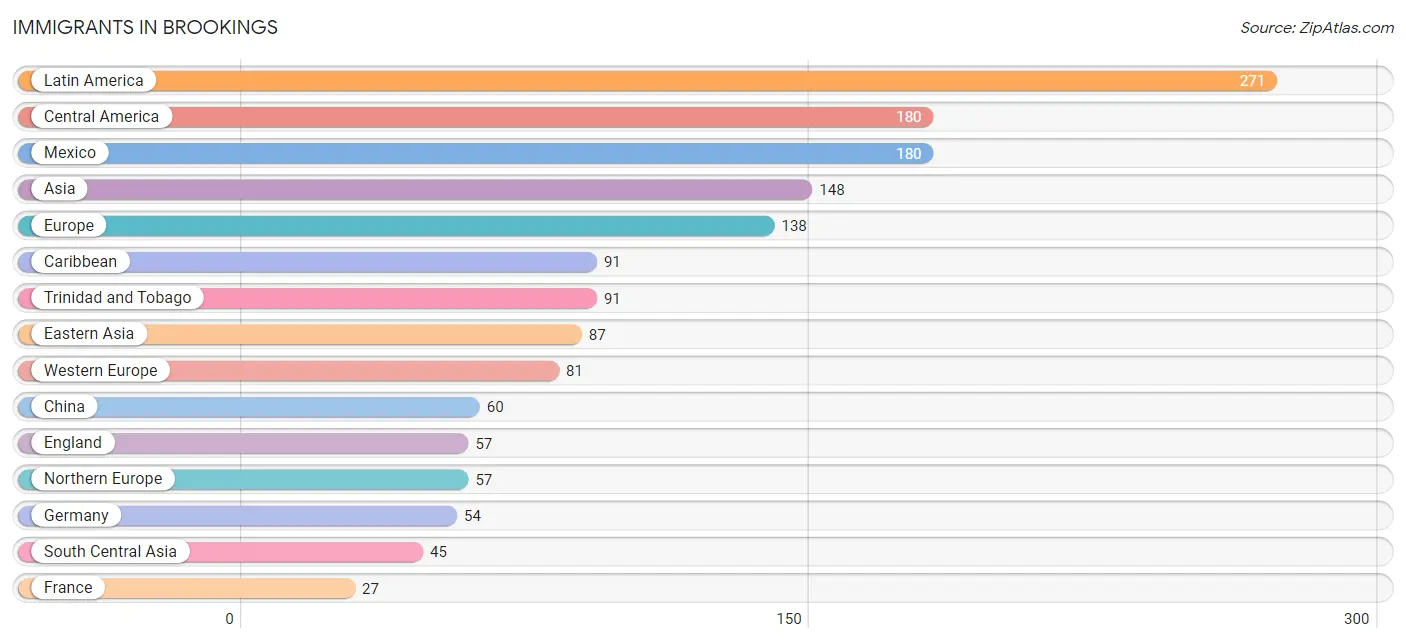
| Immigration Origin | # Population | % Population |
| Afghanistan | 18 | 0.3% |
| Asia | 148 | 2.2% |
| Canada | 19 | 0.3% |
| Caribbean | 91 | 1.3% |
| Central America | 180 | 2.7% |
| China | 60 | 0.9% |
| Eastern Asia | 87 | 1.3% |
| England | 57 | 0.9% |
| Europe | 138 | 2.1% |
| France | 27 | 0.4% |
| Germany | 54 | 0.8% |
| Iran | 27 | 0.4% |
| Japan | 27 | 0.4% |
| Latin America | 271 | 4.0% |
| Mexico | 180 | 2.7% |
| Northern Europe | 57 | 0.9% |
| Philippines | 16 | 0.2% |
| South Central Asia | 45 | 0.7% |
| South Eastern Asia | 16 | 0.2% |
| Trinidad and Tobago | 91 | 1.3% |
| Western Europe | 81 | 1.2% | View All 21 Rows |
Sex and Age in Brookings
Sex and Age in Brookings
The most populous age groups in Brookings are 60 to 64 Years (521 | 15.6%) for men and 55 to 59 Years (381 | 11.3%) for women.
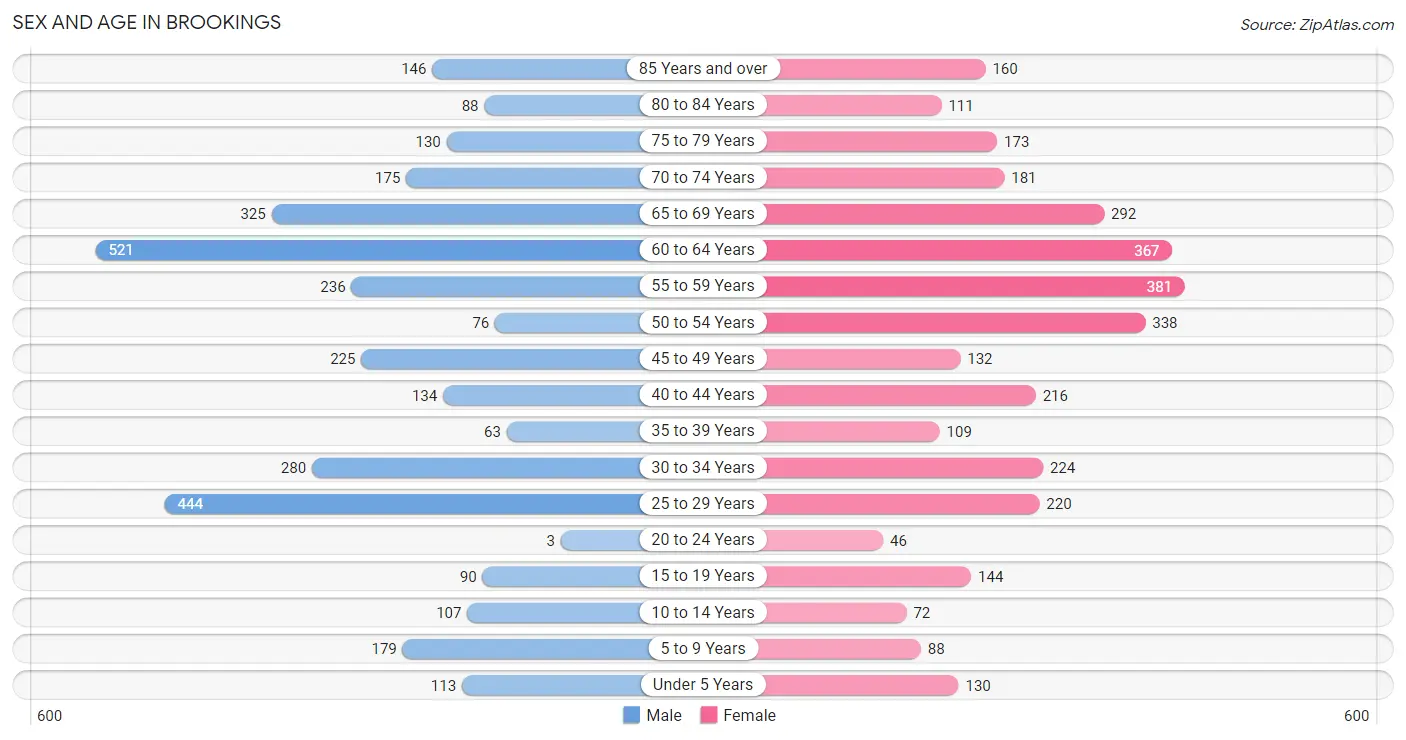
| Age Bracket | Male | Female |
| Under 5 Years | 113 (3.4%) | 130 (3.8%) |
| 5 to 9 Years | 179 (5.4%) | 88 (2.6%) |
| 10 to 14 Years | 107 (3.2%) | 72 (2.1%) |
| 15 to 19 Years | 90 (2.7%) | 144 (4.3%) |
| 20 to 24 Years | 3 (0.1%) | 46 (1.4%) |
| 25 to 29 Years | 444 (13.3%) | 220 (6.5%) |
| 30 to 34 Years | 280 (8.4%) | 224 (6.6%) |
| 35 to 39 Years | 63 (1.9%) | 109 (3.2%) |
| 40 to 44 Years | 134 (4.0%) | 216 (6.4%) |
| 45 to 49 Years | 225 (6.8%) | 132 (3.9%) |
| 50 to 54 Years | 76 (2.3%) | 338 (10.0%) |
| 55 to 59 Years | 236 (7.1%) | 381 (11.3%) |
| 60 to 64 Years | 521 (15.6%) | 367 (10.8%) |
| 65 to 69 Years | 325 (9.8%) | 292 (8.6%) |
| 70 to 74 Years | 175 (5.2%) | 181 (5.3%) |
| 75 to 79 Years | 130 (3.9%) | 173 (5.1%) |
| 80 to 84 Years | 88 (2.6%) | 111 (3.3%) |
| 85 Years and over | 146 (4.4%) | 160 (4.7%) |
| Total | 3,335 (100.0%) | 3,384 (100.0%) |
Families and Households in Brookings
Median Family Size in Brookings
The median family size in Brookings is 2.32 persons per family, with married-couple families (1,732 | 77.6%) accounting for the largest median family size of 2.42 persons per family. On the other hand, single male/father families (255 | 11.4%) represent the smallest median family size with 1.89 persons per family.
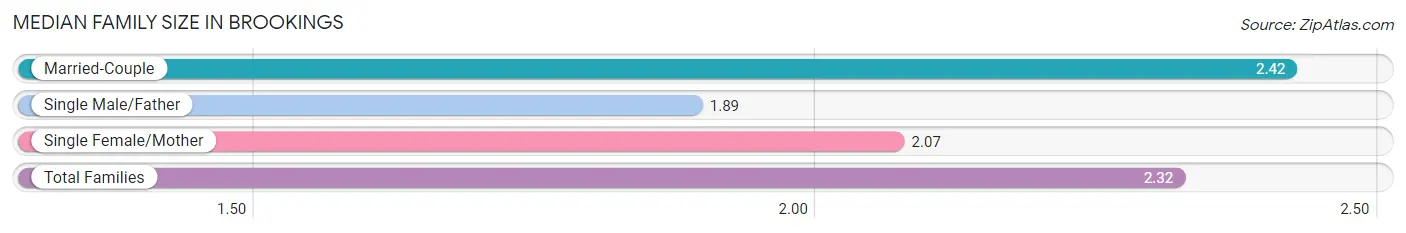
| Family Type | # Families | Family Size |
| Married-Couple | 1,732 (77.6%) | 2.42 |
| Single Male/Father | 255 (11.4%) | 1.89 |
| Single Female/Mother | 244 (10.9%) | 2.07 |
| Total Families | 2,231 (100.0%) | 2.32 |
Median Household Size in Brookings
The median household size in Brookings is 2.05 persons per household, with married-couple households (1,732 | 54.2%) accounting for the largest median household size of 2.43 persons per household. non-family households (962 | 30.1%) represent the smallest median household size with 1.27 persons per household.
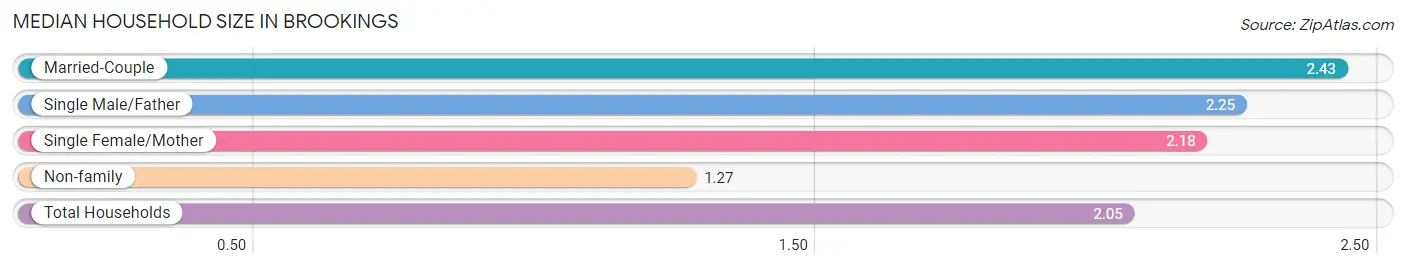
| Household Type | # Households | Household Size |
| Married-Couple | 1,732 (54.2%) | 2.43 |
| Single Male/Father | 255 (8.0%) | 2.25 |
| Single Female/Mother | 244 (7.6%) | 2.18 |
| Non-family | 962 (30.1%) | 1.27 |
| Total Households | 3,193 (100.0%) | 2.05 |
Household Size by Marriage Status in Brookings
Out of a total of 3,193 households in Brookings, 2,231 (69.9%) are family households, while 962 (30.1%) are nonfamily households. The most numerous type of family households are 2-person households, comprising 1,286, and the most common type of nonfamily households are 1-person households, comprising 698.
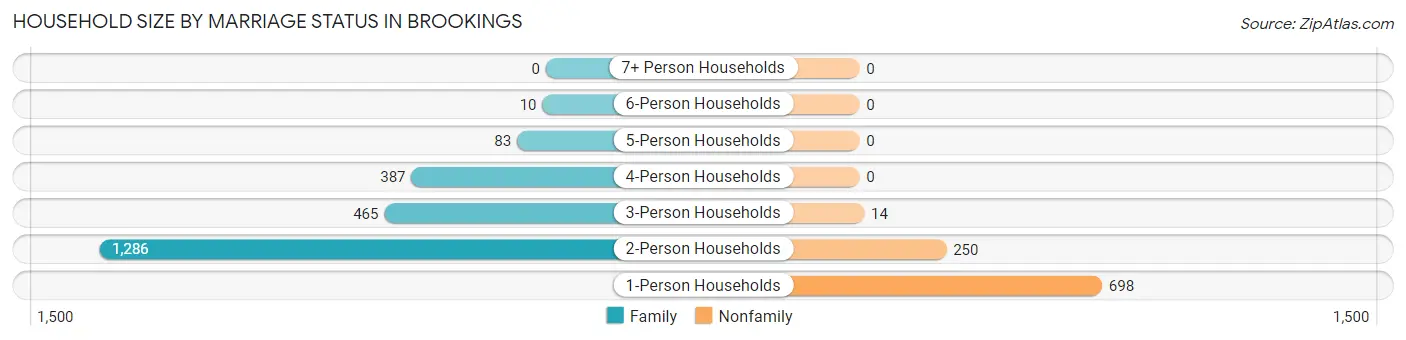
| Household Size | Family Households | Nonfamily Households |
| 1-Person Households | - | 698 (21.9%) |
| 2-Person Households | 1,286 (40.3%) | 250 (7.8%) |
| 3-Person Households | 465 (14.6%) | 14 (0.4%) |
| 4-Person Households | 387 (12.1%) | 0 (0.0%) |
| 5-Person Households | 83 (2.6%) | 0 (0.0%) |
| 6-Person Households | 10 (0.3%) | 0 (0.0%) |
| 7+ Person Households | 0 (0.0%) | 0 (0.0%) |
| Total | 2,231 (69.9%) | 962 (30.1%) |
Female Fertility in Brookings
Fertility by Age in Brookings
Average fertility rate in Brookings is 123.0 births per 1,000 women. Women in the age bracket of 20 to 34 years have the highest fertility rate with 267.0 births per 1,000 women. Women in the age bracket of 20 to 34 years acount for 96.3% of all women with births.
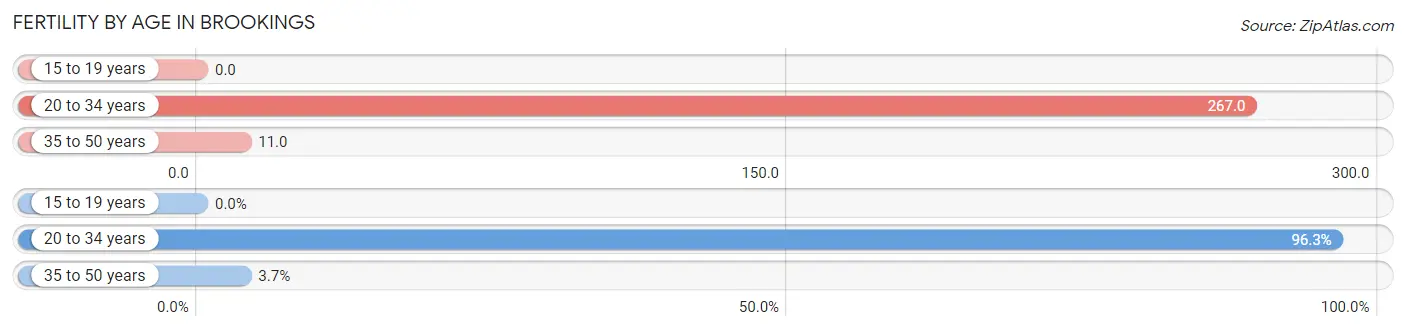
| Age Bracket | Women with Births | Births / 1,000 Women |
| 15 to 19 years | 0 (0.0%) | 0.0 |
| 20 to 34 years | 131 (96.3%) | 267.0 |
| 35 to 50 years | 5 (3.7%) | 11.0 |
| Total | 136 (100.0%) | 123.0 |
Fertility by Age by Marriage Status in Brookings
26.5% of women with births (136) in Brookings are married. The highest percentage of unmarried women with births falls into 35 to 50 years age bracket with 100.0% of them unmarried at the time of birth, while the lowest percentage of unmarried women with births belong to 20 to 34 years age bracket with 72.5% of them unmarried.
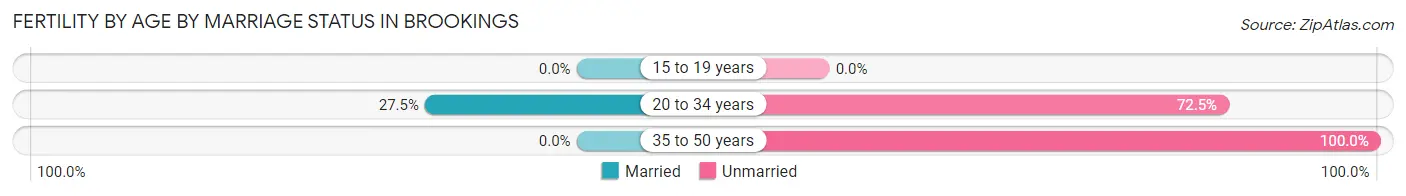
| Age Bracket | Married | Unmarried |
| 15 to 19 years | 0 (0.0%) | 0 (0.0%) |
| 20 to 34 years | 36 (27.5%) | 95 (72.5%) |
| 35 to 50 years | 0 (0.0%) | 5 (100.0%) |
| Total | 36 (26.5%) | 100 (73.5%) |
Fertility by Education in Brookings
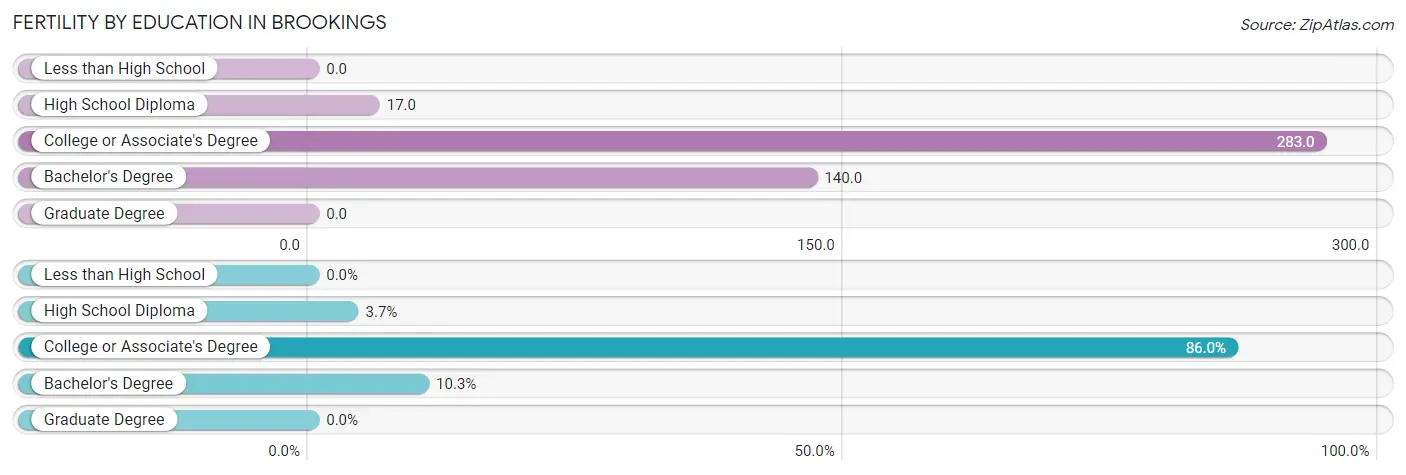
| Educational Attainment | Women with Births | Births / 1,000 Women |
| Less than High School | 0 (0.0%) | 0.0 |
| High School Diploma | 5 (3.7%) | 17.0 |
| College or Associate's Degree | 117 (86.0%) | 283.0 |
| Bachelor's Degree | 14 (10.3%) | 140.0 |
| Graduate Degree | 0 (0.0%) | 0.0 |
| Total | 136 (100.0%) | 123.0 |
Fertility by Education by Marriage Status in Brookings
73.5% of women with births in Brookings are unmarried. Women with the educational attainment of bachelor's degree are most likely to be married with 100.0% of them married at childbirth, while women with the educational attainment of high school diploma are least likely to be married with 100.0% of them unmarried at childbirth.
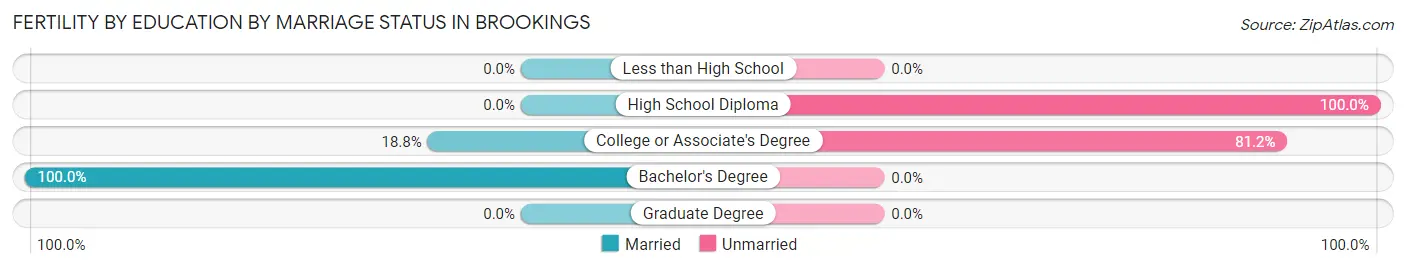
| Educational Attainment | Married | Unmarried |
| Less than High School | 0 (0.0%) | 0 (0.0%) |
| High School Diploma | 0 (0.0%) | 5 (100.0%) |
| College or Associate's Degree | 22 (18.8%) | 95 (81.2%) |
| Bachelor's Degree | 14 (100.0%) | 0 (0.0%) |
| Graduate Degree | 0 (0.0%) | 0 (0.0%) |
| Total | 36 (26.5%) | 100 (73.5%) |
Employment Characteristics in Brookings
Employment by Class of Employer in Brookings
Among the 3,023 employed individuals in Brookings, private company employees (1,531 | 50.6%), state government employees (768 | 25.4%), and local government employees (326 | 10.8%) make up the most common classes of employment.
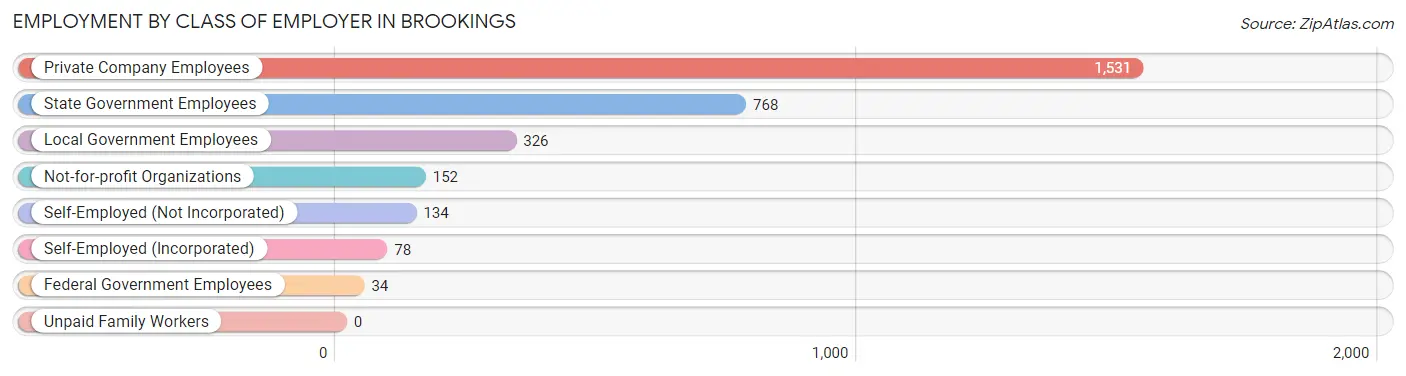
| Employer Class | # Employees | % Employees |
| Private Company Employees | 1,531 | 50.6% |
| Self-Employed (Incorporated) | 78 | 2.6% |
| Self-Employed (Not Incorporated) | 134 | 4.4% |
| Not-for-profit Organizations | 152 | 5.0% |
| Local Government Employees | 326 | 10.8% |
| State Government Employees | 768 | 25.4% |
| Federal Government Employees | 34 | 1.1% |
| Unpaid Family Workers | 0 | 0.0% |
| Total | 3,023 | 100.0% |
Employment Status by Age in Brookings
According to the labor force statistics for Brookings, out of the total population over 16 years of age (5,987), 57.9% or 3,466 individuals are in the labor force, with 8.2% or 284 of them unemployed. The age group with the highest labor force participation rate is 20 to 24 years, with 100.0% or 49 individuals in the labor force. Within the labor force, the 20 to 24 years age range has the highest percentage of unemployed individuals, with 93.9% or 46 of them being unemployed.
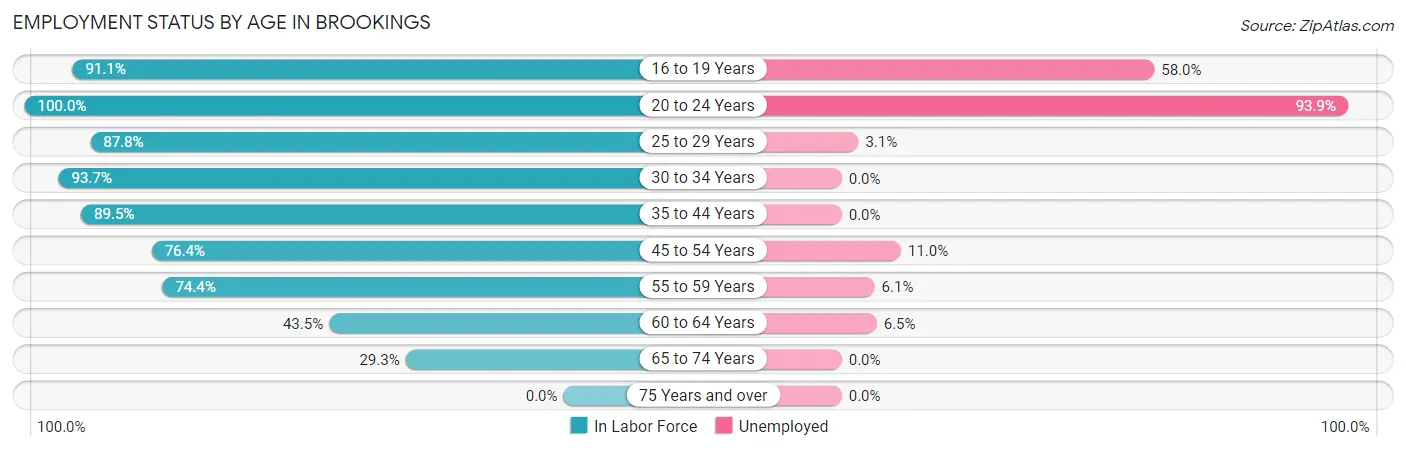
| Age Bracket | In Labor Force | Unemployed |
| 16 to 19 Years | 174 (91.1%) | 101 (58.0%) |
| 20 to 24 Years | 49 (100.0%) | 46 (93.9%) |
| 25 to 29 Years | 583 (87.8%) | 18 (3.1%) |
| 30 to 34 Years | 472 (93.7%) | 0 (0.0%) |
| 35 to 44 Years | 467 (89.5%) | 0 (0.0%) |
| 45 to 54 Years | 589 (76.4%) | 65 (11.0%) |
| 55 to 59 Years | 459 (74.4%) | 28 (6.1%) |
| 60 to 64 Years | 386 (43.5%) | 25 (6.5%) |
| 65 to 74 Years | 285 (29.3%) | 0 (0.0%) |
| 75 Years and over | 0 (0.0%) | 0 (0.0%) |
| Total | 3,466 (57.9%) | 284 (8.2%) |
Employment Status by Educational Attainment in Brookings
According to labor force statistics for Brookings, 74.5% of individuals (2,955) out of the total population between 25 and 64 years of age (3,966) are in the labor force, with 4.6% or 136 of them being unemployed. The group with the highest labor force participation rate are those with the educational attainment of bachelor's degree or higher, with 79.6% or 601 individuals in the labor force. Within the labor force, individuals with less than high school education have the highest percentage of unemployment, with 10.6% or 28 of them being unemployed.
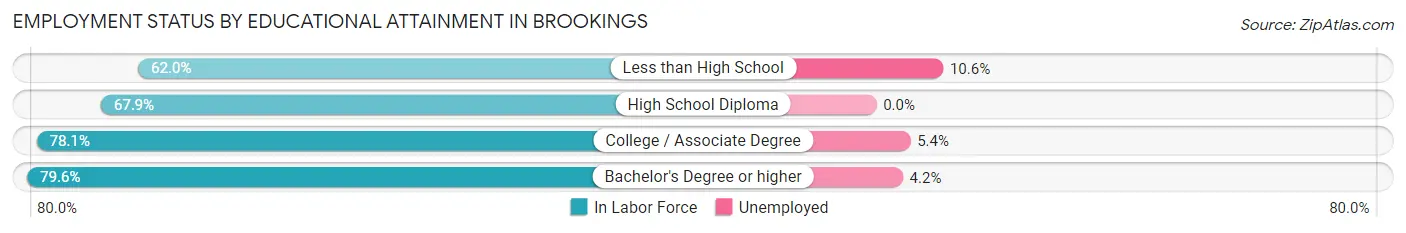
| Educational Attainment | In Labor Force | Unemployed |
| Less than High School | 264 (62.0%) | 45 (10.6%) |
| High School Diploma | 551 (67.9%) | 0 (0.0%) |
| College / Associate Degree | 1,541 (78.1%) | 107 (5.4%) |
| Bachelor's Degree or higher | 601 (79.6%) | 32 (4.2%) |
| Total | 2,955 (74.5%) | 182 (4.6%) |
Employment Occupations by Sex in Brookings
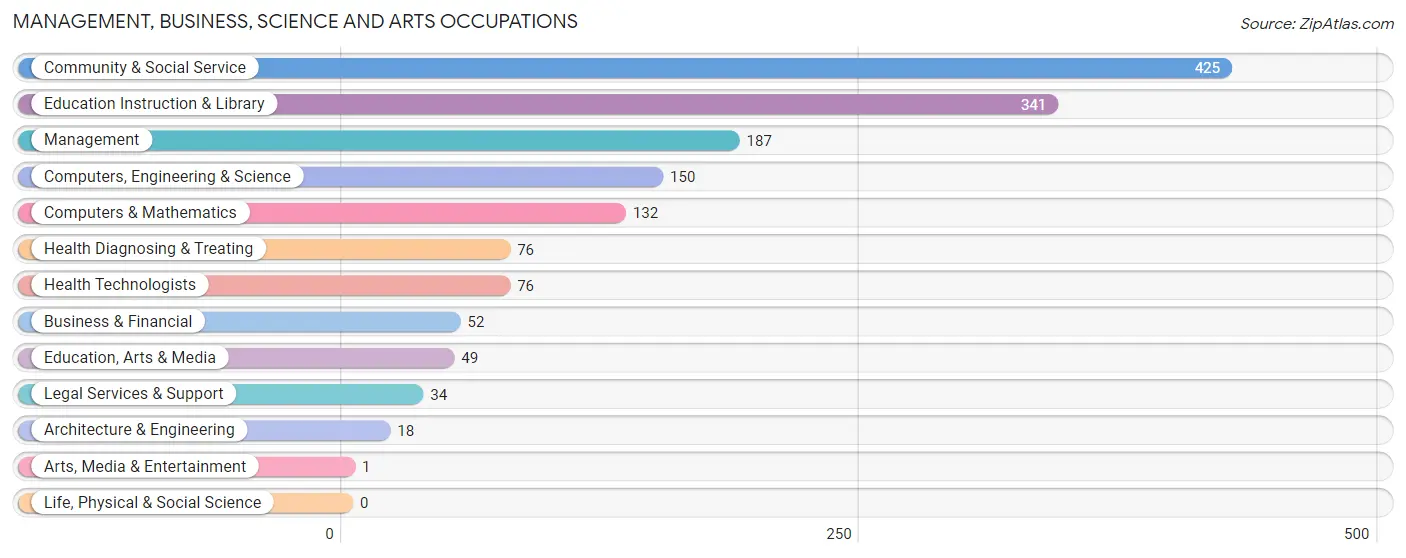
Management, Business, Science and Arts Occupations
The most common Management, Business, Science and Arts occupations in Brookings are Community & Social Service (425 | 13.4%), Education Instruction & Library (341 | 10.7%), Management (187 | 5.9%), Computers, Engineering & Science (150 | 4.7%), and Computers & Mathematics (132 | 4.2%).
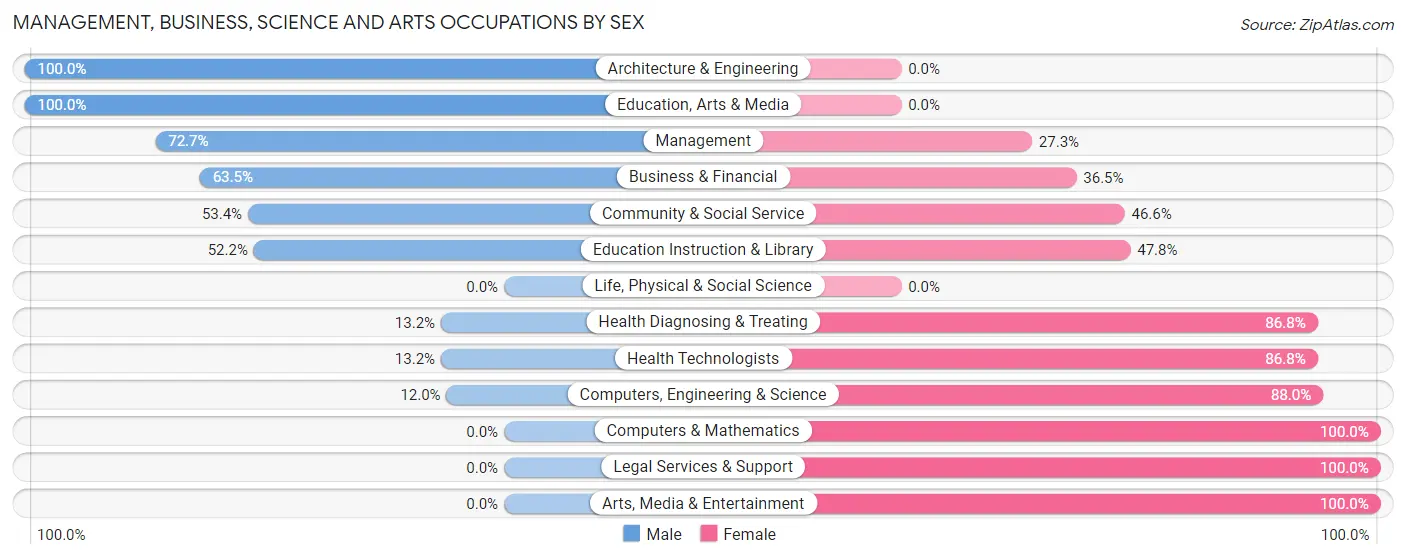
Management, Business, Science and Arts Occupations by Sex
Within the Management, Business, Science and Arts occupations in Brookings, the most male-oriented occupations are Architecture & Engineering (100.0%), Education, Arts & Media (100.0%), and Management (72.7%), while the most female-oriented occupations are Computers & Mathematics (100.0%), Legal Services & Support (100.0%), and Arts, Media & Entertainment (100.0%).
| Occupation | Male | Female |
| Management | 136 (72.7%) | 51 (27.3%) |
| Business & Financial | 33 (63.5%) | 19 (36.5%) |
| Computers, Engineering & Science | 18 (12.0%) | 132 (88.0%) |
| Computers & Mathematics | 0 (0.0%) | 132 (100.0%) |
| Architecture & Engineering | 18 (100.0%) | 0 (0.0%) |
| Life, Physical & Social Science | 0 (0.0%) | 0 (0.0%) |
| Community & Social Service | 227 (53.4%) | 198 (46.6%) |
| Education, Arts & Media | 49 (100.0%) | 0 (0.0%) |
| Legal Services & Support | 0 (0.0%) | 34 (100.0%) |
| Education Instruction & Library | 178 (52.2%) | 163 (47.8%) |
| Arts, Media & Entertainment | 0 (0.0%) | 1 (100.0%) |
| Health Diagnosing & Treating | 10 (13.2%) | 66 (86.8%) |
| Health Technologists | 10 (13.2%) | 66 (86.8%) |
| Total (Category) | 424 (47.6%) | 466 (52.4%) |
| Total (Overall) | 1,782 (56.0%) | 1,399 (44.0%) |
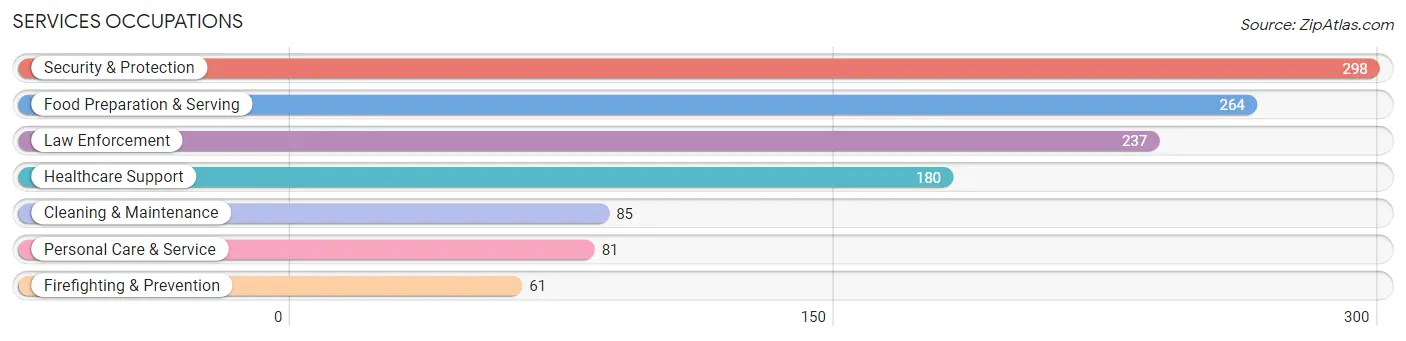
Services Occupations
The most common Services occupations in Brookings are Security & Protection (298 | 9.4%), Food Preparation & Serving (264 | 8.3%), Law Enforcement (237 | 7.4%), Healthcare Support (180 | 5.7%), and Cleaning & Maintenance (85 | 2.7%).
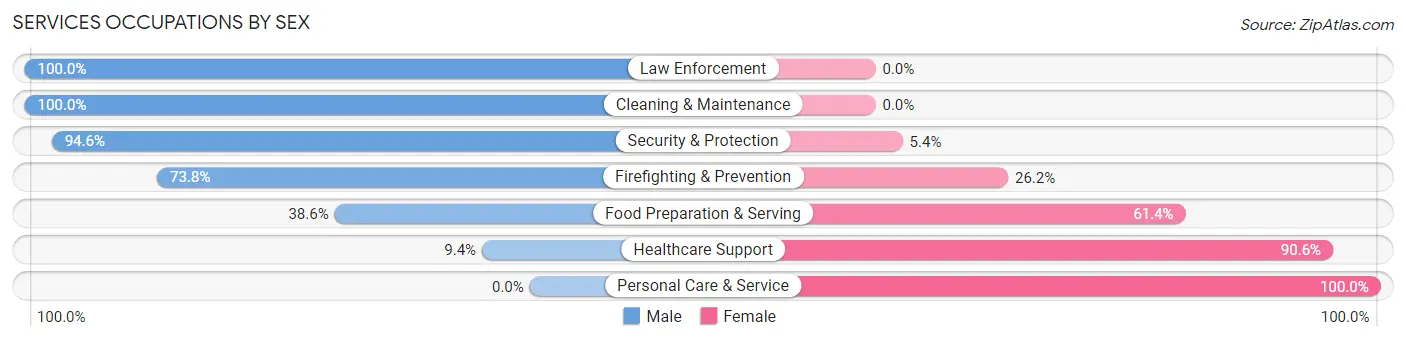
Services Occupations by Sex
Within the Services occupations in Brookings, the most male-oriented occupations are Law Enforcement (100.0%), Cleaning & Maintenance (100.0%), and Security & Protection (94.6%), while the most female-oriented occupations are Personal Care & Service (100.0%), Healthcare Support (90.6%), and Food Preparation & Serving (61.4%).
| Occupation | Male | Female |
| Healthcare Support | 17 (9.4%) | 163 (90.6%) |
| Security & Protection | 282 (94.6%) | 16 (5.4%) |
| Firefighting & Prevention | 45 (73.8%) | 16 (26.2%) |
| Law Enforcement | 237 (100.0%) | 0 (0.0%) |
| Food Preparation & Serving | 102 (38.6%) | 162 (61.4%) |
| Cleaning & Maintenance | 85 (100.0%) | 0 (0.0%) |
| Personal Care & Service | 0 (0.0%) | 81 (100.0%) |
| Total (Category) | 486 (53.5%) | 422 (46.5%) |
| Total (Overall) | 1,782 (56.0%) | 1,399 (44.0%) |
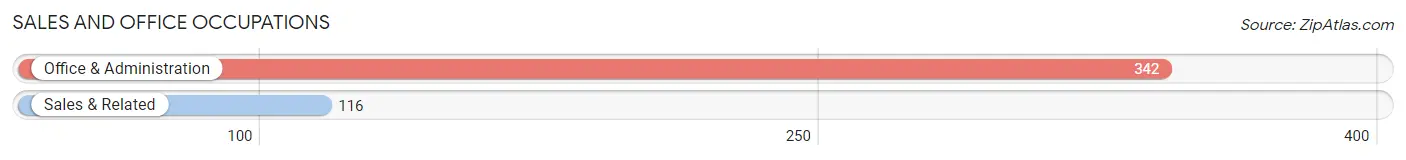
Sales and Office Occupations
The most common Sales and Office occupations in Brookings are Office & Administration (342 | 10.7%), and Sales & Related (116 | 3.6%).
Sales and Office Occupations by Sex
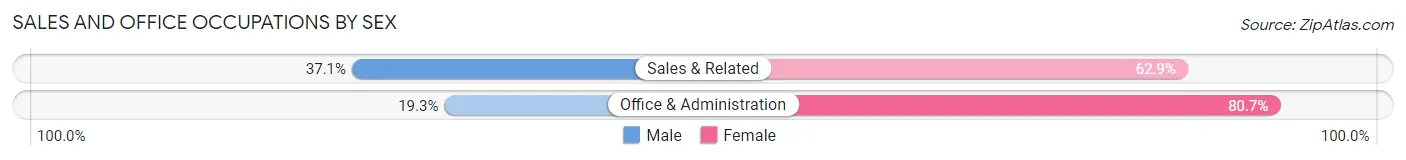
| Occupation | Male | Female |
| Sales & Related | 43 (37.1%) | 73 (62.9%) |
| Office & Administration | 66 (19.3%) | 276 (80.7%) |
| Total (Category) | 109 (23.8%) | 349 (76.2%) |
| Total (Overall) | 1,782 (56.0%) | 1,399 (44.0%) |
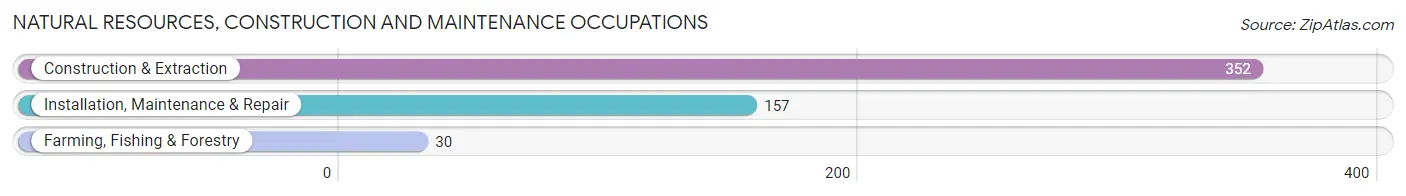
Natural Resources, Construction and Maintenance Occupations
The most common Natural Resources, Construction and Maintenance occupations in Brookings are Construction & Extraction (352 | 11.1%), Installation, Maintenance & Repair (157 | 4.9%), and Farming, Fishing & Forestry (30 | 0.9%).
Natural Resources, Construction and Maintenance Occupations by Sex
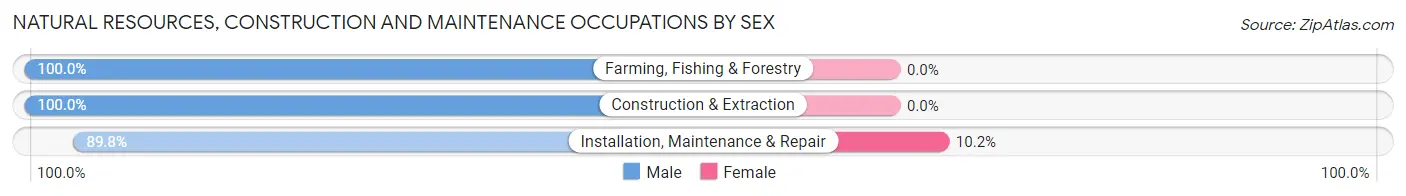
| Occupation | Male | Female |
| Farming, Fishing & Forestry | 30 (100.0%) | 0 (0.0%) |
| Construction & Extraction | 352 (100.0%) | 0 (0.0%) |
| Installation, Maintenance & Repair | 141 (89.8%) | 16 (10.2%) |
| Total (Category) | 523 (97.0%) | 16 (3.0%) |
| Total (Overall) | 1,782 (56.0%) | 1,399 (44.0%) |
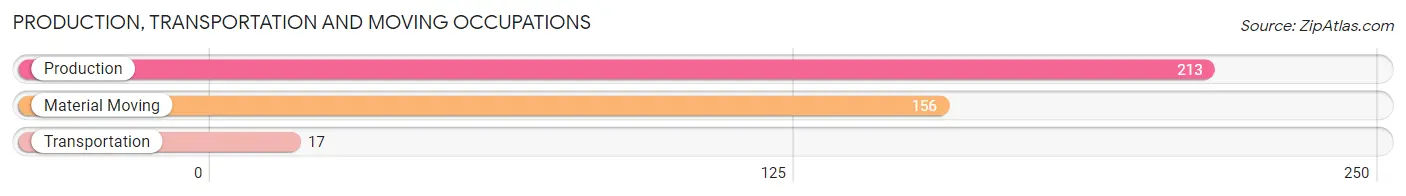
Production, Transportation and Moving Occupations
The most common Production, Transportation and Moving occupations in Brookings are Production (213 | 6.7%), Material Moving (156 | 4.9%), and Transportation (17 | 0.5%).
Production, Transportation and Moving Occupations by Sex
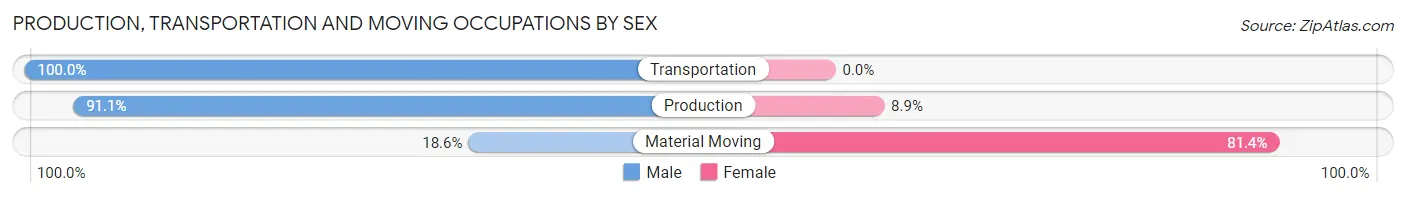
| Occupation | Male | Female |
| Production | 194 (91.1%) | 19 (8.9%) |
| Transportation | 17 (100.0%) | 0 (0.0%) |
| Material Moving | 29 (18.6%) | 127 (81.4%) |
| Total (Category) | 240 (62.2%) | 146 (37.8%) |
| Total (Overall) | 1,782 (56.0%) | 1,399 (44.0%) |
Employment Industries by Sex in Brookings
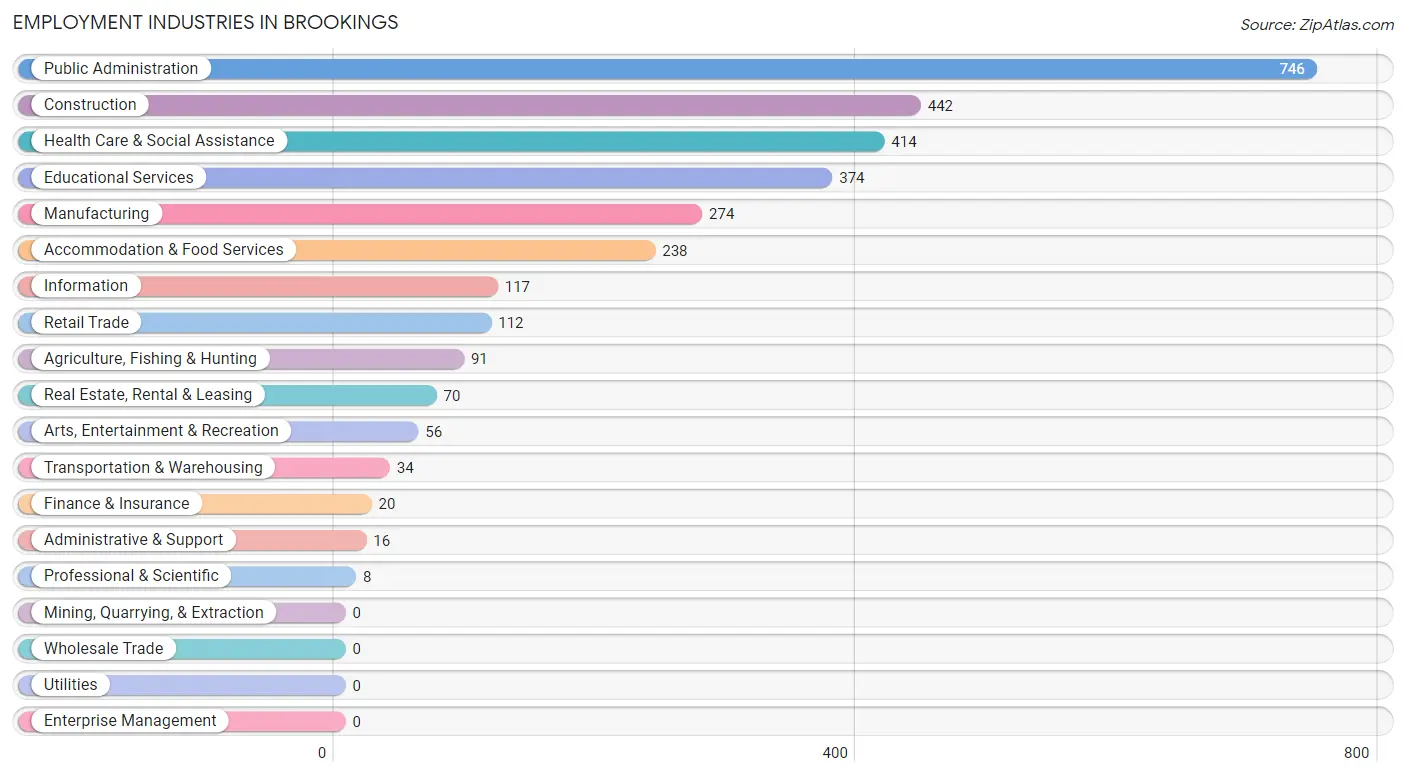
Employment Industries in Brookings
The major employment industries in Brookings include Public Administration (746 | 23.4%), Construction (442 | 13.9%), Health Care & Social Assistance (414 | 13.0%), Educational Services (374 | 11.8%), and Manufacturing (274 | 8.6%).
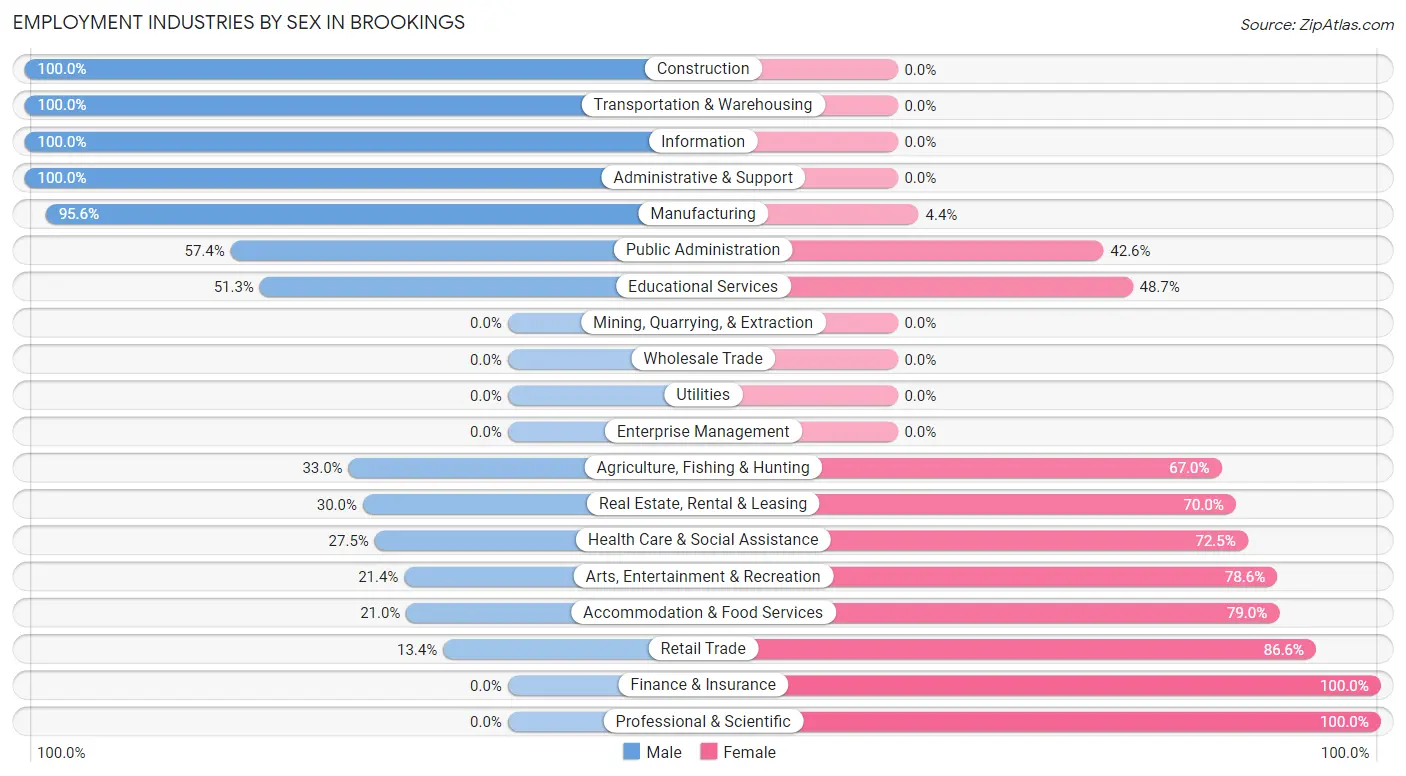
Employment Industries by Sex in Brookings
The Brookings industries that see more men than women are Construction (100.0%), Transportation & Warehousing (100.0%), and Information (100.0%), whereas the industries that tend to have a higher number of women are Finance & Insurance (100.0%), Professional & Scientific (100.0%), and Retail Trade (86.6%).
| Industry | Male | Female |
| Agriculture, Fishing & Hunting | 30 (33.0%) | 61 (67.0%) |
| Mining, Quarrying, & Extraction | 0 (0.0%) | 0 (0.0%) |
| Construction | 442 (100.0%) | 0 (0.0%) |
| Manufacturing | 262 (95.6%) | 12 (4.4%) |
| Wholesale Trade | 0 (0.0%) | 0 (0.0%) |
| Retail Trade | 15 (13.4%) | 97 (86.6%) |
| Transportation & Warehousing | 34 (100.0%) | 0 (0.0%) |
| Utilities | 0 (0.0%) | 0 (0.0%) |
| Information | 117 (100.0%) | 0 (0.0%) |
| Finance & Insurance | 0 (0.0%) | 20 (100.0%) |
| Real Estate, Rental & Leasing | 21 (30.0%) | 49 (70.0%) |
| Professional & Scientific | 0 (0.0%) | 8 (100.0%) |
| Enterprise Management | 0 (0.0%) | 0 (0.0%) |
| Administrative & Support | 16 (100.0%) | 0 (0.0%) |
| Educational Services | 192 (51.3%) | 182 (48.7%) |
| Health Care & Social Assistance | 114 (27.5%) | 300 (72.5%) |
| Arts, Entertainment & Recreation | 12 (21.4%) | 44 (78.6%) |
| Accommodation & Food Services | 50 (21.0%) | 188 (79.0%) |
| Public Administration | 428 (57.4%) | 318 (42.6%) |
| Total | 1,782 (56.0%) | 1,399 (44.0%) |
Education in Brookings
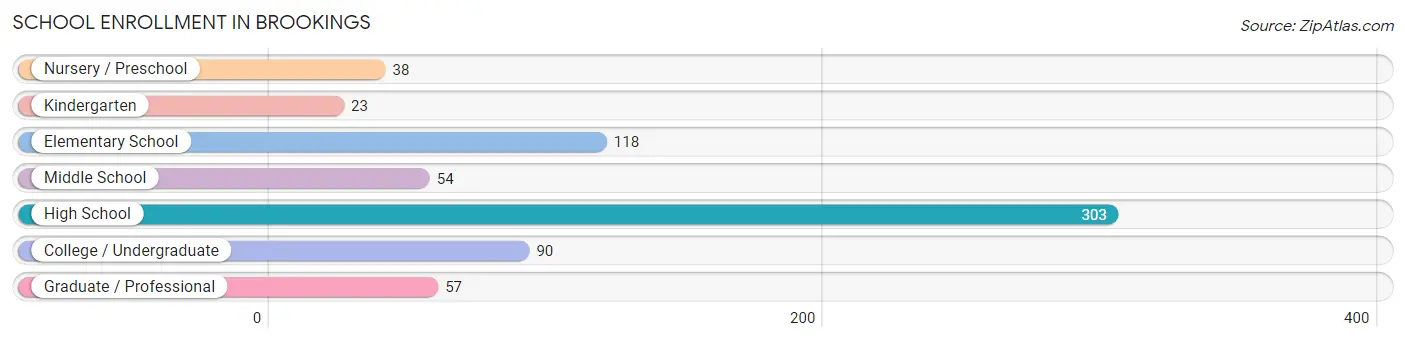
School Enrollment in Brookings
The most common levels of schooling among the 683 students in Brookings are high school (303 | 44.4%), elementary school (118 | 17.3%), and college / undergraduate (90 | 13.2%).
| School Level | # Students | % Students |
| Nursery / Preschool | 38 | 5.6% |
| Kindergarten | 23 | 3.4% |
| Elementary School | 118 | 17.3% |
| Middle School | 54 | 7.9% |
| High School | 303 | 44.4% |
| College / Undergraduate | 90 | 13.2% |
| Graduate / Professional | 57 | 8.4% |
| Total | 683 | 100.0% |
School Enrollment by Age by Funding Source in Brookings
Out of a total of 683 students who are enrolled in schools in Brookings, 133 (19.5%) attend a private institution, while the remaining 550 (80.5%) are enrolled in public schools. The age group of 25 to 34 year olds has the highest likelihood of being enrolled in private schools, with 133 (100.0% in the age bracket) enrolled. Conversely, the age group of 3 to 4 year olds has the lowest likelihood of being enrolled in a private school, with 38 (100.0% in the age bracket) attending a public institution.
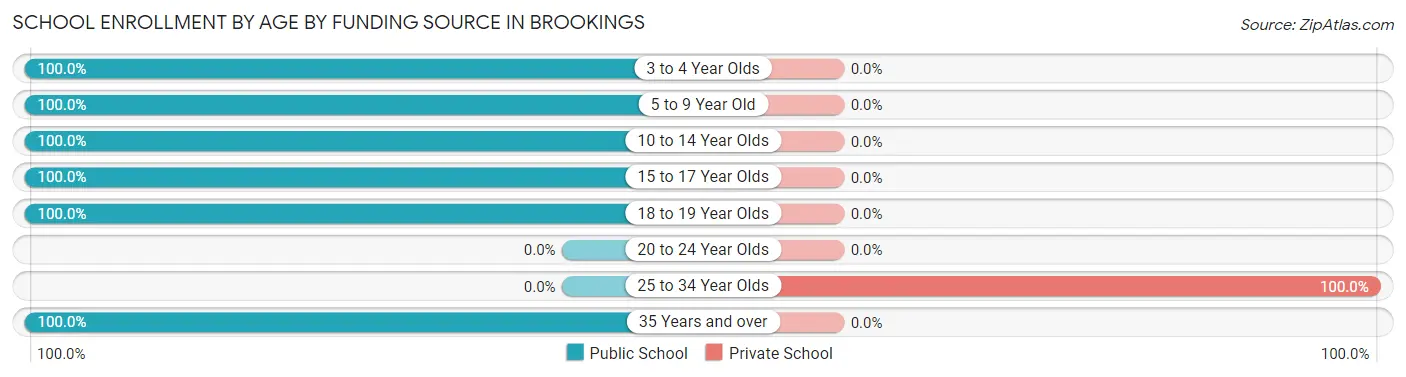
| Age Bracket | Public School | Private School |
| 3 to 4 Year Olds | 38 (100.0%) | 0 (0.0%) |
| 5 to 9 Year Old | 85 (100.0%) | 0 (0.0%) |
| 10 to 14 Year Olds | 179 (100.0%) | 0 (0.0%) |
| 15 to 17 Year Olds | 165 (100.0%) | 0 (0.0%) |
| 18 to 19 Year Olds | 69 (100.0%) | 0 (0.0%) |
| 20 to 24 Year Olds | 0 (0.0%) | 0 (0.0%) |
| 25 to 34 Year Olds | 0 (0.0%) | 133 (100.0%) |
| 35 Years and over | 14 (100.0%) | 0 (0.0%) |
| Total | 550 (80.5%) | 133 (19.5%) |
Educational Attainment by Field of Study in Brookings
Education (313 | 21.7%), psychology (163 | 11.3%), business (160 | 11.1%), science & technology (148 | 10.3%), and liberal arts & history (148 | 10.3%) are the most common fields of study among 1,442 individuals in Brookings who have obtained a bachelor's degree or higher.
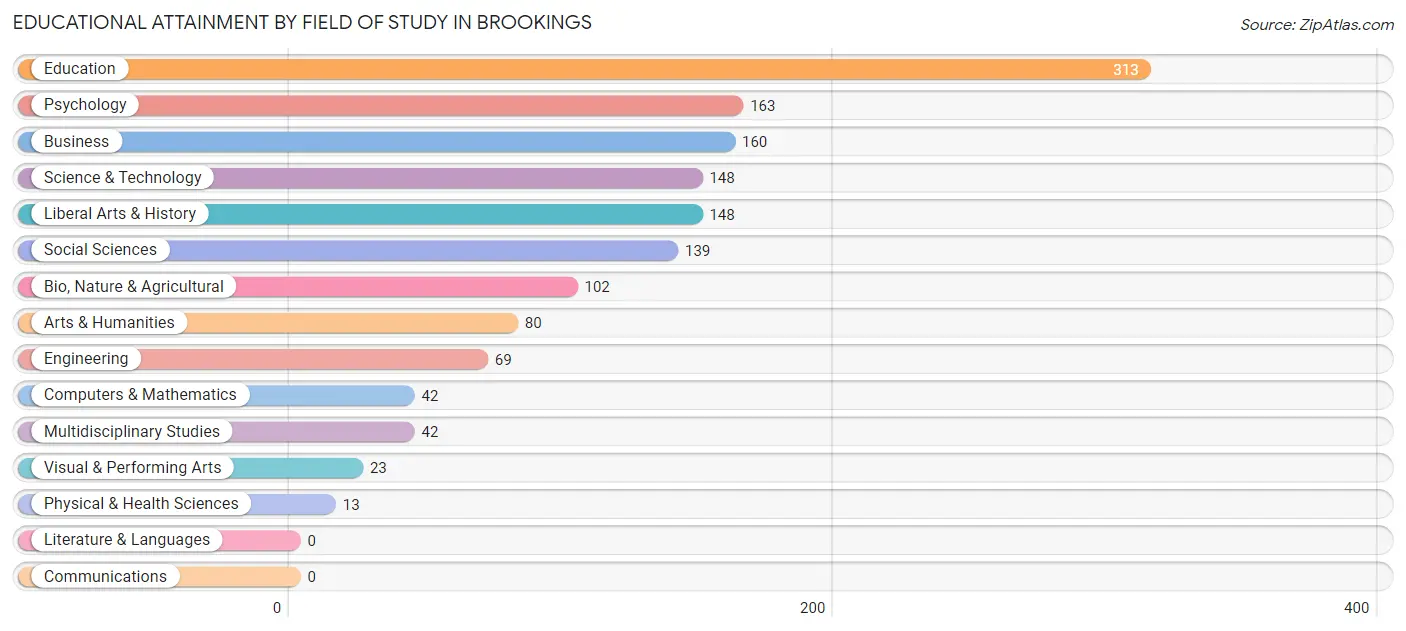
| Field of Study | # Graduates | % Graduates |
| Computers & Mathematics | 42 | 2.9% |
| Bio, Nature & Agricultural | 102 | 7.1% |
| Physical & Health Sciences | 13 | 0.9% |
| Psychology | 163 | 11.3% |
| Social Sciences | 139 | 9.6% |
| Engineering | 69 | 4.8% |
| Multidisciplinary Studies | 42 | 2.9% |
| Science & Technology | 148 | 10.3% |
| Business | 160 | 11.1% |
| Education | 313 | 21.7% |
| Literature & Languages | 0 | 0.0% |
| Liberal Arts & History | 148 | 10.3% |
| Visual & Performing Arts | 23 | 1.6% |
| Communications | 0 | 0.0% |
| Arts & Humanities | 80 | 5.6% |
| Total | 1,442 | 100.0% |
Transportation & Commute in Brookings
Vehicle Availability by Sex in Brookings
The most prevalent vehicle ownership categories in Brookings are males with 2 vehicles (938, accounting for 54.7%) and females with 2 vehicles (698, making up 72.6%).
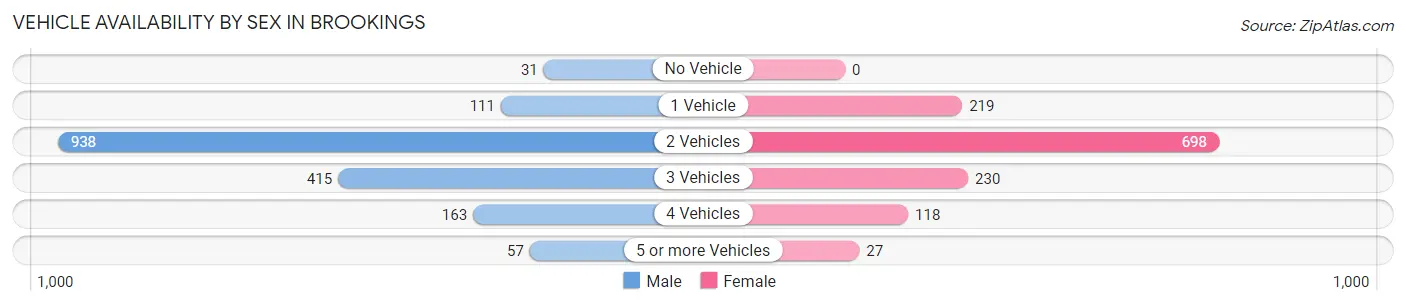
| Vehicles Available | Male | Female |
| No Vehicle | 31 (1.8%) | 0 (0.0%) |
| 1 Vehicle | 111 (6.5%) | 219 (17.0%) |
| 2 Vehicles | 938 (54.7%) | 698 (54.0%) |
| 3 Vehicles | 415 (24.2%) | 230 (17.8%) |
| 4 Vehicles | 163 (9.5%) | 118 (9.1%) |
| 5 or more Vehicles | 57 (3.3%) | 27 (2.1%) |
| Total | 1,715 (100.0%) | 1,292 (100.0%) |
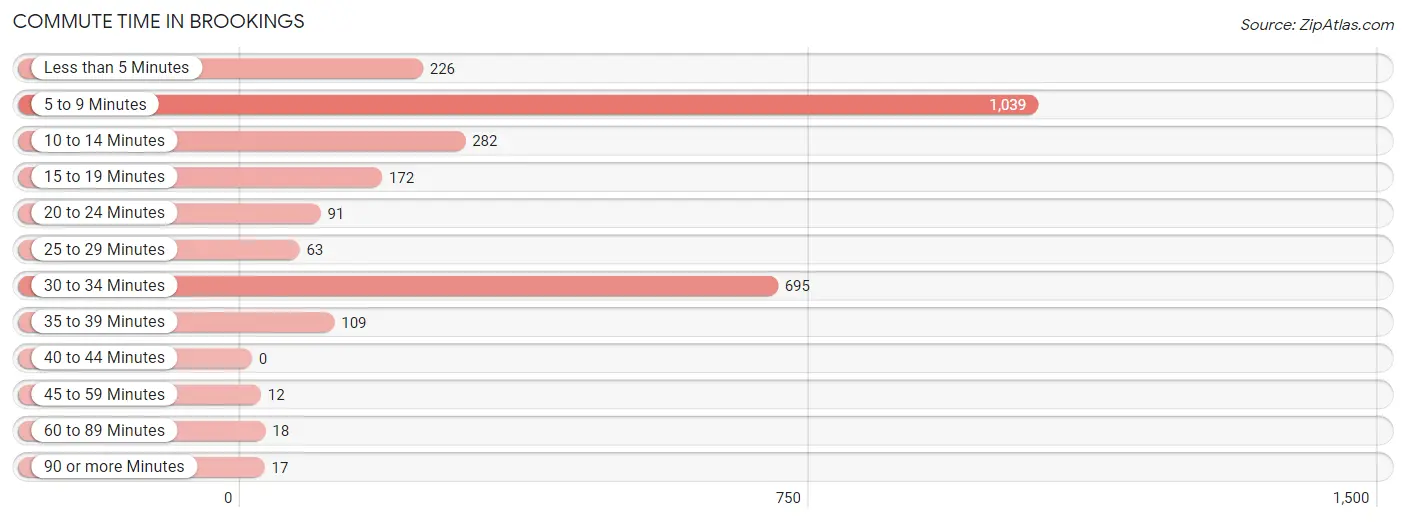
Commute Time in Brookings
The most frequently occuring commute durations in Brookings are 5 to 9 minutes (1,039 commuters, 38.1%), 30 to 34 minutes (695 commuters, 25.5%), and 10 to 14 minutes (282 commuters, 10.3%).
| Commute Time | # Commuters | % Commuters |
| Less than 5 Minutes | 226 | 8.3% |
| 5 to 9 Minutes | 1,039 | 38.1% |
| 10 to 14 Minutes | 282 | 10.3% |
| 15 to 19 Minutes | 172 | 6.3% |
| 20 to 24 Minutes | 91 | 3.3% |
| 25 to 29 Minutes | 63 | 2.3% |
| 30 to 34 Minutes | 695 | 25.5% |
| 35 to 39 Minutes | 109 | 4.0% |
| 40 to 44 Minutes | 0 | 0.0% |
| 45 to 59 Minutes | 12 | 0.4% |
| 60 to 89 Minutes | 18 | 0.7% |
| 90 or more Minutes | 17 | 0.6% |
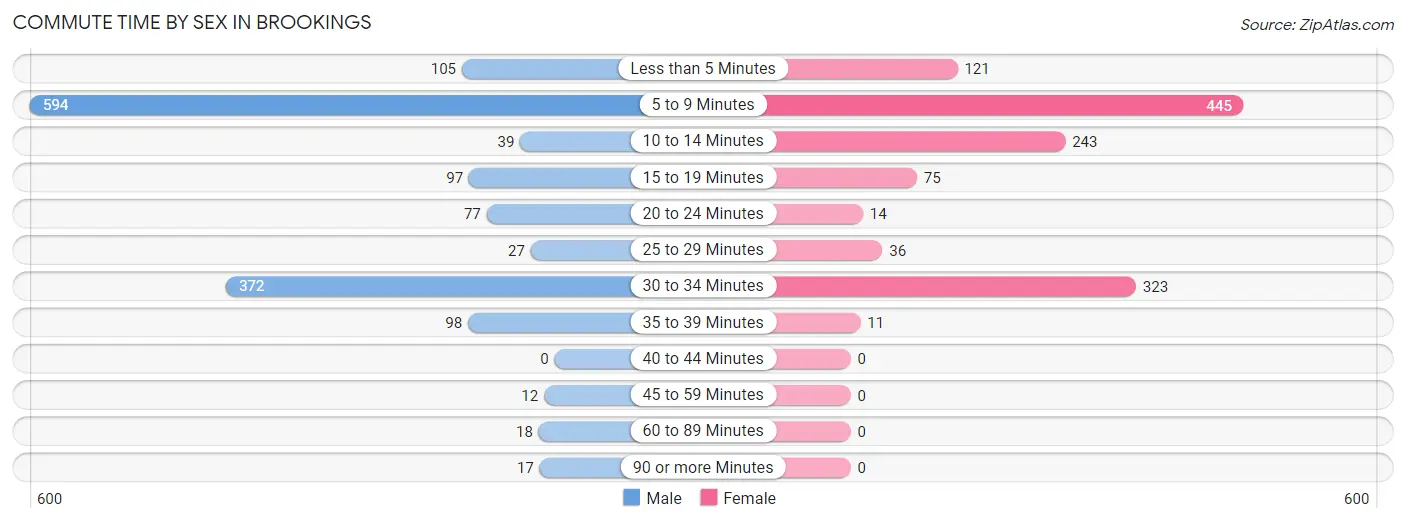
Commute Time by Sex in Brookings
The most common commute times in Brookings are 5 to 9 minutes (594 commuters, 40.8%) for males and 5 to 9 minutes (445 commuters, 35.1%) for females.
| Commute Time | Male | Female |
| Less than 5 Minutes | 105 (7.2%) | 121 (9.5%) |
| 5 to 9 Minutes | 594 (40.8%) | 445 (35.1%) |
| 10 to 14 Minutes | 39 (2.7%) | 243 (19.2%) |
| 15 to 19 Minutes | 97 (6.7%) | 75 (5.9%) |
| 20 to 24 Minutes | 77 (5.3%) | 14 (1.1%) |
| 25 to 29 Minutes | 27 (1.8%) | 36 (2.8%) |
| 30 to 34 Minutes | 372 (25.6%) | 323 (25.5%) |
| 35 to 39 Minutes | 98 (6.7%) | 11 (0.9%) |
| 40 to 44 Minutes | 0 (0.0%) | 0 (0.0%) |
| 45 to 59 Minutes | 12 (0.8%) | 0 (0.0%) |
| 60 to 89 Minutes | 18 (1.2%) | 0 (0.0%) |
| 90 or more Minutes | 17 (1.2%) | 0 (0.0%) |
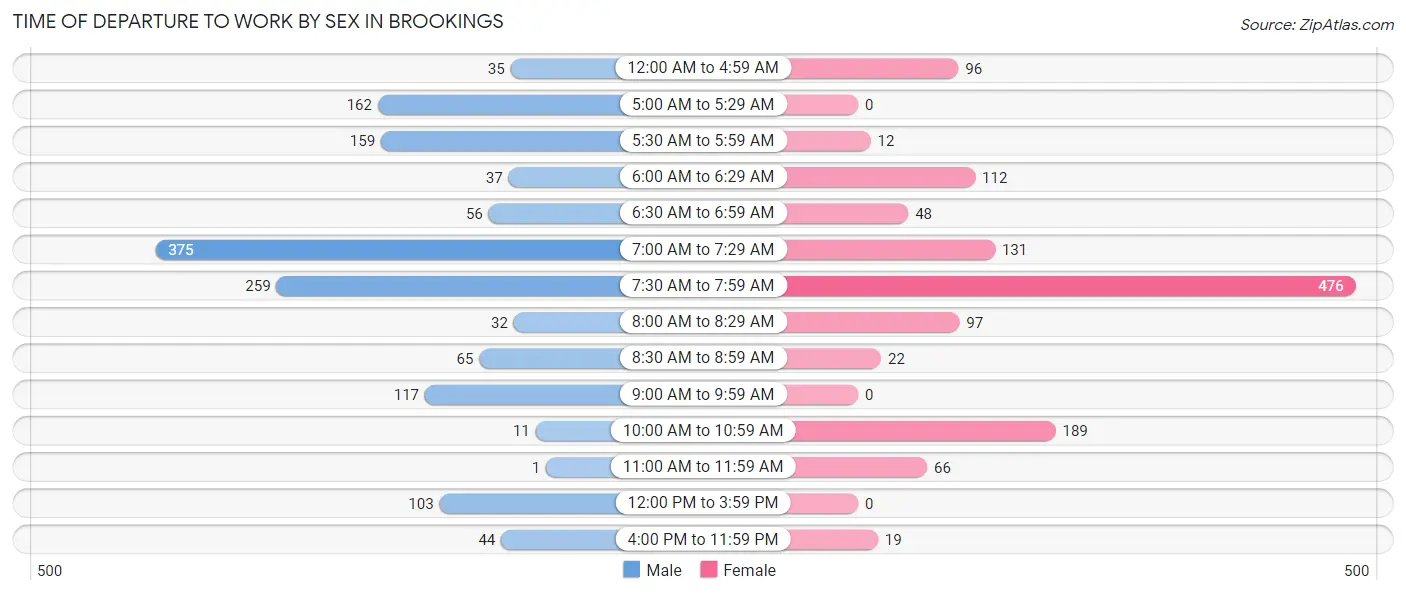
Time of Departure to Work by Sex in Brookings
The most frequent times of departure to work in Brookings are 7:00 AM to 7:29 AM (375, 25.8%) for males and 7:30 AM to 7:59 AM (476, 37.5%) for females.
| Time of Departure | Male | Female |
| 12:00 AM to 4:59 AM | 35 (2.4%) | 96 (7.6%) |
| 5:00 AM to 5:29 AM | 162 (11.1%) | 0 (0.0%) |
| 5:30 AM to 5:59 AM | 159 (10.9%) | 12 (0.9%) |
| 6:00 AM to 6:29 AM | 37 (2.5%) | 112 (8.8%) |
| 6:30 AM to 6:59 AM | 56 (3.8%) | 48 (3.8%) |
| 7:00 AM to 7:29 AM | 375 (25.8%) | 131 (10.3%) |
| 7:30 AM to 7:59 AM | 259 (17.8%) | 476 (37.5%) |
| 8:00 AM to 8:29 AM | 32 (2.2%) | 97 (7.6%) |
| 8:30 AM to 8:59 AM | 65 (4.5%) | 22 (1.7%) |
| 9:00 AM to 9:59 AM | 117 (8.0%) | 0 (0.0%) |
| 10:00 AM to 10:59 AM | 11 (0.8%) | 189 (14.9%) |
| 11:00 AM to 11:59 AM | 1 (0.1%) | 66 (5.2%) |
| 12:00 PM to 3:59 PM | 103 (7.1%) | 0 (0.0%) |
| 4:00 PM to 11:59 PM | 44 (3.0%) | 19 (1.5%) |
| Total | 1,456 (100.0%) | 1,268 (100.0%) |
Housing Occupancy in Brookings
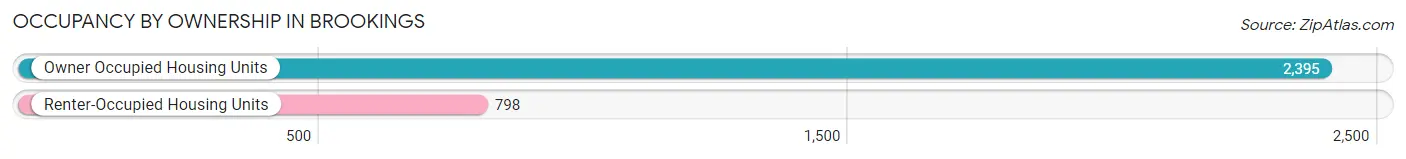
Occupancy by Ownership in Brookings
Of the total 3,193 dwellings in Brookings, owner-occupied units account for 2,395 (75.0%), while renter-occupied units make up 798 (25.0%).
| Occupancy | # Housing Units | % Housing Units |
| Owner Occupied Housing Units | 2,395 | 75.0% |
| Renter-Occupied Housing Units | 798 | 25.0% |
| Total Occupied Housing Units | 3,193 | 100.0% |
Occupancy by Household Size in Brookings
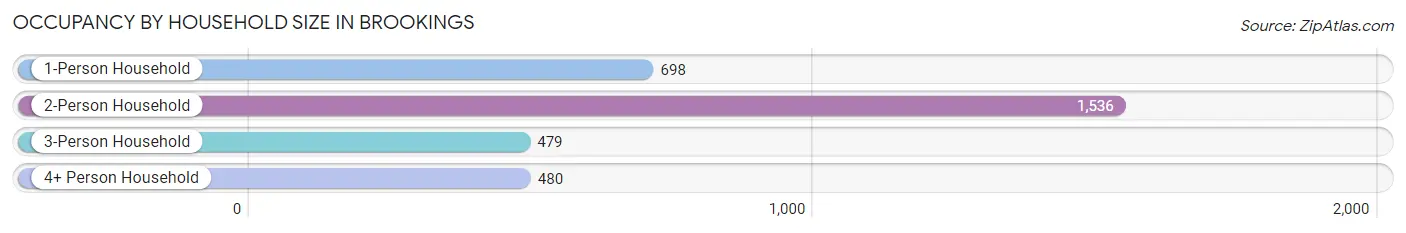
| Household Size | # Housing Units | % Housing Units |
| 1-Person Household | 698 | 21.9% |
| 2-Person Household | 1,536 | 48.1% |
| 3-Person Household | 479 | 15.0% |
| 4+ Person Household | 480 | 15.0% |
| Total Housing Units | 3,193 | 100.0% |
Occupancy by Ownership by Household Size in Brookings
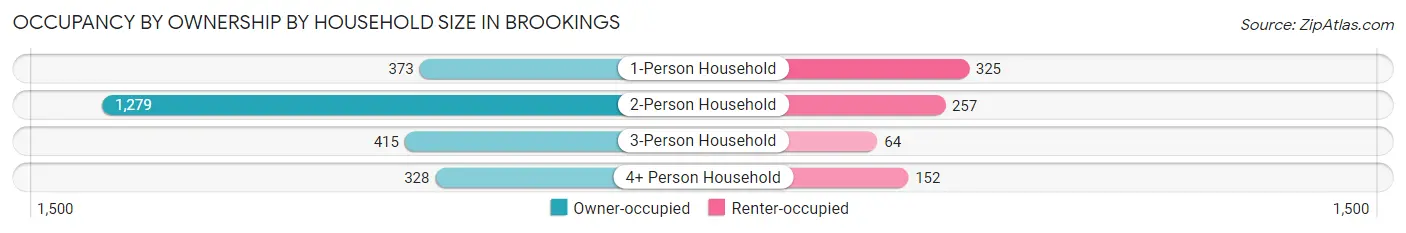
| Household Size | Owner-occupied | Renter-occupied |
| 1-Person Household | 373 (53.4%) | 325 (46.6%) |
| 2-Person Household | 1,279 (83.3%) | 257 (16.7%) |
| 3-Person Household | 415 (86.6%) | 64 (13.4%) |
| 4+ Person Household | 328 (68.3%) | 152 (31.7%) |
| Total Housing Units | 2,395 (75.0%) | 798 (25.0%) |
Occupancy by Educational Attainment in Brookings
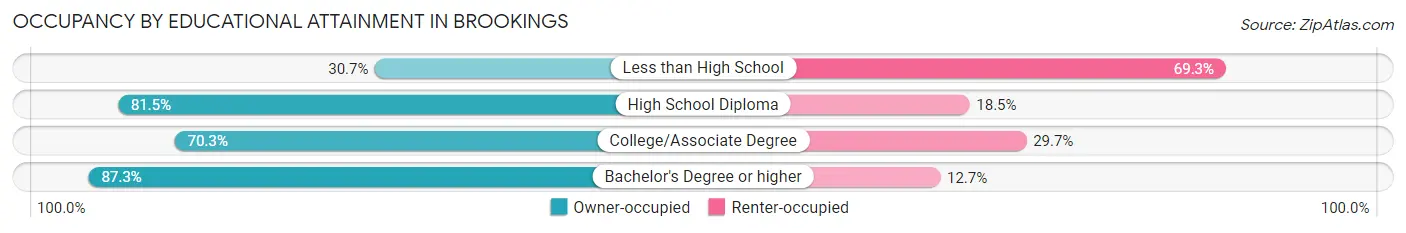
| Household Size | Owner-occupied | Renter-occupied |
| Less than High School | 46 (30.7%) | 104 (69.3%) |
| High School Diploma | 503 (81.5%) | 114 (18.5%) |
| College/Associate Degree | 1,122 (70.3%) | 475 (29.7%) |
| Bachelor's Degree or higher | 724 (87.3%) | 105 (12.7%) |
Occupancy by Age of Householder in Brookings
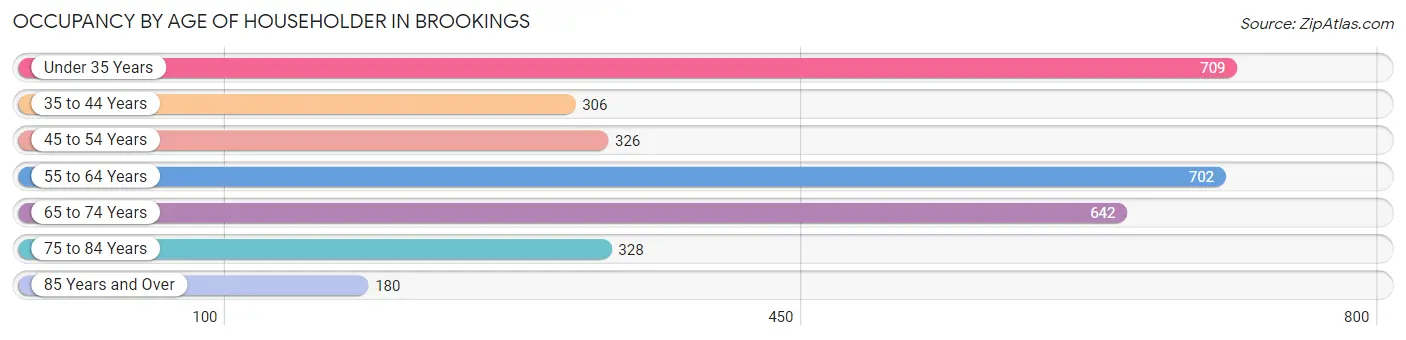
| Age Bracket | # Households | % Households |
| Under 35 Years | 709 | 22.2% |
| 35 to 44 Years | 306 | 9.6% |
| 45 to 54 Years | 326 | 10.2% |
| 55 to 64 Years | 702 | 22.0% |
| 65 to 74 Years | 642 | 20.1% |
| 75 to 84 Years | 328 | 10.3% |
| 85 Years and Over | 180 | 5.6% |
| Total | 3,193 | 100.0% |
Housing Finances in Brookings
Median Income by Occupancy in Brookings
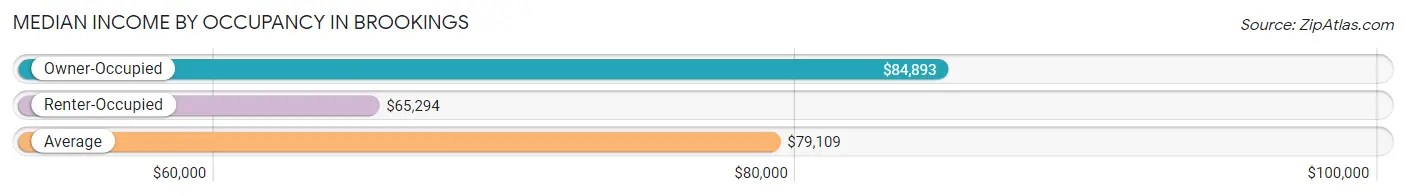
| Occupancy Type | # Households | Median Income |
| Owner-Occupied | 2,395 (75.0%) | $84,893 |
| Renter-Occupied | 798 (25.0%) | $65,294 |
| Average | 3,193 (100.0%) | $79,109 |
Occupancy by Householder Income Bracket in Brookings
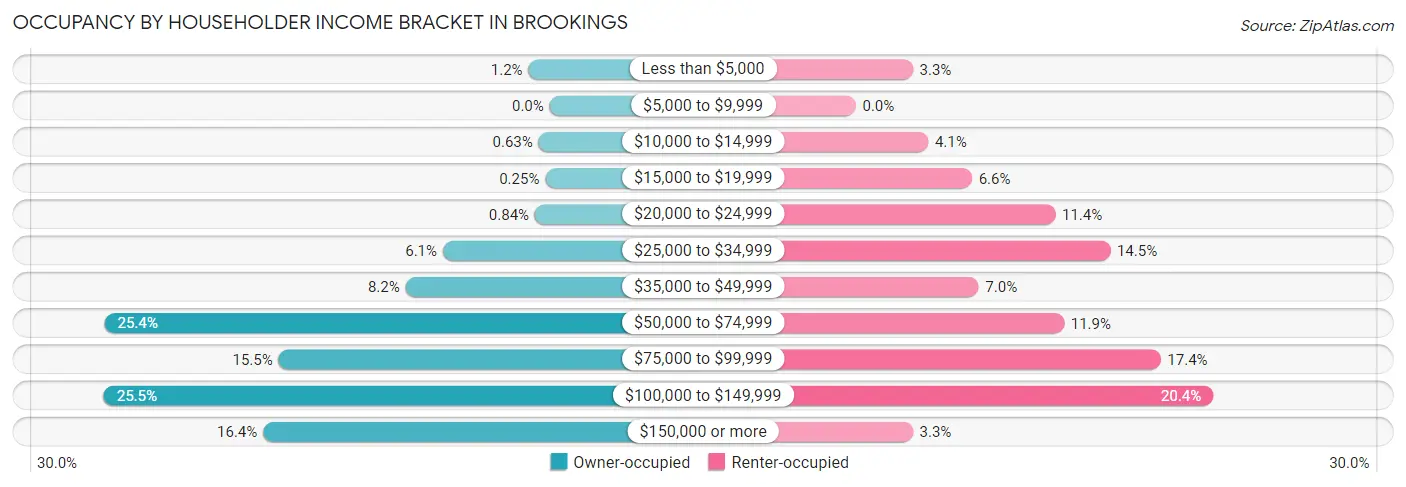
| Income Bracket | Owner-occupied | Renter-occupied |
| Less than $5,000 | 29 (1.2%) | 26 (3.3%) |
| $5,000 to $9,999 | 0 (0.0%) | 0 (0.0%) |
| $10,000 to $14,999 | 15 (0.6%) | 33 (4.1%) |
| $15,000 to $19,999 | 6 (0.3%) | 53 (6.6%) |
| $20,000 to $24,999 | 20 (0.8%) | 91 (11.4%) |
| $25,000 to $34,999 | 146 (6.1%) | 116 (14.5%) |
| $35,000 to $49,999 | 197 (8.2%) | 56 (7.0%) |
| $50,000 to $74,999 | 609 (25.4%) | 95 (11.9%) |
| $75,000 to $99,999 | 371 (15.5%) | 139 (17.4%) |
| $100,000 to $149,999 | 610 (25.5%) | 163 (20.4%) |
| $150,000 or more | 392 (16.4%) | 26 (3.3%) |
| Total | 2,395 (100.0%) | 798 (100.0%) |
Monthly Housing Cost Tiers in Brookings
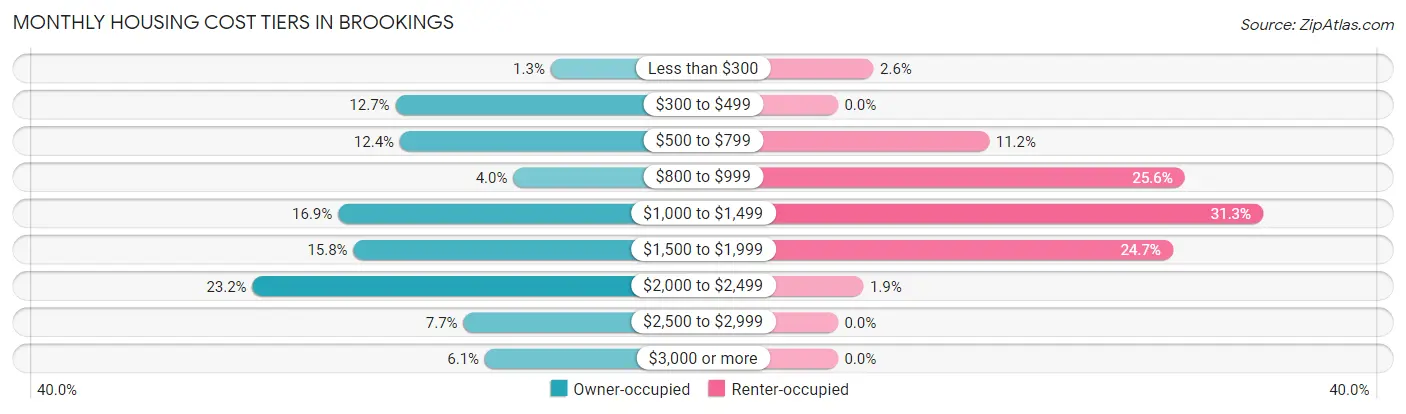
| Monthly Cost | Owner-occupied | Renter-occupied |
| Less than $300 | 30 (1.3%) | 21 (2.6%) |
| $300 to $499 | 304 (12.7%) | 0 (0.0%) |
| $500 to $799 | 296 (12.4%) | 89 (11.2%) |
| $800 to $999 | 96 (4.0%) | 204 (25.6%) |
| $1,000 to $1,499 | 405 (16.9%) | 250 (31.3%) |
| $1,500 to $1,999 | 378 (15.8%) | 197 (24.7%) |
| $2,000 to $2,499 | 556 (23.2%) | 15 (1.9%) |
| $2,500 to $2,999 | 184 (7.7%) | 0 (0.0%) |
| $3,000 or more | 146 (6.1%) | 0 (0.0%) |
| Total | 2,395 (100.0%) | 798 (100.0%) |
Physical Housing Characteristics in Brookings
Housing Structures in Brookings
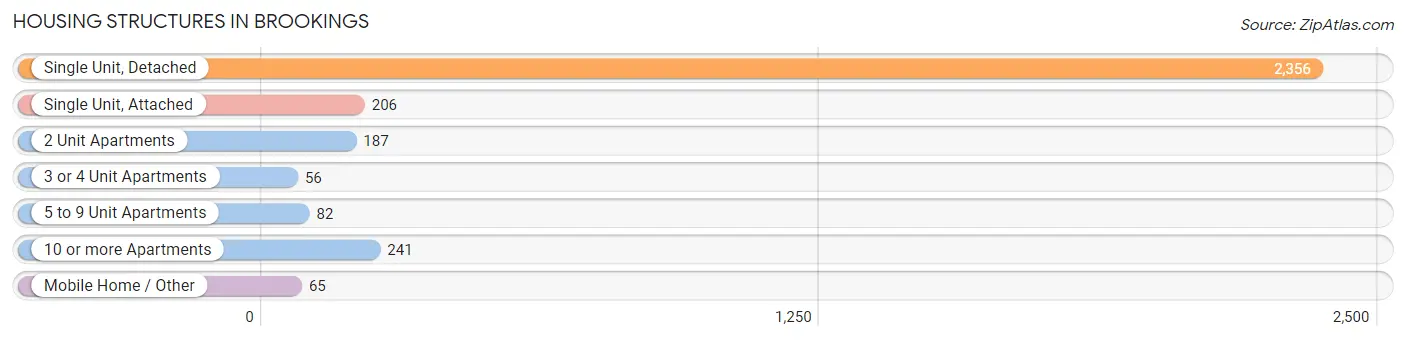
| Structure Type | # Housing Units | % Housing Units |
| Single Unit, Detached | 2,356 | 73.8% |
| Single Unit, Attached | 206 | 6.5% |
| 2 Unit Apartments | 187 | 5.9% |
| 3 or 4 Unit Apartments | 56 | 1.8% |
| 5 to 9 Unit Apartments | 82 | 2.6% |
| 10 or more Apartments | 241 | 7.5% |
| Mobile Home / Other | 65 | 2.0% |
| Total | 3,193 | 100.0% |
Housing Structures by Occupancy in Brookings
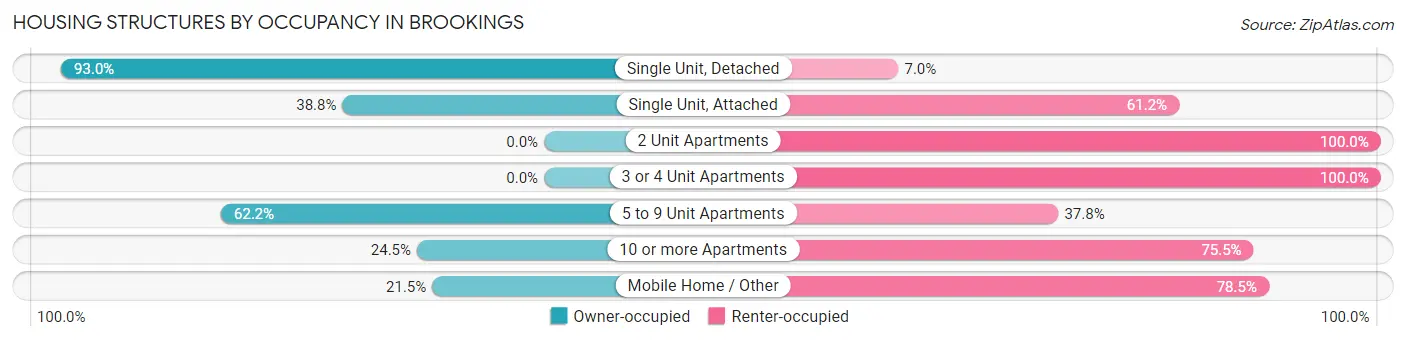
| Structure Type | Owner-occupied | Renter-occupied |
| Single Unit, Detached | 2,191 (93.0%) | 165 (7.0%) |
| Single Unit, Attached | 80 (38.8%) | 126 (61.2%) |
| 2 Unit Apartments | 0 (0.0%) | 187 (100.0%) |
| 3 or 4 Unit Apartments | 0 (0.0%) | 56 (100.0%) |
| 5 to 9 Unit Apartments | 51 (62.2%) | 31 (37.8%) |
| 10 or more Apartments | 59 (24.5%) | 182 (75.5%) |
| Mobile Home / Other | 14 (21.5%) | 51 (78.5%) |
| Total | 2,395 (75.0%) | 798 (25.0%) |
Housing Structures by Number of Rooms in Brookings
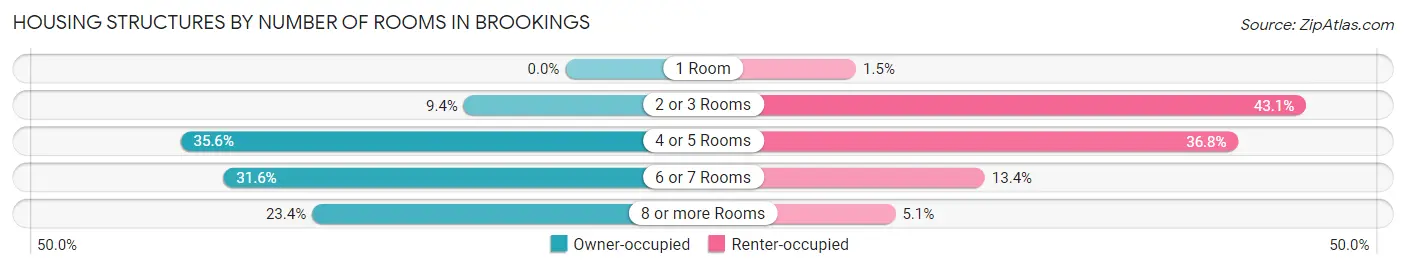
| Number of Rooms | Owner-occupied | Renter-occupied |
| 1 Room | 0 (0.0%) | 12 (1.5%) |
| 2 or 3 Rooms | 225 (9.4%) | 344 (43.1%) |
| 4 or 5 Rooms | 852 (35.6%) | 294 (36.8%) |
| 6 or 7 Rooms | 757 (31.6%) | 107 (13.4%) |
| 8 or more Rooms | 561 (23.4%) | 41 (5.1%) |
| Total | 2,395 (100.0%) | 798 (100.0%) |
Housing Structure by Heating Type in Brookings
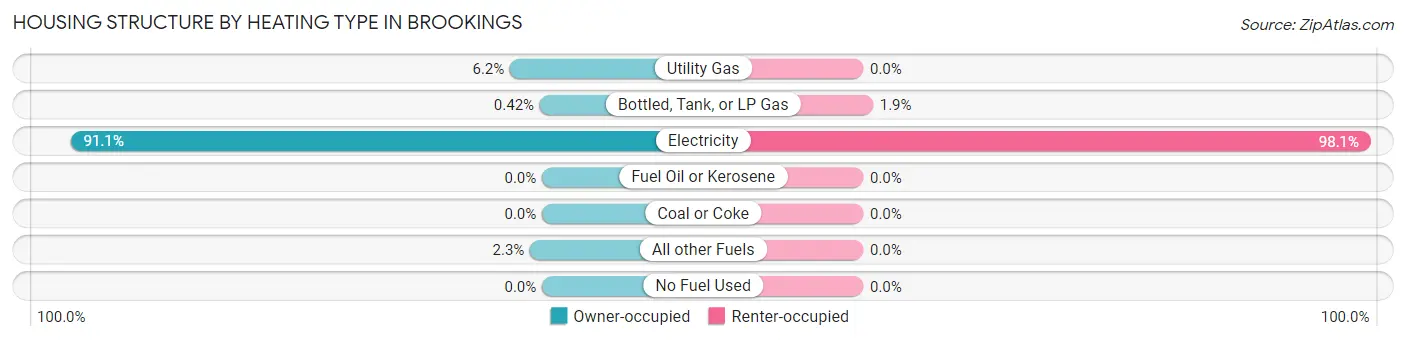
| Heating Type | Owner-occupied | Renter-occupied |
| Utility Gas | 148 (6.2%) | 0 (0.0%) |
| Bottled, Tank, or LP Gas | 10 (0.4%) | 15 (1.9%) |
| Electricity | 2,182 (91.1%) | 783 (98.1%) |
| Fuel Oil or Kerosene | 0 (0.0%) | 0 (0.0%) |
| Coal or Coke | 0 (0.0%) | 0 (0.0%) |
| All other Fuels | 55 (2.3%) | 0 (0.0%) |
| No Fuel Used | 0 (0.0%) | 0 (0.0%) |
| Total | 2,395 (100.0%) | 798 (100.0%) |
Household Vehicle Usage in Brookings
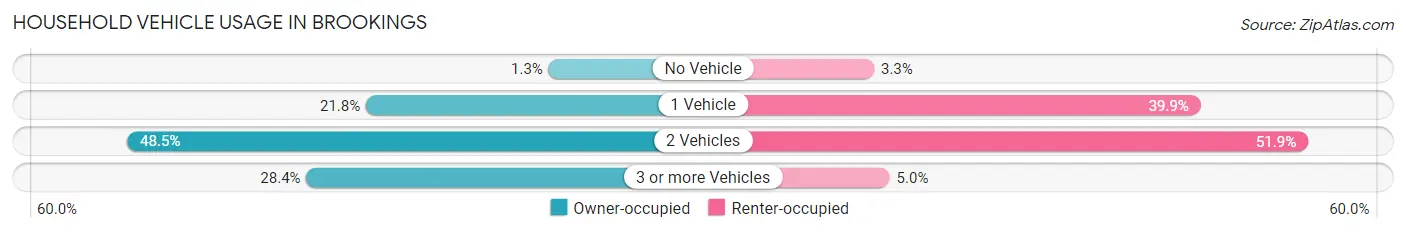
| Vehicles per Household | Owner-occupied | Renter-occupied |
| No Vehicle | 31 (1.3%) | 26 (3.3%) |
| 1 Vehicle | 521 (21.7%) | 318 (39.9%) |
| 2 Vehicles | 1,162 (48.5%) | 414 (51.9%) |
| 3 or more Vehicles | 681 (28.4%) | 40 (5.0%) |
| Total | 2,395 (100.0%) | 798 (100.0%) |
Real Estate & Mortgages in Brookings
Real Estate and Mortgage Overview in Brookings
| Characteristic | Without Mortgage | With Mortgage |
| Housing Units | 699 | 1,696 |
| Median Property Value | $352,800 | $398,100 |
| Median Household Income | $63,618 | $331 |
| Monthly Housing Costs | $518 | $146 |
| Real Estate Taxes | $2,352 | $232 |
Property Value by Mortgage Status in Brookings
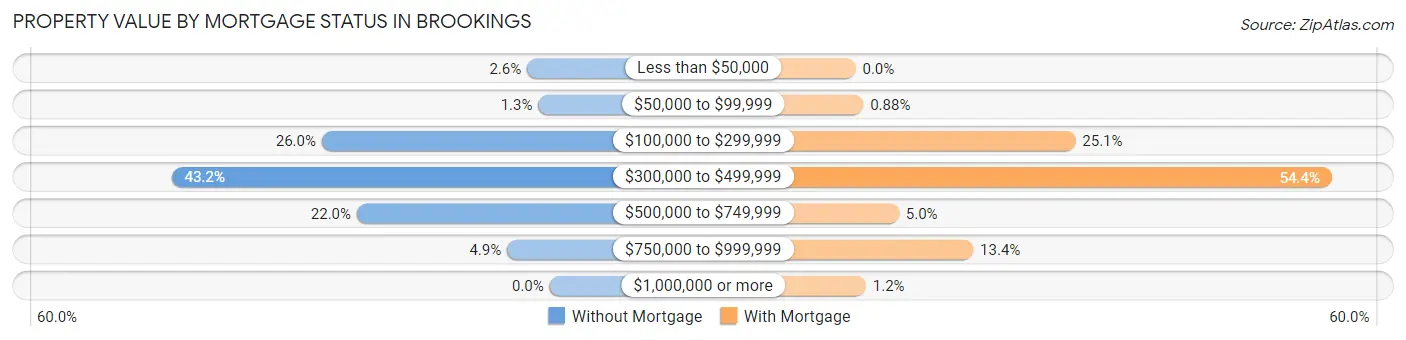
| Property Value | Without Mortgage | With Mortgage |
| Less than $50,000 | 18 (2.6%) | 0 (0.0%) |
| $50,000 to $99,999 | 9 (1.3%) | 15 (0.9%) |
| $100,000 to $299,999 | 182 (26.0%) | 426 (25.1%) |
| $300,000 to $499,999 | 302 (43.2%) | 923 (54.4%) |
| $500,000 to $749,999 | 154 (22.0%) | 84 (5.0%) |
| $750,000 to $999,999 | 34 (4.9%) | 228 (13.4%) |
| $1,000,000 or more | 0 (0.0%) | 20 (1.2%) |
| Total | 699 (100.0%) | 1,696 (100.0%) |
Household Income by Mortgage Status in Brookings
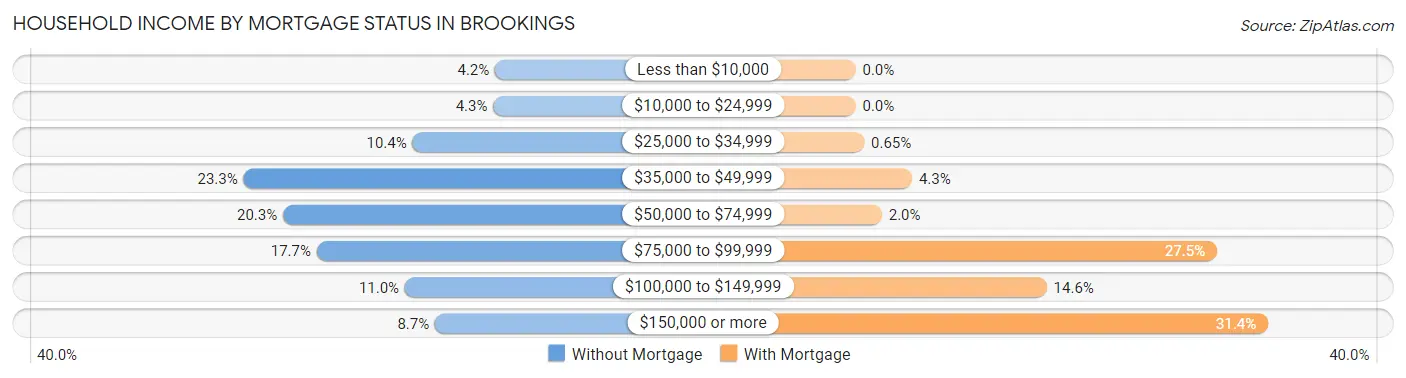
| Household Income | Without Mortgage | With Mortgage |
| Less than $10,000 | 29 (4.2%) | 0 (0.0%) |
| $10,000 to $24,999 | 30 (4.3%) | 0 (0.0%) |
| $25,000 to $34,999 | 73 (10.4%) | 11 (0.6%) |
| $35,000 to $49,999 | 163 (23.3%) | 73 (4.3%) |
| $50,000 to $74,999 | 142 (20.3%) | 34 (2.0%) |
| $75,000 to $99,999 | 124 (17.7%) | 467 (27.5%) |
| $100,000 to $149,999 | 77 (11.0%) | 247 (14.6%) |
| $150,000 or more | 61 (8.7%) | 533 (31.4%) |
| Total | 699 (100.0%) | 1,696 (100.0%) |
Property Value to Household Income Ratio in Brookings
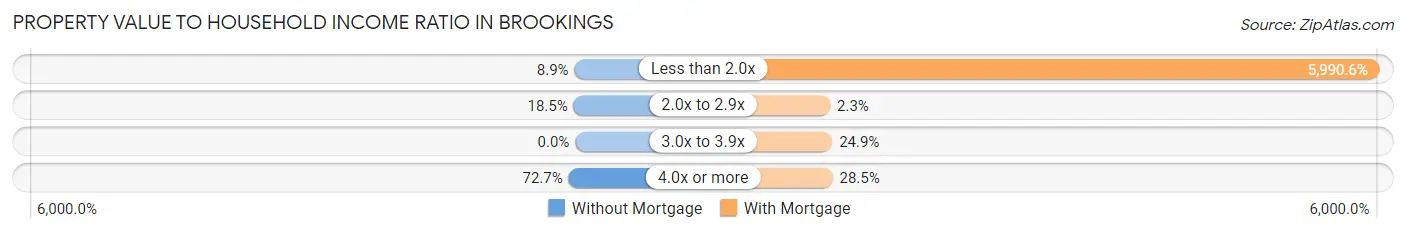
| Value-to-Income Ratio | Without Mortgage | With Mortgage |
| Less than 2.0x | 62 (8.9%) | 101,600 (5,990.6%) |
| 2.0x to 2.9x | 129 (18.4%) | 39 (2.3%) |
| 3.0x to 3.9x | 0 (0.0%) | 422 (24.9%) |
| 4.0x or more | 508 (72.7%) | 484 (28.5%) |
| Total | 699 (100.0%) | 1,696 (100.0%) |
Real Estate Taxes by Mortgage Status in Brookings
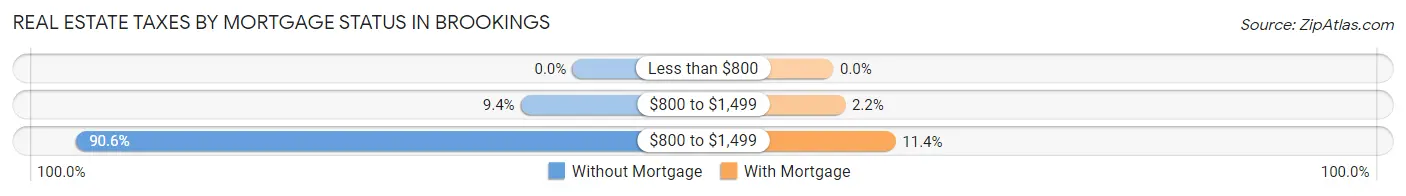
| Property Taxes | Without Mortgage | With Mortgage |
| Less than $800 | 0 (0.0%) | 0 (0.0%) |
| $800 to $1,499 | 66 (9.4%) | 37 (2.2%) |
| $800 to $1,499 | 633 (90.6%) | 193 (11.4%) |
| Total | 699 (100.0%) | 1,696 (100.0%) |
Health & Disability in Brookings
Health Insurance Coverage by Age in Brookings
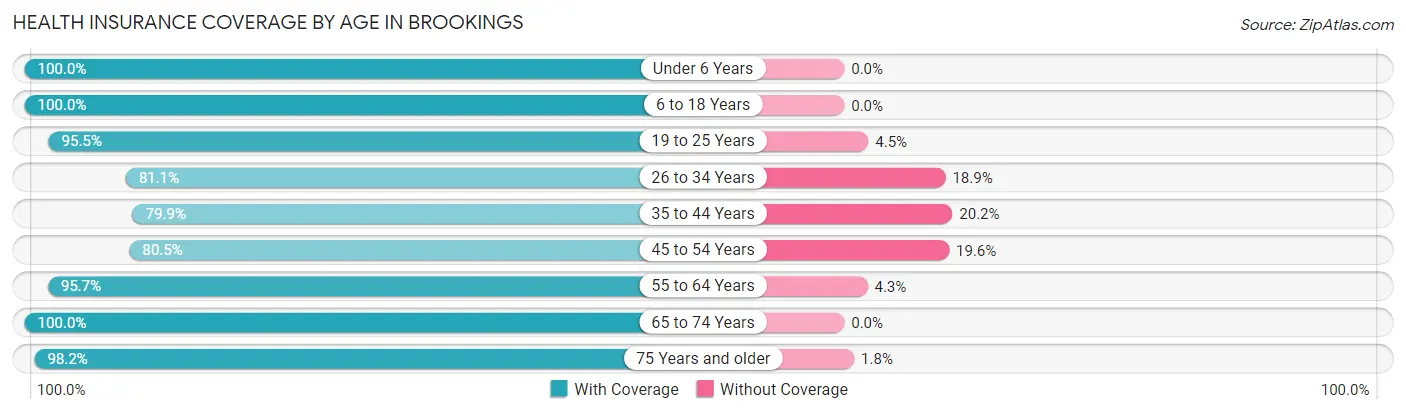
| Age Bracket | With Coverage | Without Coverage |
| Under 6 Years | 324 (100.0%) | 0 (0.0%) |
| 6 to 18 Years | 599 (100.0%) | 0 (0.0%) |
| 19 to 25 Years | 64 (95.5%) | 3 (4.5%) |
| 26 to 34 Years | 933 (81.1%) | 217 (18.9%) |
| 35 to 44 Years | 416 (79.8%) | 105 (20.2%) |
| 45 to 54 Years | 613 (80.4%) | 149 (19.6%) |
| 55 to 64 Years | 1,437 (95.7%) | 65 (4.3%) |
| 65 to 74 Years | 954 (100.0%) | 0 (0.0%) |
| 75 Years and older | 748 (98.2%) | 14 (1.8%) |
| Total | 6,088 (91.7%) | 553 (8.3%) |
Health Insurance Coverage by Citizenship Status in Brookings
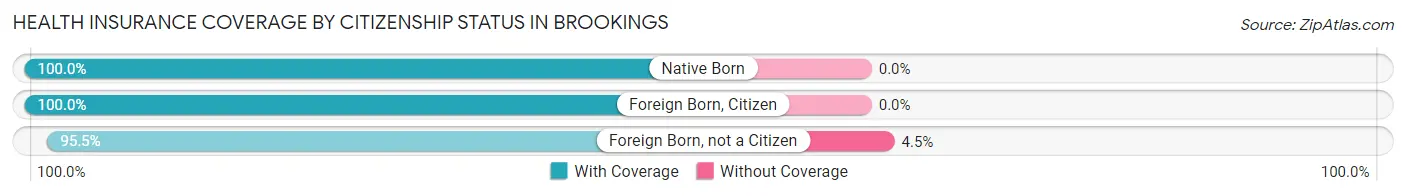
| Citizenship Status | With Coverage | Without Coverage |
| Native Born | 324 (100.0%) | 0 (0.0%) |
| Foreign Born, Citizen | 599 (100.0%) | 0 (0.0%) |
| Foreign Born, not a Citizen | 64 (95.5%) | 3 (4.5%) |
Health Insurance Coverage by Household Income in Brookings
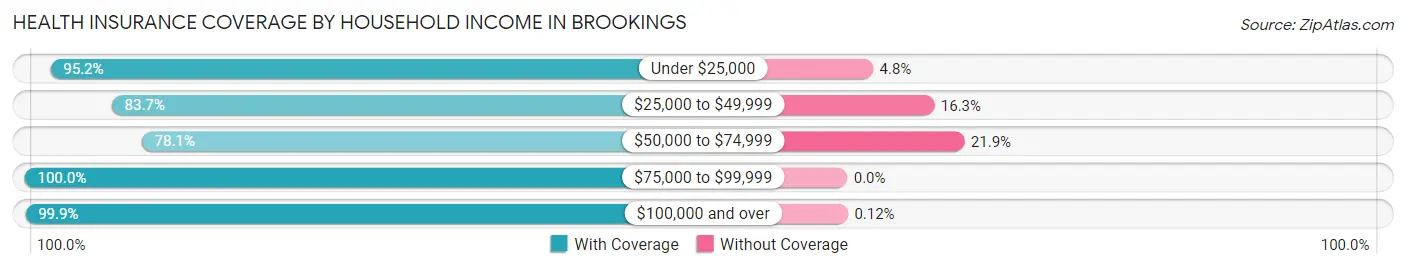
| Household Income | With Coverage | Without Coverage |
| Under $25,000 | 276 (95.2%) | 14 (4.8%) |
| $25,000 to $49,999 | 662 (83.7%) | 129 (16.3%) |
| $50,000 to $74,999 | 1,441 (78.1%) | 405 (21.9%) |
| $75,000 to $99,999 | 999 (100.0%) | 0 (0.0%) |
| $100,000 and over | 2,604 (99.9%) | 3 (0.1%) |
Public vs Private Health Insurance Coverage by Age in Brookings
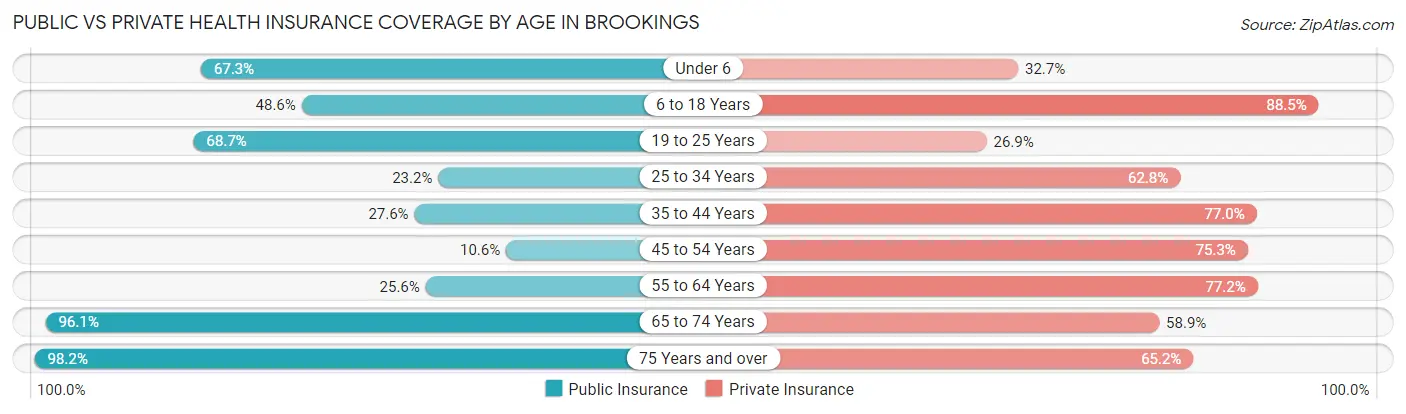
| Age Bracket | Public Insurance | Private Insurance |
| Under 6 | 218 (67.3%) | 106 (32.7%) |
| 6 to 18 Years | 291 (48.6%) | 530 (88.5%) |
| 19 to 25 Years | 46 (68.7%) | 18 (26.9%) |
| 25 to 34 Years | 267 (23.2%) | 722 (62.8%) |
| 35 to 44 Years | 144 (27.6%) | 401 (77.0%) |
| 45 to 54 Years | 81 (10.6%) | 574 (75.3%) |
| 55 to 64 Years | 384 (25.6%) | 1,159 (77.2%) |
| 65 to 74 Years | 917 (96.1%) | 562 (58.9%) |
| 75 Years and over | 748 (98.2%) | 497 (65.2%) |
| Total | 3,096 (46.6%) | 4,569 (68.8%) |
Disability Status by Sex by Age in Brookings
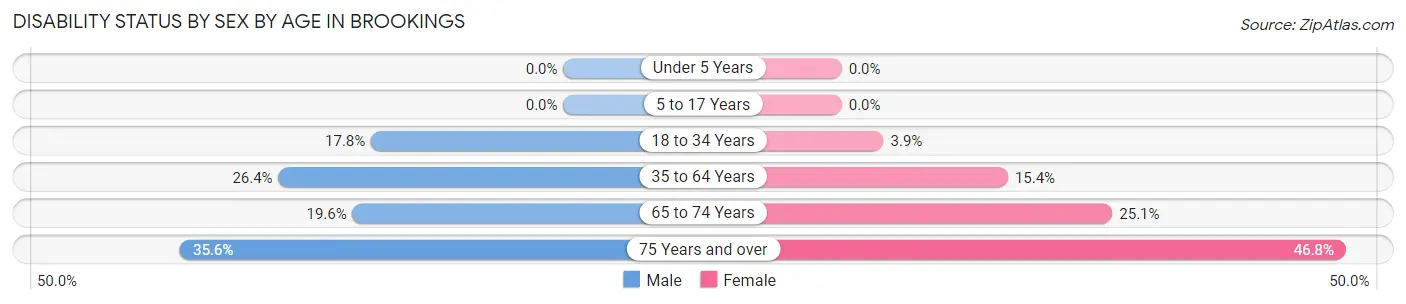
| Age Bracket | Male | Female |
| Under 5 Years | 0 (0.0%) | 0 (0.0%) |
| 5 to 17 Years | 0 (0.0%) | 0 (0.0%) |
| 18 to 34 Years | 142 (17.8%) | 19 (3.9%) |
| 35 to 64 Years | 330 (26.4%) | 237 (15.4%) |
| 65 to 74 Years | 97 (19.6%) | 115 (25.1%) |
| 75 Years and over | 122 (35.6%) | 196 (46.8%) |
Disability Class by Sex by Age in Brookings
Disability Class: Hearing Difficulty
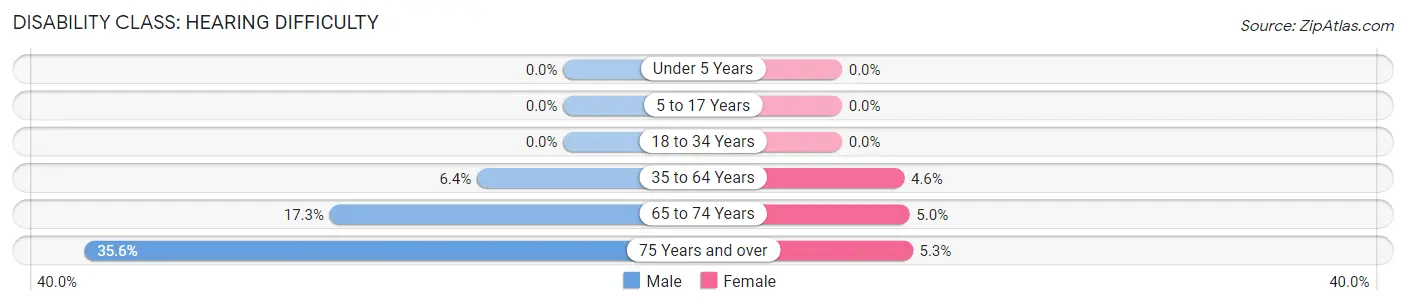
| Age Bracket | Male | Female |
| Under 5 Years | 0 (0.0%) | 0 (0.0%) |
| 5 to 17 Years | 0 (0.0%) | 0 (0.0%) |
| 18 to 34 Years | 0 (0.0%) | 0 (0.0%) |
| 35 to 64 Years | 80 (6.4%) | 71 (4.6%) |
| 65 to 74 Years | 86 (17.3%) | 23 (5.0%) |
| 75 Years and over | 122 (35.6%) | 22 (5.2%) |
Disability Class: Vision Difficulty
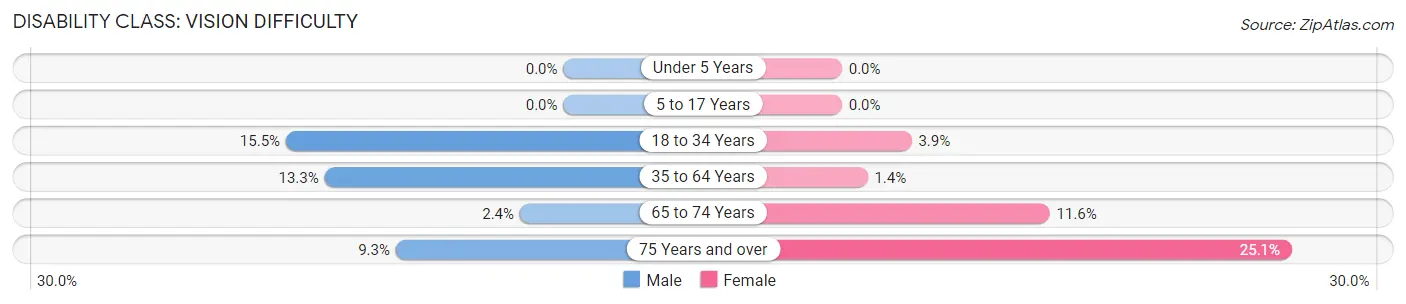
| Age Bracket | Male | Female |
| Under 5 Years | 0 (0.0%) | 0 (0.0%) |
| 5 to 17 Years | 0 (0.0%) | 0 (0.0%) |
| 18 to 34 Years | 123 (15.4%) | 19 (3.9%) |
| 35 to 64 Years | 166 (13.3%) | 22 (1.4%) |
| 65 to 74 Years | 12 (2.4%) | 53 (11.6%) |
| 75 Years and over | 32 (9.3%) | 105 (25.1%) |
Disability Class: Cognitive Difficulty
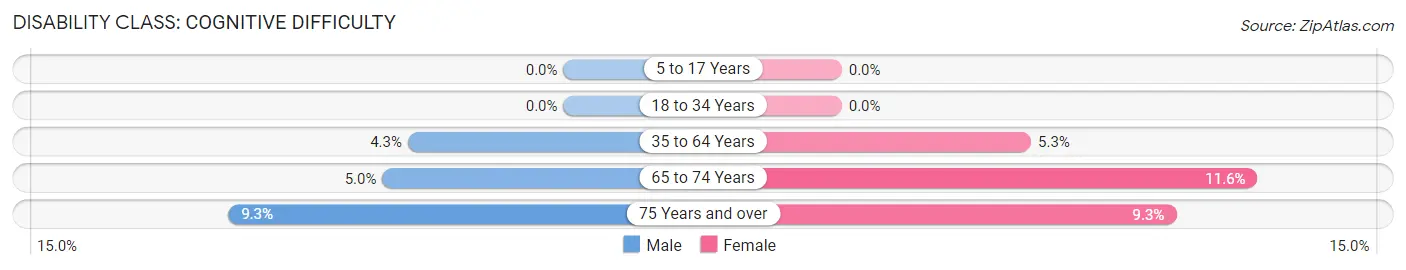
| Age Bracket | Male | Female |
| 5 to 17 Years | 0 (0.0%) | 0 (0.0%) |
| 18 to 34 Years | 0 (0.0%) | 0 (0.0%) |
| 35 to 64 Years | 54 (4.3%) | 81 (5.3%) |
| 65 to 74 Years | 25 (5.0%) | 53 (11.6%) |
| 75 Years and over | 32 (9.3%) | 39 (9.3%) |
Disability Class: Ambulatory Difficulty
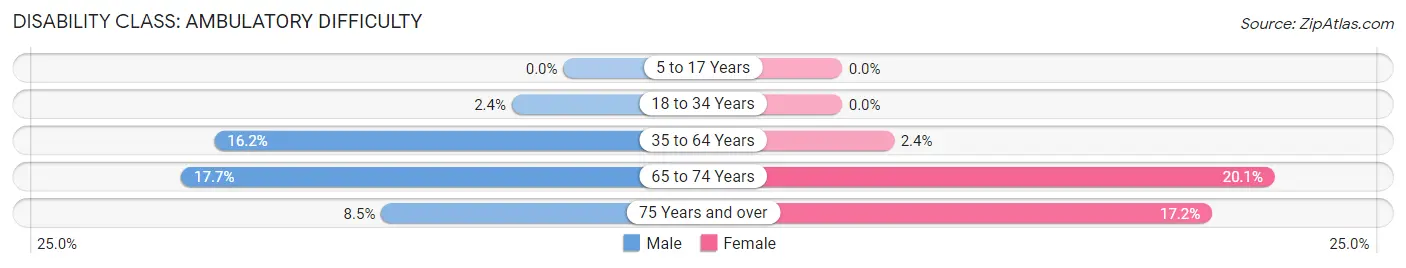
| Age Bracket | Male | Female |
| 5 to 17 Years | 0 (0.0%) | 0 (0.0%) |
| 18 to 34 Years | 19 (2.4%) | 0 (0.0%) |
| 35 to 64 Years | 202 (16.2%) | 37 (2.4%) |
| 65 to 74 Years | 88 (17.7%) | 92 (20.1%) |
| 75 Years and over | 29 (8.5%) | 72 (17.2%) |
Disability Class: Self-Care Difficulty
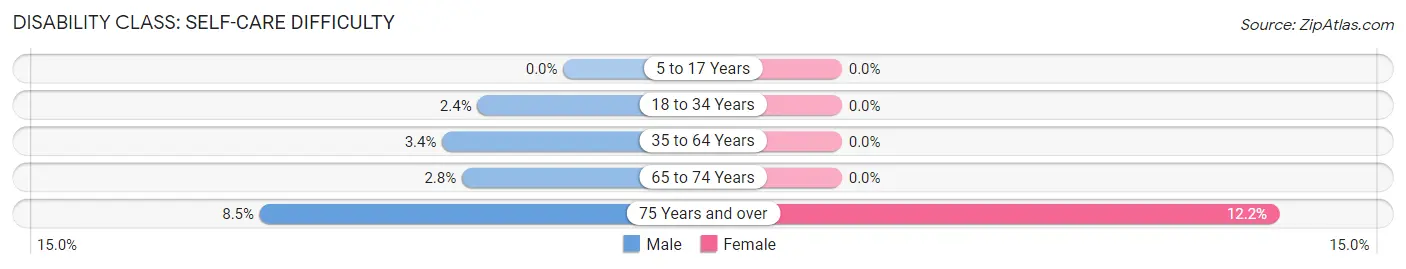
| Age Bracket | Male | Female |
| 5 to 17 Years | 0 (0.0%) | 0 (0.0%) |
| 18 to 34 Years | 19 (2.4%) | 0 (0.0%) |
| 35 to 64 Years | 42 (3.4%) | 0 (0.0%) |
| 65 to 74 Years | 14 (2.8%) | 0 (0.0%) |
| 75 Years and over | 29 (8.5%) | 51 (12.2%) |
Technology Access in Brookings
Computing Device Access in Brookings
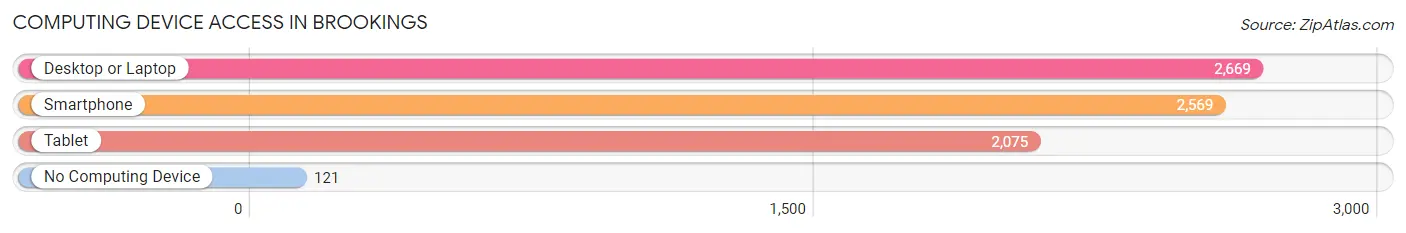
| Device Type | # Households | % Households |
| Desktop or Laptop | 2,669 | 83.6% |
| Smartphone | 2,569 | 80.5% |
| Tablet | 2,075 | 65.0% |
| No Computing Device | 121 | 3.8% |
| Total | 3,193 | 100.0% |
Internet Access in Brookings
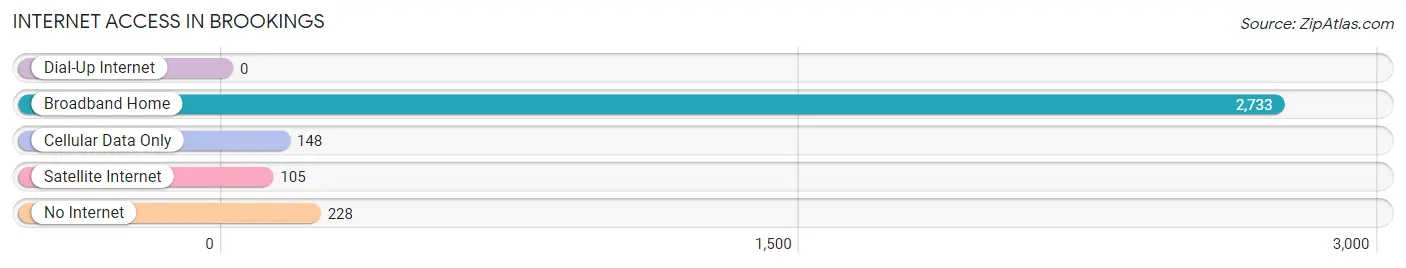
| Internet Type | # Households | % Households |
| Dial-Up Internet | 0 | 0.0% |
| Broadband Home | 2,733 | 85.6% |
| Cellular Data Only | 148 | 4.6% |
| Satellite Internet | 105 | 3.3% |
| No Internet | 228 | 7.1% |
| Total | 3,193 | 100.0% |
Brookings Summary
Brookings, Oregon is a small coastal city located in Curry County, Oregon. It is situated on the southern Oregon Coast, near the California border. The city is known for its stunning views of the Pacific Ocean, its rugged coastline, and its abundance of outdoor activities. Brookings is the largest city in Curry County, with a population of 6,336 as of the 2010 census.
History
The area that is now Brookings was first inhabited by the Chetco and Tututni Native American tribes. The first European settlers arrived in the area in the late 1800s, and the city was officially incorporated in 1951. The city was named after John E. Brookings, a lumberman who owned a large mill in the area.
Geography
Brookings is located on the southern Oregon Coast, near the California border. It is situated on the Chetco River, which flows into the Pacific Ocean. The city is surrounded by the Siskiyou National Forest and the Rogue River-Siskiyou National Forest. The city has a total area of 4.2 square miles, all of which is land.
Climate
Brookings has a mild, temperate climate, with warm summers and mild winters. The average high temperature in the summer is around 70 degrees Fahrenheit, and the average low temperature in the winter is around 40 degrees Fahrenheit. The city receives an average of 55 inches of precipitation per year, with most of it falling in the winter months.
Economy
The economy of Brookings is largely based on tourism and fishing. The city is home to several seafood processing plants, as well as a number of restaurants and hotels. The city is also home to a number of retail stores, including a Walmart Supercenter.
Demographics
As of the 2010 census, the population of Brookings was 6,336. The racial makeup of the city was 90.2% White, 0.7% African American, 1.2% Native American, 1.2% Asian, 0.2% Pacific Islander, 2.3% from other races, and 4.2% from two or more races. The median household income in Brookings was $37,917, and the median family income was $45,938.
Conclusion
Brookings, Oregon is a small coastal city located in Curry County, Oregon. It is known for its stunning views of the Pacific Ocean, its rugged coastline, and its abundance of outdoor activities. The city has a mild, temperate climate, and its economy is largely based on tourism and fishing. As of the 2010 census, the population of Brookings was 6,336, with a median household income of $37,917.
Common Questions
What is Per Capita Income in Brookings?
Per Capita income in Brookings is $43,686.
What is the Median Family Income in Brookings?
Median Family Income in Brookings is $82,536.
What is the Median Household income in Brookings?
Median Household Income in Brookings is $79,109.
What is Income or Wage Gap in Brookings?
Income or Wage Gap in Brookings is 52.1%.
Women in Brookings earn 47.9 cents for every dollar earned by a man.
What is Inequality or Gini Index in Brookings?
Inequality or Gini Index in Brookings is 0.35.
What is the Total Population of Brookings?
Total Population of Brookings is 6,719.
What is the Total Male Population of Brookings?
Total Male Population of Brookings is 3,335.
What is the Total Female Population of Brookings?
Total Female Population of Brookings is 3,384.
What is the Ratio of Males per 100 Females in Brookings?
There are 98.55 Males per 100 Females in Brookings.
What is the Ratio of Females per 100 Males in Brookings?
There are 101.47 Females per 100 Males in Brookings.
What is the Median Population Age in Brookings?
Median Population Age in Brookings is 54.5 Years.
What is the Average Family Size in Brookings
Average Family Size in Brookings is 2.3 People.
What is the Average Household Size in Brookings
Average Household Size in Brookings is 2.0 People.
How Large is the Labor Force in Brookings?
There are 3,466 People in the Labor Forcein in Brookings.
What is the Percentage of People in the Labor Force in Brookings?
57.9% of People are in the Labor Force in Brookings.
What is the Unemployment Rate in Brookings?
Unemployment Rate in Brookings is 8.2%.