Somers, CT Map & Demographics
Somers Map
Somers Overview
$41,583
PER CAPITA INCOME
$107,679
AVG FAMILY INCOME
$79,952
AVG HOUSEHOLD INCOME
24.0%
WAGE / INCOME GAP [ % ]
76.0¢/ $1
WAGE / INCOME GAP [ $ ]
0.40
INEQUALITY / GINI INDEX
2,231
TOTAL POPULATION
973
MALE POPULATION
1,258
FEMALE POPULATION
77.34
MALES / 100 FEMALES
129.29
FEMALES / 100 MALES
38.3
MEDIAN AGE
3.2
AVG FAMILY SIZE
2.5
AVG HOUSEHOLD SIZE
1,034
LABOR FORCE [ PEOPLE ]
67.7%
PERCENT IN LABOR FORCE
Somers Zip Codes
Somers Area Codes
Income in Somers
Income Overview in Somers
Per Capita Income in Somers is $41,583, while median incomes of families and households are $107,679 and $79,952 respectively.
| Characteristic | Number | Measure |
| Per Capita Income | 2,231 | $41,583 |
| Median Family Income | 575 | $107,679 |
| Mean Family Income | 575 | $121,681 |
| Median Household Income | 899 | $79,952 |
| Mean Household Income | 899 | $102,592 |
| Income Deficit | 575 | $0 |
| Wage / Income Gap (%) | 2,231 | 24.01% |
| Wage / Income Gap ($) | 2,231 | 75.99¢ per $1 |
| Gini / Inequality Index | 2,231 | 0.40 |
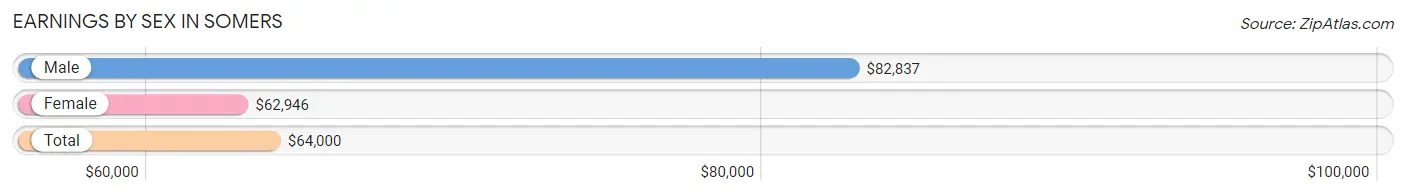
Earnings by Sex in Somers
Average Earnings in Somers are $64,000, $82,837 for men and $62,946 for women, a difference of 24.0%.
| Sex | Number | Average Earnings |
| Male | 501 (43.3%) | $82,837 |
| Female | 657 (56.7%) | $62,946 |
| Total | 1,158 (100.0%) | $64,000 |
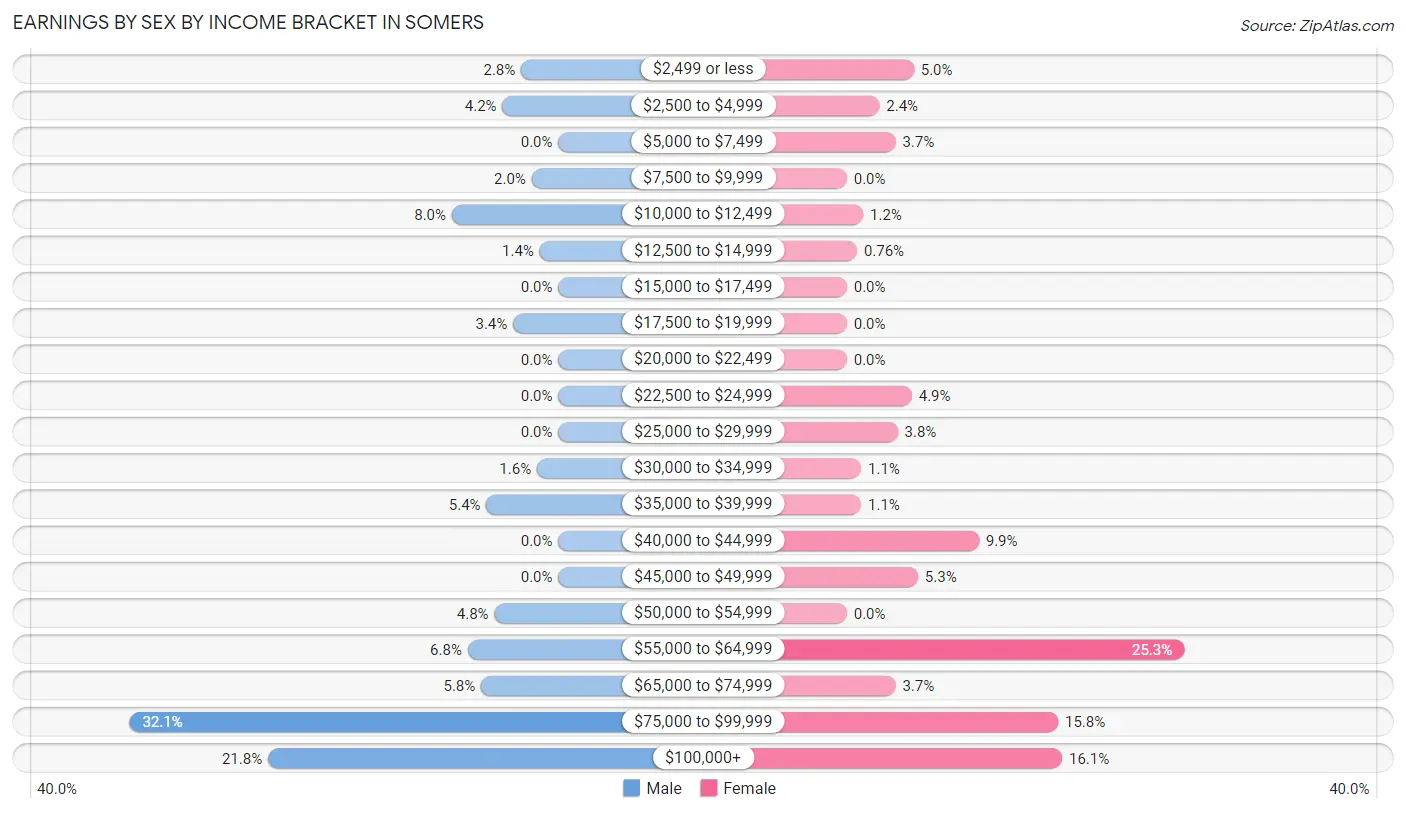
Earnings by Sex by Income Bracket in Somers
The most common earnings brackets in Somers are $75,000 to $99,999 for men (161 | 32.1%) and $55,000 to $64,999 for women (166 | 25.3%).
| Income | Male | Female |
| $2,499 or less | 14 (2.8%) | 33 (5.0%) |
| $2,500 to $4,999 | 21 (4.2%) | 16 (2.4%) |
| $5,000 to $7,499 | 0 (0.0%) | 24 (3.6%) |
| $7,500 to $9,999 | 10 (2.0%) | 0 (0.0%) |
| $10,000 to $12,499 | 40 (8.0%) | 8 (1.2%) |
| $12,500 to $14,999 | 7 (1.4%) | 5 (0.8%) |
| $15,000 to $17,499 | 0 (0.0%) | 0 (0.0%) |
| $17,500 to $19,999 | 17 (3.4%) | 0 (0.0%) |
| $20,000 to $22,499 | 0 (0.0%) | 0 (0.0%) |
| $22,500 to $24,999 | 0 (0.0%) | 32 (4.9%) |
| $25,000 to $29,999 | 0 (0.0%) | 25 (3.8%) |
| $30,000 to $34,999 | 8 (1.6%) | 7 (1.1%) |
| $35,000 to $39,999 | 27 (5.4%) | 7 (1.1%) |
| $40,000 to $44,999 | 0 (0.0%) | 65 (9.9%) |
| $45,000 to $49,999 | 0 (0.0%) | 35 (5.3%) |
| $50,000 to $54,999 | 24 (4.8%) | 0 (0.0%) |
| $55,000 to $64,999 | 34 (6.8%) | 166 (25.3%) |
| $65,000 to $74,999 | 29 (5.8%) | 24 (3.6%) |
| $75,000 to $99,999 | 161 (32.1%) | 104 (15.8%) |
| $100,000+ | 109 (21.8%) | 106 (16.1%) |
| Total | 501 (100.0%) | 657 (100.0%) |
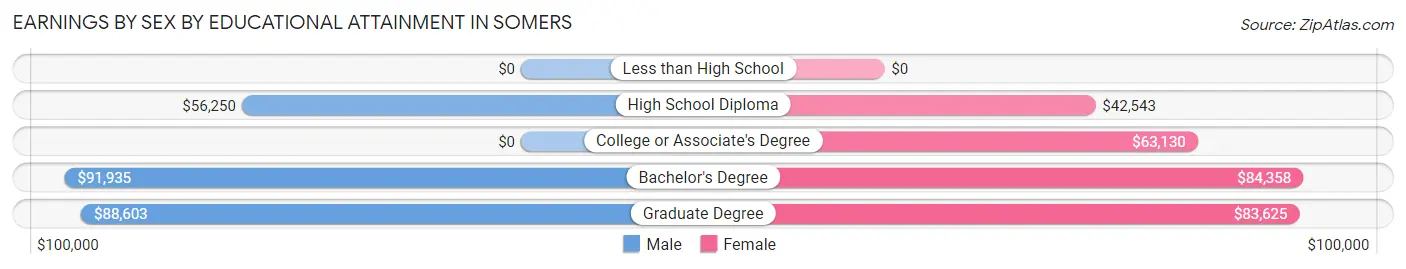
Earnings by Sex by Educational Attainment in Somers
Average earnings in Somers are $84,567 for men and $63,315 for women, a difference of 25.1%. Men with an educational attainment of bachelor's degree enjoy the highest average annual earnings of $91,935, while those with high school diploma education earn the least with $56,250. Women with an educational attainment of bachelor's degree earn the most with the average annual earnings of $84,358, while those with high school diploma education have the smallest earnings of $42,543.
| Educational Attainment | Male Income | Female Income |
| Less than High School | - | - |
| High School Diploma | $56,250 | $42,543 |
| College or Associate's Degree | - | - |
| Bachelor's Degree | $91,935 | $84,358 |
| Graduate Degree | $88,603 | $83,625 |
| Total | $84,567 | $63,315 |
Family Income in Somers
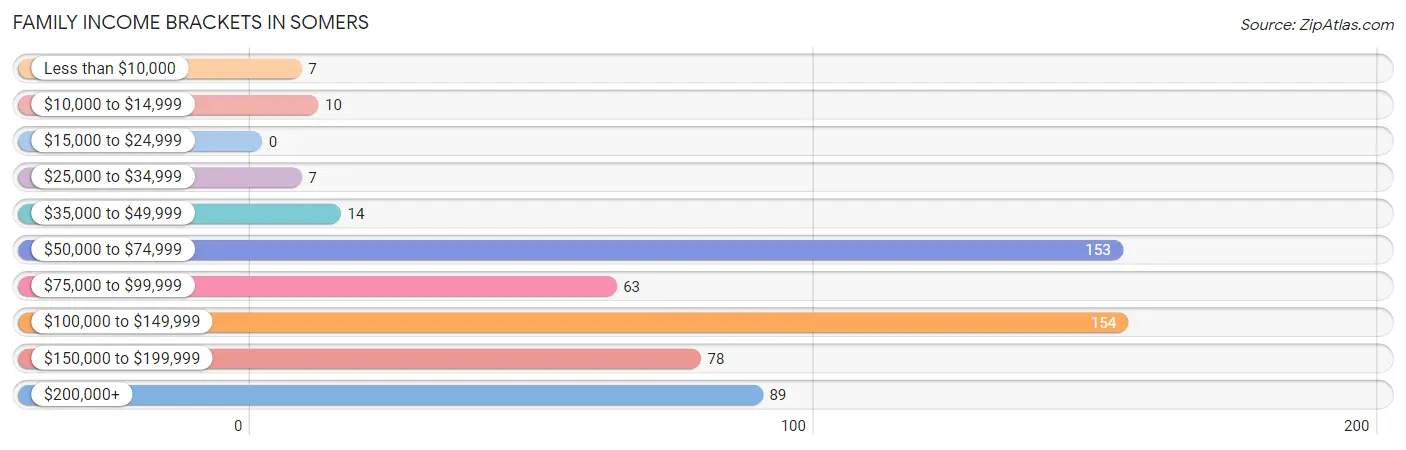
Family Income Brackets in Somers
According to the Somers family income data, there are 154 families falling into the $100,000 to $149,999 income range, which is the most common income bracket and makes up 26.8% of all families.
| Income Bracket | # Families | % Families |
| Less than $10,000 | 7 | 1.2% |
| $10,000 to $14,999 | 10 | 1.7% |
| $15,000 to $24,999 | 0 | 0.0% |
| $25,000 to $34,999 | 7 | 1.2% |
| $35,000 to $49,999 | 14 | 2.4% |
| $50,000 to $74,999 | 153 | 26.6% |
| $75,000 to $99,999 | 63 | 11.0% |
| $100,000 to $149,999 | 154 | 26.8% |
| $150,000 to $199,999 | 78 | 13.6% |
| $200,000+ | 89 | 15.5% |
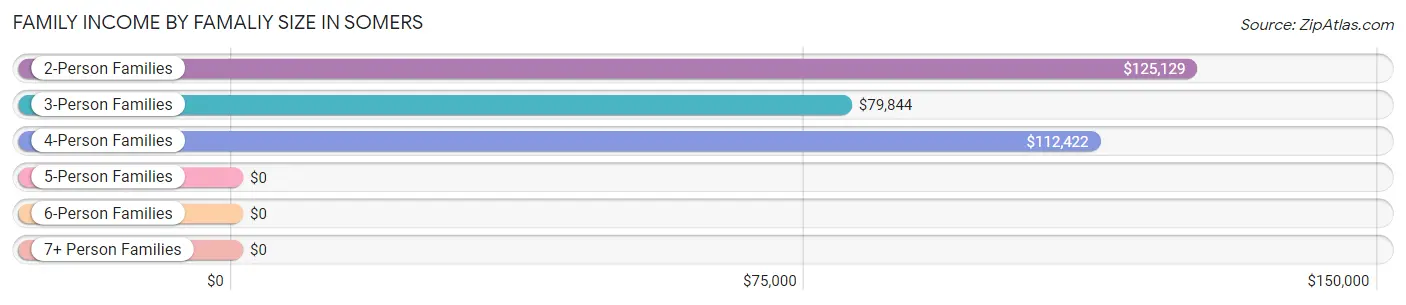
Family Income by Famaliy Size in Somers
2-person families (199 | 34.6%) account for the highest median family income in Somers with $125,129 per family, while 2-person families (199 | 34.6%) have the highest median income of $62,564 per family member.
| Income Bracket | # Families | Median Income |
| 2-Person Families | 199 (34.6%) | $125,129 |
| 3-Person Families | 292 (50.8%) | $79,844 |
| 4-Person Families | 51 (8.9%) | $112,422 |
| 5-Person Families | 0 (0.0%) | $0 |
| 6-Person Families | 33 (5.7%) | $0 |
| 7+ Person Families | 0 (0.0%) | $0 |
| Total | 575 (100.0%) | $107,679 |
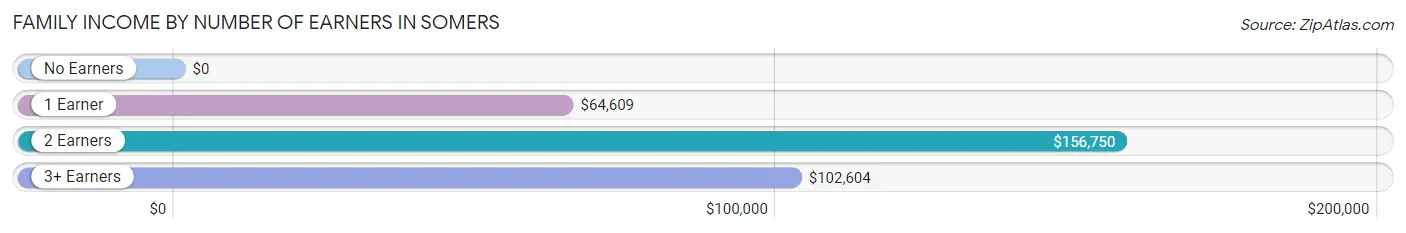
Family Income by Number of Earners in Somers
| Number of Earners | # Families | Median Income |
| No Earners | 31 (5.4%) | $0 |
| 1 Earner | 208 (36.2%) | $64,609 |
| 2 Earners | 271 (47.1%) | $156,750 |
| 3+ Earners | 65 (11.3%) | $102,604 |
| Total | 575 (100.0%) | $107,679 |
Household Income in Somers
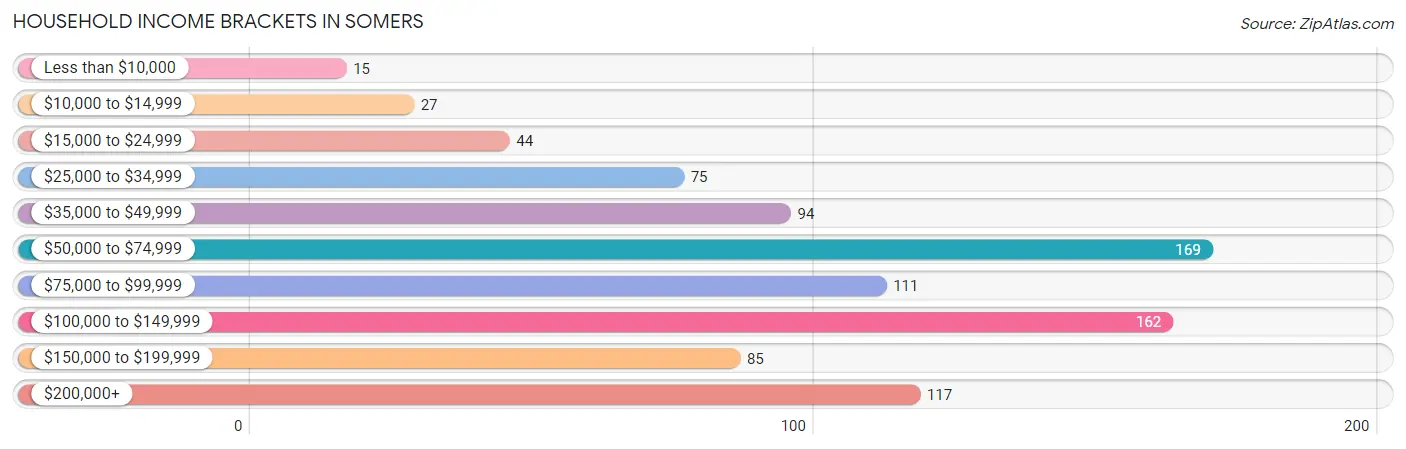
Household Income Brackets in Somers
With 169 households falling in the category, the $50,000 to $74,999 income range is the most frequent in Somers, accounting for 18.8% of all households. In contrast, only 15 households (1.7%) fall into the less than $10,000 income bracket, making it the least populous group.
| Income Bracket | # Households | % Households |
| Less than $10,000 | 15 | 1.7% |
| $10,000 to $14,999 | 27 | 3.0% |
| $15,000 to $24,999 | 44 | 4.9% |
| $25,000 to $34,999 | 75 | 8.3% |
| $35,000 to $49,999 | 94 | 10.5% |
| $50,000 to $74,999 | 169 | 18.8% |
| $75,000 to $99,999 | 111 | 12.3% |
| $100,000 to $149,999 | 162 | 18.0% |
| $150,000 to $199,999 | 85 | 9.5% |
| $200,000+ | 117 | 13.0% |
Household Income by Householder Age in Somers
The median household income in Somers is $79,952, with the highest median household income of $168,309 found in the 25 to 44 years age bracket for the primary householder. A total of 185 households (20.6%) fall into this category.
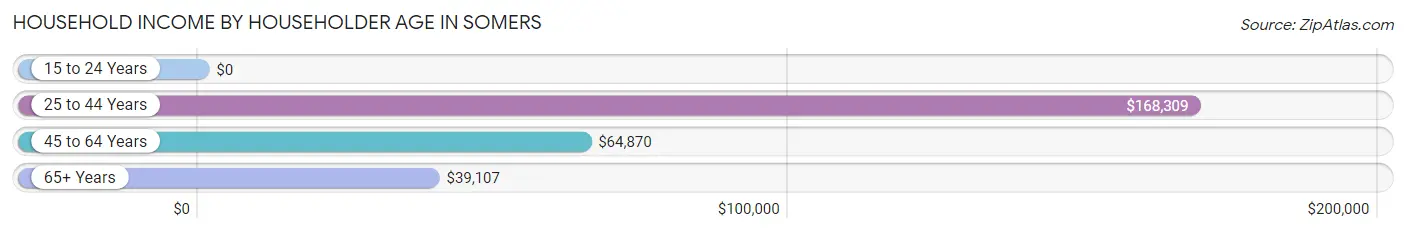
| Income Bracket | # Households | Median Income |
| 15 to 24 Years | 0 (0.0%) | $0 |
| 25 to 44 Years | 185 (20.6%) | $168,309 |
| 45 to 64 Years | 416 (46.3%) | $64,870 |
| 65+ Years | 298 (33.2%) | $39,107 |
| Total | 899 (100.0%) | $79,952 |
Poverty in Somers
Income Below Poverty by Sex and Age in Somers
With 3.7% poverty level for males and 1.8% for females among the residents of Somers, 55 to 64 year old males and 65 to 74 year old females are the most vulnerable to poverty, with 21 males (13.6%) and 7 females (9.5%) in their respective age groups living below the poverty level.
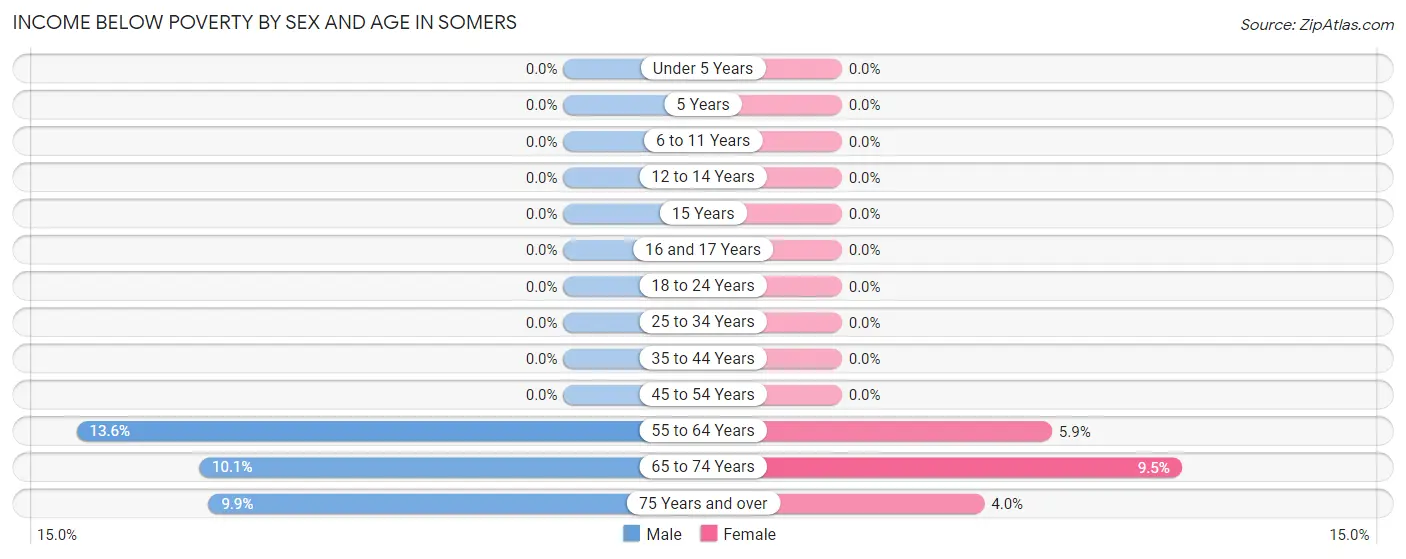
| Age Bracket | Male | Female |
| Under 5 Years | 0 (0.0%) | 0 (0.0%) |
| 5 Years | 0 (0.0%) | 0 (0.0%) |
| 6 to 11 Years | 0 (0.0%) | 0 (0.0%) |
| 12 to 14 Years | 0 (0.0%) | 0 (0.0%) |
| 15 Years | 0 (0.0%) | 0 (0.0%) |
| 16 and 17 Years | 0 (0.0%) | 0 (0.0%) |
| 18 to 24 Years | 0 (0.0%) | 0 (0.0%) |
| 25 to 34 Years | 0 (0.0%) | 0 (0.0%) |
| 35 to 44 Years | 0 (0.0%) | 0 (0.0%) |
| 45 to 54 Years | 0 (0.0%) | 0 (0.0%) |
| 55 to 64 Years | 21 (13.6%) | 10 (5.9%) |
| 65 to 74 Years | 7 (10.1%) | 7 (9.5%) |
| 75 Years and over | 8 (9.9%) | 6 (4.0%) |
| Total | 36 (3.7%) | 23 (1.8%) |
Income Above Poverty by Sex and Age in Somers
According to the poverty statistics in Somers, males aged under 5 years and females aged under 5 years are the age groups that are most secure financially, with 100.0% of males and 100.0% of females in these age groups living above the poverty line.
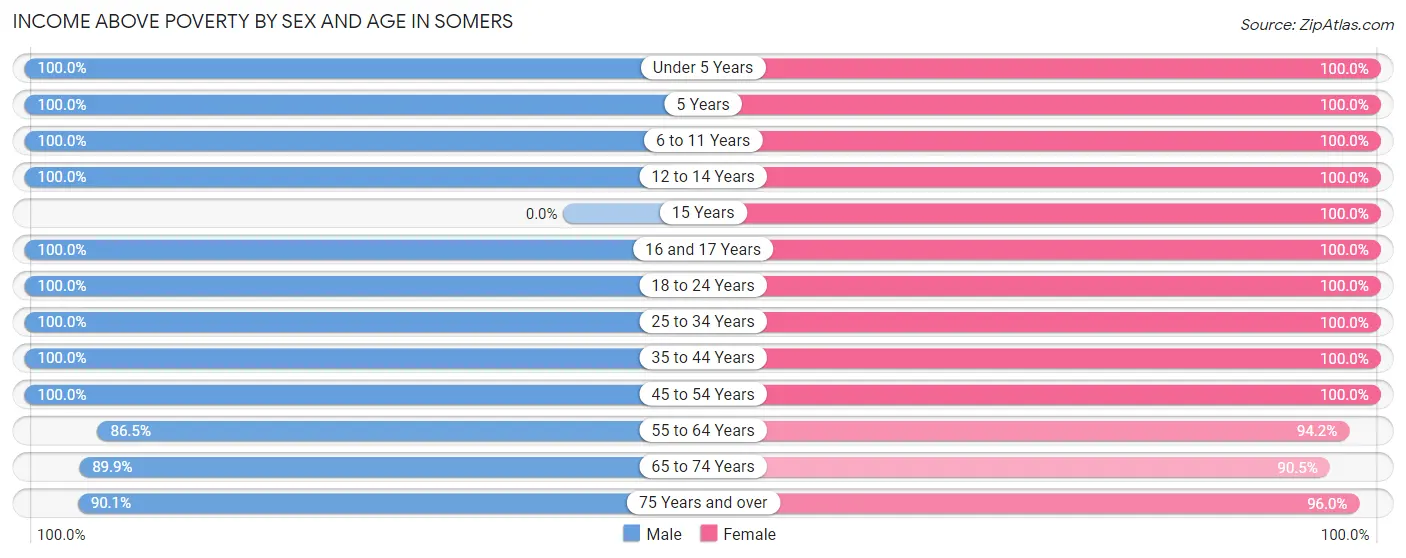
| Age Bracket | Male | Female |
| Under 5 Years | 92 (100.0%) | 11 (100.0%) |
| 5 Years | 10 (100.0%) | 16 (100.0%) |
| 6 to 11 Years | 248 (100.0%) | 297 (100.0%) |
| 12 to 14 Years | 9 (100.0%) | 14 (100.0%) |
| 15 Years | 0 (0.0%) | 6 (100.0%) |
| 16 and 17 Years | 12 (100.0%) | 35 (100.0%) |
| 18 to 24 Years | 24 (100.0%) | 17 (100.0%) |
| 25 to 34 Years | 106 (100.0%) | 129 (100.0%) |
| 35 to 44 Years | 102 (100.0%) | 65 (100.0%) |
| 45 to 54 Years | 65 (100.0%) | 272 (100.0%) |
| 55 to 64 Years | 134 (86.5%) | 161 (94.2%) |
| 65 to 74 Years | 62 (89.9%) | 67 (90.5%) |
| 75 Years and over | 73 (90.1%) | 145 (96.0%) |
| Total | 937 (96.3%) | 1,235 (98.2%) |
Income Below Poverty Among Married-Couple Families in Somers
The poverty statistics for married-couple families in Somers show that 4.2% or 17 of the total 402 families live below the poverty line. Families with no children have the highest poverty rate of 7.8%, comprising of 17 families. On the other hand, families with 1 or 2 children have the lowest poverty rate of 0.0%, which includes 0 families.
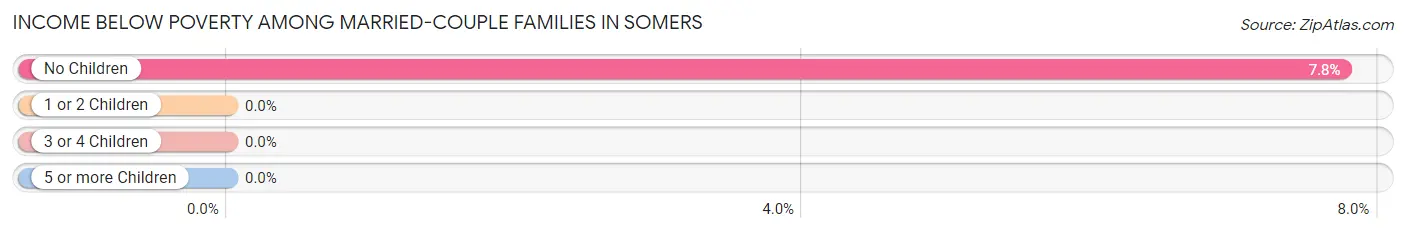
| Children | Above Poverty | Below Poverty |
| No Children | 202 (92.2%) | 17 (7.8%) |
| 1 or 2 Children | 150 (100.0%) | 0 (0.0%) |
| 3 or 4 Children | 33 (100.0%) | 0 (0.0%) |
| 5 or more Children | 0 (0.0%) | 0 (0.0%) |
| Total | 385 (95.8%) | 17 (4.2%) |
Income Below Poverty Among Single-Parent Households in Somers
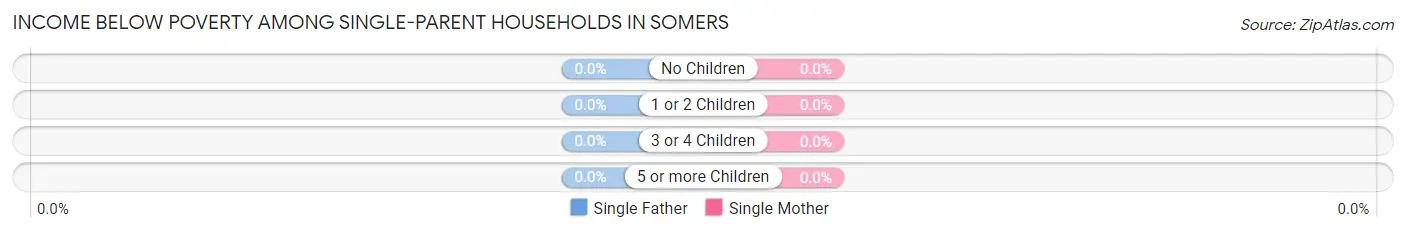
| Children | Single Father | Single Mother |
| No Children | 0 (0.0%) | 0 (0.0%) |
| 1 or 2 Children | 0 (0.0%) | 0 (0.0%) |
| 3 or 4 Children | 0 (0.0%) | 0 (0.0%) |
| 5 or more Children | 0 (0.0%) | 0 (0.0%) |
| Total | 0 (0.0%) | 0 (0.0%) |
Income Below Poverty Among Married-Couple vs Single-Parent Households in Somers
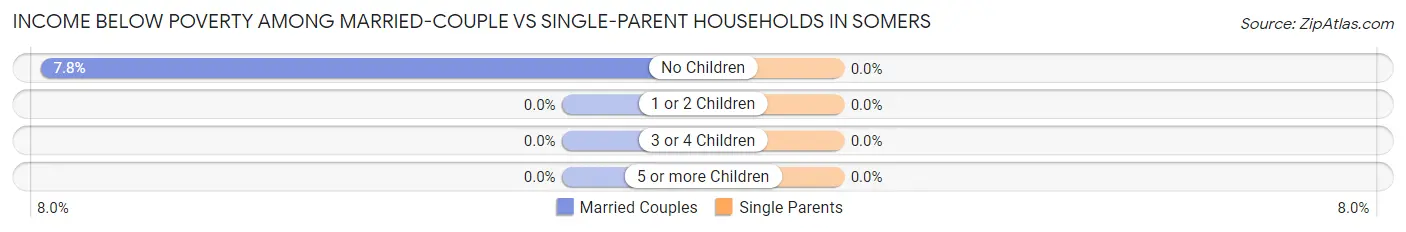
| Children | Married-Couple Families | Single-Parent Households |
| No Children | 17 (7.8%) | 0 (0.0%) |
| 1 or 2 Children | 0 (0.0%) | 0 (0.0%) |
| 3 or 4 Children | 0 (0.0%) | 0 (0.0%) |
| 5 or more Children | 0 (0.0%) | 0 (0.0%) |
| Total | 17 (4.2%) | 0 (0.0%) |
Race in Somers
The most populous races in Somers are White / Caucasian (1,707 | 76.5%), Some other Race (462 | 20.7%), and Hispanic or Latino (115 | 5.1%).
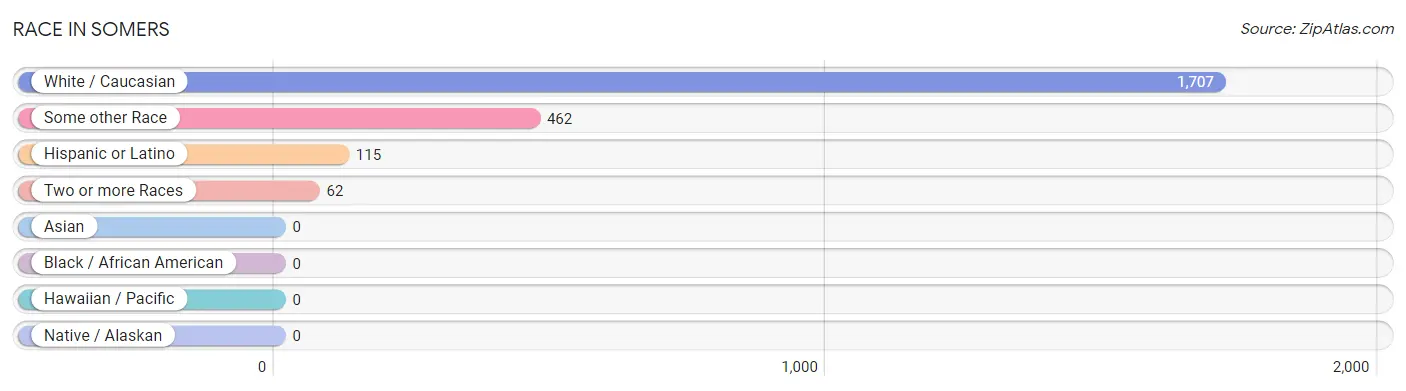
| Race | # Population | % Population |
| Asian | 0 | 0.0% |
| Black / African American | 0 | 0.0% |
| Hawaiian / Pacific | 0 | 0.0% |
| Hispanic or Latino | 115 | 5.1% |
| Native / Alaskan | 0 | 0.0% |
| White / Caucasian | 1,707 | 76.5% |
| Two or more Races | 62 | 2.8% |
| Some other Race | 462 | 20.7% |
| Total | 2,231 | 100.0% |
Ancestry in Somers
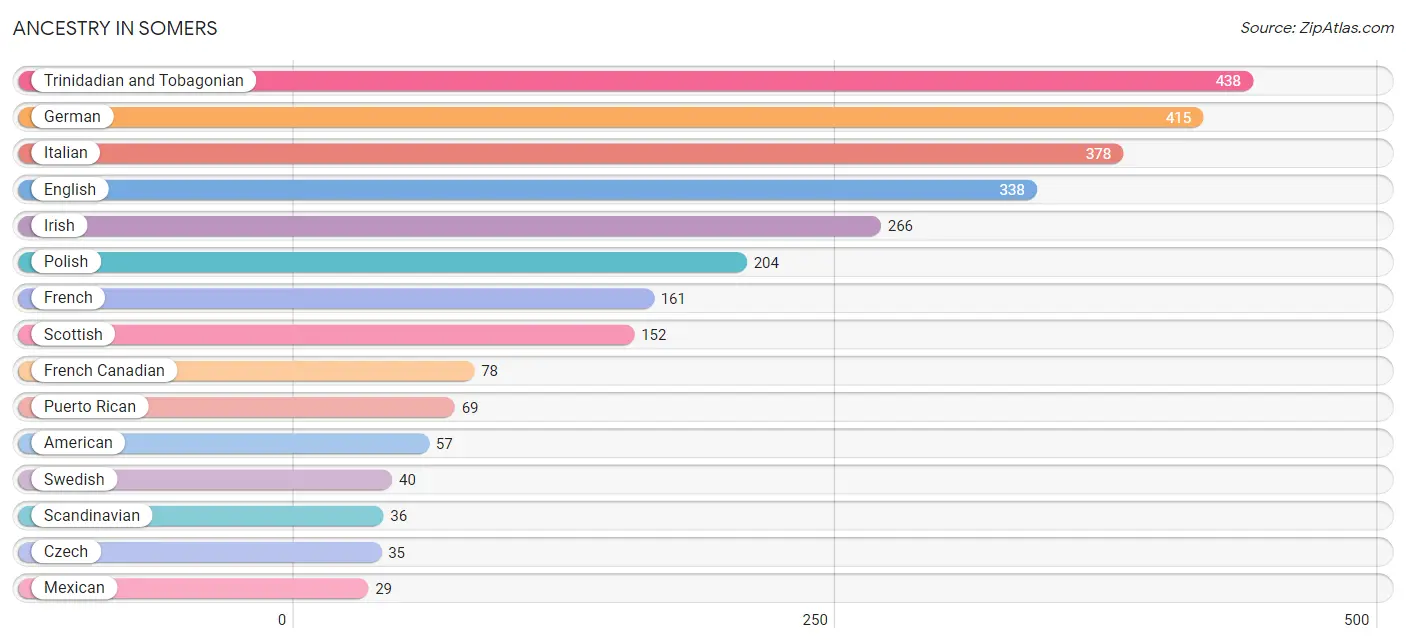
The most populous ancestries reported in Somers are Trinidadian and Tobagonian (438 | 19.6%), German (415 | 18.6%), Italian (378 | 16.9%), English (338 | 15.1%), and Irish (266 | 11.9%), together accounting for 82.2% of all Somers residents.
| Ancestry | # Population | % Population |
| American | 57 | 2.5% |
| Arab | 7 | 0.3% |
| British | 15 | 0.7% |
| Canadian | 26 | 1.2% |
| Central American | 17 | 0.8% |
| Czech | 35 | 1.6% |
| Czechoslovakian | 8 | 0.4% |
| Danish | 16 | 0.7% |
| English | 338 | 15.1% |
| European | 8 | 0.4% |
| French | 161 | 7.2% |
| French Canadian | 78 | 3.5% |
| German | 415 | 18.6% |
| Guatemalan | 17 | 0.8% |
| Hungarian | 7 | 0.3% |
| Irish | 266 | 11.9% |
| Italian | 378 | 16.9% |
| Lebanese | 7 | 0.3% |
| Lithuanian | 11 | 0.5% |
| Mexican | 29 | 1.3% |
| Norwegian | 8 | 0.4% |
| Polish | 204 | 9.1% |
| Puerto Rican | 69 | 3.1% |
| Scandinavian | 36 | 1.6% |
| Scotch-Irish | 9 | 0.4% |
| Scottish | 152 | 6.8% |
| Swedish | 40 | 1.8% |
| Trinidadian and Tobagonian | 438 | 19.6% |
| Ukrainian | 15 | 0.7% | View All 29 Rows |
Immigrants in Somers
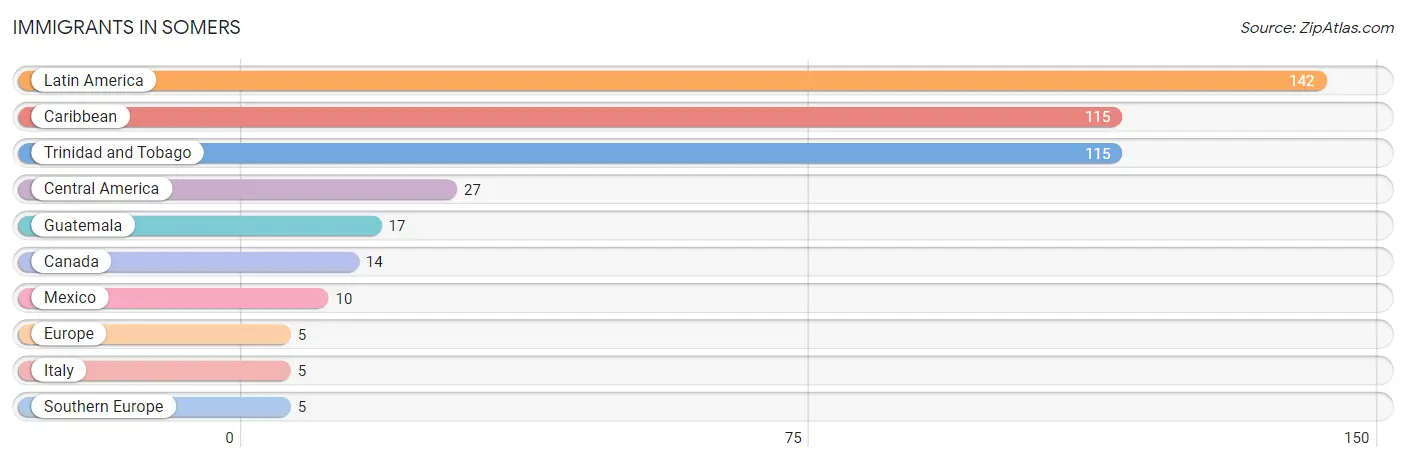
The most numerous immigrant groups reported in Somers came from Latin America (142 | 6.4%), Caribbean (115 | 5.1%), Trinidad and Tobago (115 | 5.1%), Central America (27 | 1.2%), and Guatemala (17 | 0.8%), together accounting for 18.6% of all Somers residents.
| Immigration Origin | # Population | % Population |
| Canada | 14 | 0.6% |
| Caribbean | 115 | 5.1% |
| Central America | 27 | 1.2% |
| Europe | 5 | 0.2% |
| Guatemala | 17 | 0.8% |
| Italy | 5 | 0.2% |
| Latin America | 142 | 6.4% |
| Mexico | 10 | 0.4% |
| Southern Europe | 5 | 0.2% |
| Trinidad and Tobago | 115 | 5.1% | View All 10 Rows |
Sex and Age in Somers
Sex and Age in Somers
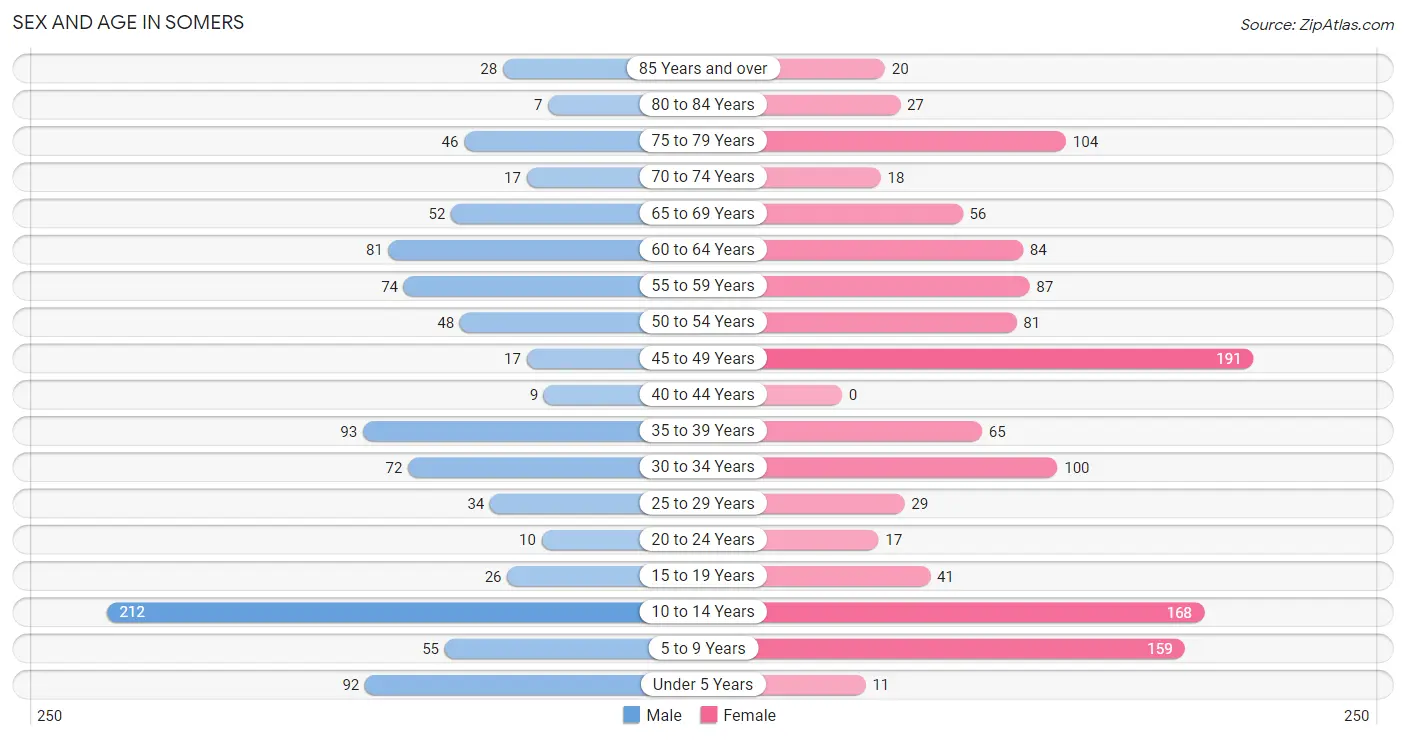
The most populous age groups in Somers are 10 to 14 Years (212 | 21.8%) for men and 45 to 49 Years (191 | 15.2%) for women.
| Age Bracket | Male | Female |
| Under 5 Years | 92 (9.5%) | 11 (0.9%) |
| 5 to 9 Years | 55 (5.7%) | 159 (12.6%) |
| 10 to 14 Years | 212 (21.8%) | 168 (13.4%) |
| 15 to 19 Years | 26 (2.7%) | 41 (3.3%) |
| 20 to 24 Years | 10 (1.0%) | 17 (1.3%) |
| 25 to 29 Years | 34 (3.5%) | 29 (2.3%) |
| 30 to 34 Years | 72 (7.4%) | 100 (8.0%) |
| 35 to 39 Years | 93 (9.6%) | 65 (5.2%) |
| 40 to 44 Years | 9 (0.9%) | 0 (0.0%) |
| 45 to 49 Years | 17 (1.8%) | 191 (15.2%) |
| 50 to 54 Years | 48 (4.9%) | 81 (6.4%) |
| 55 to 59 Years | 74 (7.6%) | 87 (6.9%) |
| 60 to 64 Years | 81 (8.3%) | 84 (6.7%) |
| 65 to 69 Years | 52 (5.3%) | 56 (4.4%) |
| 70 to 74 Years | 17 (1.8%) | 18 (1.4%) |
| 75 to 79 Years | 46 (4.7%) | 104 (8.3%) |
| 80 to 84 Years | 7 (0.7%) | 27 (2.1%) |
| 85 Years and over | 28 (2.9%) | 20 (1.6%) |
| Total | 973 (100.0%) | 1,258 (100.0%) |
Families and Households in Somers
Median Family Size in Somers
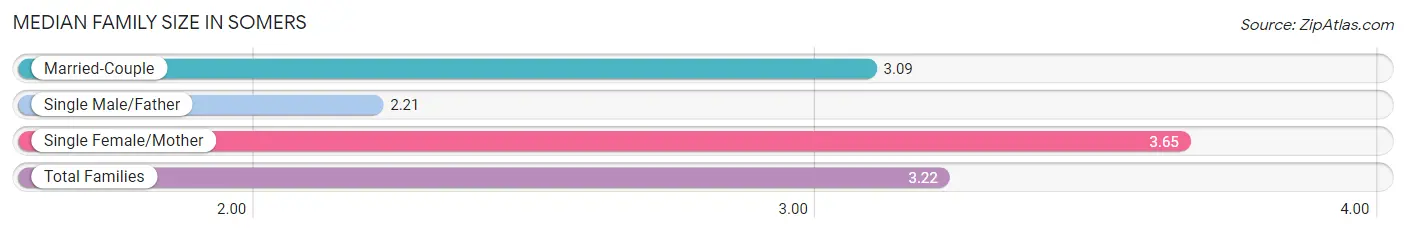
The median family size in Somers is 3.22 persons per family, with single female/mother families (159 | 27.7%) accounting for the largest median family size of 3.65 persons per family. On the other hand, single male/father families (14 | 2.4%) represent the smallest median family size with 2.21 persons per family.
| Family Type | # Families | Family Size |
| Married-Couple | 402 (69.9%) | 3.09 |
| Single Male/Father | 14 (2.4%) | 2.21 |
| Single Female/Mother | 159 (27.7%) | 3.65 |
| Total Families | 575 (100.0%) | 3.22 |
Median Household Size in Somers
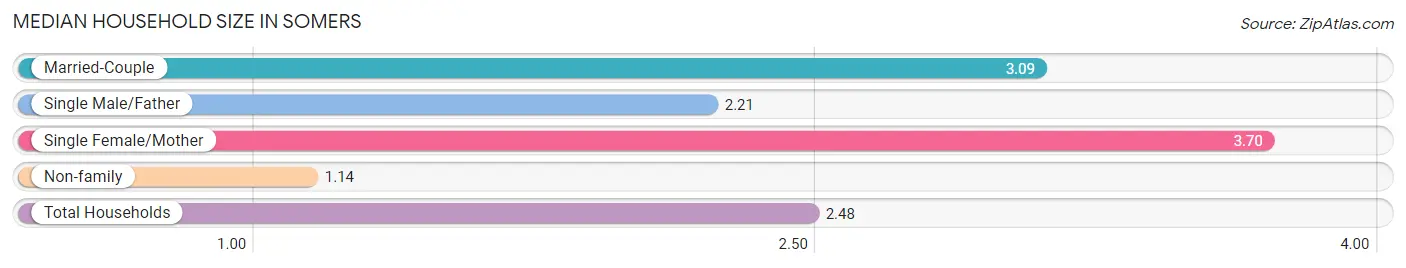
The median household size in Somers is 2.48 persons per household, with single female/mother households (159 | 17.7%) accounting for the largest median household size of 3.7 persons per household. non-family households (324 | 36.0%) represent the smallest median household size with 1.14 persons per household.
| Household Type | # Households | Household Size |
| Married-Couple | 402 (44.7%) | 3.09 |
| Single Male/Father | 14 (1.6%) | 2.21 |
| Single Female/Mother | 159 (17.7%) | 3.70 |
| Non-family | 324 (36.0%) | 1.14 |
| Total Households | 899 (100.0%) | 2.48 |
Household Size by Marriage Status in Somers
Out of a total of 899 households in Somers, 575 (64.0%) are family households, while 324 (36.0%) are nonfamily households. The most numerous type of family households are 3-person households, comprising 278, and the most common type of nonfamily households are 1-person households, comprising 280.
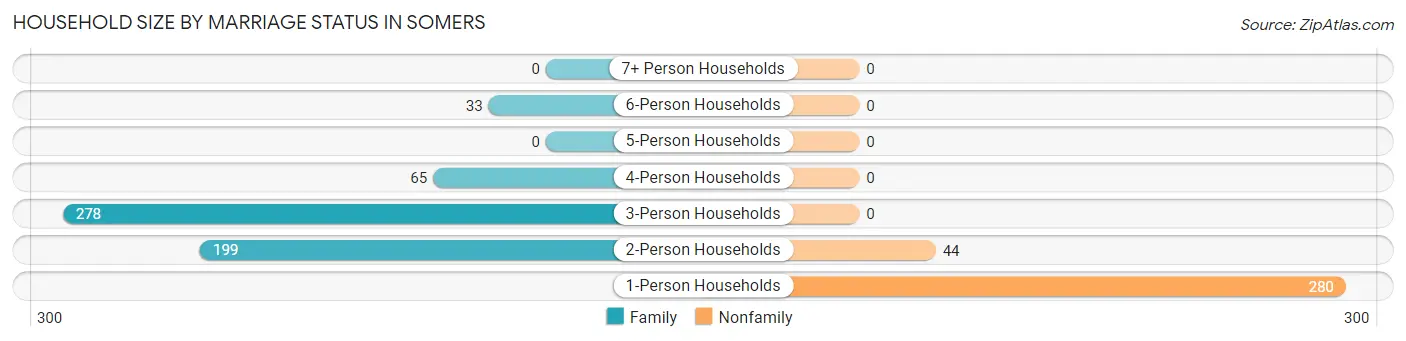
| Household Size | Family Households | Nonfamily Households |
| 1-Person Households | - | 280 (31.1%) |
| 2-Person Households | 199 (22.1%) | 44 (4.9%) |
| 3-Person Households | 278 (30.9%) | 0 (0.0%) |
| 4-Person Households | 65 (7.2%) | 0 (0.0%) |
| 5-Person Households | 0 (0.0%) | 0 (0.0%) |
| 6-Person Households | 33 (3.7%) | 0 (0.0%) |
| 7+ Person Households | 0 (0.0%) | 0 (0.0%) |
| Total | 575 (64.0%) | 324 (36.0%) |
Female Fertility in Somers
Fertility by Age in Somers
Average fertility rate in Somers is 24.0 births per 1,000 women. Women in the age bracket of 20 to 34 years have the highest fertility rate with 75.0 births per 1,000 women. Women in the age bracket of 20 to 34 years acount for 100.0% of all women with births.
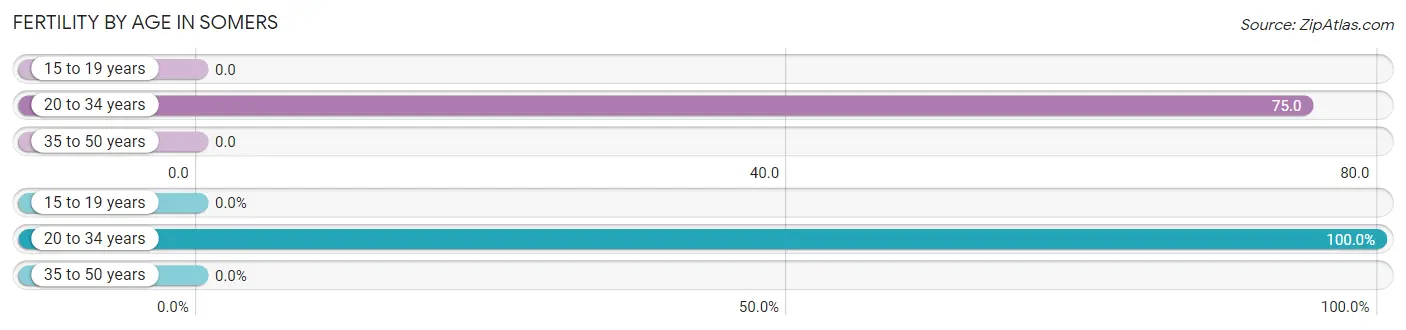
| Age Bracket | Women with Births | Births / 1,000 Women |
| 15 to 19 years | 0 (0.0%) | 0.0 |
| 20 to 34 years | 11 (100.0%) | 75.0 |
| 35 to 50 years | 0 (0.0%) | 0.0 |
| Total | 11 (100.0%) | 24.0 |
Fertility by Age by Marriage Status in Somers
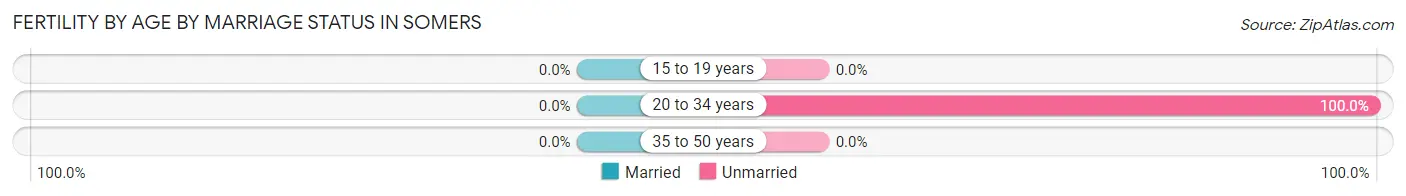
| Age Bracket | Married | Unmarried |
| 15 to 19 years | 0 (0.0%) | 0 (0.0%) |
| 20 to 34 years | 0 (0.0%) | 11 (100.0%) |
| 35 to 50 years | 0 (0.0%) | 0 (0.0%) |
| Total | 0 (0.0%) | 11 (100.0%) |
Fertility by Education in Somers
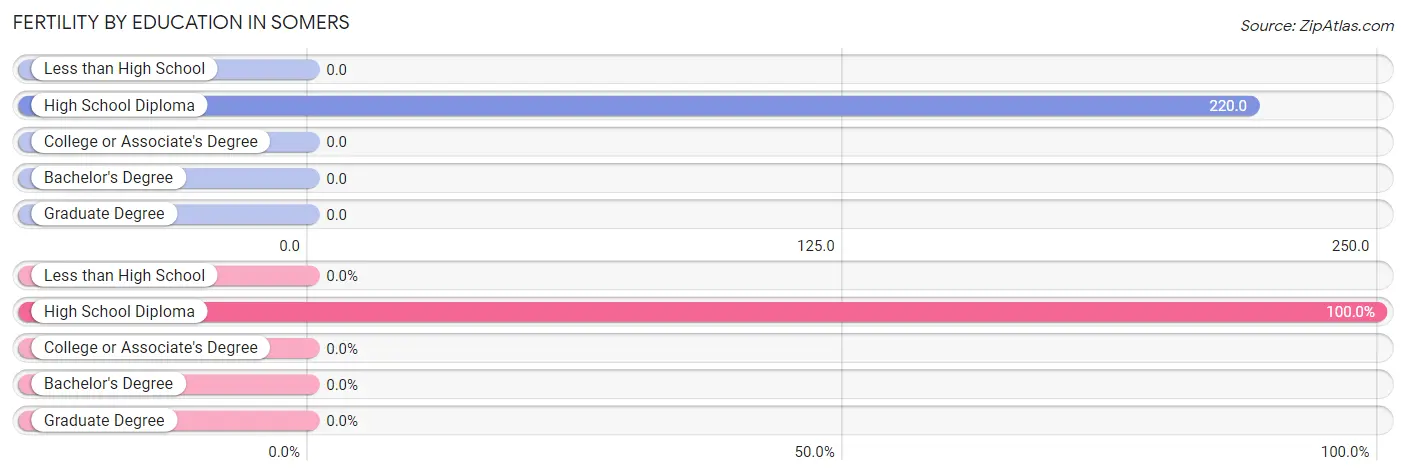
| Educational Attainment | Women with Births | Births / 1,000 Women |
| Less than High School | 0 (0.0%) | 0.0 |
| High School Diploma | 11 (100.0%) | 220.0 |
| College or Associate's Degree | 0 (0.0%) | 0.0 |
| Bachelor's Degree | 0 (0.0%) | 0.0 |
| Graduate Degree | 0 (0.0%) | 0.0 |
| Total | 11 (100.0%) | 24.0 |
Fertility by Education by Marriage Status in Somers
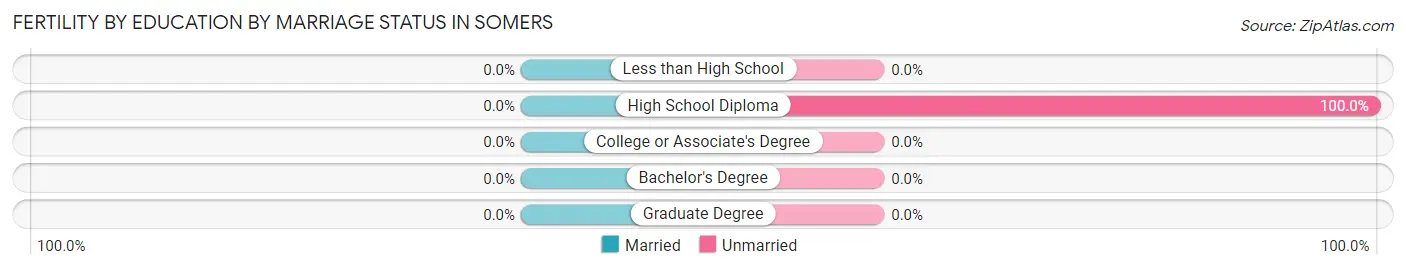
| Educational Attainment | Married | Unmarried |
| Less than High School | 0 (0.0%) | 0 (0.0%) |
| High School Diploma | 0 (0.0%) | 11 (100.0%) |
| College or Associate's Degree | 0 (0.0%) | 0 (0.0%) |
| Bachelor's Degree | 0 (0.0%) | 0 (0.0%) |
| Graduate Degree | 0 (0.0%) | 0 (0.0%) |
| Total | 0 (0.0%) | 11 (100.0%) |
Employment Characteristics in Somers
Employment by Class of Employer in Somers
Among the 1,026 employed individuals in Somers, private company employees (646 | 63.0%), local government employees (183 | 17.8%), and not-for-profit organizations (75 | 7.3%) make up the most common classes of employment.
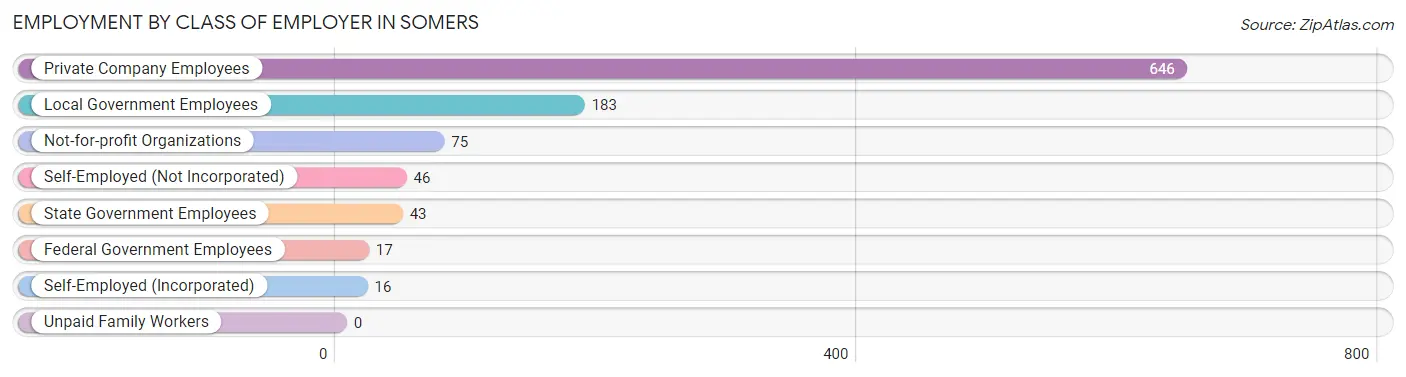
| Employer Class | # Employees | % Employees |
| Private Company Employees | 646 | 63.0% |
| Self-Employed (Incorporated) | 16 | 1.6% |
| Self-Employed (Not Incorporated) | 46 | 4.5% |
| Not-for-profit Organizations | 75 | 7.3% |
| Local Government Employees | 183 | 17.8% |
| State Government Employees | 43 | 4.2% |
| Federal Government Employees | 17 | 1.7% |
| Unpaid Family Workers | 0 | 0.0% |
| Total | 1,026 | 100.0% |
Employment Status by Age in Somers
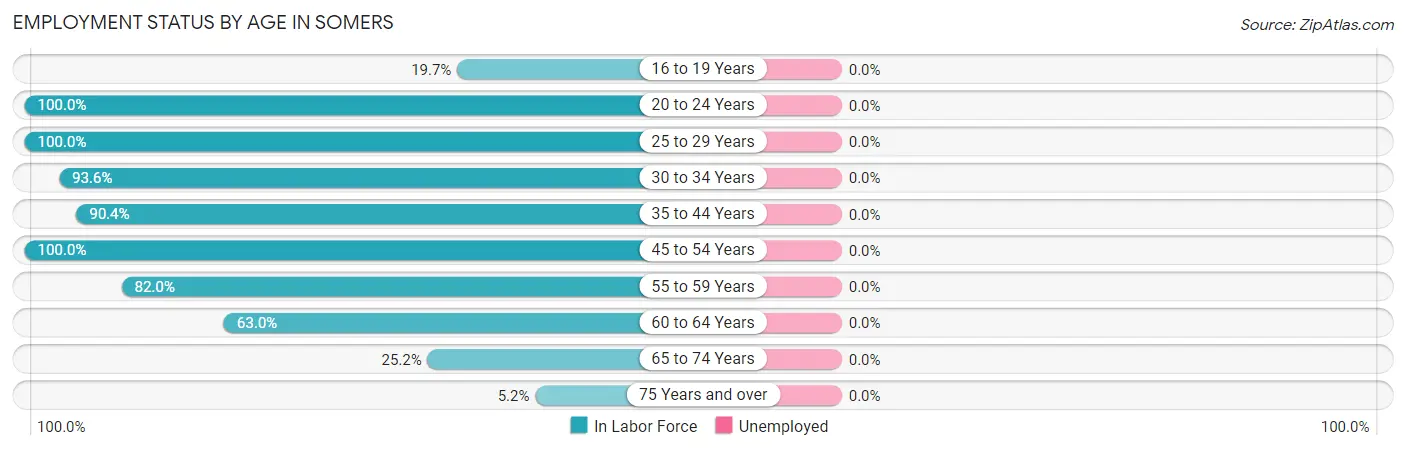
| Age Bracket | In Labor Force | Unemployed |
| 16 to 19 Years | 12 (19.7%) | 0 (0.0%) |
| 20 to 24 Years | 27 (100.0%) | 0 (0.0%) |
| 25 to 29 Years | 63 (100.0%) | 0 (0.0%) |
| 30 to 34 Years | 161 (93.6%) | 0 (0.0%) |
| 35 to 44 Years | 151 (90.4%) | 0 (0.0%) |
| 45 to 54 Years | 337 (100.0%) | 0 (0.0%) |
| 55 to 59 Years | 132 (82.0%) | 0 (0.0%) |
| 60 to 64 Years | 104 (63.0%) | 0 (0.0%) |
| 65 to 74 Years | 36 (25.2%) | 0 (0.0%) |
| 75 Years and over | 12 (5.2%) | 0 (0.0%) |
| Total | 1,034 (67.7%) | 0 (0.0%) |
Employment Status by Educational Attainment in Somers
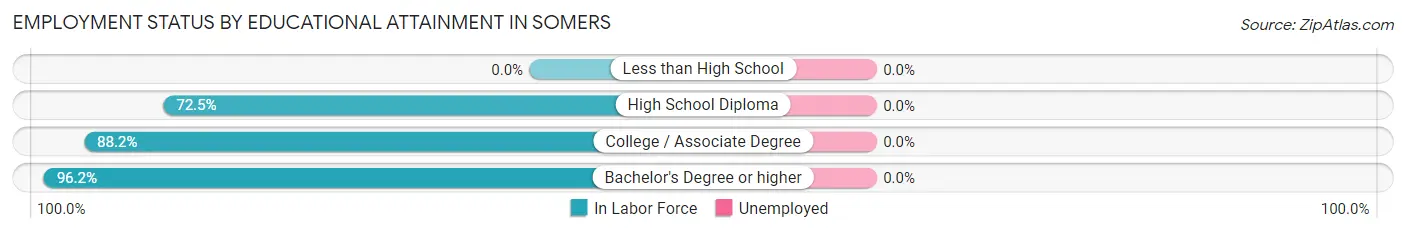
| Educational Attainment | In Labor Force | Unemployed |
| Less than High School | 0 (0.0%) | 0 (0.0%) |
| High School Diploma | 153 (72.5%) | 0 (0.0%) |
| College / Associate Degree | 217 (88.2%) | 0 (0.0%) |
| Bachelor's Degree or higher | 578 (96.2%) | 0 (0.0%) |
| Total | 948 (89.0%) | 0 (0.0%) |
Employment Occupations by Sex in Somers
Management, Business, Science and Arts Occupations
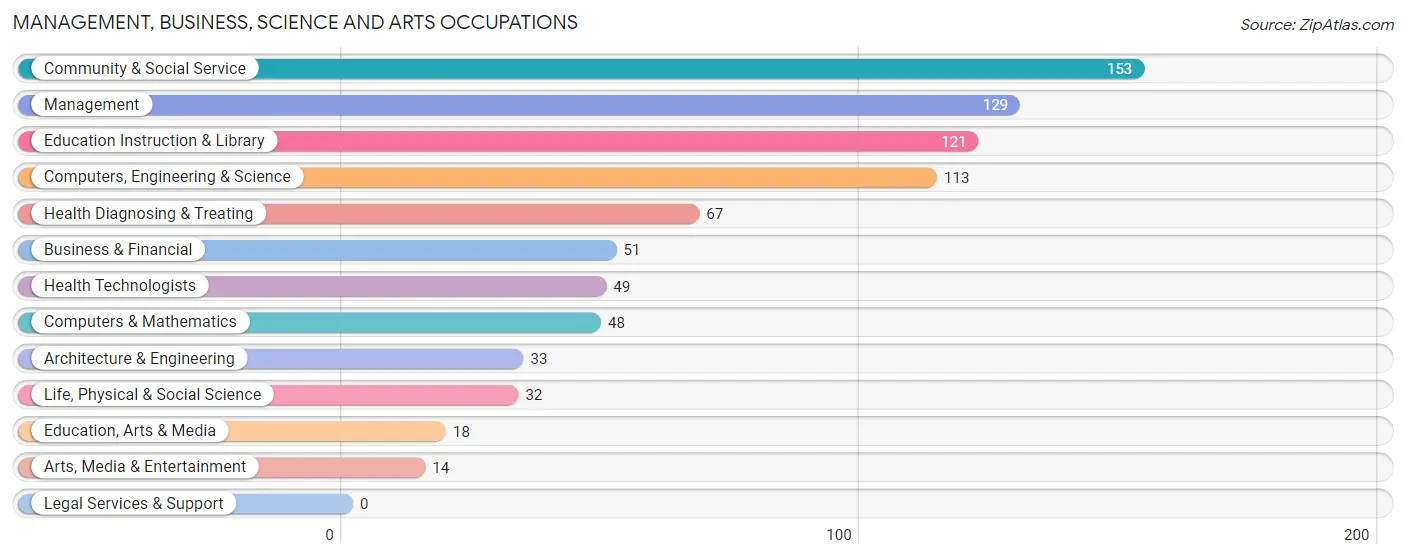
The most common Management, Business, Science and Arts occupations in Somers are Community & Social Service (153 | 14.8%), Management (129 | 12.5%), Education Instruction & Library (121 | 11.7%), Computers, Engineering & Science (113 | 10.9%), and Health Diagnosing & Treating (67 | 6.5%).
Management, Business, Science and Arts Occupations by Sex
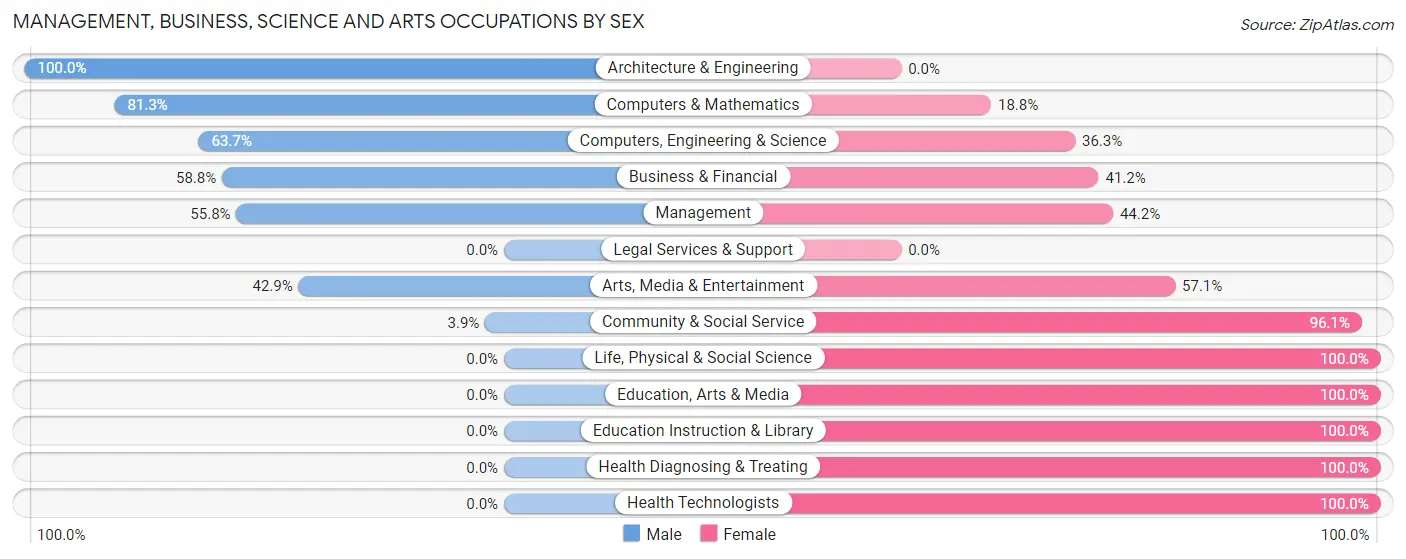
Within the Management, Business, Science and Arts occupations in Somers, the most male-oriented occupations are Architecture & Engineering (100.0%), Computers & Mathematics (81.2%), and Computers, Engineering & Science (63.7%), while the most female-oriented occupations are Life, Physical & Social Science (100.0%), Education, Arts & Media (100.0%), and Education Instruction & Library (100.0%).
| Occupation | Male | Female |
| Management | 72 (55.8%) | 57 (44.2%) |
| Business & Financial | 30 (58.8%) | 21 (41.2%) |
| Computers, Engineering & Science | 72 (63.7%) | 41 (36.3%) |
| Computers & Mathematics | 39 (81.2%) | 9 (18.8%) |
| Architecture & Engineering | 33 (100.0%) | 0 (0.0%) |
| Life, Physical & Social Science | 0 (0.0%) | 32 (100.0%) |
| Community & Social Service | 6 (3.9%) | 147 (96.1%) |
| Education, Arts & Media | 0 (0.0%) | 18 (100.0%) |
| Legal Services & Support | 0 (0.0%) | 0 (0.0%) |
| Education Instruction & Library | 0 (0.0%) | 121 (100.0%) |
| Arts, Media & Entertainment | 6 (42.9%) | 8 (57.1%) |
| Health Diagnosing & Treating | 0 (0.0%) | 67 (100.0%) |
| Health Technologists | 0 (0.0%) | 49 (100.0%) |
| Total (Category) | 180 (35.1%) | 333 (64.9%) |
| Total (Overall) | 445 (43.0%) | 590 (57.0%) |
Services Occupations
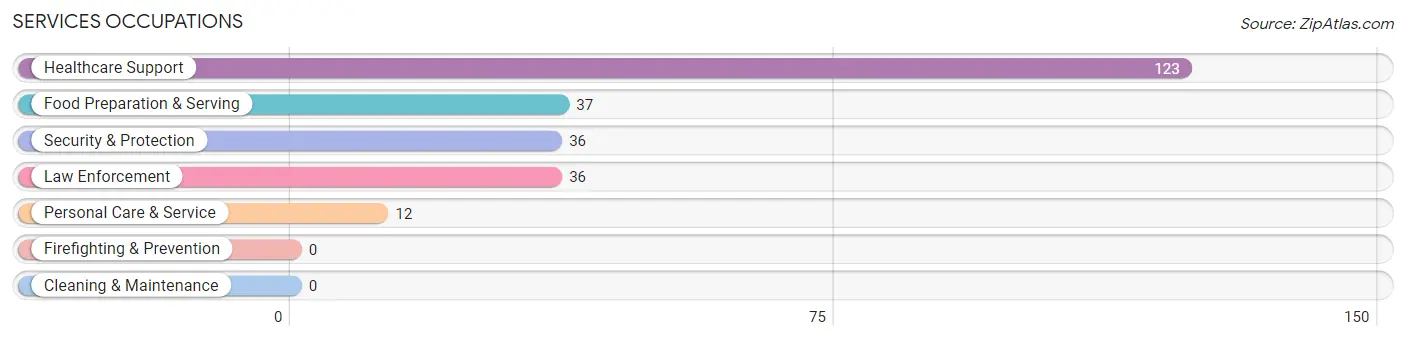
The most common Services occupations in Somers are Healthcare Support (123 | 11.9%), Food Preparation & Serving (37 | 3.6%), Security & Protection (36 | 3.5%), Law Enforcement (36 | 3.5%), and Personal Care & Service (12 | 1.2%).
Services Occupations by Sex
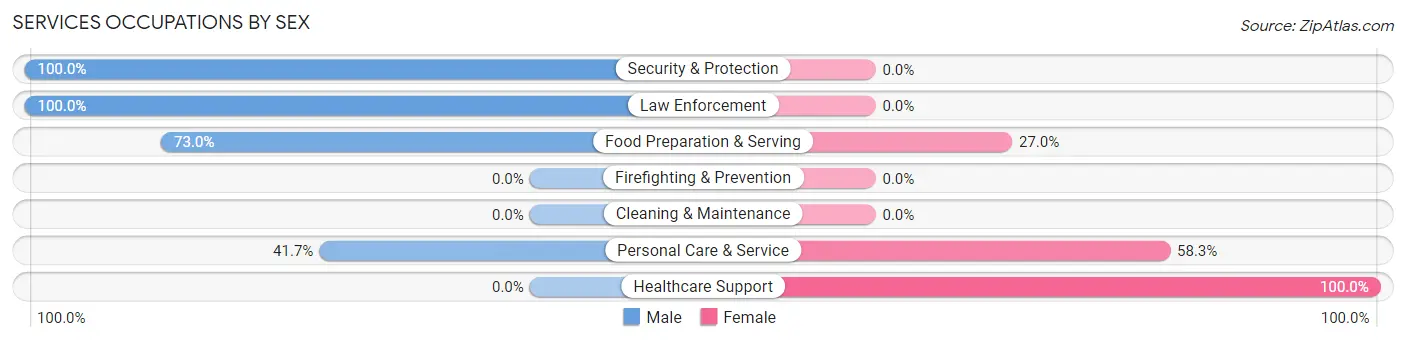
Within the Services occupations in Somers, the most male-oriented occupations are Security & Protection (100.0%), Law Enforcement (100.0%), and Food Preparation & Serving (73.0%), while the most female-oriented occupations are Healthcare Support (100.0%), Personal Care & Service (58.3%), and Food Preparation & Serving (27.0%).
| Occupation | Male | Female |
| Healthcare Support | 0 (0.0%) | 123 (100.0%) |
| Security & Protection | 36 (100.0%) | 0 (0.0%) |
| Firefighting & Prevention | 0 (0.0%) | 0 (0.0%) |
| Law Enforcement | 36 (100.0%) | 0 (0.0%) |
| Food Preparation & Serving | 27 (73.0%) | 10 (27.0%) |
| Cleaning & Maintenance | 0 (0.0%) | 0 (0.0%) |
| Personal Care & Service | 5 (41.7%) | 7 (58.3%) |
| Total (Category) | 68 (32.7%) | 140 (67.3%) |
| Total (Overall) | 445 (43.0%) | 590 (57.0%) |
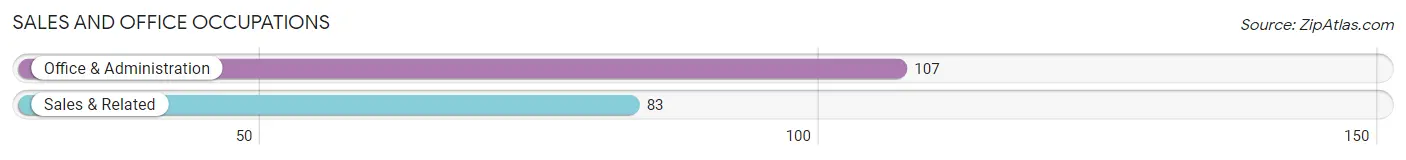
Sales and Office Occupations
The most common Sales and Office occupations in Somers are Office & Administration (107 | 10.3%), and Sales & Related (83 | 8.0%).
Sales and Office Occupations by Sex
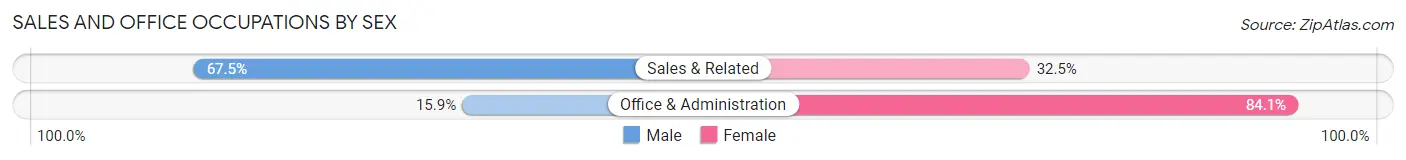
| Occupation | Male | Female |
| Sales & Related | 56 (67.5%) | 27 (32.5%) |
| Office & Administration | 17 (15.9%) | 90 (84.1%) |
| Total (Category) | 73 (38.4%) | 117 (61.6%) |
| Total (Overall) | 445 (43.0%) | 590 (57.0%) |
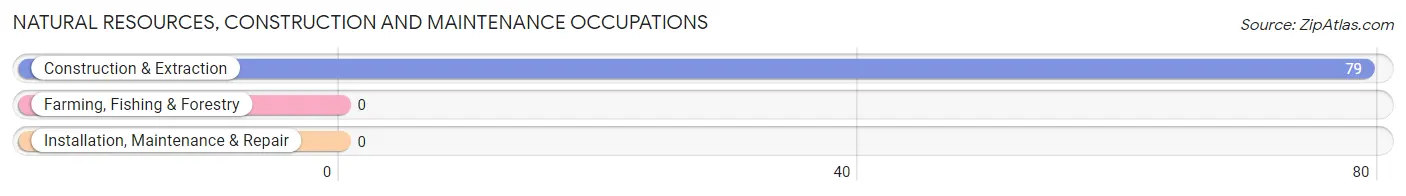
Natural Resources, Construction and Maintenance Occupations
The most common Natural Resources, Construction and Maintenance occupations in Somers are , and Construction & Extraction (79 | 7.6%).
Natural Resources, Construction and Maintenance Occupations by Sex
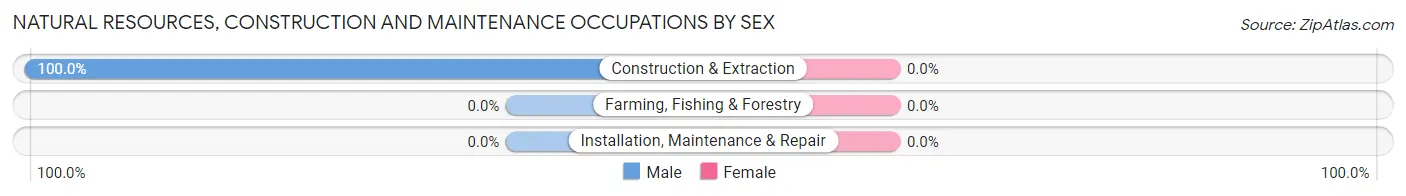
| Occupation | Male | Female |
| Farming, Fishing & Forestry | 0 (0.0%) | 0 (0.0%) |
| Construction & Extraction | 79 (100.0%) | 0 (0.0%) |
| Installation, Maintenance & Repair | 0 (0.0%) | 0 (0.0%) |
| Total (Category) | 79 (100.0%) | 0 (0.0%) |
| Total (Overall) | 445 (43.0%) | 590 (57.0%) |
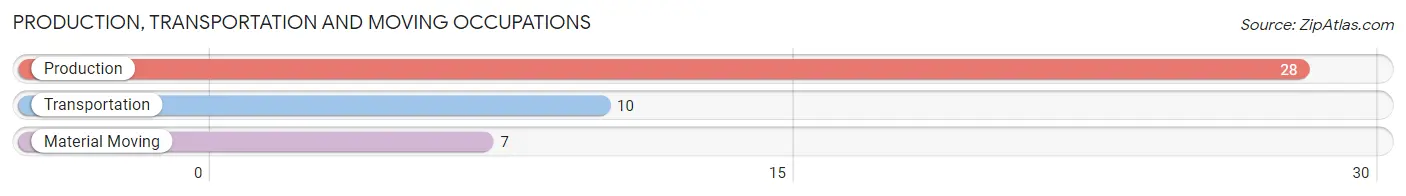
Production, Transportation and Moving Occupations
The most common Production, Transportation and Moving occupations in Somers are Production (28 | 2.7%), Transportation (10 | 1.0%), and Material Moving (7 | 0.7%).
Production, Transportation and Moving Occupations by Sex
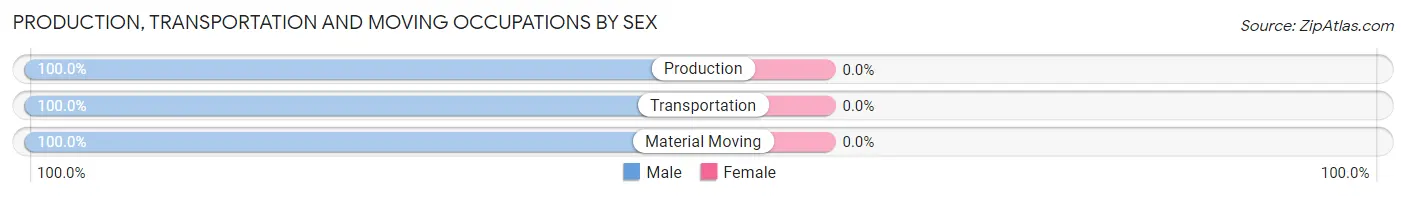
| Occupation | Male | Female |
| Production | 28 (100.0%) | 0 (0.0%) |
| Transportation | 10 (100.0%) | 0 (0.0%) |
| Material Moving | 7 (100.0%) | 0 (0.0%) |
| Total (Category) | 45 (100.0%) | 0 (0.0%) |
| Total (Overall) | 445 (43.0%) | 590 (57.0%) |
Employment Industries by Sex in Somers
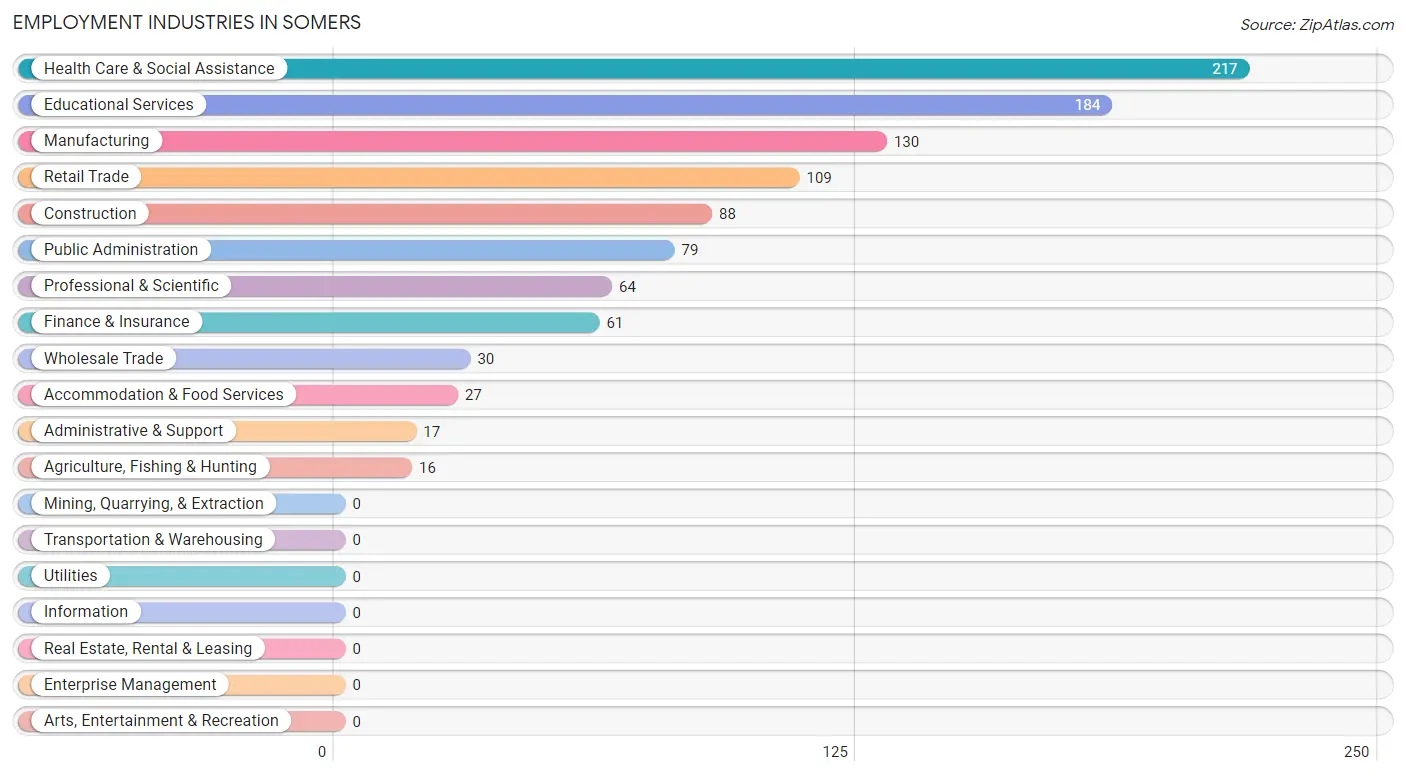
Employment Industries in Somers
The major employment industries in Somers include Health Care & Social Assistance (217 | 21.0%), Educational Services (184 | 17.8%), Manufacturing (130 | 12.6%), Retail Trade (109 | 10.5%), and Construction (88 | 8.5%).
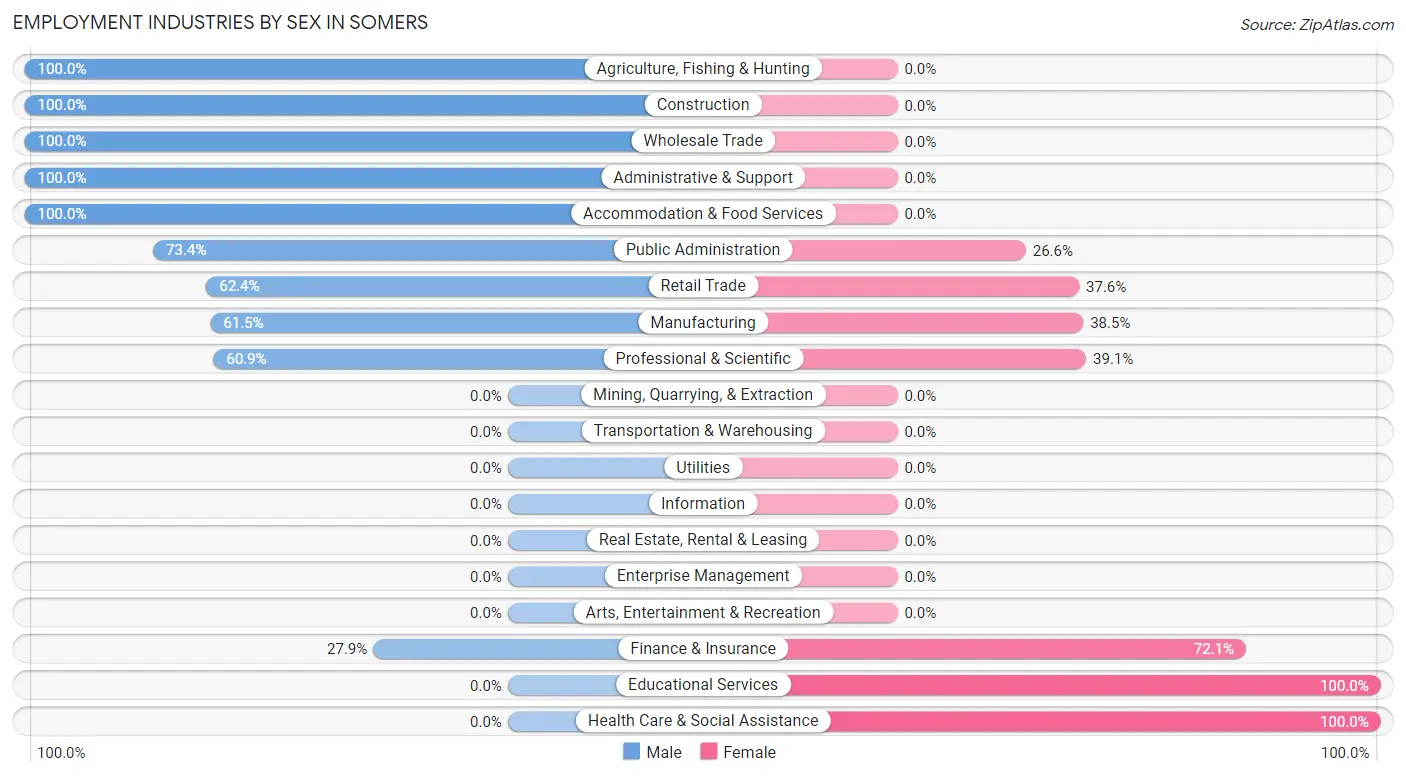
Employment Industries by Sex in Somers
The Somers industries that see more men than women are Agriculture, Fishing & Hunting (100.0%), Construction (100.0%), and Wholesale Trade (100.0%), whereas the industries that tend to have a higher number of women are Educational Services (100.0%), Health Care & Social Assistance (100.0%), and Finance & Insurance (72.1%).
| Industry | Male | Female |
| Agriculture, Fishing & Hunting | 16 (100.0%) | 0 (0.0%) |
| Mining, Quarrying, & Extraction | 0 (0.0%) | 0 (0.0%) |
| Construction | 88 (100.0%) | 0 (0.0%) |
| Manufacturing | 80 (61.5%) | 50 (38.5%) |
| Wholesale Trade | 30 (100.0%) | 0 (0.0%) |
| Retail Trade | 68 (62.4%) | 41 (37.6%) |
| Transportation & Warehousing | 0 (0.0%) | 0 (0.0%) |
| Utilities | 0 (0.0%) | 0 (0.0%) |
| Information | 0 (0.0%) | 0 (0.0%) |
| Finance & Insurance | 17 (27.9%) | 44 (72.1%) |
| Real Estate, Rental & Leasing | 0 (0.0%) | 0 (0.0%) |
| Professional & Scientific | 39 (60.9%) | 25 (39.1%) |
| Enterprise Management | 0 (0.0%) | 0 (0.0%) |
| Administrative & Support | 17 (100.0%) | 0 (0.0%) |
| Educational Services | 0 (0.0%) | 184 (100.0%) |
| Health Care & Social Assistance | 0 (0.0%) | 217 (100.0%) |
| Arts, Entertainment & Recreation | 0 (0.0%) | 0 (0.0%) |
| Accommodation & Food Services | 27 (100.0%) | 0 (0.0%) |
| Public Administration | 58 (73.4%) | 21 (26.6%) |
| Total | 445 (43.0%) | 590 (57.0%) |
Education in Somers
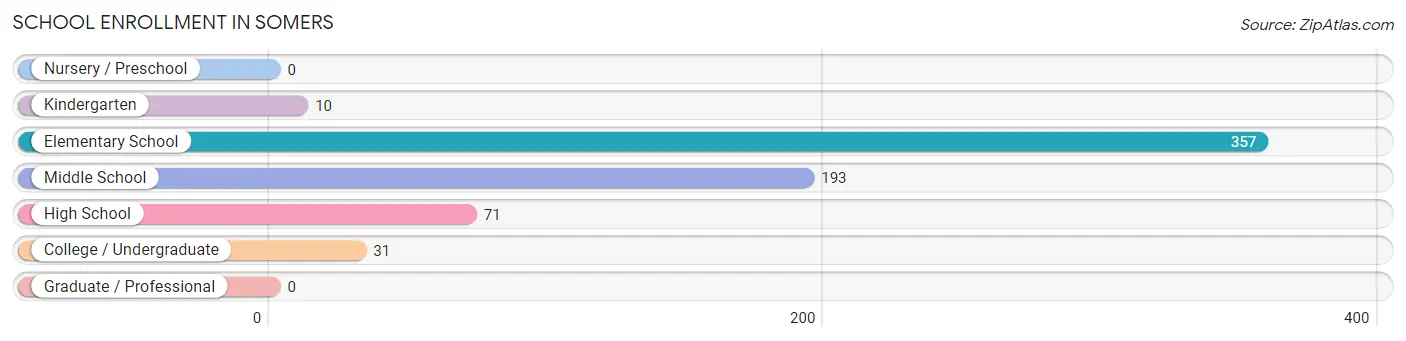
School Enrollment in Somers
The most common levels of schooling among the 662 students in Somers are elementary school (357 | 53.9%), middle school (193 | 29.1%), and high school (71 | 10.7%).
| School Level | # Students | % Students |
| Nursery / Preschool | 0 | 0.0% |
| Kindergarten | 10 | 1.5% |
| Elementary School | 357 | 53.9% |
| Middle School | 193 | 29.1% |
| High School | 71 | 10.7% |
| College / Undergraduate | 31 | 4.7% |
| Graduate / Professional | 0 | 0.0% |
| Total | 662 | 100.0% |
School Enrollment by Age by Funding Source in Somers
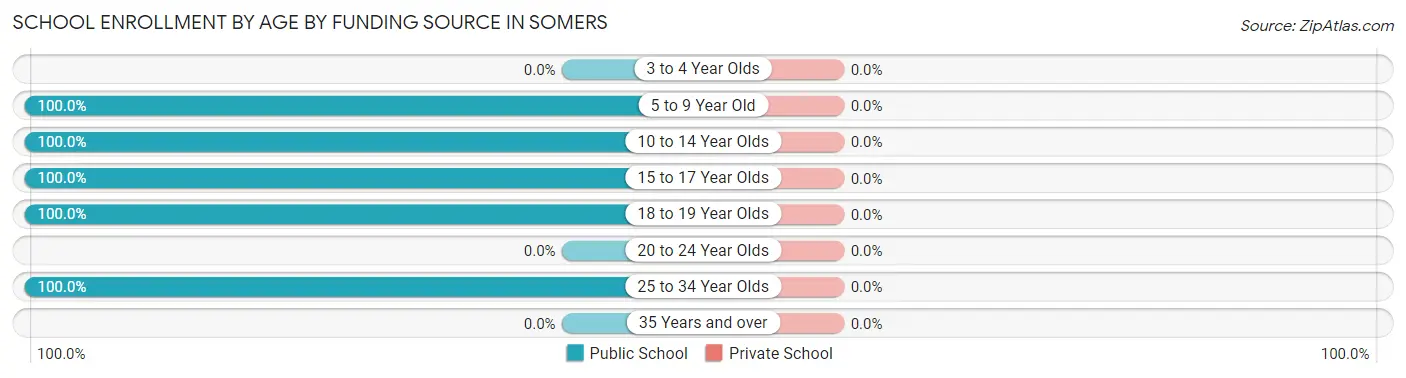
| Age Bracket | Public School | Private School |
| 3 to 4 Year Olds | 0 (0.0%) | 0 (0.0%) |
| 5 to 9 Year Old | 198 (100.0%) | 0 (0.0%) |
| 10 to 14 Year Olds | 380 (100.0%) | 0 (0.0%) |
| 15 to 17 Year Olds | 53 (100.0%) | 0 (0.0%) |
| 18 to 19 Year Olds | 14 (100.0%) | 0 (0.0%) |
| 20 to 24 Year Olds | 0 (0.0%) | 0 (0.0%) |
| 25 to 34 Year Olds | 17 (100.0%) | 0 (0.0%) |
| 35 Years and over | 0 (0.0%) | 0 (0.0%) |
| Total | 662 (100.0%) | 0 (0.0%) |
Educational Attainment by Field of Study in Somers
Business (148 | 20.6%), education (99 | 13.8%), science & technology (97 | 13.5%), physical & health sciences (74 | 10.3%), and social sciences (51 | 7.1%) are the most common fields of study among 719 individuals in Somers who have obtained a bachelor's degree or higher.
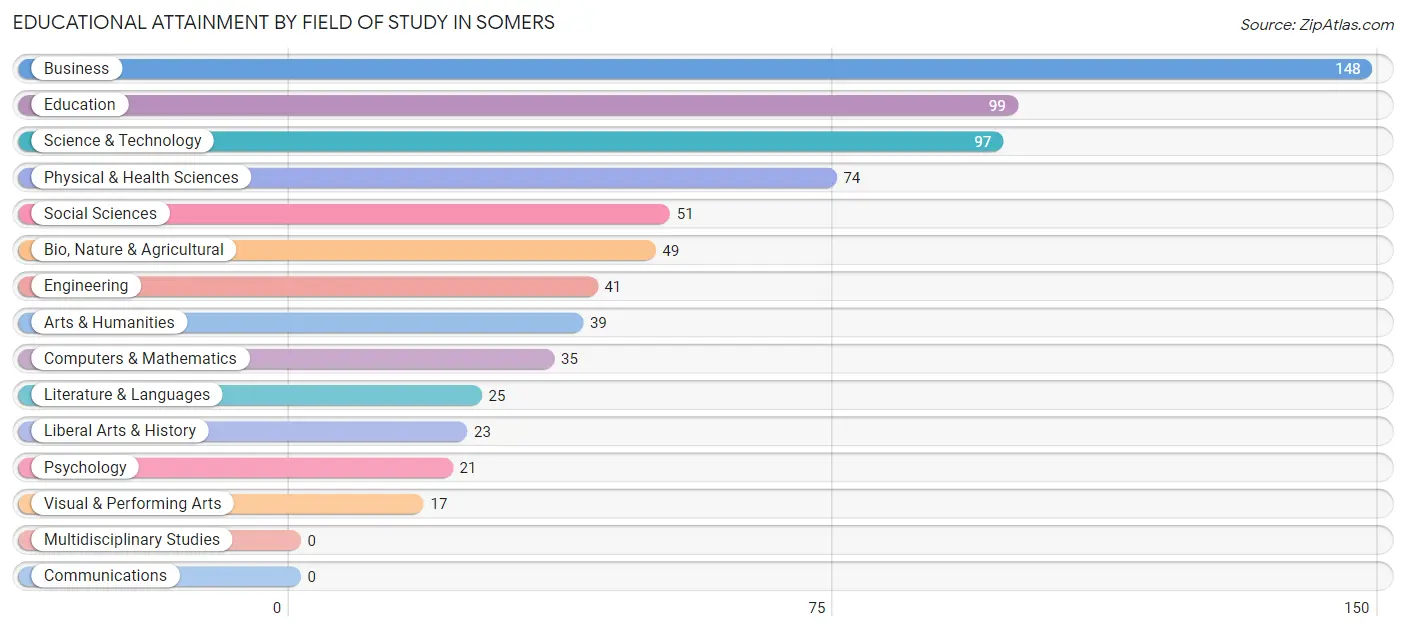
| Field of Study | # Graduates | % Graduates |
| Computers & Mathematics | 35 | 4.9% |
| Bio, Nature & Agricultural | 49 | 6.8% |
| Physical & Health Sciences | 74 | 10.3% |
| Psychology | 21 | 2.9% |
| Social Sciences | 51 | 7.1% |
| Engineering | 41 | 5.7% |
| Multidisciplinary Studies | 0 | 0.0% |
| Science & Technology | 97 | 13.5% |
| Business | 148 | 20.6% |
| Education | 99 | 13.8% |
| Literature & Languages | 25 | 3.5% |
| Liberal Arts & History | 23 | 3.2% |
| Visual & Performing Arts | 17 | 2.4% |
| Communications | 0 | 0.0% |
| Arts & Humanities | 39 | 5.4% |
| Total | 719 | 100.0% |
Transportation & Commute in Somers
Vehicle Availability by Sex in Somers
The most prevalent vehicle ownership categories in Somers are males with 2 vehicles (235, accounting for 53.9%) and females with 2 vehicles (232, making up 39.8%).
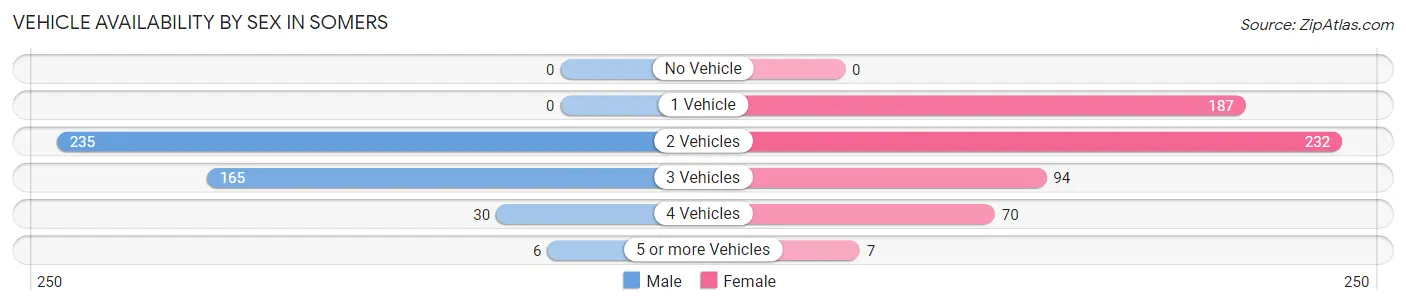
| Vehicles Available | Male | Female |
| No Vehicle | 0 (0.0%) | 0 (0.0%) |
| 1 Vehicle | 0 (0.0%) | 187 (31.7%) |
| 2 Vehicles | 235 (53.9%) | 232 (39.3%) |
| 3 Vehicles | 165 (37.8%) | 94 (15.9%) |
| 4 Vehicles | 30 (6.9%) | 70 (11.9%) |
| 5 or more Vehicles | 6 (1.4%) | 7 (1.2%) |
| Total | 436 (100.0%) | 590 (100.0%) |
Commute Time in Somers
The most frequently occuring commute durations in Somers are 45 to 59 minutes (180 commuters, 20.7%), 30 to 34 minutes (141 commuters, 16.2%), and 20 to 24 minutes (114 commuters, 13.1%).
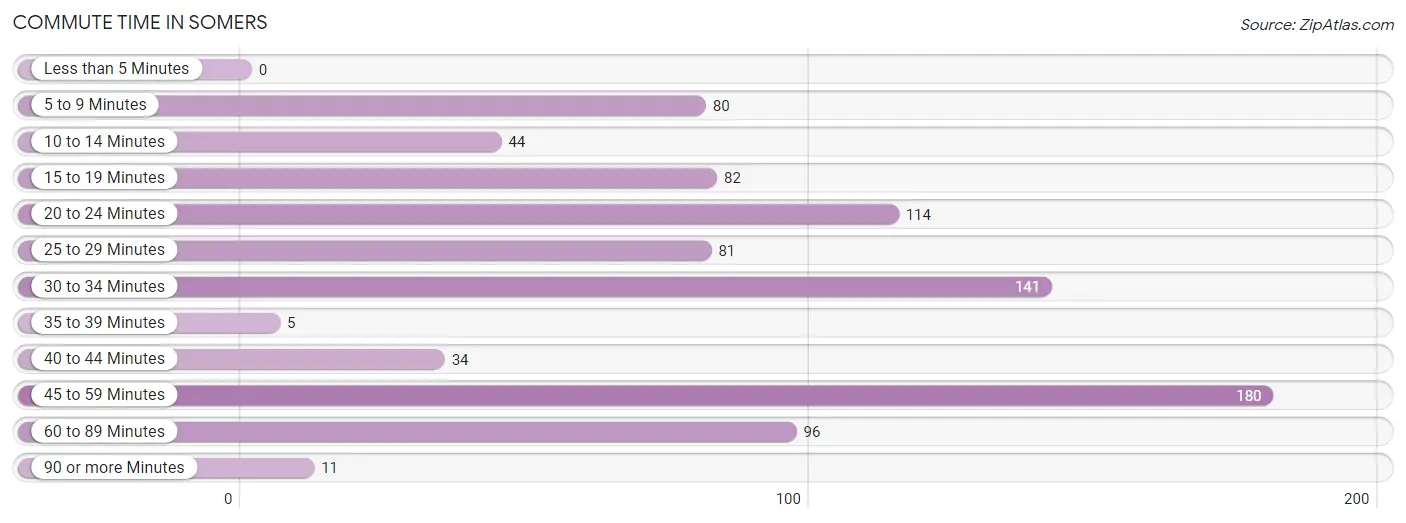
| Commute Time | # Commuters | % Commuters |
| Less than 5 Minutes | 0 | 0.0% |
| 5 to 9 Minutes | 80 | 9.2% |
| 10 to 14 Minutes | 44 | 5.1% |
| 15 to 19 Minutes | 82 | 9.5% |
| 20 to 24 Minutes | 114 | 13.1% |
| 25 to 29 Minutes | 81 | 9.3% |
| 30 to 34 Minutes | 141 | 16.2% |
| 35 to 39 Minutes | 5 | 0.6% |
| 40 to 44 Minutes | 34 | 3.9% |
| 45 to 59 Minutes | 180 | 20.7% |
| 60 to 89 Minutes | 96 | 11.1% |
| 90 or more Minutes | 11 | 1.3% |
Commute Time by Sex in Somers
The most common commute times in Somers are 60 to 89 minutes (60 commuters, 16.4%) for males and 45 to 59 minutes (138 commuters, 27.4%) for females.
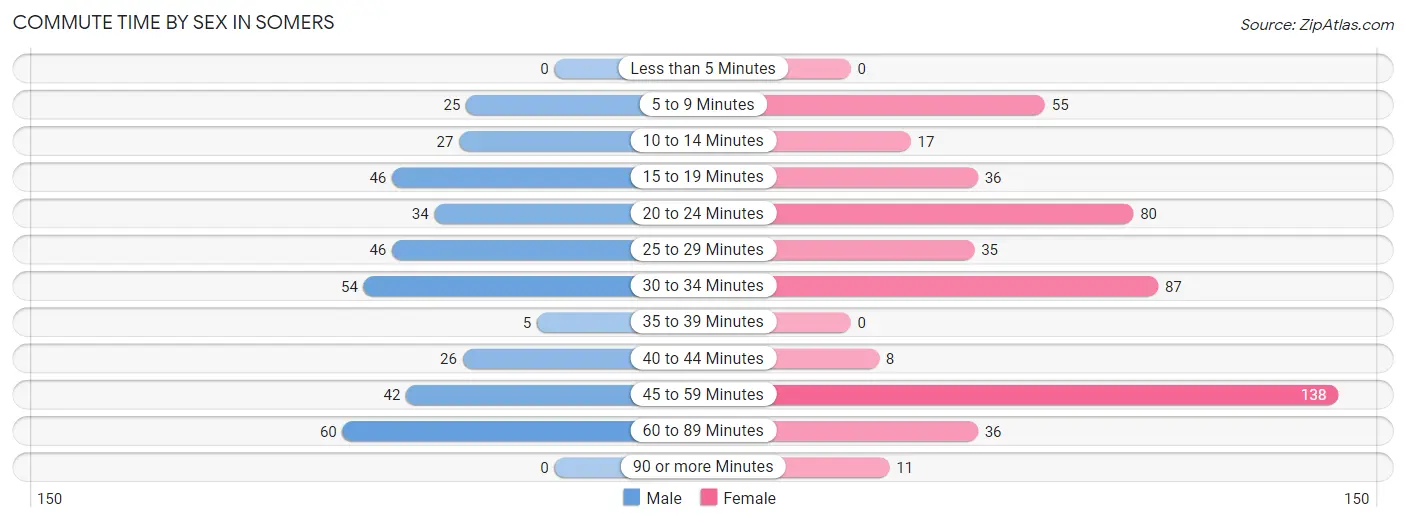
| Commute Time | Male | Female |
| Less than 5 Minutes | 0 (0.0%) | 0 (0.0%) |
| 5 to 9 Minutes | 25 (6.9%) | 55 (10.9%) |
| 10 to 14 Minutes | 27 (7.4%) | 17 (3.4%) |
| 15 to 19 Minutes | 46 (12.6%) | 36 (7.2%) |
| 20 to 24 Minutes | 34 (9.3%) | 80 (15.9%) |
| 25 to 29 Minutes | 46 (12.6%) | 35 (7.0%) |
| 30 to 34 Minutes | 54 (14.8%) | 87 (17.3%) |
| 35 to 39 Minutes | 5 (1.4%) | 0 (0.0%) |
| 40 to 44 Minutes | 26 (7.1%) | 8 (1.6%) |
| 45 to 59 Minutes | 42 (11.5%) | 138 (27.4%) |
| 60 to 89 Minutes | 60 (16.4%) | 36 (7.2%) |
| 90 or more Minutes | 0 (0.0%) | 11 (2.2%) |
Time of Departure to Work by Sex in Somers
The most frequent times of departure to work in Somers are 6:30 AM to 6:59 AM (88, 24.1%) for males and 7:30 AM to 7:59 AM (153, 30.4%) for females.
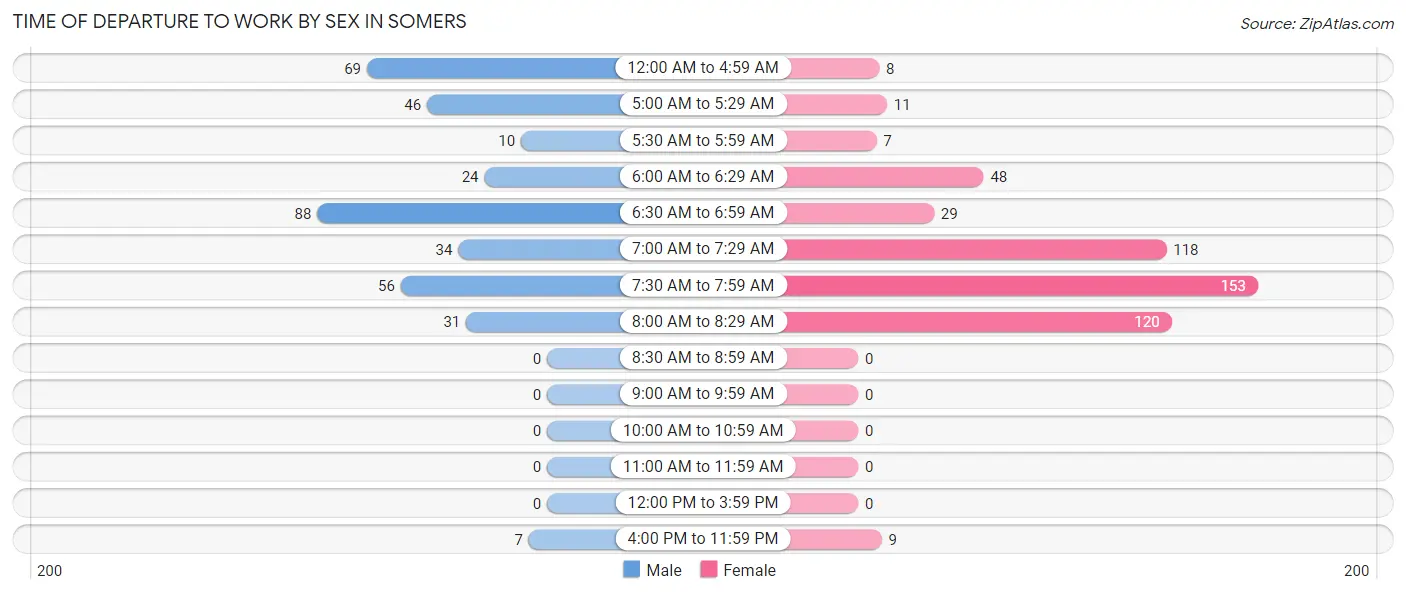
| Time of Departure | Male | Female |
| 12:00 AM to 4:59 AM | 69 (18.9%) | 8 (1.6%) |
| 5:00 AM to 5:29 AM | 46 (12.6%) | 11 (2.2%) |
| 5:30 AM to 5:59 AM | 10 (2.7%) | 7 (1.4%) |
| 6:00 AM to 6:29 AM | 24 (6.6%) | 48 (9.5%) |
| 6:30 AM to 6:59 AM | 88 (24.1%) | 29 (5.8%) |
| 7:00 AM to 7:29 AM | 34 (9.3%) | 118 (23.5%) |
| 7:30 AM to 7:59 AM | 56 (15.3%) | 153 (30.4%) |
| 8:00 AM to 8:29 AM | 31 (8.5%) | 120 (23.9%) |
| 8:30 AM to 8:59 AM | 0 (0.0%) | 0 (0.0%) |
| 9:00 AM to 9:59 AM | 0 (0.0%) | 0 (0.0%) |
| 10:00 AM to 10:59 AM | 0 (0.0%) | 0 (0.0%) |
| 11:00 AM to 11:59 AM | 0 (0.0%) | 0 (0.0%) |
| 12:00 PM to 3:59 PM | 0 (0.0%) | 0 (0.0%) |
| 4:00 PM to 11:59 PM | 7 (1.9%) | 9 (1.8%) |
| Total | 365 (100.0%) | 503 (100.0%) |
Housing Occupancy in Somers
Occupancy by Ownership in Somers
Of the total 899 dwellings in Somers, owner-occupied units account for 782 (87.0%), while renter-occupied units make up 117 (13.0%).
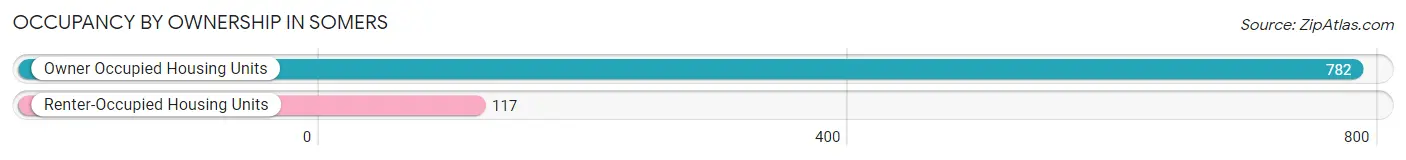
| Occupancy | # Housing Units | % Housing Units |
| Owner Occupied Housing Units | 782 | 87.0% |
| Renter-Occupied Housing Units | 117 | 13.0% |
| Total Occupied Housing Units | 899 | 100.0% |
Occupancy by Household Size in Somers
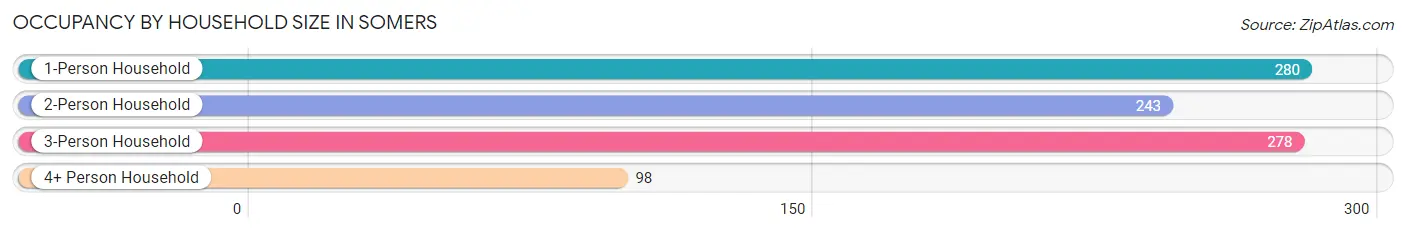
| Household Size | # Housing Units | % Housing Units |
| 1-Person Household | 280 | 31.1% |
| 2-Person Household | 243 | 27.0% |
| 3-Person Household | 278 | 30.9% |
| 4+ Person Household | 98 | 10.9% |
| Total Housing Units | 899 | 100.0% |
Occupancy by Ownership by Household Size in Somers
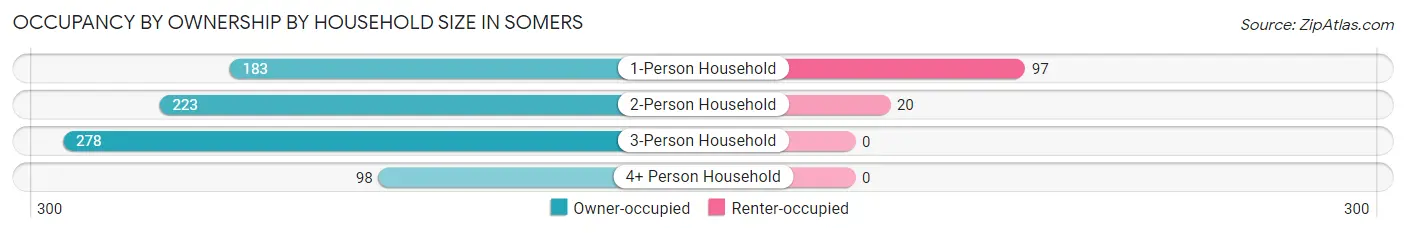
| Household Size | Owner-occupied | Renter-occupied |
| 1-Person Household | 183 (65.4%) | 97 (34.6%) |
| 2-Person Household | 223 (91.8%) | 20 (8.2%) |
| 3-Person Household | 278 (100.0%) | 0 (0.0%) |
| 4+ Person Household | 98 (100.0%) | 0 (0.0%) |
| Total Housing Units | 782 (87.0%) | 117 (13.0%) |
Occupancy by Educational Attainment in Somers
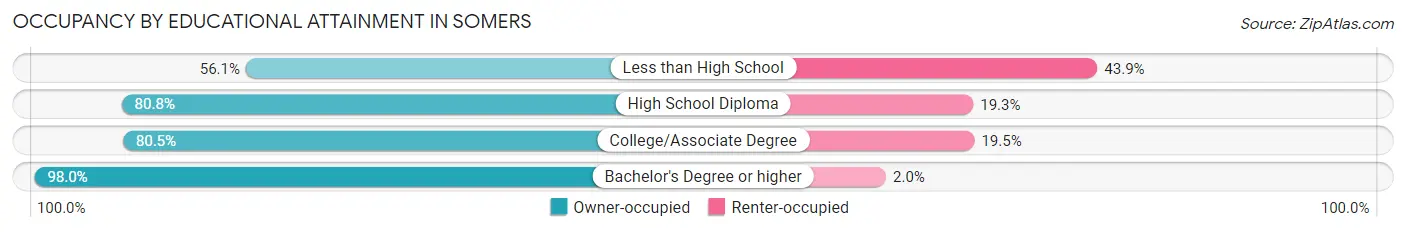
| Household Size | Owner-occupied | Renter-occupied |
| Less than High School | 32 (56.1%) | 25 (43.9%) |
| High School Diploma | 130 (80.7%) | 31 (19.3%) |
| College/Associate Degree | 219 (80.5%) | 53 (19.5%) |
| Bachelor's Degree or higher | 401 (98.0%) | 8 (2.0%) |
Occupancy by Age of Householder in Somers
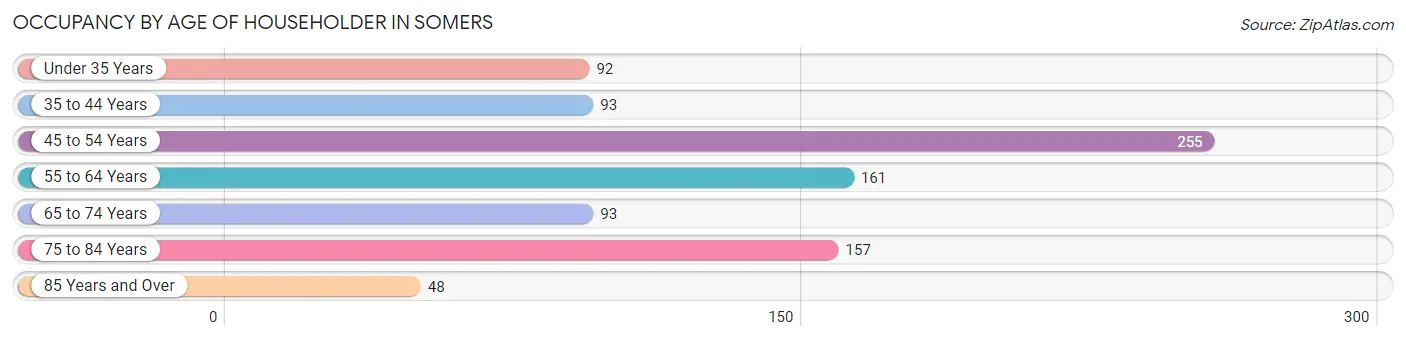
| Age Bracket | # Households | % Households |
| Under 35 Years | 92 | 10.2% |
| 35 to 44 Years | 93 | 10.3% |
| 45 to 54 Years | 255 | 28.4% |
| 55 to 64 Years | 161 | 17.9% |
| 65 to 74 Years | 93 | 10.3% |
| 75 to 84 Years | 157 | 17.5% |
| 85 Years and Over | 48 | 5.3% |
| Total | 899 | 100.0% |
Housing Finances in Somers
Median Income by Occupancy in Somers
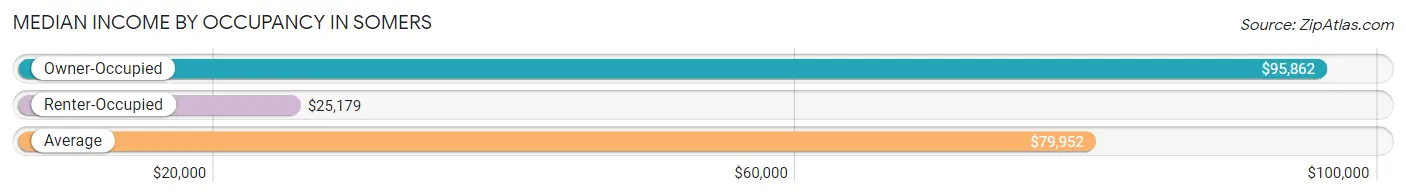
| Occupancy Type | # Households | Median Income |
| Owner-Occupied | 782 (87.0%) | $95,862 |
| Renter-Occupied | 117 (13.0%) | $25,179 |
| Average | 899 (100.0%) | $79,952 |
Occupancy by Householder Income Bracket in Somers
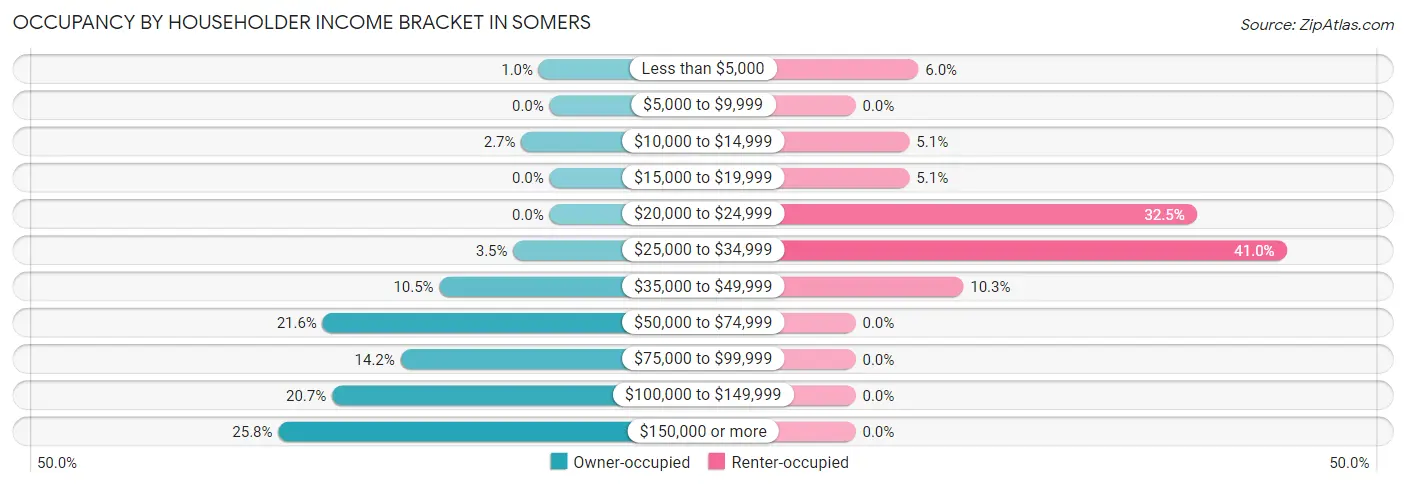
| Income Bracket | Owner-occupied | Renter-occupied |
| Less than $5,000 | 8 (1.0%) | 7 (6.0%) |
| $5,000 to $9,999 | 0 (0.0%) | 0 (0.0%) |
| $10,000 to $14,999 | 21 (2.7%) | 6 (5.1%) |
| $15,000 to $19,999 | 0 (0.0%) | 6 (5.1%) |
| $20,000 to $24,999 | 0 (0.0%) | 38 (32.5%) |
| $25,000 to $34,999 | 27 (3.5%) | 48 (41.0%) |
| $35,000 to $49,999 | 82 (10.5%) | 12 (10.3%) |
| $50,000 to $74,999 | 169 (21.6%) | 0 (0.0%) |
| $75,000 to $99,999 | 111 (14.2%) | 0 (0.0%) |
| $100,000 to $149,999 | 162 (20.7%) | 0 (0.0%) |
| $150,000 or more | 202 (25.8%) | 0 (0.0%) |
| Total | 782 (100.0%) | 117 (100.0%) |
Monthly Housing Cost Tiers in Somers
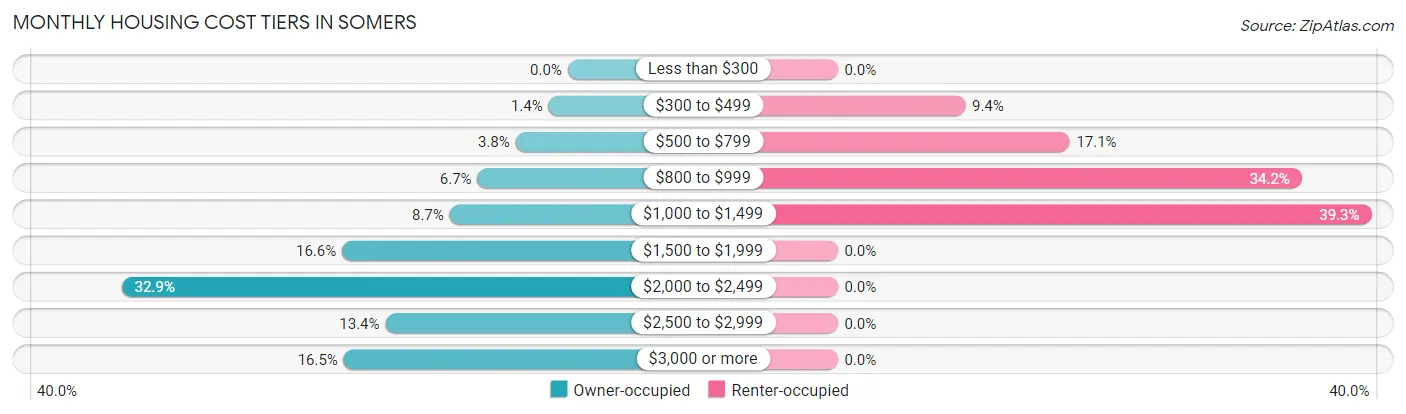
| Monthly Cost | Owner-occupied | Renter-occupied |
| Less than $300 | 0 (0.0%) | 0 (0.0%) |
| $300 to $499 | 11 (1.4%) | 11 (9.4%) |
| $500 to $799 | 30 (3.8%) | 20 (17.1%) |
| $800 to $999 | 52 (6.7%) | 40 (34.2%) |
| $1,000 to $1,499 | 68 (8.7%) | 46 (39.3%) |
| $1,500 to $1,999 | 130 (16.6%) | 0 (0.0%) |
| $2,000 to $2,499 | 257 (32.9%) | 0 (0.0%) |
| $2,500 to $2,999 | 105 (13.4%) | 0 (0.0%) |
| $3,000 or more | 129 (16.5%) | 0 (0.0%) |
| Total | 782 (100.0%) | 117 (100.0%) |
Physical Housing Characteristics in Somers
Housing Structures in Somers
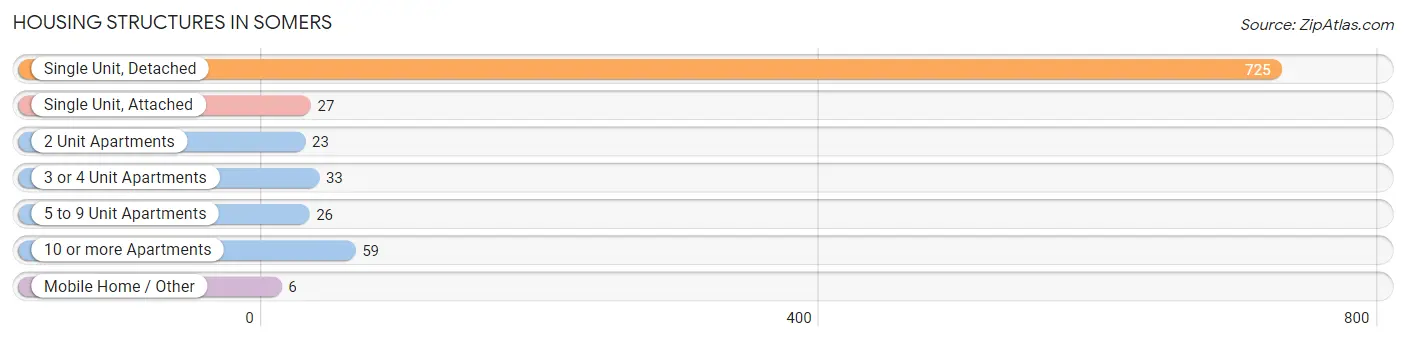
| Structure Type | # Housing Units | % Housing Units |
| Single Unit, Detached | 725 | 80.6% |
| Single Unit, Attached | 27 | 3.0% |
| 2 Unit Apartments | 23 | 2.6% |
| 3 or 4 Unit Apartments | 33 | 3.7% |
| 5 to 9 Unit Apartments | 26 | 2.9% |
| 10 or more Apartments | 59 | 6.6% |
| Mobile Home / Other | 6 | 0.7% |
| Total | 899 | 100.0% |
Housing Structures by Occupancy in Somers
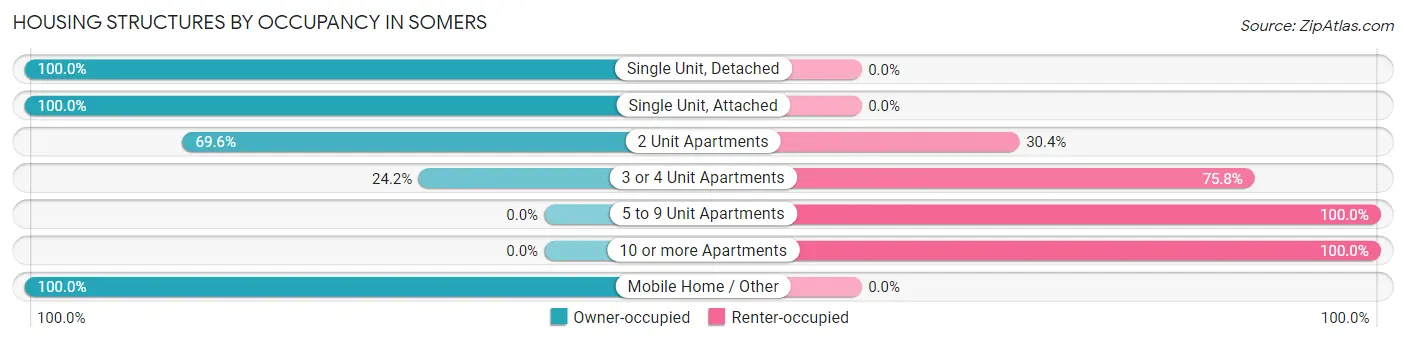
| Structure Type | Owner-occupied | Renter-occupied |
| Single Unit, Detached | 725 (100.0%) | 0 (0.0%) |
| Single Unit, Attached | 27 (100.0%) | 0 (0.0%) |
| 2 Unit Apartments | 16 (69.6%) | 7 (30.4%) |
| 3 or 4 Unit Apartments | 8 (24.2%) | 25 (75.8%) |
| 5 to 9 Unit Apartments | 0 (0.0%) | 26 (100.0%) |
| 10 or more Apartments | 0 (0.0%) | 59 (100.0%) |
| Mobile Home / Other | 6 (100.0%) | 0 (0.0%) |
| Total | 782 (87.0%) | 117 (13.0%) |
Housing Structures by Number of Rooms in Somers
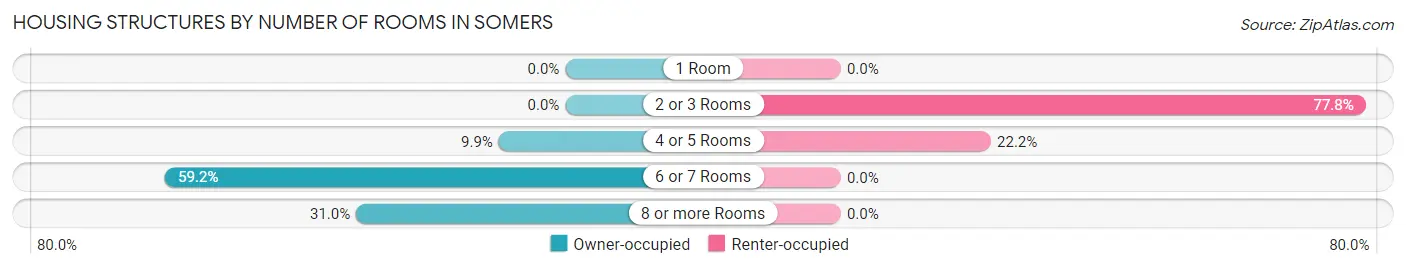
| Number of Rooms | Owner-occupied | Renter-occupied |
| 1 Room | 0 (0.0%) | 0 (0.0%) |
| 2 or 3 Rooms | 0 (0.0%) | 91 (77.8%) |
| 4 or 5 Rooms | 77 (9.9%) | 26 (22.2%) |
| 6 or 7 Rooms | 463 (59.2%) | 0 (0.0%) |
| 8 or more Rooms | 242 (30.9%) | 0 (0.0%) |
| Total | 782 (100.0%) | 117 (100.0%) |
Housing Structure by Heating Type in Somers
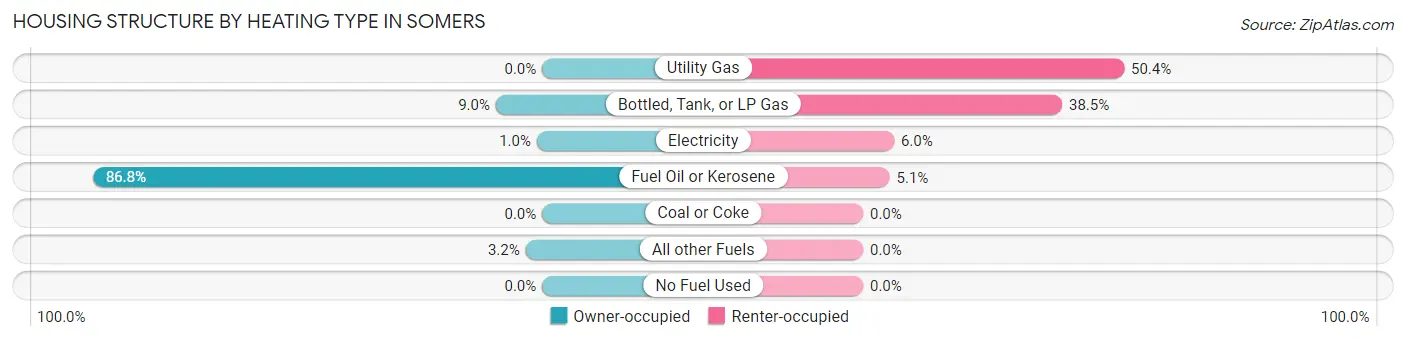
| Heating Type | Owner-occupied | Renter-occupied |
| Utility Gas | 0 (0.0%) | 59 (50.4%) |
| Bottled, Tank, or LP Gas | 70 (8.9%) | 45 (38.5%) |
| Electricity | 8 (1.0%) | 7 (6.0%) |
| Fuel Oil or Kerosene | 679 (86.8%) | 6 (5.1%) |
| Coal or Coke | 0 (0.0%) | 0 (0.0%) |
| All other Fuels | 25 (3.2%) | 0 (0.0%) |
| No Fuel Used | 0 (0.0%) | 0 (0.0%) |
| Total | 782 (100.0%) | 117 (100.0%) |
Household Vehicle Usage in Somers
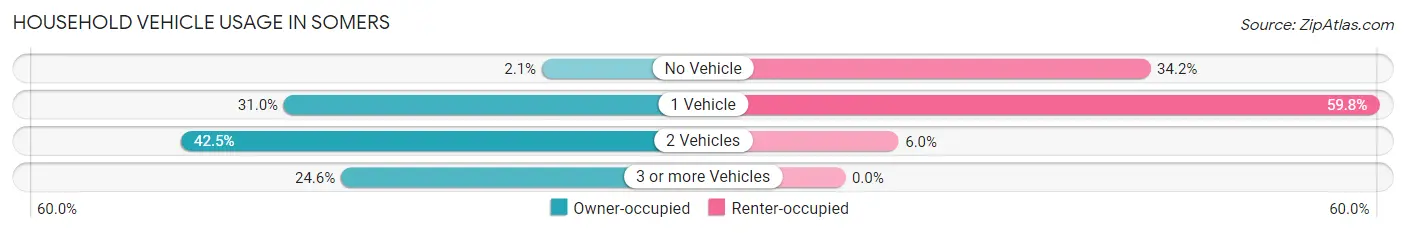
| Vehicles per Household | Owner-occupied | Renter-occupied |
| No Vehicle | 16 (2.1%) | 40 (34.2%) |
| 1 Vehicle | 242 (30.9%) | 70 (59.8%) |
| 2 Vehicles | 332 (42.5%) | 7 (6.0%) |
| 3 or more Vehicles | 192 (24.5%) | 0 (0.0%) |
| Total | 782 (100.0%) | 117 (100.0%) |
Real Estate & Mortgages in Somers
Real Estate and Mortgage Overview in Somers
| Characteristic | Without Mortgage | With Mortgage |
| Housing Units | 131 | 651 |
| Median Property Value | $309,600 | $339,400 |
| Median Household Income | $69,141 | $184 |
| Monthly Housing Costs | $910 | $123 |
| Real Estate Taxes | $4,920 | $0 |
Property Value by Mortgage Status in Somers
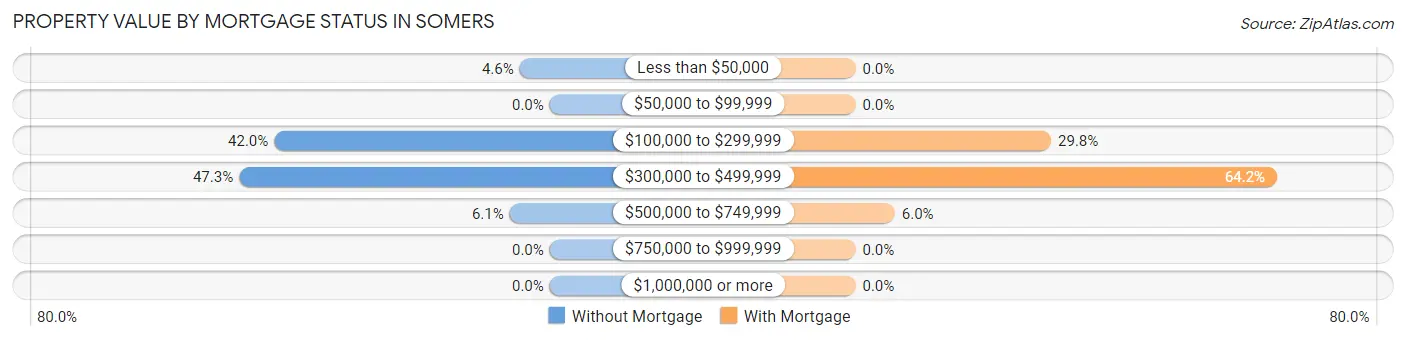
| Property Value | Without Mortgage | With Mortgage |
| Less than $50,000 | 6 (4.6%) | 0 (0.0%) |
| $50,000 to $99,999 | 0 (0.0%) | 0 (0.0%) |
| $100,000 to $299,999 | 55 (42.0%) | 194 (29.8%) |
| $300,000 to $499,999 | 62 (47.3%) | 418 (64.2%) |
| $500,000 to $749,999 | 8 (6.1%) | 39 (6.0%) |
| $750,000 to $999,999 | 0 (0.0%) | 0 (0.0%) |
| $1,000,000 or more | 0 (0.0%) | 0 (0.0%) |
| Total | 131 (100.0%) | 651 (100.0%) |
Household Income by Mortgage Status in Somers
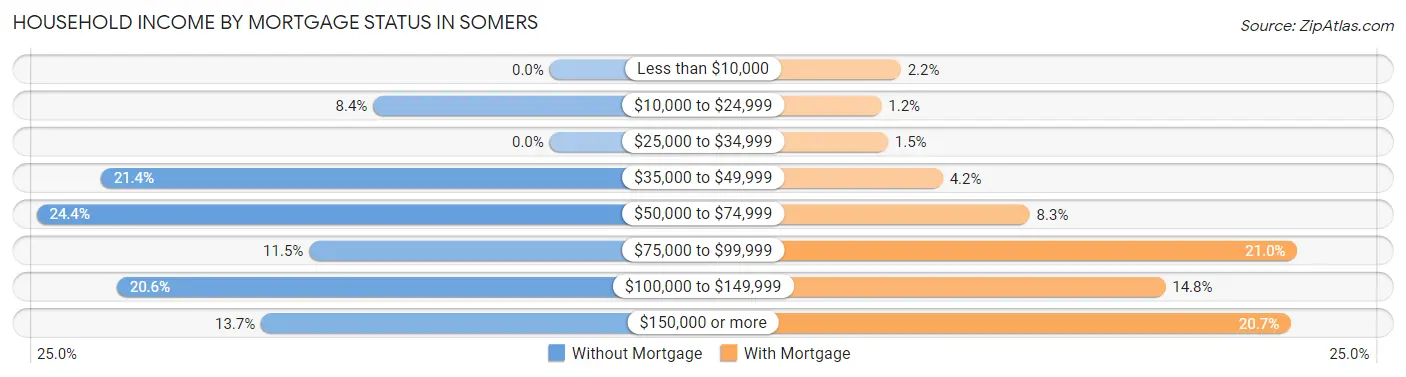
| Household Income | Without Mortgage | With Mortgage |
| Less than $10,000 | 0 (0.0%) | 14 (2.1%) |
| $10,000 to $24,999 | 11 (8.4%) | 8 (1.2%) |
| $25,000 to $34,999 | 0 (0.0%) | 10 (1.5%) |
| $35,000 to $49,999 | 28 (21.4%) | 27 (4.2%) |
| $50,000 to $74,999 | 32 (24.4%) | 54 (8.3%) |
| $75,000 to $99,999 | 15 (11.5%) | 137 (21.0%) |
| $100,000 to $149,999 | 27 (20.6%) | 96 (14.7%) |
| $150,000 or more | 18 (13.7%) | 135 (20.7%) |
| Total | 131 (100.0%) | 651 (100.0%) |
Property Value to Household Income Ratio in Somers
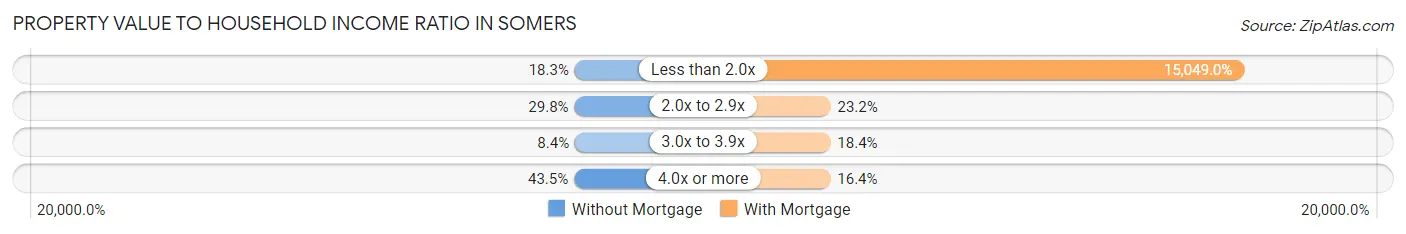
| Value-to-Income Ratio | Without Mortgage | With Mortgage |
| Less than 2.0x | 24 (18.3%) | 97,969 (15,049.0%) |
| 2.0x to 2.9x | 39 (29.8%) | 151 (23.2%) |
| 3.0x to 3.9x | 11 (8.4%) | 120 (18.4%) |
| 4.0x or more | 57 (43.5%) | 107 (16.4%) |
| Total | 131 (100.0%) | 651 (100.0%) |
Real Estate Taxes by Mortgage Status in Somers
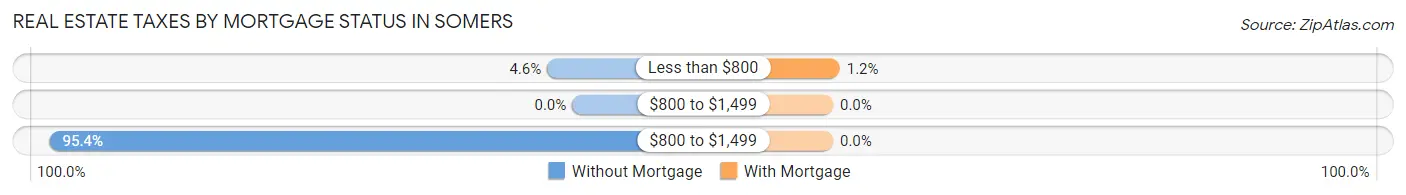
| Property Taxes | Without Mortgage | With Mortgage |
| Less than $800 | 6 (4.6%) | 8 (1.2%) |
| $800 to $1,499 | 0 (0.0%) | 0 (0.0%) |
| $800 to $1,499 | 125 (95.4%) | 0 (0.0%) |
| Total | 131 (100.0%) | 651 (100.0%) |
Health & Disability in Somers
Health Insurance Coverage by Age in Somers
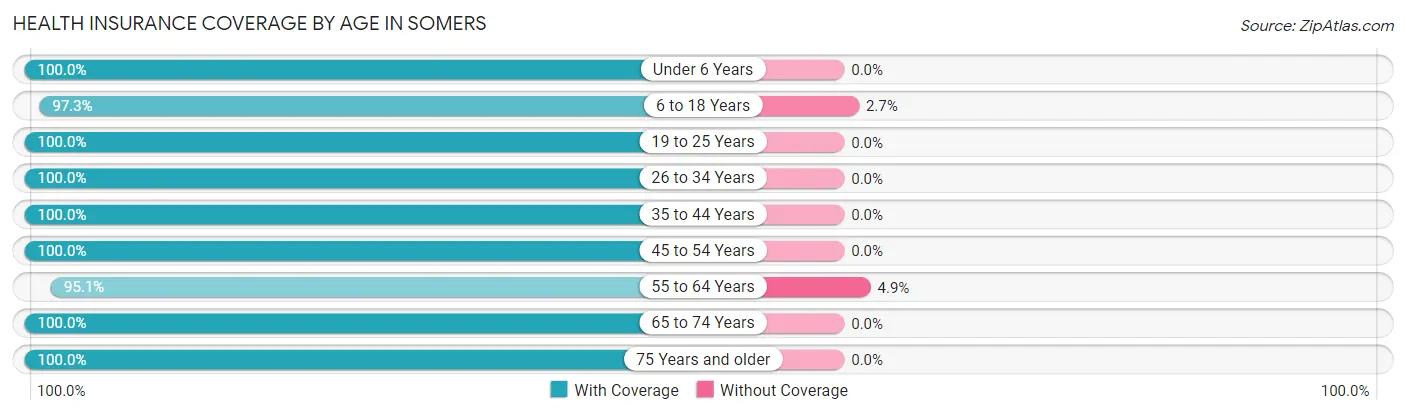
| Age Bracket | With Coverage | Without Coverage |
| Under 6 Years | 129 (100.0%) | 0 (0.0%) |
| 6 to 18 Years | 604 (97.3%) | 17 (2.7%) |
| 19 to 25 Years | 75 (100.0%) | 0 (0.0%) |
| 26 to 34 Years | 201 (100.0%) | 0 (0.0%) |
| 35 to 44 Years | 167 (100.0%) | 0 (0.0%) |
| 45 to 54 Years | 337 (100.0%) | 0 (0.0%) |
| 55 to 64 Years | 310 (95.1%) | 16 (4.9%) |
| 65 to 74 Years | 143 (100.0%) | 0 (0.0%) |
| 75 Years and older | 232 (100.0%) | 0 (0.0%) |
| Total | 2,198 (98.5%) | 33 (1.5%) |
Health Insurance Coverage by Citizenship Status in Somers
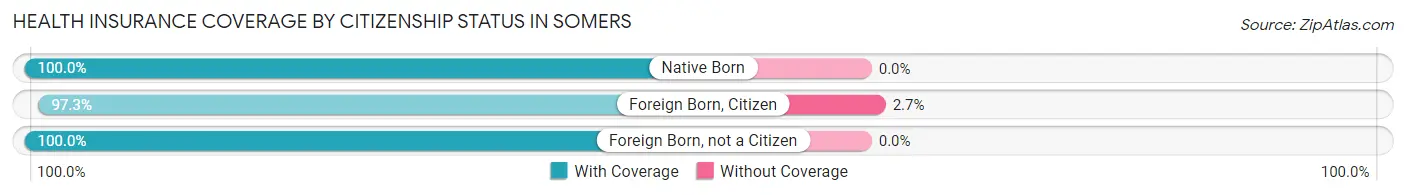
| Citizenship Status | With Coverage | Without Coverage |
| Native Born | 129 (100.0%) | 0 (0.0%) |
| Foreign Born, Citizen | 604 (97.3%) | 17 (2.7%) |
| Foreign Born, not a Citizen | 75 (100.0%) | 0 (0.0%) |
Health Insurance Coverage by Household Income in Somers
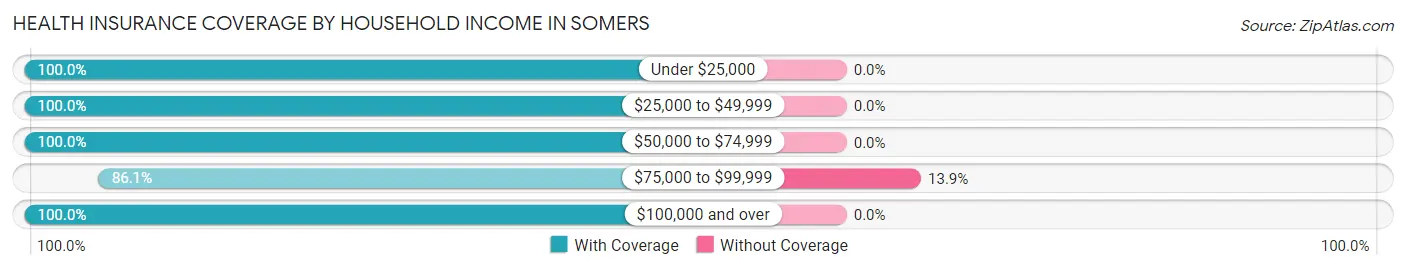
| Household Income | With Coverage | Without Coverage |
| Under $25,000 | 103 (100.0%) | 0 (0.0%) |
| $25,000 to $49,999 | 192 (100.0%) | 0 (0.0%) |
| $50,000 to $74,999 | 559 (100.0%) | 0 (0.0%) |
| $75,000 to $99,999 | 204 (86.1%) | 33 (13.9%) |
| $100,000 and over | 1,140 (100.0%) | 0 (0.0%) |
Public vs Private Health Insurance Coverage by Age in Somers
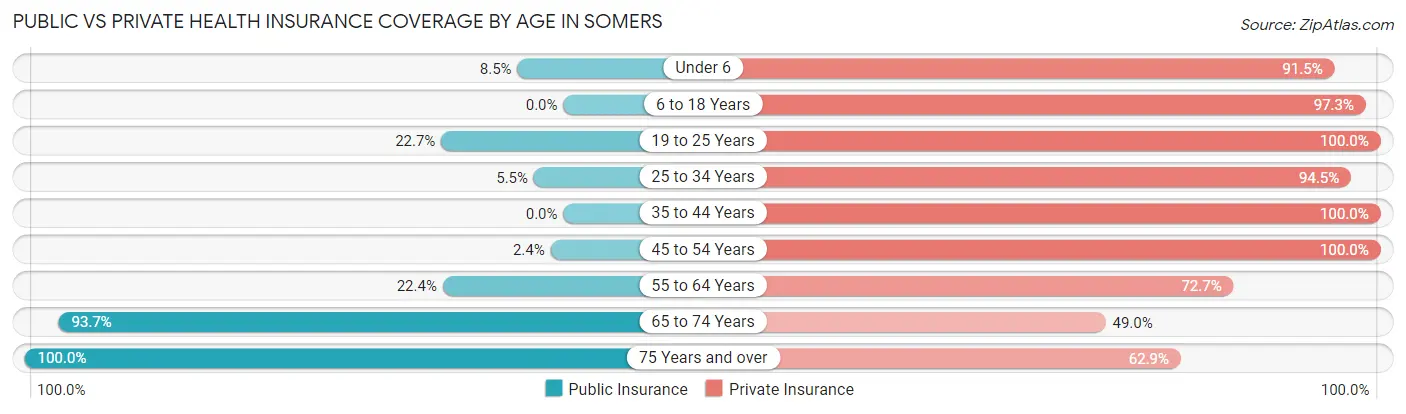
| Age Bracket | Public Insurance | Private Insurance |
| Under 6 | 11 (8.5%) | 118 (91.5%) |
| 6 to 18 Years | 0 (0.0%) | 604 (97.3%) |
| 19 to 25 Years | 17 (22.7%) | 75 (100.0%) |
| 25 to 34 Years | 11 (5.5%) | 190 (94.5%) |
| 35 to 44 Years | 0 (0.0%) | 167 (100.0%) |
| 45 to 54 Years | 8 (2.4%) | 337 (100.0%) |
| 55 to 64 Years | 73 (22.4%) | 237 (72.7%) |
| 65 to 74 Years | 134 (93.7%) | 70 (48.9%) |
| 75 Years and over | 232 (100.0%) | 146 (62.9%) |
| Total | 486 (21.8%) | 1,944 (87.1%) |
Disability Status by Sex by Age in Somers
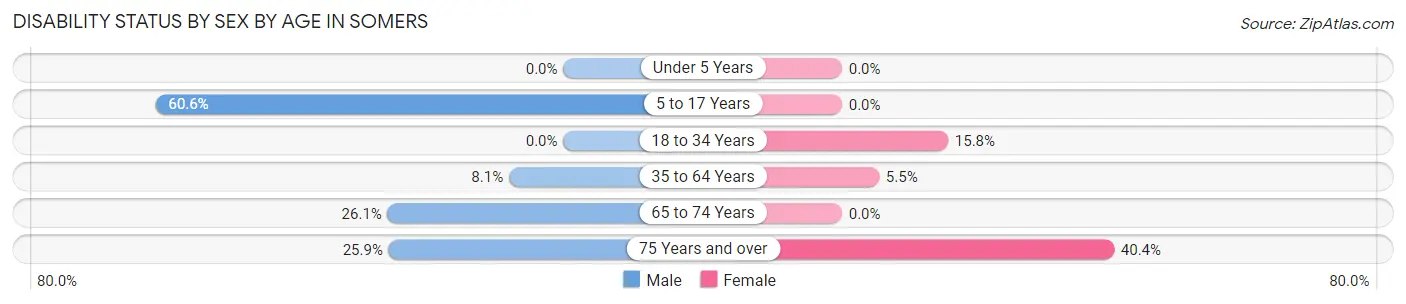
| Age Bracket | Male | Female |
| Under 5 Years | 0 (0.0%) | 0 (0.0%) |
| 5 to 17 Years | 169 (60.6%) | 0 (0.0%) |
| 18 to 34 Years | 0 (0.0%) | 23 (15.8%) |
| 35 to 64 Years | 26 (8.1%) | 28 (5.5%) |
| 65 to 74 Years | 18 (26.1%) | 0 (0.0%) |
| 75 Years and over | 21 (25.9%) | 61 (40.4%) |
Disability Class by Sex by Age in Somers
Disability Class: Hearing Difficulty
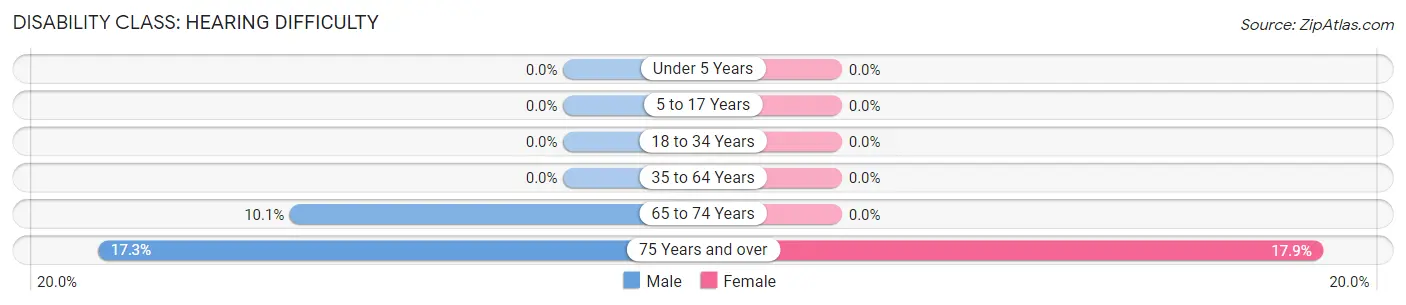
| Age Bracket | Male | Female |
| Under 5 Years | 0 (0.0%) | 0 (0.0%) |
| 5 to 17 Years | 0 (0.0%) | 0 (0.0%) |
| 18 to 34 Years | 0 (0.0%) | 0 (0.0%) |
| 35 to 64 Years | 0 (0.0%) | 0 (0.0%) |
| 65 to 74 Years | 7 (10.1%) | 0 (0.0%) |
| 75 Years and over | 14 (17.3%) | 27 (17.9%) |
Disability Class: Vision Difficulty
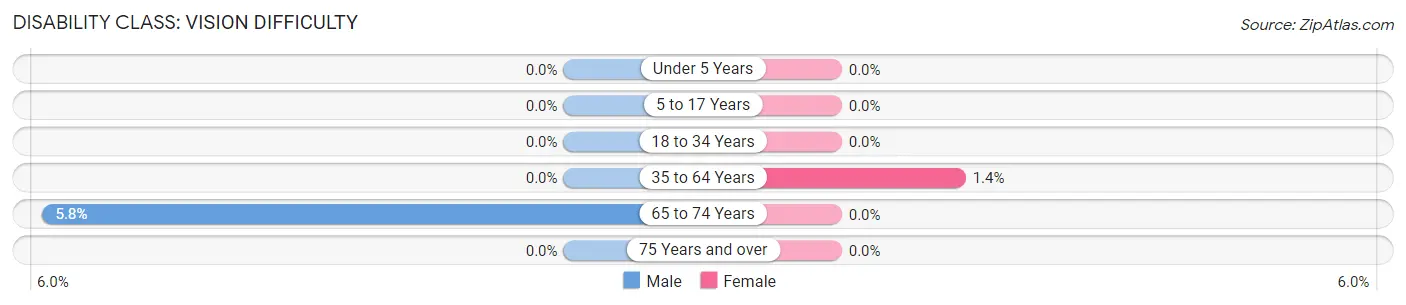
| Age Bracket | Male | Female |
| Under 5 Years | 0 (0.0%) | 0 (0.0%) |
| 5 to 17 Years | 0 (0.0%) | 0 (0.0%) |
| 18 to 34 Years | 0 (0.0%) | 0 (0.0%) |
| 35 to 64 Years | 0 (0.0%) | 7 (1.4%) |
| 65 to 74 Years | 4 (5.8%) | 0 (0.0%) |
| 75 Years and over | 0 (0.0%) | 0 (0.0%) |
Disability Class: Cognitive Difficulty
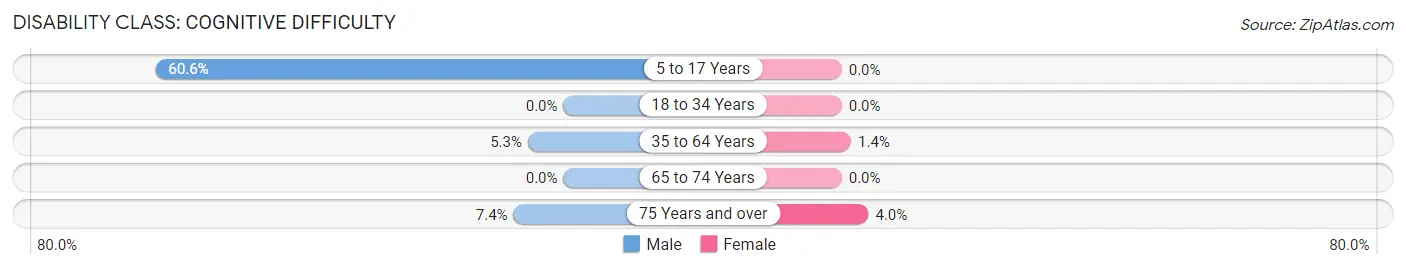
| Age Bracket | Male | Female |
| 5 to 17 Years | 169 (60.6%) | 0 (0.0%) |
| 18 to 34 Years | 0 (0.0%) | 0 (0.0%) |
| 35 to 64 Years | 17 (5.3%) | 7 (1.4%) |
| 65 to 74 Years | 0 (0.0%) | 0 (0.0%) |
| 75 Years and over | 6 (7.4%) | 6 (4.0%) |
Disability Class: Ambulatory Difficulty
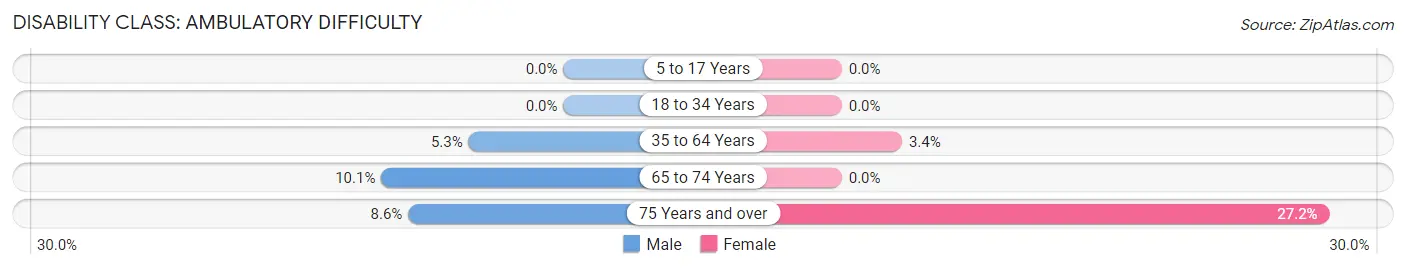
| Age Bracket | Male | Female |
| 5 to 17 Years | 0 (0.0%) | 0 (0.0%) |
| 18 to 34 Years | 0 (0.0%) | 0 (0.0%) |
| 35 to 64 Years | 17 (5.3%) | 17 (3.4%) |
| 65 to 74 Years | 7 (10.1%) | 0 (0.0%) |
| 75 Years and over | 7 (8.6%) | 41 (27.2%) |
Disability Class: Self-Care Difficulty
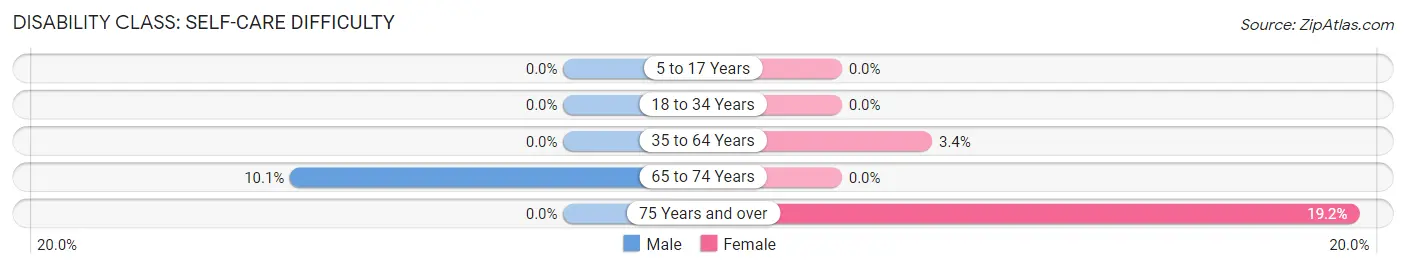
| Age Bracket | Male | Female |
| 5 to 17 Years | 0 (0.0%) | 0 (0.0%) |
| 18 to 34 Years | 0 (0.0%) | 0 (0.0%) |
| 35 to 64 Years | 0 (0.0%) | 17 (3.4%) |
| 65 to 74 Years | 7 (10.1%) | 0 (0.0%) |
| 75 Years and over | 0 (0.0%) | 29 (19.2%) |
Technology Access in Somers
Computing Device Access in Somers
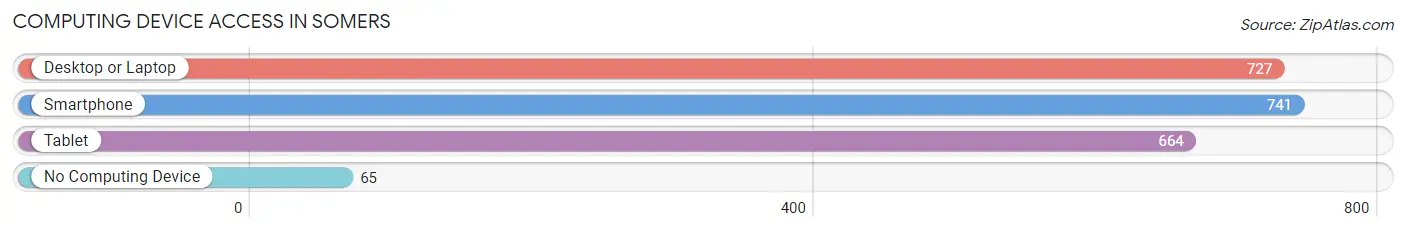
| Device Type | # Households | % Households |
| Desktop or Laptop | 727 | 80.9% |
| Smartphone | 741 | 82.4% |
| Tablet | 664 | 73.9% |
| No Computing Device | 65 | 7.2% |
| Total | 899 | 100.0% |
Internet Access in Somers
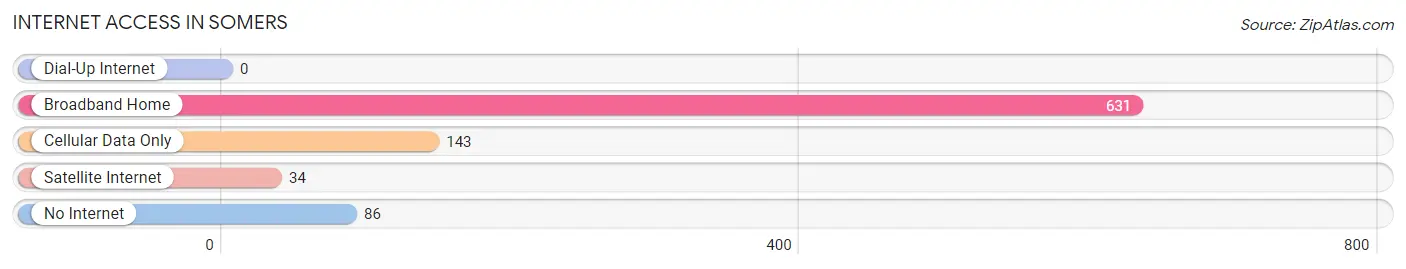
| Internet Type | # Households | % Households |
| Dial-Up Internet | 0 | 0.0% |
| Broadband Home | 631 | 70.2% |
| Cellular Data Only | 143 | 15.9% |
| Satellite Internet | 34 | 3.8% |
| No Internet | 86 | 9.6% |
| Total | 899 | 100.0% |
Somers Summary
Somers, Connecticut is a town located in the northeastern part of the state, in the county of Tolland. It is bordered by the towns of Enfield, East Windsor, Stafford, and Ellington. The town has a population of 11,444 people, according to the 2010 census.
History
Somers was first settled in 1717, and was incorporated in May of 1734. The town was named after John Somers, who was the first settler in the area. The town was originally part of the town of Enfield, but was separated in 1749.
The town was primarily an agricultural community, with the main crops being corn, wheat, and hay. The town also had a number of mills, including a grist mill, a saw mill, and a fulling mill.
In the 19th century, the town began to industrialize, with the opening of a number of factories. These included a paper mill, a cotton mill, and a woolen mill. The town also had a number of quarries, which provided stone for the construction of buildings in the area.
Geography
Somers is located in the northeastern part of Connecticut, in the county of Tolland. It is bordered by the towns of Enfield, East Windsor, Stafford, and Ellington. The town has a total area of 28.3 square miles, of which 28.2 square miles is land and 0.1 square miles is water.
The town is located in the Connecticut River Valley, and is part of the Hartford metropolitan area. The town is located in the foothills of the Berkshires, and is home to a number of parks and recreational areas.
Economy
The economy of Somers is primarily based on manufacturing and services. The town is home to a number of factories, including a paper mill, a cotton mill, and a woolen mill. The town also has a number of retail stores, restaurants, and other businesses.
The town is also home to a number of educational institutions, including the University of Connecticut, Eastern Connecticut State University, and the University of Hartford.
Demographics
According to the 2010 census, the population of Somers was 11,444 people. The racial makeup of the town was 94.3% White, 1.7% African American, 0.3% Native American, 1.2% Asian, 0.1% Pacific Islander, 1.2% from other races, and 1.3% from two or more races. Hispanic or Latino of any race were 3.2% of the population.
The median household income in the town was $71,917, and the median family income was $83,917. The per capita income in the town was $30,917. About 4.3% of the population was below the poverty line.
Common Questions
What is Per Capita Income in Somers?
Per Capita income in Somers is $41,583.
What is the Median Family Income in Somers?
Median Family Income in Somers is $107,679.
What is the Median Household income in Somers?
Median Household Income in Somers is $79,952.
What is Income or Wage Gap in Somers?
Income or Wage Gap in Somers is 24.0%.
Women in Somers earn 76.0 cents for every dollar earned by a man.
What is Inequality or Gini Index in Somers?
Inequality or Gini Index in Somers is 0.40.
What is the Total Population of Somers?
Total Population of Somers is 2,231.
What is the Total Male Population of Somers?
Total Male Population of Somers is 973.
What is the Total Female Population of Somers?
Total Female Population of Somers is 1,258.
What is the Ratio of Males per 100 Females in Somers?
There are 77.34 Males per 100 Females in Somers.
What is the Ratio of Females per 100 Males in Somers?
There are 129.29 Females per 100 Males in Somers.
What is the Median Population Age in Somers?
Median Population Age in Somers is 38.3 Years.
What is the Average Family Size in Somers
Average Family Size in Somers is 3.2 People.
What is the Average Household Size in Somers
Average Household Size in Somers is 2.5 People.
How Large is the Labor Force in Somers?
There are 1,034 People in the Labor Forcein in Somers.
What is the Percentage of People in the Labor Force in Somers?
67.7% of People are in the Labor Force in Somers.