Whitesboro, NY Map & Demographics
Whitesboro Map
Whitesboro Overview
$34,432
PER CAPITA INCOME
$79,157
AVG FAMILY INCOME
$65,234
AVG HOUSEHOLD INCOME
37.8%
WAGE / INCOME GAP [ % ]
62.2¢/ $1
WAGE / INCOME GAP [ $ ]
0.38
INEQUALITY / GINI INDEX
3,673
TOTAL POPULATION
1,560
MALE POPULATION
2,113
FEMALE POPULATION
73.83
MALES / 100 FEMALES
135.45
FEMALES / 100 MALES
35.8
MEDIAN AGE
2.8
AVG FAMILY SIZE
2.2
AVG HOUSEHOLD SIZE
1,961
LABOR FORCE [ PEOPLE ]
62.7%
PERCENT IN LABOR FORCE
9.2%
UNEMPLOYMENT RATE
Whitesboro Zip Codes
Whitesboro Area Codes
Income in Whitesboro
Income Overview in Whitesboro
Per Capita Income in Whitesboro is $34,432, while median incomes of families and households are $79,157 and $65,234 respectively.
| Characteristic | Number | Measure |
| Per Capita Income | 3,673 | $34,432 |
| Median Family Income | 981 | $79,157 |
| Mean Family Income | 981 | $87,398 |
| Median Household Income | 1,643 | $65,234 |
| Mean Household Income | 1,643 | $76,450 |
| Income Deficit | 981 | $0 |
| Wage / Income Gap (%) | 3,673 | 37.79% |
| Wage / Income Gap ($) | 3,673 | 62.21¢ per $1 |
| Gini / Inequality Index | 3,673 | 0.38 |
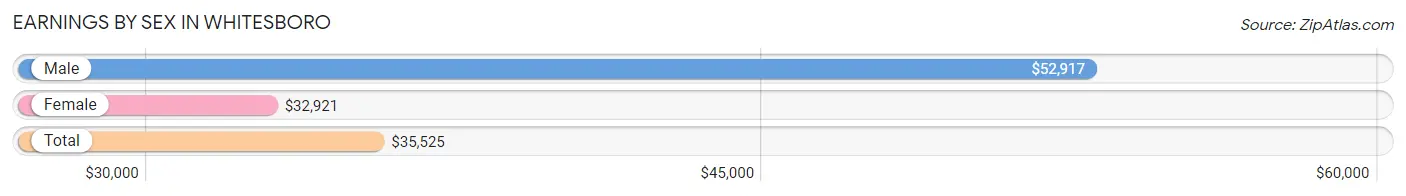
Earnings by Sex in Whitesboro
Average Earnings in Whitesboro are $35,525, $52,917 for men and $32,921 for women, a difference of 37.8%.
| Sex | Number | Average Earnings |
| Male | 758 (37.4%) | $52,917 |
| Female | 1,270 (62.6%) | $32,921 |
| Total | 2,028 (100.0%) | $35,525 |
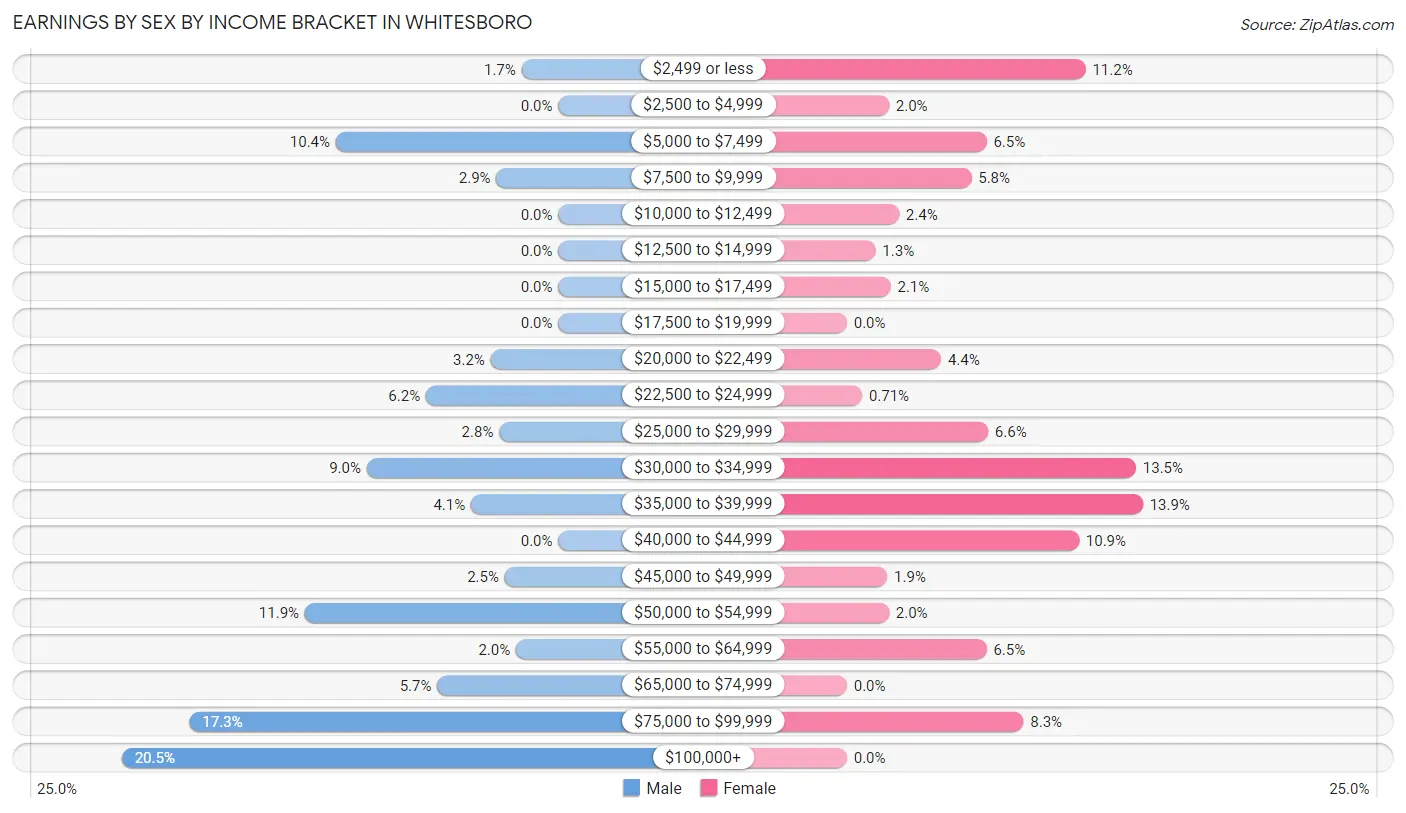
Earnings by Sex by Income Bracket in Whitesboro
The most common earnings brackets in Whitesboro are $100,000+ for men (155 | 20.4%) and $35,000 to $39,999 for women (176 | 13.9%).
| Income | Male | Female |
| $2,499 or less | 13 (1.7%) | 142 (11.2%) |
| $2,500 to $4,999 | 0 (0.0%) | 25 (2.0%) |
| $5,000 to $7,499 | 79 (10.4%) | 83 (6.5%) |
| $7,500 to $9,999 | 22 (2.9%) | 74 (5.8%) |
| $10,000 to $12,499 | 0 (0.0%) | 31 (2.4%) |
| $12,500 to $14,999 | 0 (0.0%) | 17 (1.3%) |
| $15,000 to $17,499 | 0 (0.0%) | 26 (2.1%) |
| $17,500 to $19,999 | 0 (0.0%) | 0 (0.0%) |
| $20,000 to $22,499 | 24 (3.2%) | 56 (4.4%) |
| $22,500 to $24,999 | 47 (6.2%) | 9 (0.7%) |
| $25,000 to $29,999 | 21 (2.8%) | 84 (6.6%) |
| $30,000 to $34,999 | 68 (9.0%) | 172 (13.5%) |
| $35,000 to $39,999 | 31 (4.1%) | 176 (13.9%) |
| $40,000 to $44,999 | 0 (0.0%) | 138 (10.9%) |
| $45,000 to $49,999 | 19 (2.5%) | 24 (1.9%) |
| $50,000 to $54,999 | 90 (11.9%) | 25 (2.0%) |
| $55,000 to $64,999 | 15 (2.0%) | 83 (6.5%) |
| $65,000 to $74,999 | 43 (5.7%) | 0 (0.0%) |
| $75,000 to $99,999 | 131 (17.3%) | 105 (8.3%) |
| $100,000+ | 155 (20.4%) | 0 (0.0%) |
| Total | 758 (100.0%) | 1,270 (100.0%) |
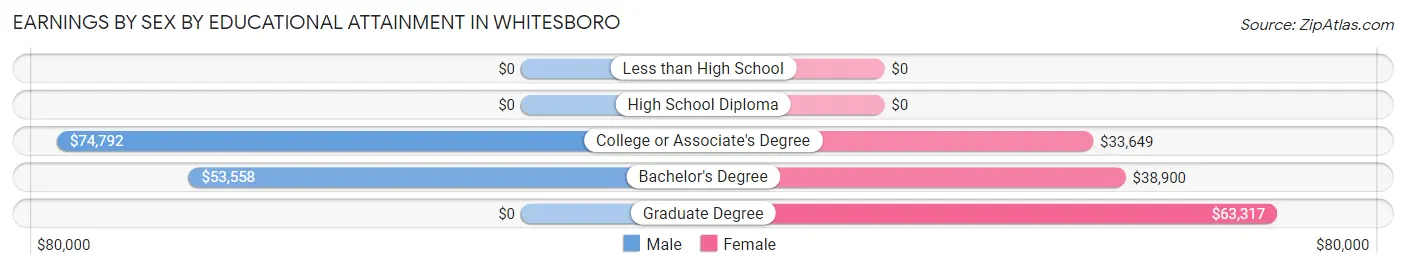
Earnings by Sex by Educational Attainment in Whitesboro
Average earnings in Whitesboro are $54,970 for men and $34,270 for women, a difference of 37.7%. Men with an educational attainment of college or associate's degree enjoy the highest average annual earnings of $74,792, while those with bachelor's degree education earn the least with $53,558. Women with an educational attainment of graduate degree earn the most with the average annual earnings of $63,317, while those with college or associate's degree education have the smallest earnings of $33,649.
| Educational Attainment | Male Income | Female Income |
| Less than High School | - | - |
| High School Diploma | - | - |
| College or Associate's Degree | $74,792 | $33,649 |
| Bachelor's Degree | $53,558 | $38,900 |
| Graduate Degree | - | - |
| Total | $54,970 | $34,270 |
Family Income in Whitesboro
Family Income Brackets in Whitesboro
According to the Whitesboro family income data, there are 263 families falling into the $75,000 to $99,999 income range, which is the most common income bracket and makes up 26.8% of all families.
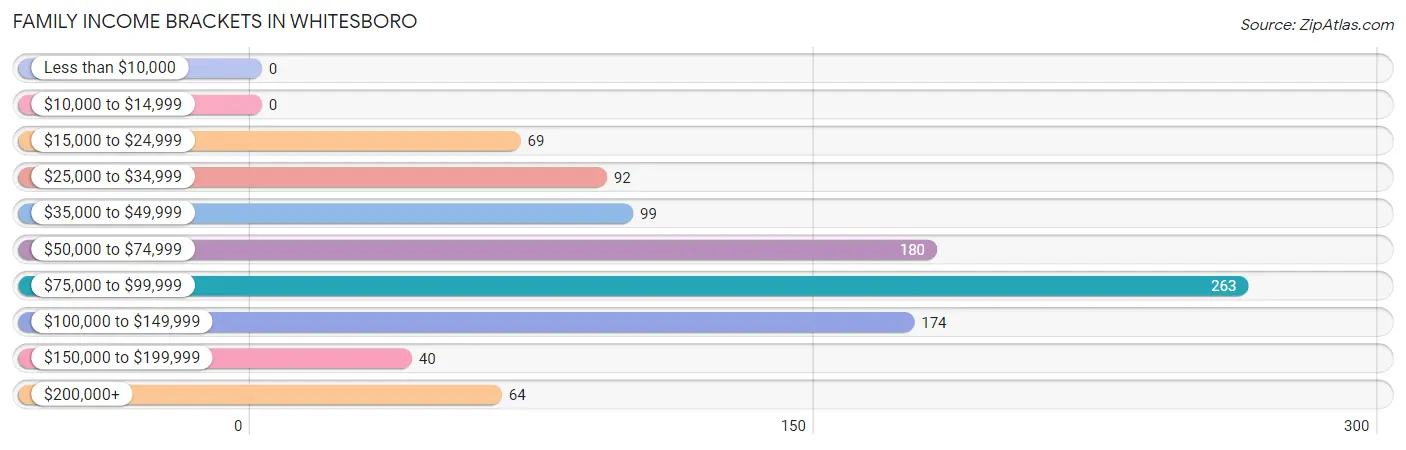
| Income Bracket | # Families | % Families |
| Less than $10,000 | 0 | 0.0% |
| $10,000 to $14,999 | 0 | 0.0% |
| $15,000 to $24,999 | 69 | 7.0% |
| $25,000 to $34,999 | 92 | 9.4% |
| $35,000 to $49,999 | 99 | 10.1% |
| $50,000 to $74,999 | 180 | 18.3% |
| $75,000 to $99,999 | 263 | 26.8% |
| $100,000 to $149,999 | 174 | 17.7% |
| $150,000 to $199,999 | 40 | 4.1% |
| $200,000+ | 64 | 6.5% |
Family Income by Famaliy Size in Whitesboro
4-person families (109 | 11.1%) account for the highest median family income in Whitesboro with $130,592 per family, while 2-person families (610 | 62.2%) have the highest median income of $37,466 per family member.
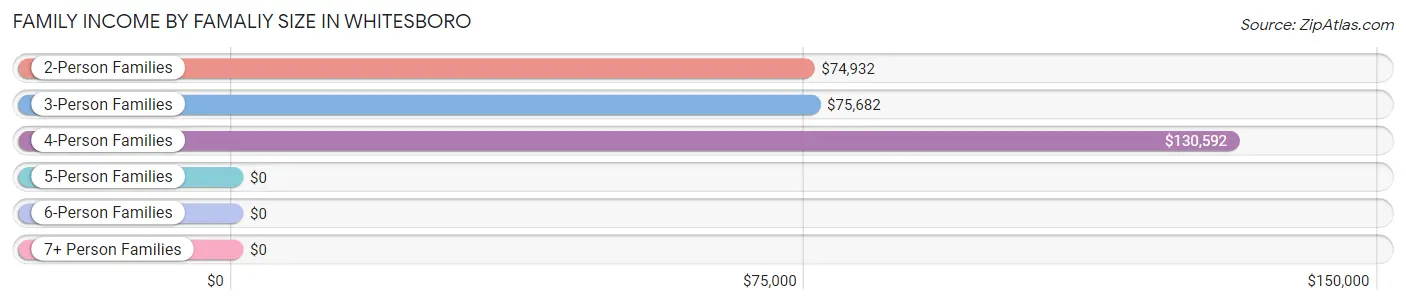
| Income Bracket | # Families | Median Income |
| 2-Person Families | 610 (62.2%) | $74,932 |
| 3-Person Families | 190 (19.4%) | $75,682 |
| 4-Person Families | 109 (11.1%) | $130,592 |
| 5-Person Families | 72 (7.3%) | $0 |
| 6-Person Families | 0 (0.0%) | $0 |
| 7+ Person Families | 0 (0.0%) | $0 |
| Total | 981 (100.0%) | $79,157 |
Family Income by Number of Earners in Whitesboro
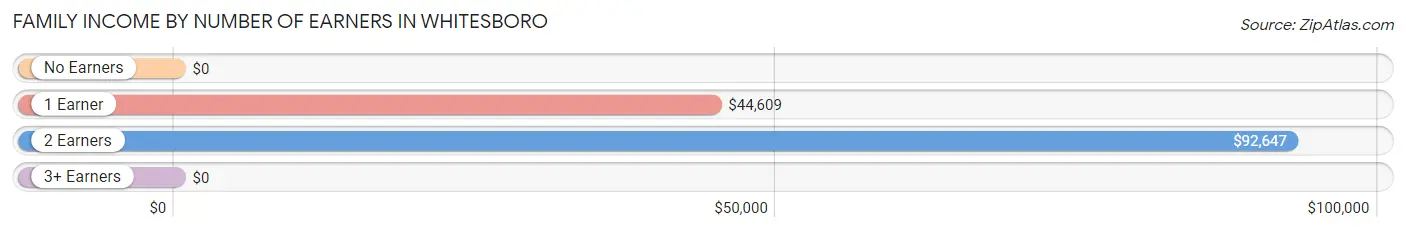
| Number of Earners | # Families | Median Income |
| No Earners | 193 (19.7%) | $0 |
| 1 Earner | 311 (31.7%) | $44,609 |
| 2 Earners | 464 (47.3%) | $92,647 |
| 3+ Earners | 13 (1.3%) | $0 |
| Total | 981 (100.0%) | $79,157 |
Household Income in Whitesboro
Household Income Brackets in Whitesboro
With 296 households falling in the category, the $75,000 to $99,999 income range is the most frequent in Whitesboro, accounting for 18.0% of all households. In contrast, only 30 households (1.8%) fall into the $15,000 to $24,999 income bracket, making it the least populous group.
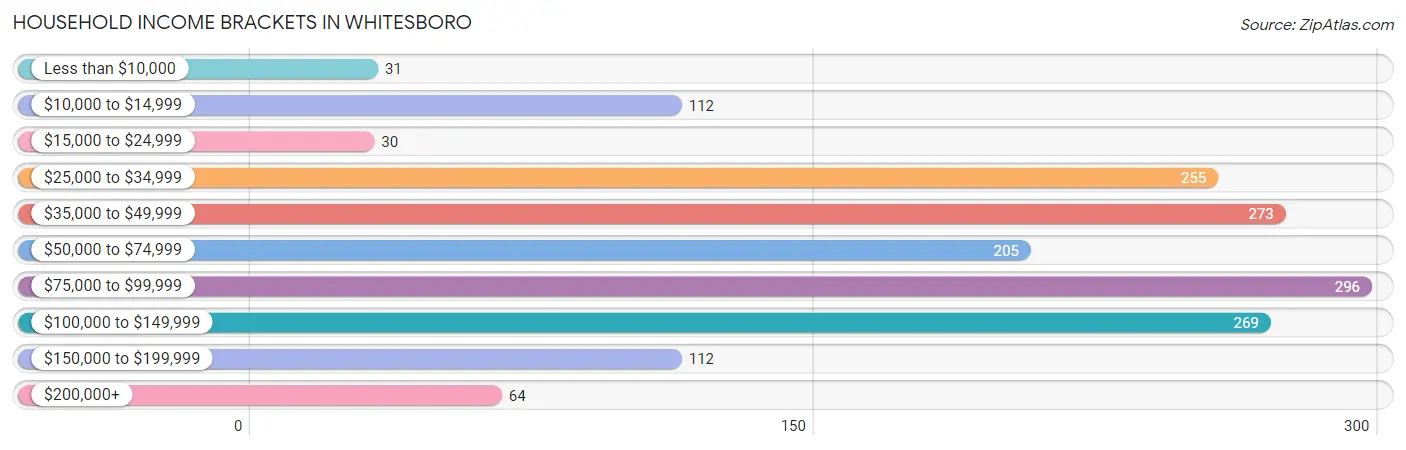
| Income Bracket | # Households | % Households |
| Less than $10,000 | 31 | 1.9% |
| $10,000 to $14,999 | 112 | 6.8% |
| $15,000 to $24,999 | 30 | 1.8% |
| $25,000 to $34,999 | 255 | 15.5% |
| $35,000 to $49,999 | 273 | 16.6% |
| $50,000 to $74,999 | 205 | 12.5% |
| $75,000 to $99,999 | 296 | 18.0% |
| $100,000 to $149,999 | 269 | 16.4% |
| $150,000 to $199,999 | 112 | 6.8% |
| $200,000+ | 64 | 3.9% |
Household Income by Householder Age in Whitesboro
The median household income in Whitesboro is $65,234, with the highest median household income of $79,300 found in the 25 to 44 years age bracket for the primary householder. A total of 554 households (33.7%) fall into this category. Meanwhile, the 15 to 24 years age bracket for the primary householder has the lowest median household income of $36,346, with 156 households (9.5%) in this group.
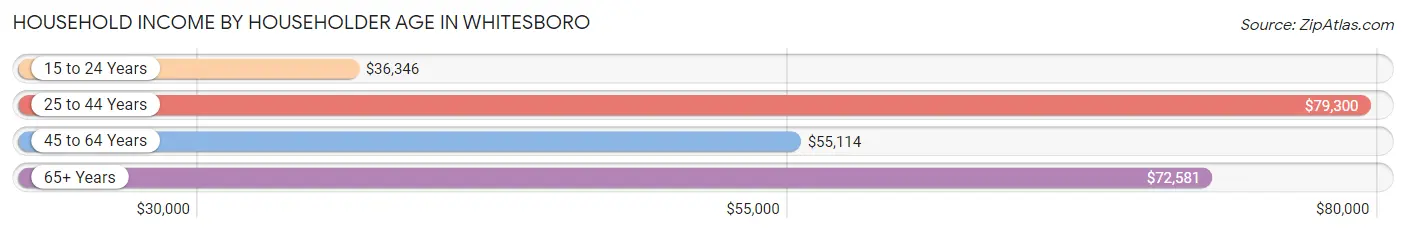
| Income Bracket | # Households | Median Income |
| 15 to 24 Years | 156 (9.5%) | $36,346 |
| 25 to 44 Years | 554 (33.7%) | $79,300 |
| 45 to 64 Years | 467 (28.4%) | $55,114 |
| 65+ Years | 466 (28.4%) | $72,581 |
| Total | 1,643 (100.0%) | $65,234 |
Poverty in Whitesboro
Income Below Poverty by Sex and Age in Whitesboro
With 8.7% poverty level for males and 12.2% for females among the residents of Whitesboro, under 5 year old males and 6 to 11 year old females are the most vulnerable to poverty, with 20 males (29.8%) and 20 females (27.8%) in their respective age groups living below the poverty level.
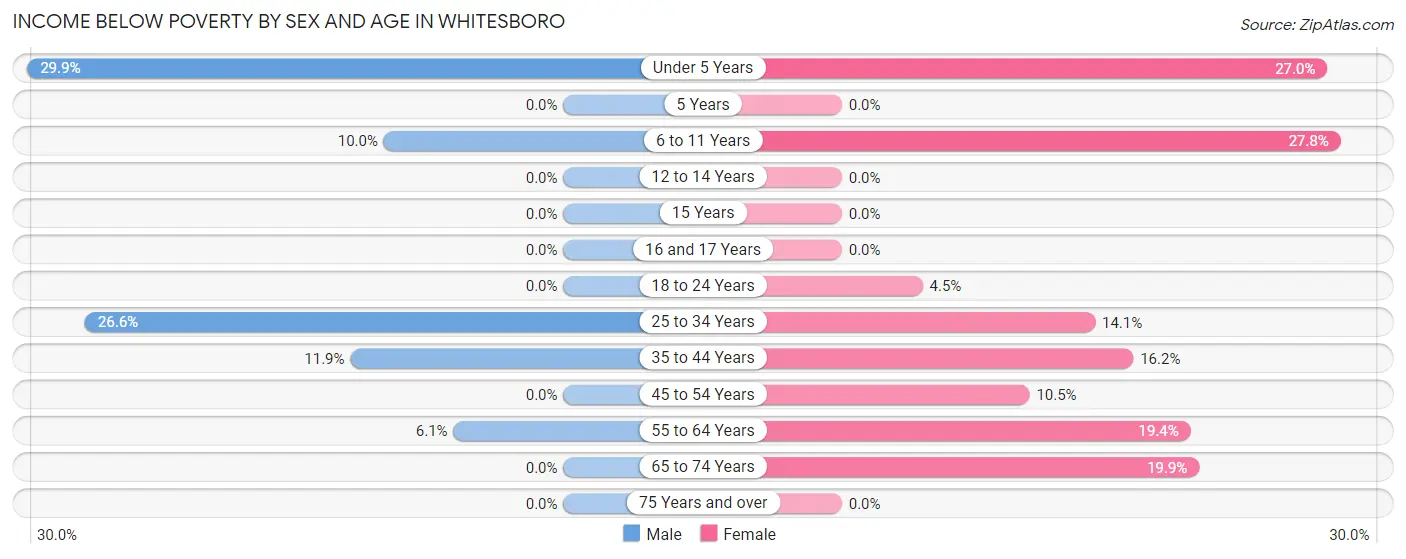
| Age Bracket | Male | Female |
| Under 5 Years | 20 (29.8%) | 20 (27.0%) |
| 5 Years | 0 (0.0%) | 0 (0.0%) |
| 6 to 11 Years | 20 (10.0%) | 20 (27.8%) |
| 12 to 14 Years | 0 (0.0%) | 0 (0.0%) |
| 15 Years | 0 (0.0%) | 0 (0.0%) |
| 16 and 17 Years | 0 (0.0%) | 0 (0.0%) |
| 18 to 24 Years | 0 (0.0%) | 17 (4.5%) |
| 25 to 34 Years | 65 (26.6%) | 55 (14.1%) |
| 35 to 44 Years | 28 (11.9%) | 37 (16.2%) |
| 45 to 54 Years | 0 (0.0%) | 28 (10.4%) |
| 55 to 64 Years | 3 (6.1%) | 40 (19.4%) |
| 65 to 74 Years | 0 (0.0%) | 41 (19.9%) |
| 75 Years and over | 0 (0.0%) | 0 (0.0%) |
| Total | 136 (8.7%) | 258 (12.2%) |
Income Above Poverty by Sex and Age in Whitesboro
According to the poverty statistics in Whitesboro, males aged 15 years and females aged 5 years are the age groups that are most secure financially, with 100.0% of males and 100.0% of females in these age groups living above the poverty line.
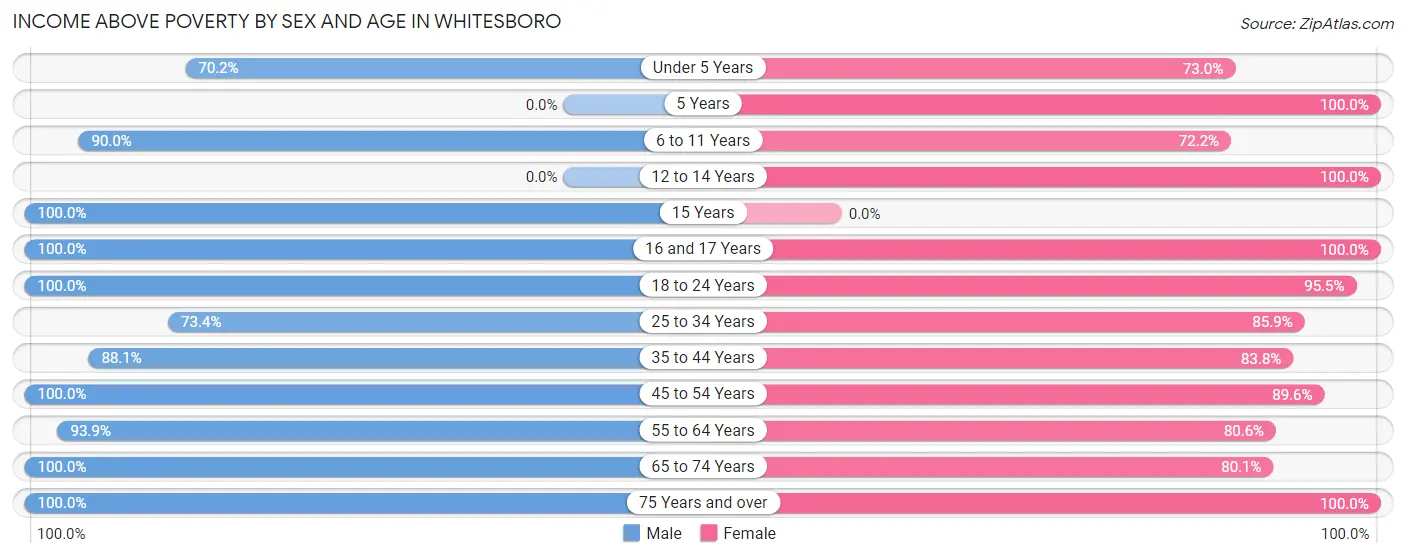
| Age Bracket | Male | Female |
| Under 5 Years | 47 (70.2%) | 54 (73.0%) |
| 5 Years | 0 (0.0%) | 52 (100.0%) |
| 6 to 11 Years | 180 (90.0%) | 52 (72.2%) |
| 12 to 14 Years | 0 (0.0%) | 58 (100.0%) |
| 15 Years | 23 (100.0%) | 0 (0.0%) |
| 16 and 17 Years | 87 (100.0%) | 81 (100.0%) |
| 18 to 24 Years | 81 (100.0%) | 361 (95.5%) |
| 25 to 34 Years | 179 (73.4%) | 335 (85.9%) |
| 35 to 44 Years | 208 (88.1%) | 191 (83.8%) |
| 45 to 54 Years | 145 (100.0%) | 240 (89.5%) |
| 55 to 64 Years | 46 (93.9%) | 166 (80.6%) |
| 65 to 74 Years | 359 (100.0%) | 165 (80.1%) |
| 75 Years and over | 69 (100.0%) | 100 (100.0%) |
| Total | 1,424 (91.3%) | 1,855 (87.8%) |
Income Below Poverty Among Married-Couple Families in Whitesboro
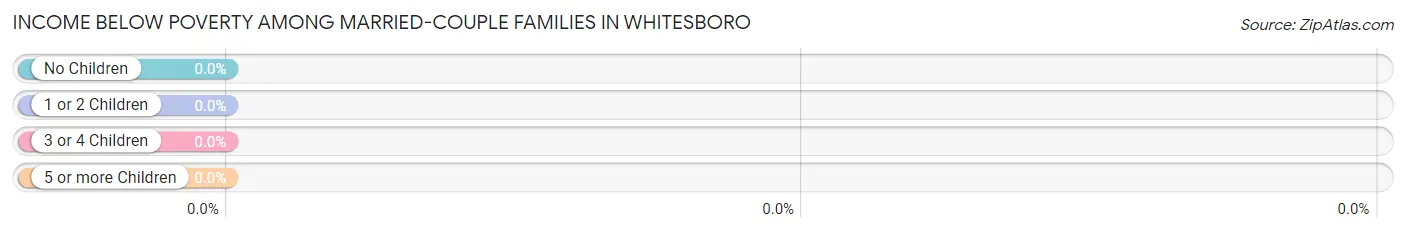
| Children | Above Poverty | Below Poverty |
| No Children | 329 (100.0%) | 0 (0.0%) |
| 1 or 2 Children | 142 (100.0%) | 0 (0.0%) |
| 3 or 4 Children | 28 (100.0%) | 0 (0.0%) |
| 5 or more Children | 0 (0.0%) | 0 (0.0%) |
| Total | 499 (100.0%) | 0 (0.0%) |
Income Below Poverty Among Single-Parent Households in Whitesboro
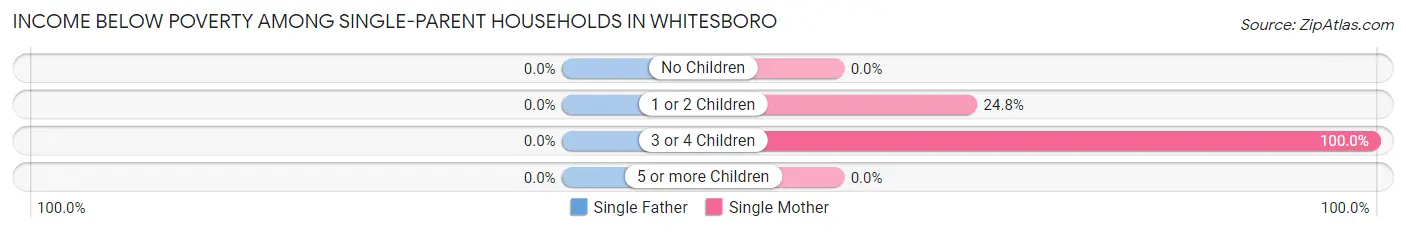
| Children | Single Father | Single Mother |
| No Children | 0 (0.0%) | 0 (0.0%) |
| 1 or 2 Children | 0 (0.0%) | 55 (24.8%) |
| 3 or 4 Children | 0 (0.0%) | 19 (100.0%) |
| 5 or more Children | 0 (0.0%) | 0 (0.0%) |
| Total | 0 (0.0%) | 74 (27.4%) |
Income Below Poverty Among Married-Couple vs Single-Parent Households in Whitesboro
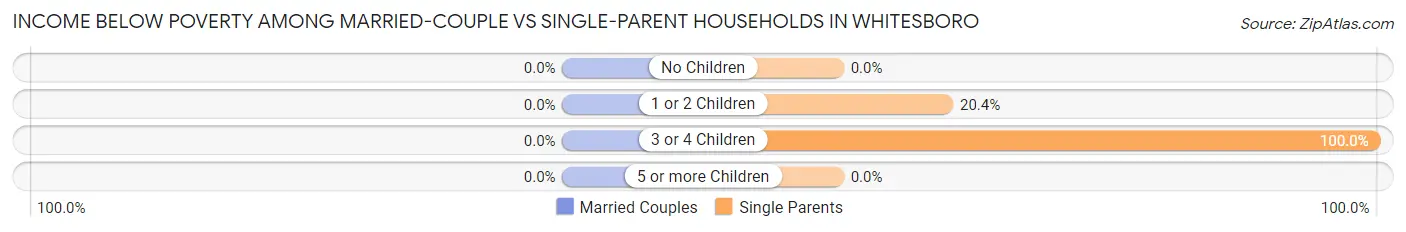
| Children | Married-Couple Families | Single-Parent Households |
| No Children | 0 (0.0%) | 0 (0.0%) |
| 1 or 2 Children | 0 (0.0%) | 55 (20.4%) |
| 3 or 4 Children | 0 (0.0%) | 19 (100.0%) |
| 5 or more Children | 0 (0.0%) | 0 (0.0%) |
| Total | 0 (0.0%) | 74 (15.3%) |
Race in Whitesboro
The most populous races in Whitesboro are White / Caucasian (3,144 | 85.6%), Hispanic or Latino (362 | 9.9%), and Some other Race (206 | 5.6%).
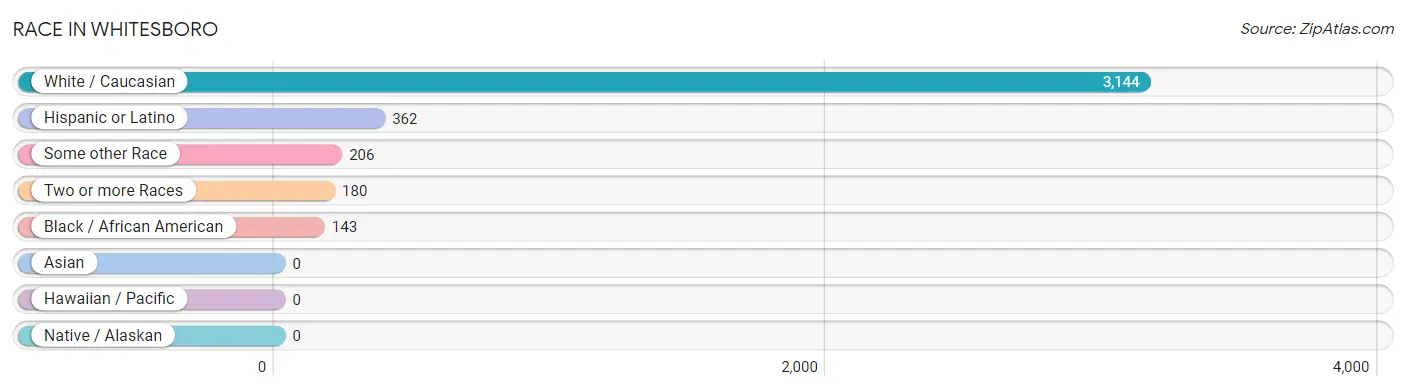
| Race | # Population | % Population |
| Asian | 0 | 0.0% |
| Black / African American | 143 | 3.9% |
| Hawaiian / Pacific | 0 | 0.0% |
| Hispanic or Latino | 362 | 9.9% |
| Native / Alaskan | 0 | 0.0% |
| White / Caucasian | 3,144 | 85.6% |
| Two or more Races | 180 | 4.9% |
| Some other Race | 206 | 5.6% |
| Total | 3,673 | 100.0% |
Ancestry in Whitesboro
The most populous ancestries reported in Whitesboro are Italian (977 | 26.6%), Irish (887 | 24.1%), Polish (680 | 18.5%), English (402 | 10.9%), and German (341 | 9.3%), together accounting for 89.5% of all Whitesboro residents.
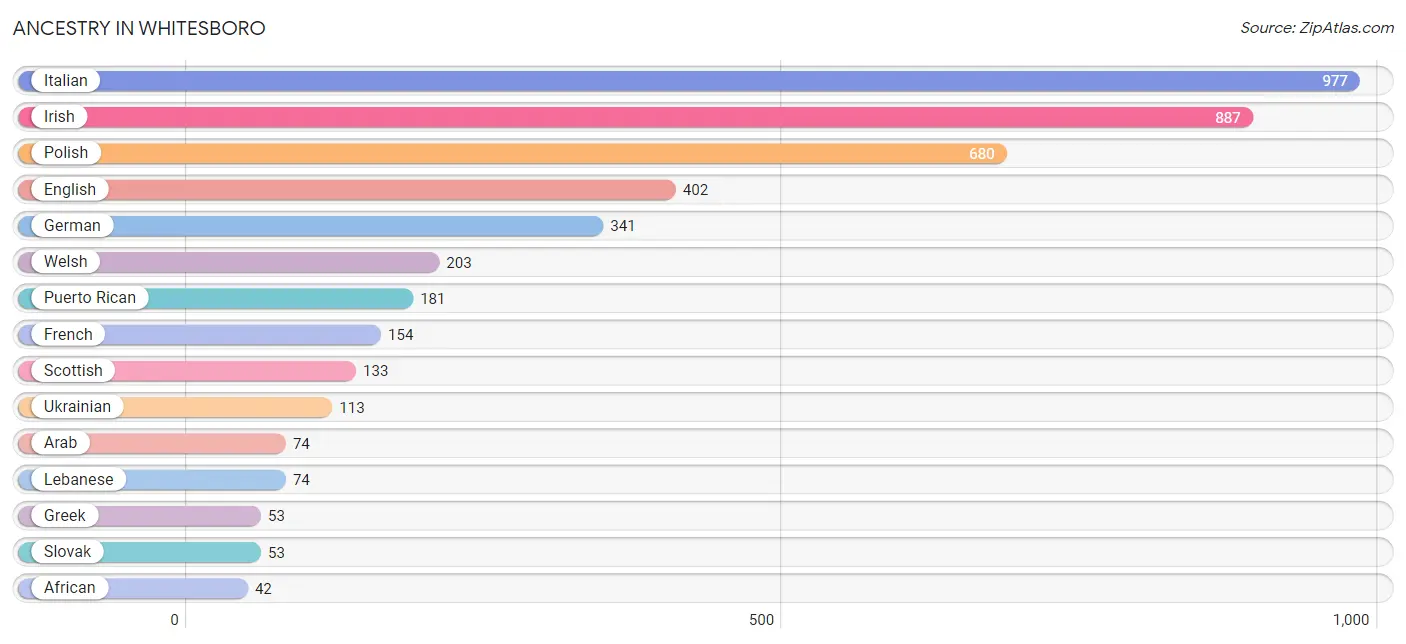
| Ancestry | # Population | % Population |
| African | 42 | 1.1% |
| American | 24 | 0.6% |
| Arab | 74 | 2.0% |
| Austrian | 14 | 0.4% |
| Dutch | 32 | 0.9% |
| English | 402 | 10.9% |
| French | 154 | 4.2% |
| French Canadian | 28 | 0.8% |
| German | 341 | 9.3% |
| Greek | 53 | 1.4% |
| Hungarian | 20 | 0.5% |
| Irish | 887 | 24.1% |
| Italian | 977 | 26.6% |
| Lebanese | 74 | 2.0% |
| Polish | 680 | 18.5% |
| Puerto Rican | 181 | 4.9% |
| Romanian | 20 | 0.5% |
| Russian | 29 | 0.8% |
| Scotch-Irish | 19 | 0.5% |
| Scottish | 133 | 3.6% |
| Slovak | 53 | 1.4% |
| Subsaharan African | 42 | 1.1% |
| Ukrainian | 113 | 3.1% |
| Welsh | 203 | 5.5% | View All 24 Rows |
Immigrants in Whitesboro
The most numerous immigrant groups reported in Whitesboro came from Caribbean (120 | 3.3%), Latin America (120 | 3.3%), Jamaica (65 | 1.8%), Trinidad and Tobago (55 | 1.5%), and Europe (54 | 1.5%), together accounting for 11.3% of all Whitesboro residents.
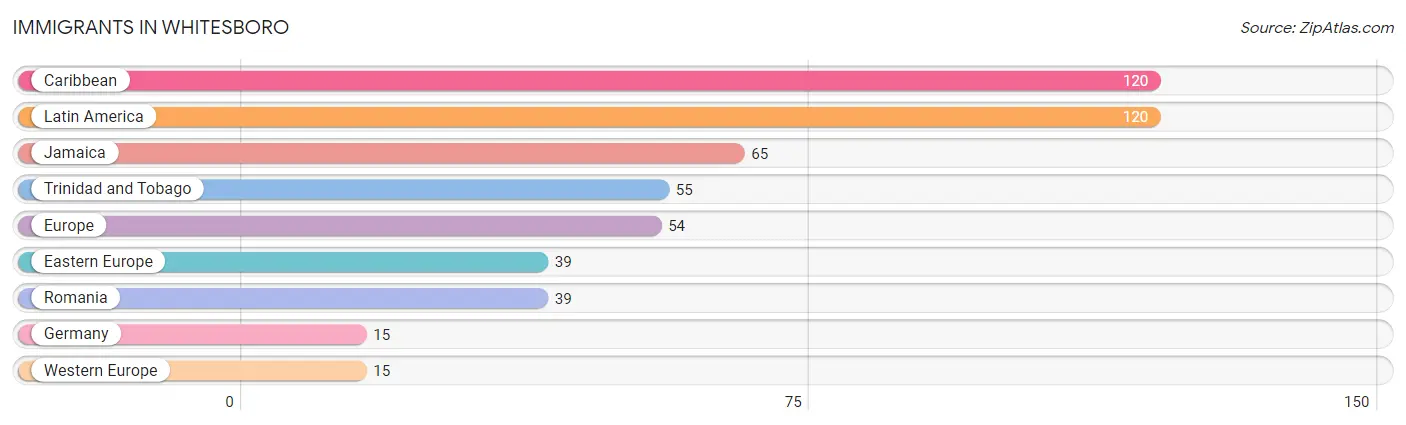
| Immigration Origin | # Population | % Population |
| Caribbean | 120 | 3.3% |
| Eastern Europe | 39 | 1.1% |
| Europe | 54 | 1.5% |
| Germany | 15 | 0.4% |
| Jamaica | 65 | 1.8% |
| Latin America | 120 | 3.3% |
| Romania | 39 | 1.1% |
| Trinidad and Tobago | 55 | 1.5% |
| Western Europe | 15 | 0.4% | View All 9 Rows |
Sex and Age in Whitesboro
Sex and Age in Whitesboro
The most populous age groups in Whitesboro are 65 to 69 Years (215 | 13.8%) for men and 20 to 24 Years (328 | 15.5%) for women.
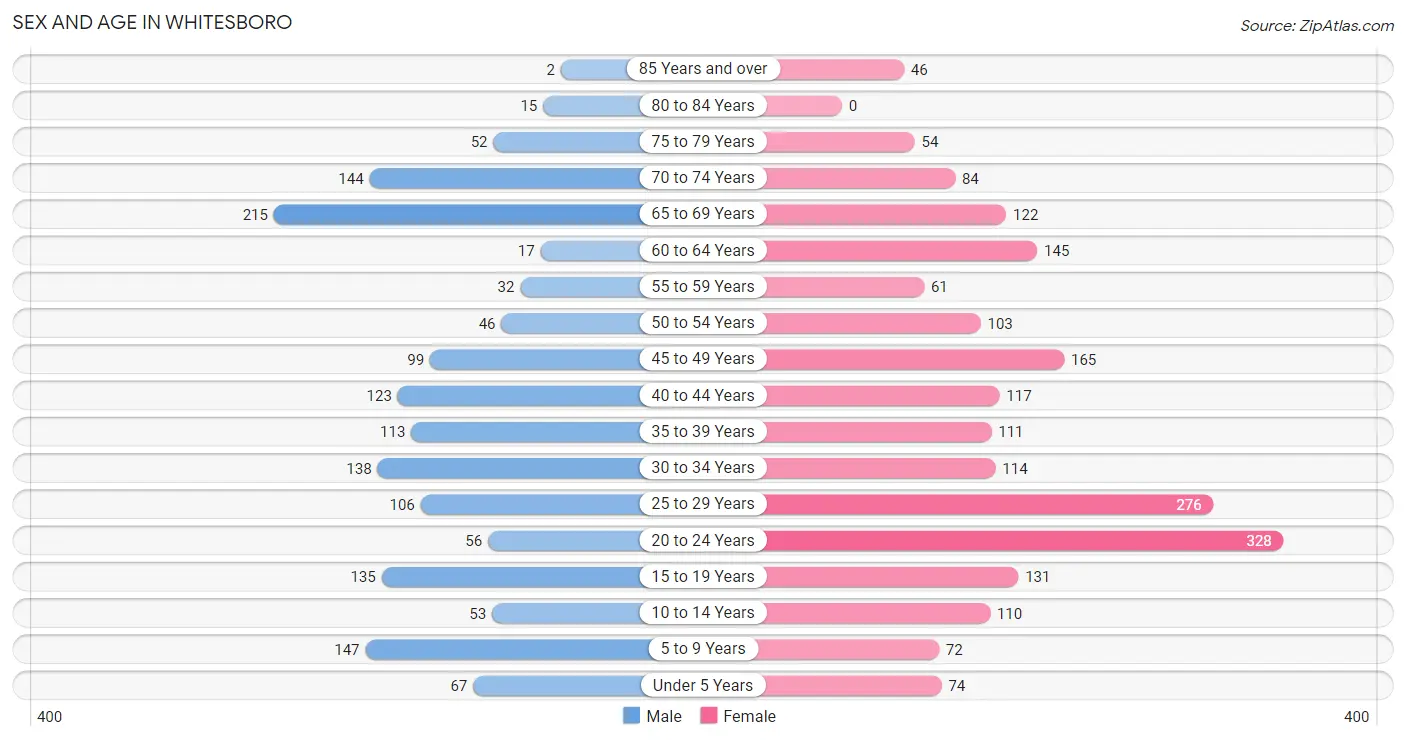
| Age Bracket | Male | Female |
| Under 5 Years | 67 (4.3%) | 74 (3.5%) |
| 5 to 9 Years | 147 (9.4%) | 72 (3.4%) |
| 10 to 14 Years | 53 (3.4%) | 110 (5.2%) |
| 15 to 19 Years | 135 (8.6%) | 131 (6.2%) |
| 20 to 24 Years | 56 (3.6%) | 328 (15.5%) |
| 25 to 29 Years | 106 (6.8%) | 276 (13.1%) |
| 30 to 34 Years | 138 (8.8%) | 114 (5.4%) |
| 35 to 39 Years | 113 (7.2%) | 111 (5.2%) |
| 40 to 44 Years | 123 (7.9%) | 117 (5.5%) |
| 45 to 49 Years | 99 (6.4%) | 165 (7.8%) |
| 50 to 54 Years | 46 (2.9%) | 103 (4.9%) |
| 55 to 59 Years | 32 (2.1%) | 61 (2.9%) |
| 60 to 64 Years | 17 (1.1%) | 145 (6.9%) |
| 65 to 69 Years | 215 (13.8%) | 122 (5.8%) |
| 70 to 74 Years | 144 (9.2%) | 84 (4.0%) |
| 75 to 79 Years | 52 (3.3%) | 54 (2.6%) |
| 80 to 84 Years | 15 (1.0%) | 0 (0.0%) |
| 85 Years and over | 2 (0.1%) | 46 (2.2%) |
| Total | 1,560 (100.0%) | 2,113 (100.0%) |
Families and Households in Whitesboro
Median Family Size in Whitesboro
The median family size in Whitesboro is 2.79 persons per family, with single female/mother families (270 | 27.5%) accounting for the largest median family size of 3.03 persons per family. On the other hand, single male/father families (212 | 21.6%) represent the smallest median family size with 2.20 persons per family.
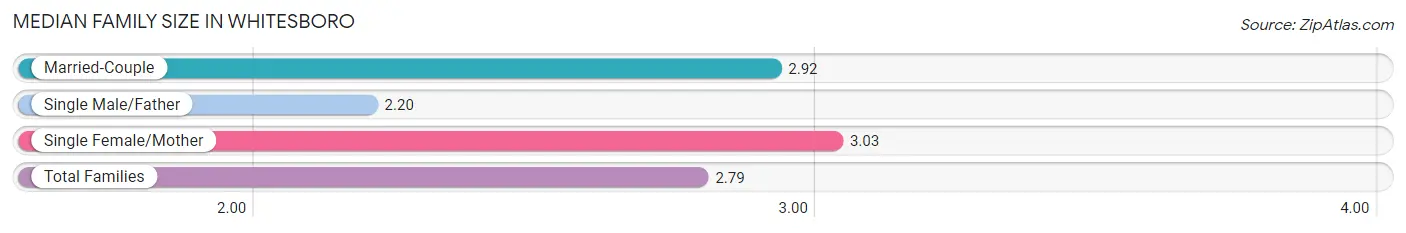
| Family Type | # Families | Family Size |
| Married-Couple | 499 (50.9%) | 2.92 |
| Single Male/Father | 212 (21.6%) | 2.20 |
| Single Female/Mother | 270 (27.5%) | 3.03 |
| Total Families | 981 (100.0%) | 2.79 |
Median Household Size in Whitesboro
The median household size in Whitesboro is 2.23 persons per household, with single female/mother households (270 | 16.4%) accounting for the largest median household size of 3.34 persons per household. non-family households (662 | 40.3%) represent the smallest median household size with 1.14 persons per household.
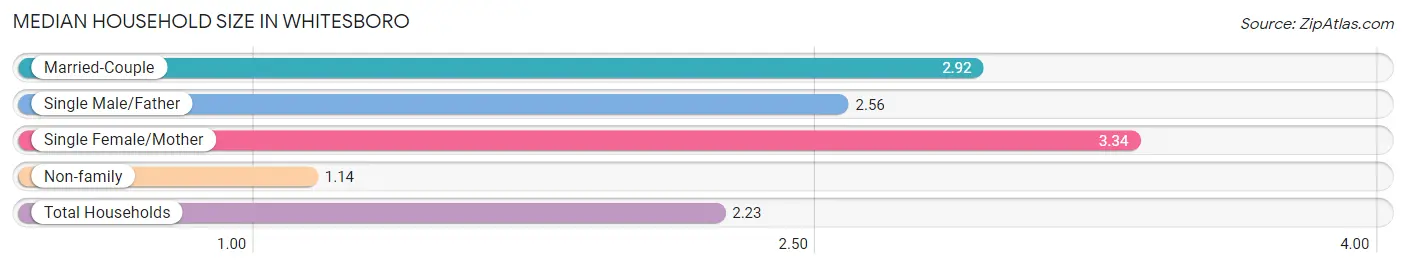
| Household Type | # Households | Household Size |
| Married-Couple | 499 (30.4%) | 2.92 |
| Single Male/Father | 212 (12.9%) | 2.56 |
| Single Female/Mother | 270 (16.4%) | 3.34 |
| Non-family | 662 (40.3%) | 1.14 |
| Total Households | 1,643 (100.0%) | 2.23 |
Household Size by Marriage Status in Whitesboro
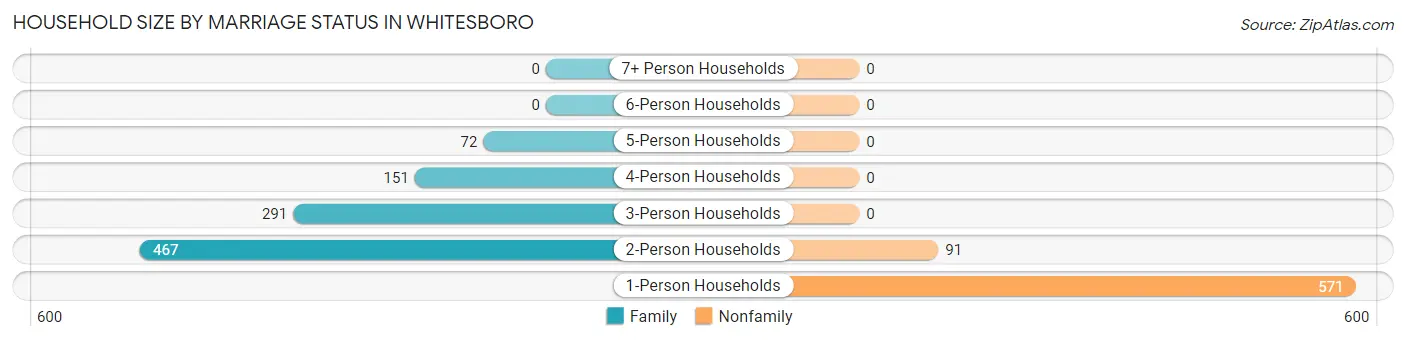
Out of a total of 1,643 households in Whitesboro, 981 (59.7%) are family households, while 662 (40.3%) are nonfamily households. The most numerous type of family households are 2-person households, comprising 467, and the most common type of nonfamily households are 1-person households, comprising 571.
| Household Size | Family Households | Nonfamily Households |
| 1-Person Households | - | 571 (34.7%) |
| 2-Person Households | 467 (28.4%) | 91 (5.5%) |
| 3-Person Households | 291 (17.7%) | 0 (0.0%) |
| 4-Person Households | 151 (9.2%) | 0 (0.0%) |
| 5-Person Households | 72 (4.4%) | 0 (0.0%) |
| 6-Person Households | 0 (0.0%) | 0 (0.0%) |
| 7+ Person Households | 0 (0.0%) | 0 (0.0%) |
| Total | 981 (59.7%) | 662 (40.3%) |
Female Fertility in Whitesboro
Fertility by Age in Whitesboro
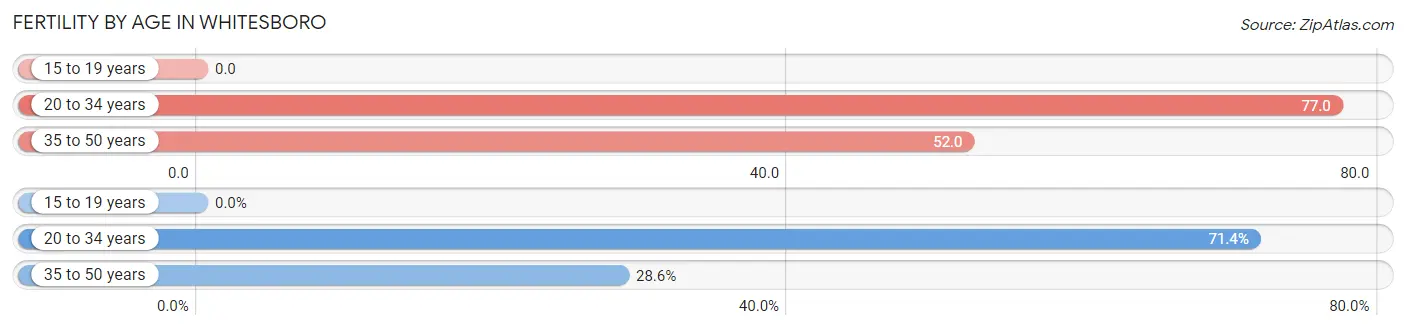
Average fertility rate in Whitesboro is 61.0 births per 1,000 women. Women in the age bracket of 20 to 34 years have the highest fertility rate with 77.0 births per 1,000 women. Women in the age bracket of 20 to 34 years acount for 71.4% of all women with births.
| Age Bracket | Women with Births | Births / 1,000 Women |
| 15 to 19 years | 0 (0.0%) | 0.0 |
| 20 to 34 years | 55 (71.4%) | 77.0 |
| 35 to 50 years | 22 (28.6%) | 52.0 |
| Total | 77 (100.0%) | 61.0 |
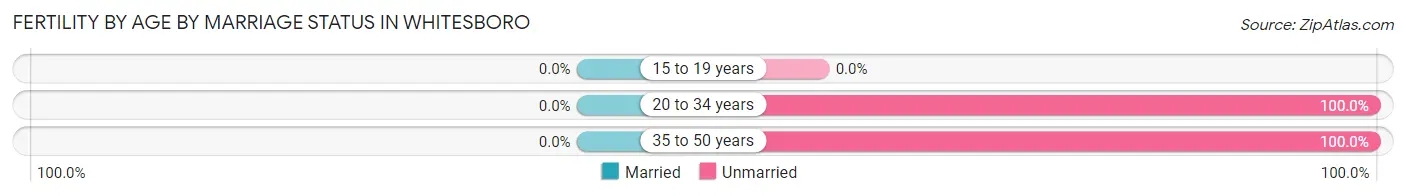
Fertility by Age by Marriage Status in Whitesboro
| Age Bracket | Married | Unmarried |
| 15 to 19 years | 0 (0.0%) | 0 (0.0%) |
| 20 to 34 years | 0 (0.0%) | 55 (100.0%) |
| 35 to 50 years | 0 (0.0%) | 22 (100.0%) |
| Total | 0 (0.0%) | 77 (100.0%) |
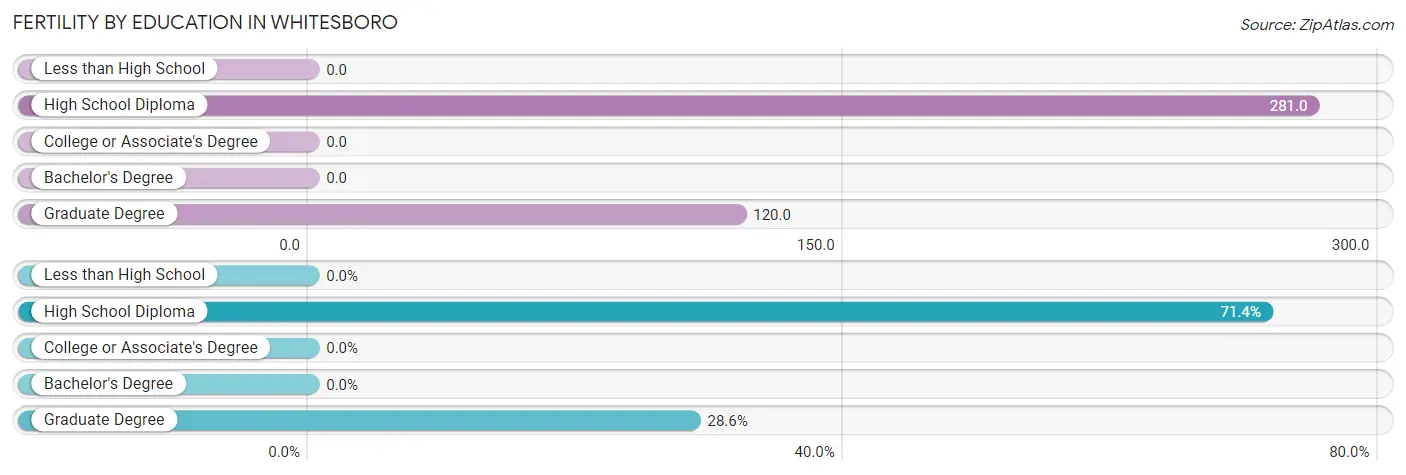
Fertility by Education in Whitesboro
| Educational Attainment | Women with Births | Births / 1,000 Women |
| Less than High School | 0 (0.0%) | 0.0 |
| High School Diploma | 55 (71.4%) | 281.0 |
| College or Associate's Degree | 0 (0.0%) | 0.0 |
| Bachelor's Degree | 0 (0.0%) | 0.0 |
| Graduate Degree | 22 (28.6%) | 120.0 |
| Total | 77 (100.0%) | 61.0 |
Fertility by Education by Marriage Status in Whitesboro
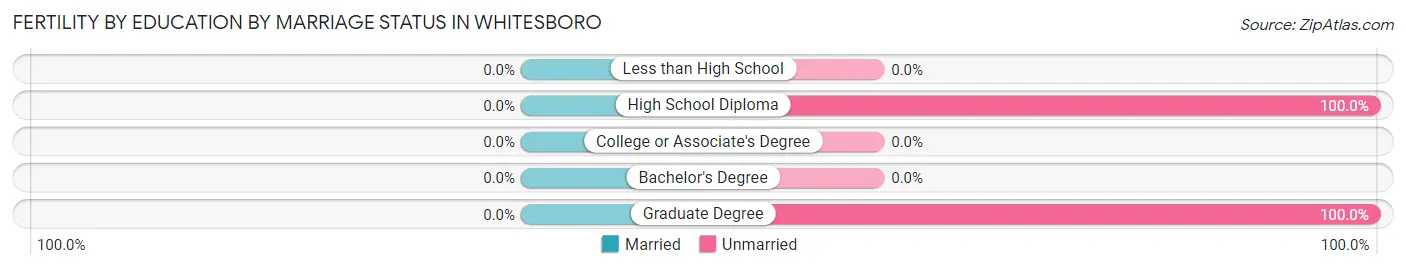
| Educational Attainment | Married | Unmarried |
| Less than High School | 0 (0.0%) | 0 (0.0%) |
| High School Diploma | 0 (0.0%) | 55 (100.0%) |
| College or Associate's Degree | 0 (0.0%) | 0 (0.0%) |
| Bachelor's Degree | 0 (0.0%) | 0 (0.0%) |
| Graduate Degree | 0 (0.0%) | 22 (100.0%) |
| Total | 0 (0.0%) | 77 (100.0%) |
Employment Characteristics in Whitesboro
Employment by Class of Employer in Whitesboro
Among the 1,733 employed individuals in Whitesboro, private company employees (851 | 49.1%), not-for-profit organizations (358 | 20.7%), and local government employees (265 | 15.3%) make up the most common classes of employment.
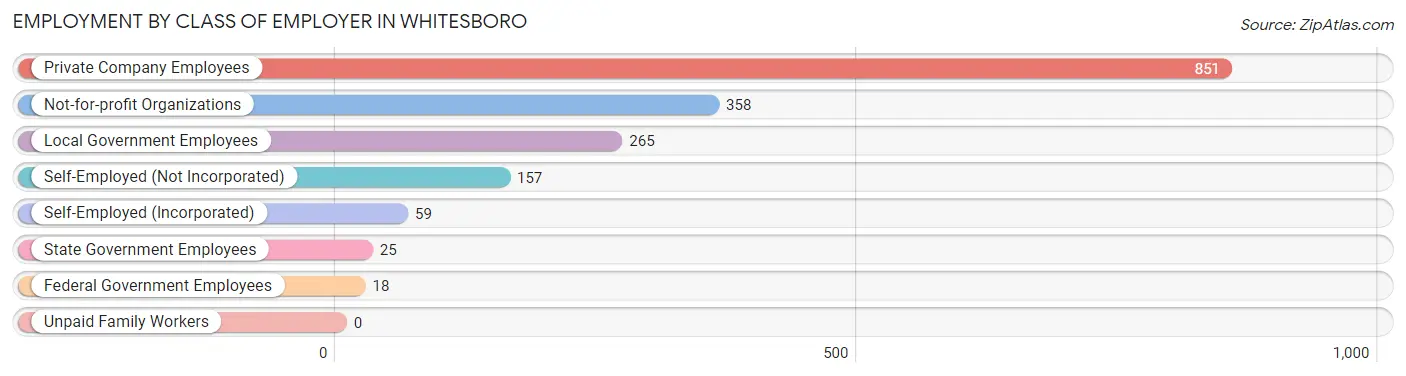
| Employer Class | # Employees | % Employees |
| Private Company Employees | 851 | 49.1% |
| Self-Employed (Incorporated) | 59 | 3.4% |
| Self-Employed (Not Incorporated) | 157 | 9.1% |
| Not-for-profit Organizations | 358 | 20.7% |
| Local Government Employees | 265 | 15.3% |
| State Government Employees | 25 | 1.4% |
| Federal Government Employees | 18 | 1.0% |
| Unpaid Family Workers | 0 | 0.0% |
| Total | 1,733 | 100.0% |
Employment Status by Age in Whitesboro
According to the labor force statistics for Whitesboro, out of the total population over 16 years of age (3,127), 62.7% or 1,961 individuals are in the labor force, with 9.2% or 180 of them unemployed. The age group with the highest labor force participation rate is 30 to 34 years, with 100.0% or 252 individuals in the labor force. Within the labor force, the 16 to 19 years age range has the highest percentage of unemployed individuals, with 100.0% or 50 of them being unemployed.
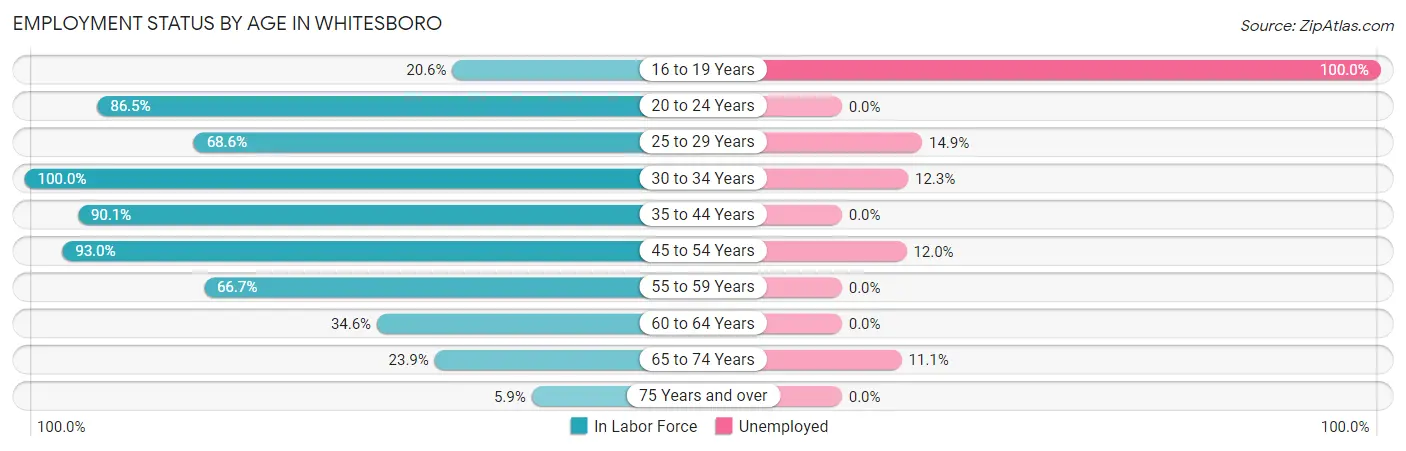
| Age Bracket | In Labor Force | Unemployed |
| 16 to 19 Years | 50 (20.6%) | 50 (100.0%) |
| 20 to 24 Years | 332 (86.5%) | 0 (0.0%) |
| 25 to 29 Years | 262 (68.6%) | 39 (14.9%) |
| 30 to 34 Years | 252 (100.0%) | 31 (12.3%) |
| 35 to 44 Years | 418 (90.1%) | 0 (0.0%) |
| 45 to 54 Years | 384 (93.0%) | 46 (12.0%) |
| 55 to 59 Years | 62 (66.7%) | 0 (0.0%) |
| 60 to 64 Years | 56 (34.6%) | 0 (0.0%) |
| 65 to 74 Years | 135 (23.9%) | 15 (11.1%) |
| 75 Years and over | 10 (5.9%) | 0 (0.0%) |
| Total | 1,961 (62.7%) | 180 (9.2%) |
Employment Status by Educational Attainment in Whitesboro
According to labor force statistics for Whitesboro, 81.2% of individuals (1,434) out of the total population between 25 and 64 years of age (1,766) are in the labor force, with 8.1% or 116 of them being unemployed. The group with the highest labor force participation rate are those with the educational attainment of bachelor's degree or higher, with 86.1% or 575 individuals in the labor force. Within the labor force, individuals with high school diploma education have the highest percentage of unemployment, with 22.9% or 77 of them being unemployed.
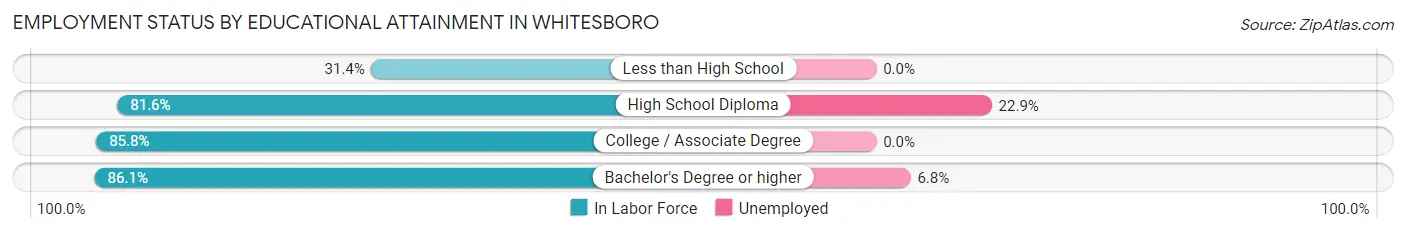
| Educational Attainment | In Labor Force | Unemployed |
| Less than High School | 38 (31.4%) | 0 (0.0%) |
| High School Diploma | 336 (81.6%) | 94 (22.9%) |
| College / Associate Degree | 485 (85.8%) | 0 (0.0%) |
| Bachelor's Degree or higher | 575 (86.1%) | 45 (6.8%) |
| Total | 1,434 (81.2%) | 143 (8.1%) |
Employment Occupations by Sex in Whitesboro
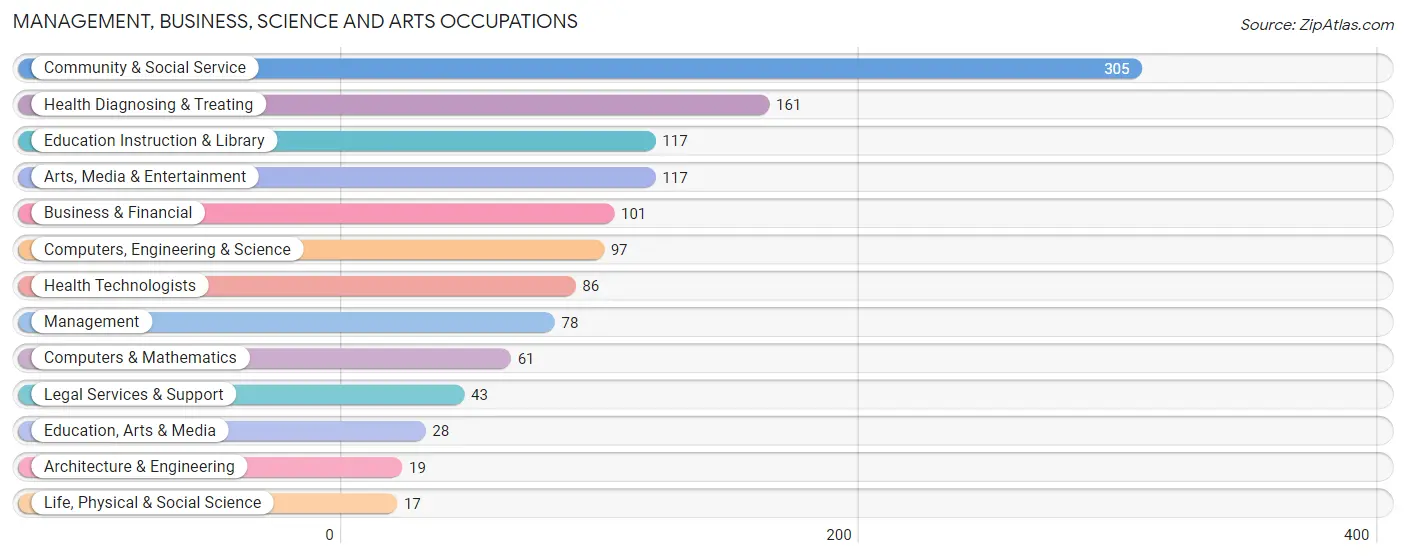
Management, Business, Science and Arts Occupations
The most common Management, Business, Science and Arts occupations in Whitesboro are Community & Social Service (305 | 17.1%), Health Diagnosing & Treating (161 | 9.0%), Education Instruction & Library (117 | 6.6%), Arts, Media & Entertainment (117 | 6.6%), and Business & Financial (101 | 5.7%).
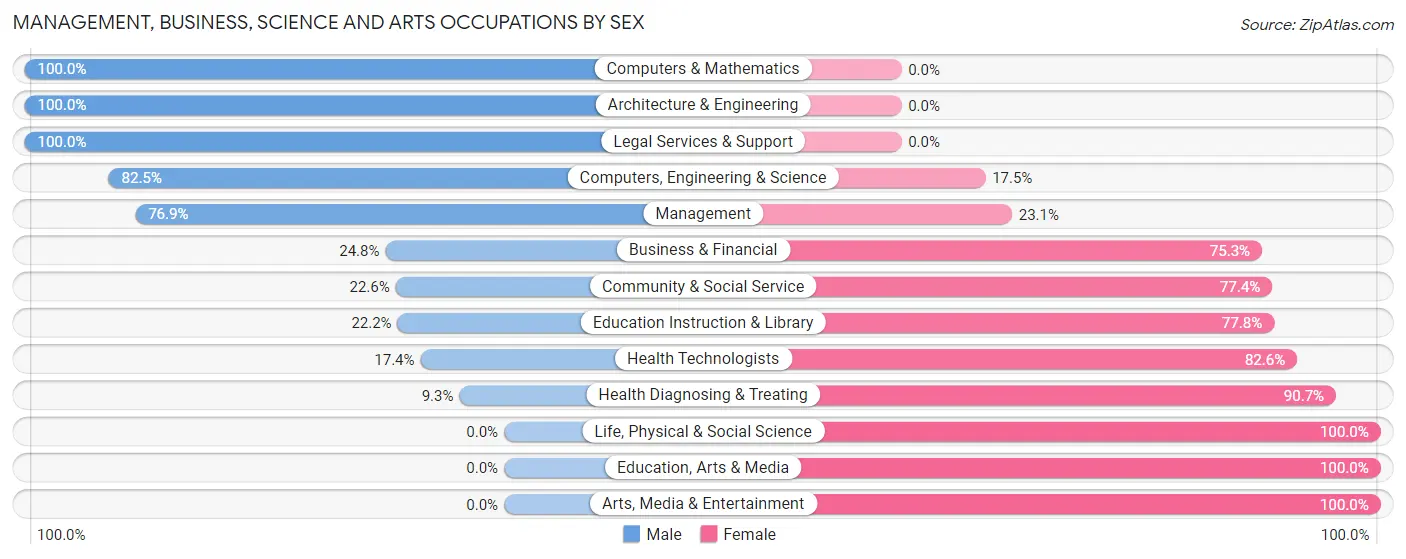
Management, Business, Science and Arts Occupations by Sex
Within the Management, Business, Science and Arts occupations in Whitesboro, the most male-oriented occupations are Computers & Mathematics (100.0%), Architecture & Engineering (100.0%), and Legal Services & Support (100.0%), while the most female-oriented occupations are Life, Physical & Social Science (100.0%), Education, Arts & Media (100.0%), and Arts, Media & Entertainment (100.0%).
| Occupation | Male | Female |
| Management | 60 (76.9%) | 18 (23.1%) |
| Business & Financial | 25 (24.7%) | 76 (75.2%) |
| Computers, Engineering & Science | 80 (82.5%) | 17 (17.5%) |
| Computers & Mathematics | 61 (100.0%) | 0 (0.0%) |
| Architecture & Engineering | 19 (100.0%) | 0 (0.0%) |
| Life, Physical & Social Science | 0 (0.0%) | 17 (100.0%) |
| Community & Social Service | 69 (22.6%) | 236 (77.4%) |
| Education, Arts & Media | 0 (0.0%) | 28 (100.0%) |
| Legal Services & Support | 43 (100.0%) | 0 (0.0%) |
| Education Instruction & Library | 26 (22.2%) | 91 (77.8%) |
| Arts, Media & Entertainment | 0 (0.0%) | 117 (100.0%) |
| Health Diagnosing & Treating | 15 (9.3%) | 146 (90.7%) |
| Health Technologists | 15 (17.4%) | 71 (82.6%) |
| Total (Category) | 249 (33.6%) | 493 (66.4%) |
| Total (Overall) | 649 (36.5%) | 1,131 (63.5%) |
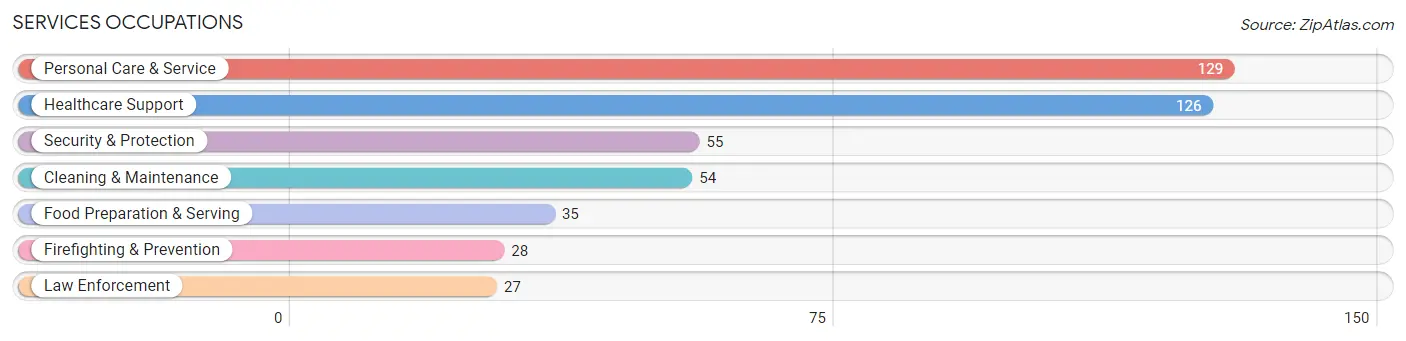
Services Occupations
The most common Services occupations in Whitesboro are Personal Care & Service (129 | 7.2%), Healthcare Support (126 | 7.1%), Security & Protection (55 | 3.1%), Cleaning & Maintenance (54 | 3.0%), and Food Preparation & Serving (35 | 2.0%).
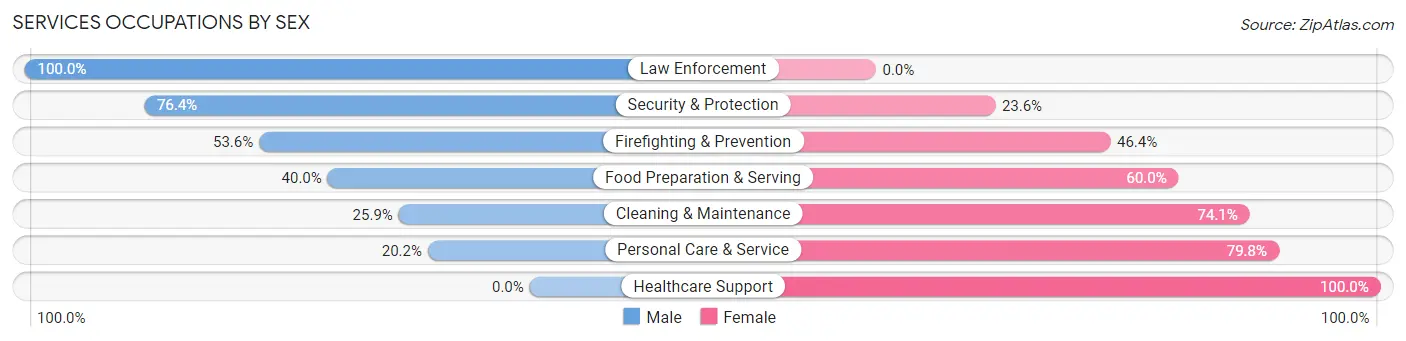
Services Occupations by Sex
Within the Services occupations in Whitesboro, the most male-oriented occupations are Law Enforcement (100.0%), Security & Protection (76.4%), and Firefighting & Prevention (53.6%), while the most female-oriented occupations are Healthcare Support (100.0%), Personal Care & Service (79.8%), and Cleaning & Maintenance (74.1%).
| Occupation | Male | Female |
| Healthcare Support | 0 (0.0%) | 126 (100.0%) |
| Security & Protection | 42 (76.4%) | 13 (23.6%) |
| Firefighting & Prevention | 15 (53.6%) | 13 (46.4%) |
| Law Enforcement | 27 (100.0%) | 0 (0.0%) |
| Food Preparation & Serving | 14 (40.0%) | 21 (60.0%) |
| Cleaning & Maintenance | 14 (25.9%) | 40 (74.1%) |
| Personal Care & Service | 26 (20.2%) | 103 (79.8%) |
| Total (Category) | 96 (24.1%) | 303 (75.9%) |
| Total (Overall) | 649 (36.5%) | 1,131 (63.5%) |
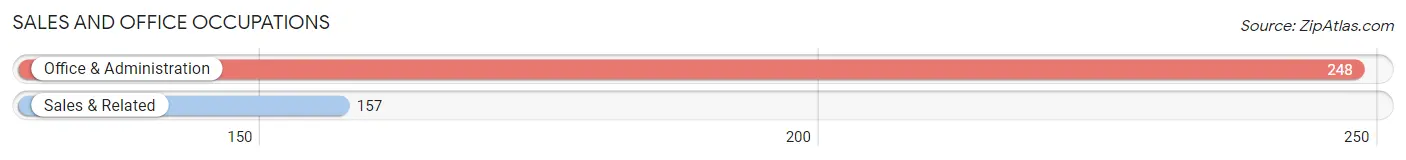
Sales and Office Occupations
The most common Sales and Office occupations in Whitesboro are Office & Administration (248 | 13.9%), and Sales & Related (157 | 8.8%).
Sales and Office Occupations by Sex
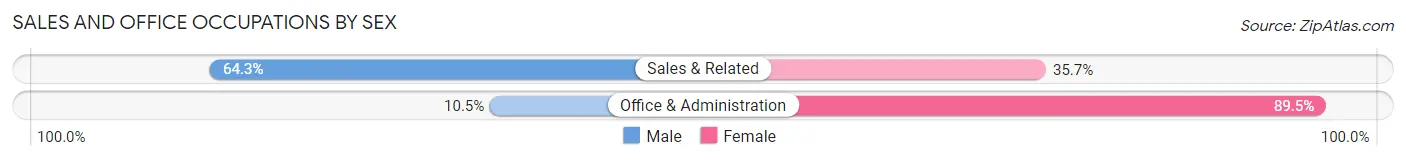
| Occupation | Male | Female |
| Sales & Related | 101 (64.3%) | 56 (35.7%) |
| Office & Administration | 26 (10.5%) | 222 (89.5%) |
| Total (Category) | 127 (31.4%) | 278 (68.6%) |
| Total (Overall) | 649 (36.5%) | 1,131 (63.5%) |
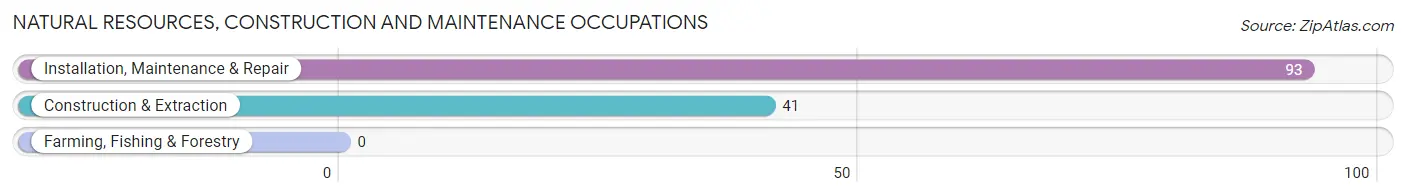
Natural Resources, Construction and Maintenance Occupations
The most common Natural Resources, Construction and Maintenance occupations in Whitesboro are Installation, Maintenance & Repair (93 | 5.2%), and Construction & Extraction (41 | 2.3%).
Natural Resources, Construction and Maintenance Occupations by Sex
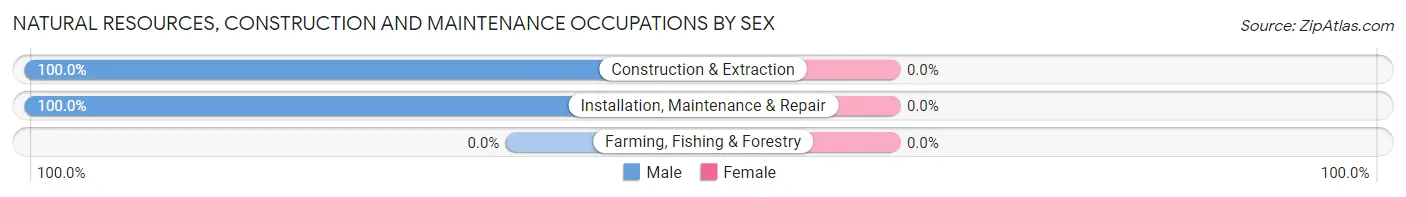
| Occupation | Male | Female |
| Farming, Fishing & Forestry | 0 (0.0%) | 0 (0.0%) |
| Construction & Extraction | 41 (100.0%) | 0 (0.0%) |
| Installation, Maintenance & Repair | 93 (100.0%) | 0 (0.0%) |
| Total (Category) | 134 (100.0%) | 0 (0.0%) |
| Total (Overall) | 649 (36.5%) | 1,131 (63.5%) |
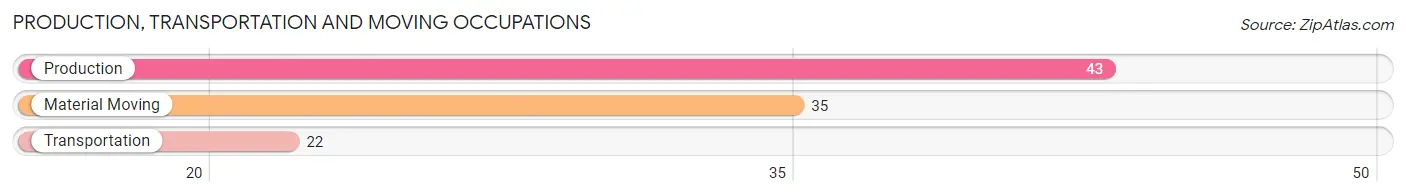
Production, Transportation and Moving Occupations
The most common Production, Transportation and Moving occupations in Whitesboro are Production (43 | 2.4%), Material Moving (35 | 2.0%), and Transportation (22 | 1.2%).
Production, Transportation and Moving Occupations by Sex
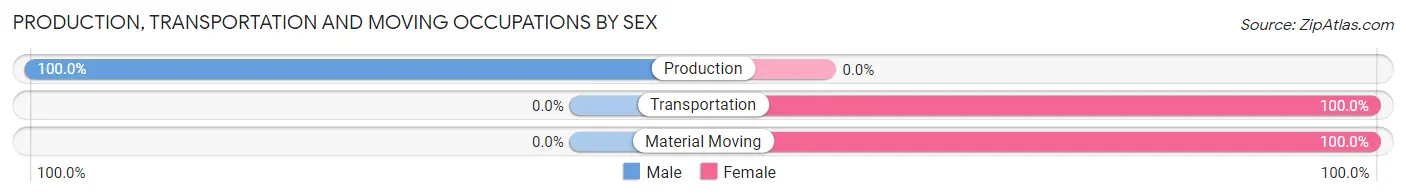
| Occupation | Male | Female |
| Production | 43 (100.0%) | 0 (0.0%) |
| Transportation | 0 (0.0%) | 22 (100.0%) |
| Material Moving | 0 (0.0%) | 35 (100.0%) |
| Total (Category) | 43 (43.0%) | 57 (57.0%) |
| Total (Overall) | 649 (36.5%) | 1,131 (63.5%) |
Employment Industries by Sex in Whitesboro
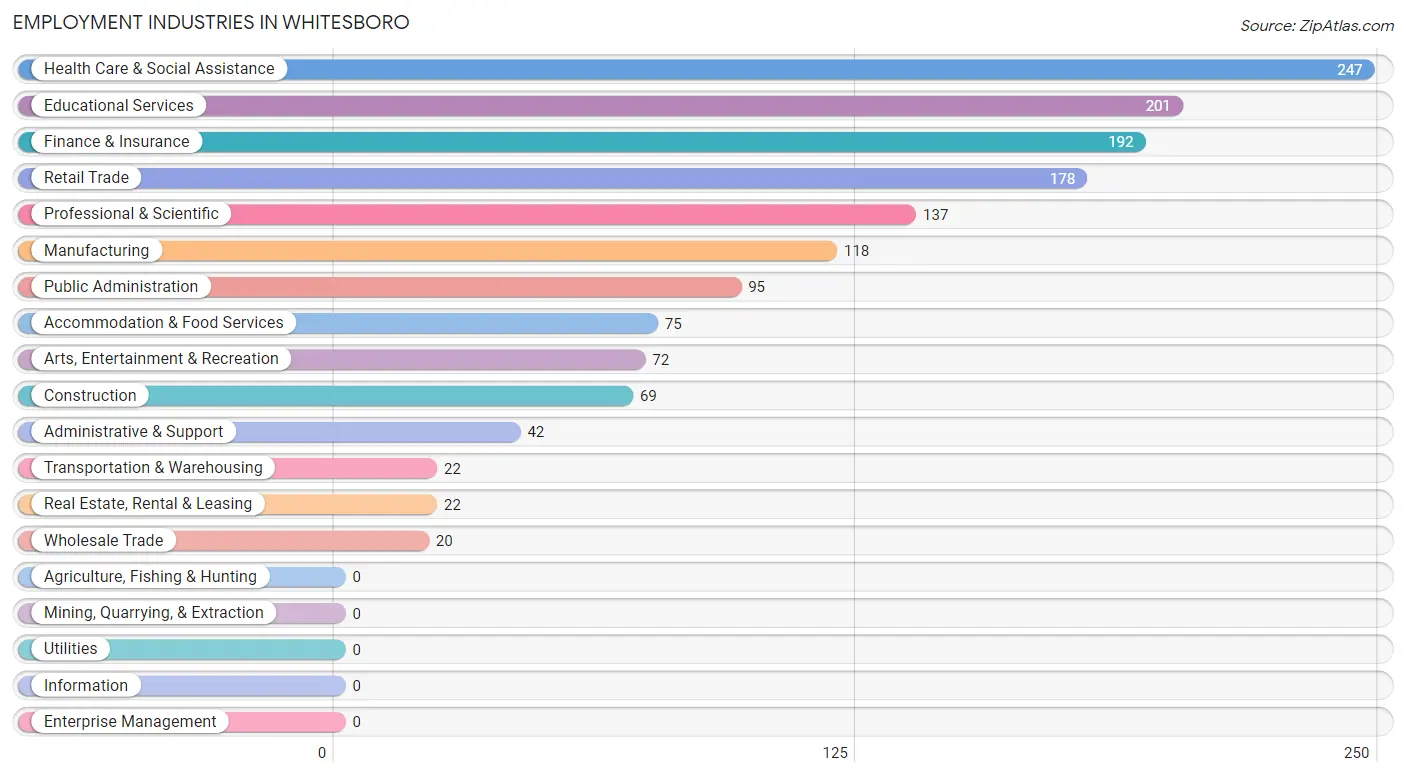
Employment Industries in Whitesboro
The major employment industries in Whitesboro include Health Care & Social Assistance (247 | 13.9%), Educational Services (201 | 11.3%), Finance & Insurance (192 | 10.8%), Retail Trade (178 | 10.0%), and Professional & Scientific (137 | 7.7%).
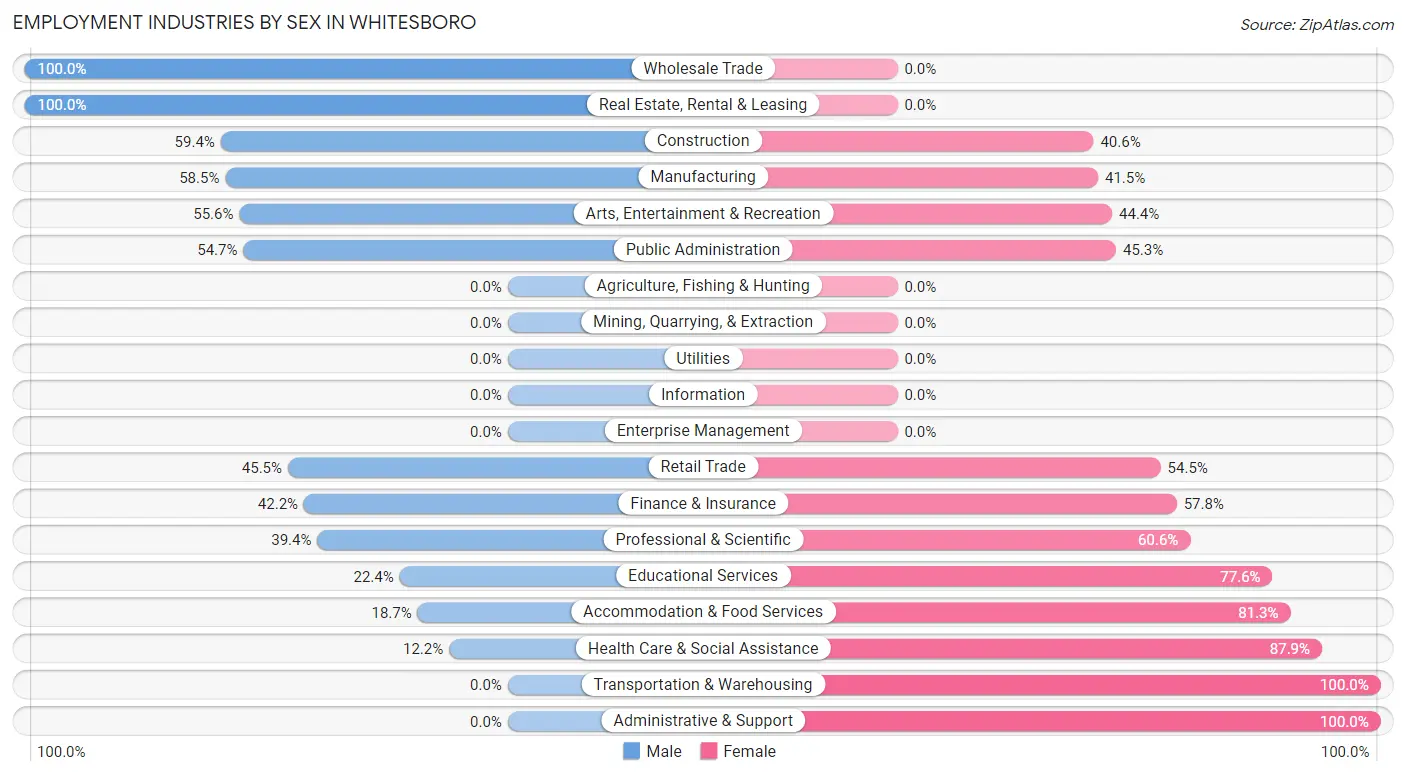
Employment Industries by Sex in Whitesboro
The Whitesboro industries that see more men than women are Wholesale Trade (100.0%), Real Estate, Rental & Leasing (100.0%), and Construction (59.4%), whereas the industries that tend to have a higher number of women are Transportation & Warehousing (100.0%), Administrative & Support (100.0%), and Health Care & Social Assistance (87.8%).
| Industry | Male | Female |
| Agriculture, Fishing & Hunting | 0 (0.0%) | 0 (0.0%) |
| Mining, Quarrying, & Extraction | 0 (0.0%) | 0 (0.0%) |
| Construction | 41 (59.4%) | 28 (40.6%) |
| Manufacturing | 69 (58.5%) | 49 (41.5%) |
| Wholesale Trade | 20 (100.0%) | 0 (0.0%) |
| Retail Trade | 81 (45.5%) | 97 (54.5%) |
| Transportation & Warehousing | 0 (0.0%) | 22 (100.0%) |
| Utilities | 0 (0.0%) | 0 (0.0%) |
| Information | 0 (0.0%) | 0 (0.0%) |
| Finance & Insurance | 81 (42.2%) | 111 (57.8%) |
| Real Estate, Rental & Leasing | 22 (100.0%) | 0 (0.0%) |
| Professional & Scientific | 54 (39.4%) | 83 (60.6%) |
| Enterprise Management | 0 (0.0%) | 0 (0.0%) |
| Administrative & Support | 0 (0.0%) | 42 (100.0%) |
| Educational Services | 45 (22.4%) | 156 (77.6%) |
| Health Care & Social Assistance | 30 (12.1%) | 217 (87.8%) |
| Arts, Entertainment & Recreation | 40 (55.6%) | 32 (44.4%) |
| Accommodation & Food Services | 14 (18.7%) | 61 (81.3%) |
| Public Administration | 52 (54.7%) | 43 (45.3%) |
| Total | 649 (36.5%) | 1,131 (63.5%) |
Education in Whitesboro
School Enrollment in Whitesboro
The most common levels of schooling among the 629 students in Whitesboro are high school (204 | 32.4%), elementary school (197 | 31.3%), and middle school (112 | 17.8%).
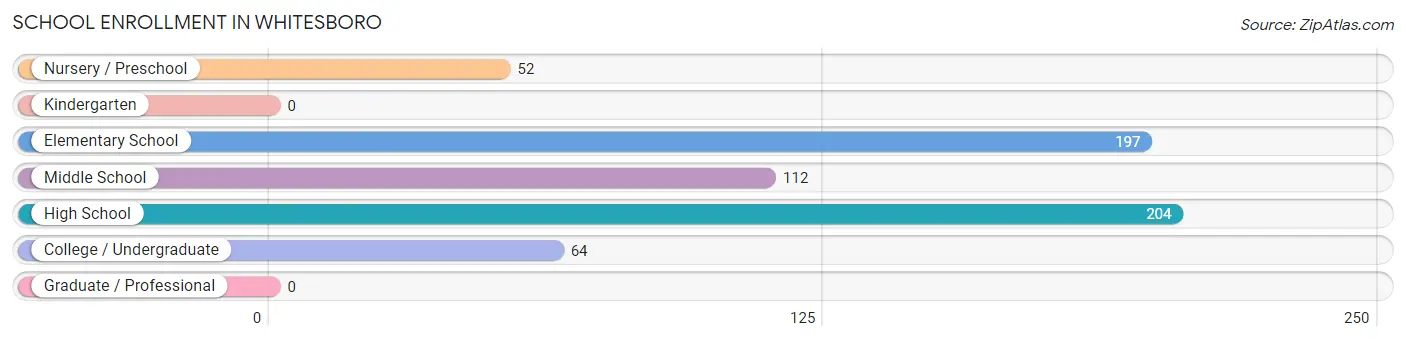
| School Level | # Students | % Students |
| Nursery / Preschool | 52 | 8.3% |
| Kindergarten | 0 | 0.0% |
| Elementary School | 197 | 31.3% |
| Middle School | 112 | 17.8% |
| High School | 204 | 32.4% |
| College / Undergraduate | 64 | 10.2% |
| Graduate / Professional | 0 | 0.0% |
| Total | 629 | 100.0% |
School Enrollment by Age by Funding Source in Whitesboro
Out of a total of 629 students who are enrolled in schools in Whitesboro, 84 (13.4%) attend a private institution, while the remaining 545 (86.6%) are enrolled in public schools. The age group of 18 to 19 year olds has the highest likelihood of being enrolled in private schools, with 13 (52.0% in the age bracket) enrolled. Conversely, the age group of 10 to 14 year olds has the lowest likelihood of being enrolled in a private school, with 142 (100.0% in the age bracket) attending a public institution.
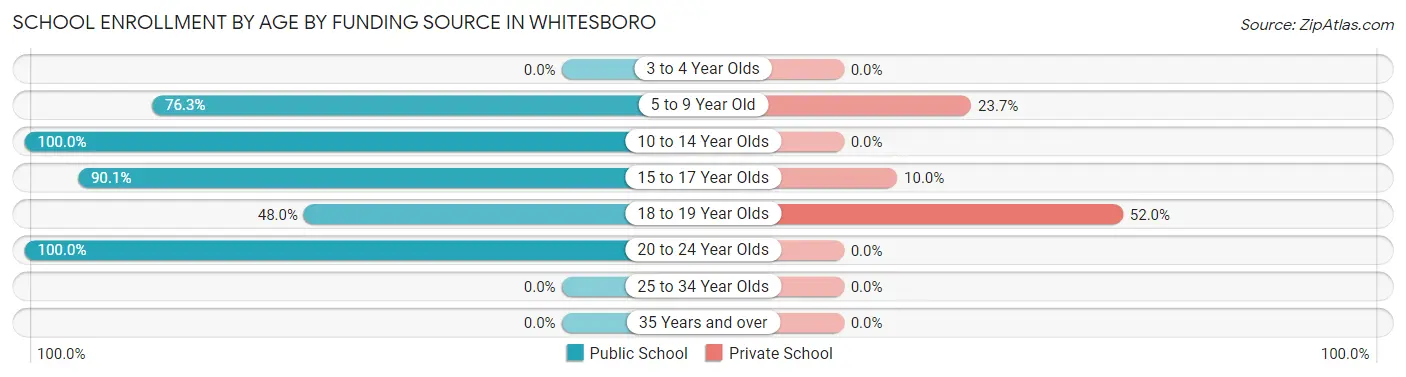
| Age Bracket | Public School | Private School |
| 3 to 4 Year Olds | 0 (0.0%) | 0 (0.0%) |
| 5 to 9 Year Old | 167 (76.3%) | 52 (23.7%) |
| 10 to 14 Year Olds | 142 (100.0%) | 0 (0.0%) |
| 15 to 17 Year Olds | 172 (90.0%) | 19 (10.0%) |
| 18 to 19 Year Olds | 12 (48.0%) | 13 (52.0%) |
| 20 to 24 Year Olds | 52 (100.0%) | 0 (0.0%) |
| 25 to 34 Year Olds | 0 (0.0%) | 0 (0.0%) |
| 35 Years and over | 0 (0.0%) | 0 (0.0%) |
| Total | 545 (86.6%) | 84 (13.4%) |
Educational Attainment by Field of Study in Whitesboro
Psychology (161 | 17.2%), liberal arts & history (149 | 15.9%), visual & performing arts (147 | 15.7%), computers & mathematics (114 | 12.1%), and science & technology (99 | 10.5%) are the most common fields of study among 939 individuals in Whitesboro who have obtained a bachelor's degree or higher.
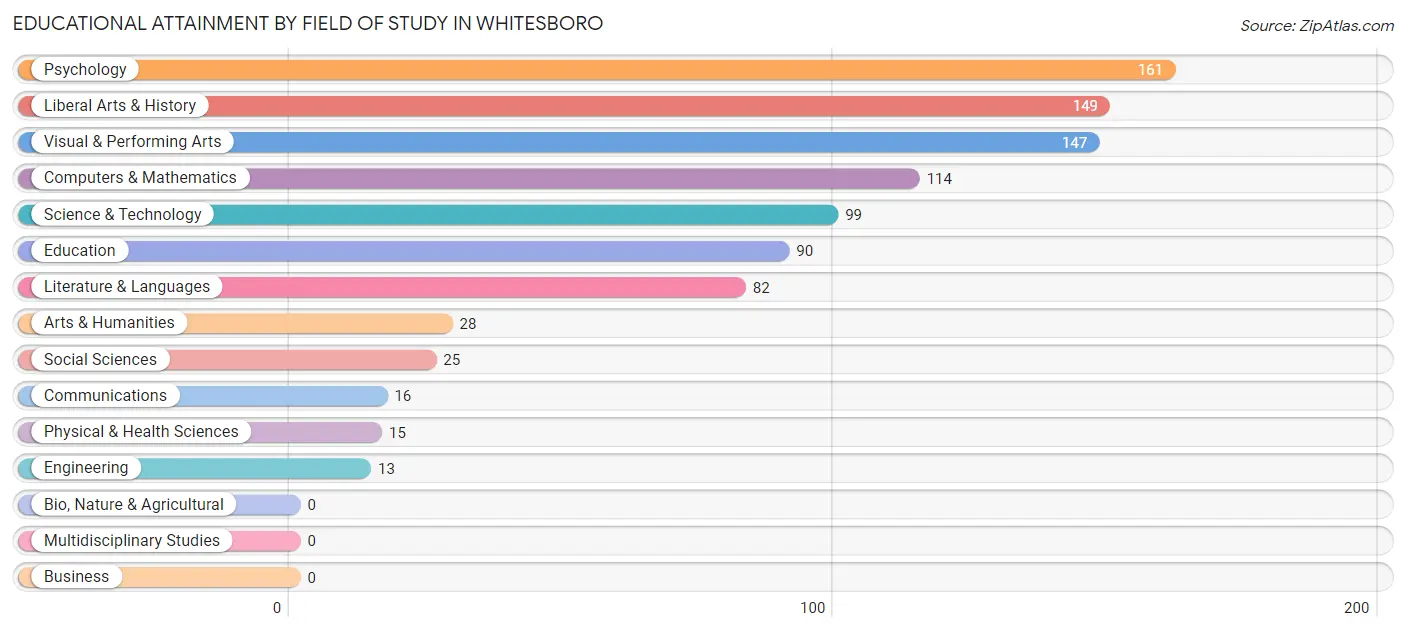
| Field of Study | # Graduates | % Graduates |
| Computers & Mathematics | 114 | 12.1% |
| Bio, Nature & Agricultural | 0 | 0.0% |
| Physical & Health Sciences | 15 | 1.6% |
| Psychology | 161 | 17.2% |
| Social Sciences | 25 | 2.7% |
| Engineering | 13 | 1.4% |
| Multidisciplinary Studies | 0 | 0.0% |
| Science & Technology | 99 | 10.5% |
| Business | 0 | 0.0% |
| Education | 90 | 9.6% |
| Literature & Languages | 82 | 8.7% |
| Liberal Arts & History | 149 | 15.9% |
| Visual & Performing Arts | 147 | 15.7% |
| Communications | 16 | 1.7% |
| Arts & Humanities | 28 | 3.0% |
| Total | 939 | 100.0% |
Transportation & Commute in Whitesboro
Vehicle Availability by Sex in Whitesboro
The most prevalent vehicle ownership categories in Whitesboro are males with 2 vehicles (295, accounting for 47.7%) and females with 2 vehicles (464, making up 26.5%).
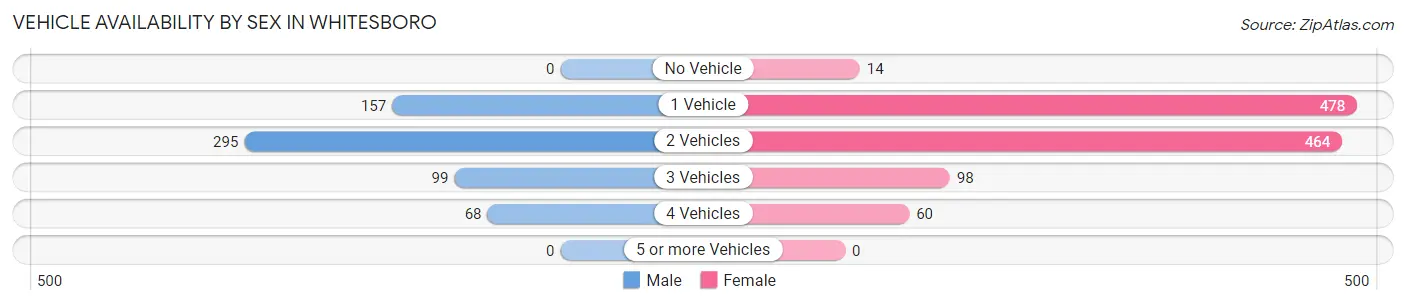
| Vehicles Available | Male | Female |
| No Vehicle | 0 (0.0%) | 14 (1.3%) |
| 1 Vehicle | 157 (25.4%) | 478 (42.9%) |
| 2 Vehicles | 295 (47.7%) | 464 (41.6%) |
| 3 Vehicles | 99 (16.0%) | 98 (8.8%) |
| 4 Vehicles | 68 (11.0%) | 60 (5.4%) |
| 5 or more Vehicles | 0 (0.0%) | 0 (0.0%) |
| Total | 619 (100.0%) | 1,114 (100.0%) |
Commute Time in Whitesboro
The most frequently occuring commute durations in Whitesboro are 15 to 19 minutes (512 commuters, 32.0%), 10 to 14 minutes (360 commuters, 22.5%), and 5 to 9 minutes (267 commuters, 16.7%).
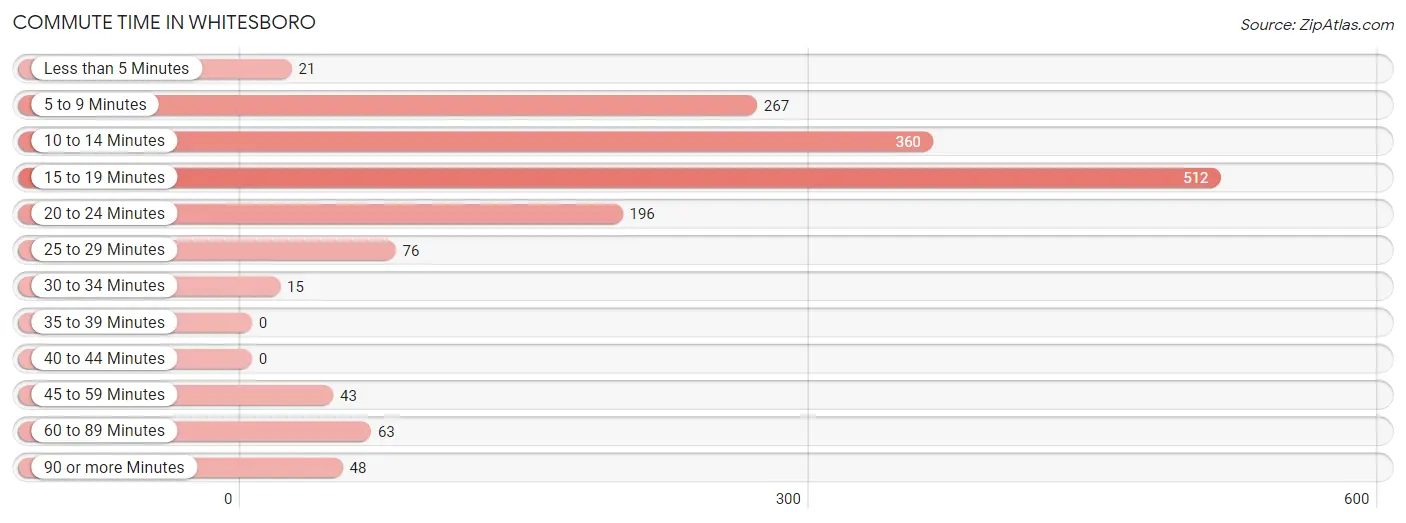
| Commute Time | # Commuters | % Commuters |
| Less than 5 Minutes | 21 | 1.3% |
| 5 to 9 Minutes | 267 | 16.7% |
| 10 to 14 Minutes | 360 | 22.5% |
| 15 to 19 Minutes | 512 | 32.0% |
| 20 to 24 Minutes | 196 | 12.2% |
| 25 to 29 Minutes | 76 | 4.8% |
| 30 to 34 Minutes | 15 | 0.9% |
| 35 to 39 Minutes | 0 | 0.0% |
| 40 to 44 Minutes | 0 | 0.0% |
| 45 to 59 Minutes | 43 | 2.7% |
| 60 to 89 Minutes | 63 | 3.9% |
| 90 or more Minutes | 48 | 3.0% |
Commute Time by Sex in Whitesboro
The most common commute times in Whitesboro are 15 to 19 minutes (155 commuters, 26.8%) for males and 15 to 19 minutes (357 commuters, 34.9%) for females.
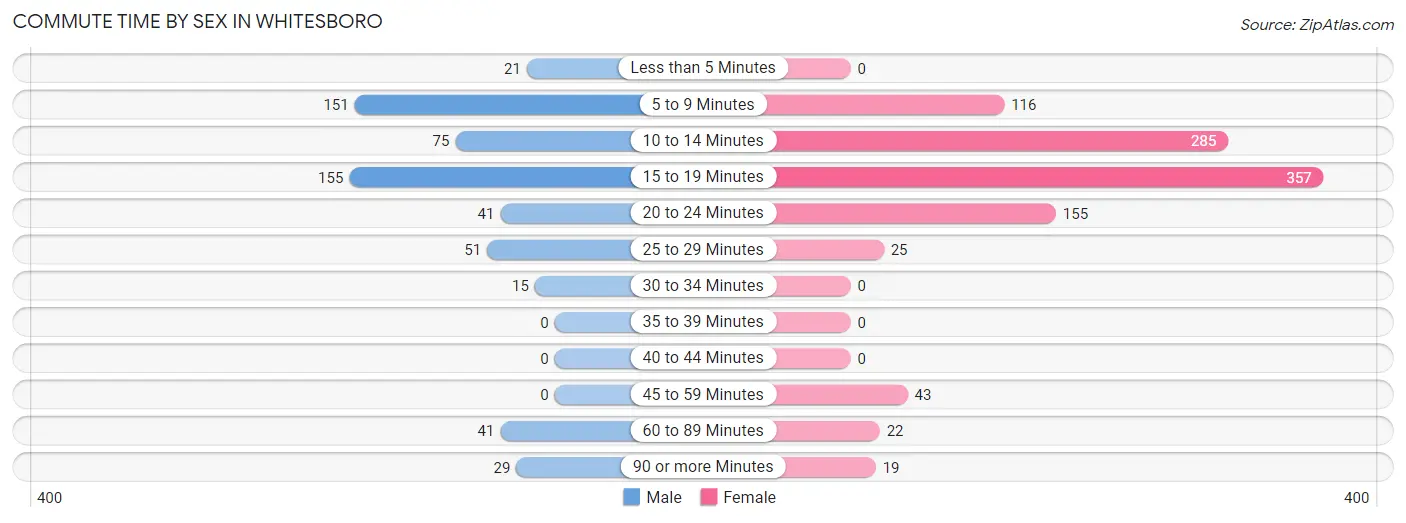
| Commute Time | Male | Female |
| Less than 5 Minutes | 21 (3.6%) | 0 (0.0%) |
| 5 to 9 Minutes | 151 (26.1%) | 116 (11.4%) |
| 10 to 14 Minutes | 75 (13.0%) | 285 (27.9%) |
| 15 to 19 Minutes | 155 (26.8%) | 357 (34.9%) |
| 20 to 24 Minutes | 41 (7.1%) | 155 (15.2%) |
| 25 to 29 Minutes | 51 (8.8%) | 25 (2.5%) |
| 30 to 34 Minutes | 15 (2.6%) | 0 (0.0%) |
| 35 to 39 Minutes | 0 (0.0%) | 0 (0.0%) |
| 40 to 44 Minutes | 0 (0.0%) | 0 (0.0%) |
| 45 to 59 Minutes | 0 (0.0%) | 43 (4.2%) |
| 60 to 89 Minutes | 41 (7.1%) | 22 (2.1%) |
| 90 or more Minutes | 29 (5.0%) | 19 (1.9%) |
Time of Departure to Work by Sex in Whitesboro
The most frequent times of departure to work in Whitesboro are 8:00 AM to 8:29 AM (145, 25.0%) for males and 7:30 AM to 7:59 AM (253, 24.8%) for females.
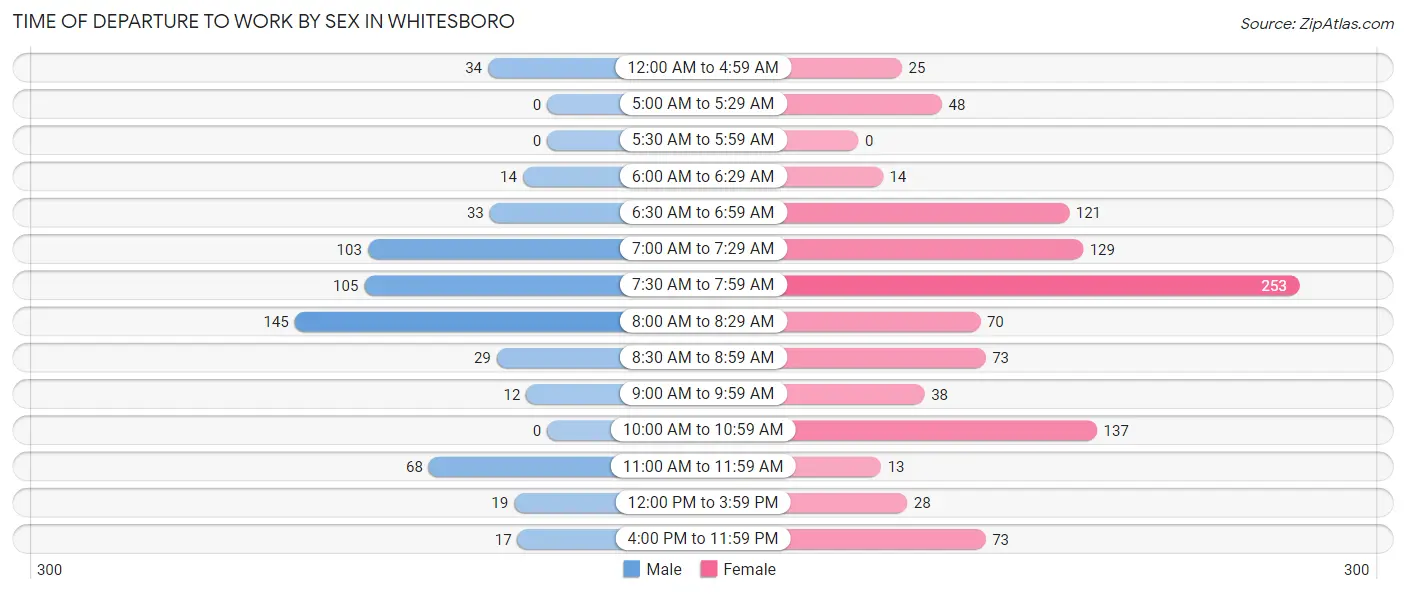
| Time of Departure | Male | Female |
| 12:00 AM to 4:59 AM | 34 (5.9%) | 25 (2.5%) |
| 5:00 AM to 5:29 AM | 0 (0.0%) | 48 (4.7%) |
| 5:30 AM to 5:59 AM | 0 (0.0%) | 0 (0.0%) |
| 6:00 AM to 6:29 AM | 14 (2.4%) | 14 (1.4%) |
| 6:30 AM to 6:59 AM | 33 (5.7%) | 121 (11.8%) |
| 7:00 AM to 7:29 AM | 103 (17.8%) | 129 (12.6%) |
| 7:30 AM to 7:59 AM | 105 (18.1%) | 253 (24.8%) |
| 8:00 AM to 8:29 AM | 145 (25.0%) | 70 (6.9%) |
| 8:30 AM to 8:59 AM | 29 (5.0%) | 73 (7.1%) |
| 9:00 AM to 9:59 AM | 12 (2.1%) | 38 (3.7%) |
| 10:00 AM to 10:59 AM | 0 (0.0%) | 137 (13.4%) |
| 11:00 AM to 11:59 AM | 68 (11.7%) | 13 (1.3%) |
| 12:00 PM to 3:59 PM | 19 (3.3%) | 28 (2.7%) |
| 4:00 PM to 11:59 PM | 17 (2.9%) | 73 (7.1%) |
| Total | 579 (100.0%) | 1,022 (100.0%) |
Housing Occupancy in Whitesboro
Occupancy by Ownership in Whitesboro
Of the total 1,643 dwellings in Whitesboro, owner-occupied units account for 977 (59.5%), while renter-occupied units make up 666 (40.5%).
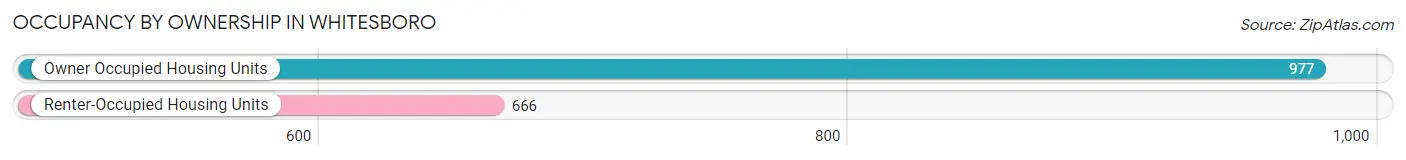
| Occupancy | # Housing Units | % Housing Units |
| Owner Occupied Housing Units | 977 | 59.5% |
| Renter-Occupied Housing Units | 666 | 40.5% |
| Total Occupied Housing Units | 1,643 | 100.0% |
Occupancy by Household Size in Whitesboro
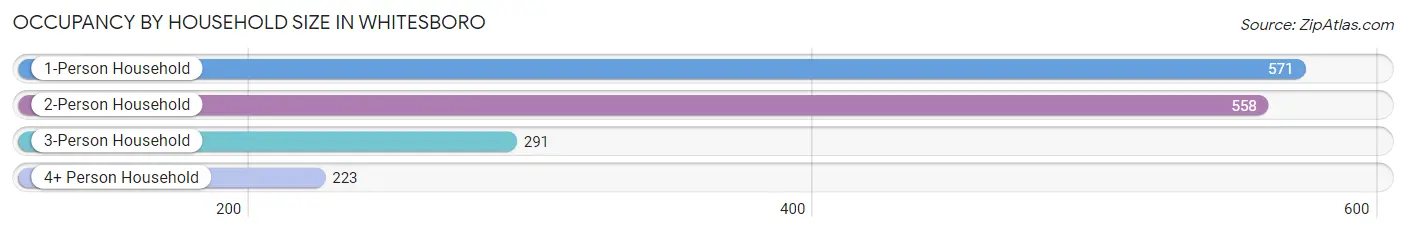
| Household Size | # Housing Units | % Housing Units |
| 1-Person Household | 571 | 34.7% |
| 2-Person Household | 558 | 34.0% |
| 3-Person Household | 291 | 17.7% |
| 4+ Person Household | 223 | 13.6% |
| Total Housing Units | 1,643 | 100.0% |
Occupancy by Ownership by Household Size in Whitesboro
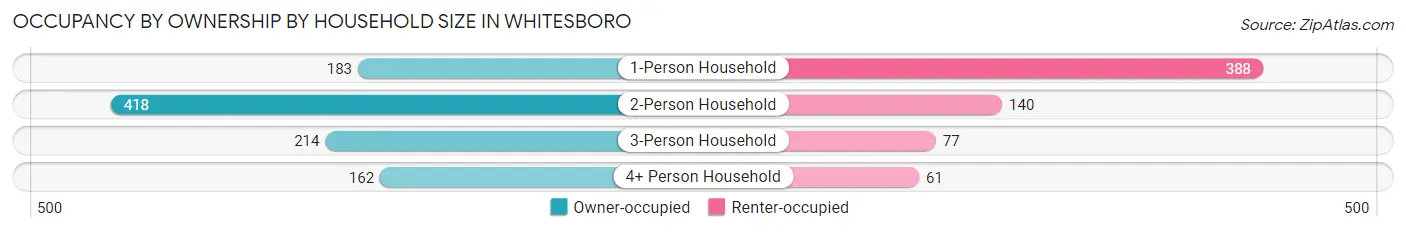
| Household Size | Owner-occupied | Renter-occupied |
| 1-Person Household | 183 (32.1%) | 388 (67.9%) |
| 2-Person Household | 418 (74.9%) | 140 (25.1%) |
| 3-Person Household | 214 (73.5%) | 77 (26.5%) |
| 4+ Person Household | 162 (72.7%) | 61 (27.4%) |
| Total Housing Units | 977 (59.5%) | 666 (40.5%) |
Occupancy by Educational Attainment in Whitesboro
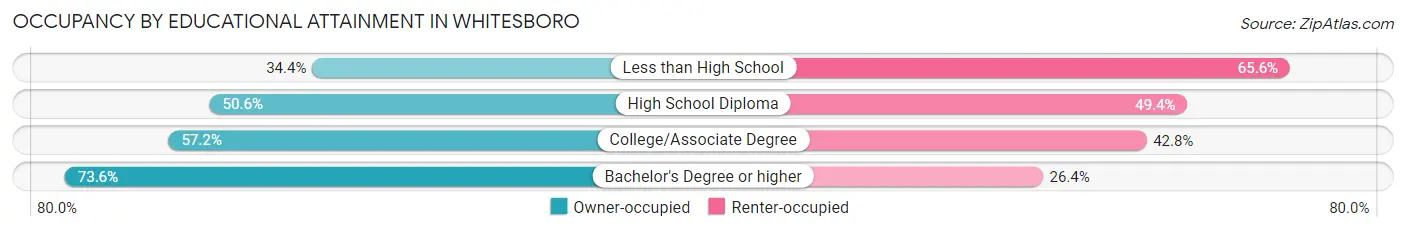
| Household Size | Owner-occupied | Renter-occupied |
| Less than High School | 22 (34.4%) | 42 (65.6%) |
| High School Diploma | 237 (50.6%) | 231 (49.4%) |
| College/Associate Degree | 347 (57.2%) | 260 (42.8%) |
| Bachelor's Degree or higher | 371 (73.6%) | 133 (26.4%) |
Occupancy by Age of Householder in Whitesboro
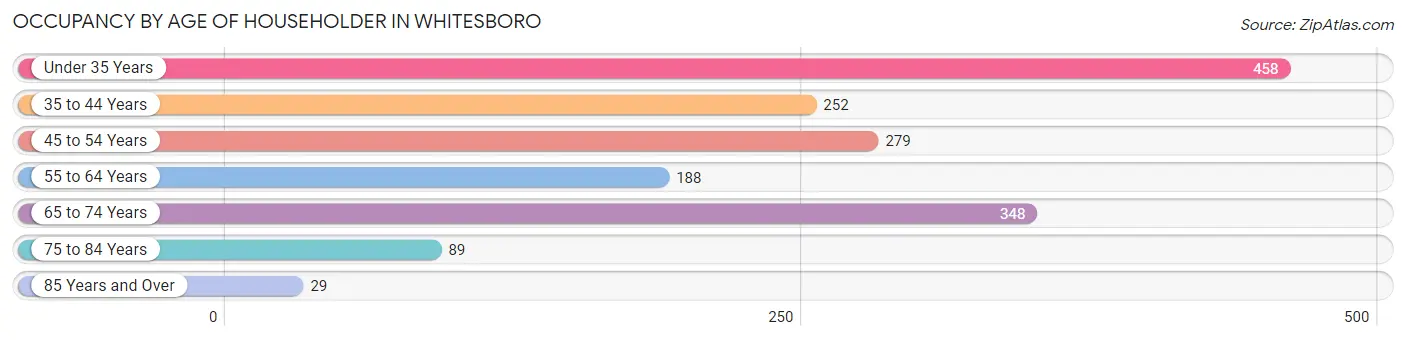
| Age Bracket | # Households | % Households |
| Under 35 Years | 458 | 27.9% |
| 35 to 44 Years | 252 | 15.3% |
| 45 to 54 Years | 279 | 17.0% |
| 55 to 64 Years | 188 | 11.4% |
| 65 to 74 Years | 348 | 21.2% |
| 75 to 84 Years | 89 | 5.4% |
| 85 Years and Over | 29 | 1.8% |
| Total | 1,643 | 100.0% |
Housing Finances in Whitesboro
Median Income by Occupancy in Whitesboro
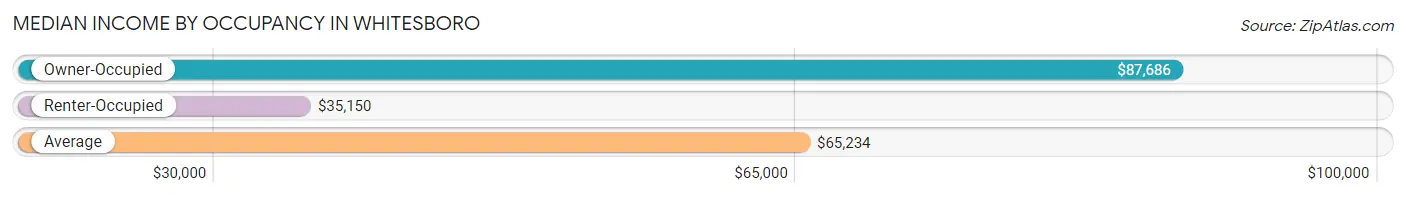
| Occupancy Type | # Households | Median Income |
| Owner-Occupied | 977 (59.5%) | $87,686 |
| Renter-Occupied | 666 (40.5%) | $35,150 |
| Average | 1,643 (100.0%) | $65,234 |
Occupancy by Householder Income Bracket in Whitesboro
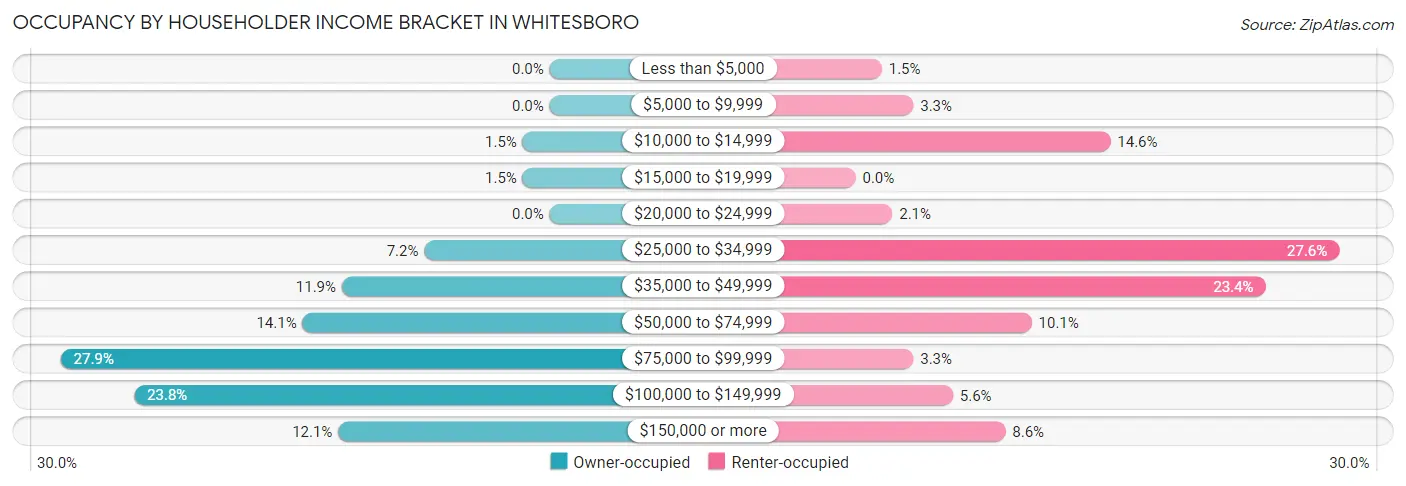
| Income Bracket | Owner-occupied | Renter-occupied |
| Less than $5,000 | 0 (0.0%) | 10 (1.5%) |
| $5,000 to $9,999 | 0 (0.0%) | 22 (3.3%) |
| $10,000 to $14,999 | 15 (1.5%) | 97 (14.6%) |
| $15,000 to $19,999 | 15 (1.5%) | 0 (0.0%) |
| $20,000 to $24,999 | 0 (0.0%) | 14 (2.1%) |
| $25,000 to $34,999 | 70 (7.2%) | 184 (27.6%) |
| $35,000 to $49,999 | 116 (11.9%) | 156 (23.4%) |
| $50,000 to $74,999 | 138 (14.1%) | 67 (10.1%) |
| $75,000 to $99,999 | 273 (27.9%) | 22 (3.3%) |
| $100,000 to $149,999 | 232 (23.7%) | 37 (5.6%) |
| $150,000 or more | 118 (12.1%) | 57 (8.6%) |
| Total | 977 (100.0%) | 666 (100.0%) |
Monthly Housing Cost Tiers in Whitesboro
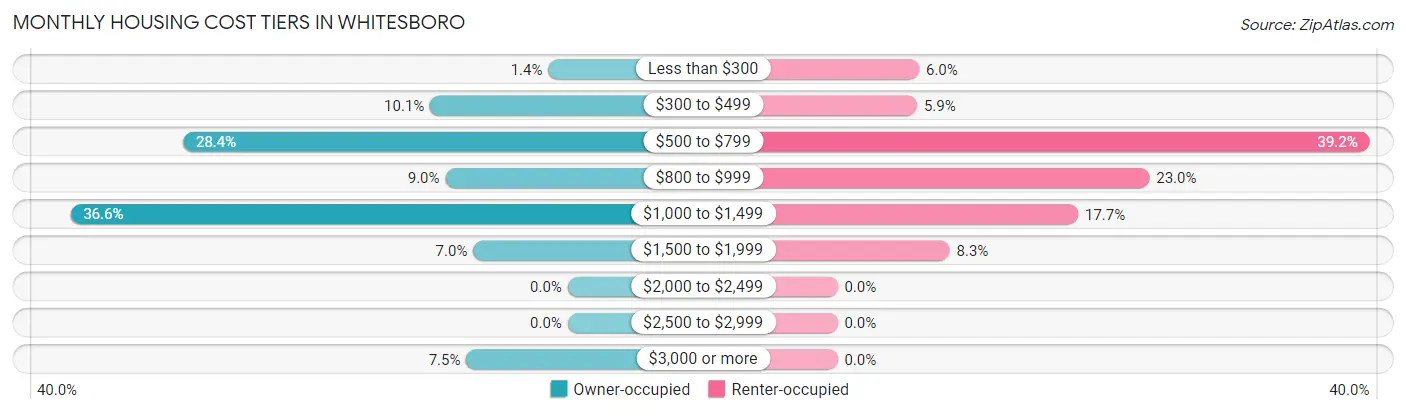
| Monthly Cost | Owner-occupied | Renter-occupied |
| Less than $300 | 14 (1.4%) | 40 (6.0%) |
| $300 to $499 | 99 (10.1%) | 39 (5.9%) |
| $500 to $799 | 277 (28.3%) | 261 (39.2%) |
| $800 to $999 | 88 (9.0%) | 153 (23.0%) |
| $1,000 to $1,499 | 358 (36.6%) | 118 (17.7%) |
| $1,500 to $1,999 | 68 (7.0%) | 55 (8.3%) |
| $2,000 to $2,499 | 0 (0.0%) | 0 (0.0%) |
| $2,500 to $2,999 | 0 (0.0%) | 0 (0.0%) |
| $3,000 or more | 73 (7.5%) | 0 (0.0%) |
| Total | 977 (100.0%) | 666 (100.0%) |
Physical Housing Characteristics in Whitesboro
Housing Structures in Whitesboro
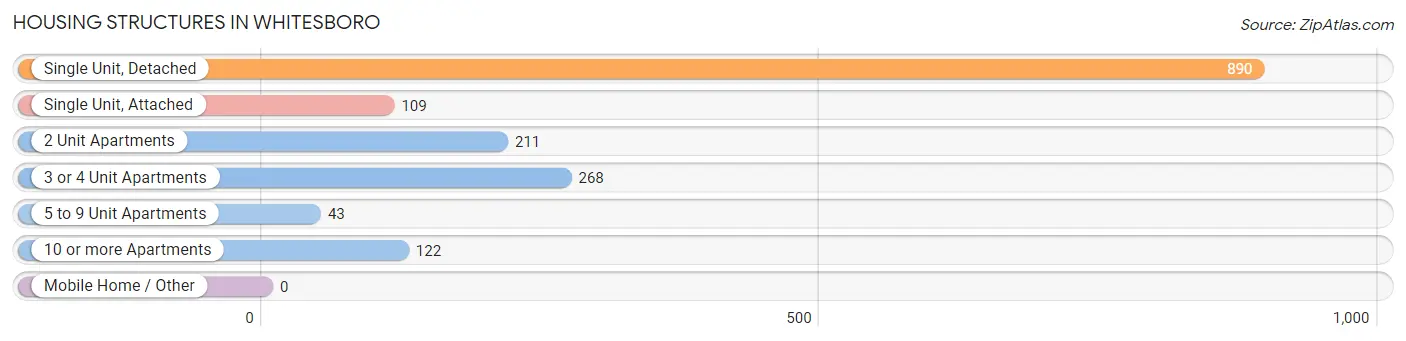
| Structure Type | # Housing Units | % Housing Units |
| Single Unit, Detached | 890 | 54.2% |
| Single Unit, Attached | 109 | 6.6% |
| 2 Unit Apartments | 211 | 12.8% |
| 3 or 4 Unit Apartments | 268 | 16.3% |
| 5 to 9 Unit Apartments | 43 | 2.6% |
| 10 or more Apartments | 122 | 7.4% |
| Mobile Home / Other | 0 | 0.0% |
| Total | 1,643 | 100.0% |
Housing Structures by Occupancy in Whitesboro
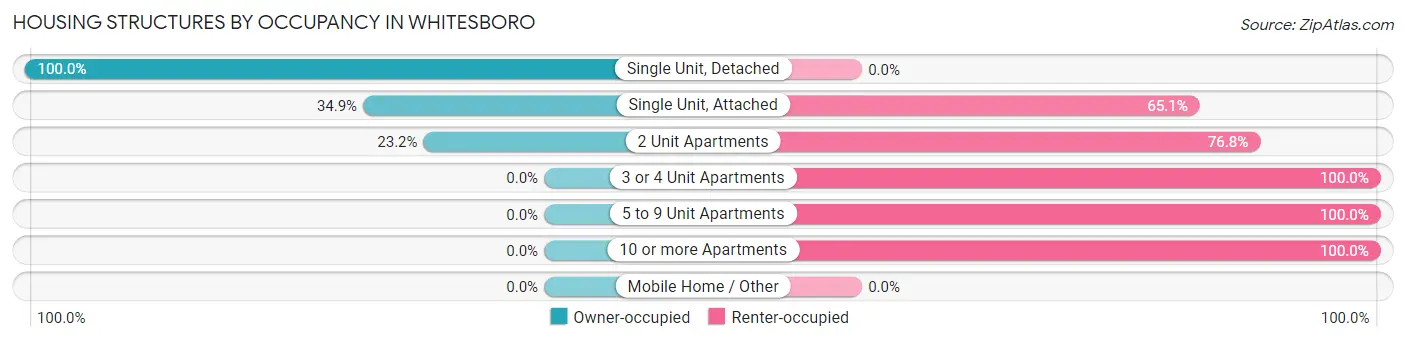
| Structure Type | Owner-occupied | Renter-occupied |
| Single Unit, Detached | 890 (100.0%) | 0 (0.0%) |
| Single Unit, Attached | 38 (34.9%) | 71 (65.1%) |
| 2 Unit Apartments | 49 (23.2%) | 162 (76.8%) |
| 3 or 4 Unit Apartments | 0 (0.0%) | 268 (100.0%) |
| 5 to 9 Unit Apartments | 0 (0.0%) | 43 (100.0%) |
| 10 or more Apartments | 0 (0.0%) | 122 (100.0%) |
| Mobile Home / Other | 0 (0.0%) | 0 (0.0%) |
| Total | 977 (59.5%) | 666 (40.5%) |
Housing Structures by Number of Rooms in Whitesboro
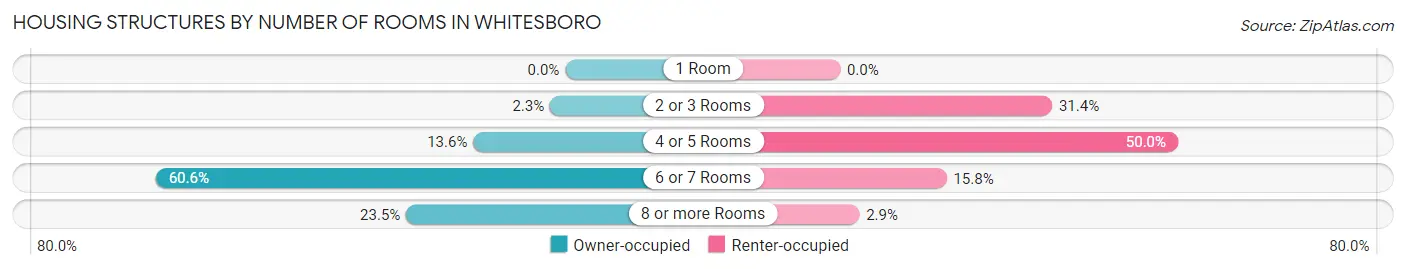
| Number of Rooms | Owner-occupied | Renter-occupied |
| 1 Room | 0 (0.0%) | 0 (0.0%) |
| 2 or 3 Rooms | 22 (2.2%) | 209 (31.4%) |
| 4 or 5 Rooms | 133 (13.6%) | 333 (50.0%) |
| 6 or 7 Rooms | 592 (60.6%) | 105 (15.8%) |
| 8 or more Rooms | 230 (23.5%) | 19 (2.9%) |
| Total | 977 (100.0%) | 666 (100.0%) |
Housing Structure by Heating Type in Whitesboro
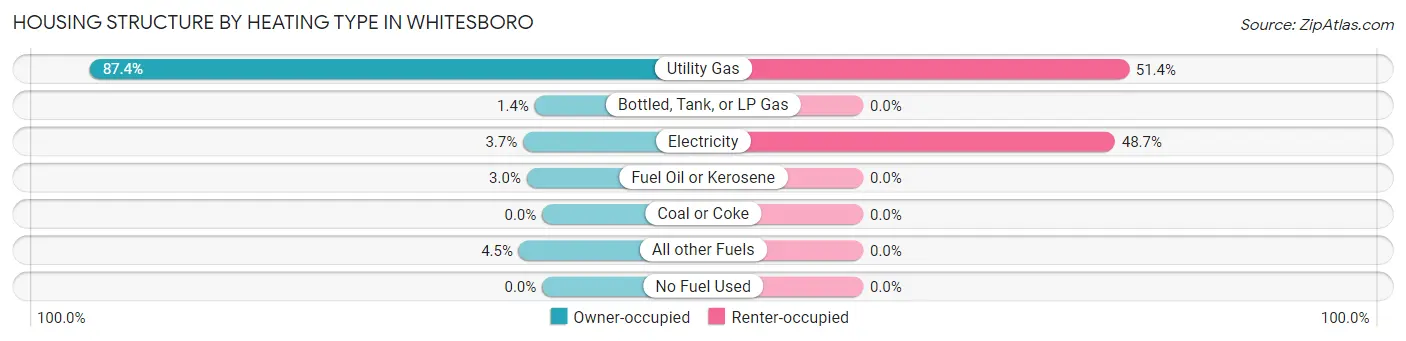
| Heating Type | Owner-occupied | Renter-occupied |
| Utility Gas | 854 (87.4%) | 342 (51.3%) |
| Bottled, Tank, or LP Gas | 14 (1.4%) | 0 (0.0%) |
| Electricity | 36 (3.7%) | 324 (48.6%) |
| Fuel Oil or Kerosene | 29 (3.0%) | 0 (0.0%) |
| Coal or Coke | 0 (0.0%) | 0 (0.0%) |
| All other Fuels | 44 (4.5%) | 0 (0.0%) |
| No Fuel Used | 0 (0.0%) | 0 (0.0%) |
| Total | 977 (100.0%) | 666 (100.0%) |
Household Vehicle Usage in Whitesboro
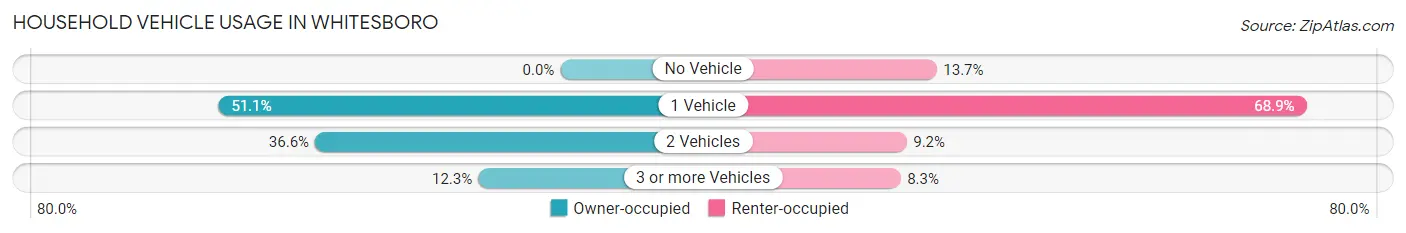
| Vehicles per Household | Owner-occupied | Renter-occupied |
| No Vehicle | 0 (0.0%) | 91 (13.7%) |
| 1 Vehicle | 499 (51.1%) | 459 (68.9%) |
| 2 Vehicles | 358 (36.6%) | 61 (9.2%) |
| 3 or more Vehicles | 120 (12.3%) | 55 (8.3%) |
| Total | 977 (100.0%) | 666 (100.0%) |
Real Estate & Mortgages in Whitesboro
Real Estate and Mortgage Overview in Whitesboro
| Characteristic | Without Mortgage | With Mortgage |
| Housing Units | 395 | 582 |
| Median Property Value | $130,300 | $128,400 |
| Median Household Income | $84,018 | $89 |
| Monthly Housing Costs | $560 | $58 |
| Real Estate Taxes | $2,676 | $48 |
Property Value by Mortgage Status in Whitesboro
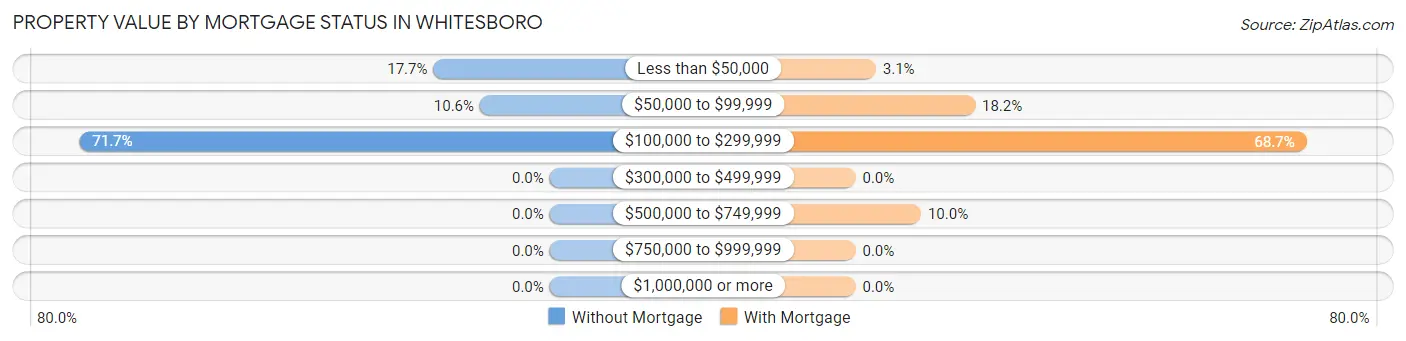
| Property Value | Without Mortgage | With Mortgage |
| Less than $50,000 | 70 (17.7%) | 18 (3.1%) |
| $50,000 to $99,999 | 42 (10.6%) | 106 (18.2%) |
| $100,000 to $299,999 | 283 (71.7%) | 400 (68.7%) |
| $300,000 to $499,999 | 0 (0.0%) | 0 (0.0%) |
| $500,000 to $749,999 | 0 (0.0%) | 58 (10.0%) |
| $750,000 to $999,999 | 0 (0.0%) | 0 (0.0%) |
| $1,000,000 or more | 0 (0.0%) | 0 (0.0%) |
| Total | 395 (100.0%) | 582 (100.0%) |
Household Income by Mortgage Status in Whitesboro
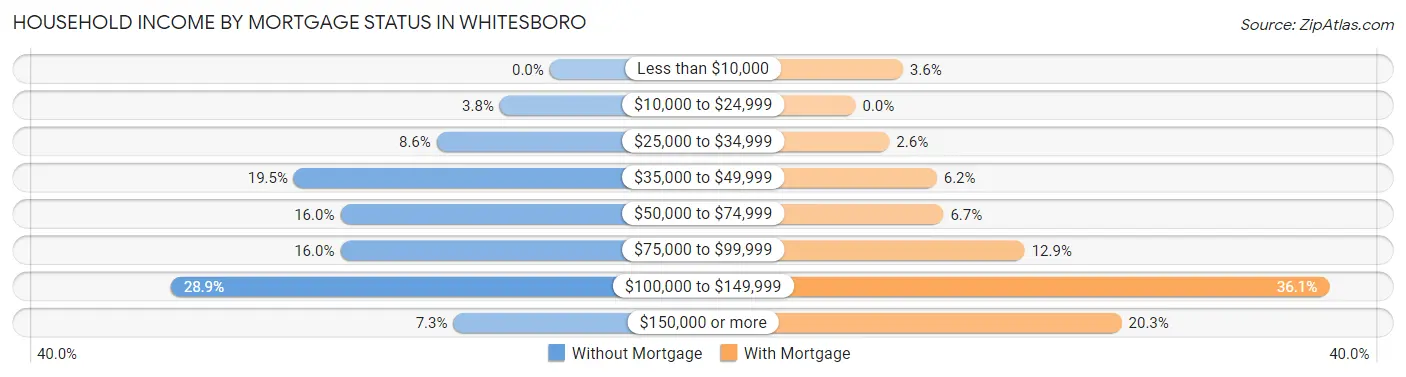
| Household Income | Without Mortgage | With Mortgage |
| Less than $10,000 | 0 (0.0%) | 21 (3.6%) |
| $10,000 to $24,999 | 15 (3.8%) | 0 (0.0%) |
| $25,000 to $34,999 | 34 (8.6%) | 15 (2.6%) |
| $35,000 to $49,999 | 77 (19.5%) | 36 (6.2%) |
| $50,000 to $74,999 | 63 (16.0%) | 39 (6.7%) |
| $75,000 to $99,999 | 63 (16.0%) | 75 (12.9%) |
| $100,000 to $149,999 | 114 (28.9%) | 210 (36.1%) |
| $150,000 or more | 29 (7.3%) | 118 (20.3%) |
| Total | 395 (100.0%) | 582 (100.0%) |
Property Value to Household Income Ratio in Whitesboro
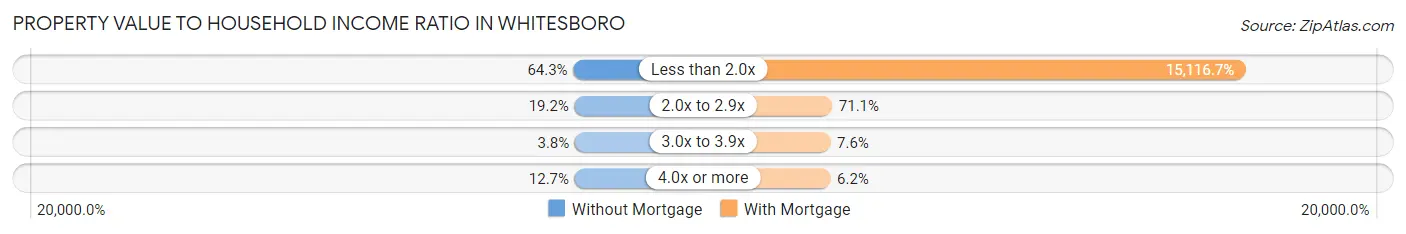
| Value-to-Income Ratio | Without Mortgage | With Mortgage |
| Less than 2.0x | 254 (64.3%) | 87,979 (15,116.7%) |
| 2.0x to 2.9x | 76 (19.2%) | 414 (71.1%) |
| 3.0x to 3.9x | 15 (3.8%) | 44 (7.6%) |
| 4.0x or more | 50 (12.7%) | 36 (6.2%) |
| Total | 395 (100.0%) | 582 (100.0%) |
Real Estate Taxes by Mortgage Status in Whitesboro
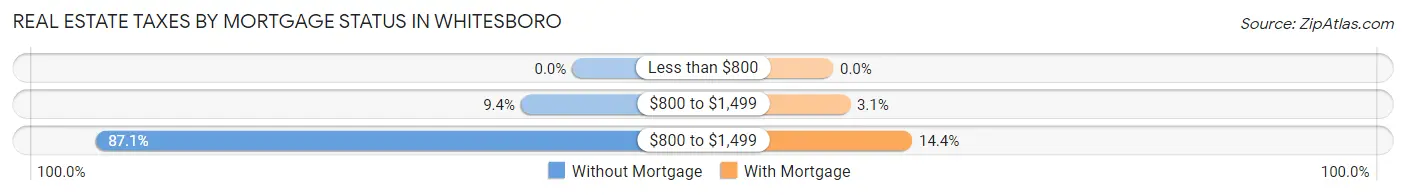
| Property Taxes | Without Mortgage | With Mortgage |
| Less than $800 | 0 (0.0%) | 0 (0.0%) |
| $800 to $1,499 | 37 (9.4%) | 18 (3.1%) |
| $800 to $1,499 | 344 (87.1%) | 84 (14.4%) |
| Total | 395 (100.0%) | 582 (100.0%) |
Health & Disability in Whitesboro
Health Insurance Coverage by Age in Whitesboro
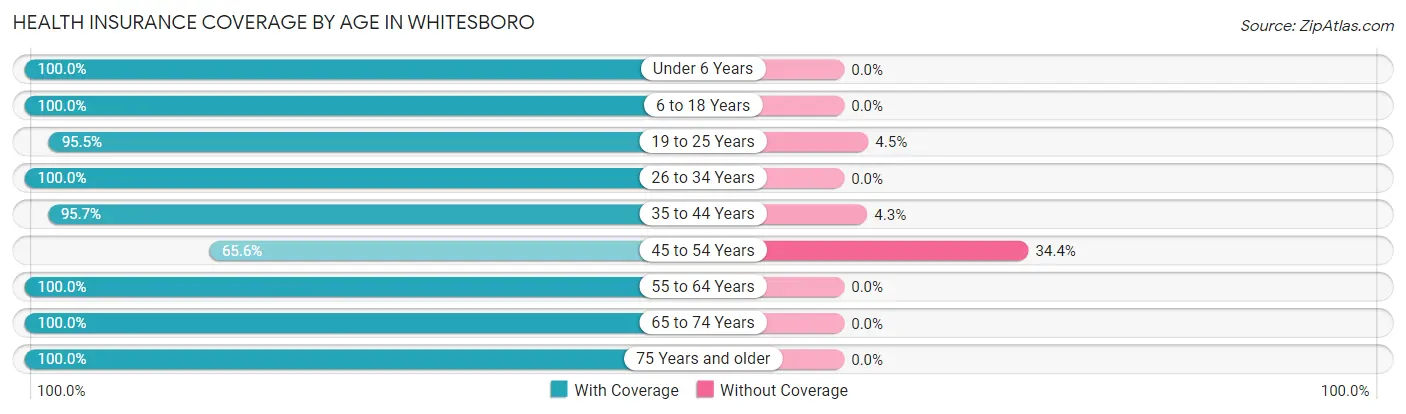
| Age Bracket | With Coverage | Without Coverage |
| Under 6 Years | 193 (100.0%) | 0 (0.0%) |
| 6 to 18 Years | 584 (100.0%) | 0 (0.0%) |
| 19 to 25 Years | 403 (95.5%) | 19 (4.5%) |
| 26 to 34 Years | 608 (100.0%) | 0 (0.0%) |
| 35 to 44 Years | 444 (95.7%) | 20 (4.3%) |
| 45 to 54 Years | 271 (65.6%) | 142 (34.4%) |
| 55 to 64 Years | 255 (100.0%) | 0 (0.0%) |
| 65 to 74 Years | 565 (100.0%) | 0 (0.0%) |
| 75 Years and older | 169 (100.0%) | 0 (0.0%) |
| Total | 3,492 (95.1%) | 181 (4.9%) |
Health Insurance Coverage by Citizenship Status in Whitesboro
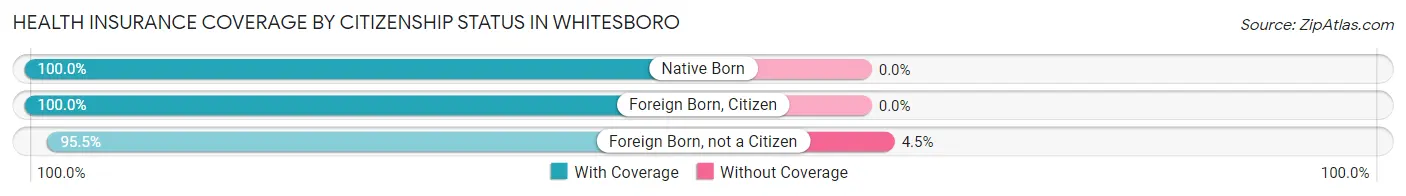
| Citizenship Status | With Coverage | Without Coverage |
| Native Born | 193 (100.0%) | 0 (0.0%) |
| Foreign Born, Citizen | 584 (100.0%) | 0 (0.0%) |
| Foreign Born, not a Citizen | 403 (95.5%) | 19 (4.5%) |
Health Insurance Coverage by Household Income in Whitesboro
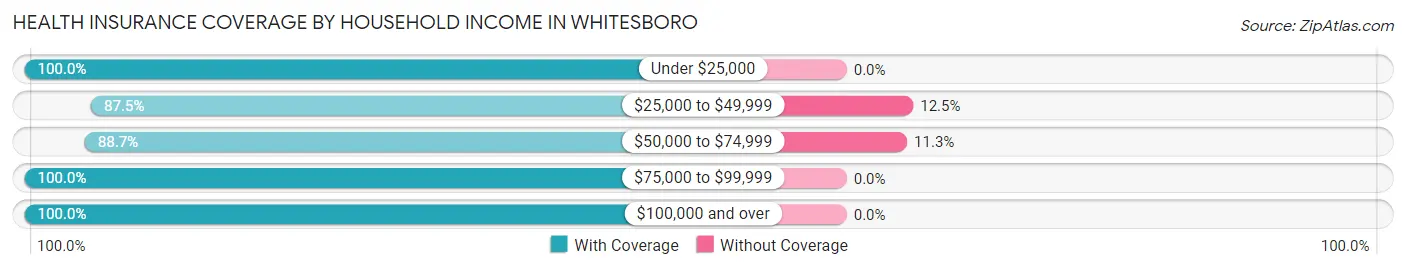
| Household Income | With Coverage | Without Coverage |
| Under $25,000 | 189 (100.0%) | 0 (0.0%) |
| $25,000 to $49,999 | 794 (87.5%) | 113 (12.5%) |
| $50,000 to $74,999 | 533 (88.7%) | 68 (11.3%) |
| $75,000 to $99,999 | 771 (100.0%) | 0 (0.0%) |
| $100,000 and over | 1,189 (100.0%) | 0 (0.0%) |
Public vs Private Health Insurance Coverage by Age in Whitesboro
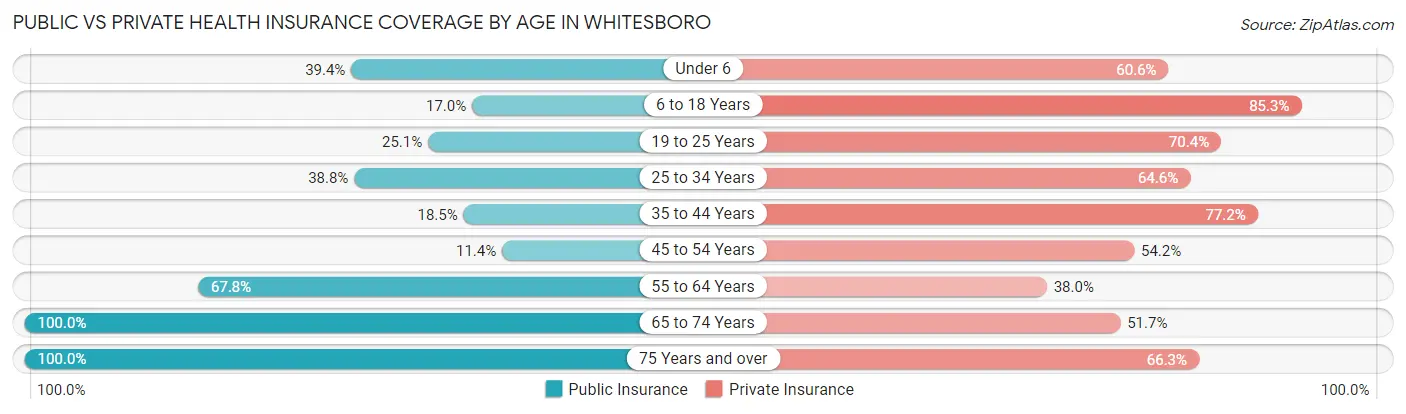
| Age Bracket | Public Insurance | Private Insurance |
| Under 6 | 76 (39.4%) | 117 (60.6%) |
| 6 to 18 Years | 99 (17.0%) | 498 (85.3%) |
| 19 to 25 Years | 106 (25.1%) | 297 (70.4%) |
| 25 to 34 Years | 236 (38.8%) | 393 (64.6%) |
| 35 to 44 Years | 86 (18.5%) | 358 (77.2%) |
| 45 to 54 Years | 47 (11.4%) | 224 (54.2%) |
| 55 to 64 Years | 173 (67.8%) | 97 (38.0%) |
| 65 to 74 Years | 565 (100.0%) | 292 (51.7%) |
| 75 Years and over | 169 (100.0%) | 112 (66.3%) |
| Total | 1,557 (42.4%) | 2,388 (65.0%) |
Disability Status by Sex by Age in Whitesboro
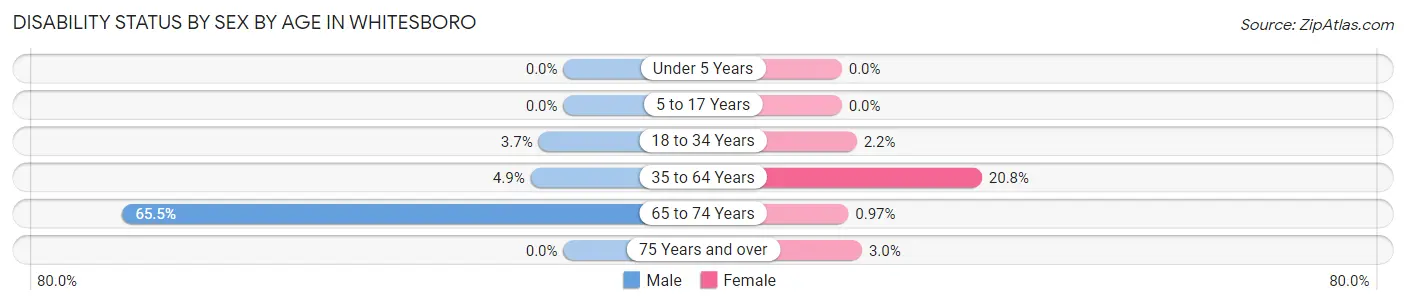
| Age Bracket | Male | Female |
| Under 5 Years | 0 (0.0%) | 0 (0.0%) |
| 5 to 17 Years | 0 (0.0%) | 0 (0.0%) |
| 18 to 34 Years | 12 (3.7%) | 17 (2.2%) |
| 35 to 64 Years | 21 (4.9%) | 146 (20.8%) |
| 65 to 74 Years | 235 (65.5%) | 2 (1.0%) |
| 75 Years and over | 0 (0.0%) | 3 (3.0%) |
Disability Class by Sex by Age in Whitesboro
Disability Class: Hearing Difficulty
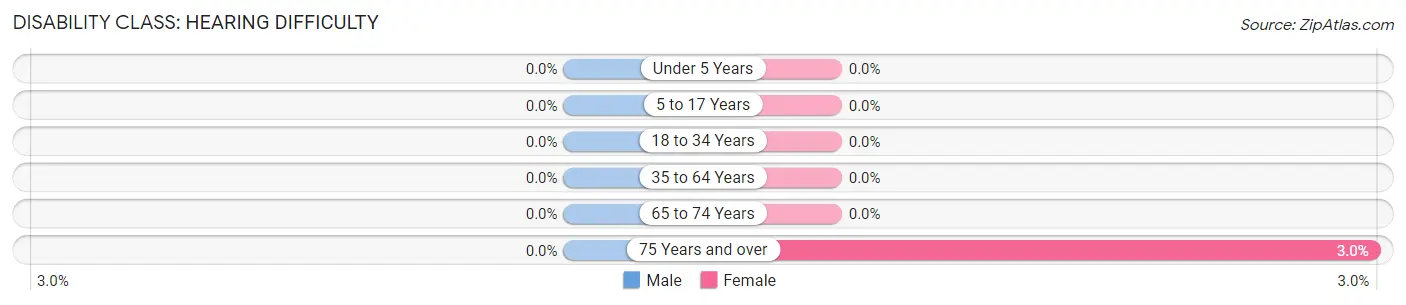
| Age Bracket | Male | Female |
| Under 5 Years | 0 (0.0%) | 0 (0.0%) |
| 5 to 17 Years | 0 (0.0%) | 0 (0.0%) |
| 18 to 34 Years | 0 (0.0%) | 0 (0.0%) |
| 35 to 64 Years | 0 (0.0%) | 0 (0.0%) |
| 65 to 74 Years | 0 (0.0%) | 0 (0.0%) |
| 75 Years and over | 0 (0.0%) | 3 (3.0%) |
Disability Class: Vision Difficulty
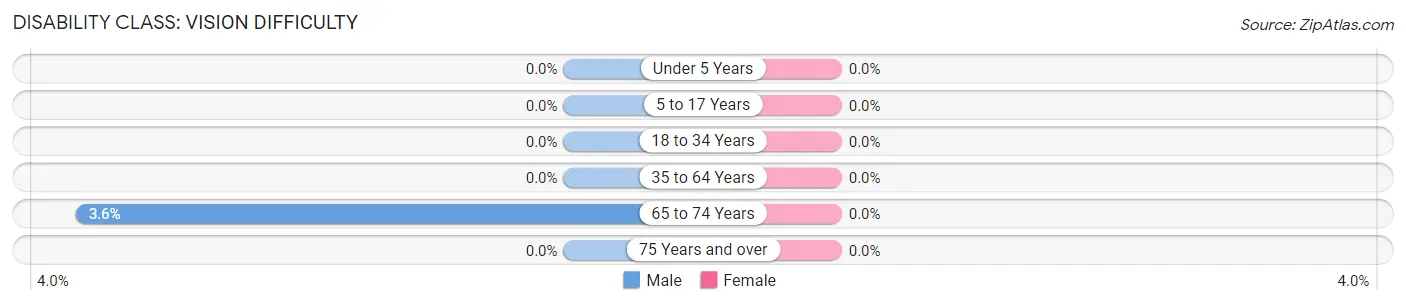
| Age Bracket | Male | Female |
| Under 5 Years | 0 (0.0%) | 0 (0.0%) |
| 5 to 17 Years | 0 (0.0%) | 0 (0.0%) |
| 18 to 34 Years | 0 (0.0%) | 0 (0.0%) |
| 35 to 64 Years | 0 (0.0%) | 0 (0.0%) |
| 65 to 74 Years | 13 (3.6%) | 0 (0.0%) |
| 75 Years and over | 0 (0.0%) | 0 (0.0%) |
Disability Class: Cognitive Difficulty
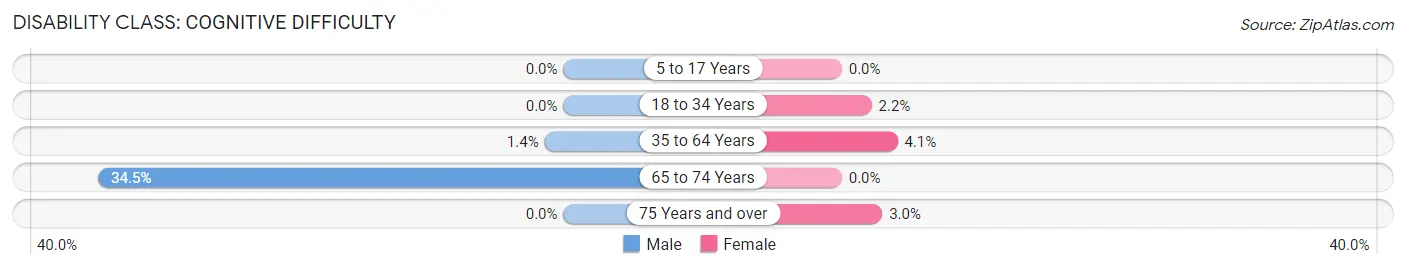
| Age Bracket | Male | Female |
| 5 to 17 Years | 0 (0.0%) | 0 (0.0%) |
| 18 to 34 Years | 0 (0.0%) | 17 (2.2%) |
| 35 to 64 Years | 6 (1.4%) | 29 (4.1%) |
| 65 to 74 Years | 124 (34.5%) | 0 (0.0%) |
| 75 Years and over | 0 (0.0%) | 3 (3.0%) |
Disability Class: Ambulatory Difficulty
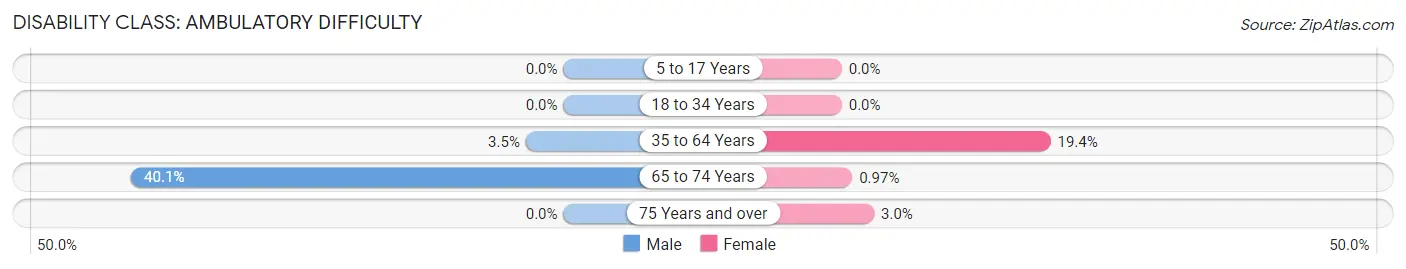
| Age Bracket | Male | Female |
| 5 to 17 Years | 0 (0.0%) | 0 (0.0%) |
| 18 to 34 Years | 0 (0.0%) | 0 (0.0%) |
| 35 to 64 Years | 15 (3.5%) | 136 (19.4%) |
| 65 to 74 Years | 144 (40.1%) | 2 (1.0%) |
| 75 Years and over | 0 (0.0%) | 3 (3.0%) |
Disability Class: Self-Care Difficulty
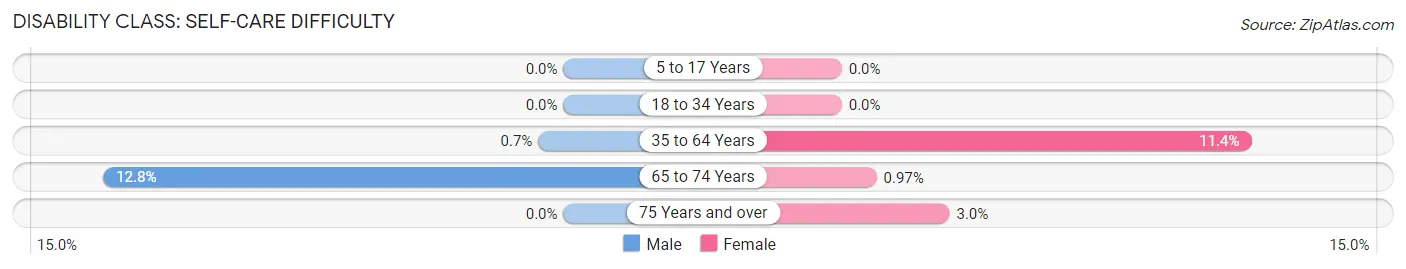
| Age Bracket | Male | Female |
| 5 to 17 Years | 0 (0.0%) | 0 (0.0%) |
| 18 to 34 Years | 0 (0.0%) | 0 (0.0%) |
| 35 to 64 Years | 3 (0.7%) | 80 (11.4%) |
| 65 to 74 Years | 46 (12.8%) | 2 (1.0%) |
| 75 Years and over | 0 (0.0%) | 3 (3.0%) |
Technology Access in Whitesboro
Computing Device Access in Whitesboro
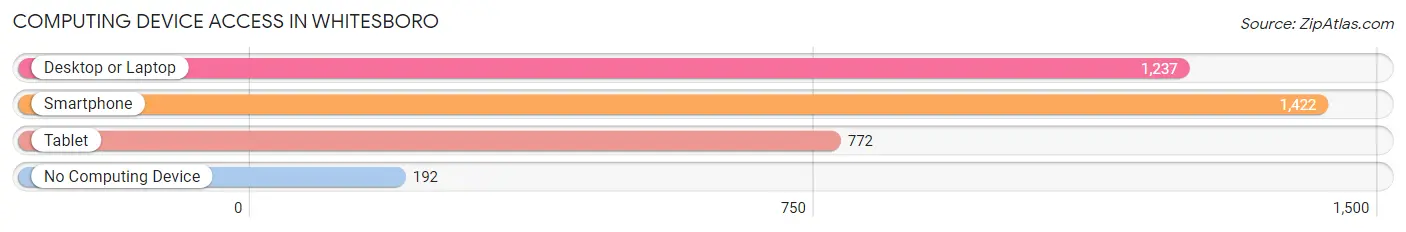
| Device Type | # Households | % Households |
| Desktop or Laptop | 1,237 | 75.3% |
| Smartphone | 1,422 | 86.6% |
| Tablet | 772 | 47.0% |
| No Computing Device | 192 | 11.7% |
| Total | 1,643 | 100.0% |
Internet Access in Whitesboro
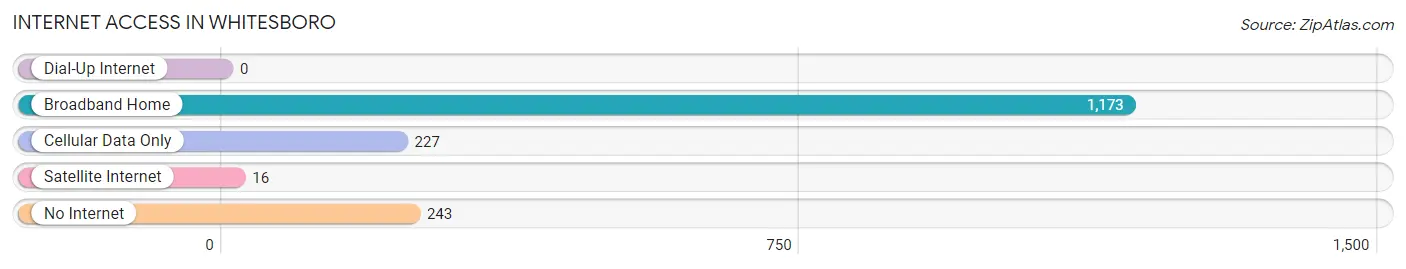
| Internet Type | # Households | % Households |
| Dial-Up Internet | 0 | 0.0% |
| Broadband Home | 1,173 | 71.4% |
| Cellular Data Only | 227 | 13.8% |
| Satellite Internet | 16 | 1.0% |
| No Internet | 243 | 14.8% |
| Total | 1,643 | 100.0% |
Whitesboro Summary
Whitesboro is a village located in Oneida County, New York, United States. The population was 3,772 at the 2010 census. The village is named after Hugh White, an early settler. It is part of the Utica–Rome Metropolitan Statistical Area.
Geography
Whitesboro is located at 43 097 75 30
According to the United States Census Bureau, the village has a total area of 1.2 square miles (3.1 km2), all of it land.
History
Whitesboro was founded in 1784 by Hugh White, a Revolutionary War veteran from Massachusetts. White was granted a large tract of land in the area by the state of New York in recognition of his service. He built a log cabin and cleared the land for farming. The village was originally known as White's Town, but the name was changed to Whitesboro in 1817.
The village was incorporated in 1817 and has grown steadily since then. In the late 19th century, Whitesboro was a center of industry, with several mills and factories located in the area. The village also had a railroad station, which connected it to Utica and other nearby towns.
Economy
Whitesboro's economy is largely based on manufacturing and retail. The village is home to several factories and industrial parks, including the Whitesboro Industrial Park, which is home to several businesses, including a plastics manufacturer and a metal fabricator. The village also has several retail stores, including a grocery store, a hardware store, and a pharmacy.
Demographics
As of the census of 2010, there were 3,772 people, 1,541 households, and 990 families residing in the village. The population density was 3,093.3 people per square mile (1,190.2/km2). There were 1,637 housing units at an average density of 1,335.8 per square mile (515.7/km2). The racial makeup of the village was 97.2% White, 0.7% African American, 0.2% Native American, 0.7% Asian, 0.1% Pacific Islander, 0.3% from other races, and 0.9% from two or more races. Hispanic or Latino of any race were 1.7% of the population.
There were 1,541 households, out of which 28.2% had children under the age of 18 living with them, 48.2% were married couples living together, 11.7% had a female householder with no husband present, and 35.2% were non-families. 29.7% of all households were made up of individuals, and 12.3% had someone living alone who was 65 years of age or older. The average household size was 2.45 and the average family size was 3.03.
In the village, the population was spread out, with 23.2% under the age of 18, 7.2% from 18 to 24, 28.2% from 25 to 44, 25.2% from 45 to 64, and 16.2% who were 65 years of age or older. The median age was 39 years. For every 100 females, there were 93.2 males. For every 100 females age 18 and over, there were 90.2 males.
The median income for a household in the village was $45,938, and the median income for a family was $54,917. Males had a median income of $41,964 versus $30,917 for females. The per capita income for the village was $21,945. About 4.2% of families and 6.2% of the population were below the poverty line, including 8.2% of those under age 18 and 5.2% of those age 65 or over.
Common Questions
What is Per Capita Income in Whitesboro?
Per Capita income in Whitesboro is $34,432.
What is the Median Family Income in Whitesboro?
Median Family Income in Whitesboro is $79,157.
What is the Median Household income in Whitesboro?
Median Household Income in Whitesboro is $65,234.
What is Income or Wage Gap in Whitesboro?
Income or Wage Gap in Whitesboro is 37.8%.
Women in Whitesboro earn 62.2 cents for every dollar earned by a man.
What is Inequality or Gini Index in Whitesboro?
Inequality or Gini Index in Whitesboro is 0.38.
What is the Total Population of Whitesboro?
Total Population of Whitesboro is 3,673.
What is the Total Male Population of Whitesboro?
Total Male Population of Whitesboro is 1,560.
What is the Total Female Population of Whitesboro?
Total Female Population of Whitesboro is 2,113.
What is the Ratio of Males per 100 Females in Whitesboro?
There are 73.83 Males per 100 Females in Whitesboro.
What is the Ratio of Females per 100 Males in Whitesboro?
There are 135.45 Females per 100 Males in Whitesboro.
What is the Median Population Age in Whitesboro?
Median Population Age in Whitesboro is 35.8 Years.
What is the Average Family Size in Whitesboro
Average Family Size in Whitesboro is 2.8 People.
What is the Average Household Size in Whitesboro
Average Household Size in Whitesboro is 2.2 People.
How Large is the Labor Force in Whitesboro?
There are 1,961 People in the Labor Forcein in Whitesboro.
What is the Percentage of People in the Labor Force in Whitesboro?
62.7% of People are in the Labor Force in Whitesboro.
What is the Unemployment Rate in Whitesboro?
Unemployment Rate in Whitesboro is 9.2%.