Cities with the Highest Percentage of Immigrants from Trinidad and Tobago in Maryland
RELATED REPORTS & OPTIONS
Trinidad and Tobago
Maryland
Compare Cities
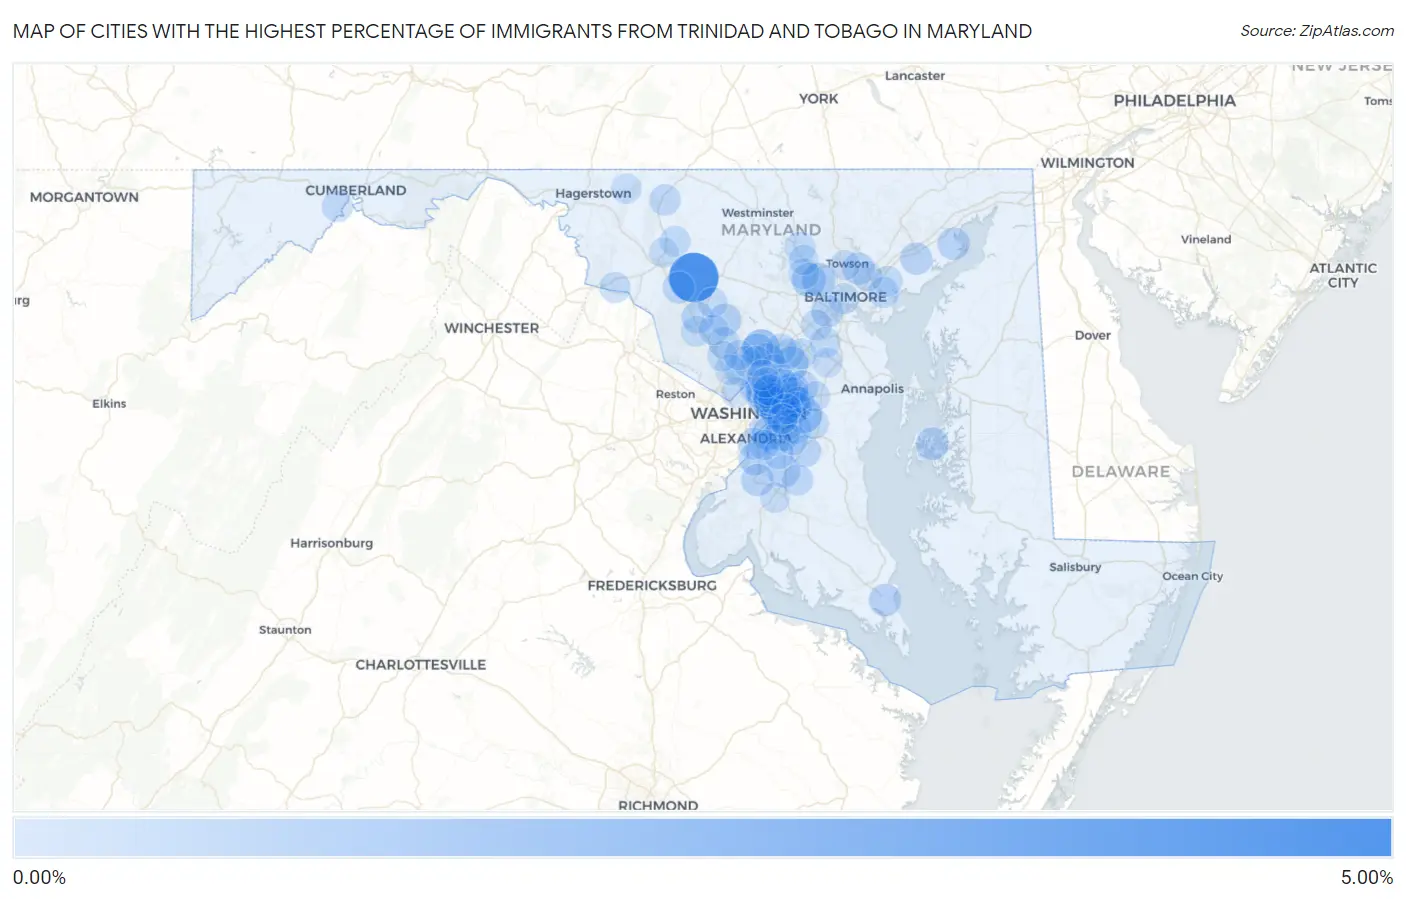
Map of Cities with the Highest Percentage of Immigrants from Trinidad and Tobago in Maryland
0.00%
5.00%
Cities with the Highest Percentage of Immigrants from Trinidad and Tobago in Maryland
| City | Trinidad and Tobago | vs State | vs National | |
| 1. | Monrovia | 4.77% | 0.19%(+4.58)#-1 | 0.070%(+4.70)#0 |
| 2. | Seat Pleasant | 1.65% | 0.19%(+1.46)#0 | 0.070%(+1.58)#1 |
| 3. | Spencerville | 1.57% | 0.19%(+1.38)#1 | 0.070%(+1.50)#2 |
| 4. | Kettering | 1.52% | 0.19%(+1.33)#2 | 0.070%(+1.45)#3 |
| 5. | Cheverly | 1.47% | 0.19%(+1.28)#3 | 0.070%(+1.40)#4 |
| 6. | Peppermill Village | 1.42% | 0.19%(+1.23)#4 | 0.070%(+1.35)#5 |
| 7. | Mount Rainier | 1.32% | 0.19%(+1.13)#5 | 0.070%(+1.25)#6 |
| 8. | New Carrollton | 1.25% | 0.19%(+1.07)#6 | 0.070%(+1.18)#7 |
| 9. | South Laurel | 1.13% | 0.19%(+0.939)#7 | 0.070%(+1.06)#8 |
| 10. | Springdale | 1.07% | 0.19%(+0.884)#8 | 0.070%(+1.00)#9 |
| 11. | Morningside | 1.06% | 0.19%(+0.876)#9 | 0.070%(+0.993)#10 |
| 12. | Colmar Manor | 1.06% | 0.19%(+0.869)#10 | 0.070%(+0.986)#11 |
| 13. | Milford Mill | 1.02% | 0.19%(+0.832)#11 | 0.070%(+0.949)#12 |
| 14. | Lochearn | 0.99% | 0.19%(+0.800)#12 | 0.070%(+0.916)#13 |
| 15. | Fairland | 0.97% | 0.19%(+0.787)#13 | 0.070%(+0.904)#14 |
| 16. | Chillum | 0.88% | 0.19%(+0.694)#14 | 0.070%(+0.810)#15 |
| 17. | Marlow Heights | 0.82% | 0.19%(+0.629)#15 | 0.070%(+0.746)#16 |
| 18. | Cloverly | 0.76% | 0.19%(+0.574)#16 | 0.070%(+0.691)#17 |
| 19. | Fort Washington | 0.76% | 0.19%(+0.573)#17 | 0.070%(+0.689)#18 |
| 20. | St Michaels | 0.72% | 0.19%(+0.536)#18 | 0.070%(+0.652)#19 |
| 21. | Landover Hills | 0.71% | 0.19%(+0.522)#19 | 0.070%(+0.638)#20 |
| 22. | Brandywine | 0.69% | 0.19%(+0.508)#20 | 0.070%(+0.624)#21 |
| 23. | Seabrook | 0.69% | 0.19%(+0.500)#21 | 0.070%(+0.617)#22 |
| 24. | Laytonsville | 0.68% | 0.19%(+0.493)#22 | 0.070%(+0.610)#23 |
| 25. | Aberdeen Proving Ground | 0.67% | 0.19%(+0.480)#23 | 0.070%(+0.596)#24 |
| 26. | Lexington Park | 0.66% | 0.19%(+0.471)#24 | 0.070%(+0.588)#25 |
| 27. | Parkville | 0.65% | 0.19%(+0.466)#25 | 0.070%(+0.582)#26 |
| 28. | Accokeek | 0.64% | 0.19%(+0.457)#26 | 0.070%(+0.574)#27 |
| 29. | Edgewood | 0.64% | 0.19%(+0.451)#27 | 0.070%(+0.567)#28 |
| 30. | Arbutus | 0.63% | 0.19%(+0.439)#28 | 0.070%(+0.556)#29 |
| 31. | Takoma Park | 0.62% | 0.19%(+0.435)#29 | 0.070%(+0.552)#30 |
| 32. | Woodlawn Cdp Baltimore County | 0.62% | 0.19%(+0.434)#30 | 0.070%(+0.550)#31 |
| 33. | Riverdale Park | 0.62% | 0.19%(+0.431)#31 | 0.070%(+0.548)#32 |
| 34. | Urbana | 0.56% | 0.19%(+0.375)#32 | 0.070%(+0.491)#33 |
| 35. | Langley Park | 0.56% | 0.19%(+0.374)#33 | 0.070%(+0.490)#34 |
| 36. | Clarksburg | 0.54% | 0.19%(+0.350)#34 | 0.070%(+0.467)#35 |
| 37. | North Brentwood | 0.52% | 0.19%(+0.336)#35 | 0.070%(+0.452)#36 |
| 38. | Marlton | 0.52% | 0.19%(+0.335)#36 | 0.070%(+0.451)#37 |
| 39. | Hillcrest Heights | 0.49% | 0.19%(+0.299)#37 | 0.070%(+0.416)#38 |
| 40. | Redland | 0.49% | 0.19%(+0.299)#38 | 0.070%(+0.415)#39 |
| 41. | National Harbor | 0.47% | 0.19%(+0.282)#39 | 0.070%(+0.399)#40 |
| 42. | Cottage City | 0.45% | 0.19%(+0.262)#40 | 0.070%(+0.379)#41 |
| 43. | Glenn Dale | 0.45% | 0.19%(+0.260)#41 | 0.070%(+0.376)#42 |
| 44. | Hyattsville | 0.45% | 0.19%(+0.260)#42 | 0.070%(+0.376)#43 |
| 45. | Beltsville | 0.44% | 0.19%(+0.250)#43 | 0.070%(+0.367)#44 |
| 46. | Woodlawn Cdp Prince George S County | 0.41% | 0.19%(+0.226)#44 | 0.070%(+0.343)#45 |
| 47. | Thurmont | 0.41% | 0.19%(+0.226)#45 | 0.070%(+0.342)#46 |
| 48. | Cresaptown | 0.40% | 0.19%(+0.214)#46 | 0.070%(+0.331)#47 |
| 49. | Camp Springs | 0.40% | 0.19%(+0.213)#47 | 0.070%(+0.330)#48 |
| 50. | Flower Hill | 0.39% | 0.19%(+0.203)#48 | 0.070%(+0.320)#49 |
| 51. | Mitchellville | 0.38% | 0.19%(+0.194)#49 | 0.070%(+0.310)#50 |
| 52. | Brunswick | 0.37% | 0.19%(+0.186)#50 | 0.070%(+0.303)#51 |
| 53. | Lake Arbor | 0.37% | 0.19%(+0.183)#51 | 0.070%(+0.299)#52 |
| 54. | Bladensburg | 0.37% | 0.19%(+0.179)#52 | 0.070%(+0.296)#53 |
| 55. | Cedarville | 0.36% | 0.19%(+0.176)#53 | 0.070%(+0.293)#54 |
| 56. | Lanham | 0.36% | 0.19%(+0.174)#54 | 0.070%(+0.290)#55 |
| 57. | Brown Station | 0.36% | 0.19%(+0.170)#55 | 0.070%(+0.287)#56 |
| 58. | Baltimore | 0.33% | 0.19%(+0.146)#56 | 0.070%(+0.262)#500 |
| 59. | Reisterstown | 0.32% | 0.19%(+0.136)#57 | 0.070%(+0.252)#501 |
| 60. | Randallstown | 0.32% | 0.19%(+0.131)#58 | 0.070%(+0.248)#502 |
| 61. | Essex | 0.31% | 0.19%(+0.127)#59 | 0.070%(+0.244)#503 |
| 62. | University Park | 0.31% | 0.19%(+0.120)#60 | 0.070%(+0.237)#504 |
| 63. | Walkersville | 0.30% | 0.19%(+0.118)#61 | 0.070%(+0.235)#505 |
| 64. | Greenbelt | 0.30% | 0.19%(+0.110)#62 | 0.070%(+0.226)#506 |
| 65. | North Kensington | 0.30% | 0.19%(+0.109)#63 | 0.070%(+0.225)#507 |
| 66. | Elkridge | 0.29% | 0.19%(+0.107)#64 | 0.070%(+0.223)#508 |
| 67. | Severn | 0.28% | 0.19%(+0.097)#65 | 0.070%(+0.214)#509 |
| 68. | Clinton | 0.28% | 0.19%(+0.090)#66 | 0.070%(+0.206)#510 |
| 69. | Forestville | 0.26% | 0.19%(+0.076)#67 | 0.070%(+0.193)#511 |
| 70. | Westphalia | 0.26% | 0.19%(+0.071)#68 | 0.070%(+0.188)#512 |
| 71. | Maryland City | 0.26% | 0.19%(+0.070)#69 | 0.070%(+0.186)#513 |
| 72. | Glenmont | 0.25% | 0.19%(+0.066)#70 | 0.070%(+0.183)#514 |
| 73. | Laurel | 0.24% | 0.19%(+0.057)#71 | 0.070%(+0.174)#515 |
| 74. | Colesville | 0.24% | 0.19%(+0.054)#72 | 0.070%(+0.171)#516 |
| 75. | Hillandale | 0.24% | 0.19%(+0.054)#73 | 0.070%(+0.170)#517 |
| 76. | Germantown | 0.24% | 0.19%(+0.049)#74 | 0.070%(+0.165)#518 |
| 77. | Melwood | 0.23% | 0.19%(+0.046)#75 | 0.070%(+0.163)#519 |
| 78. | Friendship Heights Village | 0.23% | 0.19%(+0.045)#76 | 0.070%(+0.162)#520 |
| 79. | North Bethesda | 0.23% | 0.19%(+0.041)#77 | 0.070%(+0.157)#521 |
| 80. | Brock Hall | 0.22% | 0.19%(+0.037)#78 | 0.070%(+0.154)#522 |
| 81. | Summerfield | 0.21% | 0.19%(+0.027)#79 | 0.070%(+0.143)#523 |
| 82. | Rockville | 0.21% | 0.19%(+0.027)#80 | 0.070%(+0.143)#524 |
| 83. | Middle River | 0.21% | 0.19%(+0.026)#81 | 0.070%(+0.142)#525 |
| 84. | West Laurel | 0.21% | 0.19%(+0.021)#82 | 0.070%(+0.138)#526 |
| 85. | Montgomery Village | 0.20% | 0.19%(+0.012)#83 | 0.070%(+0.129)#527 |
| 86. | Bowie | 0.20% | 0.19%(+0.010)#84 | 0.070%(+0.127)#528 |
| 87. | Green Valley | 0.19% | 0.19%(+0.006)#85 | 0.070%(+0.123)#529 |
| 88. | Walker Mill | 0.18% | 0.19%(-0.006)#86 | 0.070%(+0.111)#530 |
| 89. | Overlea | 0.18% | 0.19%(-0.007)#87 | 0.070%(+0.110)#531 |
| 90. | Aspen Hill | 0.18% | 0.19%(-0.011)#88 | 0.070%(+0.105)#532 |
| 91. | Smithsburg | 0.17% | 0.19%(-0.021)#89 | 0.070%(+0.095)#533 |
| 92. | Owings Mills | 0.16% | 0.19%(-0.023)#90 | 0.070%(+0.093)#534 |
| 93. | Damascus | 0.16% | 0.19%(-0.026)#91 | 0.070%(+0.090)#535 |
| 94. | Adelphi | 0.16% | 0.19%(-0.027)#92 | 0.070%(+0.090)#536 |
| 95. | Honeygo | 0.16% | 0.19%(-0.029)#93 | 0.070%(+0.088)#537 |
| 96. | Frederick | 0.16% | 0.19%(-0.031)#94 | 0.070%(+0.086)#538 |
| 97. | Oxon Hill | 0.14% | 0.19%(-0.046)#95 | 0.070%(+0.071)#539 |
| 98. | Waldorf | 0.14% | 0.19%(-0.048)#96 | 0.070%(+0.068)#540 |
| 99. | Towson | 0.13% | 0.19%(-0.053)#97 | 0.070%(+0.064)#541 |
| 100. | Odenton | 0.13% | 0.19%(-0.060)#98 | 0.070%(+0.057)#542 |
Common Questions
What are the Top 10 Cities with the Highest Percentage of Immigrants from Trinidad and Tobago in Maryland?
Top 10 Cities with the Highest Percentage of Immigrants from Trinidad and Tobago in Maryland are:
#1
4.77%
#2
1.65%
#3
1.57%
#4
1.52%
#5
1.47%
#6
1.42%
#7
1.32%
#8
1.25%
#9
1.13%
#10
1.07%
What city has the Highest Percentage of Immigrants from Trinidad and Tobago in Maryland?
Monrovia has the Highest Percentage of Immigrants from Trinidad and Tobago in Maryland with 4.77%.
What is the Percentage of Immigrants from Trinidad and Tobago in the State of Maryland?
Percentage of Immigrants from Trinidad and Tobago in Maryland is 0.19%.
What is the Percentage of Immigrants from Trinidad and Tobago in the United States?
Percentage of Immigrants from Trinidad and Tobago in the United States is 0.070%.