Plant City, FL Map & Demographics
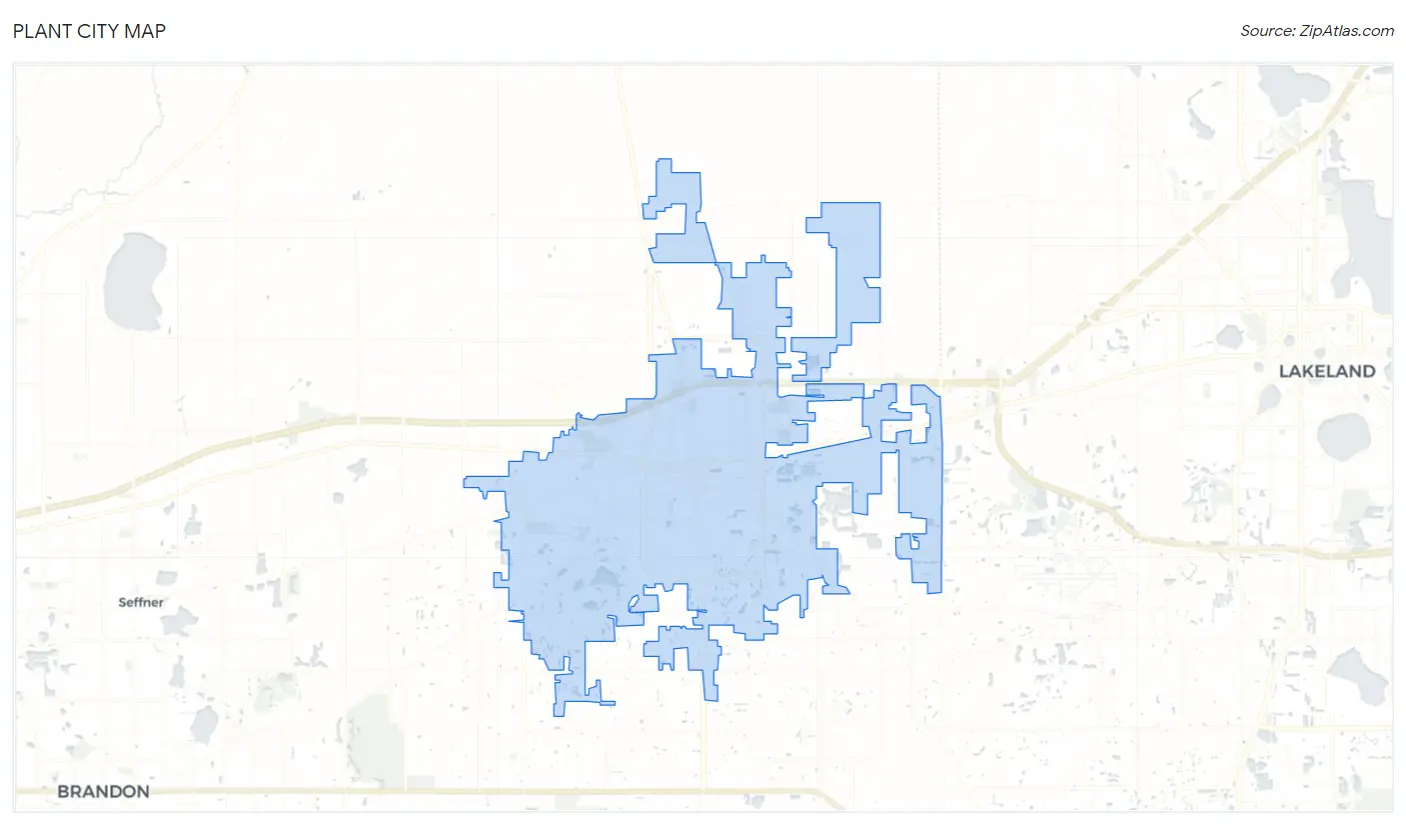
Plant City Map
Plant City Overview
$29,466
PER CAPITA INCOME
$71,712
AVG FAMILY INCOME
$62,015
AVG HOUSEHOLD INCOME
15.2%
WAGE / INCOME GAP [ % ]
84.8¢/ $1
WAGE / INCOME GAP [ $ ]
$12,608
FAMILY INCOME DEFICIT
0.41
INEQUALITY / GINI INDEX
39,655
TOTAL POPULATION
19,680
MALE POPULATION
19,975
FEMALE POPULATION
98.52
MALES / 100 FEMALES
101.50
FEMALES / 100 MALES
37.6
MEDIAN AGE
3.3
AVG FAMILY SIZE
2.7
AVG HOUSEHOLD SIZE
21,030
LABOR FORCE [ PEOPLE ]
66.6%
PERCENT IN LABOR FORCE
3.2%
UNEMPLOYMENT RATE
Income in Plant City
Income Overview in Plant City
Per Capita Income in Plant City is $29,466, while median incomes of families and households are $71,712 and $62,015 respectively.
| Characteristic | Number | Measure |
| Per Capita Income | 39,655 | $29,466 |
| Median Family Income | 9,394 | $71,712 |
| Mean Family Income | 9,394 | $87,584 |
| Median Household Income | 14,500 | $62,015 |
| Mean Household Income | 14,500 | $77,079 |
| Income Deficit | 9,394 | $12,608 |
| Wage / Income Gap (%) | 39,655 | 15.19% |
| Wage / Income Gap ($) | 39,655 | 84.81¢ per $1 |
| Gini / Inequality Index | 39,655 | 0.41 |
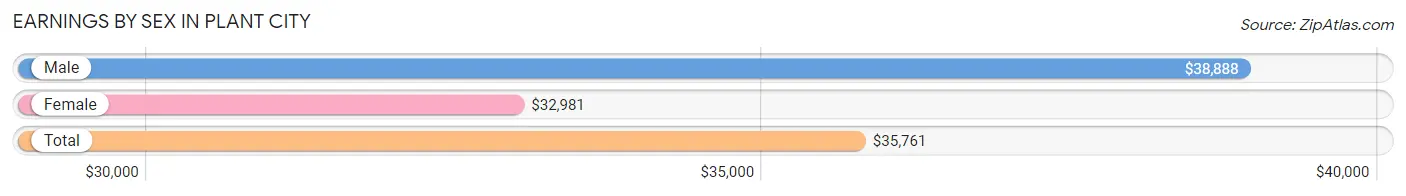
Earnings by Sex in Plant City
Average Earnings in Plant City are $35,761, $38,888 for men and $32,981 for women, a difference of 15.2%.
| Sex | Number | Average Earnings |
| Male | 11,631 (54.0%) | $38,888 |
| Female | 9,904 (46.0%) | $32,981 |
| Total | 21,535 (100.0%) | $35,761 |
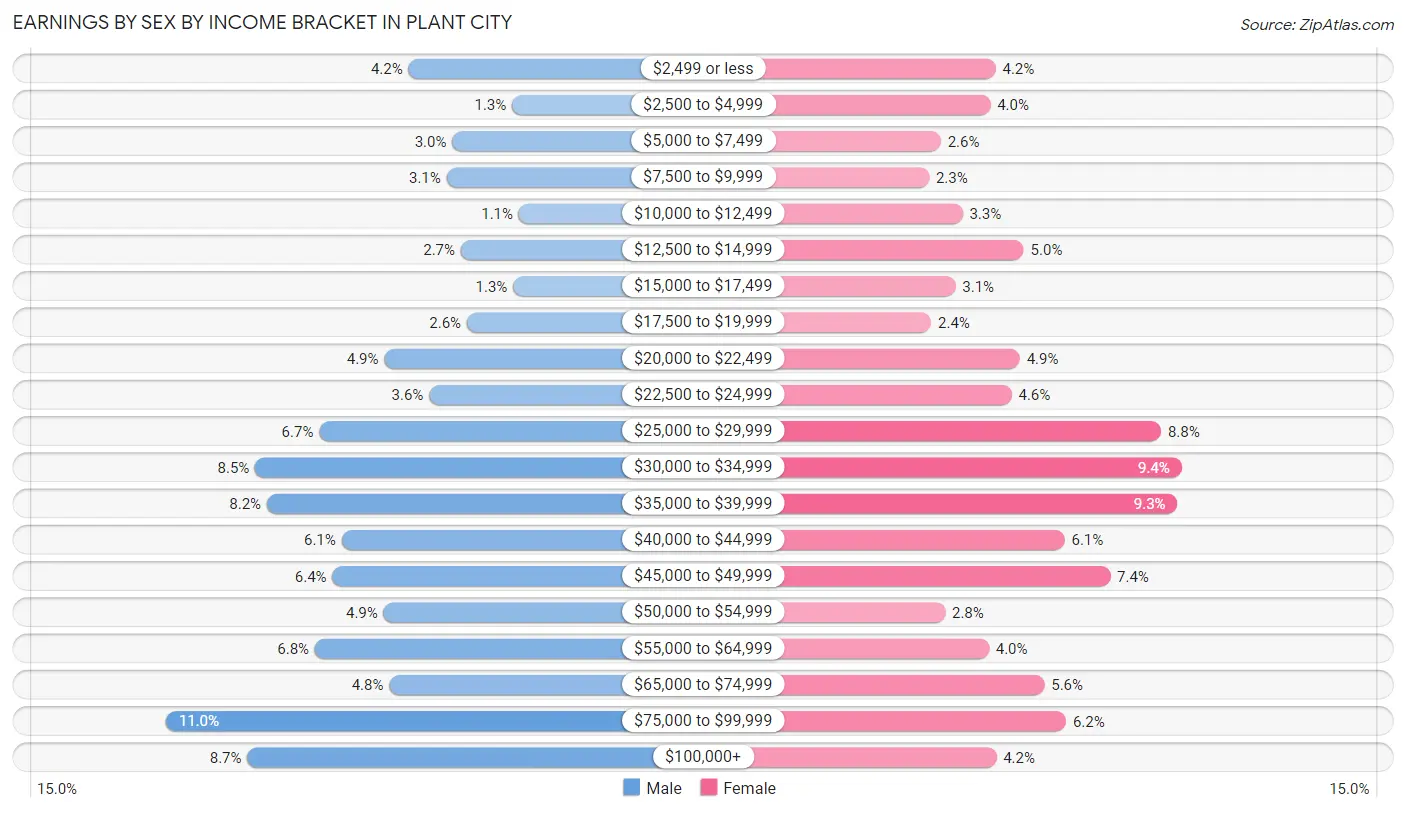
Earnings by Sex by Income Bracket in Plant City
The most common earnings brackets in Plant City are $75,000 to $99,999 for men (1,283 | 11.0%) and $30,000 to $34,999 for women (932 | 9.4%).
| Income | Male | Female |
| $2,499 or less | 490 (4.2%) | 414 (4.2%) |
| $2,500 to $4,999 | 151 (1.3%) | 399 (4.0%) |
| $5,000 to $7,499 | 347 (3.0%) | 261 (2.6%) |
| $7,500 to $9,999 | 365 (3.1%) | 229 (2.3%) |
| $10,000 to $12,499 | 129 (1.1%) | 322 (3.3%) |
| $12,500 to $14,999 | 319 (2.7%) | 492 (5.0%) |
| $15,000 to $17,499 | 148 (1.3%) | 302 (3.0%) |
| $17,500 to $19,999 | 299 (2.6%) | 235 (2.4%) |
| $20,000 to $22,499 | 569 (4.9%) | 481 (4.9%) |
| $22,500 to $24,999 | 422 (3.6%) | 459 (4.6%) |
| $25,000 to $29,999 | 782 (6.7%) | 875 (8.8%) |
| $30,000 to $34,999 | 991 (8.5%) | 932 (9.4%) |
| $35,000 to $39,999 | 953 (8.2%) | 920 (9.3%) |
| $40,000 to $44,999 | 708 (6.1%) | 606 (6.1%) |
| $45,000 to $49,999 | 738 (6.4%) | 733 (7.4%) |
| $50,000 to $54,999 | 571 (4.9%) | 273 (2.8%) |
| $55,000 to $64,999 | 796 (6.8%) | 395 (4.0%) |
| $65,000 to $74,999 | 553 (4.8%) | 550 (5.6%) |
| $75,000 to $99,999 | 1,283 (11.0%) | 610 (6.2%) |
| $100,000+ | 1,017 (8.7%) | 416 (4.2%) |
| Total | 11,631 (100.0%) | 9,904 (100.0%) |
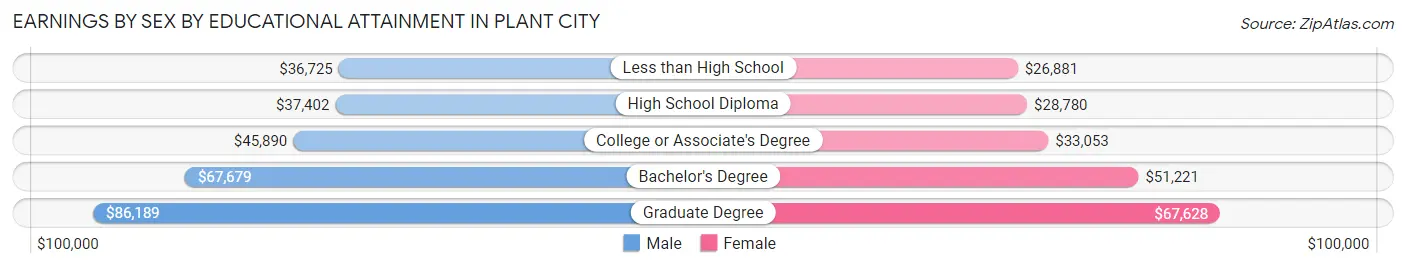
Earnings by Sex by Educational Attainment in Plant City
Average earnings in Plant City are $43,756 for men and $35,323 for women, a difference of 19.3%. Men with an educational attainment of graduate degree enjoy the highest average annual earnings of $86,189, while those with less than high school education earn the least with $36,725. Women with an educational attainment of graduate degree earn the most with the average annual earnings of $67,628, while those with less than high school education have the smallest earnings of $26,881.
| Educational Attainment | Male Income | Female Income |
| Less than High School | $36,725 | $26,881 |
| High School Diploma | $37,402 | $28,780 |
| College or Associate's Degree | $45,890 | $33,053 |
| Bachelor's Degree | $67,679 | $51,221 |
| Graduate Degree | $86,189 | $67,628 |
| Total | $43,756 | $35,323 |
Family Income in Plant City
Family Income Brackets in Plant City
According to the Plant City family income data, there are 1,869 families falling into the $50,000 to $74,999 income range, which is the most common income bracket and makes up 19.9% of all families. Conversely, the $10,000 to $14,999 income bracket is the least frequent group with only 103 families (1.1%) belonging to this category.
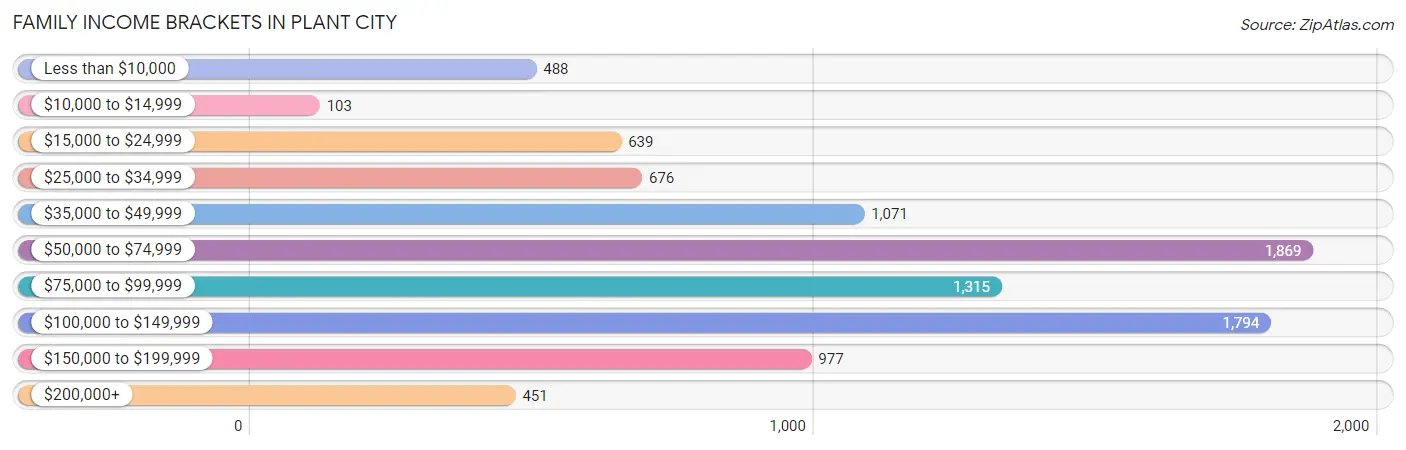
| Income Bracket | # Families | % Families |
| Less than $10,000 | 488 | 5.2% |
| $10,000 to $14,999 | 103 | 1.1% |
| $15,000 to $24,999 | 639 | 6.8% |
| $25,000 to $34,999 | 676 | 7.2% |
| $35,000 to $49,999 | 1,071 | 11.4% |
| $50,000 to $74,999 | 1,869 | 19.9% |
| $75,000 to $99,999 | 1,315 | 14.0% |
| $100,000 to $149,999 | 1,794 | 19.1% |
| $150,000 to $199,999 | 977 | 10.4% |
| $200,000+ | 451 | 4.8% |
Family Income by Famaliy Size in Plant City
5-person families (999 | 10.6%) account for the highest median family income in Plant City with $102,523 per family, while 2-person families (4,132 | 44.0%) have the highest median income of $33,270 per family member.
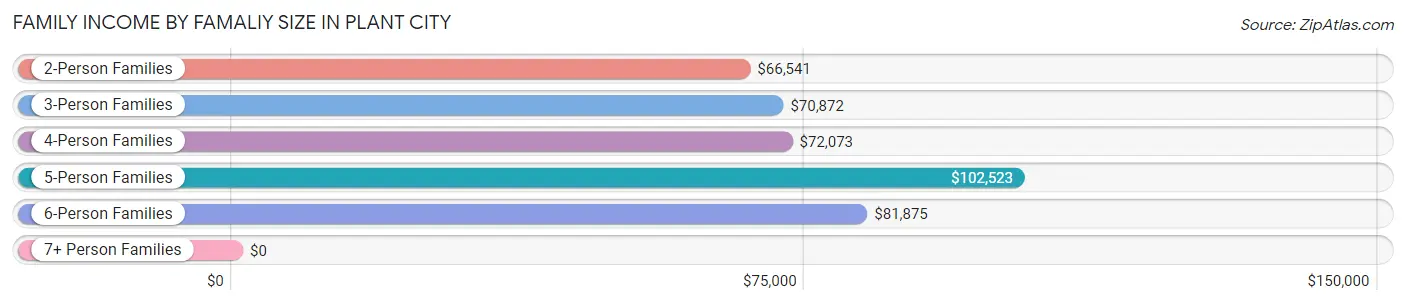
| Income Bracket | # Families | Median Income |
| 2-Person Families | 4,132 (44.0%) | $66,541 |
| 3-Person Families | 1,831 (19.5%) | $70,872 |
| 4-Person Families | 1,930 (20.5%) | $72,073 |
| 5-Person Families | 999 (10.6%) | $102,523 |
| 6-Person Families | 377 (4.0%) | $81,875 |
| 7+ Person Families | 125 (1.3%) | $0 |
| Total | 9,394 (100.0%) | $71,712 |
Family Income by Number of Earners in Plant City
The median family income in Plant City is $71,712, with families comprising 3+ earners (1,295) having the highest median family income of $118,153, while families with no earners (1,202) have the lowest median family income of $31,389, accounting for 13.8% and 12.8% of families, respectively.
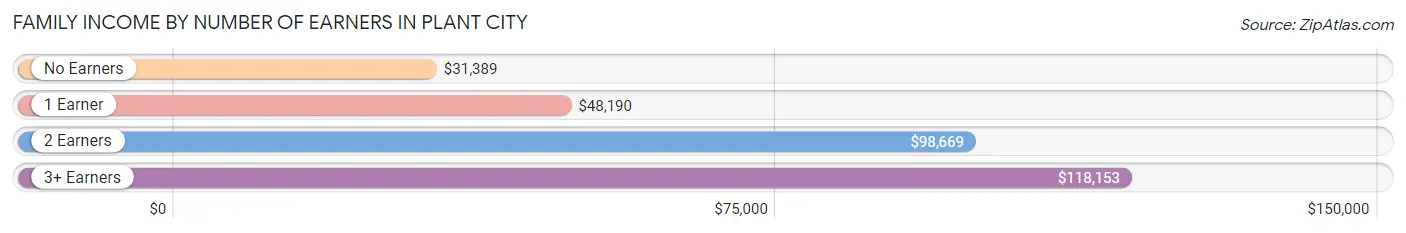
| Number of Earners | # Families | Median Income |
| No Earners | 1,202 (12.8%) | $31,389 |
| 1 Earner | 3,160 (33.6%) | $48,190 |
| 2 Earners | 3,737 (39.8%) | $98,669 |
| 3+ Earners | 1,295 (13.8%) | $118,153 |
| Total | 9,394 (100.0%) | $71,712 |
Household Income in Plant City
Household Income Brackets in Plant City
With 2,682 households falling in the category, the $50,000 to $74,999 income range is the most frequent in Plant City, accounting for 18.5% of all households. In contrast, only 450 households (3.1%) fall into the $10,000 to $14,999 income bracket, making it the least populous group.
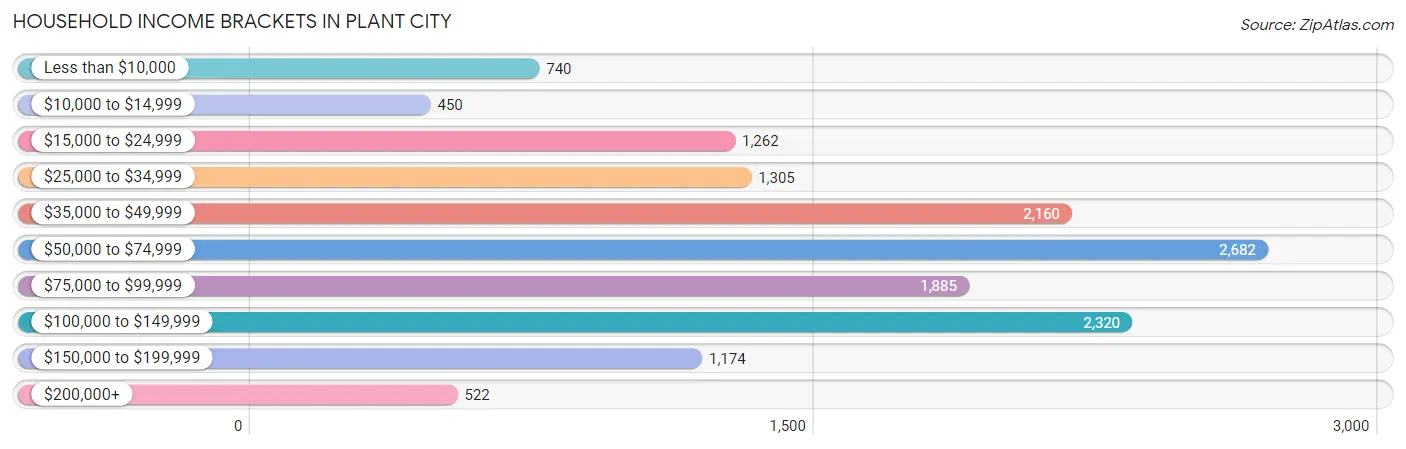
| Income Bracket | # Households | % Households |
| Less than $10,000 | 740 | 5.1% |
| $10,000 to $14,999 | 450 | 3.1% |
| $15,000 to $24,999 | 1,262 | 8.7% |
| $25,000 to $34,999 | 1,305 | 9.0% |
| $35,000 to $49,999 | 2,160 | 14.9% |
| $50,000 to $74,999 | 2,682 | 18.5% |
| $75,000 to $99,999 | 1,885 | 13.0% |
| $100,000 to $149,999 | 2,320 | 16.0% |
| $150,000 to $199,999 | 1,174 | 8.1% |
| $200,000+ | 522 | 3.6% |
Household Income by Householder Age in Plant City
The median household income in Plant City is $62,015, with the highest median household income of $71,475 found in the 45 to 64 years age bracket for the primary householder. A total of 5,741 households (39.6%) fall into this category. Meanwhile, the 65+ years age bracket for the primary householder has the lowest median household income of $50,061, with 3,031 households (20.9%) in this group.
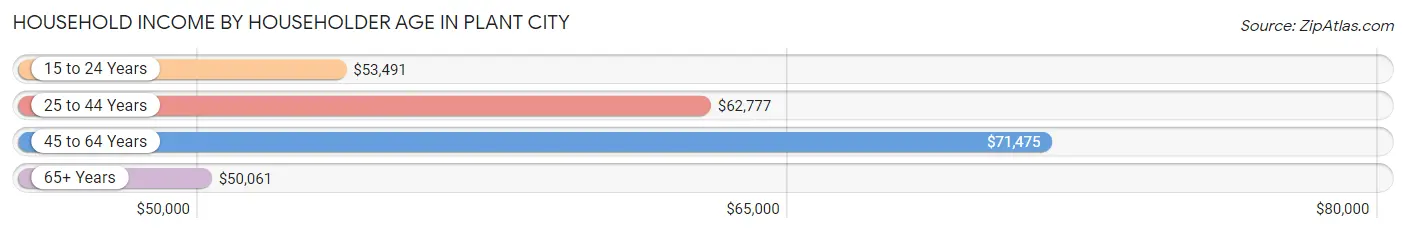
| Income Bracket | # Households | Median Income |
| 15 to 24 Years | 507 (3.5%) | $53,491 |
| 25 to 44 Years | 5,221 (36.0%) | $62,777 |
| 45 to 64 Years | 5,741 (39.6%) | $71,475 |
| 65+ Years | 3,031 (20.9%) | $50,061 |
| Total | 14,500 (100.0%) | $62,015 |
Poverty in Plant City
Income Below Poverty by Sex and Age in Plant City
With 13.4% poverty level for males and 17.3% for females among the residents of Plant City, 12 to 14 year old males and 15 year old females are the most vulnerable to poverty, with 327 males (34.2%) and 104 females (34.5%) in their respective age groups living below the poverty level.
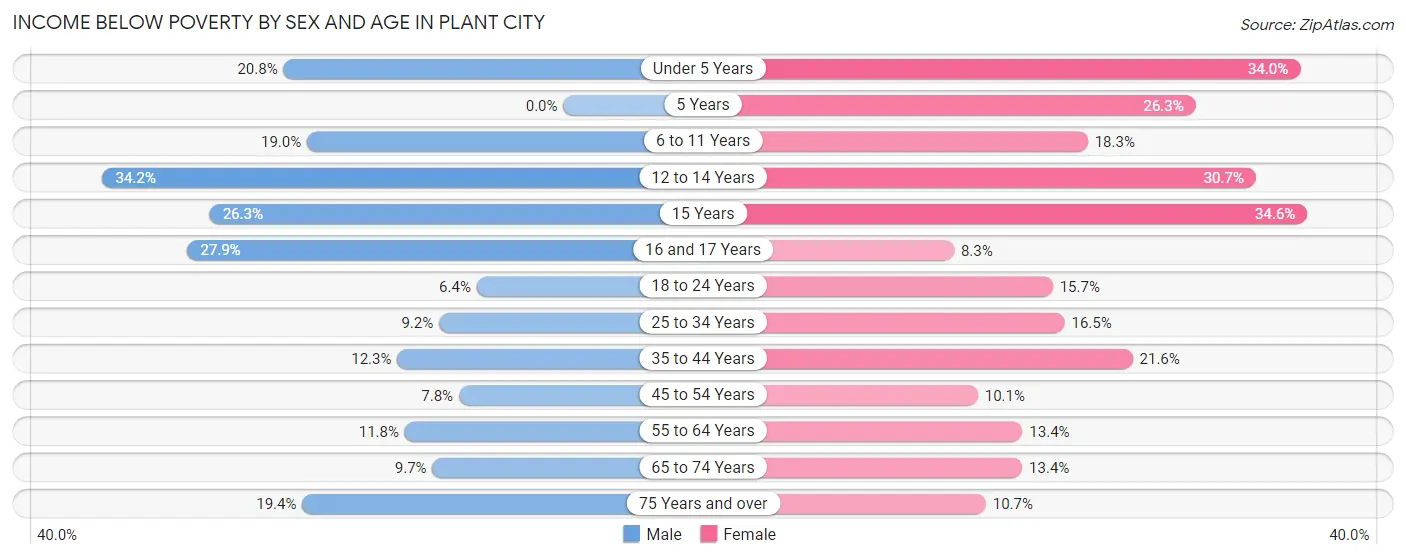
| Age Bracket | Male | Female |
| Under 5 Years | 213 (20.8%) | 397 (34.0%) |
| 5 Years | 0 (0.0%) | 94 (26.3%) |
| 6 to 11 Years | 295 (19.0%) | 229 (18.3%) |
| 12 to 14 Years | 327 (34.2%) | 240 (30.7%) |
| 15 Years | 79 (26.3%) | 104 (34.5%) |
| 16 and 17 Years | 144 (27.9%) | 50 (8.3%) |
| 18 to 24 Years | 124 (6.4%) | 274 (15.7%) |
| 25 to 34 Years | 260 (9.2%) | 452 (16.5%) |
| 35 to 44 Years | 417 (12.3%) | 642 (21.6%) |
| 45 to 54 Years | 183 (7.7%) | 244 (10.1%) |
| 55 to 64 Years | 271 (11.8%) | 352 (13.4%) |
| 65 to 74 Years | 132 (9.7%) | 238 (13.4%) |
| 75 Years and over | 149 (19.4%) | 112 (10.7%) |
| Total | 2,594 (13.4%) | 3,428 (17.3%) |
Income Above Poverty by Sex and Age in Plant City
According to the poverty statistics in Plant City, males aged 5 years and females aged 16 and 17 years are the age groups that are most secure financially, with 100.0% of males and 91.7% of females in these age groups living above the poverty line.
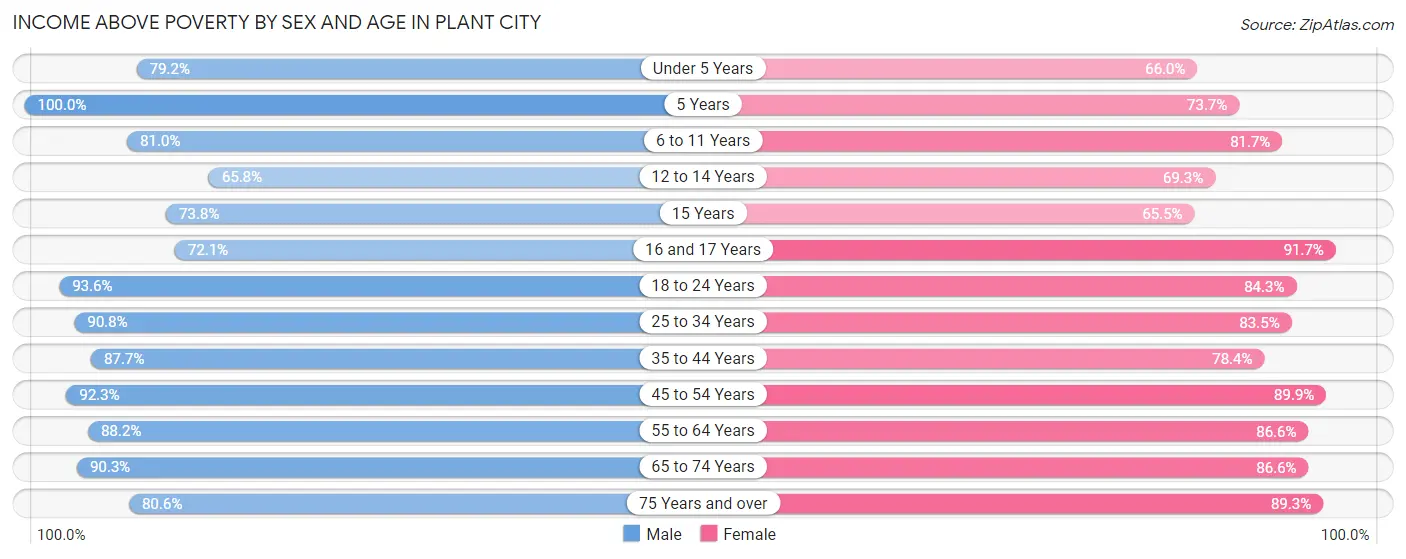
| Age Bracket | Male | Female |
| Under 5 Years | 812 (79.2%) | 770 (66.0%) |
| 5 Years | 144 (100.0%) | 264 (73.7%) |
| 6 to 11 Years | 1,255 (81.0%) | 1,025 (81.7%) |
| 12 to 14 Years | 629 (65.8%) | 541 (69.3%) |
| 15 Years | 222 (73.8%) | 197 (65.4%) |
| 16 and 17 Years | 372 (72.1%) | 550 (91.7%) |
| 18 to 24 Years | 1,803 (93.6%) | 1,476 (84.3%) |
| 25 to 34 Years | 2,557 (90.8%) | 2,280 (83.5%) |
| 35 to 44 Years | 2,964 (87.7%) | 2,332 (78.4%) |
| 45 to 54 Years | 2,178 (92.2%) | 2,172 (89.9%) |
| 55 to 64 Years | 2,032 (88.2%) | 2,273 (86.6%) |
| 65 to 74 Years | 1,226 (90.3%) | 1,539 (86.6%) |
| 75 Years and over | 620 (80.6%) | 936 (89.3%) |
| Total | 16,814 (86.6%) | 16,355 (82.7%) |
Income Below Poverty Among Married-Couple Families in Plant City
The poverty statistics for married-couple families in Plant City show that 8.8% or 573 of the total 6,527 families live below the poverty line. Families with 5 or more children have the highest poverty rate of 76.9%, comprising of 30 families. On the other hand, families with 1 or 2 children have the lowest poverty rate of 2.9%, which includes 61 families.
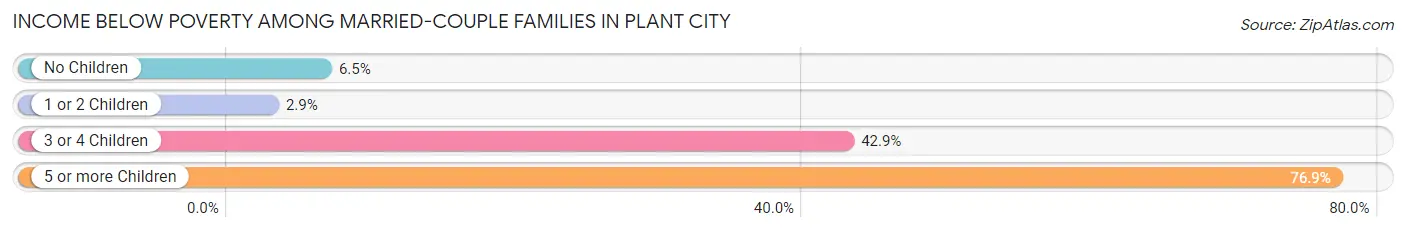
| Children | Above Poverty | Below Poverty |
| No Children | 3,559 (93.5%) | 249 (6.5%) |
| 1 or 2 Children | 2,076 (97.2%) | 61 (2.9%) |
| 3 or 4 Children | 310 (57.1%) | 233 (42.9%) |
| 5 or more Children | 9 (23.1%) | 30 (76.9%) |
| Total | 5,954 (91.2%) | 573 (8.8%) |
Income Below Poverty Among Single-Parent Households in Plant City
According to the poverty data in Plant City, 11.3% or 87 single-father households and 23.2% or 486 single-mother households are living below the poverty line. Among single-father households, those with 5 or more children have the highest poverty rate, with 5 households (100.0%) experiencing poverty. Likewise, among single-mother households, those with 5 or more children have the highest poverty rate, with 6 households (100.0%) falling below the poverty line.
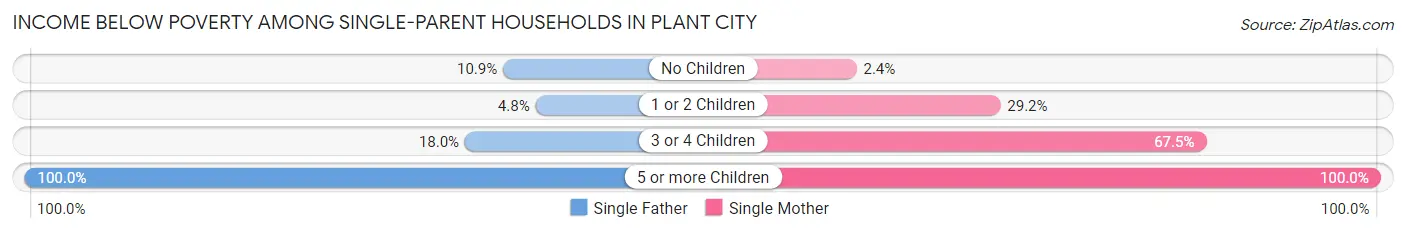
| Children | Single Father | Single Mother |
| No Children | 27 (10.9%) | 17 (2.4%) |
| 1 or 2 Children | 14 (4.8%) | 359 (29.2%) |
| 3 or 4 Children | 41 (18.0%) | 104 (67.5%) |
| 5 or more Children | 5 (100.0%) | 6 (100.0%) |
| Total | 87 (11.3%) | 486 (23.2%) |
Income Below Poverty Among Married-Couple vs Single-Parent Households in Plant City
The poverty data for Plant City shows that 573 of the married-couple family households (8.8%) and 573 of the single-parent households (20.0%) are living below the poverty level. Within the married-couple family households, those with 5 or more children have the highest poverty rate, with 30 households (76.9%) falling below the poverty line. Among the single-parent households, those with 5 or more children have the highest poverty rate, with 11 household (100.0%) living below poverty.
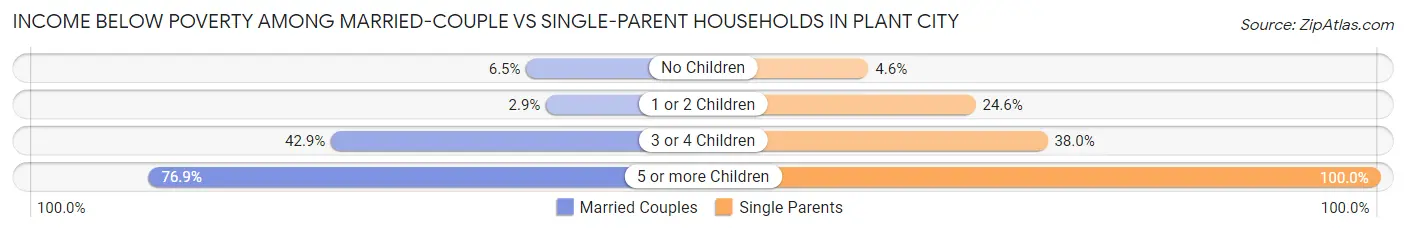
| Children | Married-Couple Families | Single-Parent Households |
| No Children | 249 (6.5%) | 44 (4.6%) |
| 1 or 2 Children | 61 (2.9%) | 373 (24.6%) |
| 3 or 4 Children | 233 (42.9%) | 145 (38.0%) |
| 5 or more Children | 30 (76.9%) | 11 (100.0%) |
| Total | 573 (8.8%) | 573 (20.0%) |
Race in Plant City
The most populous races in Plant City are White / Caucasian (25,993 | 65.5%), Hispanic or Latino (13,256 | 33.4%), and Black / African American (5,393 | 13.6%).
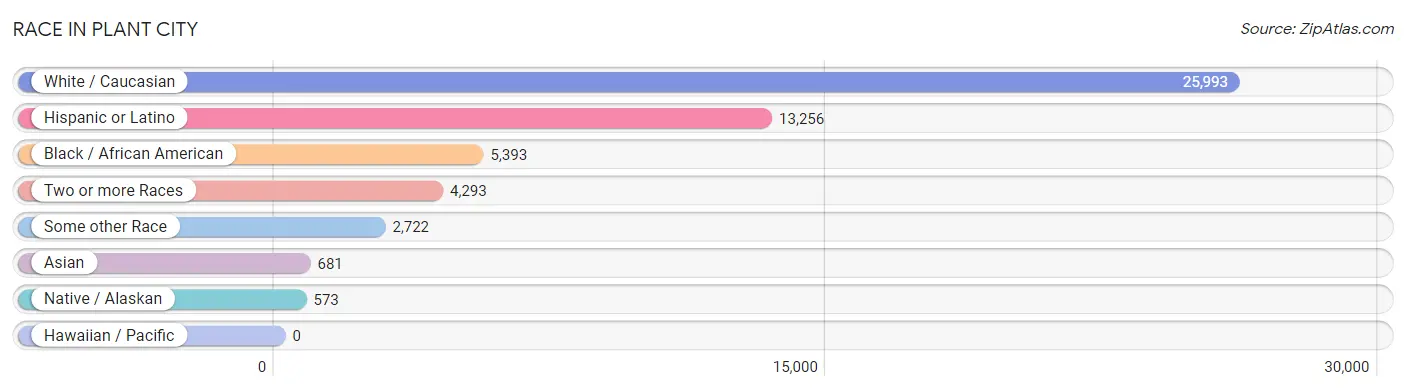
| Race | # Population | % Population |
| Asian | 681 | 1.7% |
| Black / African American | 5,393 | 13.6% |
| Hawaiian / Pacific | 0 | 0.0% |
| Hispanic or Latino | 13,256 | 33.4% |
| Native / Alaskan | 573 | 1.4% |
| White / Caucasian | 25,993 | 65.5% |
| Two or more Races | 4,293 | 10.8% |
| Some other Race | 2,722 | 6.9% |
| Total | 39,655 | 100.0% |
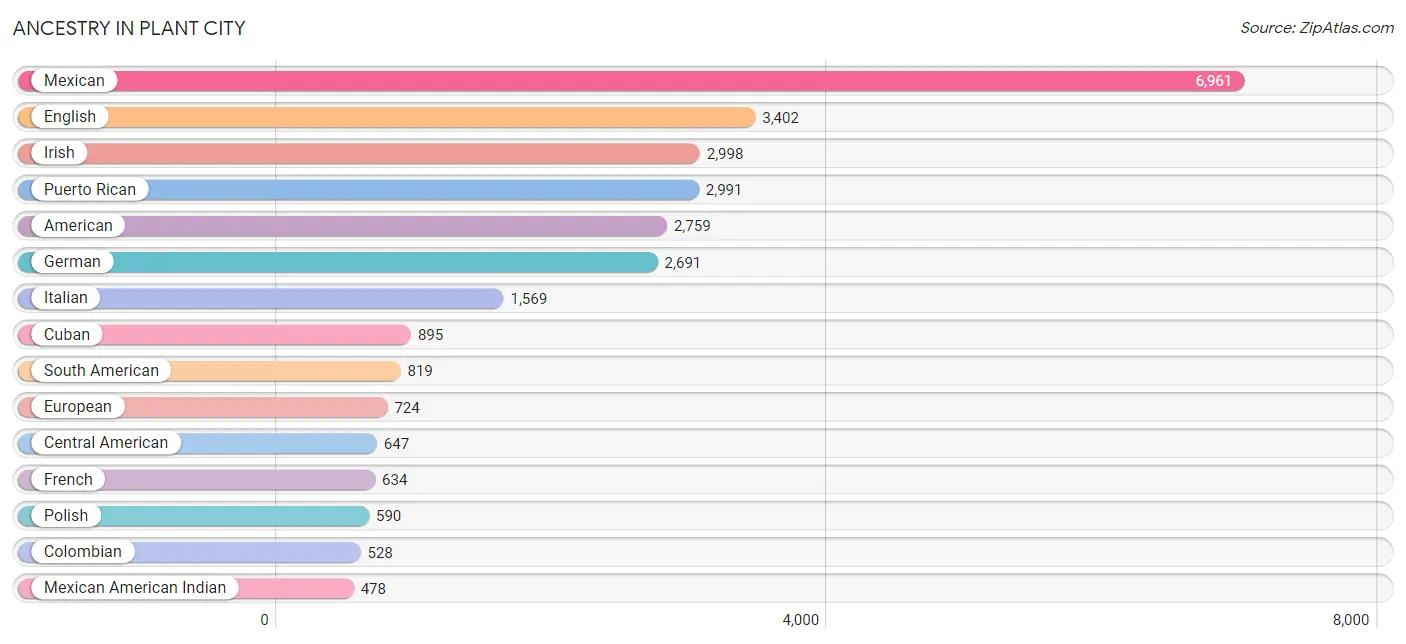
Ancestry in Plant City
The most populous ancestries reported in Plant City are Mexican (6,961 | 17.5%), English (3,402 | 8.6%), Irish (2,998 | 7.6%), Puerto Rican (2,991 | 7.5%), and American (2,759 | 7.0%), together accounting for 48.2% of all Plant City residents.
| Ancestry | # Population | % Population |
| African | 136 | 0.3% |
| American | 2,759 | 7.0% |
| Arab | 69 | 0.2% |
| Australian | 20 | 0.1% |
| Austrian | 25 | 0.1% |
| Bahamian | 28 | 0.1% |
| Bangladeshi | 24 | 0.1% |
| Belgian | 6 | 0.0% |
| Blackfeet | 6 | 0.0% |
| British | 245 | 0.6% |
| British West Indian | 163 | 0.4% |
| Burmese | 69 | 0.2% |
| Canadian | 43 | 0.1% |
| Cape Verdean | 62 | 0.2% |
| Central American | 647 | 1.6% |
| Central American Indian | 26 | 0.1% |
| Cherokee | 98 | 0.3% |
| Chilean | 17 | 0.0% |
| Colombian | 528 | 1.3% |
| Cree | 6 | 0.0% |
| Creek | 6 | 0.0% |
| Croatian | 11 | 0.0% |
| Cuban | 895 | 2.3% |
| Czech | 25 | 0.1% |
| Danish | 28 | 0.1% |
| Dominican | 318 | 0.8% |
| Dutch | 344 | 0.9% |
| Eastern European | 21 | 0.1% |
| Ecuadorian | 91 | 0.2% |
| English | 3,402 | 8.6% |
| European | 724 | 1.8% |
| Finnish | 16 | 0.0% |
| French | 634 | 1.6% |
| French Canadian | 100 | 0.3% |
| German | 2,691 | 6.8% |
| Greek | 171 | 0.4% |
| Guatemalan | 380 | 1.0% |
| Haitian | 35 | 0.1% |
| Honduran | 67 | 0.2% |
| Hungarian | 59 | 0.2% |
| Icelander | 10 | 0.0% |
| Indian (Asian) | 36 | 0.1% |
| Inupiat | 47 | 0.1% |
| Irish | 2,998 | 7.6% |
| Israeli | 11 | 0.0% |
| Italian | 1,569 | 4.0% |
| Jamaican | 42 | 0.1% |
| Japanese | 159 | 0.4% |
| Korean | 86 | 0.2% |
| Lebanese | 44 | 0.1% |
| Lithuanian | 32 | 0.1% |
| Malaysian | 157 | 0.4% |
| Mexican | 6,961 | 17.5% |
| Mexican American Indian | 478 | 1.2% |
| Moroccan | 1 | 0.0% |
| Nicaraguan | 175 | 0.4% |
| Northern European | 10 | 0.0% |
| Norwegian | 87 | 0.2% |
| Pakistani | 28 | 0.1% |
| Palestinian | 24 | 0.1% |
| Panamanian | 10 | 0.0% |
| Peruvian | 108 | 0.3% |
| Polish | 590 | 1.5% |
| Portuguese | 205 | 0.5% |
| Puerto Rican | 2,991 | 7.5% |
| Romanian | 18 | 0.1% |
| Russian | 38 | 0.1% |
| Salvadoran | 15 | 0.0% |
| Scandinavian | 115 | 0.3% |
| Scotch-Irish | 352 | 0.9% |
| Scottish | 324 | 0.8% |
| Serbian | 13 | 0.0% |
| Slovak | 83 | 0.2% |
| South American | 819 | 2.1% |
| Spaniard | 77 | 0.2% |
| Sri Lankan | 135 | 0.3% |
| Subsaharan African | 198 | 0.5% |
| Swedish | 104 | 0.3% |
| Swiss | 38 | 0.1% |
| Thai | 104 | 0.3% |
| Trinidadian and Tobagonian | 451 | 1.1% |
| Turkish | 32 | 0.1% |
| Ukrainian | 154 | 0.4% |
| Uruguayan | 36 | 0.1% |
| Venezuelan | 39 | 0.1% |
| Welsh | 137 | 0.4% |
| West Indian | 11 | 0.0% | View All 87 Rows |
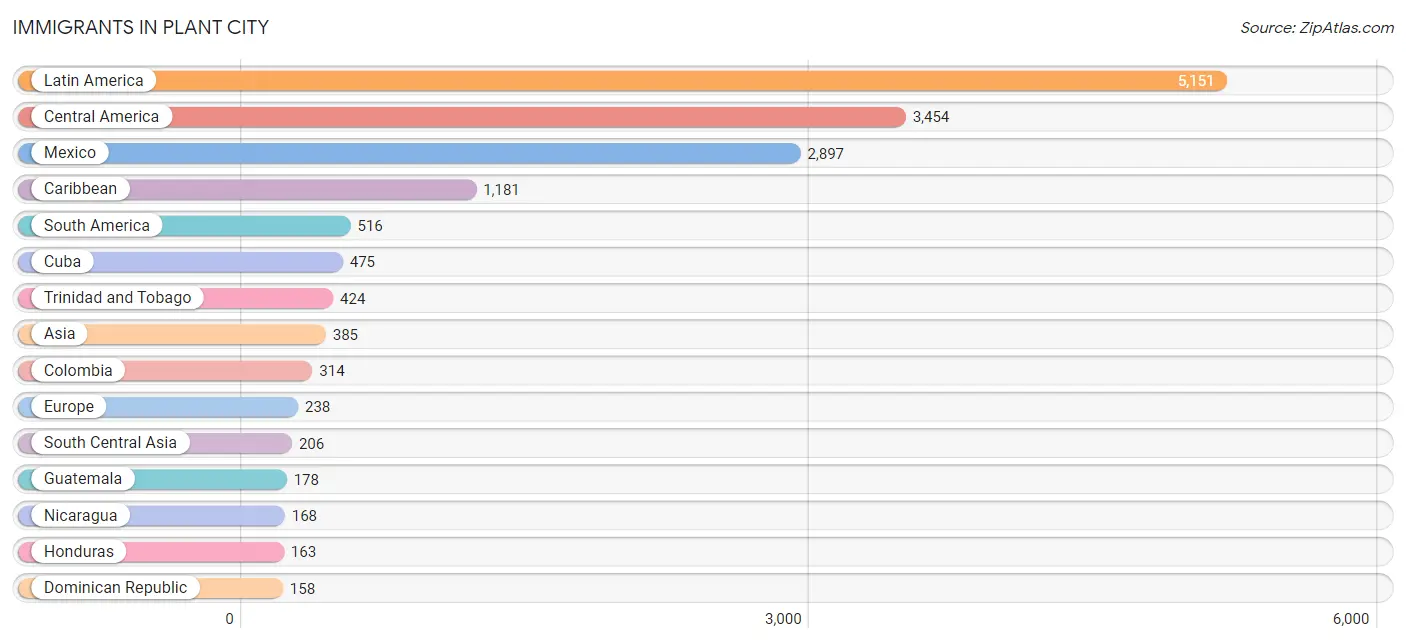
Immigrants in Plant City
The most numerous immigrant groups reported in Plant City came from Latin America (5,151 | 13.0%), Central America (3,454 | 8.7%), Mexico (2,897 | 7.3%), Caribbean (1,181 | 3.0%), and South America (516 | 1.3%), together accounting for 33.3% of all Plant City residents.
| Immigration Origin | # Population | % Population |
| Africa | 52 | 0.1% |
| Asia | 385 | 1.0% |
| Australia | 22 | 0.1% |
| Belgium | 28 | 0.1% |
| Cambodia | 18 | 0.1% |
| Canada | 62 | 0.2% |
| Caribbean | 1,181 | 3.0% |
| Central America | 3,454 | 8.7% |
| Chile | 17 | 0.0% |
| Colombia | 314 | 0.8% |
| Cuba | 475 | 1.2% |
| Dominican Republic | 158 | 0.4% |
| Eastern Africa | 4 | 0.0% |
| Eastern Asia | 8 | 0.0% |
| Eastern Europe | 15 | 0.0% |
| England | 89 | 0.2% |
| Europe | 238 | 0.6% |
| Germany | 46 | 0.1% |
| Guatemala | 178 | 0.4% |
| Guyana | 43 | 0.1% |
| Honduras | 163 | 0.4% |
| India | 140 | 0.4% |
| Jamaica | 56 | 0.1% |
| Kenya | 4 | 0.0% |
| Korea | 8 | 0.0% |
| Laos | 58 | 0.2% |
| Latin America | 5,151 | 13.0% |
| Mexico | 2,897 | 7.3% |
| Middle Africa | 33 | 0.1% |
| Netherlands | 23 | 0.1% |
| Nicaragua | 168 | 0.4% |
| Northern Europe | 118 | 0.3% |
| Oceania | 22 | 0.1% |
| Pakistan | 58 | 0.2% |
| Panama | 48 | 0.1% |
| Peru | 54 | 0.1% |
| Philippines | 52 | 0.1% |
| Russia | 15 | 0.0% |
| South Africa | 15 | 0.0% |
| South America | 516 | 1.3% |
| South Central Asia | 206 | 0.5% |
| South Eastern Asia | 156 | 0.4% |
| Southern Europe | 8 | 0.0% |
| Spain | 8 | 0.0% |
| Thailand | 19 | 0.1% |
| Trinidad and Tobago | 424 | 1.1% |
| Uruguay | 36 | 0.1% |
| Venezuela | 52 | 0.1% |
| Vietnam | 9 | 0.0% |
| Western Europe | 97 | 0.2% | View All 50 Rows |
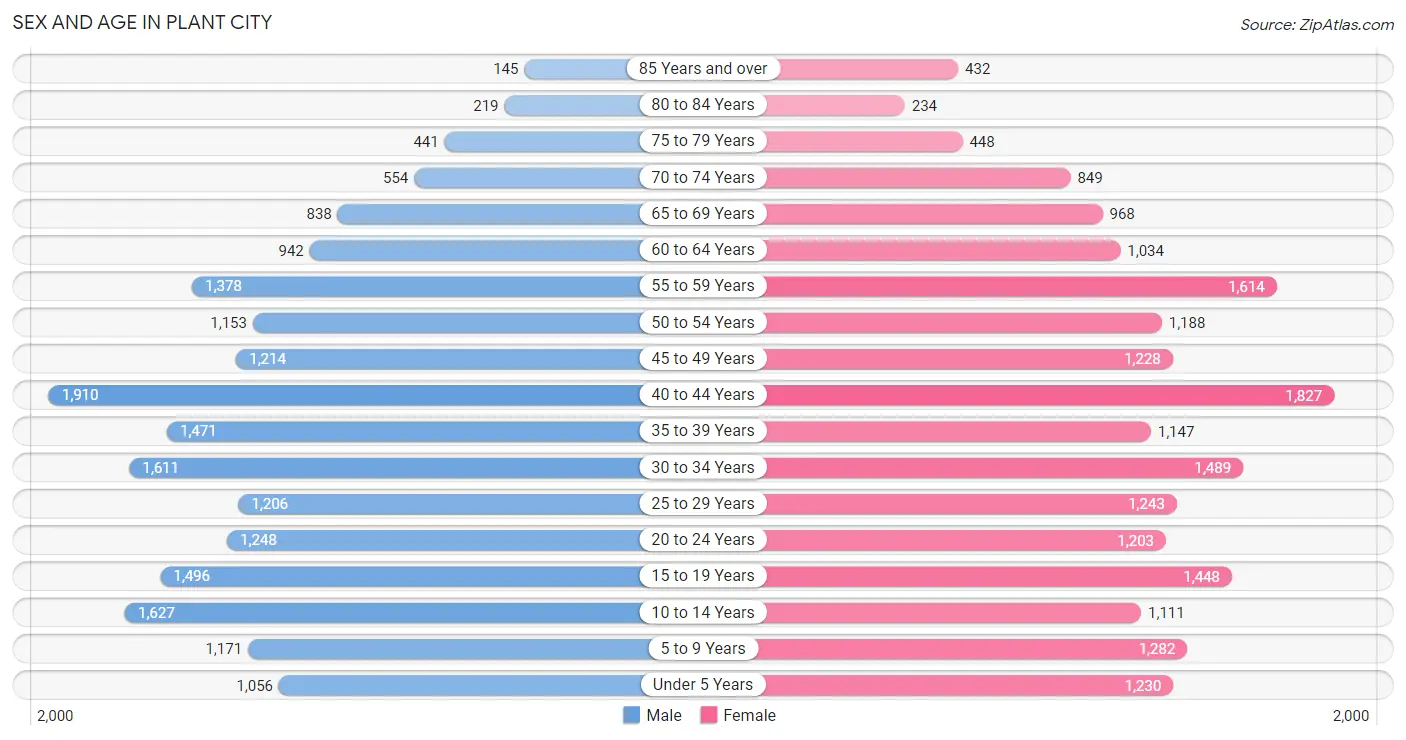
Sex and Age in Plant City
Sex and Age in Plant City
The most populous age groups in Plant City are 40 to 44 Years (1,910 | 9.7%) for men and 40 to 44 Years (1,827 | 9.1%) for women.
| Age Bracket | Male | Female |
| Under 5 Years | 1,056 (5.4%) | 1,230 (6.2%) |
| 5 to 9 Years | 1,171 (5.9%) | 1,282 (6.4%) |
| 10 to 14 Years | 1,627 (8.3%) | 1,111 (5.6%) |
| 15 to 19 Years | 1,496 (7.6%) | 1,448 (7.2%) |
| 20 to 24 Years | 1,248 (6.3%) | 1,203 (6.0%) |
| 25 to 29 Years | 1,206 (6.1%) | 1,243 (6.2%) |
| 30 to 34 Years | 1,611 (8.2%) | 1,489 (7.4%) |
| 35 to 39 Years | 1,471 (7.5%) | 1,147 (5.7%) |
| 40 to 44 Years | 1,910 (9.7%) | 1,827 (9.1%) |
| 45 to 49 Years | 1,214 (6.2%) | 1,228 (6.1%) |
| 50 to 54 Years | 1,153 (5.9%) | 1,188 (5.9%) |
| 55 to 59 Years | 1,378 (7.0%) | 1,614 (8.1%) |
| 60 to 64 Years | 942 (4.8%) | 1,034 (5.2%) |
| 65 to 69 Years | 838 (4.3%) | 968 (4.9%) |
| 70 to 74 Years | 554 (2.8%) | 849 (4.3%) |
| 75 to 79 Years | 441 (2.2%) | 448 (2.2%) |
| 80 to 84 Years | 219 (1.1%) | 234 (1.2%) |
| 85 Years and over | 145 (0.7%) | 432 (2.2%) |
| Total | 19,680 (100.0%) | 19,975 (100.0%) |
Families and Households in Plant City
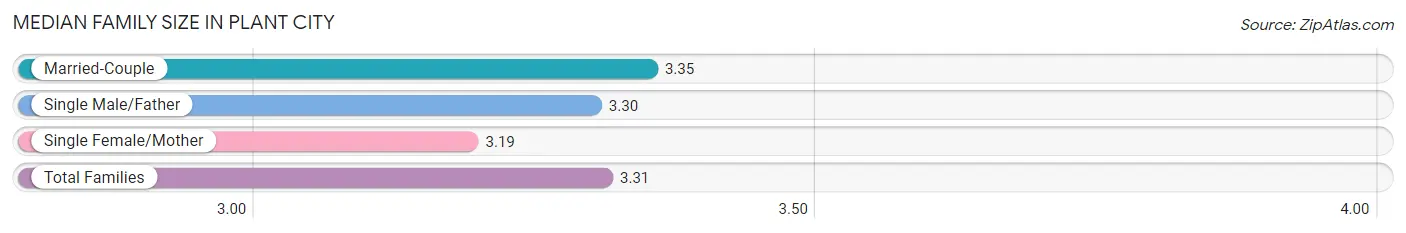
Median Family Size in Plant City
The median family size in Plant City is 3.31 persons per family, with married-couple families (6,527 | 69.5%) accounting for the largest median family size of 3.35 persons per family. On the other hand, single female/mother families (2,097 | 22.3%) represent the smallest median family size with 3.19 persons per family.
| Family Type | # Families | Family Size |
| Married-Couple | 6,527 (69.5%) | 3.35 |
| Single Male/Father | 770 (8.2%) | 3.30 |
| Single Female/Mother | 2,097 (22.3%) | 3.19 |
| Total Families | 9,394 (100.0%) | 3.31 |
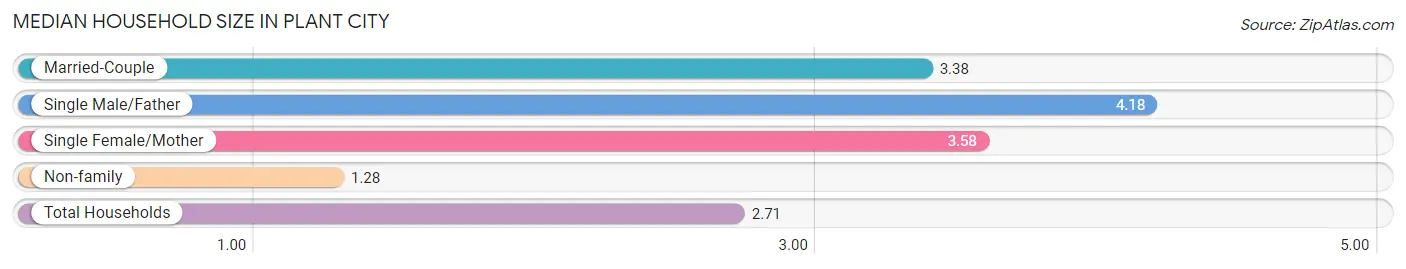
Median Household Size in Plant City
The median household size in Plant City is 2.71 persons per household, with single male/father households (770 | 5.3%) accounting for the largest median household size of 4.18 persons per household. non-family households (5,106 | 35.2%) represent the smallest median household size with 1.28 persons per household.
| Household Type | # Households | Household Size |
| Married-Couple | 6,527 (45.0%) | 3.38 |
| Single Male/Father | 770 (5.3%) | 4.18 |
| Single Female/Mother | 2,097 (14.5%) | 3.58 |
| Non-family | 5,106 (35.2%) | 1.28 |
| Total Households | 14,500 (100.0%) | 2.71 |
Household Size by Marriage Status in Plant City
Out of a total of 14,500 households in Plant City, 9,394 (64.8%) are family households, while 5,106 (35.2%) are nonfamily households. The most numerous type of family households are 2-person households, comprising 3,565, and the most common type of nonfamily households are 1-person households, comprising 4,242.
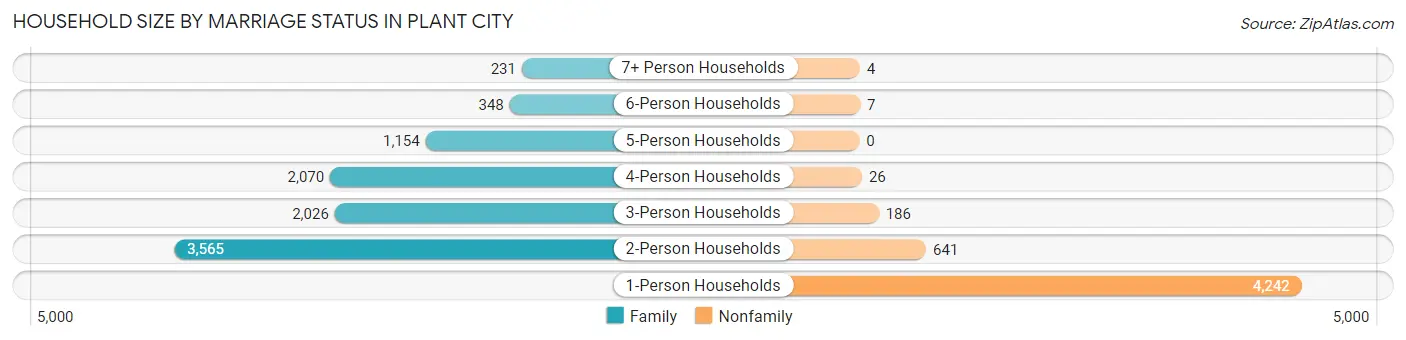
| Household Size | Family Households | Nonfamily Households |
| 1-Person Households | - | 4,242 (29.3%) |
| 2-Person Households | 3,565 (24.6%) | 641 (4.4%) |
| 3-Person Households | 2,026 (14.0%) | 186 (1.3%) |
| 4-Person Households | 2,070 (14.3%) | 26 (0.2%) |
| 5-Person Households | 1,154 (8.0%) | 0 (0.0%) |
| 6-Person Households | 348 (2.4%) | 7 (0.1%) |
| 7+ Person Households | 231 (1.6%) | 4 (0.0%) |
| Total | 9,394 (64.8%) | 5,106 (35.2%) |
Female Fertility in Plant City
Fertility by Age in Plant City
Average fertility rate in Plant City is 79.0 births per 1,000 women. Women in the age bracket of 20 to 34 years have the highest fertility rate with 149.0 births per 1,000 women. Women in the age bracket of 20 to 34 years acount for 74.6% of all women with births.
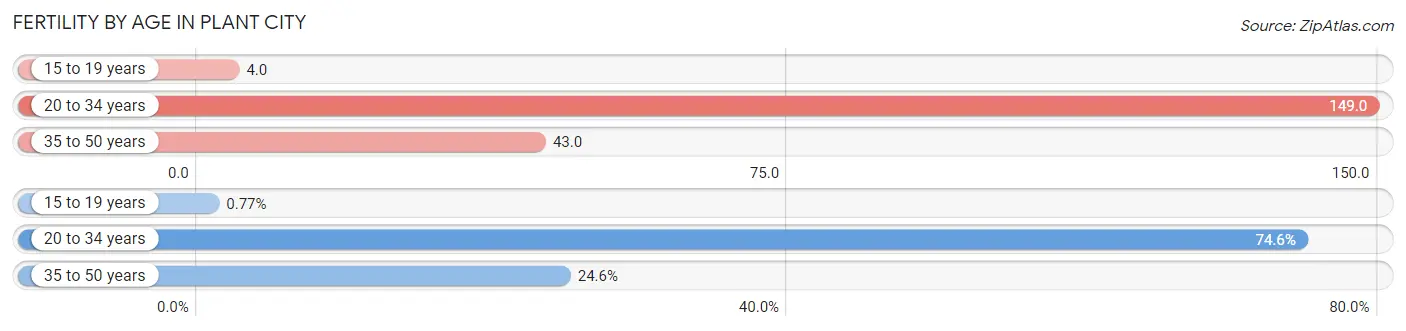
| Age Bracket | Women with Births | Births / 1,000 Women |
| 15 to 19 years | 6 (0.8%) | 4.0 |
| 20 to 34 years | 585 (74.6%) | 149.0 |
| 35 to 50 years | 193 (24.6%) | 43.0 |
| Total | 784 (100.0%) | 79.0 |
Fertility by Age by Marriage Status in Plant City
47.1% of women with births (784) in Plant City are married. The highest percentage of unmarried women with births falls into 15 to 19 years age bracket with 100.0% of them unmarried at the time of birth, while the lowest percentage of unmarried women with births belong to 20 to 34 years age bracket with 42.0% of them unmarried.
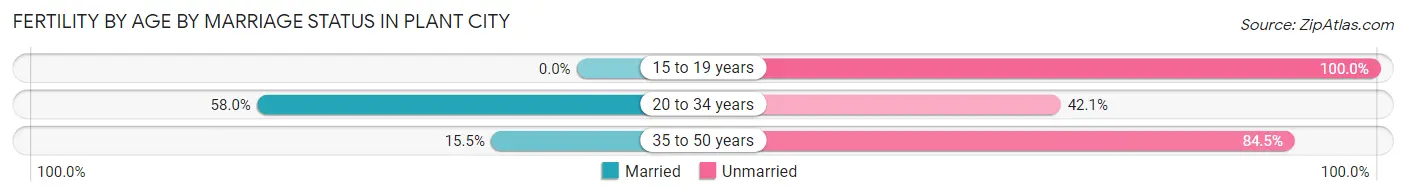
| Age Bracket | Married | Unmarried |
| 15 to 19 years | 0 (0.0%) | 6 (100.0%) |
| 20 to 34 years | 339 (58.0%) | 246 (42.0%) |
| 35 to 50 years | 30 (15.5%) | 163 (84.5%) |
| Total | 369 (47.1%) | 415 (52.9%) |
Fertility by Education in Plant City
Average fertility rate in Plant City is 79.0 births per 1,000 women. Women with the education attainment of college or associate's degree have the highest fertility rate of 148.0 births per 1,000 women, while women with the education attainment of graduate degree have the lowest fertility at 20.0 births per 1,000 women. Women with the education attainment of college or associate's degree represent 56.1% of all women with births.
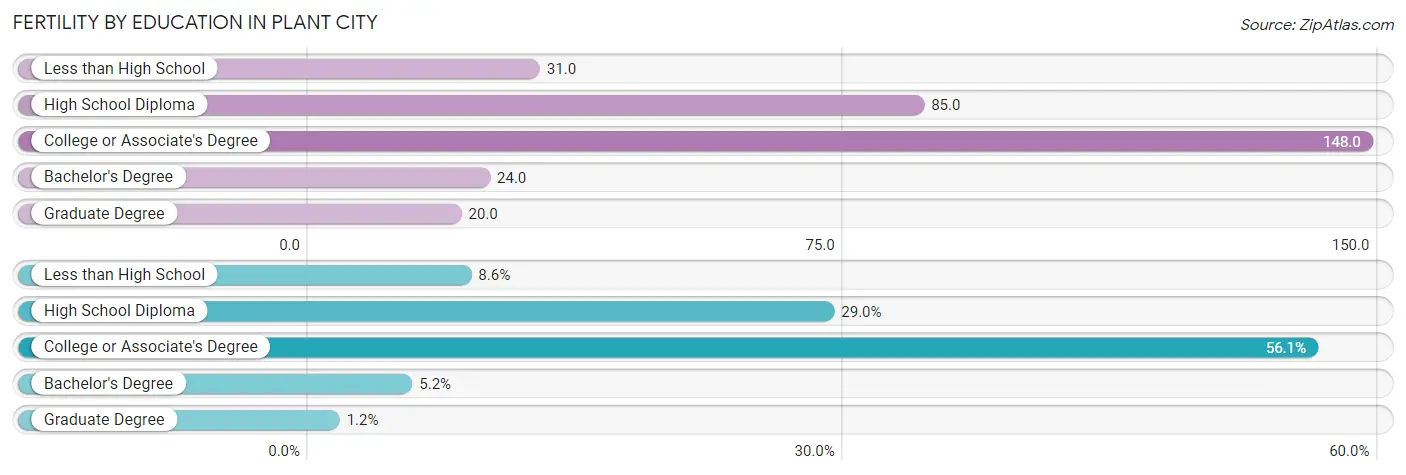
| Educational Attainment | Women with Births | Births / 1,000 Women |
| Less than High School | 67 (8.6%) | 31.0 |
| High School Diploma | 227 (28.9%) | 85.0 |
| College or Associate's Degree | 440 (56.1%) | 148.0 |
| Bachelor's Degree | 41 (5.2%) | 24.0 |
| Graduate Degree | 9 (1.1%) | 20.0 |
| Total | 784 (100.0%) | 79.0 |
Fertility by Education by Marriage Status in Plant City
52.9% of women with births in Plant City are unmarried. Women with the educational attainment of graduate degree are most likely to be married with 100.0% of them married at childbirth, while women with the educational attainment of bachelor's degree are least likely to be married with 75.6% of them unmarried at childbirth.
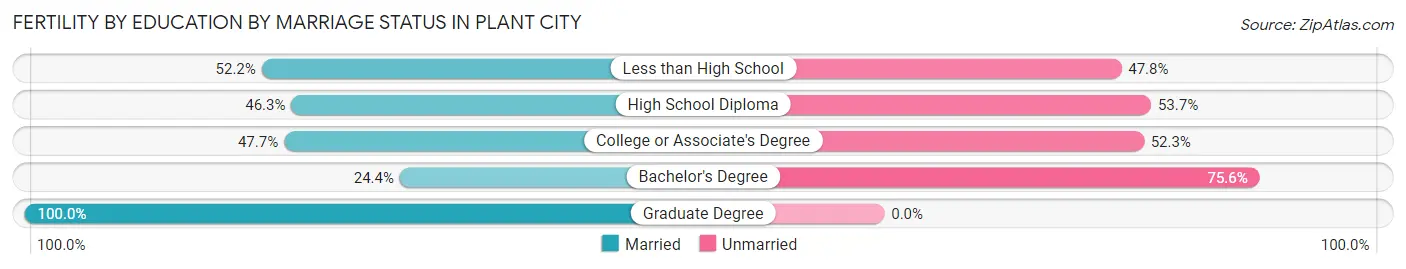
| Educational Attainment | Married | Unmarried |
| Less than High School | 35 (52.2%) | 32 (47.8%) |
| High School Diploma | 105 (46.3%) | 122 (53.7%) |
| College or Associate's Degree | 210 (47.7%) | 230 (52.3%) |
| Bachelor's Degree | 10 (24.4%) | 31 (75.6%) |
| Graduate Degree | 9 (100.0%) | 0 (0.0%) |
| Total | 369 (47.1%) | 415 (52.9%) |
Employment Characteristics in Plant City
Employment by Class of Employer in Plant City
Among the 20,077 employed individuals in Plant City, private company employees (14,788 | 73.7%), local government employees (1,623 | 8.1%), and not-for-profit organizations (1,343 | 6.7%) make up the most common classes of employment.
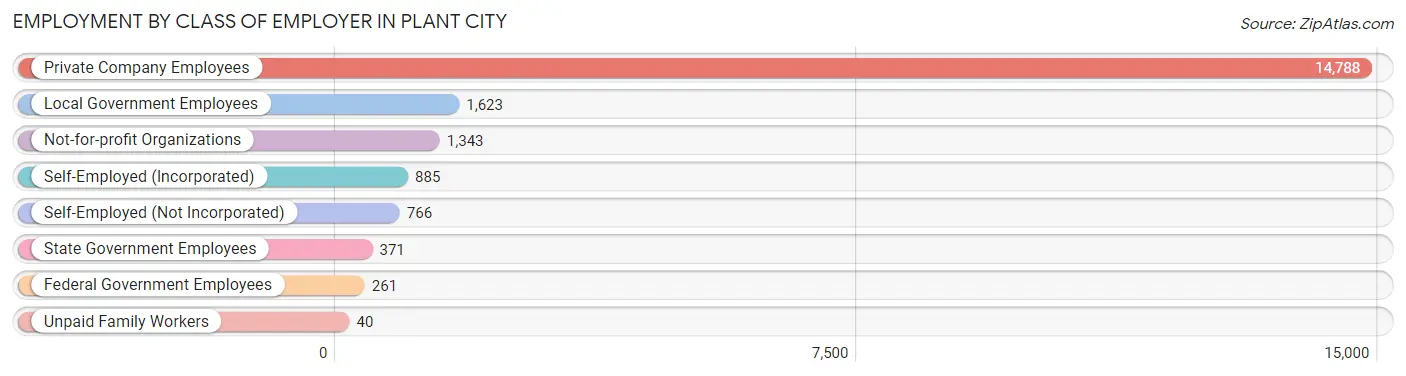
| Employer Class | # Employees | % Employees |
| Private Company Employees | 14,788 | 73.7% |
| Self-Employed (Incorporated) | 885 | 4.4% |
| Self-Employed (Not Incorporated) | 766 | 3.8% |
| Not-for-profit Organizations | 1,343 | 6.7% |
| Local Government Employees | 1,623 | 8.1% |
| State Government Employees | 371 | 1.8% |
| Federal Government Employees | 261 | 1.3% |
| Unpaid Family Workers | 40 | 0.2% |
| Total | 20,077 | 100.0% |
Employment Status by Age in Plant City
According to the labor force statistics for Plant City, out of the total population over 16 years of age (31,576), 66.6% or 21,030 individuals are in the labor force, with 3.2% or 673 of them unemployed. The age group with the highest labor force participation rate is 25 to 29 years, with 92.6% or 2,268 individuals in the labor force. Within the labor force, the 16 to 19 years age range has the highest percentage of unemployed individuals, with 10.6% or 103 of them being unemployed.
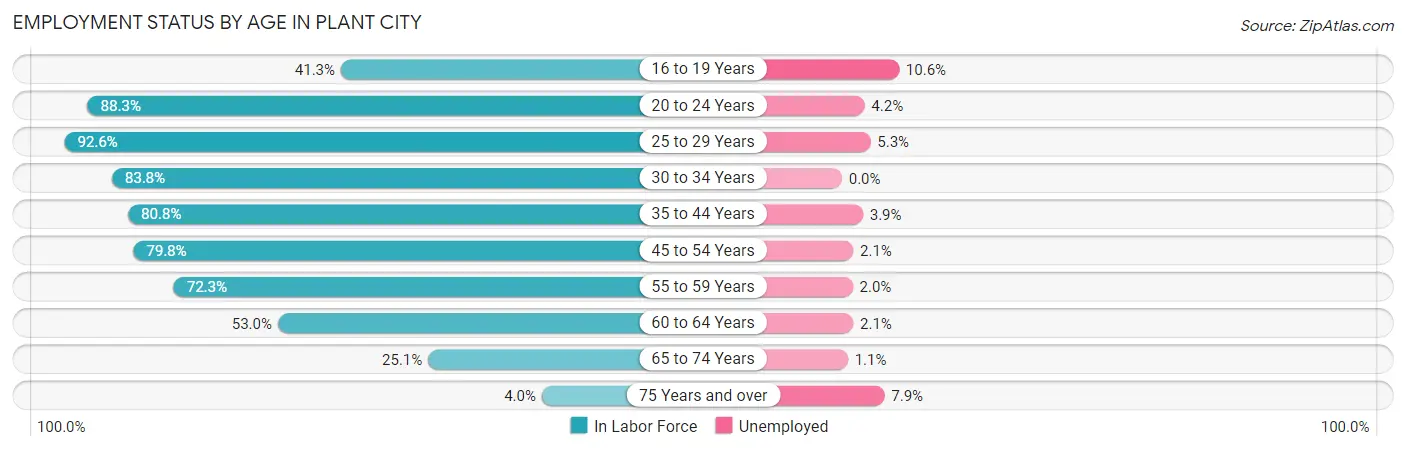
| Age Bracket | In Labor Force | Unemployed |
| 16 to 19 Years | 967 (41.3%) | 103 (10.6%) |
| 20 to 24 Years | 2,164 (88.3%) | 91 (4.2%) |
| 25 to 29 Years | 2,268 (92.6%) | 120 (5.3%) |
| 30 to 34 Years | 2,598 (83.8%) | 0 (0.0%) |
| 35 to 44 Years | 5,135 (80.8%) | 200 (3.9%) |
| 45 to 54 Years | 3,817 (79.8%) | 80 (2.1%) |
| 55 to 59 Years | 2,163 (72.3%) | 43 (2.0%) |
| 60 to 64 Years | 1,047 (53.0%) | 22 (2.1%) |
| 65 to 74 Years | 805 (25.1%) | 9 (1.1%) |
| 75 Years and over | 77 (4.0%) | 6 (7.9%) |
| Total | 21,030 (66.6%) | 673 (3.2%) |
Employment Status by Educational Attainment in Plant City
According to labor force statistics for Plant City, 78.6% of individuals (17,021) out of the total population between 25 and 64 years of age (21,655) are in the labor force, with 2.8% or 477 of them being unemployed. The group with the highest labor force participation rate are those with the educational attainment of bachelor's degree or higher, with 88.3% or 4,068 individuals in the labor force. Within the labor force, individuals with high school diploma education have the highest percentage of unemployment, with 4.5% or 232 of them being unemployed.
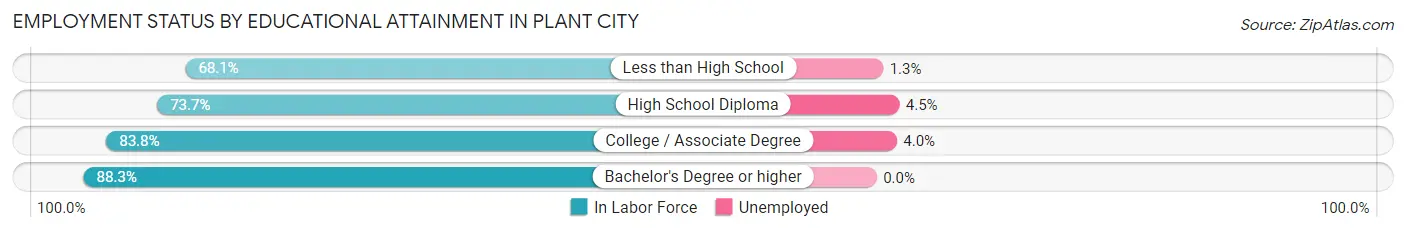
| Educational Attainment | In Labor Force | Unemployed |
| Less than High School | 2,684 (68.1%) | 51 (1.3%) |
| High School Diploma | 5,156 (73.7%) | 315 (4.5%) |
| College / Associate Degree | 5,121 (83.8%) | 244 (4.0%) |
| Bachelor's Degree or higher | 4,068 (88.3%) | 0 (0.0%) |
| Total | 17,021 (78.6%) | 606 (2.8%) |
Employment Occupations by Sex in Plant City
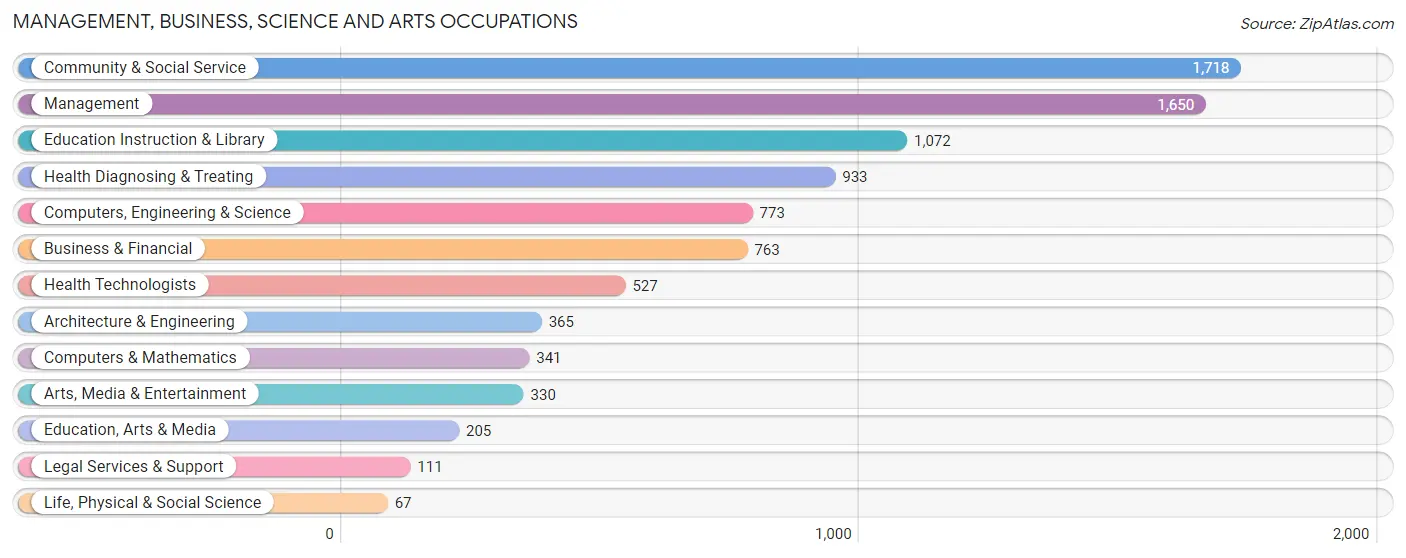
Management, Business, Science and Arts Occupations
The most common Management, Business, Science and Arts occupations in Plant City are Community & Social Service (1,718 | 8.4%), Management (1,650 | 8.1%), Education Instruction & Library (1,072 | 5.3%), Health Diagnosing & Treating (933 | 4.6%), and Computers, Engineering & Science (773 | 3.8%).
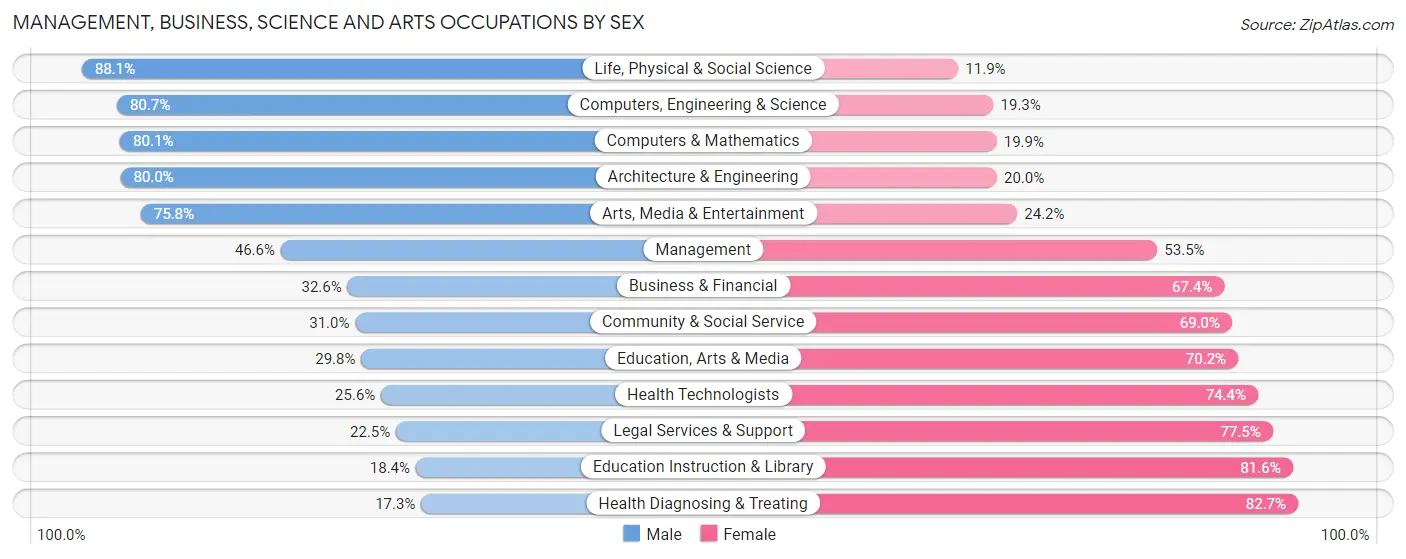
Management, Business, Science and Arts Occupations by Sex
Within the Management, Business, Science and Arts occupations in Plant City, the most male-oriented occupations are Life, Physical & Social Science (88.1%), Computers, Engineering & Science (80.7%), and Computers & Mathematics (80.1%), while the most female-oriented occupations are Health Diagnosing & Treating (82.7%), Education Instruction & Library (81.6%), and Legal Services & Support (77.5%).
| Occupation | Male | Female |
| Management | 768 (46.6%) | 882 (53.4%) |
| Business & Financial | 249 (32.6%) | 514 (67.4%) |
| Computers, Engineering & Science | 624 (80.7%) | 149 (19.3%) |
| Computers & Mathematics | 273 (80.1%) | 68 (19.9%) |
| Architecture & Engineering | 292 (80.0%) | 73 (20.0%) |
| Life, Physical & Social Science | 59 (88.1%) | 8 (11.9%) |
| Community & Social Service | 533 (31.0%) | 1,185 (69.0%) |
| Education, Arts & Media | 61 (29.8%) | 144 (70.2%) |
| Legal Services & Support | 25 (22.5%) | 86 (77.5%) |
| Education Instruction & Library | 197 (18.4%) | 875 (81.6%) |
| Arts, Media & Entertainment | 250 (75.8%) | 80 (24.2%) |
| Health Diagnosing & Treating | 161 (17.3%) | 772 (82.7%) |
| Health Technologists | 135 (25.6%) | 392 (74.4%) |
| Total (Category) | 2,335 (40.0%) | 3,502 (60.0%) |
| Total (Overall) | 11,172 (54.9%) | 9,174 (45.1%) |
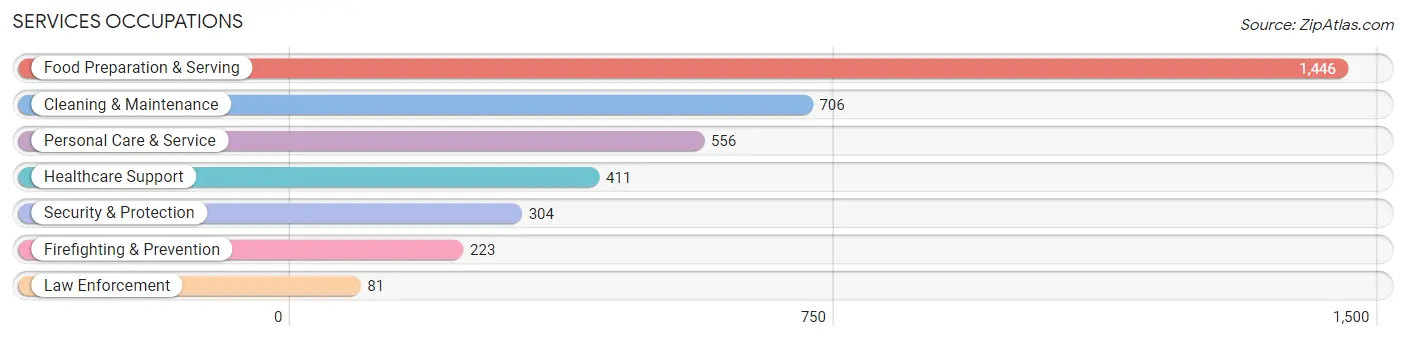
Services Occupations
The most common Services occupations in Plant City are Food Preparation & Serving (1,446 | 7.1%), Cleaning & Maintenance (706 | 3.5%), Personal Care & Service (556 | 2.7%), Healthcare Support (411 | 2.0%), and Security & Protection (304 | 1.5%).
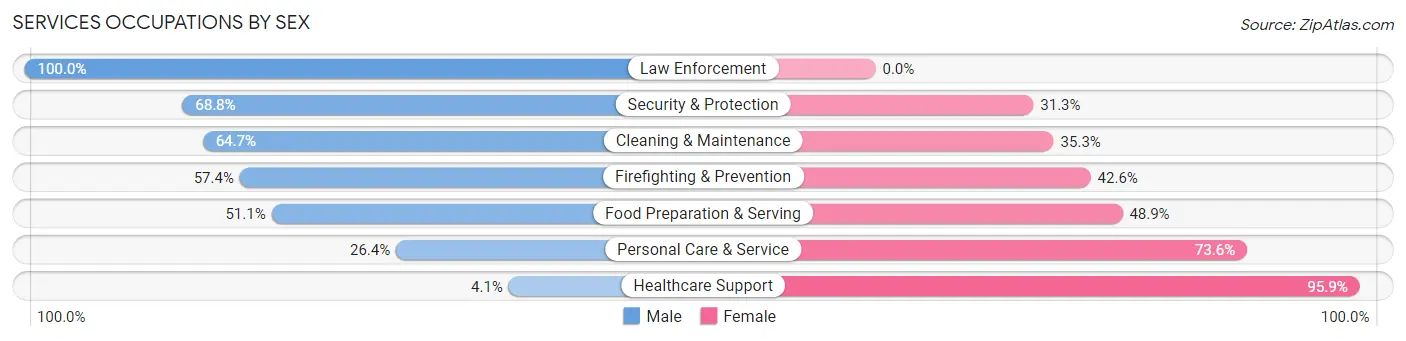
Services Occupations by Sex
Within the Services occupations in Plant City, the most male-oriented occupations are Law Enforcement (100.0%), Security & Protection (68.8%), and Cleaning & Maintenance (64.7%), while the most female-oriented occupations are Healthcare Support (95.9%), Personal Care & Service (73.6%), and Food Preparation & Serving (48.9%).
| Occupation | Male | Female |
| Healthcare Support | 17 (4.1%) | 394 (95.9%) |
| Security & Protection | 209 (68.8%) | 95 (31.2%) |
| Firefighting & Prevention | 128 (57.4%) | 95 (42.6%) |
| Law Enforcement | 81 (100.0%) | 0 (0.0%) |
| Food Preparation & Serving | 739 (51.1%) | 707 (48.9%) |
| Cleaning & Maintenance | 457 (64.7%) | 249 (35.3%) |
| Personal Care & Service | 147 (26.4%) | 409 (73.6%) |
| Total (Category) | 1,569 (45.8%) | 1,854 (54.2%) |
| Total (Overall) | 11,172 (54.9%) | 9,174 (45.1%) |
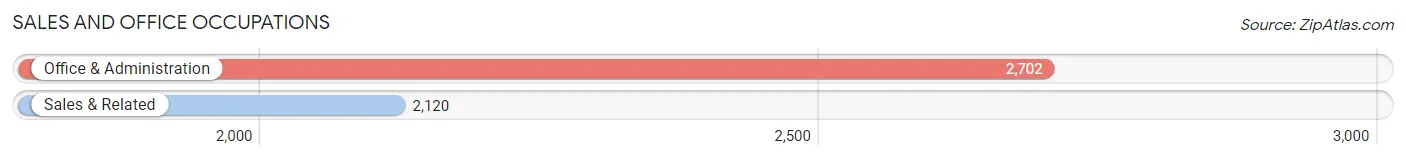
Sales and Office Occupations
The most common Sales and Office occupations in Plant City are Office & Administration (2,702 | 13.3%), and Sales & Related (2,120 | 10.4%).
Sales and Office Occupations by Sex
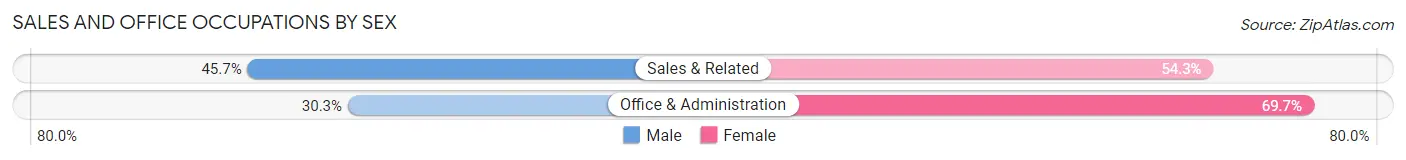
| Occupation | Male | Female |
| Sales & Related | 969 (45.7%) | 1,151 (54.3%) |
| Office & Administration | 818 (30.3%) | 1,884 (69.7%) |
| Total (Category) | 1,787 (37.1%) | 3,035 (62.9%) |
| Total (Overall) | 11,172 (54.9%) | 9,174 (45.1%) |
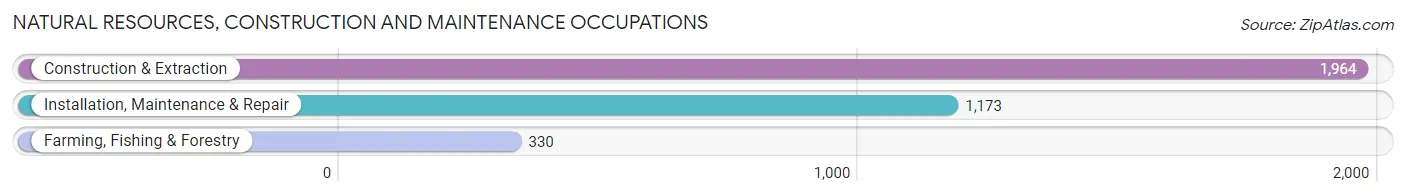
Natural Resources, Construction and Maintenance Occupations
The most common Natural Resources, Construction and Maintenance occupations in Plant City are Construction & Extraction (1,964 | 9.7%), Installation, Maintenance & Repair (1,173 | 5.8%), and Farming, Fishing & Forestry (330 | 1.6%).
Natural Resources, Construction and Maintenance Occupations by Sex
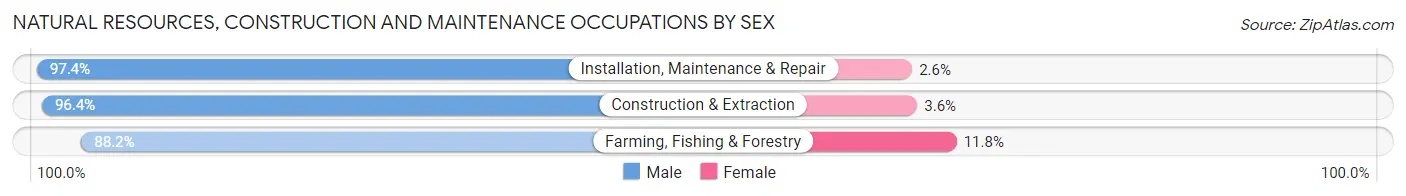
| Occupation | Male | Female |
| Farming, Fishing & Forestry | 291 (88.2%) | 39 (11.8%) |
| Construction & Extraction | 1,893 (96.4%) | 71 (3.6%) |
| Installation, Maintenance & Repair | 1,143 (97.4%) | 30 (2.6%) |
| Total (Category) | 3,327 (96.0%) | 140 (4.0%) |
| Total (Overall) | 11,172 (54.9%) | 9,174 (45.1%) |
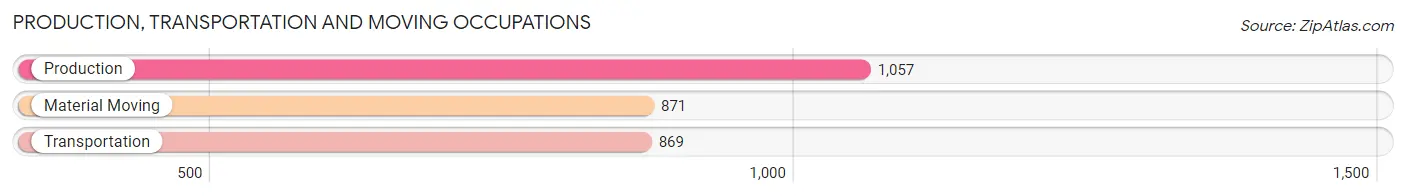
Production, Transportation and Moving Occupations
The most common Production, Transportation and Moving occupations in Plant City are Production (1,057 | 5.2%), Material Moving (871 | 4.3%), and Transportation (869 | 4.3%).
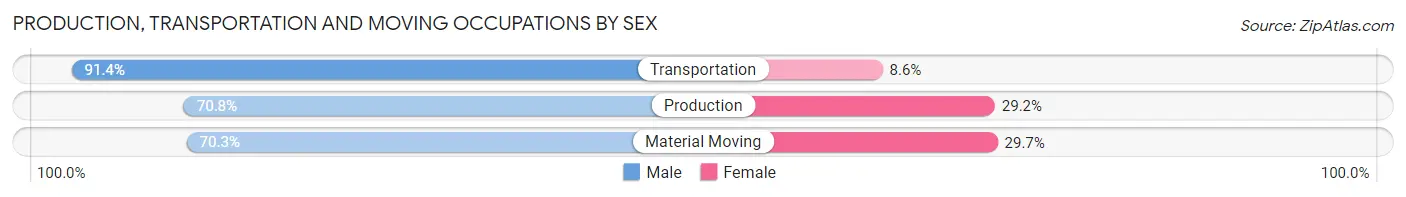
Production, Transportation and Moving Occupations by Sex
| Occupation | Male | Female |
| Production | 748 (70.8%) | 309 (29.2%) |
| Transportation | 794 (91.4%) | 75 (8.6%) |
| Material Moving | 612 (70.3%) | 259 (29.7%) |
| Total (Category) | 2,154 (77.0%) | 643 (23.0%) |
| Total (Overall) | 11,172 (54.9%) | 9,174 (45.1%) |
Employment Industries by Sex in Plant City
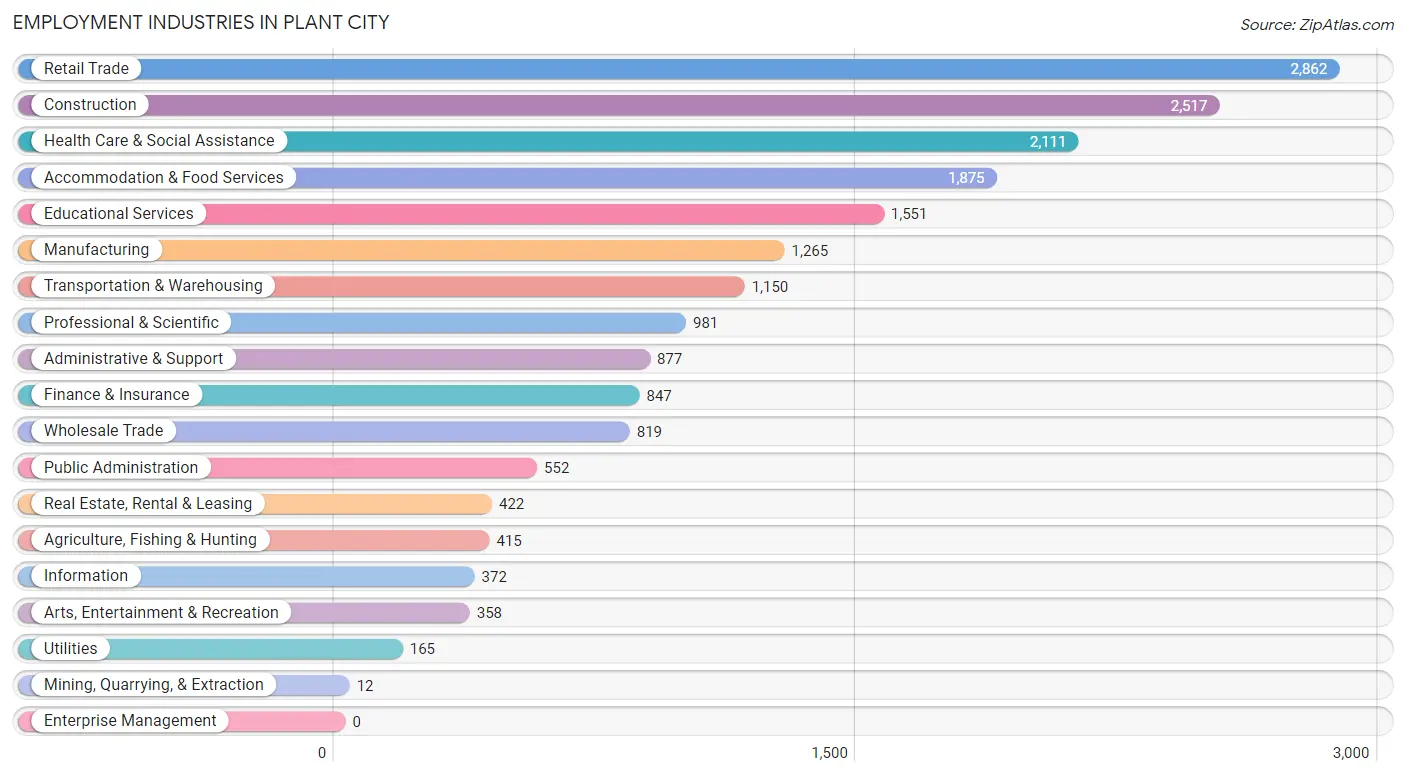
Employment Industries in Plant City
The major employment industries in Plant City include Retail Trade (2,862 | 14.1%), Construction (2,517 | 12.4%), Health Care & Social Assistance (2,111 | 10.4%), Accommodation & Food Services (1,875 | 9.2%), and Educational Services (1,551 | 7.6%).
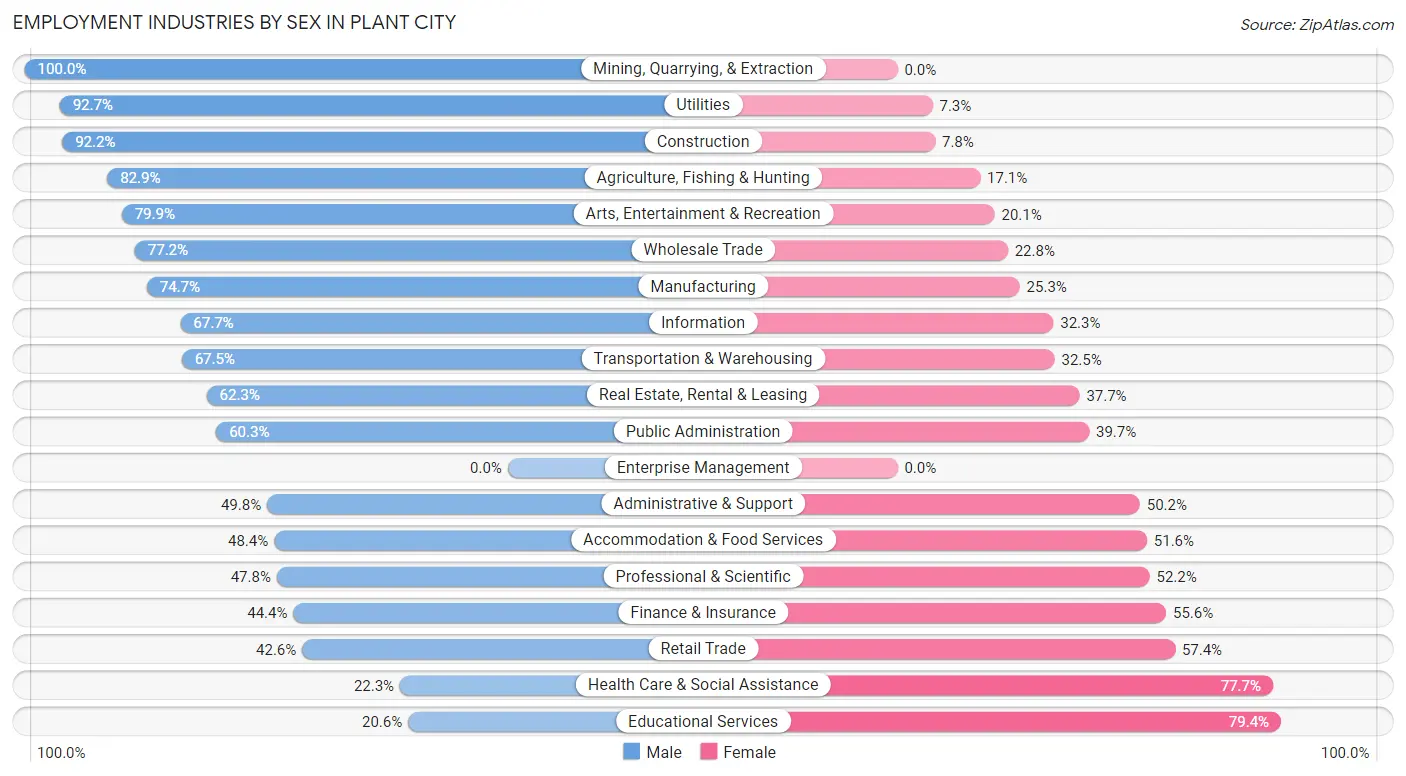
Employment Industries by Sex in Plant City
The Plant City industries that see more men than women are Mining, Quarrying, & Extraction (100.0%), Utilities (92.7%), and Construction (92.2%), whereas the industries that tend to have a higher number of women are Educational Services (79.4%), Health Care & Social Assistance (77.7%), and Retail Trade (57.4%).
| Industry | Male | Female |
| Agriculture, Fishing & Hunting | 344 (82.9%) | 71 (17.1%) |
| Mining, Quarrying, & Extraction | 12 (100.0%) | 0 (0.0%) |
| Construction | 2,321 (92.2%) | 196 (7.8%) |
| Manufacturing | 945 (74.7%) | 320 (25.3%) |
| Wholesale Trade | 632 (77.2%) | 187 (22.8%) |
| Retail Trade | 1,218 (42.6%) | 1,644 (57.4%) |
| Transportation & Warehousing | 776 (67.5%) | 374 (32.5%) |
| Utilities | 153 (92.7%) | 12 (7.3%) |
| Information | 252 (67.7%) | 120 (32.3%) |
| Finance & Insurance | 376 (44.4%) | 471 (55.6%) |
| Real Estate, Rental & Leasing | 263 (62.3%) | 159 (37.7%) |
| Professional & Scientific | 469 (47.8%) | 512 (52.2%) |
| Enterprise Management | 0 (0.0%) | 0 (0.0%) |
| Administrative & Support | 437 (49.8%) | 440 (50.2%) |
| Educational Services | 320 (20.6%) | 1,231 (79.4%) |
| Health Care & Social Assistance | 471 (22.3%) | 1,640 (77.7%) |
| Arts, Entertainment & Recreation | 286 (79.9%) | 72 (20.1%) |
| Accommodation & Food Services | 907 (48.4%) | 968 (51.6%) |
| Public Administration | 333 (60.3%) | 219 (39.7%) |
| Total | 11,172 (54.9%) | 9,174 (45.1%) |
Education in Plant City
School Enrollment in Plant City
The most common levels of schooling among the 9,597 students in Plant City are high school (2,464 | 25.7%), middle school (2,274 | 23.7%), and elementary school (2,084 | 21.7%).
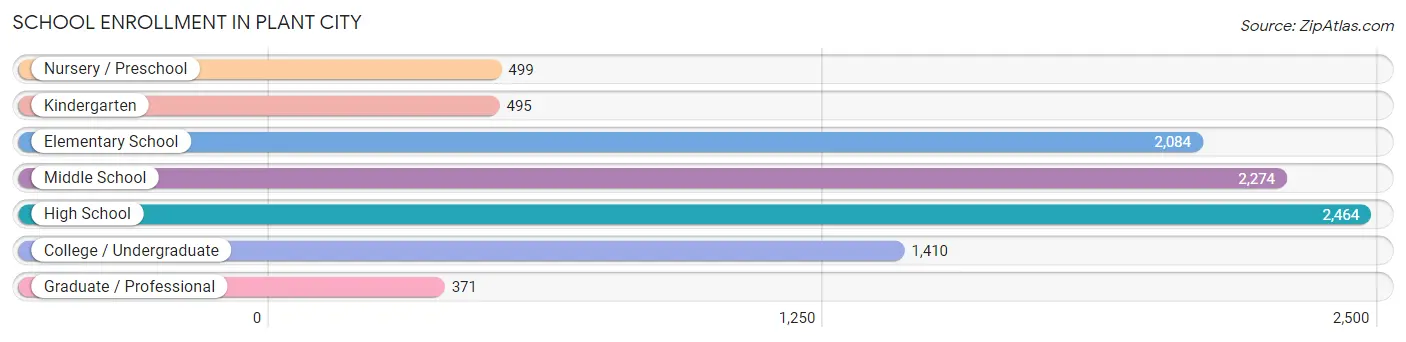
| School Level | # Students | % Students |
| Nursery / Preschool | 499 | 5.2% |
| Kindergarten | 495 | 5.2% |
| Elementary School | 2,084 | 21.7% |
| Middle School | 2,274 | 23.7% |
| High School | 2,464 | 25.7% |
| College / Undergraduate | 1,410 | 14.7% |
| Graduate / Professional | 371 | 3.9% |
| Total | 9,597 | 100.0% |
School Enrollment by Age by Funding Source in Plant City
Out of a total of 9,597 students who are enrolled in schools in Plant City, 1,401 (14.6%) attend a private institution, while the remaining 8,196 (85.4%) are enrolled in public schools. The age group of 3 to 4 year olds has the highest likelihood of being enrolled in private schools, with 241 (53.4% in the age bracket) enrolled. Conversely, the age group of 15 to 17 year olds has the lowest likelihood of being enrolled in a private school, with 1,560 (94.3% in the age bracket) attending a public institution.
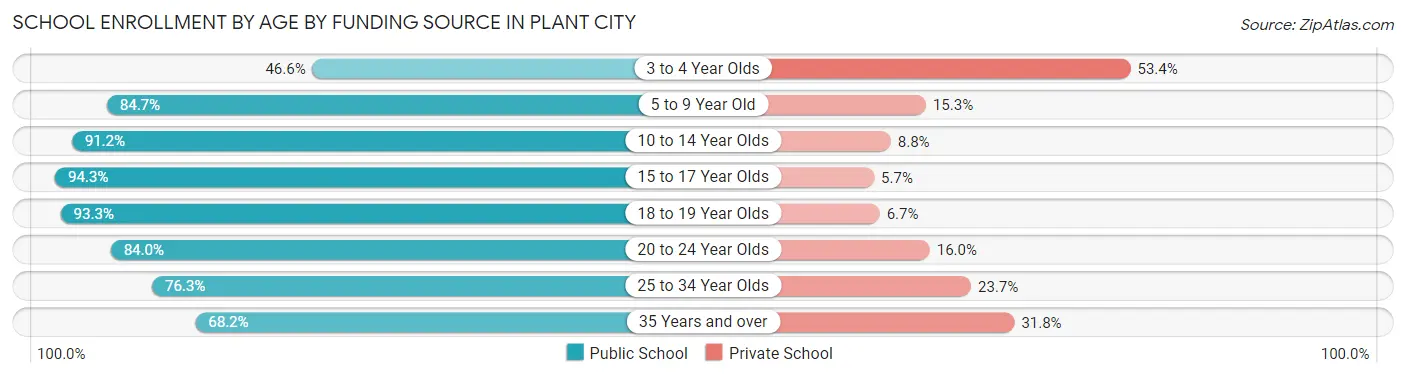
| Age Bracket | Public School | Private School |
| 3 to 4 Year Olds | 210 (46.6%) | 241 (53.4%) |
| 5 to 9 Year Old | 1,972 (84.7%) | 357 (15.3%) |
| 10 to 14 Year Olds | 2,459 (91.2%) | 237 (8.8%) |
| 15 to 17 Year Olds | 1,560 (94.3%) | 94 (5.7%) |
| 18 to 19 Year Olds | 666 (93.3%) | 48 (6.7%) |
| 20 to 24 Year Olds | 471 (84.0%) | 90 (16.0%) |
| 25 to 34 Year Olds | 408 (76.3%) | 127 (23.7%) |
| 35 Years and over | 448 (68.2%) | 209 (31.8%) |
| Total | 8,196 (85.4%) | 1,401 (14.6%) |
Educational Attainment by Field of Study in Plant City
Business (1,451 | 23.0%), education (721 | 11.5%), engineering (602 | 9.6%), science & technology (598 | 9.5%), and social sciences (536 | 8.5%) are the most common fields of study among 6,297 individuals in Plant City who have obtained a bachelor's degree or higher.
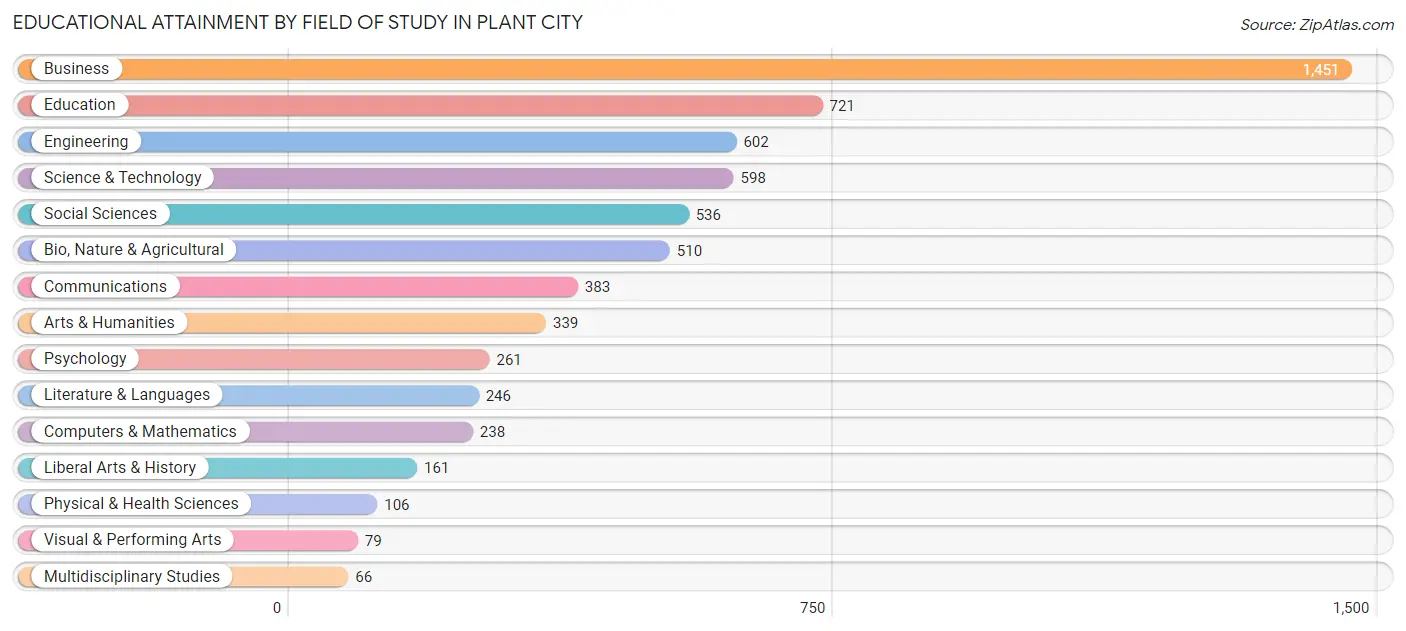
| Field of Study | # Graduates | % Graduates |
| Computers & Mathematics | 238 | 3.8% |
| Bio, Nature & Agricultural | 510 | 8.1% |
| Physical & Health Sciences | 106 | 1.7% |
| Psychology | 261 | 4.1% |
| Social Sciences | 536 | 8.5% |
| Engineering | 602 | 9.6% |
| Multidisciplinary Studies | 66 | 1.1% |
| Science & Technology | 598 | 9.5% |
| Business | 1,451 | 23.0% |
| Education | 721 | 11.5% |
| Literature & Languages | 246 | 3.9% |
| Liberal Arts & History | 161 | 2.6% |
| Visual & Performing Arts | 79 | 1.3% |
| Communications | 383 | 6.1% |
| Arts & Humanities | 339 | 5.4% |
| Total | 6,297 | 100.0% |
Transportation & Commute in Plant City
Vehicle Availability by Sex in Plant City
The most prevalent vehicle ownership categories in Plant City are males with 2 vehicles (4,165, accounting for 38.0%) and females with 2 vehicles (3,140, making up 46.3%).
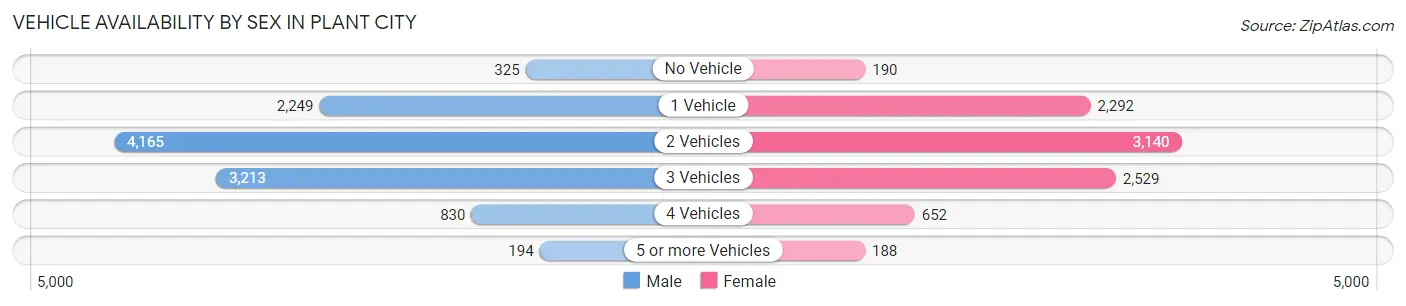
| Vehicles Available | Male | Female |
| No Vehicle | 325 (3.0%) | 190 (2.1%) |
| 1 Vehicle | 2,249 (20.5%) | 2,292 (25.5%) |
| 2 Vehicles | 4,165 (38.0%) | 3,140 (34.9%) |
| 3 Vehicles | 3,213 (29.3%) | 2,529 (28.1%) |
| 4 Vehicles | 830 (7.6%) | 652 (7.2%) |
| 5 or more Vehicles | 194 (1.8%) | 188 (2.1%) |
| Total | 10,976 (100.0%) | 8,991 (100.0%) |
Commute Time in Plant City
The most frequently occuring commute durations in Plant City are 10 to 14 minutes (2,984 commuters, 16.2%), 30 to 34 minutes (2,853 commuters, 15.5%), and 5 to 9 minutes (2,291 commuters, 12.4%).
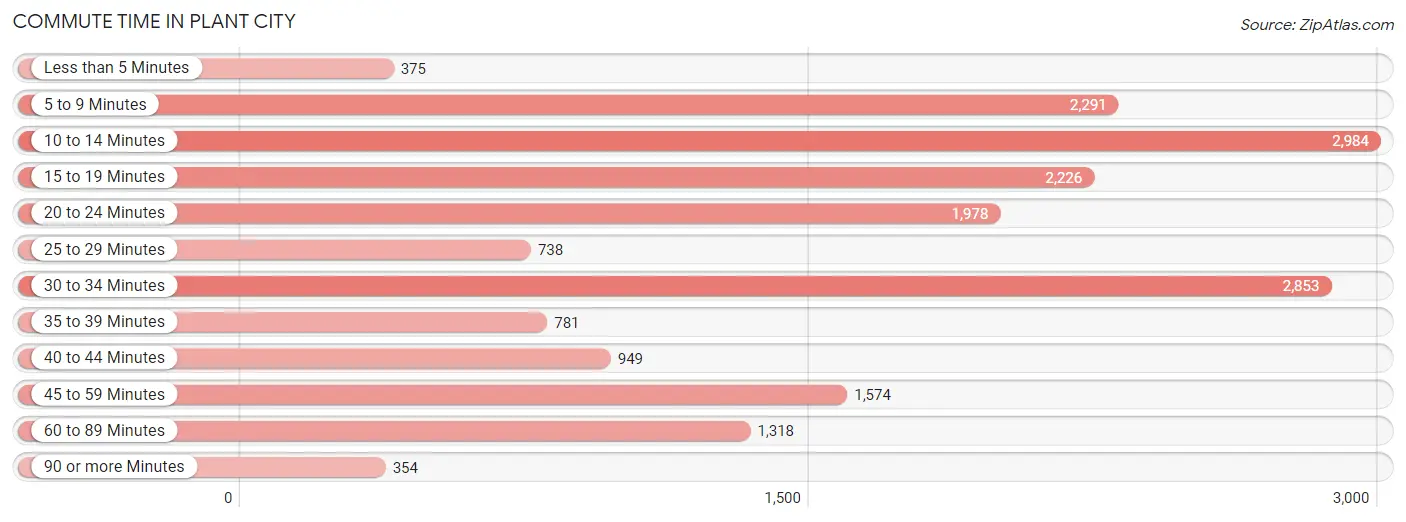
| Commute Time | # Commuters | % Commuters |
| Less than 5 Minutes | 375 | 2.0% |
| 5 to 9 Minutes | 2,291 | 12.4% |
| 10 to 14 Minutes | 2,984 | 16.2% |
| 15 to 19 Minutes | 2,226 | 12.1% |
| 20 to 24 Minutes | 1,978 | 10.7% |
| 25 to 29 Minutes | 738 | 4.0% |
| 30 to 34 Minutes | 2,853 | 15.5% |
| 35 to 39 Minutes | 781 | 4.2% |
| 40 to 44 Minutes | 949 | 5.1% |
| 45 to 59 Minutes | 1,574 | 8.5% |
| 60 to 89 Minutes | 1,318 | 7.1% |
| 90 or more Minutes | 354 | 1.9% |
Commute Time by Sex in Plant City
The most common commute times in Plant City are 10 to 14 minutes (1,505 commuters, 14.7%) for males and 10 to 14 minutes (1,479 commuters, 18.1%) for females.
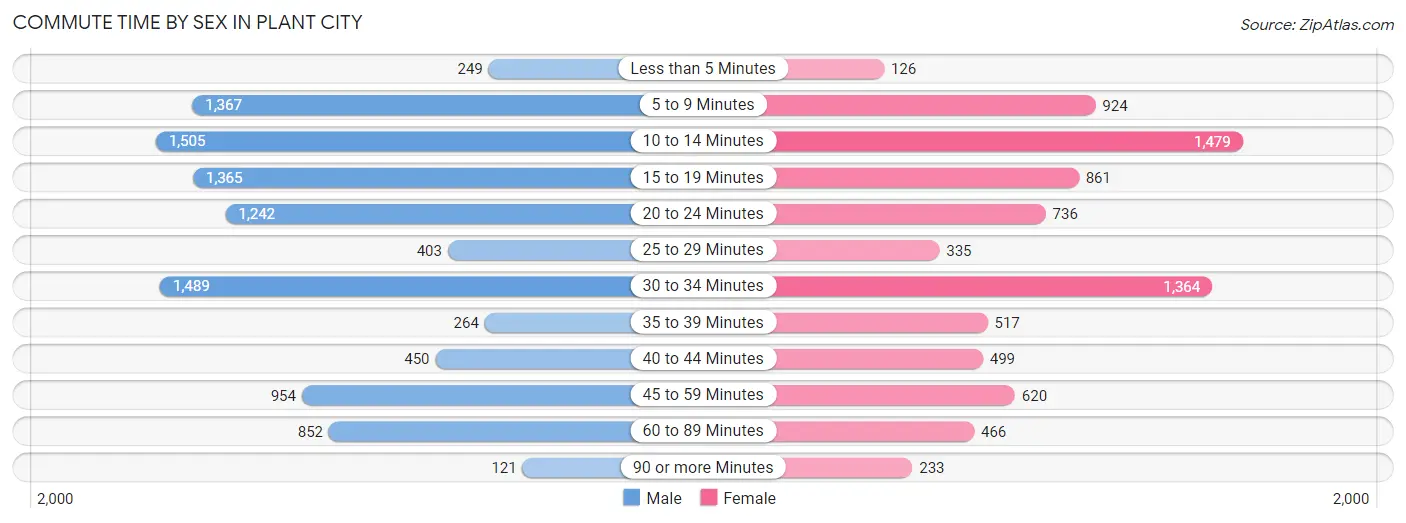
| Commute Time | Male | Female |
| Less than 5 Minutes | 249 (2.4%) | 126 (1.5%) |
| 5 to 9 Minutes | 1,367 (13.3%) | 924 (11.3%) |
| 10 to 14 Minutes | 1,505 (14.7%) | 1,479 (18.1%) |
| 15 to 19 Minutes | 1,365 (13.3%) | 861 (10.5%) |
| 20 to 24 Minutes | 1,242 (12.1%) | 736 (9.0%) |
| 25 to 29 Minutes | 403 (3.9%) | 335 (4.1%) |
| 30 to 34 Minutes | 1,489 (14.5%) | 1,364 (16.7%) |
| 35 to 39 Minutes | 264 (2.6%) | 517 (6.3%) |
| 40 to 44 Minutes | 450 (4.4%) | 499 (6.1%) |
| 45 to 59 Minutes | 954 (9.3%) | 620 (7.6%) |
| 60 to 89 Minutes | 852 (8.3%) | 466 (5.7%) |
| 90 or more Minutes | 121 (1.2%) | 233 (2.9%) |
Time of Departure to Work by Sex in Plant City
The most frequent times of departure to work in Plant City are 6:00 AM to 6:29 AM (1,823, 17.8%) for males and 7:00 AM to 7:29 AM (1,293, 15.9%) for females.
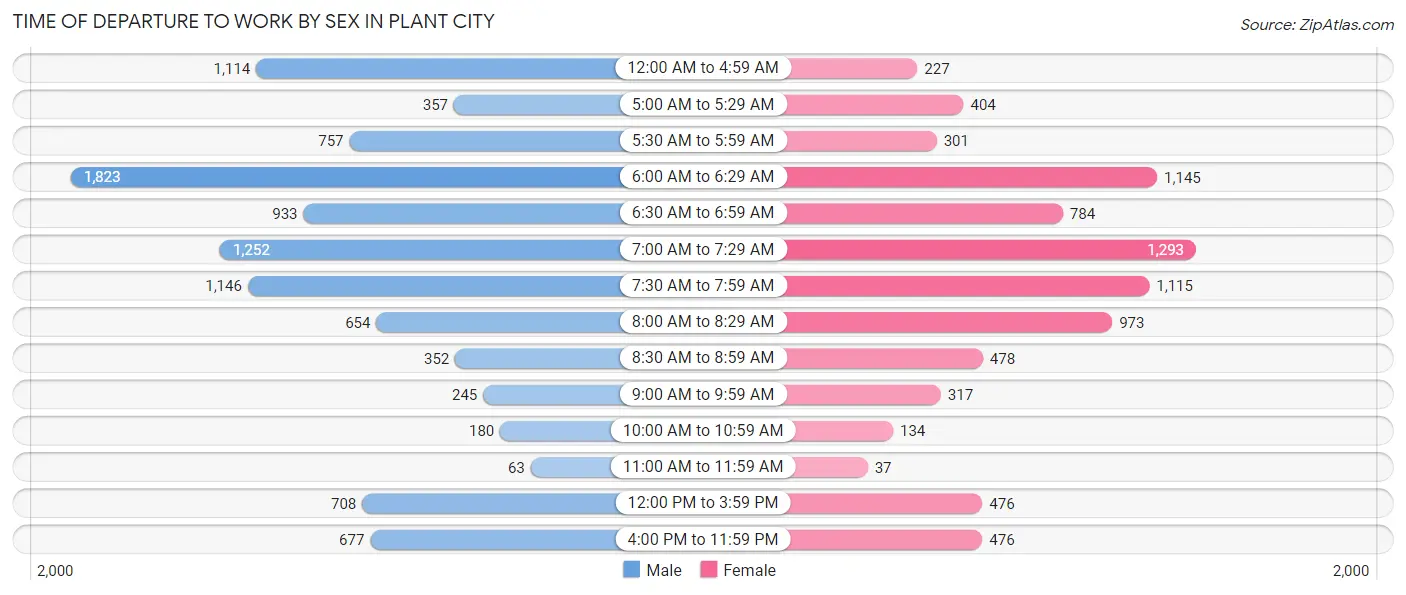
| Time of Departure | Male | Female |
| 12:00 AM to 4:59 AM | 1,114 (10.9%) | 227 (2.8%) |
| 5:00 AM to 5:29 AM | 357 (3.5%) | 404 (5.0%) |
| 5:30 AM to 5:59 AM | 757 (7.4%) | 301 (3.7%) |
| 6:00 AM to 6:29 AM | 1,823 (17.8%) | 1,145 (14.0%) |
| 6:30 AM to 6:59 AM | 933 (9.1%) | 784 (9.6%) |
| 7:00 AM to 7:29 AM | 1,252 (12.2%) | 1,293 (15.9%) |
| 7:30 AM to 7:59 AM | 1,146 (11.2%) | 1,115 (13.7%) |
| 8:00 AM to 8:29 AM | 654 (6.4%) | 973 (11.9%) |
| 8:30 AM to 8:59 AM | 352 (3.4%) | 478 (5.9%) |
| 9:00 AM to 9:59 AM | 245 (2.4%) | 317 (3.9%) |
| 10:00 AM to 10:59 AM | 180 (1.8%) | 134 (1.6%) |
| 11:00 AM to 11:59 AM | 63 (0.6%) | 37 (0.4%) |
| 12:00 PM to 3:59 PM | 708 (6.9%) | 476 (5.8%) |
| 4:00 PM to 11:59 PM | 677 (6.6%) | 476 (5.8%) |
| Total | 10,261 (100.0%) | 8,160 (100.0%) |
Housing Occupancy in Plant City
Occupancy by Ownership in Plant City
Of the total 14,500 dwellings in Plant City, owner-occupied units account for 9,075 (62.6%), while renter-occupied units make up 5,425 (37.4%).
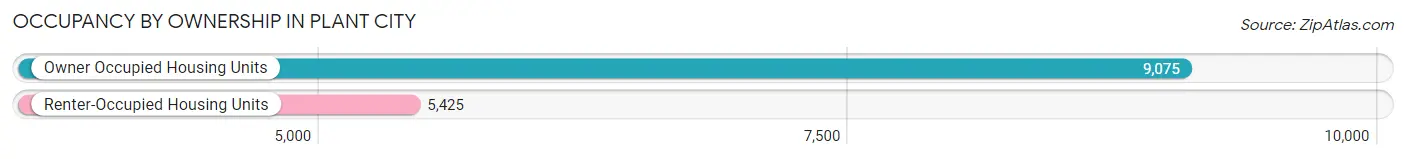
| Occupancy | # Housing Units | % Housing Units |
| Owner Occupied Housing Units | 9,075 | 62.6% |
| Renter-Occupied Housing Units | 5,425 | 37.4% |
| Total Occupied Housing Units | 14,500 | 100.0% |
Occupancy by Household Size in Plant City
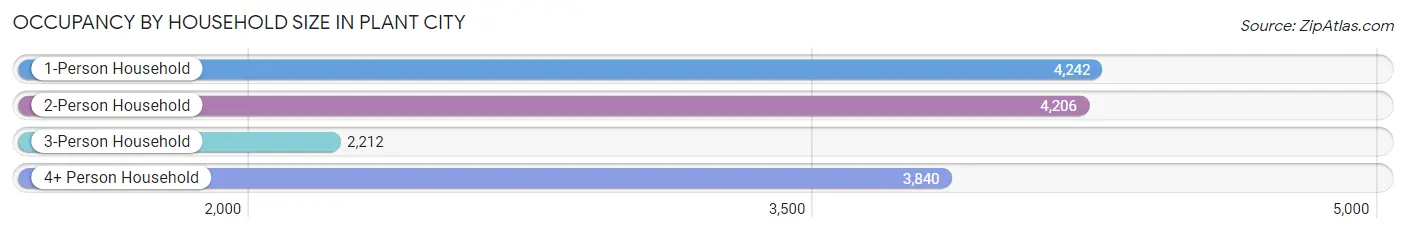
| Household Size | # Housing Units | % Housing Units |
| 1-Person Household | 4,242 | 29.3% |
| 2-Person Household | 4,206 | 29.0% |
| 3-Person Household | 2,212 | 15.3% |
| 4+ Person Household | 3,840 | 26.5% |
| Total Housing Units | 14,500 | 100.0% |
Occupancy by Ownership by Household Size in Plant City
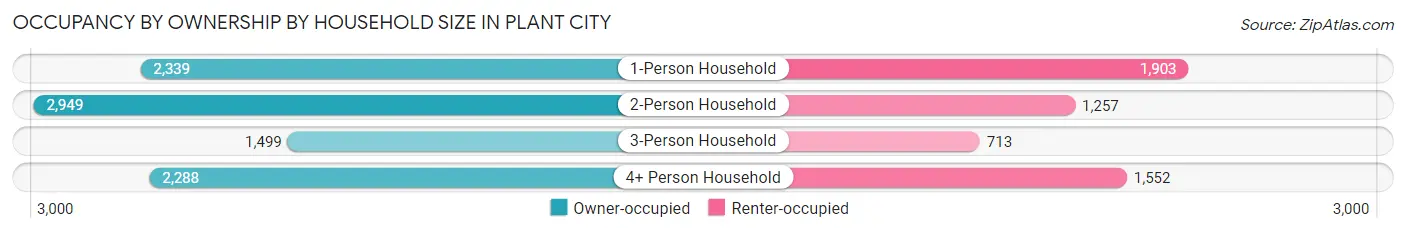
| Household Size | Owner-occupied | Renter-occupied |
| 1-Person Household | 2,339 (55.1%) | 1,903 (44.9%) |
| 2-Person Household | 2,949 (70.1%) | 1,257 (29.9%) |
| 3-Person Household | 1,499 (67.8%) | 713 (32.2%) |
| 4+ Person Household | 2,288 (59.6%) | 1,552 (40.4%) |
| Total Housing Units | 9,075 (62.6%) | 5,425 (37.4%) |
Occupancy by Educational Attainment in Plant City
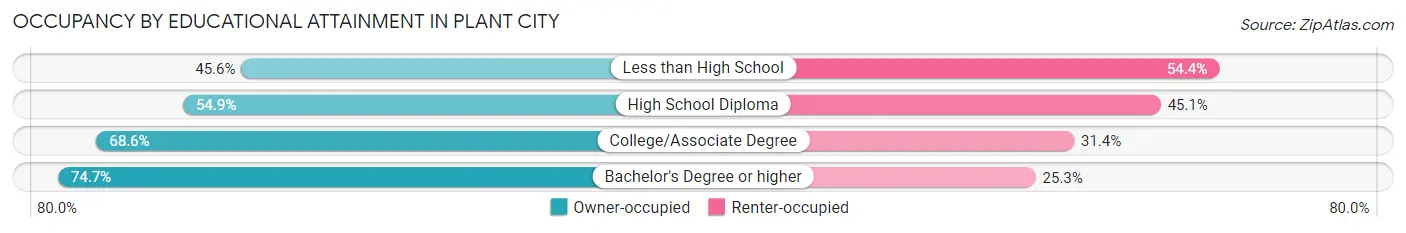
| Household Size | Owner-occupied | Renter-occupied |
| Less than High School | 1,044 (45.6%) | 1,244 (54.4%) |
| High School Diploma | 2,288 (54.9%) | 1,882 (45.1%) |
| College/Associate Degree | 2,981 (68.6%) | 1,364 (31.4%) |
| Bachelor's Degree or higher | 2,762 (74.7%) | 935 (25.3%) |
Occupancy by Age of Householder in Plant City
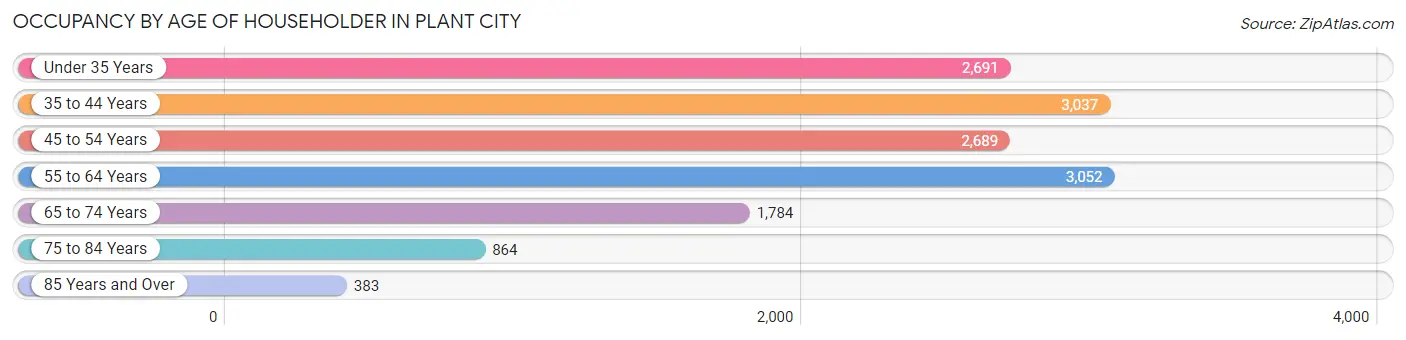
| Age Bracket | # Households | % Households |
| Under 35 Years | 2,691 | 18.6% |
| 35 to 44 Years | 3,037 | 20.9% |
| 45 to 54 Years | 2,689 | 18.5% |
| 55 to 64 Years | 3,052 | 21.0% |
| 65 to 74 Years | 1,784 | 12.3% |
| 75 to 84 Years | 864 | 6.0% |
| 85 Years and Over | 383 | 2.6% |
| Total | 14,500 | 100.0% |
Housing Finances in Plant City
Median Income by Occupancy in Plant City
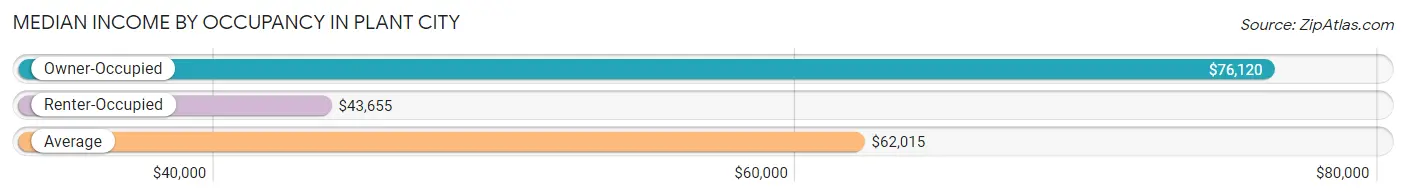
| Occupancy Type | # Households | Median Income |
| Owner-Occupied | 9,075 (62.6%) | $76,120 |
| Renter-Occupied | 5,425 (37.4%) | $43,655 |
| Average | 14,500 (100.0%) | $62,015 |
Occupancy by Householder Income Bracket in Plant City
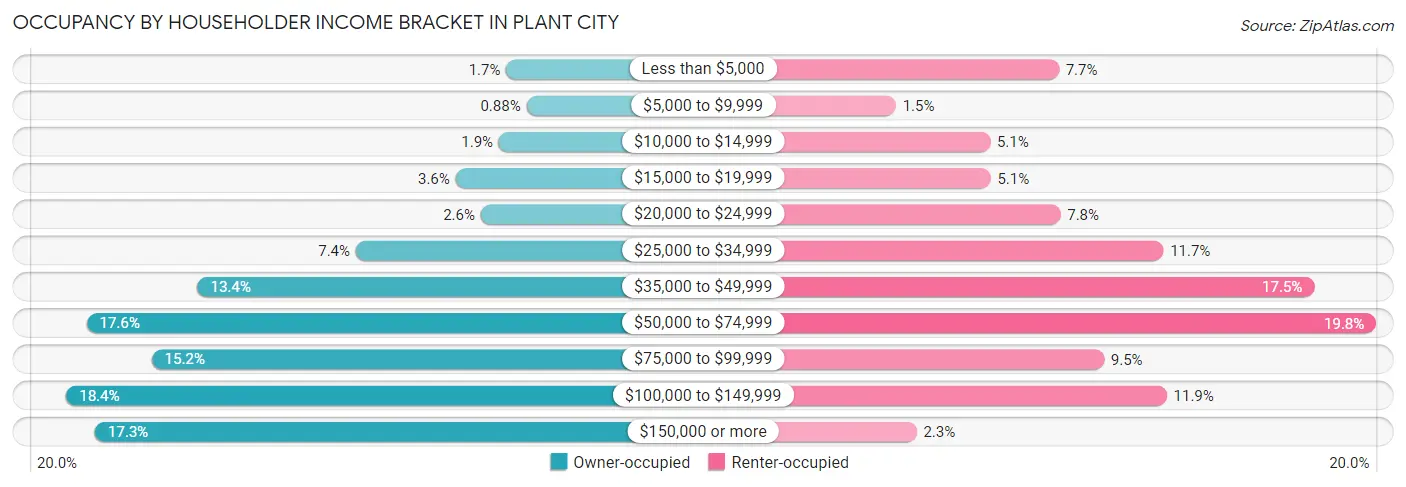
| Income Bracket | Owner-occupied | Renter-occupied |
| Less than $5,000 | 150 (1.7%) | 420 (7.7%) |
| $5,000 to $9,999 | 80 (0.9%) | 83 (1.5%) |
| $10,000 to $14,999 | 175 (1.9%) | 278 (5.1%) |
| $15,000 to $19,999 | 325 (3.6%) | 279 (5.1%) |
| $20,000 to $24,999 | 238 (2.6%) | 423 (7.8%) |
| $25,000 to $34,999 | 670 (7.4%) | 636 (11.7%) |
| $35,000 to $49,999 | 1,217 (13.4%) | 948 (17.5%) |
| $50,000 to $74,999 | 1,601 (17.6%) | 1,076 (19.8%) |
| $75,000 to $99,999 | 1,376 (15.2%) | 513 (9.5%) |
| $100,000 to $149,999 | 1,671 (18.4%) | 643 (11.8%) |
| $150,000 or more | 1,572 (17.3%) | 126 (2.3%) |
| Total | 9,075 (100.0%) | 5,425 (100.0%) |
Monthly Housing Cost Tiers in Plant City
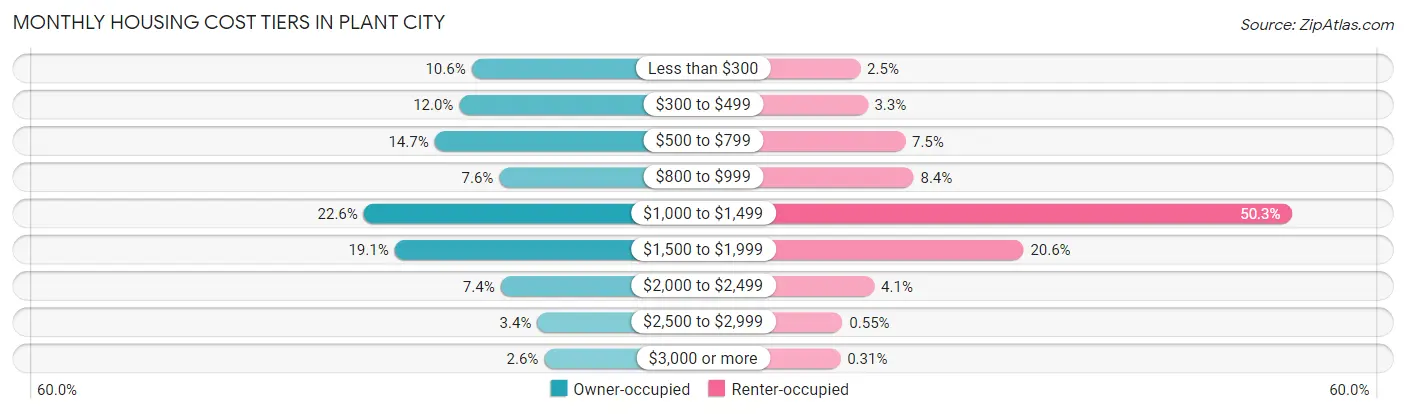
| Monthly Cost | Owner-occupied | Renter-occupied |
| Less than $300 | 965 (10.6%) | 136 (2.5%) |
| $300 to $499 | 1,088 (12.0%) | 180 (3.3%) |
| $500 to $799 | 1,336 (14.7%) | 405 (7.5%) |
| $800 to $999 | 687 (7.6%) | 456 (8.4%) |
| $1,000 to $1,499 | 2,046 (22.6%) | 2,726 (50.2%) |
| $1,500 to $1,999 | 1,737 (19.1%) | 1,115 (20.5%) |
| $2,000 to $2,499 | 674 (7.4%) | 220 (4.1%) |
| $2,500 to $2,999 | 306 (3.4%) | 30 (0.5%) |
| $3,000 or more | 236 (2.6%) | 17 (0.3%) |
| Total | 9,075 (100.0%) | 5,425 (100.0%) |
Physical Housing Characteristics in Plant City
Housing Structures in Plant City
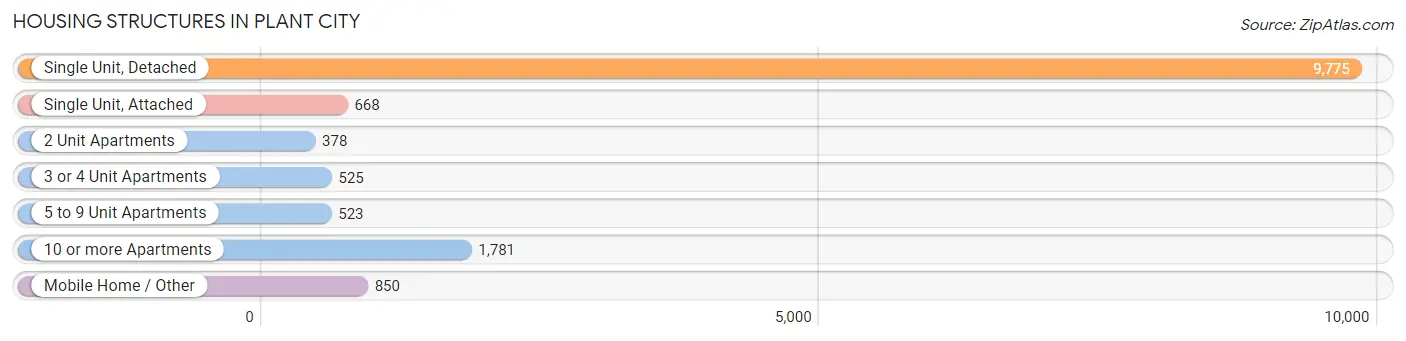
| Structure Type | # Housing Units | % Housing Units |
| Single Unit, Detached | 9,775 | 67.4% |
| Single Unit, Attached | 668 | 4.6% |
| 2 Unit Apartments | 378 | 2.6% |
| 3 or 4 Unit Apartments | 525 | 3.6% |
| 5 to 9 Unit Apartments | 523 | 3.6% |
| 10 or more Apartments | 1,781 | 12.3% |
| Mobile Home / Other | 850 | 5.9% |
| Total | 14,500 | 100.0% |
Housing Structures by Occupancy in Plant City
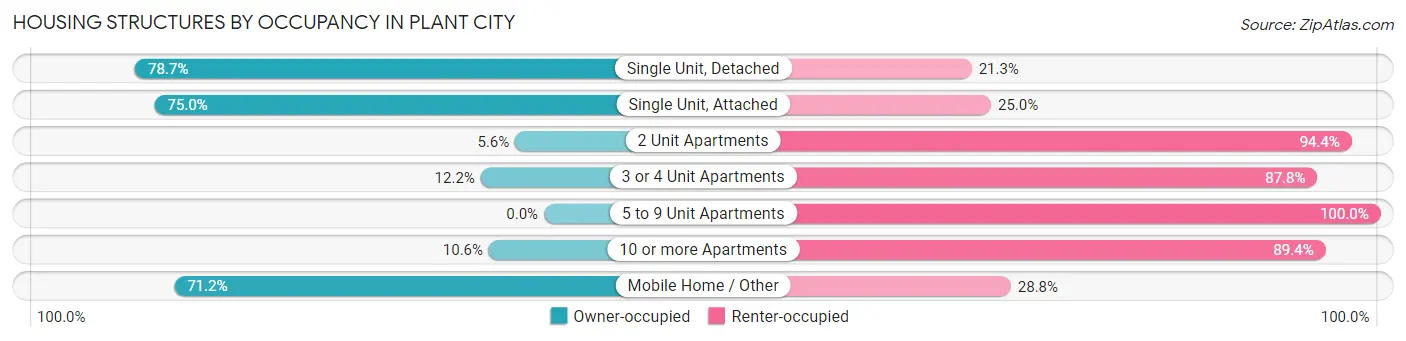
| Structure Type | Owner-occupied | Renter-occupied |
| Single Unit, Detached | 7,695 (78.7%) | 2,080 (21.3%) |
| Single Unit, Attached | 501 (75.0%) | 167 (25.0%) |
| 2 Unit Apartments | 21 (5.6%) | 357 (94.4%) |
| 3 or 4 Unit Apartments | 64 (12.2%) | 461 (87.8%) |
| 5 to 9 Unit Apartments | 0 (0.0%) | 523 (100.0%) |
| 10 or more Apartments | 189 (10.6%) | 1,592 (89.4%) |
| Mobile Home / Other | 605 (71.2%) | 245 (28.8%) |
| Total | 9,075 (62.6%) | 5,425 (37.4%) |
Housing Structures by Number of Rooms in Plant City
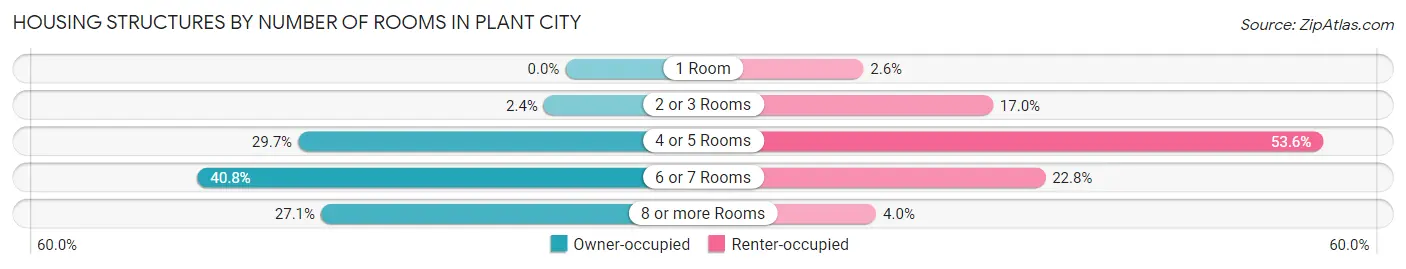
| Number of Rooms | Owner-occupied | Renter-occupied |
| 1 Room | 0 (0.0%) | 141 (2.6%) |
| 2 or 3 Rooms | 217 (2.4%) | 921 (17.0%) |
| 4 or 5 Rooms | 2,693 (29.7%) | 2,909 (53.6%) |
| 6 or 7 Rooms | 3,704 (40.8%) | 1,236 (22.8%) |
| 8 or more Rooms | 2,461 (27.1%) | 218 (4.0%) |
| Total | 9,075 (100.0%) | 5,425 (100.0%) |
Housing Structure by Heating Type in Plant City
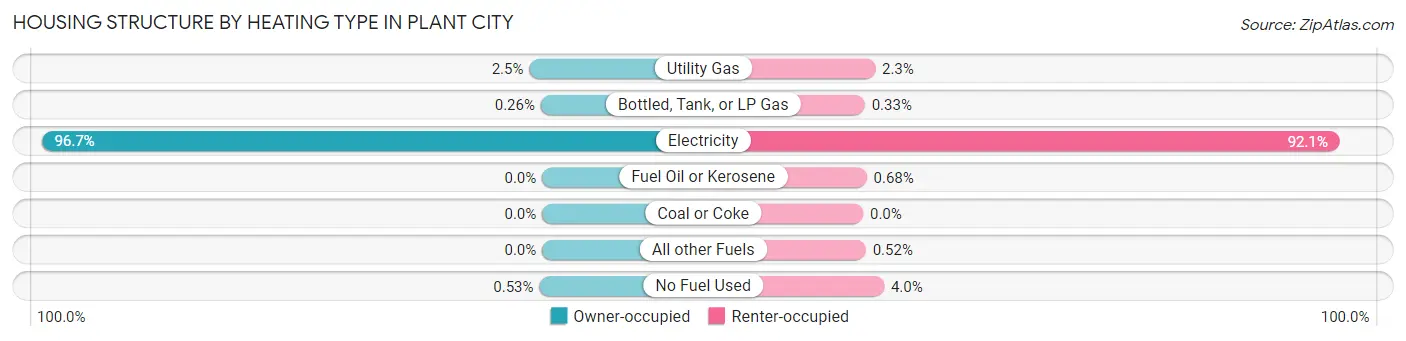
| Heating Type | Owner-occupied | Renter-occupied |
| Utility Gas | 224 (2.5%) | 126 (2.3%) |
| Bottled, Tank, or LP Gas | 24 (0.3%) | 18 (0.3%) |
| Electricity | 8,779 (96.7%) | 4,997 (92.1%) |
| Fuel Oil or Kerosene | 0 (0.0%) | 37 (0.7%) |
| Coal or Coke | 0 (0.0%) | 0 (0.0%) |
| All other Fuels | 0 (0.0%) | 28 (0.5%) |
| No Fuel Used | 48 (0.5%) | 219 (4.0%) |
| Total | 9,075 (100.0%) | 5,425 (100.0%) |
Household Vehicle Usage in Plant City
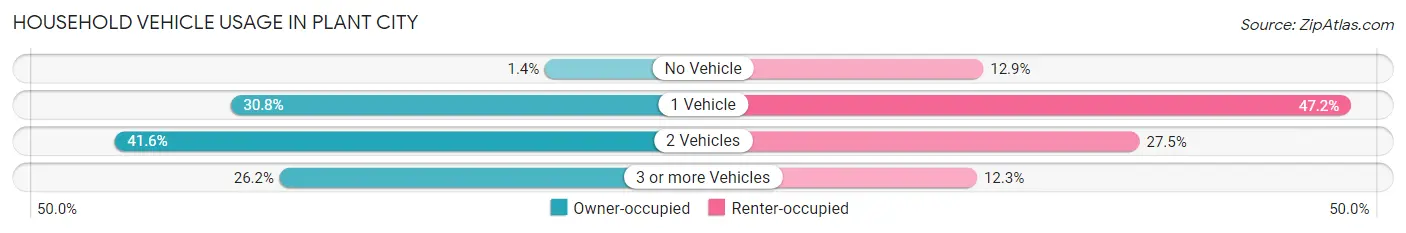
| Vehicles per Household | Owner-occupied | Renter-occupied |
| No Vehicle | 128 (1.4%) | 701 (12.9%) |
| 1 Vehicle | 2,794 (30.8%) | 2,563 (47.2%) |
| 2 Vehicles | 3,777 (41.6%) | 1,492 (27.5%) |
| 3 or more Vehicles | 2,376 (26.2%) | 669 (12.3%) |
| Total | 9,075 (100.0%) | 5,425 (100.0%) |
Real Estate & Mortgages in Plant City
Real Estate and Mortgage Overview in Plant City
| Characteristic | Without Mortgage | With Mortgage |
| Housing Units | 3,489 | 5,586 |
| Median Property Value | $179,900 | $243,400 |
| Median Household Income | $54,886 | $1,143 |
| Monthly Housing Costs | $454 | $236 |
| Real Estate Taxes | $1,078 | $270 |
Property Value by Mortgage Status in Plant City
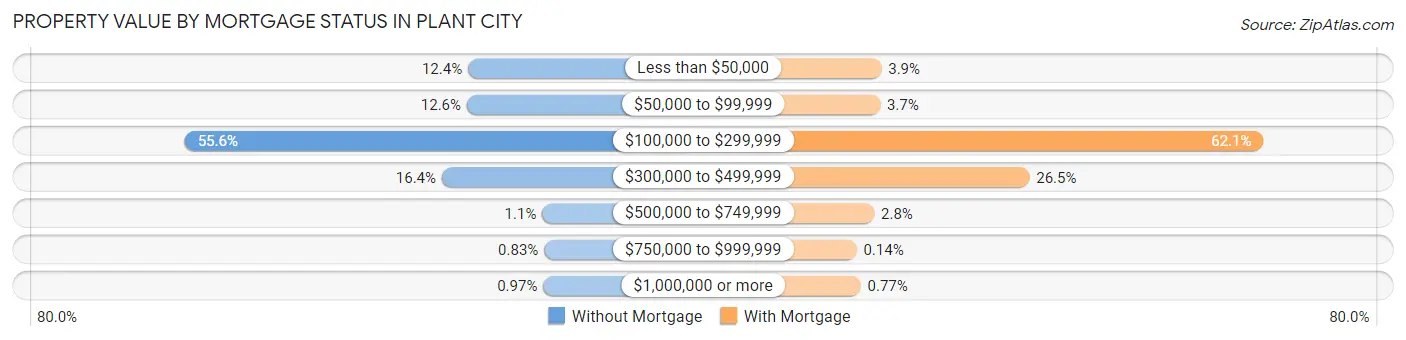
| Property Value | Without Mortgage | With Mortgage |
| Less than $50,000 | 434 (12.4%) | 219 (3.9%) |
| $50,000 to $99,999 | 440 (12.6%) | 208 (3.7%) |
| $100,000 to $299,999 | 1,940 (55.6%) | 3,471 (62.1%) |
| $300,000 to $499,999 | 573 (16.4%) | 1,479 (26.5%) |
| $500,000 to $749,999 | 39 (1.1%) | 158 (2.8%) |
| $750,000 to $999,999 | 29 (0.8%) | 8 (0.1%) |
| $1,000,000 or more | 34 (1.0%) | 43 (0.8%) |
| Total | 3,489 (100.0%) | 5,586 (100.0%) |
Household Income by Mortgage Status in Plant City
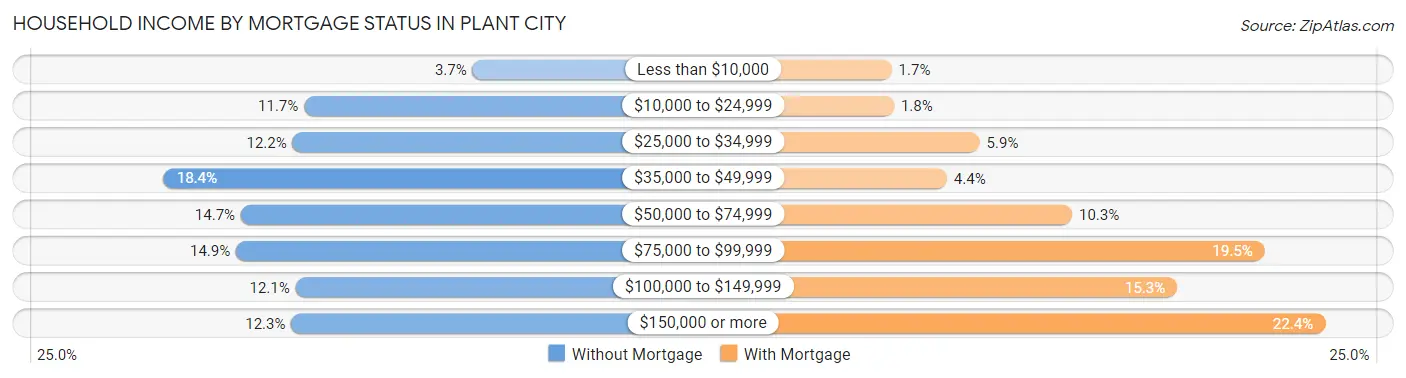
| Household Income | Without Mortgage | With Mortgage |
| Less than $10,000 | 128 (3.7%) | 96 (1.7%) |
| $10,000 to $24,999 | 408 (11.7%) | 102 (1.8%) |
| $25,000 to $34,999 | 427 (12.2%) | 330 (5.9%) |
| $35,000 to $49,999 | 641 (18.4%) | 243 (4.3%) |
| $50,000 to $74,999 | 513 (14.7%) | 576 (10.3%) |
| $75,000 to $99,999 | 521 (14.9%) | 1,088 (19.5%) |
| $100,000 to $149,999 | 422 (12.1%) | 855 (15.3%) |
| $150,000 or more | 429 (12.3%) | 1,249 (22.4%) |
| Total | 3,489 (100.0%) | 5,586 (100.0%) |
Property Value to Household Income Ratio in Plant City
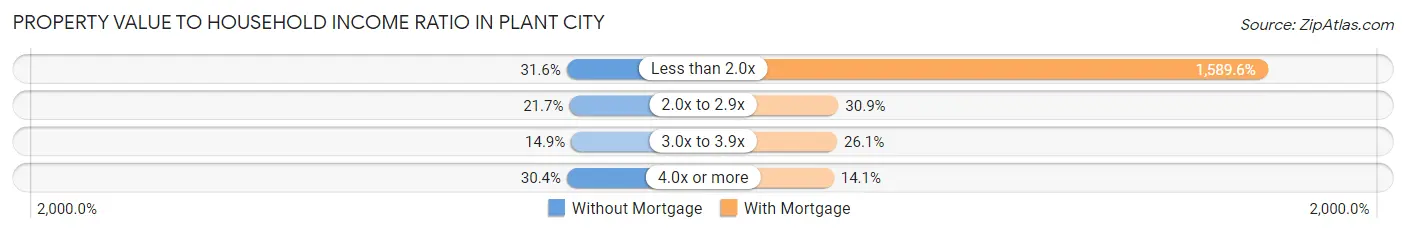
| Value-to-Income Ratio | Without Mortgage | With Mortgage |
| Less than 2.0x | 1,102 (31.6%) | 88,794 (1,589.6%) |
| 2.0x to 2.9x | 758 (21.7%) | 1,725 (30.9%) |
| 3.0x to 3.9x | 519 (14.9%) | 1,458 (26.1%) |
| 4.0x or more | 1,061 (30.4%) | 786 (14.1%) |
| Total | 3,489 (100.0%) | 5,586 (100.0%) |
Real Estate Taxes by Mortgage Status in Plant City
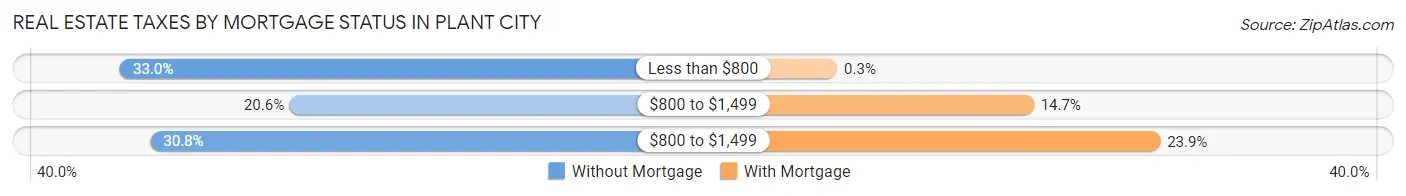
| Property Taxes | Without Mortgage | With Mortgage |
| Less than $800 | 1,152 (33.0%) | 17 (0.3%) |
| $800 to $1,499 | 719 (20.6%) | 819 (14.7%) |
| $800 to $1,499 | 1,075 (30.8%) | 1,335 (23.9%) |
| Total | 3,489 (100.0%) | 5,586 (100.0%) |
Health & Disability in Plant City
Health Insurance Coverage by Age in Plant City
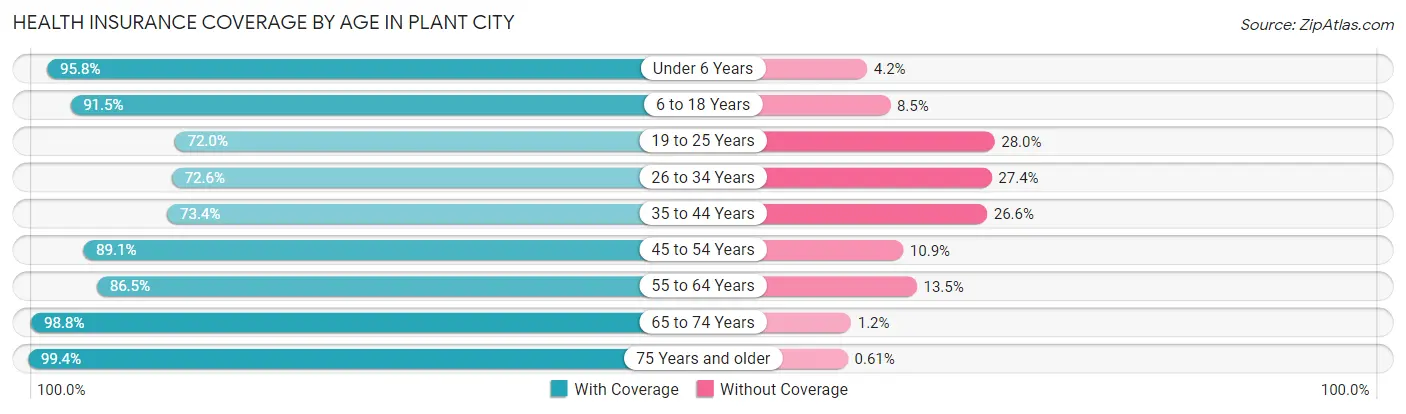
| Age Bracket | With Coverage | Without Coverage |
| Under 6 Years | 2,671 (95.8%) | 117 (4.2%) |
| 6 to 18 Years | 6,626 (91.5%) | 616 (8.5%) |
| 19 to 25 Years | 2,377 (72.0%) | 923 (28.0%) |
| 26 to 34 Years | 3,683 (72.6%) | 1,392 (27.4%) |
| 35 to 44 Years | 4,666 (73.4%) | 1,689 (26.6%) |
| 45 to 54 Years | 4,255 (89.1%) | 522 (10.9%) |
| 55 to 64 Years | 4,264 (86.5%) | 664 (13.5%) |
| 65 to 74 Years | 3,097 (98.8%) | 38 (1.2%) |
| 75 Years and older | 1,806 (99.4%) | 11 (0.6%) |
| Total | 33,445 (84.9%) | 5,972 (15.1%) |
Health Insurance Coverage by Citizenship Status in Plant City
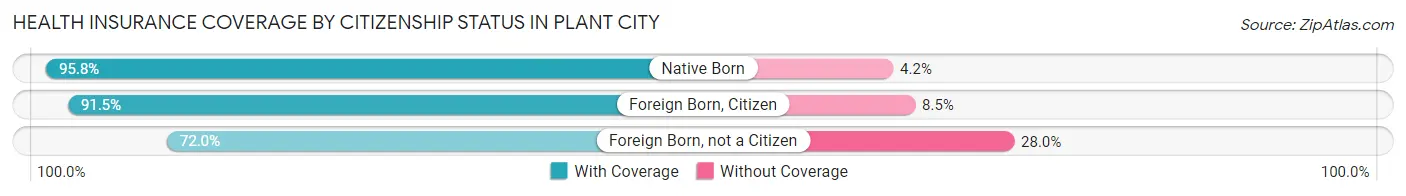
| Citizenship Status | With Coverage | Without Coverage |
| Native Born | 2,671 (95.8%) | 117 (4.2%) |
| Foreign Born, Citizen | 6,626 (91.5%) | 616 (8.5%) |
| Foreign Born, not a Citizen | 2,377 (72.0%) | 923 (28.0%) |
Health Insurance Coverage by Household Income in Plant City
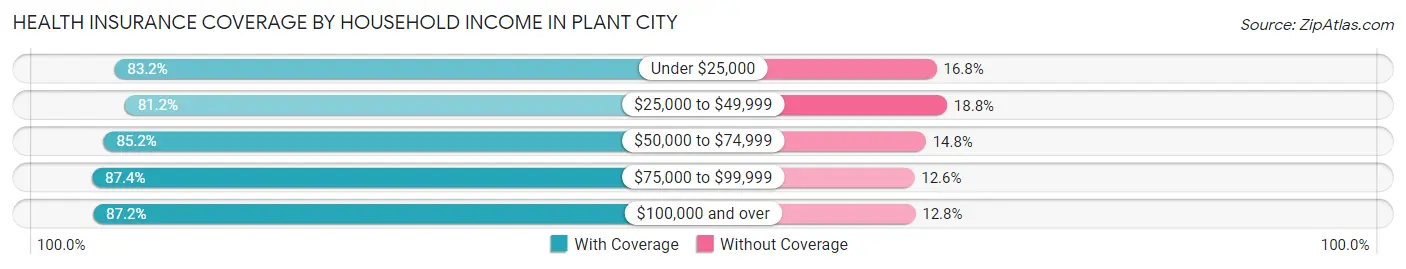
| Household Income | With Coverage | Without Coverage |
| Under $25,000 | 3,918 (83.2%) | 792 (16.8%) |
| $25,000 to $49,999 | 6,958 (81.2%) | 1,607 (18.8%) |
| $50,000 to $74,999 | 5,934 (85.2%) | 1,029 (14.8%) |
| $75,000 to $99,999 | 5,024 (87.4%) | 727 (12.6%) |
| $100,000 and over | 11,583 (87.2%) | 1,707 (12.8%) |
Public vs Private Health Insurance Coverage by Age in Plant City
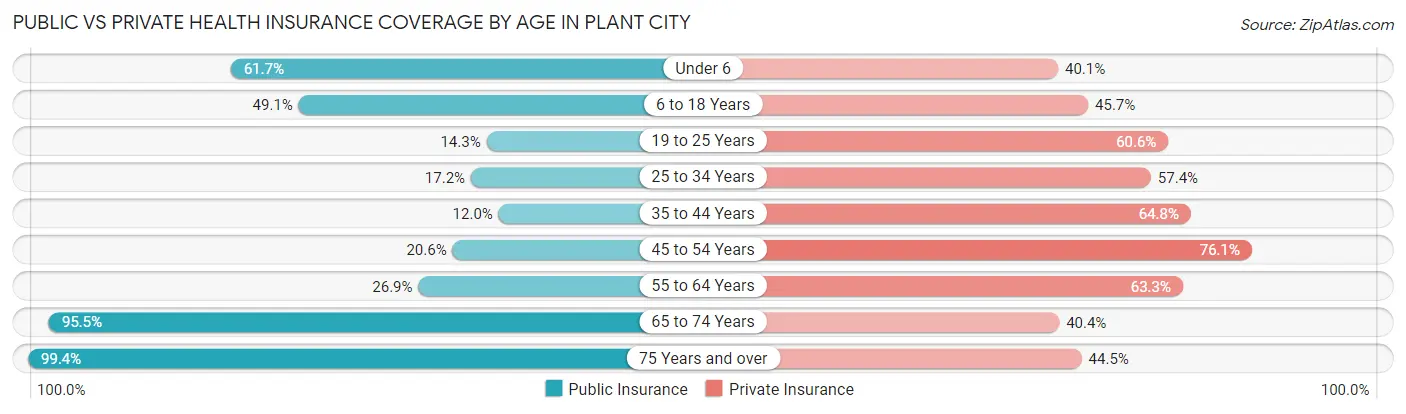
| Age Bracket | Public Insurance | Private Insurance |
| Under 6 | 1,721 (61.7%) | 1,119 (40.1%) |
| 6 to 18 Years | 3,558 (49.1%) | 3,311 (45.7%) |
| 19 to 25 Years | 471 (14.3%) | 1,999 (60.6%) |
| 25 to 34 Years | 871 (17.2%) | 2,912 (57.4%) |
| 35 to 44 Years | 763 (12.0%) | 4,117 (64.8%) |
| 45 to 54 Years | 983 (20.6%) | 3,635 (76.1%) |
| 55 to 64 Years | 1,326 (26.9%) | 3,119 (63.3%) |
| 65 to 74 Years | 2,994 (95.5%) | 1,265 (40.4%) |
| 75 Years and over | 1,806 (99.4%) | 809 (44.5%) |
| Total | 14,493 (36.8%) | 22,286 (56.5%) |
Disability Status by Sex by Age in Plant City
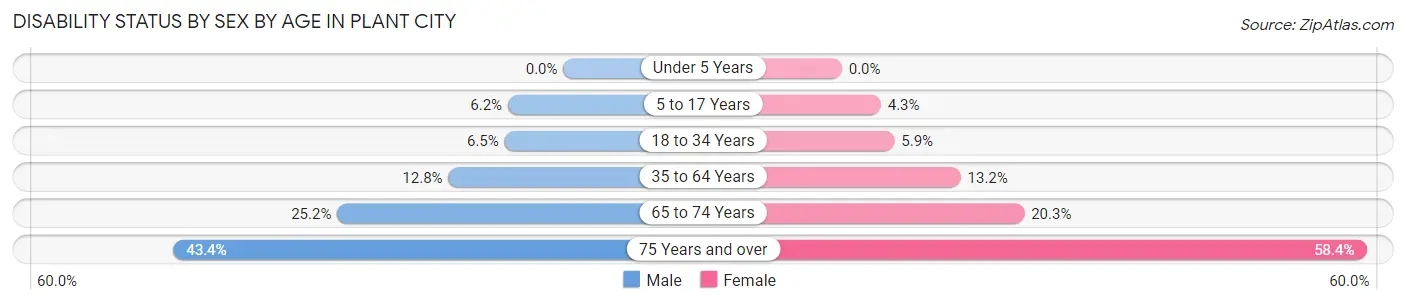
| Age Bracket | Male | Female |
| Under 5 Years | 0 (0.0%) | 0 (0.0%) |
| 5 to 17 Years | 223 (6.2%) | 143 (4.3%) |
| 18 to 34 Years | 309 (6.5%) | 262 (5.9%) |
| 35 to 64 Years | 1,030 (12.8%) | 1,060 (13.2%) |
| 65 to 74 Years | 342 (25.2%) | 361 (20.3%) |
| 75 Years and over | 334 (43.4%) | 612 (58.4%) |
Disability Class by Sex by Age in Plant City
Disability Class: Hearing Difficulty
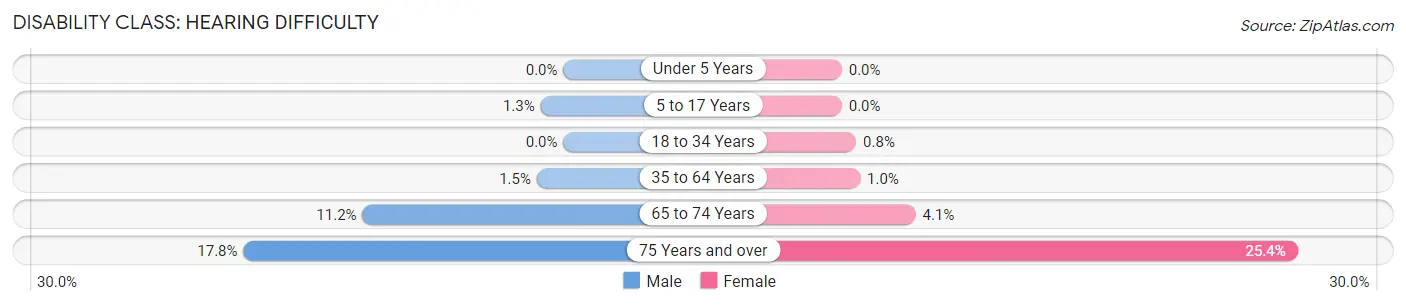
| Age Bracket | Male | Female |
| Under 5 Years | 0 (0.0%) | 0 (0.0%) |
| 5 to 17 Years | 46 (1.3%) | 0 (0.0%) |
| 18 to 34 Years | 0 (0.0%) | 36 (0.8%) |
| 35 to 64 Years | 119 (1.5%) | 82 (1.0%) |
| 65 to 74 Years | 152 (11.2%) | 73 (4.1%) |
| 75 Years and over | 137 (17.8%) | 266 (25.4%) |
Disability Class: Vision Difficulty
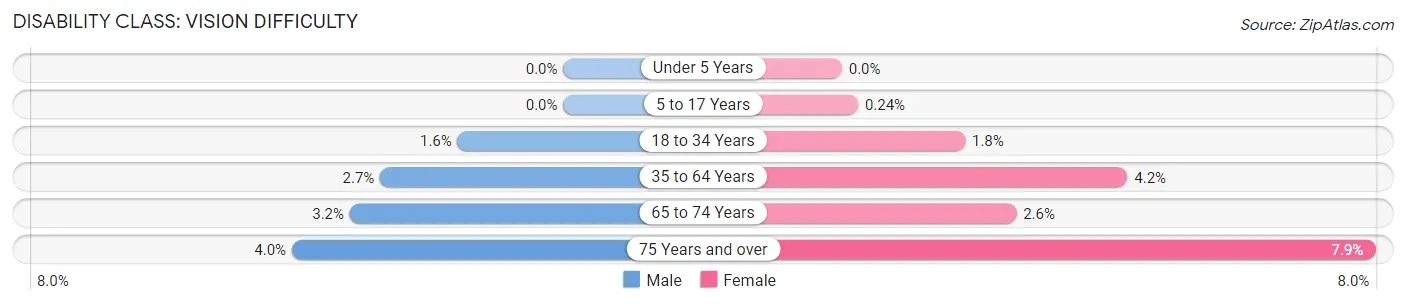
| Age Bracket | Male | Female |
| Under 5 Years | 0 (0.0%) | 0 (0.0%) |
| 5 to 17 Years | 0 (0.0%) | 8 (0.2%) |
| 18 to 34 Years | 74 (1.6%) | 82 (1.8%) |
| 35 to 64 Years | 219 (2.7%) | 340 (4.2%) |
| 65 to 74 Years | 43 (3.2%) | 46 (2.6%) |
| 75 Years and over | 31 (4.0%) | 83 (7.9%) |
Disability Class: Cognitive Difficulty
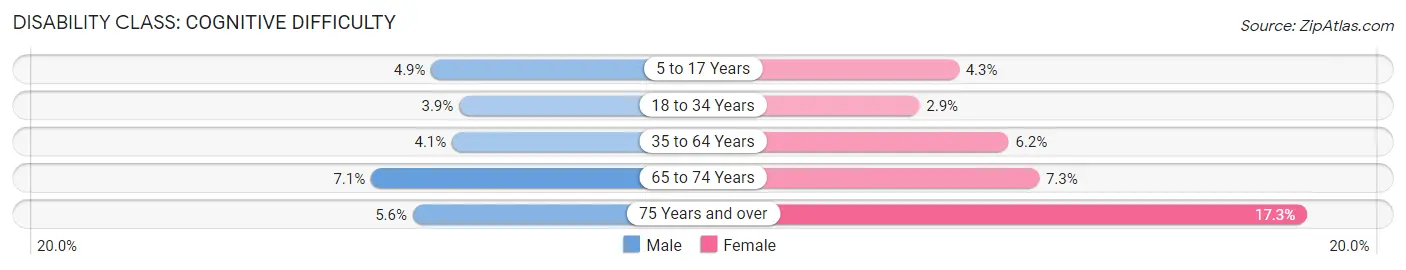
| Age Bracket | Male | Female |
| 5 to 17 Years | 177 (4.9%) | 143 (4.3%) |
| 18 to 34 Years | 183 (3.9%) | 129 (2.9%) |
| 35 to 64 Years | 332 (4.1%) | 496 (6.2%) |
| 65 to 74 Years | 97 (7.1%) | 130 (7.3%) |
| 75 Years and over | 43 (5.6%) | 181 (17.3%) |
Disability Class: Ambulatory Difficulty
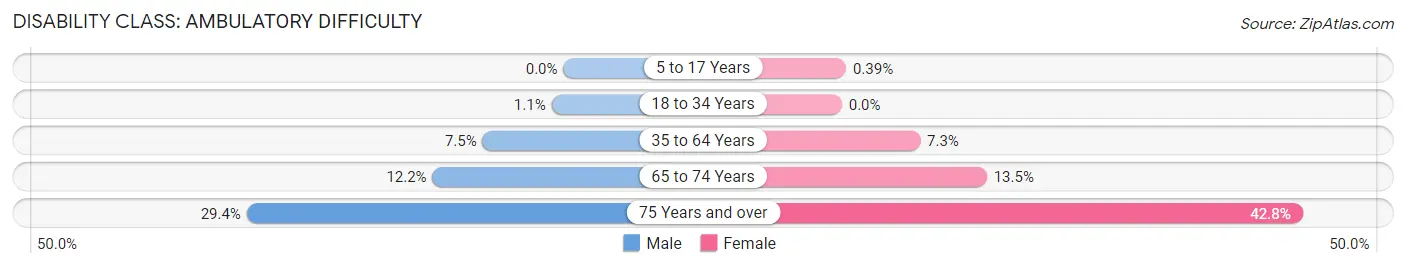
| Age Bracket | Male | Female |
| 5 to 17 Years | 0 (0.0%) | 13 (0.4%) |
| 18 to 34 Years | 52 (1.1%) | 0 (0.0%) |
| 35 to 64 Years | 603 (7.5%) | 583 (7.3%) |
| 65 to 74 Years | 165 (12.1%) | 239 (13.5%) |
| 75 Years and over | 226 (29.4%) | 448 (42.7%) |
Disability Class: Self-Care Difficulty
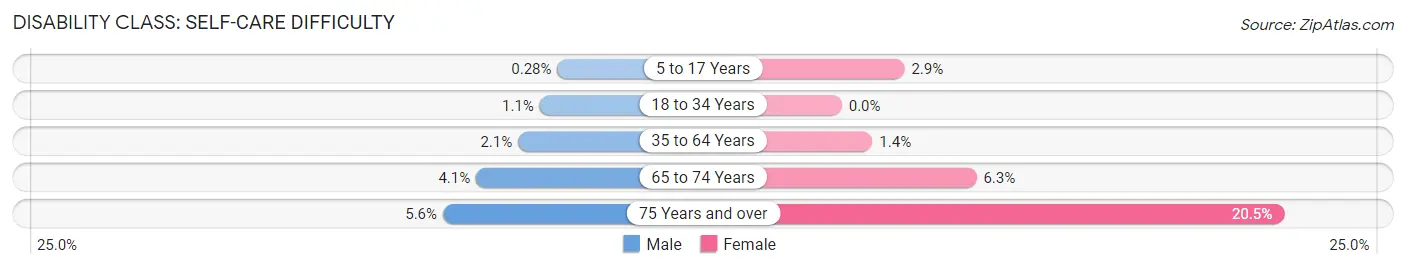
| Age Bracket | Male | Female |
| 5 to 17 Years | 10 (0.3%) | 96 (2.9%) |
| 18 to 34 Years | 52 (1.1%) | 0 (0.0%) |
| 35 to 64 Years | 169 (2.1%) | 114 (1.4%) |
| 65 to 74 Years | 55 (4.1%) | 111 (6.2%) |
| 75 Years and over | 43 (5.6%) | 215 (20.5%) |
Technology Access in Plant City
Computing Device Access in Plant City
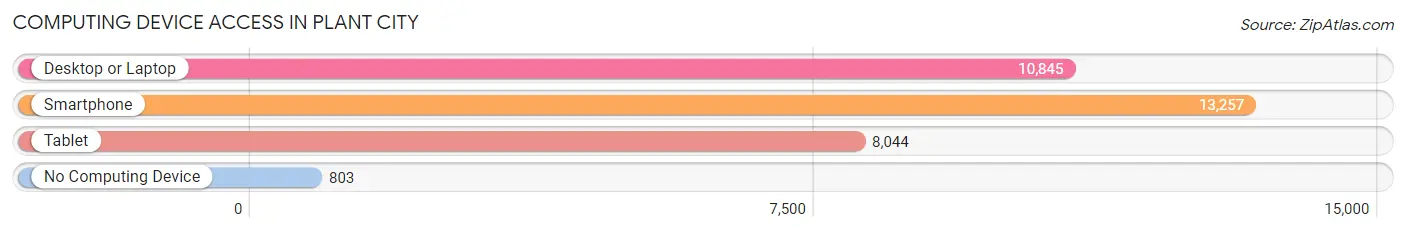
| Device Type | # Households | % Households |
| Desktop or Laptop | 10,845 | 74.8% |
| Smartphone | 13,257 | 91.4% |
| Tablet | 8,044 | 55.5% |
| No Computing Device | 803 | 5.5% |
| Total | 14,500 | 100.0% |
Internet Access in Plant City
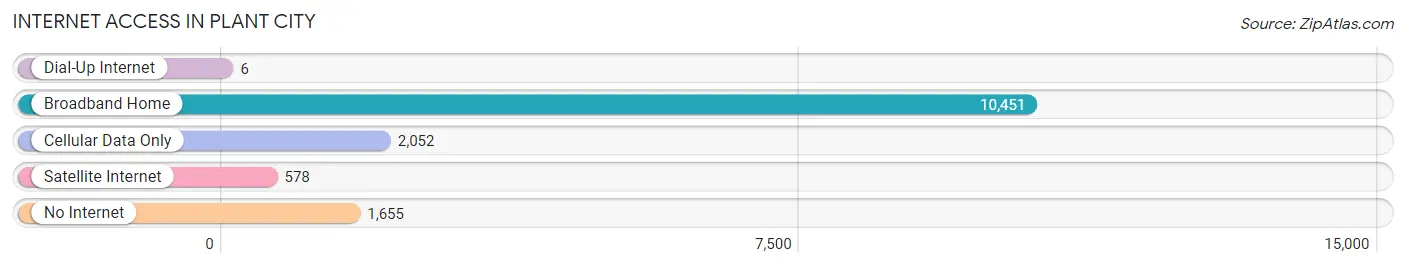
| Internet Type | # Households | % Households |
| Dial-Up Internet | 6 | 0.0% |
| Broadband Home | 10,451 | 72.1% |
| Cellular Data Only | 2,052 | 14.1% |
| Satellite Internet | 578 | 4.0% |
| No Internet | 1,655 | 11.4% |
| Total | 14,500 | 100.0% |
Plant City Summary
Plant City is a city located in Hillsborough County, Florida, United States, approximately 20 miles east of Tampa. The population was 34,721 at the 2010 census. Plant City is known as the winter strawberry capital of the world and hosts the annual Florida Strawberry Festival in the late winter.
History
Plant City was founded in 1885 by Henry B. Plant, a railroad magnate, who purchased the land and built the railroad line that connected the city to Tampa. Plant City was named after him and was incorporated in 1892.
Plant City was a major center for the citrus industry in the early 20th century. The city was also home to a large phosphate mining industry. In the 1950s, Plant City became a major center for the strawberry industry, and it remains so today.
Geography
Plant City is located in central Hillsborough County, approximately 20 miles east of Tampa. The city is situated on the northern edge of the Green Swamp, a vast area of wetlands and forests that stretches across central Florida. The city is bordered by the cities of Lakeland to the east, Brandon to the south, and Thonotosassa to the west.
The city has a total area of 16.2 square miles, of which 16.1 square miles is land and 0.1 square miles is water. The city is located in the humid subtropical climate zone, with hot, humid summers and mild winters.
Economy
Plant City is a major center for the agricultural industry, particularly the strawberry industry. The city is home to numerous strawberry farms, as well as other agricultural operations such as nurseries and greenhouses. The city is also home to several manufacturing and distribution companies, including a Coca-Cola bottling plant and a distribution center for Publix Super Markets.
The city is also home to several retail and dining establishments, as well as a variety of professional services. The city is served by the Plant City Airport, which is located just outside the city limits.
Demographics
As of the 2010 census, there were 34,721 people, 12,845 households, and 8,845 families residing in the city. The population density was 2,145.3 people per square mile. The racial makeup of the city was 68.2% White, 19.3% African American, 0.5% Native American, 1.2% Asian, 0.1% Pacific Islander, 8.2% from other races, and 2.5% from two or more races. Hispanic or Latino of any race were 19.3% of the population.
The median income for a household in the city was $37,845, and the median income for a family was $45,945. The per capita income for the city was $19,845. About 16.2% of families and 19.7% of the population were below the poverty line, including 28.2% of those under age 18 and 11.2% of those age 65 or over.
Common Questions
What is Per Capita Income in Plant City?
Per Capita income in Plant City is $29,466.
What is the Median Family Income in Plant City?
Median Family Income in Plant City is $71,712.
What is the Median Household income in Plant City?
Median Household Income in Plant City is $62,015.
What is Income or Wage Gap in Plant City?
Income or Wage Gap in Plant City is 15.2%.
Women in Plant City earn 84.8 cents for every dollar earned by a man.
What is Family Income Deficit in Plant City?
Family Income Deficit in Plant City is $12,608.
Families that are below poverty line in Plant City earn $12,608 less on average than the poverty threshold level.
What is Inequality or Gini Index in Plant City?
Inequality or Gini Index in Plant City is 0.41.
What is the Total Population of Plant City?
Total Population of Plant City is 39,655.
What is the Total Male Population of Plant City?
Total Male Population of Plant City is 19,680.
What is the Total Female Population of Plant City?
Total Female Population of Plant City is 19,975.
What is the Ratio of Males per 100 Females in Plant City?
There are 98.52 Males per 100 Females in Plant City.
What is the Ratio of Females per 100 Males in Plant City?
There are 101.50 Females per 100 Males in Plant City.
What is the Median Population Age in Plant City?
Median Population Age in Plant City is 37.6 Years.
What is the Average Family Size in Plant City
Average Family Size in Plant City is 3.3 People.
What is the Average Household Size in Plant City
Average Household Size in Plant City is 2.7 People.
How Large is the Labor Force in Plant City?
There are 21,030 People in the Labor Forcein in Plant City.
What is the Percentage of People in the Labor Force in Plant City?
66.6% of People are in the Labor Force in Plant City.
What is the Unemployment Rate in Plant City?
Unemployment Rate in Plant City is 3.2%.