Valley Falls, SC Map & Demographics
Valley Falls Map
Valley Falls Overview
$26,911
PER CAPITA INCOME
$69,416
AVG FAMILY INCOME
$47,695
AVG HOUSEHOLD INCOME
61.7%
WAGE / INCOME GAP [ % ]
38.3¢/ $1
WAGE / INCOME GAP [ $ ]
0.48
INEQUALITY / GINI INDEX
7,104
TOTAL POPULATION
2,766
MALE POPULATION
4,338
FEMALE POPULATION
63.76
MALES / 100 FEMALES
156.83
FEMALES / 100 MALES
25.6
MEDIAN AGE
2.6
AVG FAMILY SIZE
2.3
AVG HOUSEHOLD SIZE
4,389
LABOR FORCE [ PEOPLE ]
68.5%
PERCENT IN LABOR FORCE
4.5%
UNEMPLOYMENT RATE
Income in Valley Falls
Income Overview in Valley Falls
Per Capita Income in Valley Falls is $26,911, while median incomes of families and households are $69,416 and $47,695 respectively.
| Characteristic | Number | Measure |
| Per Capita Income | 7,104 | $26,911 |
| Median Family Income | 1,642 | $69,416 |
| Mean Family Income | 1,642 | $79,290 |
| Median Household Income | 2,671 | $47,695 |
| Mean Household Income | 2,671 | $65,389 |
| Income Deficit | 1,642 | $0 |
| Wage / Income Gap (%) | 7,104 | 61.67% |
| Wage / Income Gap ($) | 7,104 | 38.33¢ per $1 |
| Gini / Inequality Index | 7,104 | 0.48 |
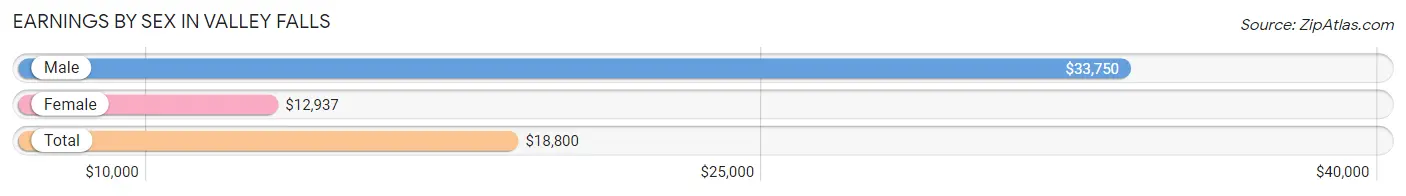
Earnings by Sex in Valley Falls
Average Earnings in Valley Falls are $18,800, $33,750 for men and $12,937 for women, a difference of 61.7%.
| Sex | Number | Average Earnings |
| Male | 2,143 (43.0%) | $33,750 |
| Female | 2,845 (57.0%) | $12,937 |
| Total | 4,988 (100.0%) | $18,800 |
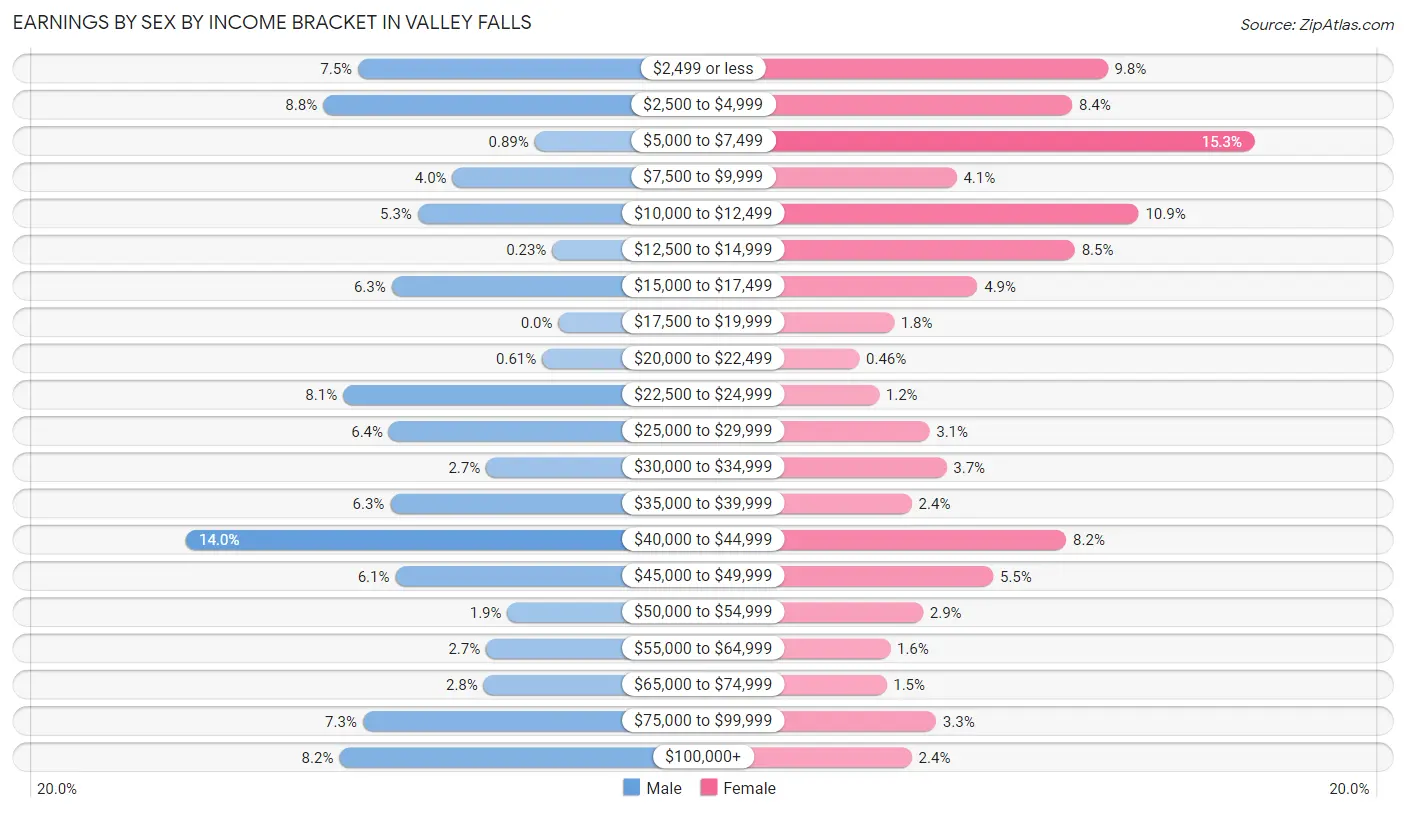
Earnings by Sex by Income Bracket in Valley Falls
The most common earnings brackets in Valley Falls are $40,000 to $44,999 for men (299 | 14.0%) and $5,000 to $7,499 for women (434 | 15.2%).
| Income | Male | Female |
| $2,499 or less | 161 (7.5%) | 278 (9.8%) |
| $2,500 to $4,999 | 189 (8.8%) | 240 (8.4%) |
| $5,000 to $7,499 | 19 (0.9%) | 434 (15.2%) |
| $7,500 to $9,999 | 85 (4.0%) | 117 (4.1%) |
| $10,000 to $12,499 | 113 (5.3%) | 311 (10.9%) |
| $12,500 to $14,999 | 5 (0.2%) | 243 (8.5%) |
| $15,000 to $17,499 | 134 (6.2%) | 139 (4.9%) |
| $17,500 to $19,999 | 0 (0.0%) | 50 (1.8%) |
| $20,000 to $22,499 | 13 (0.6%) | 13 (0.5%) |
| $22,500 to $24,999 | 173 (8.1%) | 34 (1.2%) |
| $25,000 to $29,999 | 136 (6.4%) | 88 (3.1%) |
| $30,000 to $34,999 | 58 (2.7%) | 106 (3.7%) |
| $35,000 to $39,999 | 135 (6.3%) | 69 (2.4%) |
| $40,000 to $44,999 | 299 (14.0%) | 234 (8.2%) |
| $45,000 to $49,999 | 131 (6.1%) | 156 (5.5%) |
| $50,000 to $54,999 | 41 (1.9%) | 81 (2.9%) |
| $55,000 to $64,999 | 58 (2.7%) | 46 (1.6%) |
| $65,000 to $74,999 | 60 (2.8%) | 42 (1.5%) |
| $75,000 to $99,999 | 157 (7.3%) | 95 (3.3%) |
| $100,000+ | 176 (8.2%) | 69 (2.4%) |
| Total | 2,143 (100.0%) | 2,845 (100.0%) |
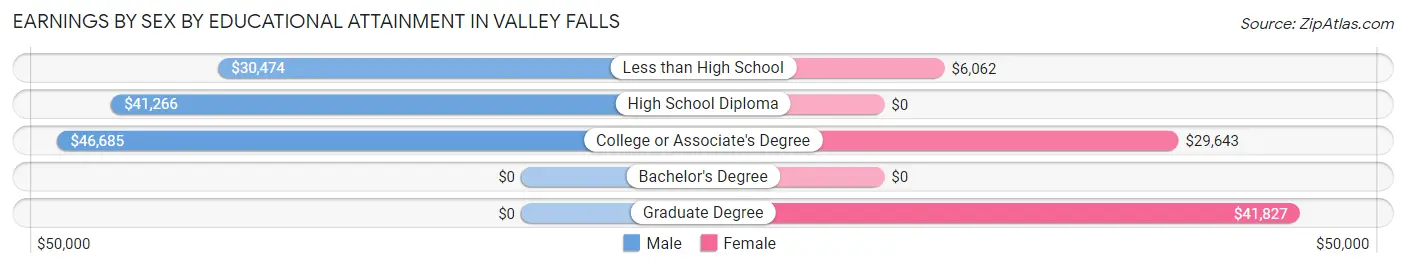
Earnings by Sex by Educational Attainment in Valley Falls
Average earnings in Valley Falls are $41,433 for men and $29,226 for women, a difference of 29.5%. Men with an educational attainment of college or associate's degree enjoy the highest average annual earnings of $46,685, while those with less than high school education earn the least with $30,474. Women with an educational attainment of graduate degree earn the most with the average annual earnings of $41,827, while those with less than high school education have the smallest earnings of $6,062.
| Educational Attainment | Male Income | Female Income |
| Less than High School | $30,474 | $6,062 |
| High School Diploma | $41,266 | $0 |
| College or Associate's Degree | $46,685 | $29,643 |
| Bachelor's Degree | - | - |
| Graduate Degree | - | - |
| Total | $41,433 | $29,226 |
Family Income in Valley Falls
Family Income Brackets in Valley Falls
According to the Valley Falls family income data, there are 427 families falling into the $75,000 to $99,999 income range, which is the most common income bracket and makes up 26.0% of all families. Conversely, the $25,000 to $34,999 income bracket is the least frequent group with only 36 families (2.2%) belonging to this category.
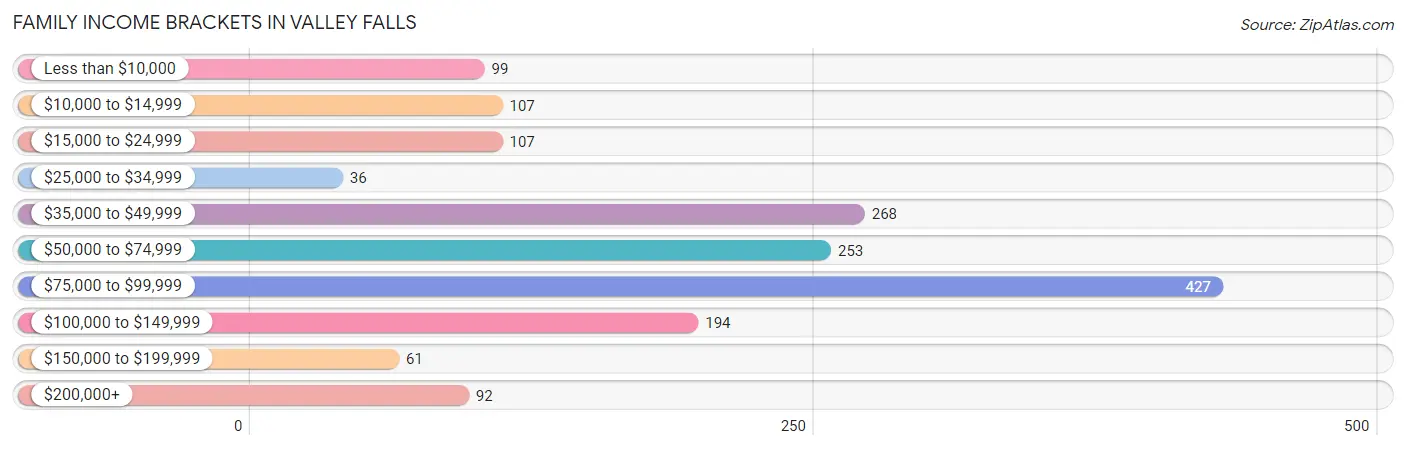
| Income Bracket | # Families | % Families |
| Less than $10,000 | 99 | 6.0% |
| $10,000 to $14,999 | 107 | 6.5% |
| $15,000 to $24,999 | 107 | 6.5% |
| $25,000 to $34,999 | 36 | 2.2% |
| $35,000 to $49,999 | 268 | 16.3% |
| $50,000 to $74,999 | 253 | 15.4% |
| $75,000 to $99,999 | 427 | 26.0% |
| $100,000 to $149,999 | 194 | 11.8% |
| $150,000 to $199,999 | 61 | 3.7% |
| $200,000+ | 92 | 5.6% |
Family Income by Famaliy Size in Valley Falls
4-person families (175 | 10.7%) account for the highest median family income in Valley Falls with $104,531 per family, while 3-person families (340 | 20.7%) have the highest median income of $33,186 per family member.
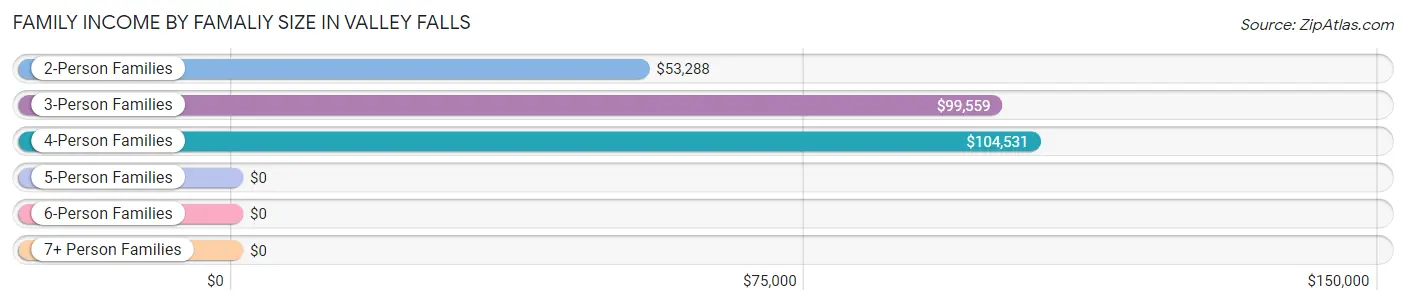
| Income Bracket | # Families | Median Income |
| 2-Person Families | 1,074 (65.4%) | $53,288 |
| 3-Person Families | 340 (20.7%) | $99,559 |
| 4-Person Families | 175 (10.7%) | $104,531 |
| 5-Person Families | 37 (2.2%) | $0 |
| 6-Person Families | 0 (0.0%) | $0 |
| 7+ Person Families | 16 (1.0%) | $0 |
| Total | 1,642 (100.0%) | $69,416 |
Family Income by Number of Earners in Valley Falls
The median family income in Valley Falls is $69,416, with families comprising 2 earners (683) having the highest median family income of $85,721, while families with 1 earner (657) have the lowest median family income of $42,283, accounting for 41.6% and 40.0% of families, respectively.
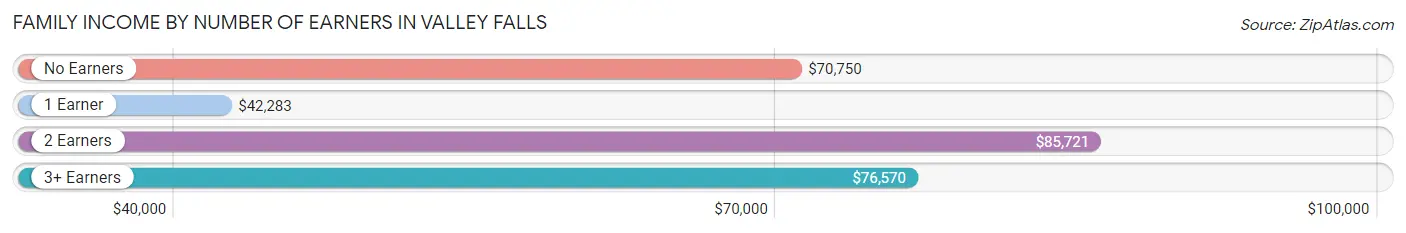
| Number of Earners | # Families | Median Income |
| No Earners | 110 (6.7%) | $70,750 |
| 1 Earner | 657 (40.0%) | $42,283 |
| 2 Earners | 683 (41.6%) | $85,721 |
| 3+ Earners | 192 (11.7%) | $76,570 |
| Total | 1,642 (100.0%) | $69,416 |
Household Income in Valley Falls
Household Income Brackets in Valley Falls
With 542 households falling in the category, the $75,000 to $99,999 income range is the most frequent in Valley Falls, accounting for 20.3% of all households. In contrast, only 69 households (2.6%) fall into the $150,000 to $199,999 income bracket, making it the least populous group.
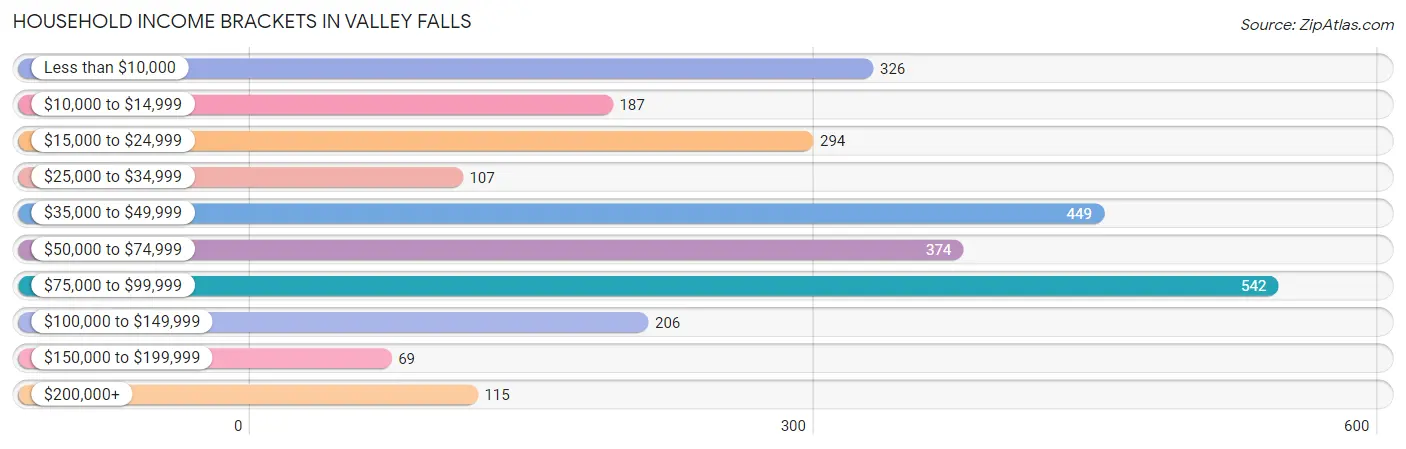
| Income Bracket | # Households | % Households |
| Less than $10,000 | 326 | 12.2% |
| $10,000 to $14,999 | 187 | 7.0% |
| $15,000 to $24,999 | 294 | 11.0% |
| $25,000 to $34,999 | 107 | 4.0% |
| $35,000 to $49,999 | 449 | 16.8% |
| $50,000 to $74,999 | 374 | 14.0% |
| $75,000 to $99,999 | 542 | 20.3% |
| $100,000 to $149,999 | 206 | 7.7% |
| $150,000 to $199,999 | 69 | 2.6% |
| $200,000+ | 115 | 4.3% |
Household Income by Householder Age in Valley Falls
The median household income in Valley Falls is $47,695, with the highest median household income of $79,301 found in the 45 to 64 years age bracket for the primary householder. A total of 762 households (28.5%) fall into this category. Meanwhile, the 25 to 44 years age bracket for the primary householder has the lowest median household income of $35,919, with 929 households (34.8%) in this group.
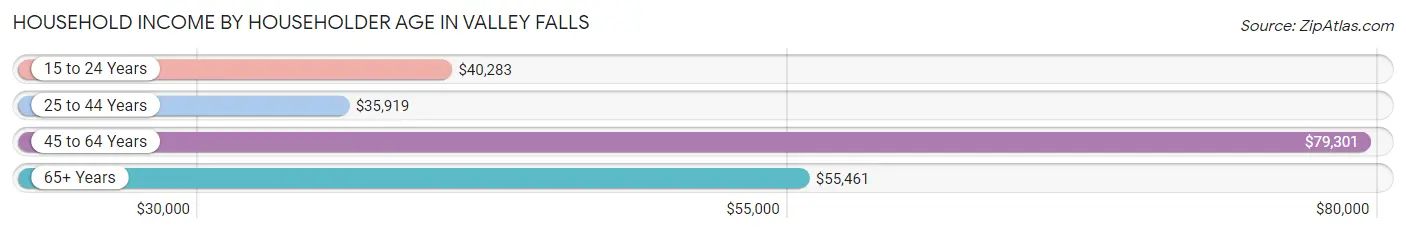
| Income Bracket | # Households | Median Income |
| 15 to 24 Years | 637 (23.8%) | $40,283 |
| 25 to 44 Years | 929 (34.8%) | $35,919 |
| 45 to 64 Years | 762 (28.5%) | $79,301 |
| 65+ Years | 343 (12.8%) | $55,461 |
| Total | 2,671 (100.0%) | $47,695 |
Poverty in Valley Falls
Income Below Poverty by Sex and Age in Valley Falls
With 13.6% poverty level for males and 33.1% for females among the residents of Valley Falls, 18 to 24 year old males and under 5 year old females are the most vulnerable to poverty, with 164 males (29.2%) and 153 females (69.9%) in their respective age groups living below the poverty level.
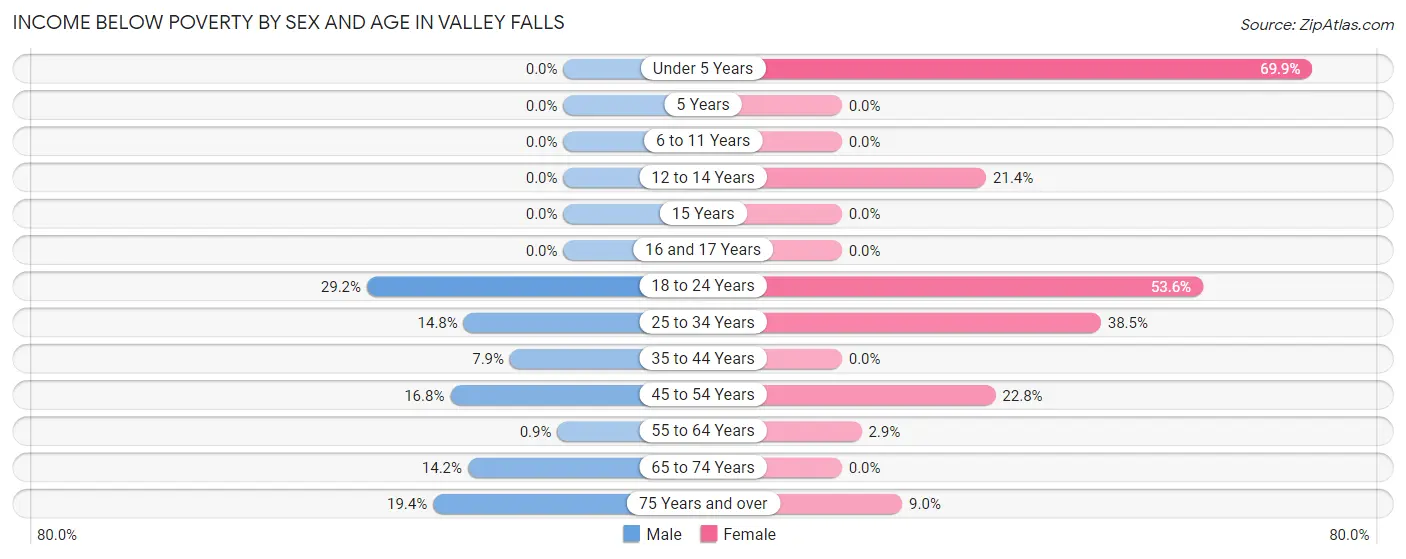
| Age Bracket | Male | Female |
| Under 5 Years | 0 (0.0%) | 153 (69.9%) |
| 5 Years | 0 (0.0%) | 0 (0.0%) |
| 6 to 11 Years | 0 (0.0%) | 0 (0.0%) |
| 12 to 14 Years | 0 (0.0%) | 3 (21.4%) |
| 15 Years | 0 (0.0%) | 0 (0.0%) |
| 16 and 17 Years | 0 (0.0%) | 0 (0.0%) |
| 18 to 24 Years | 164 (29.2%) | 689 (53.6%) |
| 25 to 34 Years | 81 (14.8%) | 260 (38.5%) |
| 35 to 44 Years | 15 (7.9%) | 0 (0.0%) |
| 45 to 54 Years | 43 (16.8%) | 73 (22.8%) |
| 55 to 64 Years | 4 (0.9%) | 10 (2.9%) |
| 65 to 74 Years | 19 (14.2%) | 0 (0.0%) |
| 75 Years and over | 18 (19.4%) | 19 (9.0%) |
| Total | 344 (13.6%) | 1,207 (33.1%) |
Income Above Poverty by Sex and Age in Valley Falls
According to the poverty statistics in Valley Falls, males aged under 5 years and females aged 5 years are the age groups that are most secure financially, with 100.0% of males and 100.0% of females in these age groups living above the poverty line.
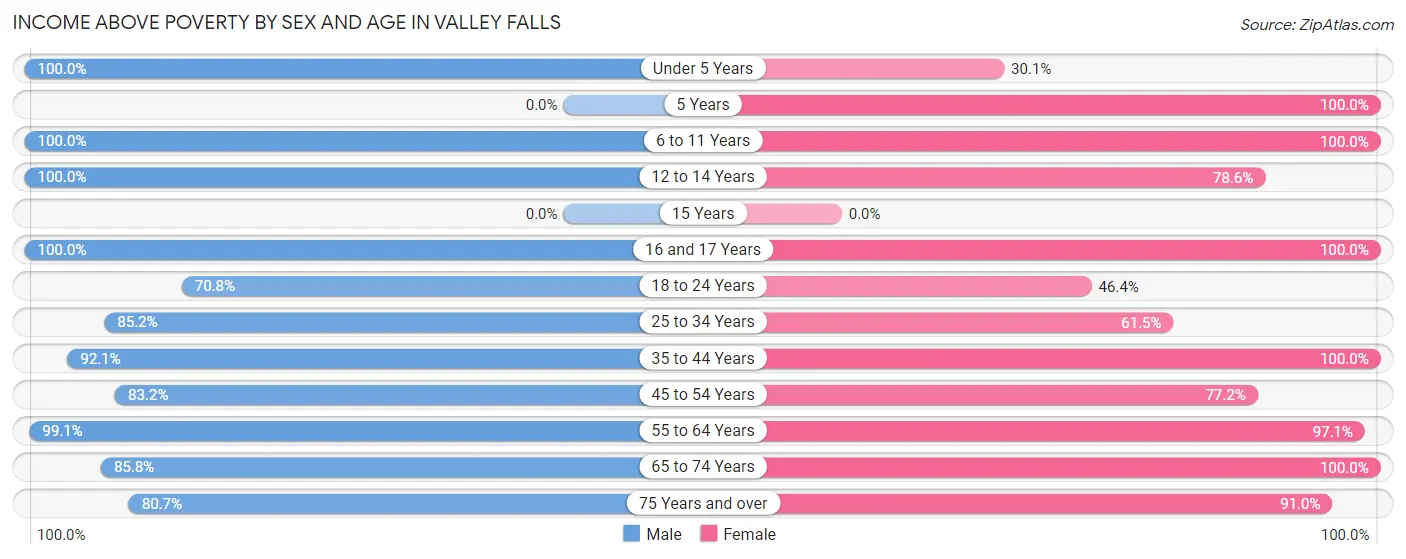
| Age Bracket | Male | Female |
| Under 5 Years | 208 (100.0%) | 66 (30.1%) |
| 5 Years | 0 (0.0%) | 13 (100.0%) |
| 6 to 11 Years | 28 (100.0%) | 167 (100.0%) |
| 12 to 14 Years | 47 (100.0%) | 11 (78.6%) |
| 15 Years | 0 (0.0%) | 0 (0.0%) |
| 16 and 17 Years | 27 (100.0%) | 14 (100.0%) |
| 18 to 24 Years | 398 (70.8%) | 596 (46.4%) |
| 25 to 34 Years | 466 (85.2%) | 416 (61.5%) |
| 35 to 44 Years | 174 (92.1%) | 220 (100.0%) |
| 45 to 54 Years | 213 (83.2%) | 247 (77.2%) |
| 55 to 64 Years | 438 (99.1%) | 332 (97.1%) |
| 65 to 74 Years | 115 (85.8%) | 163 (100.0%) |
| 75 Years and over | 75 (80.6%) | 193 (91.0%) |
| Total | 2,189 (86.4%) | 2,438 (66.9%) |
Income Below Poverty Among Married-Couple Families in Valley Falls
The poverty statistics for married-couple families in Valley Falls show that 2.2% or 22 of the total 1,020 families live below the poverty line. Families with no children have the highest poverty rate of 3.0%, comprising of 19 families. On the other hand, families with 3 or 4 children have the lowest poverty rate of 0.0%, which includes 0 families.
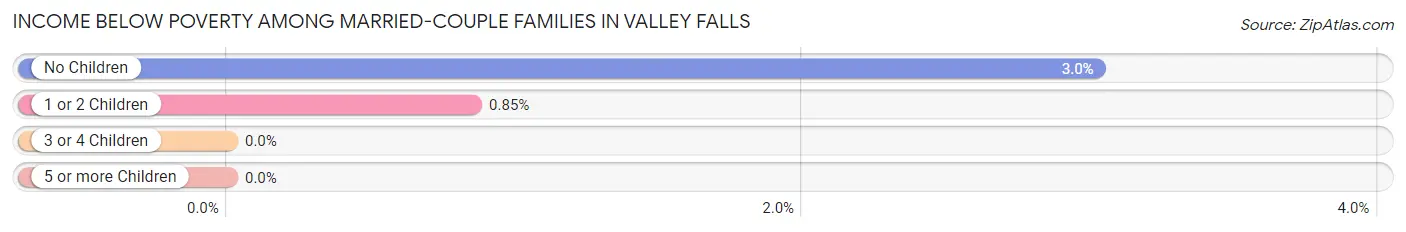
| Children | Above Poverty | Below Poverty |
| No Children | 611 (97.0%) | 19 (3.0%) |
| 1 or 2 Children | 351 (99.2%) | 3 (0.9%) |
| 3 or 4 Children | 36 (100.0%) | 0 (0.0%) |
| 5 or more Children | 0 (0.0%) | 0 (0.0%) |
| Total | 998 (97.8%) | 22 (2.2%) |
Income Below Poverty Among Single-Parent Households in Valley Falls
According to the poverty data in Valley Falls, 7.9% or 15 single-father households and 44.1% or 190 single-mother households are living below the poverty line. Among single-father households, those with no children have the highest poverty rate, with 15 households (12.9%) experiencing poverty. Likewise, among single-mother households, those with 1 or 2 children have the highest poverty rate, with 190 households (94.1%) falling below the poverty line.
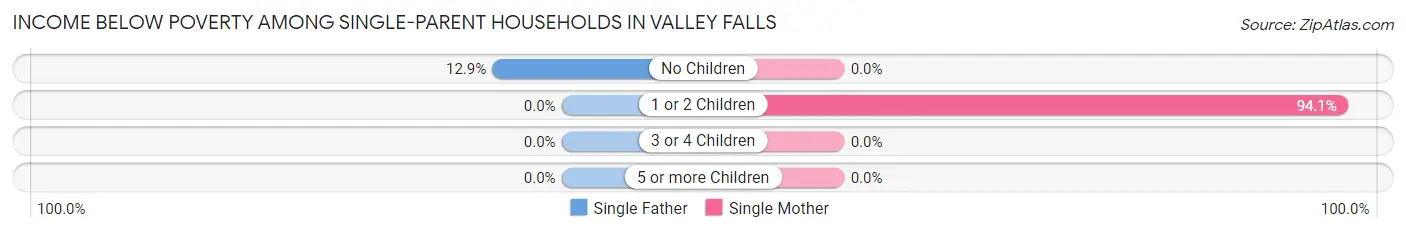
| Children | Single Father | Single Mother |
| No Children | 15 (12.9%) | 0 (0.0%) |
| 1 or 2 Children | 0 (0.0%) | 190 (94.1%) |
| 3 or 4 Children | 0 (0.0%) | 0 (0.0%) |
| 5 or more Children | 0 (0.0%) | 0 (0.0%) |
| Total | 15 (7.9%) | 190 (44.1%) |
Income Below Poverty Among Married-Couple vs Single-Parent Households in Valley Falls
The poverty data for Valley Falls shows that 22 of the married-couple family households (2.2%) and 205 of the single-parent households (33.0%) are living below the poverty level. Within the married-couple family households, those with no children have the highest poverty rate, with 19 households (3.0%) falling below the poverty line. Among the single-parent households, those with 1 or 2 children have the highest poverty rate, with 190 household (68.6%) living below poverty.
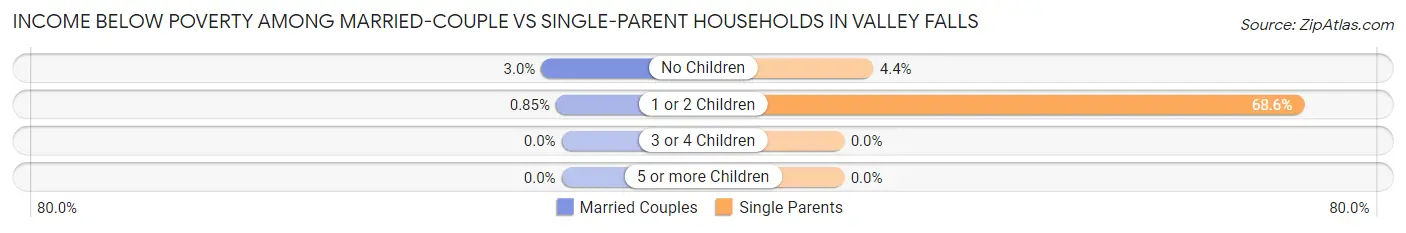
| Children | Married-Couple Families | Single-Parent Households |
| No Children | 19 (3.0%) | 15 (4.3%) |
| 1 or 2 Children | 3 (0.9%) | 190 (68.6%) |
| 3 or 4 Children | 0 (0.0%) | 0 (0.0%) |
| 5 or more Children | 0 (0.0%) | 0 (0.0%) |
| Total | 22 (2.2%) | 205 (33.0%) |
Race in Valley Falls
The most populous races in Valley Falls are White / Caucasian (4,347 | 61.2%), Black / African American (2,201 | 31.0%), and Hispanic or Latino (379 | 5.3%).
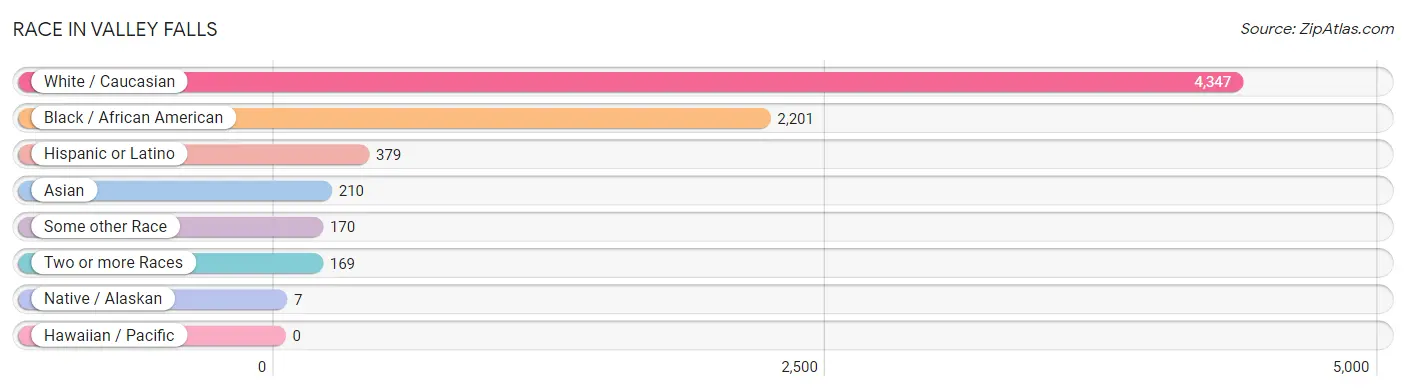
| Race | # Population | % Population |
| Asian | 210 | 3.0% |
| Black / African American | 2,201 | 31.0% |
| Hawaiian / Pacific | 0 | 0.0% |
| Hispanic or Latino | 379 | 5.3% |
| Native / Alaskan | 7 | 0.1% |
| White / Caucasian | 4,347 | 61.2% |
| Two or more Races | 169 | 2.4% |
| Some other Race | 170 | 2.4% |
| Total | 7,104 | 100.0% |
Ancestry in Valley Falls
The most populous ancestries reported in Valley Falls are Irish (652 | 9.2%), English (594 | 8.4%), German (494 | 7.0%), American (417 | 5.9%), and Russian (195 | 2.7%), together accounting for 33.1% of all Valley Falls residents.
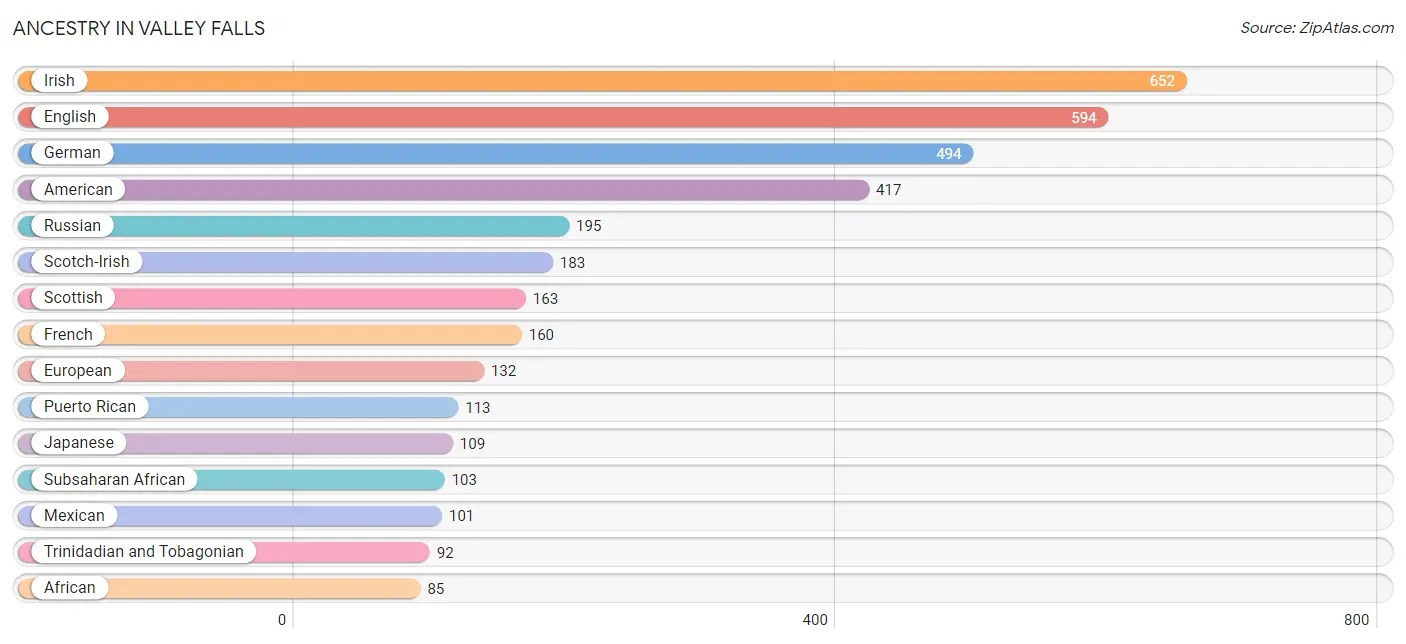
| Ancestry | # Population | % Population |
| African | 85 | 1.2% |
| American | 417 | 5.9% |
| Argentinean | 31 | 0.4% |
| Austrian | 47 | 0.7% |
| Bulgarian | 17 | 0.2% |
| Canadian | 24 | 0.3% |
| Central American | 40 | 0.6% |
| Cherokee | 32 | 0.4% |
| Choctaw | 7 | 0.1% |
| Colombian | 6 | 0.1% |
| Dutch | 7 | 0.1% |
| Ecuadorian | 41 | 0.6% |
| English | 594 | 8.4% |
| European | 132 | 1.9% |
| French | 160 | 2.2% |
| German | 494 | 7.0% |
| Haitian | 5 | 0.1% |
| Honduran | 40 | 0.6% |
| Icelander | 6 | 0.1% |
| Indian (Asian) | 27 | 0.4% |
| Irish | 652 | 9.2% |
| Italian | 58 | 0.8% |
| Japanese | 109 | 1.5% |
| Kenyan | 8 | 0.1% |
| Korean | 18 | 0.3% |
| Mexican | 101 | 1.4% |
| Northern European | 23 | 0.3% |
| Norwegian | 35 | 0.5% |
| Pakistani | 26 | 0.4% |
| Polish | 19 | 0.3% |
| Puerto Rican | 113 | 1.6% |
| Russian | 195 | 2.7% |
| Scotch-Irish | 183 | 2.6% |
| Scottish | 163 | 2.3% |
| South American | 78 | 1.1% |
| Spaniard | 47 | 0.7% |
| Subsaharan African | 103 | 1.5% |
| Swedish | 39 | 0.5% |
| Swiss | 20 | 0.3% |
| Thai | 35 | 0.5% |
| Trinidadian and Tobagonian | 92 | 1.3% |
| Ugandan | 13 | 0.2% |
| Ukrainian | 33 | 0.5% |
| Welsh | 63 | 0.9% | View All 44 Rows |
Immigrants in Valley Falls
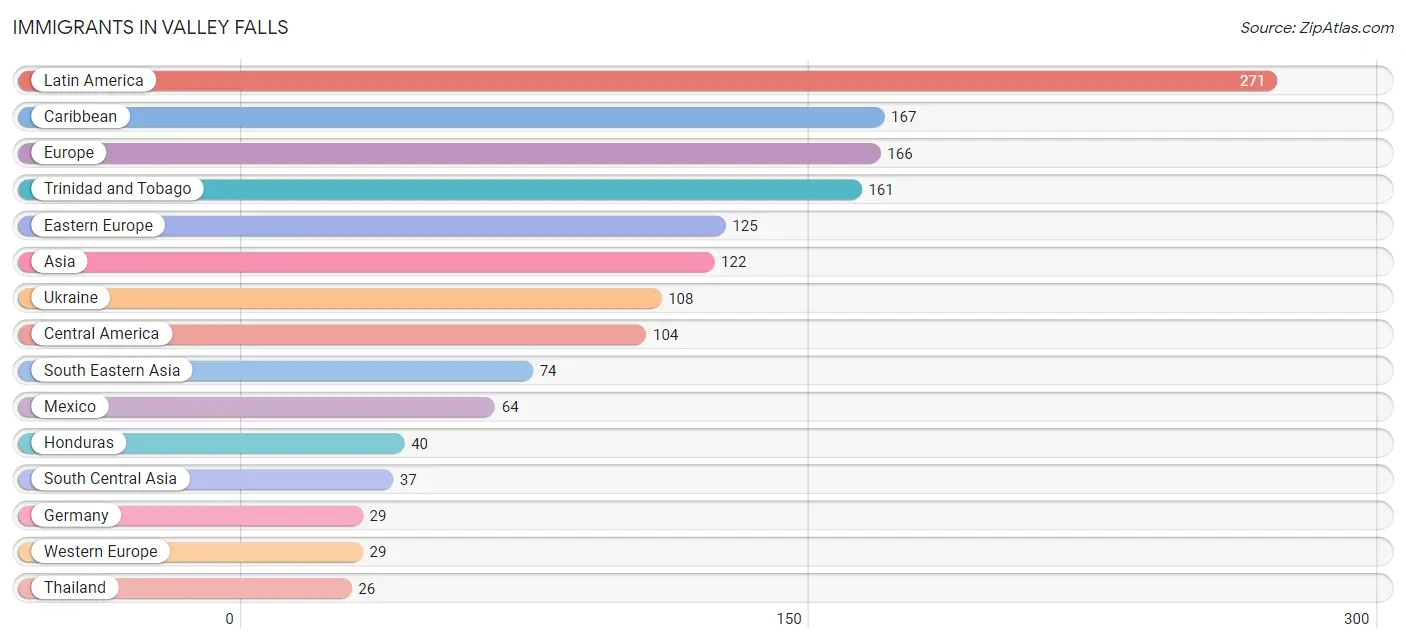
The most numerous immigrant groups reported in Valley Falls came from Latin America (271 | 3.8%), Caribbean (167 | 2.4%), Europe (166 | 2.3%), Trinidad and Tobago (161 | 2.3%), and Eastern Europe (125 | 1.8%), together accounting for 12.5% of all Valley Falls residents.
| Immigration Origin | # Population | % Population |
| Africa | 13 | 0.2% |
| Asia | 122 | 1.7% |
| Cambodia | 19 | 0.3% |
| Caribbean | 167 | 2.4% |
| Central America | 104 | 1.5% |
| China | 11 | 0.2% |
| Eastern Africa | 13 | 0.2% |
| Eastern Asia | 11 | 0.2% |
| Eastern Europe | 125 | 1.8% |
| Europe | 166 | 2.3% |
| Germany | 29 | 0.4% |
| Honduras | 40 | 0.6% |
| India | 20 | 0.3% |
| Jamaica | 6 | 0.1% |
| Kazakhstan | 17 | 0.2% |
| Kenya | 8 | 0.1% |
| Latin America | 271 | 3.8% |
| Mexico | 64 | 0.9% |
| Moldova | 17 | 0.2% |
| Northern Europe | 12 | 0.2% |
| Norway | 12 | 0.2% |
| Philippines | 18 | 0.3% |
| Singapore | 11 | 0.2% |
| South Central Asia | 37 | 0.5% |
| South Eastern Asia | 74 | 1.0% |
| Thailand | 26 | 0.4% |
| Trinidad and Tobago | 161 | 2.3% |
| Ukraine | 108 | 1.5% |
| Western Europe | 29 | 0.4% | View All 29 Rows |
Sex and Age in Valley Falls
Sex and Age in Valley Falls
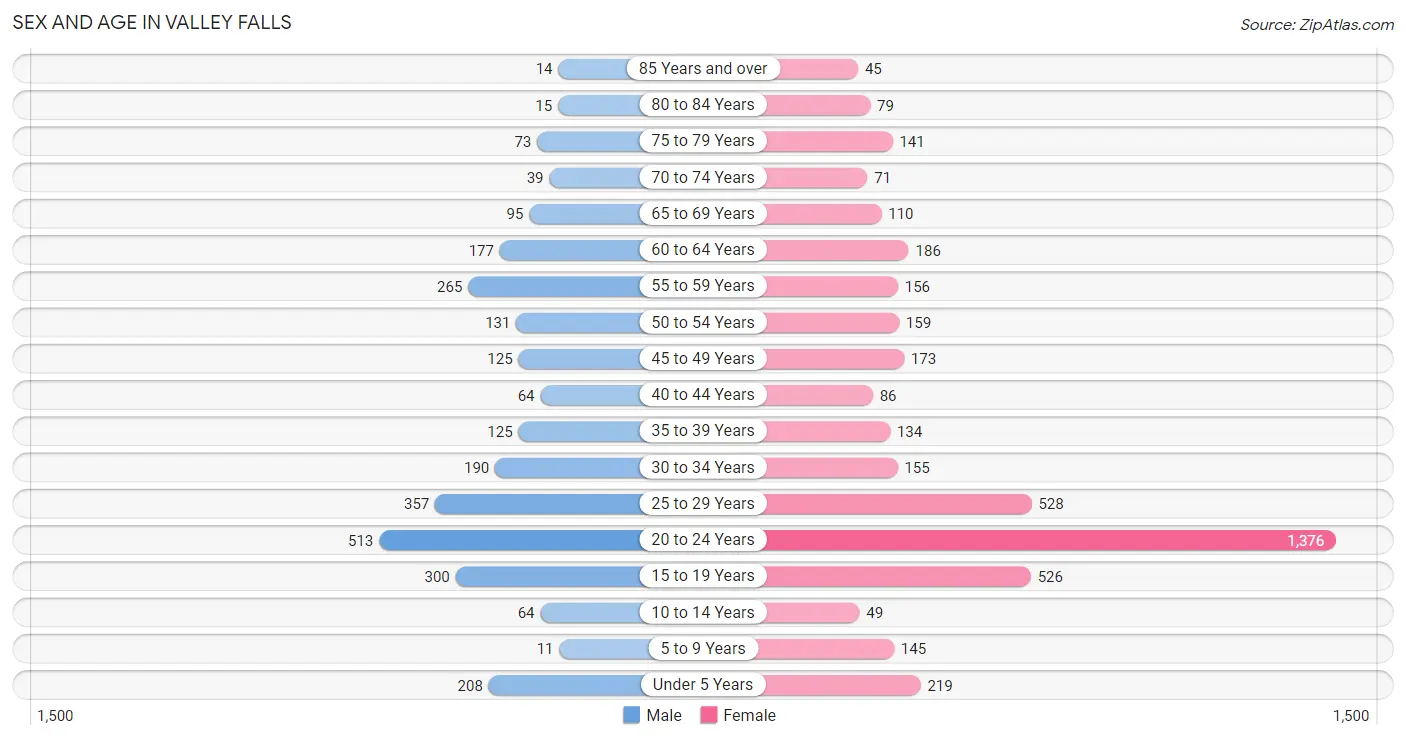
The most populous age groups in Valley Falls are 20 to 24 Years (513 | 18.5%) for men and 20 to 24 Years (1,376 | 31.7%) for women.
| Age Bracket | Male | Female |
| Under 5 Years | 208 (7.5%) | 219 (5.1%) |
| 5 to 9 Years | 11 (0.4%) | 145 (3.3%) |
| 10 to 14 Years | 64 (2.3%) | 49 (1.1%) |
| 15 to 19 Years | 300 (10.8%) | 526 (12.1%) |
| 20 to 24 Years | 513 (18.5%) | 1,376 (31.7%) |
| 25 to 29 Years | 357 (12.9%) | 528 (12.2%) |
| 30 to 34 Years | 190 (6.9%) | 155 (3.6%) |
| 35 to 39 Years | 125 (4.5%) | 134 (3.1%) |
| 40 to 44 Years | 64 (2.3%) | 86 (2.0%) |
| 45 to 49 Years | 125 (4.5%) | 173 (4.0%) |
| 50 to 54 Years | 131 (4.7%) | 159 (3.7%) |
| 55 to 59 Years | 265 (9.6%) | 156 (3.6%) |
| 60 to 64 Years | 177 (6.4%) | 186 (4.3%) |
| 65 to 69 Years | 95 (3.4%) | 110 (2.5%) |
| 70 to 74 Years | 39 (1.4%) | 71 (1.6%) |
| 75 to 79 Years | 73 (2.6%) | 141 (3.3%) |
| 80 to 84 Years | 15 (0.5%) | 79 (1.8%) |
| 85 Years and over | 14 (0.5%) | 45 (1.0%) |
| Total | 2,766 (100.0%) | 4,338 (100.0%) |
Families and Households in Valley Falls
Median Family Size in Valley Falls
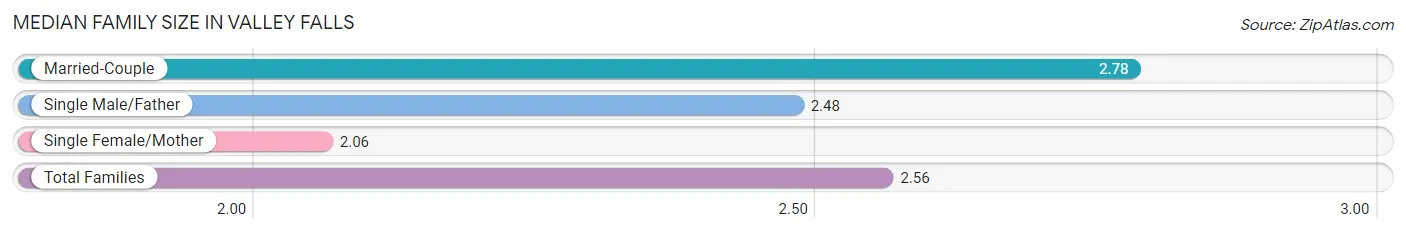
The median family size in Valley Falls is 2.56 persons per family, with married-couple families (1,020 | 62.1%) accounting for the largest median family size of 2.78 persons per family. On the other hand, single female/mother families (431 | 26.3%) represent the smallest median family size with 2.06 persons per family.
| Family Type | # Families | Family Size |
| Married-Couple | 1,020 (62.1%) | 2.78 |
| Single Male/Father | 191 (11.6%) | 2.48 |
| Single Female/Mother | 431 (26.3%) | 2.06 |
| Total Families | 1,642 (100.0%) | 2.56 |
Median Household Size in Valley Falls
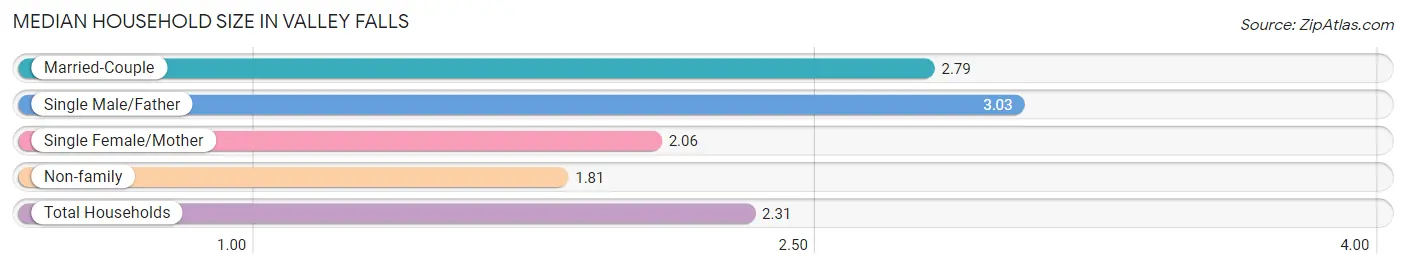
The median household size in Valley Falls is 2.31 persons per household, with single male/father households (191 | 7.1%) accounting for the largest median household size of 3.03 persons per household. non-family households (1,029 | 38.5%) represent the smallest median household size with 1.81 persons per household.
| Household Type | # Households | Household Size |
| Married-Couple | 1,020 (38.2%) | 2.79 |
| Single Male/Father | 191 (7.1%) | 3.03 |
| Single Female/Mother | 431 (16.1%) | 2.06 |
| Non-family | 1,029 (38.5%) | 1.81 |
| Total Households | 2,671 (100.0%) | 2.31 |
Household Size by Marriage Status in Valley Falls
Out of a total of 2,671 households in Valley Falls, 1,642 (61.5%) are family households, while 1,029 (38.5%) are nonfamily households. The most numerous type of family households are 2-person households, comprising 935, and the most common type of nonfamily households are 1-person households, comprising 679.
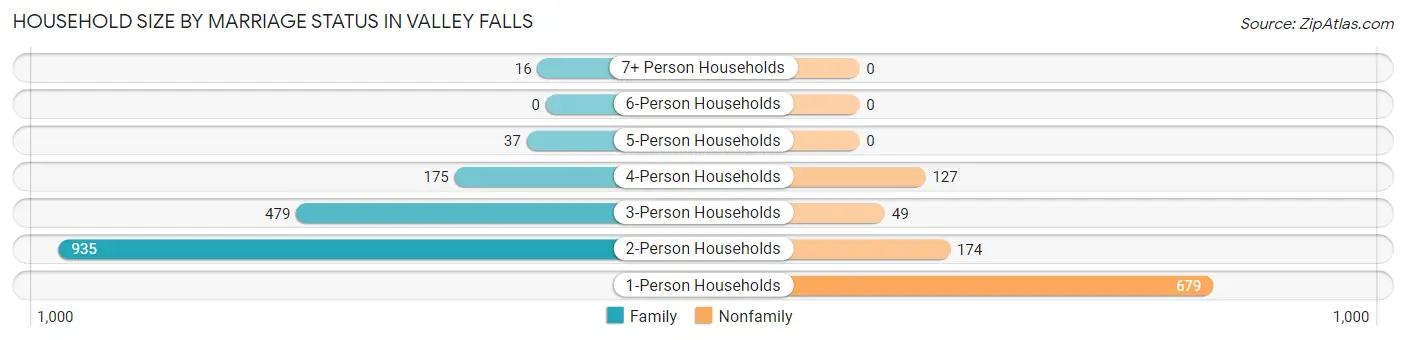
| Household Size | Family Households | Nonfamily Households |
| 1-Person Households | - | 679 (25.4%) |
| 2-Person Households | 935 (35.0%) | 174 (6.5%) |
| 3-Person Households | 479 (17.9%) | 49 (1.8%) |
| 4-Person Households | 175 (6.6%) | 127 (4.8%) |
| 5-Person Households | 37 (1.4%) | 0 (0.0%) |
| 6-Person Households | 0 (0.0%) | 0 (0.0%) |
| 7+ Person Households | 16 (0.6%) | 0 (0.0%) |
| Total | 1,642 (61.5%) | 1,029 (38.5%) |
Female Fertility in Valley Falls
Fertility by Age in Valley Falls
Average fertility rate in Valley Falls is 87.0 births per 1,000 women. Women in the age bracket of 20 to 34 years have the highest fertility rate with 125.0 births per 1,000 women. Women in the age bracket of 20 to 34 years acount for 97.0% of all women with births.
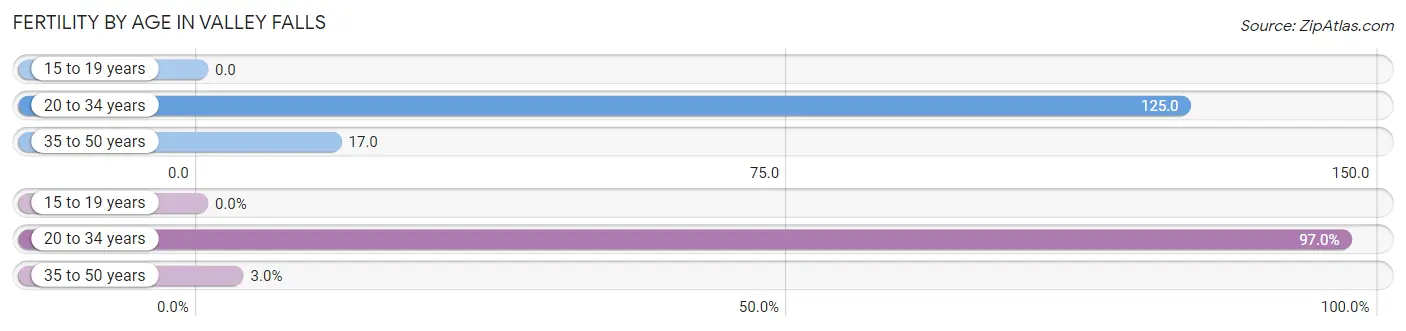
| Age Bracket | Women with Births | Births / 1,000 Women |
| 15 to 19 years | 0 (0.0%) | 0.0 |
| 20 to 34 years | 257 (97.0%) | 125.0 |
| 35 to 50 years | 8 (3.0%) | 17.0 |
| Total | 265 (100.0%) | 87.0 |
Fertility by Age by Marriage Status in Valley Falls
53.2% of women with births (265) in Valley Falls are married. The highest percentage of unmarried women with births falls into 20 to 34 years age bracket with 48.2% of them unmarried at the time of birth, while the lowest percentage of unmarried women with births belong to 35 to 50 years age bracket with 0.0% of them unmarried.
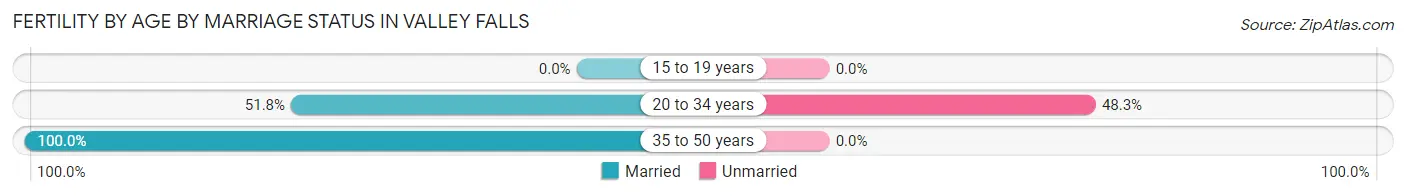
| Age Bracket | Married | Unmarried |
| 15 to 19 years | 0 (0.0%) | 0 (0.0%) |
| 20 to 34 years | 133 (51.7%) | 124 (48.2%) |
| 35 to 50 years | 8 (100.0%) | 0 (0.0%) |
| Total | 141 (53.2%) | 124 (46.8%) |
Fertility by Education in Valley Falls
Average fertility rate in Valley Falls is 87.0 births per 1,000 women. Women with the education attainment of graduate degree have the highest fertility rate of 413.0 births per 1,000 women, while women with the education attainment of bachelor's degree have the lowest fertility at 37.0 births per 1,000 women. Women with the education attainment of college or associate's degree represent 43.8% of all women with births.
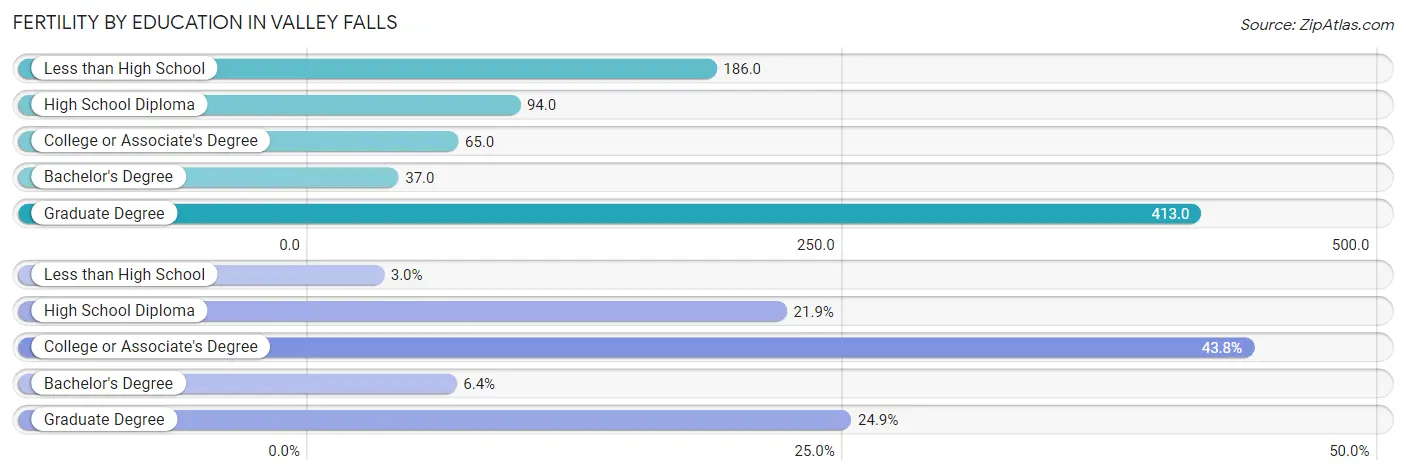
| Educational Attainment | Women with Births | Births / 1,000 Women |
| Less than High School | 8 (3.0%) | 186.0 |
| High School Diploma | 58 (21.9%) | 94.0 |
| College or Associate's Degree | 116 (43.8%) | 65.0 |
| Bachelor's Degree | 17 (6.4%) | 37.0 |
| Graduate Degree | 66 (24.9%) | 413.0 |
| Total | 265 (100.0%) | 87.0 |
Fertility by Education by Marriage Status in Valley Falls
46.8% of women with births in Valley Falls are unmarried. Women with the educational attainment of less than high school are most likely to be married with 100.0% of them married at childbirth, while women with the educational attainment of high school diploma are least likely to be married with 100.0% of them unmarried at childbirth.
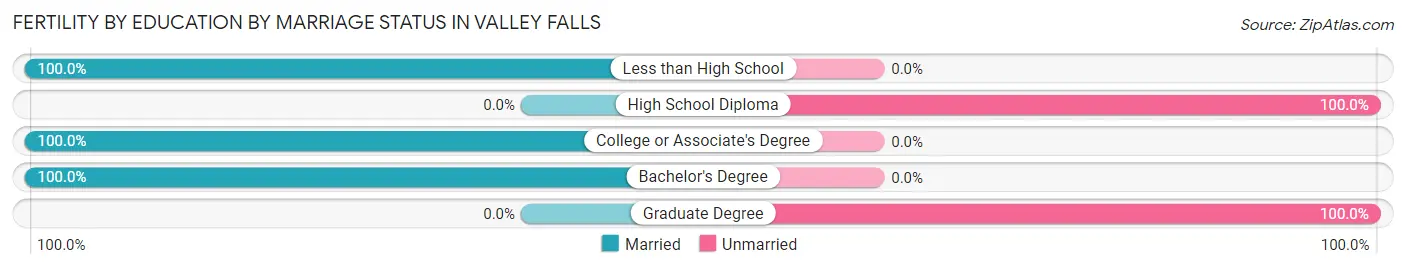
| Educational Attainment | Married | Unmarried |
| Less than High School | 8 (100.0%) | 0 (0.0%) |
| High School Diploma | 0 (0.0%) | 58 (100.0%) |
| College or Associate's Degree | 116 (100.0%) | 0 (0.0%) |
| Bachelor's Degree | 17 (100.0%) | 0 (0.0%) |
| Graduate Degree | 0 (0.0%) | 66 (100.0%) |
| Total | 141 (53.2%) | 124 (46.8%) |
Employment Characteristics in Valley Falls
Employment by Class of Employer in Valley Falls
Among the 3,917 employed individuals in Valley Falls, private company employees (3,024 | 77.2%), not-for-profit organizations (267 | 6.8%), and state government employees (200 | 5.1%) make up the most common classes of employment.
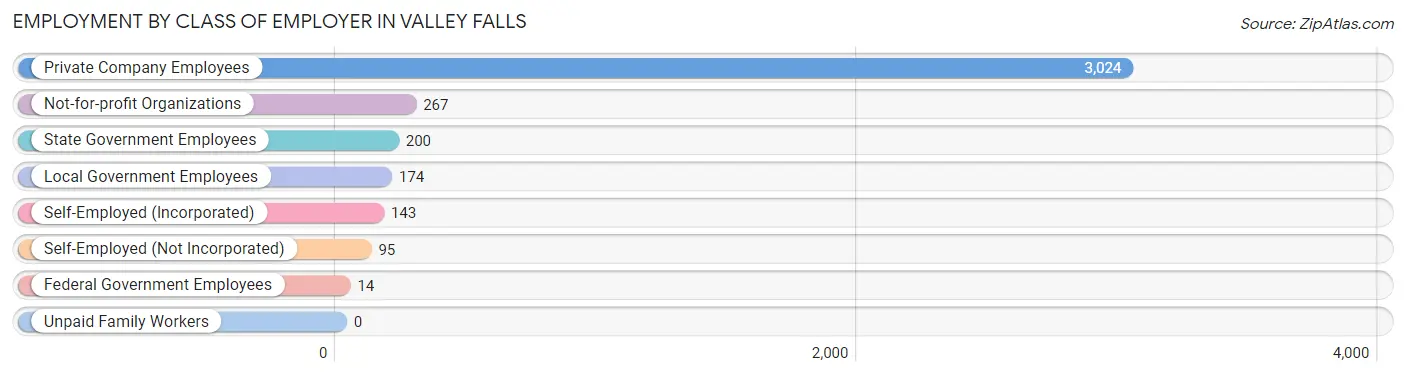
| Employer Class | # Employees | % Employees |
| Private Company Employees | 3,024 | 77.2% |
| Self-Employed (Incorporated) | 143 | 3.6% |
| Self-Employed (Not Incorporated) | 95 | 2.4% |
| Not-for-profit Organizations | 267 | 6.8% |
| Local Government Employees | 174 | 4.4% |
| State Government Employees | 200 | 5.1% |
| Federal Government Employees | 14 | 0.4% |
| Unpaid Family Workers | 0 | 0.0% |
| Total | 3,917 | 100.0% |
Employment Status by Age in Valley Falls
According to the labor force statistics for Valley Falls, out of the total population over 16 years of age (6,408), 68.5% or 4,389 individuals are in the labor force, with 4.5% or 198 of them unemployed. The age group with the highest labor force participation rate is 35 to 44 years, with 100.0% or 409 individuals in the labor force. Within the labor force, the 65 to 74 years age range has the highest percentage of unemployed individuals, with 25.3% or 24 of them being unemployed.
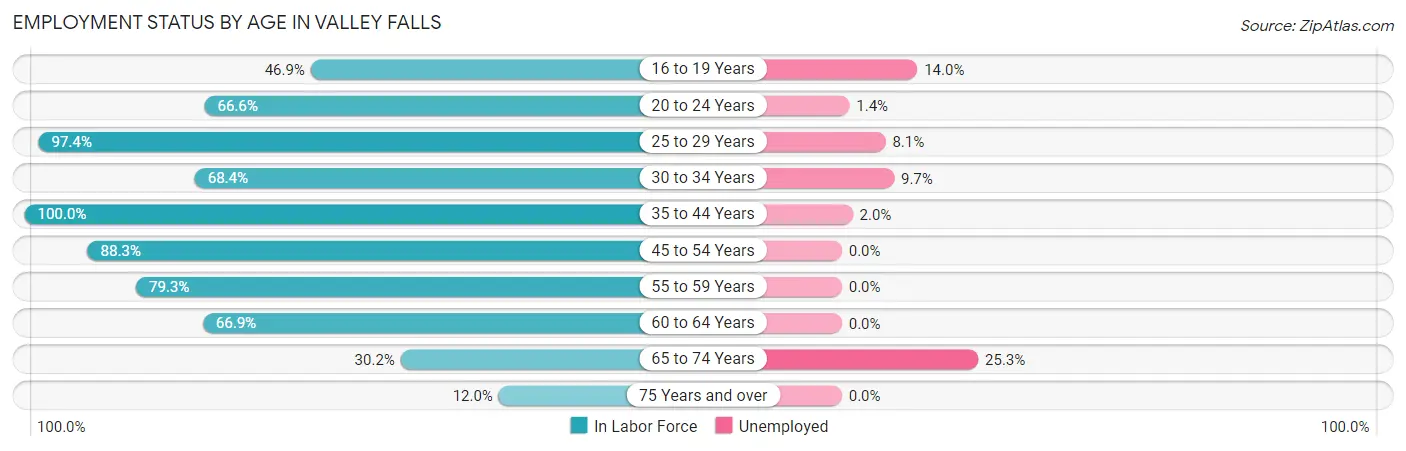
| Age Bracket | In Labor Force | Unemployed |
| 16 to 19 Years | 387 (46.9%) | 54 (14.0%) |
| 20 to 24 Years | 1,258 (66.6%) | 18 (1.4%) |
| 25 to 29 Years | 862 (97.4%) | 70 (8.1%) |
| 30 to 34 Years | 236 (68.4%) | 23 (9.7%) |
| 35 to 44 Years | 409 (100.0%) | 8 (2.0%) |
| 45 to 54 Years | 519 (88.3%) | 0 (0.0%) |
| 55 to 59 Years | 334 (79.3%) | 0 (0.0%) |
| 60 to 64 Years | 243 (66.9%) | 0 (0.0%) |
| 65 to 74 Years | 95 (30.2%) | 24 (25.3%) |
| 75 Years and over | 44 (12.0%) | 0 (0.0%) |
| Total | 4,389 (68.5%) | 198 (4.5%) |
Employment Status by Educational Attainment in Valley Falls
According to labor force statistics for Valley Falls, 86.4% of individuals (2,602) out of the total population between 25 and 64 years of age (3,011) are in the labor force, with 3.9% or 101 of them being unemployed. The group with the highest labor force participation rate are those with the educational attainment of bachelor's degree or higher, with 90.3% or 742 individuals in the labor force. Within the labor force, individuals with bachelor's degree or higher education have the highest percentage of unemployment, with 11.9% or 88 of them being unemployed.
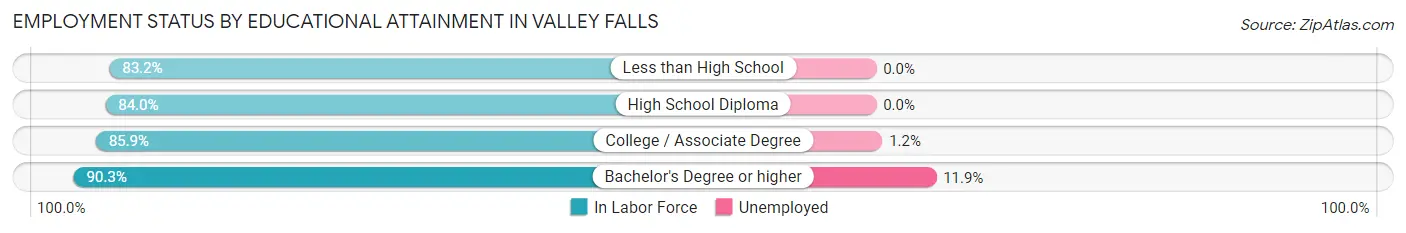
| Educational Attainment | In Labor Force | Unemployed |
| Less than High School | 153 (83.2%) | 0 (0.0%) |
| High School Diploma | 645 (84.0%) | 0 (0.0%) |
| College / Associate Degree | 1,063 (85.9%) | 15 (1.2%) |
| Bachelor's Degree or higher | 742 (90.3%) | 98 (11.9%) |
| Total | 2,602 (86.4%) | 117 (3.9%) |
Employment Occupations by Sex in Valley Falls
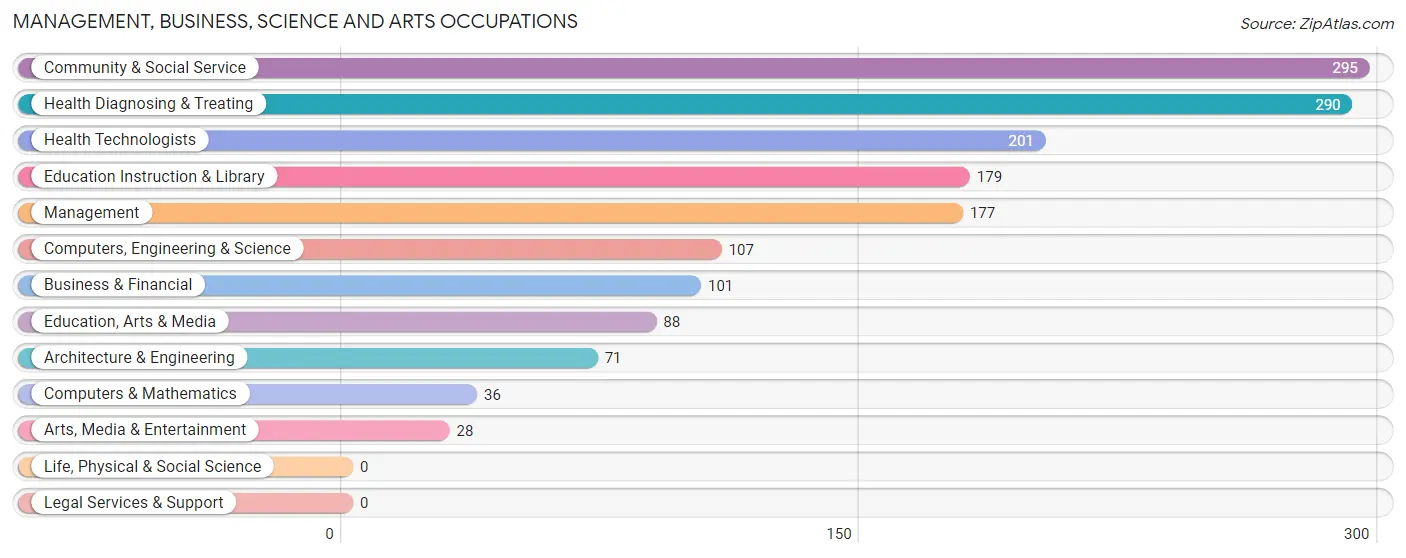
Management, Business, Science and Arts Occupations
The most common Management, Business, Science and Arts occupations in Valley Falls are Community & Social Service (295 | 7.0%), Health Diagnosing & Treating (290 | 6.9%), Health Technologists (201 | 4.8%), Education Instruction & Library (179 | 4.3%), and Management (177 | 4.2%).
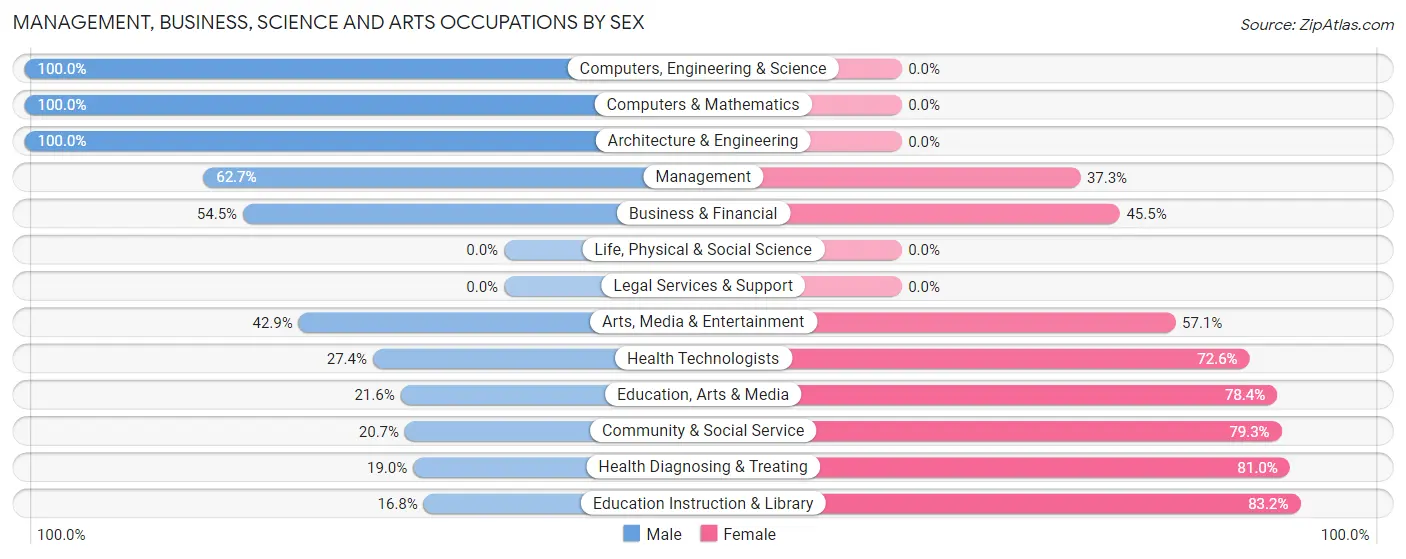
Management, Business, Science and Arts Occupations by Sex
Within the Management, Business, Science and Arts occupations in Valley Falls, the most male-oriented occupations are Computers, Engineering & Science (100.0%), Computers & Mathematics (100.0%), and Architecture & Engineering (100.0%), while the most female-oriented occupations are Education Instruction & Library (83.2%), Health Diagnosing & Treating (81.0%), and Community & Social Service (79.3%).
| Occupation | Male | Female |
| Management | 111 (62.7%) | 66 (37.3%) |
| Business & Financial | 55 (54.5%) | 46 (45.5%) |
| Computers, Engineering & Science | 107 (100.0%) | 0 (0.0%) |
| Computers & Mathematics | 36 (100.0%) | 0 (0.0%) |
| Architecture & Engineering | 71 (100.0%) | 0 (0.0%) |
| Life, Physical & Social Science | 0 (0.0%) | 0 (0.0%) |
| Community & Social Service | 61 (20.7%) | 234 (79.3%) |
| Education, Arts & Media | 19 (21.6%) | 69 (78.4%) |
| Legal Services & Support | 0 (0.0%) | 0 (0.0%) |
| Education Instruction & Library | 30 (16.8%) | 149 (83.2%) |
| Arts, Media & Entertainment | 12 (42.9%) | 16 (57.1%) |
| Health Diagnosing & Treating | 55 (19.0%) | 235 (81.0%) |
| Health Technologists | 55 (27.4%) | 146 (72.6%) |
| Total (Category) | 389 (40.1%) | 581 (59.9%) |
| Total (Overall) | 1,877 (44.8%) | 2,313 (55.2%) |
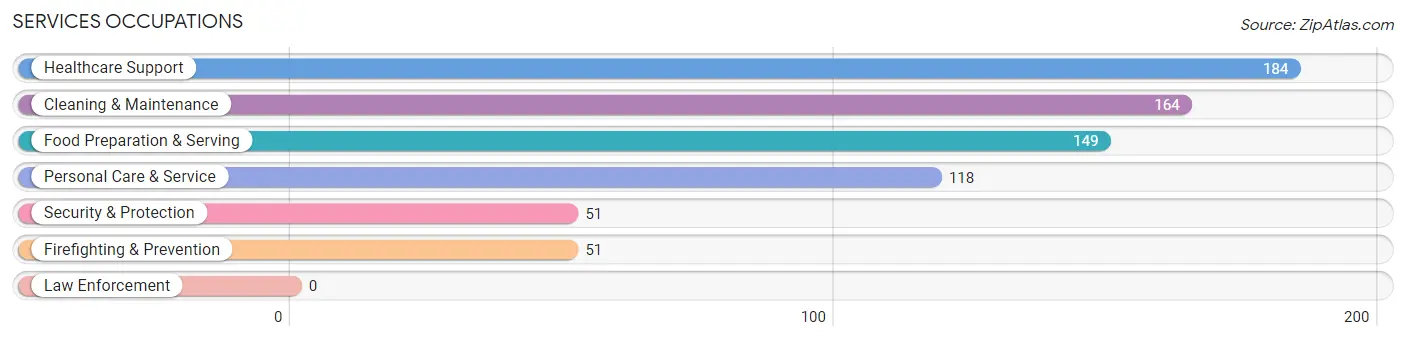
Services Occupations
The most common Services occupations in Valley Falls are Healthcare Support (184 | 4.4%), Cleaning & Maintenance (164 | 3.9%), Food Preparation & Serving (149 | 3.6%), Personal Care & Service (118 | 2.8%), and Security & Protection (51 | 1.2%).
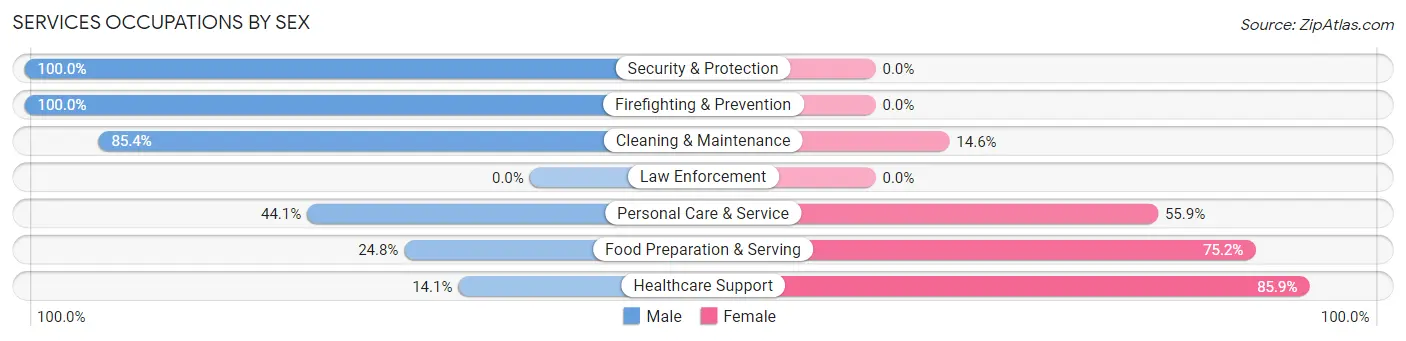
Services Occupations by Sex
Within the Services occupations in Valley Falls, the most male-oriented occupations are Security & Protection (100.0%), Firefighting & Prevention (100.0%), and Cleaning & Maintenance (85.4%), while the most female-oriented occupations are Healthcare Support (85.9%), Food Preparation & Serving (75.2%), and Personal Care & Service (55.9%).
| Occupation | Male | Female |
| Healthcare Support | 26 (14.1%) | 158 (85.9%) |
| Security & Protection | 51 (100.0%) | 0 (0.0%) |
| Firefighting & Prevention | 51 (100.0%) | 0 (0.0%) |
| Law Enforcement | 0 (0.0%) | 0 (0.0%) |
| Food Preparation & Serving | 37 (24.8%) | 112 (75.2%) |
| Cleaning & Maintenance | 140 (85.4%) | 24 (14.6%) |
| Personal Care & Service | 52 (44.1%) | 66 (55.9%) |
| Total (Category) | 306 (46.0%) | 360 (54.0%) |
| Total (Overall) | 1,877 (44.8%) | 2,313 (55.2%) |
Sales and Office Occupations
The most common Sales and Office occupations in Valley Falls are Office & Administration (919 | 21.9%), and Sales & Related (539 | 12.9%).
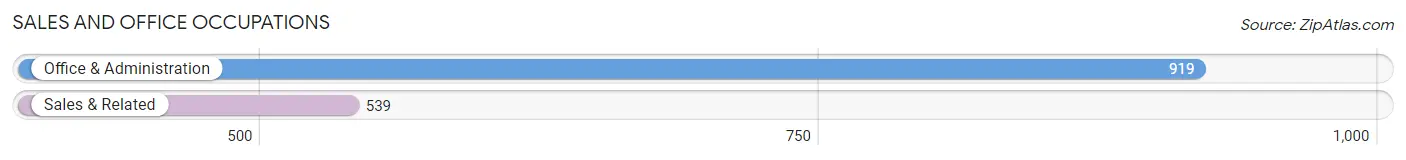
Sales and Office Occupations by Sex
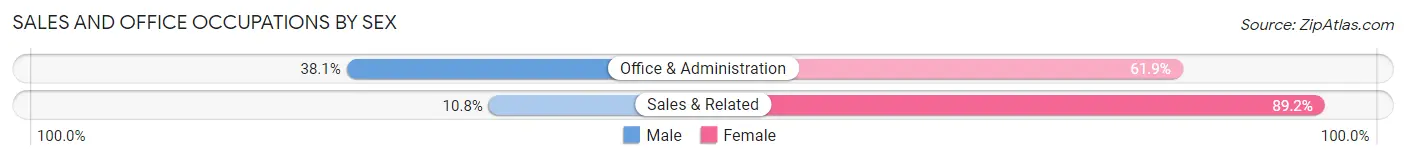
| Occupation | Male | Female |
| Sales & Related | 58 (10.8%) | 481 (89.2%) |
| Office & Administration | 350 (38.1%) | 569 (61.9%) |
| Total (Category) | 408 (28.0%) | 1,050 (72.0%) |
| Total (Overall) | 1,877 (44.8%) | 2,313 (55.2%) |
Natural Resources, Construction and Maintenance Occupations
The most common Natural Resources, Construction and Maintenance occupations in Valley Falls are Construction & Extraction (157 | 3.7%), and Installation, Maintenance & Repair (37 | 0.9%).
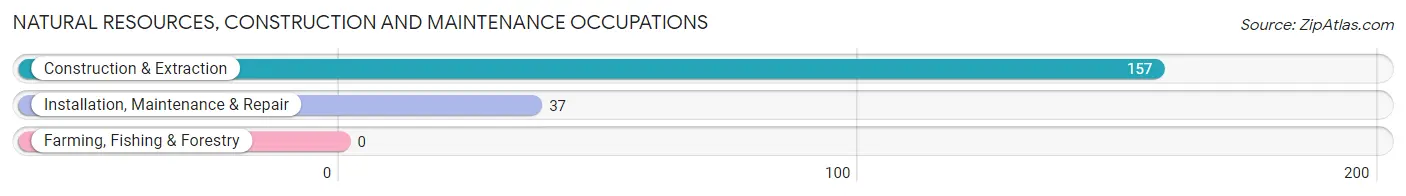
Natural Resources, Construction and Maintenance Occupations by Sex
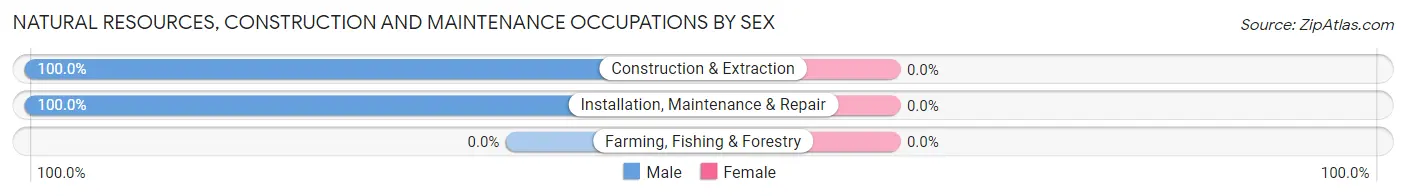
| Occupation | Male | Female |
| Farming, Fishing & Forestry | 0 (0.0%) | 0 (0.0%) |
| Construction & Extraction | 157 (100.0%) | 0 (0.0%) |
| Installation, Maintenance & Repair | 37 (100.0%) | 0 (0.0%) |
| Total (Category) | 194 (100.0%) | 0 (0.0%) |
| Total (Overall) | 1,877 (44.8%) | 2,313 (55.2%) |
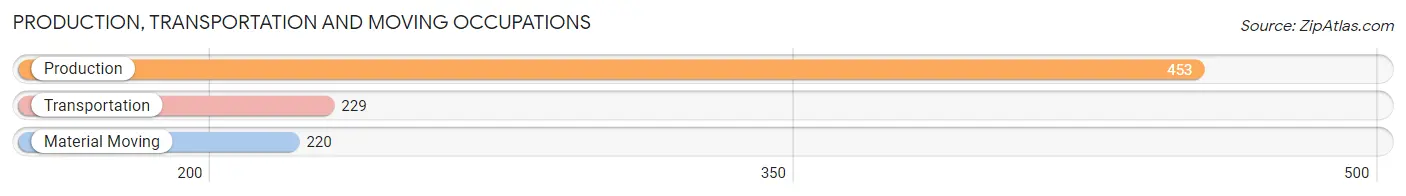
Production, Transportation and Moving Occupations
The most common Production, Transportation and Moving occupations in Valley Falls are Production (453 | 10.8%), Transportation (229 | 5.5%), and Material Moving (220 | 5.2%).
Production, Transportation and Moving Occupations by Sex
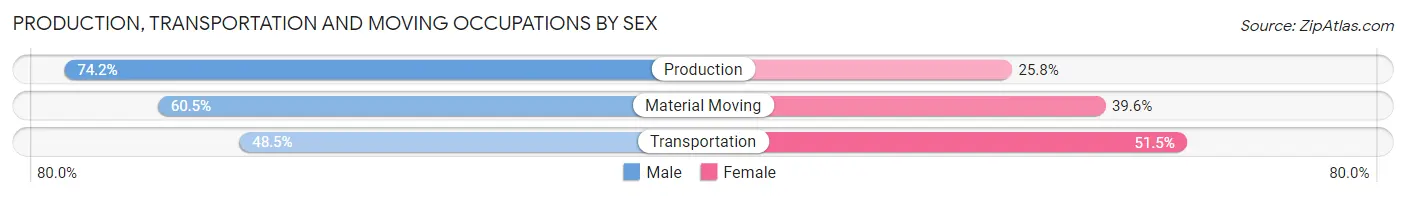
| Occupation | Male | Female |
| Production | 336 (74.2%) | 117 (25.8%) |
| Transportation | 111 (48.5%) | 118 (51.5%) |
| Material Moving | 133 (60.5%) | 87 (39.6%) |
| Total (Category) | 580 (64.3%) | 322 (35.7%) |
| Total (Overall) | 1,877 (44.8%) | 2,313 (55.2%) |
Employment Industries by Sex in Valley Falls
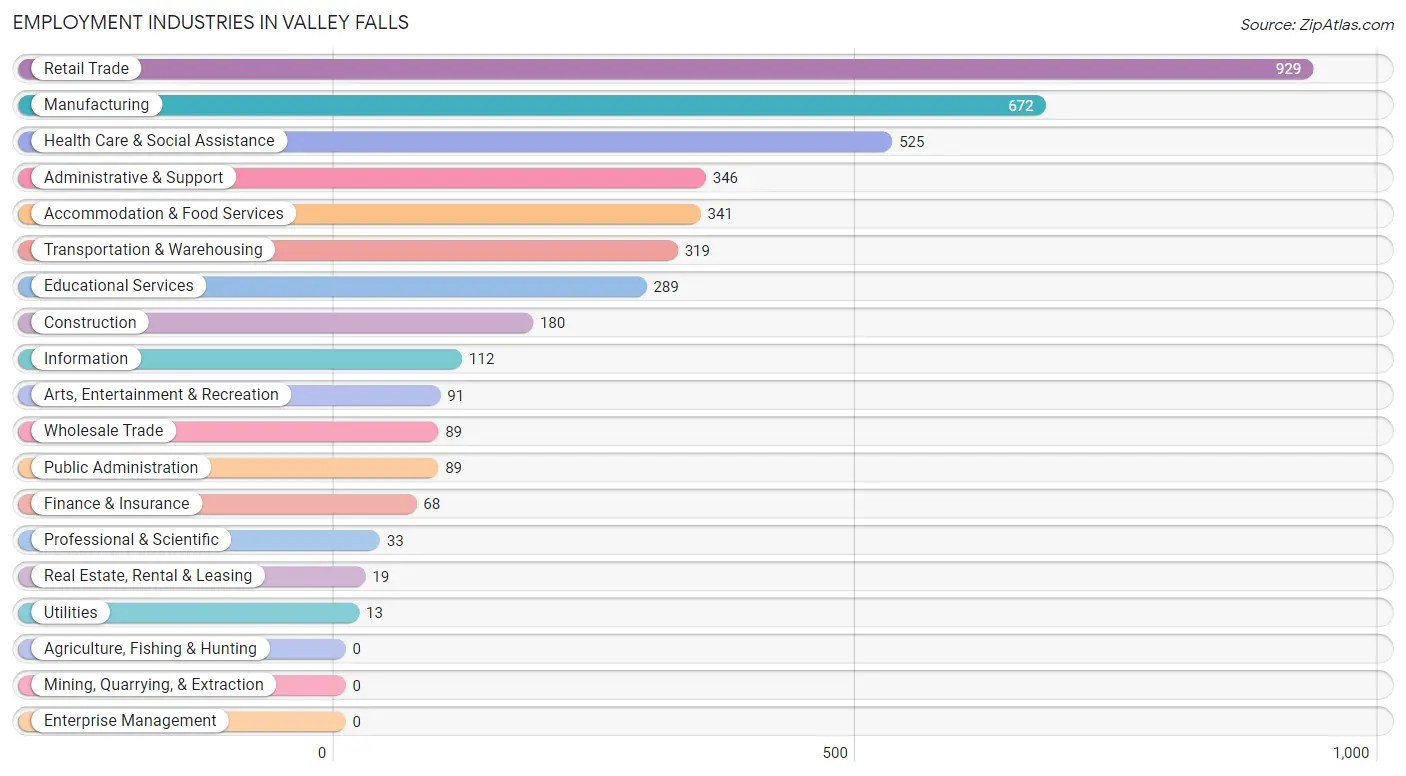
Employment Industries in Valley Falls
The major employment industries in Valley Falls include Retail Trade (929 | 22.2%), Manufacturing (672 | 16.0%), Health Care & Social Assistance (525 | 12.5%), Administrative & Support (346 | 8.3%), and Accommodation & Food Services (341 | 8.1%).
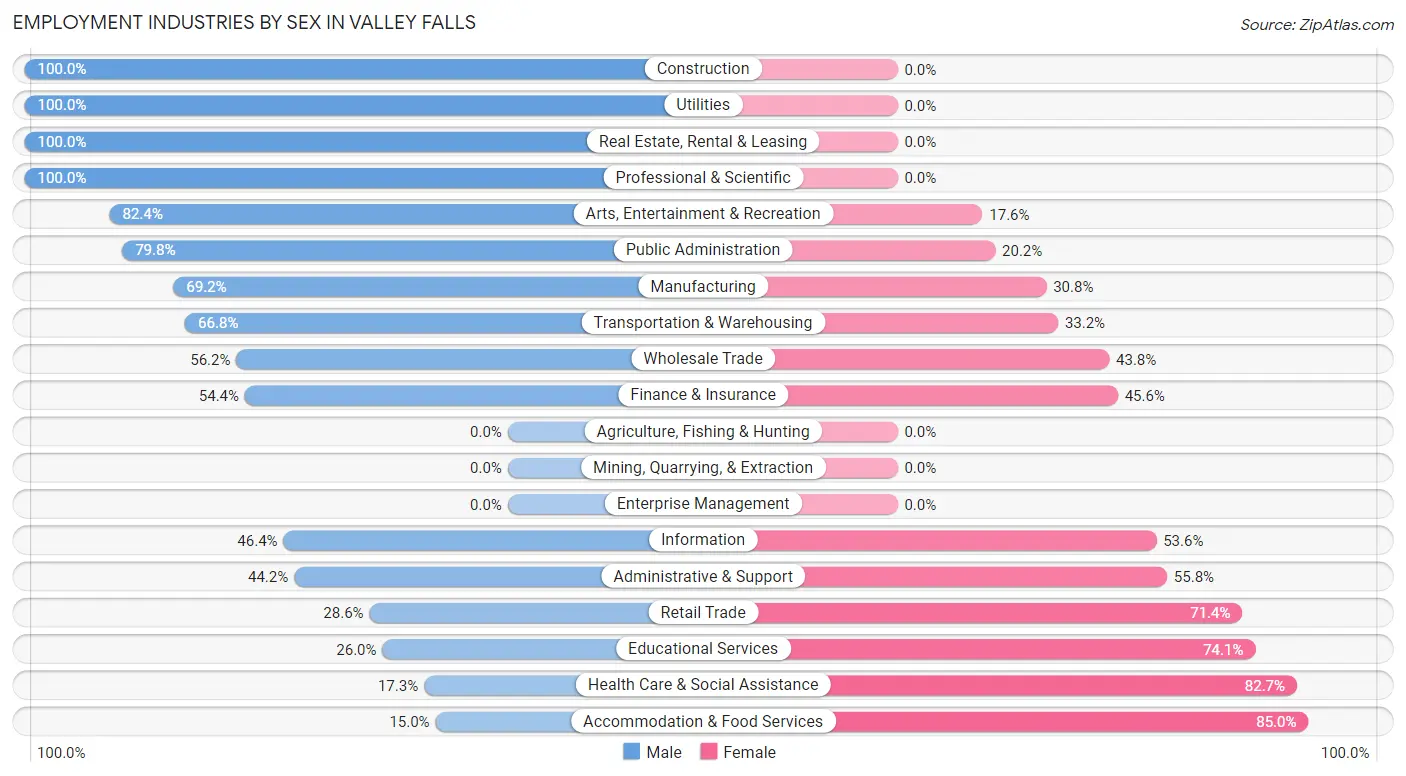
Employment Industries by Sex in Valley Falls
The Valley Falls industries that see more men than women are Construction (100.0%), Utilities (100.0%), and Real Estate, Rental & Leasing (100.0%), whereas the industries that tend to have a higher number of women are Accommodation & Food Services (85.0%), Health Care & Social Assistance (82.7%), and Educational Services (74.1%).
| Industry | Male | Female |
| Agriculture, Fishing & Hunting | 0 (0.0%) | 0 (0.0%) |
| Mining, Quarrying, & Extraction | 0 (0.0%) | 0 (0.0%) |
| Construction | 180 (100.0%) | 0 (0.0%) |
| Manufacturing | 465 (69.2%) | 207 (30.8%) |
| Wholesale Trade | 50 (56.2%) | 39 (43.8%) |
| Retail Trade | 266 (28.6%) | 663 (71.4%) |
| Transportation & Warehousing | 213 (66.8%) | 106 (33.2%) |
| Utilities | 13 (100.0%) | 0 (0.0%) |
| Information | 52 (46.4%) | 60 (53.6%) |
| Finance & Insurance | 37 (54.4%) | 31 (45.6%) |
| Real Estate, Rental & Leasing | 19 (100.0%) | 0 (0.0%) |
| Professional & Scientific | 33 (100.0%) | 0 (0.0%) |
| Enterprise Management | 0 (0.0%) | 0 (0.0%) |
| Administrative & Support | 153 (44.2%) | 193 (55.8%) |
| Educational Services | 75 (26.0%) | 214 (74.1%) |
| Health Care & Social Assistance | 91 (17.3%) | 434 (82.7%) |
| Arts, Entertainment & Recreation | 75 (82.4%) | 16 (17.6%) |
| Accommodation & Food Services | 51 (15.0%) | 290 (85.0%) |
| Public Administration | 71 (79.8%) | 18 (20.2%) |
| Total | 1,877 (44.8%) | 2,313 (55.2%) |
Education in Valley Falls
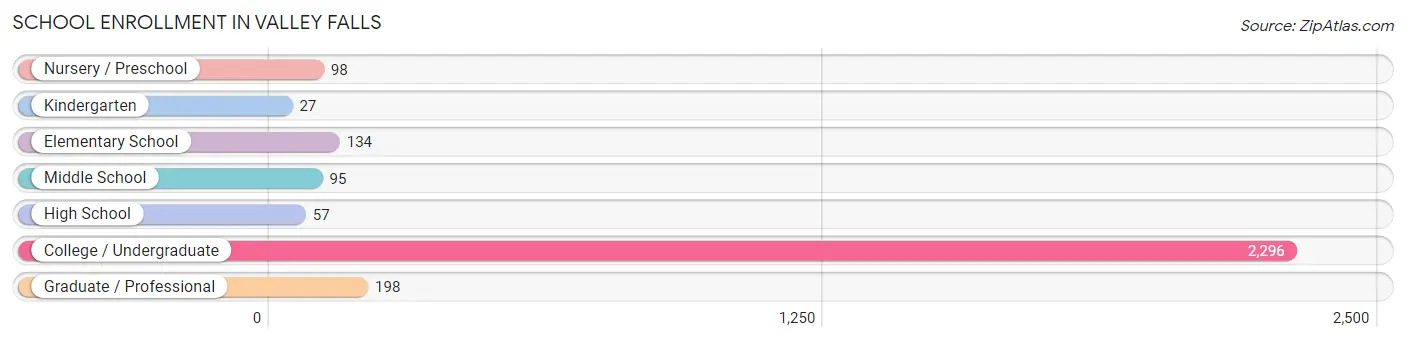
School Enrollment in Valley Falls
The most common levels of schooling among the 2,905 students in Valley Falls are college / undergraduate (2,296 | 79.0%), graduate / professional (198 | 6.8%), and elementary school (134 | 4.6%).
| School Level | # Students | % Students |
| Nursery / Preschool | 98 | 3.4% |
| Kindergarten | 27 | 0.9% |
| Elementary School | 134 | 4.6% |
| Middle School | 95 | 3.3% |
| High School | 57 | 2.0% |
| College / Undergraduate | 2,296 | 79.0% |
| Graduate / Professional | 198 | 6.8% |
| Total | 2,905 | 100.0% |
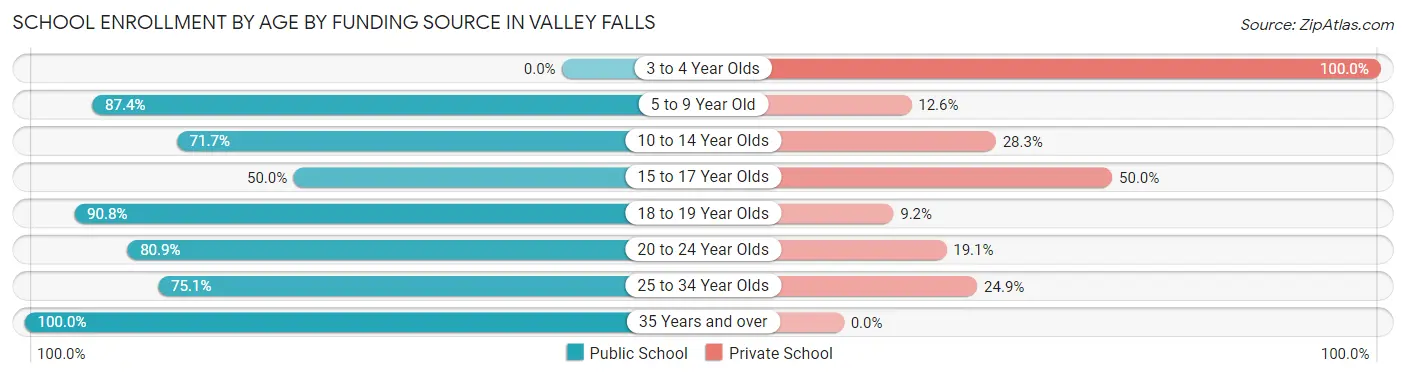
School Enrollment by Age by Funding Source in Valley Falls
Out of a total of 2,905 students who are enrolled in schools in Valley Falls, 590 (20.3%) attend a private institution, while the remaining 2,315 (79.7%) are enrolled in public schools. The age group of 3 to 4 year olds has the highest likelihood of being enrolled in private schools, with 98 (100.0% in the age bracket) enrolled. Conversely, the age group of 35 years and over has the lowest likelihood of being enrolled in a private school, with 85 (100.0% in the age bracket) attending a public institution.
| Age Bracket | Public School | Private School |
| 3 to 4 Year Olds | 0 (0.0%) | 98 (100.0%) |
| 5 to 9 Year Old | 125 (87.4%) | 18 (12.6%) |
| 10 to 14 Year Olds | 81 (71.7%) | 32 (28.3%) |
| 15 to 17 Year Olds | 24 (50.0%) | 24 (50.0%) |
| 18 to 19 Year Olds | 589 (90.8%) | 60 (9.2%) |
| 20 to 24 Year Olds | 1,138 (80.9%) | 269 (19.1%) |
| 25 to 34 Year Olds | 272 (75.1%) | 90 (24.9%) |
| 35 Years and over | 85 (100.0%) | 0 (0.0%) |
| Total | 2,315 (79.7%) | 590 (20.3%) |
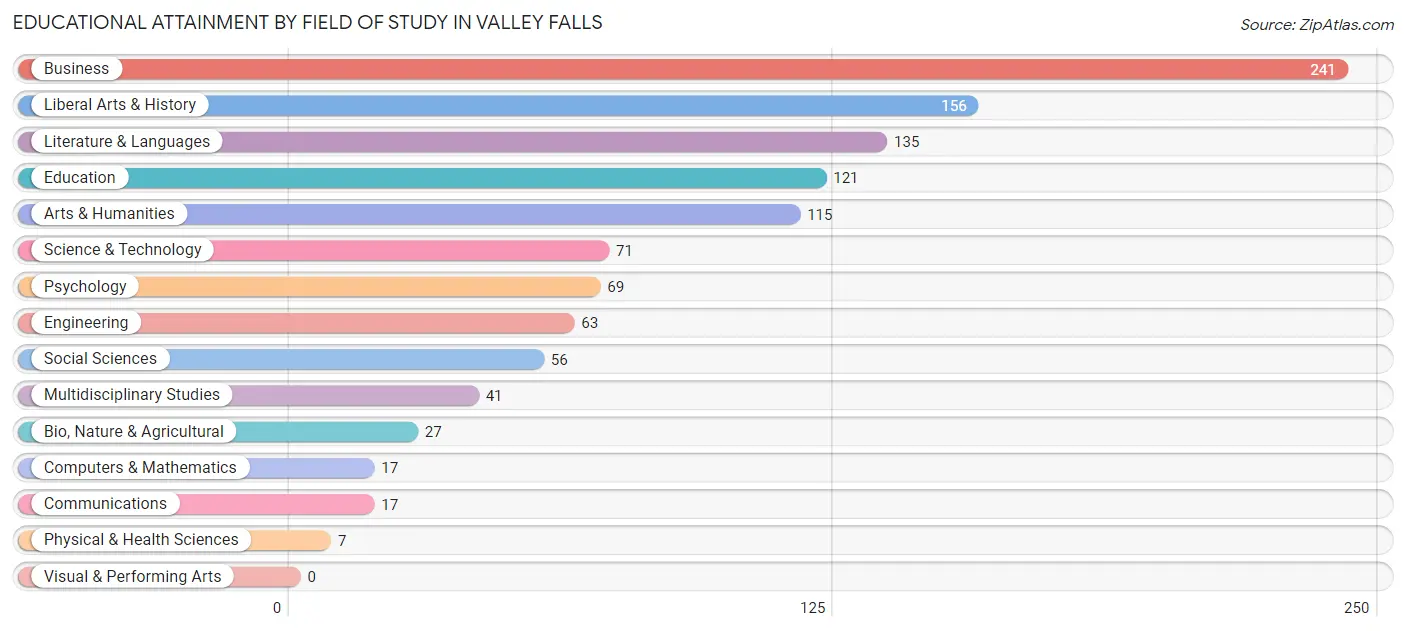
Educational Attainment by Field of Study in Valley Falls
Business (241 | 21.2%), liberal arts & history (156 | 13.7%), literature & languages (135 | 11.9%), education (121 | 10.6%), and arts & humanities (115 | 10.1%) are the most common fields of study among 1,136 individuals in Valley Falls who have obtained a bachelor's degree or higher.
| Field of Study | # Graduates | % Graduates |
| Computers & Mathematics | 17 | 1.5% |
| Bio, Nature & Agricultural | 27 | 2.4% |
| Physical & Health Sciences | 7 | 0.6% |
| Psychology | 69 | 6.1% |
| Social Sciences | 56 | 4.9% |
| Engineering | 63 | 5.6% |
| Multidisciplinary Studies | 41 | 3.6% |
| Science & Technology | 71 | 6.2% |
| Business | 241 | 21.2% |
| Education | 121 | 10.6% |
| Literature & Languages | 135 | 11.9% |
| Liberal Arts & History | 156 | 13.7% |
| Visual & Performing Arts | 0 | 0.0% |
| Communications | 17 | 1.5% |
| Arts & Humanities | 115 | 10.1% |
| Total | 1,136 | 100.0% |
Transportation & Commute in Valley Falls
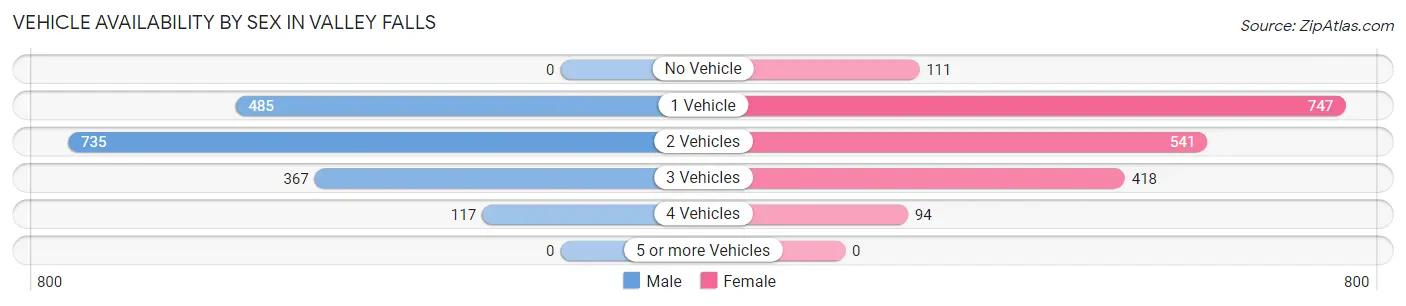
Vehicle Availability by Sex in Valley Falls
The most prevalent vehicle ownership categories in Valley Falls are males with 2 vehicles (735, accounting for 43.1%) and females with 2 vehicles (541, making up 38.5%).
| Vehicles Available | Male | Female |
| No Vehicle | 0 (0.0%) | 111 (5.8%) |
| 1 Vehicle | 485 (28.5%) | 747 (39.1%) |
| 2 Vehicles | 735 (43.1%) | 541 (28.3%) |
| 3 Vehicles | 367 (21.5%) | 418 (21.9%) |
| 4 Vehicles | 117 (6.9%) | 94 (4.9%) |
| 5 or more Vehicles | 0 (0.0%) | 0 (0.0%) |
| Total | 1,704 (100.0%) | 1,911 (100.0%) |
Commute Time in Valley Falls
The most frequently occuring commute durations in Valley Falls are 10 to 14 minutes (725 commuters, 19.3%), 15 to 19 minutes (710 commuters, 18.9%), and 5 to 9 minutes (483 commuters, 12.9%).
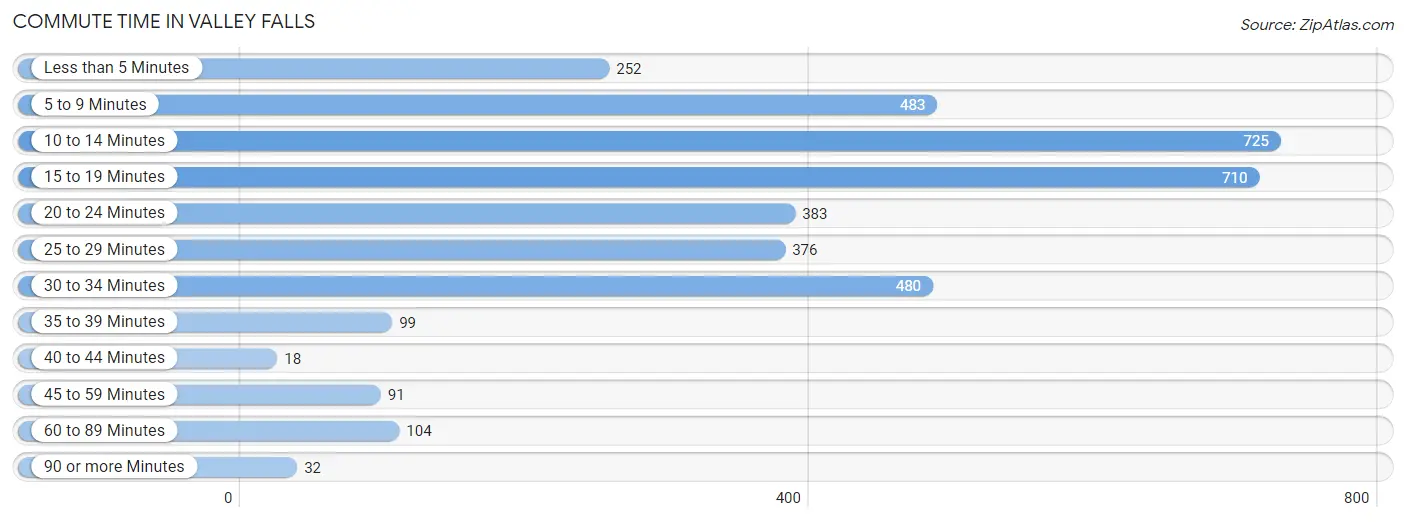
| Commute Time | # Commuters | % Commuters |
| Less than 5 Minutes | 252 | 6.7% |
| 5 to 9 Minutes | 483 | 12.9% |
| 10 to 14 Minutes | 725 | 19.3% |
| 15 to 19 Minutes | 710 | 18.9% |
| 20 to 24 Minutes | 383 | 10.2% |
| 25 to 29 Minutes | 376 | 10.0% |
| 30 to 34 Minutes | 480 | 12.8% |
| 35 to 39 Minutes | 99 | 2.6% |
| 40 to 44 Minutes | 18 | 0.5% |
| 45 to 59 Minutes | 91 | 2.4% |
| 60 to 89 Minutes | 104 | 2.8% |
| 90 or more Minutes | 32 | 0.9% |
Commute Time by Sex in Valley Falls
The most common commute times in Valley Falls are 25 to 29 minutes (310 commuters, 18.2%) for males and 15 to 19 minutes (501 commuters, 24.4%) for females.
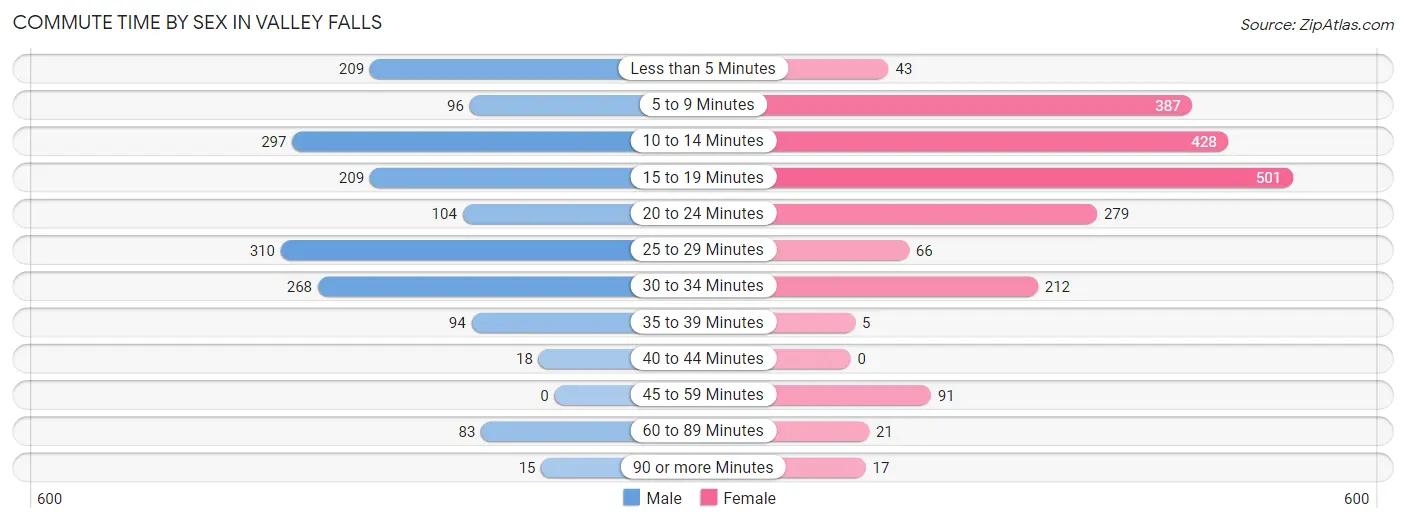
| Commute Time | Male | Female |
| Less than 5 Minutes | 209 (12.3%) | 43 (2.1%) |
| 5 to 9 Minutes | 96 (5.6%) | 387 (18.9%) |
| 10 to 14 Minutes | 297 (17.4%) | 428 (20.9%) |
| 15 to 19 Minutes | 209 (12.3%) | 501 (24.4%) |
| 20 to 24 Minutes | 104 (6.1%) | 279 (13.6%) |
| 25 to 29 Minutes | 310 (18.2%) | 66 (3.2%) |
| 30 to 34 Minutes | 268 (15.7%) | 212 (10.3%) |
| 35 to 39 Minutes | 94 (5.5%) | 5 (0.2%) |
| 40 to 44 Minutes | 18 (1.1%) | 0 (0.0%) |
| 45 to 59 Minutes | 0 (0.0%) | 91 (4.4%) |
| 60 to 89 Minutes | 83 (4.9%) | 21 (1.0%) |
| 90 or more Minutes | 15 (0.9%) | 17 (0.8%) |
Time of Departure to Work by Sex in Valley Falls
The most frequent times of departure to work in Valley Falls are 4:00 PM to 11:59 PM (292, 17.2%) for males and 12:00 PM to 3:59 PM (510, 24.9%) for females.
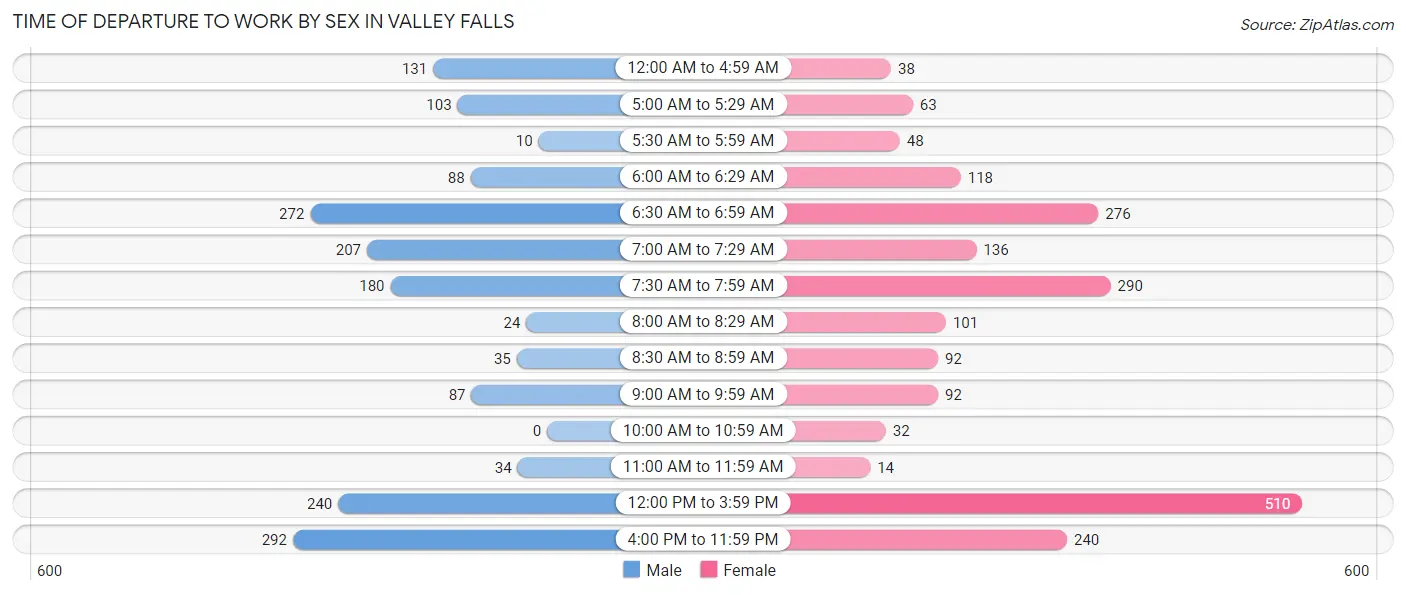
| Time of Departure | Male | Female |
| 12:00 AM to 4:59 AM | 131 (7.7%) | 38 (1.8%) |
| 5:00 AM to 5:29 AM | 103 (6.0%) | 63 (3.1%) |
| 5:30 AM to 5:59 AM | 10 (0.6%) | 48 (2.3%) |
| 6:00 AM to 6:29 AM | 88 (5.2%) | 118 (5.8%) |
| 6:30 AM to 6:59 AM | 272 (16.0%) | 276 (13.5%) |
| 7:00 AM to 7:29 AM | 207 (12.2%) | 136 (6.6%) |
| 7:30 AM to 7:59 AM | 180 (10.6%) | 290 (14.1%) |
| 8:00 AM to 8:29 AM | 24 (1.4%) | 101 (4.9%) |
| 8:30 AM to 8:59 AM | 35 (2.1%) | 92 (4.5%) |
| 9:00 AM to 9:59 AM | 87 (5.1%) | 92 (4.5%) |
| 10:00 AM to 10:59 AM | 0 (0.0%) | 32 (1.6%) |
| 11:00 AM to 11:59 AM | 34 (2.0%) | 14 (0.7%) |
| 12:00 PM to 3:59 PM | 240 (14.1%) | 510 (24.9%) |
| 4:00 PM to 11:59 PM | 292 (17.2%) | 240 (11.7%) |
| Total | 1,703 (100.0%) | 2,050 (100.0%) |
Housing Occupancy in Valley Falls
Occupancy by Ownership in Valley Falls
Of the total 2,671 dwellings in Valley Falls, owner-occupied units account for 1,283 (48.0%), while renter-occupied units make up 1,388 (52.0%).
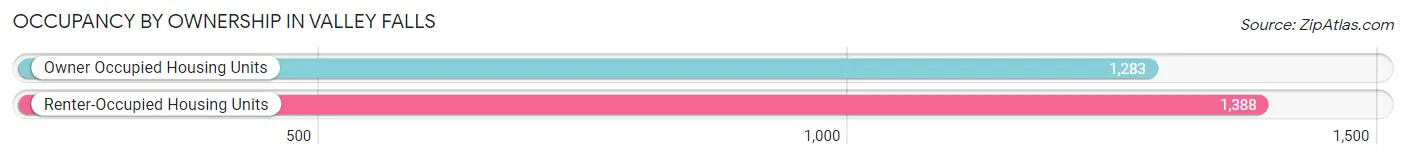
| Occupancy | # Housing Units | % Housing Units |
| Owner Occupied Housing Units | 1,283 | 48.0% |
| Renter-Occupied Housing Units | 1,388 | 52.0% |
| Total Occupied Housing Units | 2,671 | 100.0% |
Occupancy by Household Size in Valley Falls
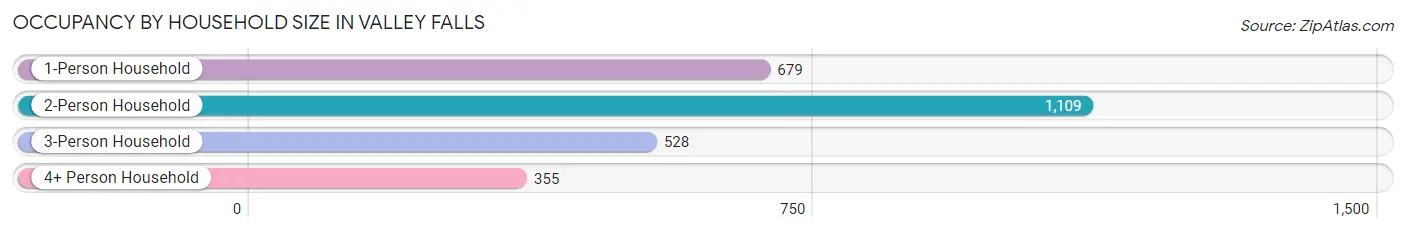
| Household Size | # Housing Units | % Housing Units |
| 1-Person Household | 679 | 25.4% |
| 2-Person Household | 1,109 | 41.5% |
| 3-Person Household | 528 | 19.8% |
| 4+ Person Household | 355 | 13.3% |
| Total Housing Units | 2,671 | 100.0% |
Occupancy by Ownership by Household Size in Valley Falls
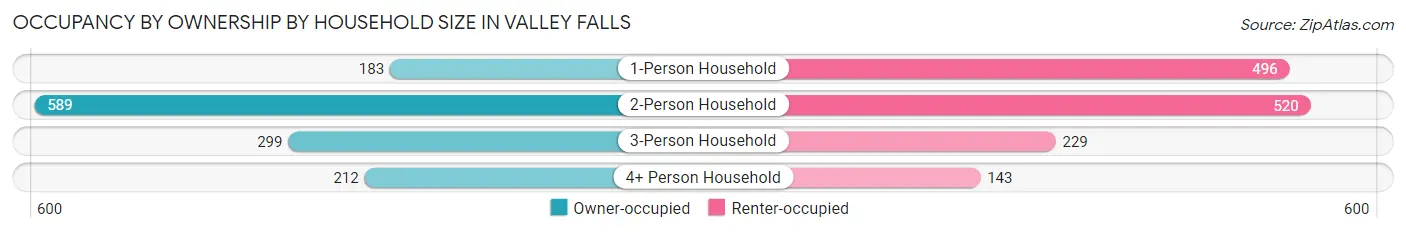
| Household Size | Owner-occupied | Renter-occupied |
| 1-Person Household | 183 (27.0%) | 496 (73.1%) |
| 2-Person Household | 589 (53.1%) | 520 (46.9%) |
| 3-Person Household | 299 (56.6%) | 229 (43.4%) |
| 4+ Person Household | 212 (59.7%) | 143 (40.3%) |
| Total Housing Units | 1,283 (48.0%) | 1,388 (52.0%) |
Occupancy by Educational Attainment in Valley Falls
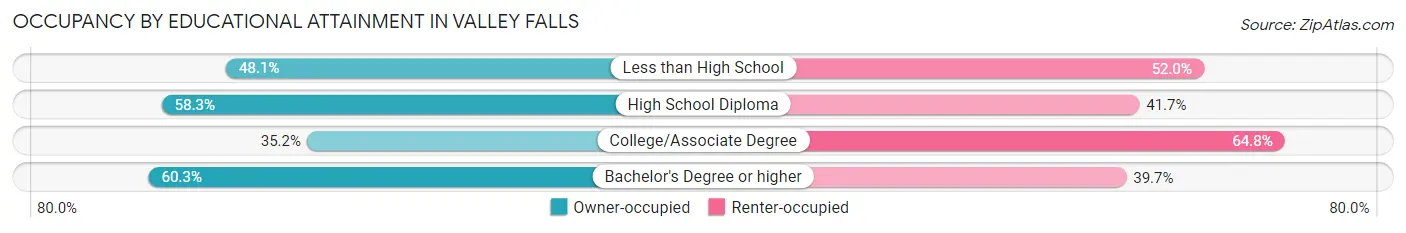
| Household Size | Owner-occupied | Renter-occupied |
| Less than High School | 37 (48.0%) | 40 (51.9%) |
| High School Diploma | 342 (58.3%) | 245 (41.7%) |
| College/Associate Degree | 431 (35.2%) | 792 (64.8%) |
| Bachelor's Degree or higher | 473 (60.3%) | 311 (39.7%) |
Occupancy by Age of Householder in Valley Falls
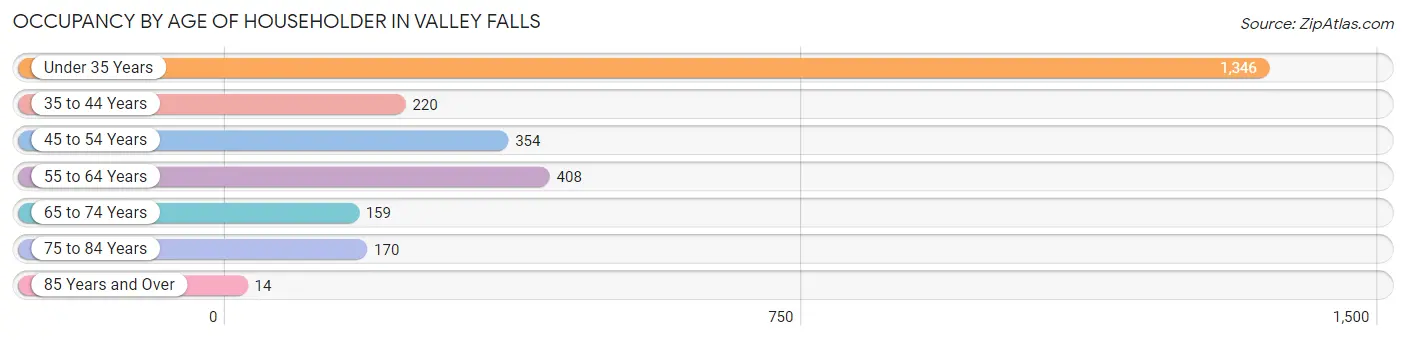
| Age Bracket | # Households | % Households |
| Under 35 Years | 1,346 | 50.4% |
| 35 to 44 Years | 220 | 8.2% |
| 45 to 54 Years | 354 | 13.3% |
| 55 to 64 Years | 408 | 15.3% |
| 65 to 74 Years | 159 | 5.9% |
| 75 to 84 Years | 170 | 6.4% |
| 85 Years and Over | 14 | 0.5% |
| Total | 2,671 | 100.0% |
Housing Finances in Valley Falls
Median Income by Occupancy in Valley Falls
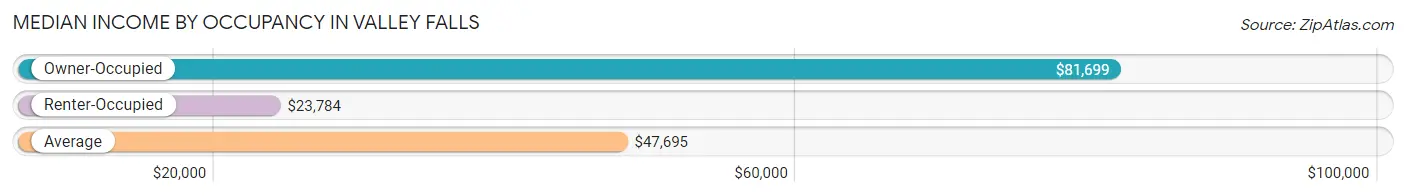
| Occupancy Type | # Households | Median Income |
| Owner-Occupied | 1,283 (48.0%) | $81,699 |
| Renter-Occupied | 1,388 (52.0%) | $23,784 |
| Average | 2,671 (100.0%) | $47,695 |
Occupancy by Householder Income Bracket in Valley Falls
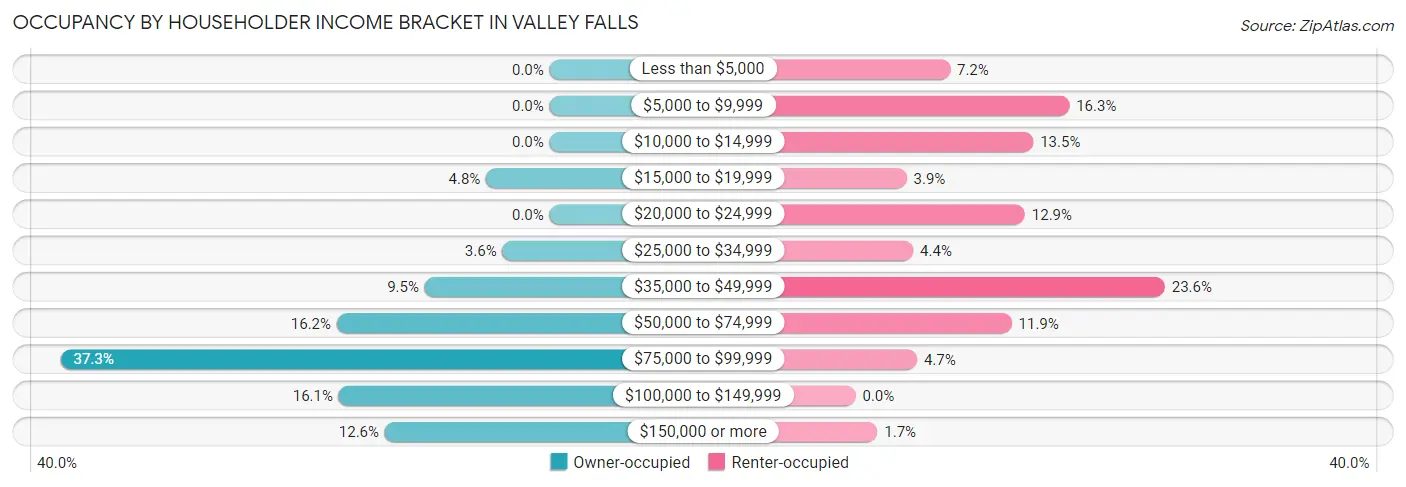
| Income Bracket | Owner-occupied | Renter-occupied |
| Less than $5,000 | 0 (0.0%) | 100 (7.2%) |
| $5,000 to $9,999 | 0 (0.0%) | 226 (16.3%) |
| $10,000 to $14,999 | 0 (0.0%) | 188 (13.5%) |
| $15,000 to $19,999 | 62 (4.8%) | 54 (3.9%) |
| $20,000 to $24,999 | 0 (0.0%) | 179 (12.9%) |
| $25,000 to $34,999 | 46 (3.6%) | 61 (4.4%) |
| $35,000 to $49,999 | 122 (9.5%) | 327 (23.6%) |
| $50,000 to $74,999 | 208 (16.2%) | 165 (11.9%) |
| $75,000 to $99,999 | 478 (37.3%) | 65 (4.7%) |
| $100,000 to $149,999 | 206 (16.1%) | 0 (0.0%) |
| $150,000 or more | 161 (12.6%) | 23 (1.7%) |
| Total | 1,283 (100.0%) | 1,388 (100.0%) |
Monthly Housing Cost Tiers in Valley Falls
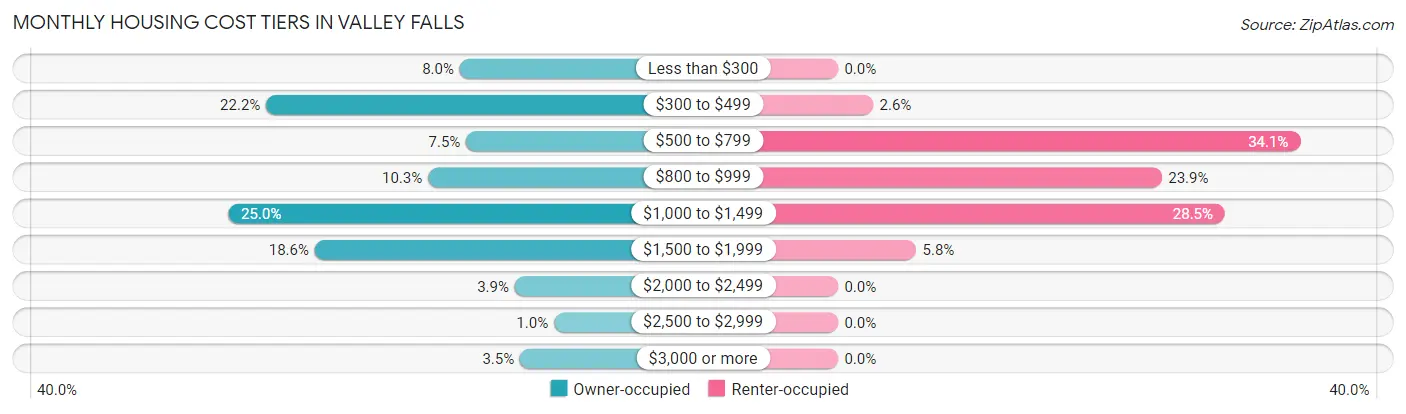
| Monthly Cost | Owner-occupied | Renter-occupied |
| Less than $300 | 102 (8.0%) | 0 (0.0%) |
| $300 to $499 | 285 (22.2%) | 36 (2.6%) |
| $500 to $799 | 96 (7.5%) | 473 (34.1%) |
| $800 to $999 | 132 (10.3%) | 331 (23.8%) |
| $1,000 to $1,499 | 321 (25.0%) | 396 (28.5%) |
| $1,500 to $1,999 | 239 (18.6%) | 80 (5.8%) |
| $2,000 to $2,499 | 50 (3.9%) | 0 (0.0%) |
| $2,500 to $2,999 | 13 (1.0%) | 0 (0.0%) |
| $3,000 or more | 45 (3.5%) | 0 (0.0%) |
| Total | 1,283 (100.0%) | 1,388 (100.0%) |
Physical Housing Characteristics in Valley Falls
Housing Structures in Valley Falls
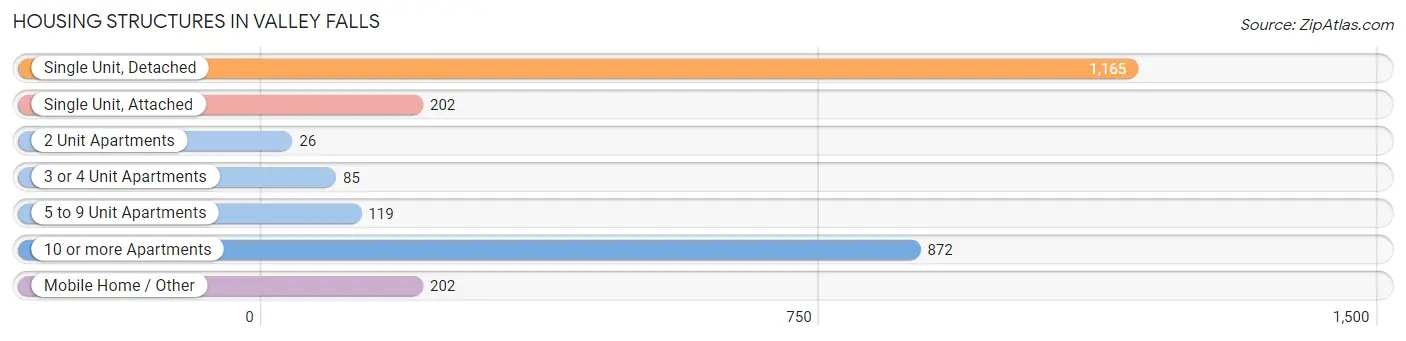
| Structure Type | # Housing Units | % Housing Units |
| Single Unit, Detached | 1,165 | 43.6% |
| Single Unit, Attached | 202 | 7.6% |
| 2 Unit Apartments | 26 | 1.0% |
| 3 or 4 Unit Apartments | 85 | 3.2% |
| 5 to 9 Unit Apartments | 119 | 4.5% |
| 10 or more Apartments | 872 | 32.7% |
| Mobile Home / Other | 202 | 7.6% |
| Total | 2,671 | 100.0% |
Housing Structures by Occupancy in Valley Falls
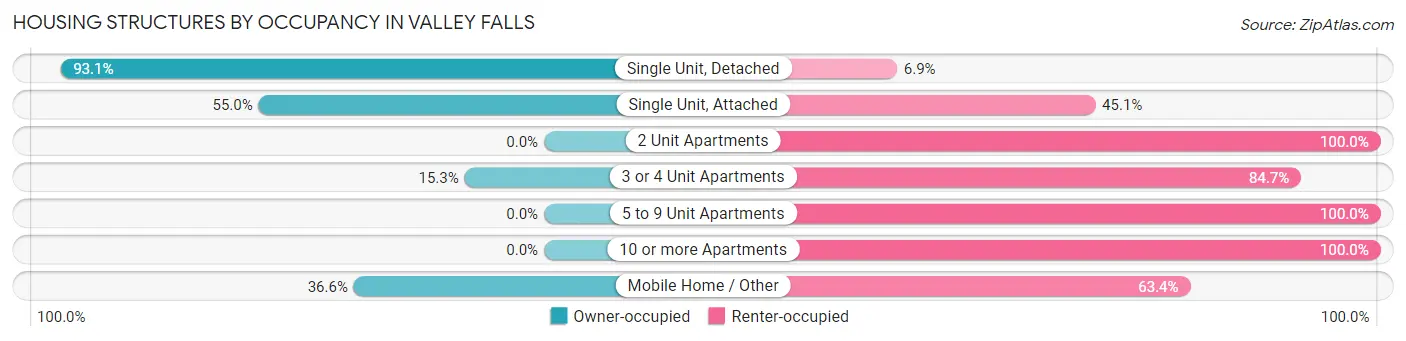
| Structure Type | Owner-occupied | Renter-occupied |
| Single Unit, Detached | 1,085 (93.1%) | 80 (6.9%) |
| Single Unit, Attached | 111 (54.9%) | 91 (45.1%) |
| 2 Unit Apartments | 0 (0.0%) | 26 (100.0%) |
| 3 or 4 Unit Apartments | 13 (15.3%) | 72 (84.7%) |
| 5 to 9 Unit Apartments | 0 (0.0%) | 119 (100.0%) |
| 10 or more Apartments | 0 (0.0%) | 872 (100.0%) |
| Mobile Home / Other | 74 (36.6%) | 128 (63.4%) |
| Total | 1,283 (48.0%) | 1,388 (52.0%) |
Housing Structures by Number of Rooms in Valley Falls
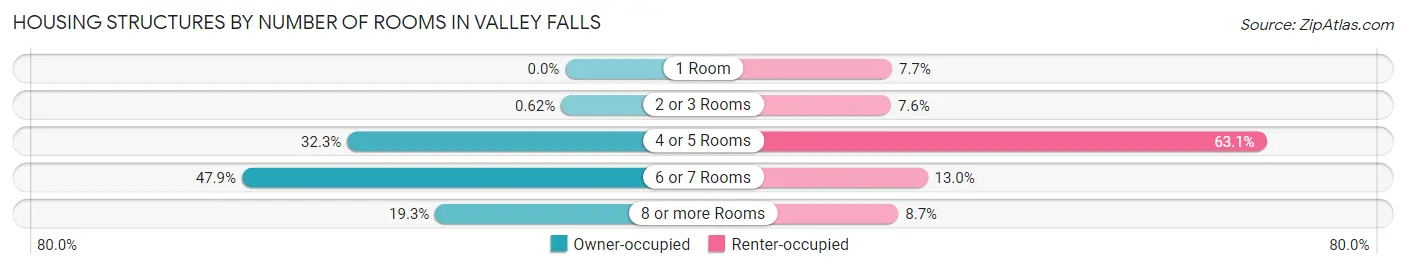
| Number of Rooms | Owner-occupied | Renter-occupied |
| 1 Room | 0 (0.0%) | 107 (7.7%) |
| 2 or 3 Rooms | 8 (0.6%) | 105 (7.6%) |
| 4 or 5 Rooms | 414 (32.3%) | 876 (63.1%) |
| 6 or 7 Rooms | 614 (47.9%) | 180 (13.0%) |
| 8 or more Rooms | 247 (19.3%) | 120 (8.6%) |
| Total | 1,283 (100.0%) | 1,388 (100.0%) |
Housing Structure by Heating Type in Valley Falls
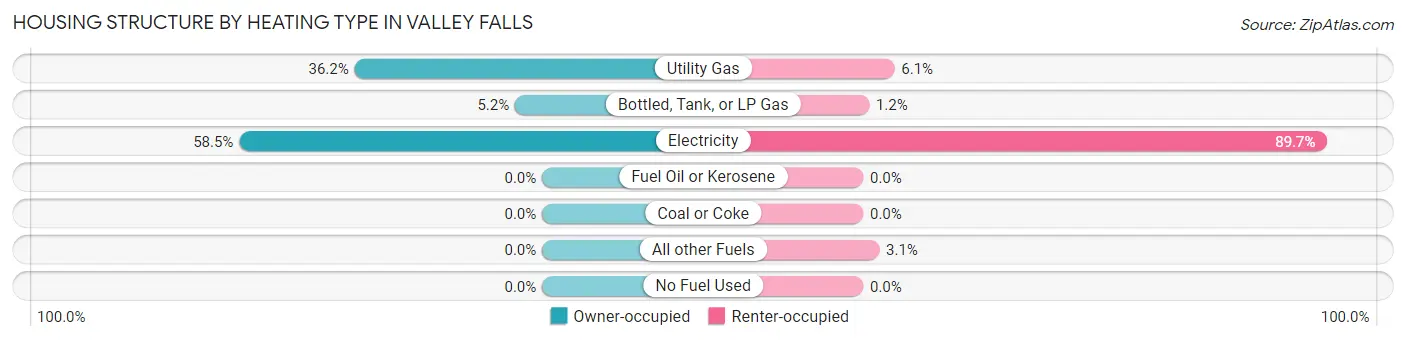
| Heating Type | Owner-occupied | Renter-occupied |
| Utility Gas | 465 (36.2%) | 84 (6.0%) |
| Bottled, Tank, or LP Gas | 67 (5.2%) | 16 (1.1%) |
| Electricity | 751 (58.5%) | 1,245 (89.7%) |
| Fuel Oil or Kerosene | 0 (0.0%) | 0 (0.0%) |
| Coal or Coke | 0 (0.0%) | 0 (0.0%) |
| All other Fuels | 0 (0.0%) | 43 (3.1%) |
| No Fuel Used | 0 (0.0%) | 0 (0.0%) |
| Total | 1,283 (100.0%) | 1,388 (100.0%) |
Household Vehicle Usage in Valley Falls
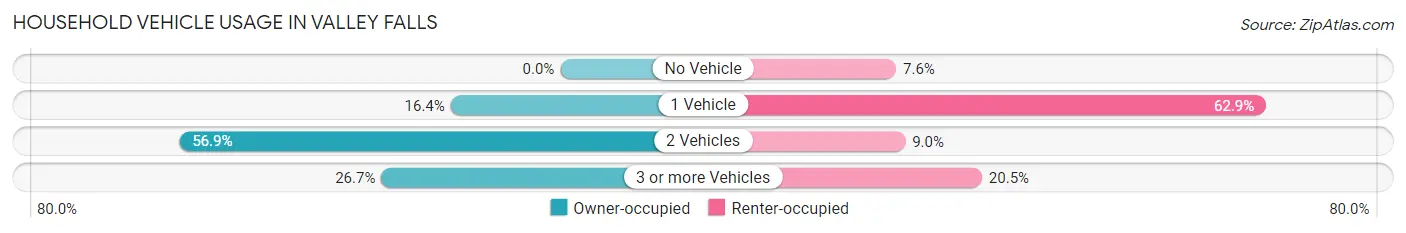
| Vehicles per Household | Owner-occupied | Renter-occupied |
| No Vehicle | 0 (0.0%) | 106 (7.6%) |
| 1 Vehicle | 210 (16.4%) | 873 (62.9%) |
| 2 Vehicles | 730 (56.9%) | 125 (9.0%) |
| 3 or more Vehicles | 343 (26.7%) | 284 (20.5%) |
| Total | 1,283 (100.0%) | 1,388 (100.0%) |
Real Estate & Mortgages in Valley Falls
Real Estate and Mortgage Overview in Valley Falls
| Characteristic | Without Mortgage | With Mortgage |
| Housing Units | 471 | 812 |
| Median Property Value | $148,300 | $199,800 |
| Median Household Income | $70,375 | $116 |
| Monthly Housing Costs | $340 | $45 |
| Real Estate Taxes | $1,000 | $102 |
Property Value by Mortgage Status in Valley Falls
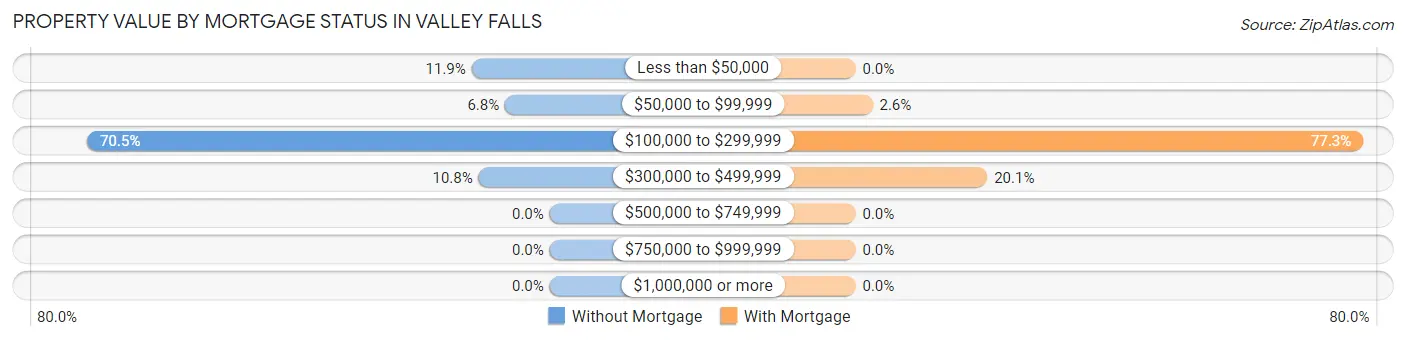
| Property Value | Without Mortgage | With Mortgage |
| Less than $50,000 | 56 (11.9%) | 0 (0.0%) |
| $50,000 to $99,999 | 32 (6.8%) | 21 (2.6%) |
| $100,000 to $299,999 | 332 (70.5%) | 628 (77.3%) |
| $300,000 to $499,999 | 51 (10.8%) | 163 (20.1%) |
| $500,000 to $749,999 | 0 (0.0%) | 0 (0.0%) |
| $750,000 to $999,999 | 0 (0.0%) | 0 (0.0%) |
| $1,000,000 or more | 0 (0.0%) | 0 (0.0%) |
| Total | 471 (100.0%) | 812 (100.0%) |
Household Income by Mortgage Status in Valley Falls
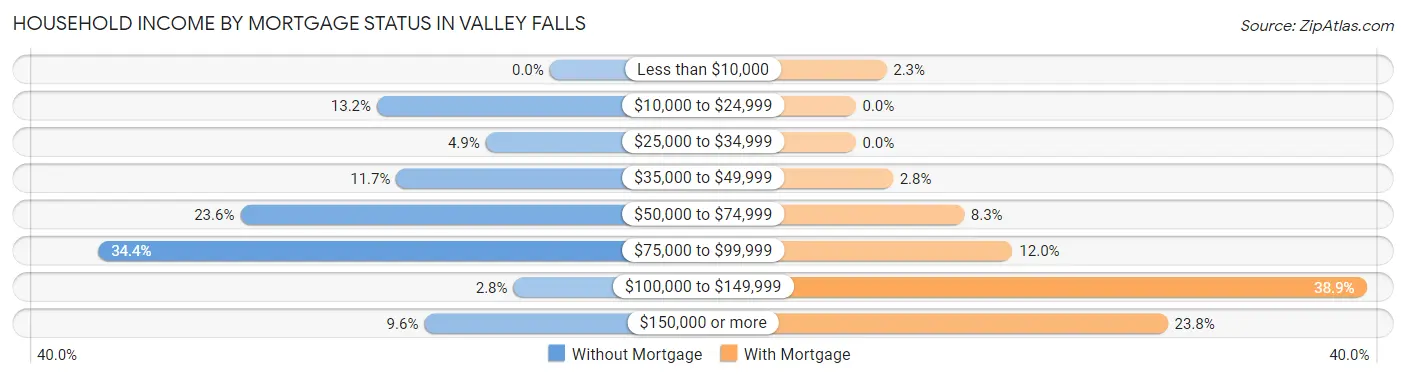
| Household Income | Without Mortgage | With Mortgage |
| Less than $10,000 | 0 (0.0%) | 19 (2.3%) |
| $10,000 to $24,999 | 62 (13.2%) | 0 (0.0%) |
| $25,000 to $34,999 | 23 (4.9%) | 0 (0.0%) |
| $35,000 to $49,999 | 55 (11.7%) | 23 (2.8%) |
| $50,000 to $74,999 | 111 (23.6%) | 67 (8.3%) |
| $75,000 to $99,999 | 162 (34.4%) | 97 (11.9%) |
| $100,000 to $149,999 | 13 (2.8%) | 316 (38.9%) |
| $150,000 or more | 45 (9.6%) | 193 (23.8%) |
| Total | 471 (100.0%) | 812 (100.0%) |
Property Value to Household Income Ratio in Valley Falls
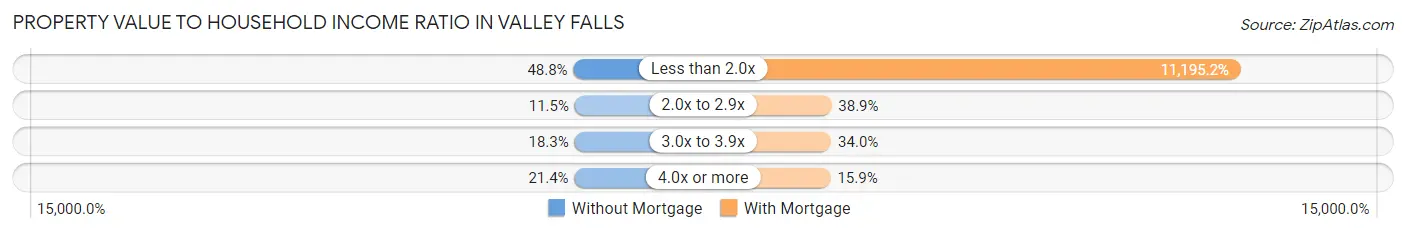
| Value-to-Income Ratio | Without Mortgage | With Mortgage |
| Less than 2.0x | 230 (48.8%) | 90,905 (11,195.2%) |
| 2.0x to 2.9x | 54 (11.5%) | 316 (38.9%) |
| 3.0x to 3.9x | 86 (18.3%) | 276 (34.0%) |
| 4.0x or more | 101 (21.4%) | 129 (15.9%) |
| Total | 471 (100.0%) | 812 (100.0%) |
Real Estate Taxes by Mortgage Status in Valley Falls
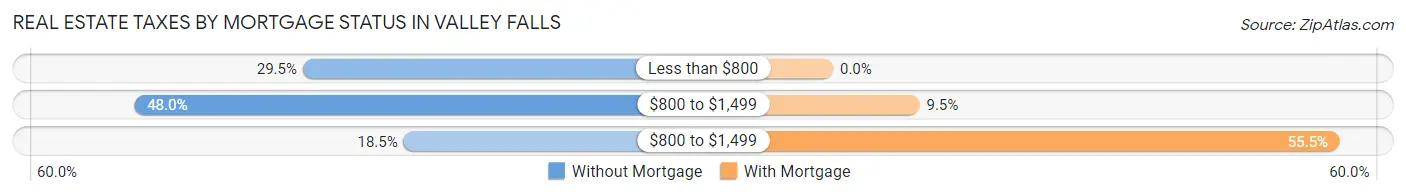
| Property Taxes | Without Mortgage | With Mortgage |
| Less than $800 | 139 (29.5%) | 0 (0.0%) |
| $800 to $1,499 | 226 (48.0%) | 77 (9.5%) |
| $800 to $1,499 | 87 (18.5%) | 451 (55.5%) |
| Total | 471 (100.0%) | 812 (100.0%) |
Health & Disability in Valley Falls
Health Insurance Coverage by Age in Valley Falls
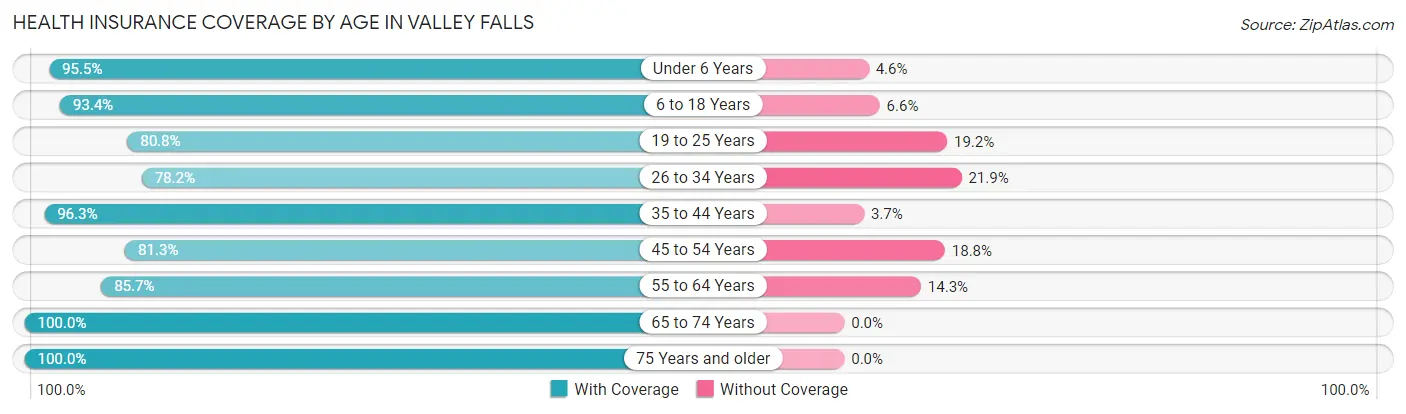
| Age Bracket | With Coverage | Without Coverage |
| Under 6 Years | 420 (95.5%) | 20 (4.5%) |
| 6 to 18 Years | 510 (93.4%) | 36 (6.6%) |
| 19 to 25 Years | 2,152 (80.8%) | 510 (19.2%) |
| 26 to 34 Years | 776 (78.1%) | 217 (21.8%) |
| 35 to 44 Years | 394 (96.3%) | 15 (3.7%) |
| 45 to 54 Years | 468 (81.2%) | 108 (18.8%) |
| 55 to 64 Years | 672 (85.7%) | 112 (14.3%) |
| 65 to 74 Years | 297 (100.0%) | 0 (0.0%) |
| 75 Years and older | 305 (100.0%) | 0 (0.0%) |
| Total | 5,994 (85.5%) | 1,018 (14.5%) |
Health Insurance Coverage by Citizenship Status in Valley Falls
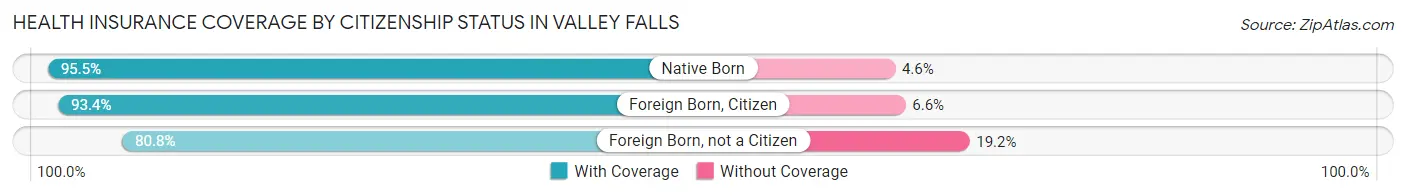
| Citizenship Status | With Coverage | Without Coverage |
| Native Born | 420 (95.5%) | 20 (4.5%) |
| Foreign Born, Citizen | 510 (93.4%) | 36 (6.6%) |
| Foreign Born, not a Citizen | 2,152 (80.8%) | 510 (19.2%) |
Health Insurance Coverage by Household Income in Valley Falls
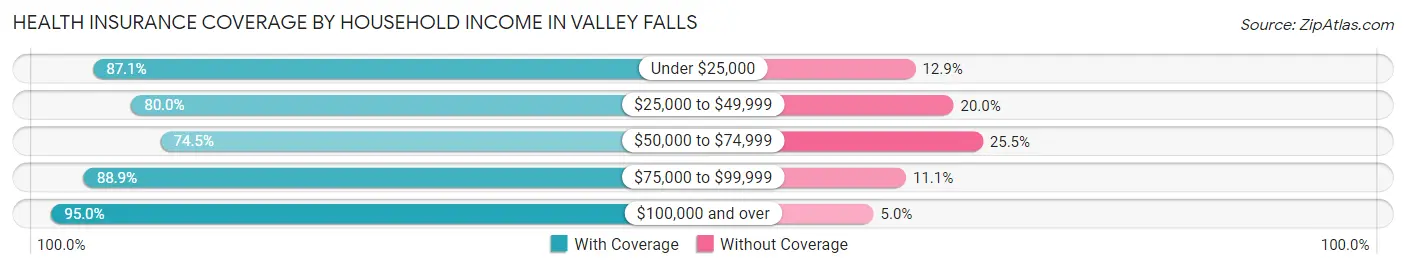
| Household Income | With Coverage | Without Coverage |
| Under $25,000 | 1,205 (87.1%) | 178 (12.9%) |
| $25,000 to $49,999 | 964 (80.0%) | 241 (20.0%) |
| $50,000 to $74,999 | 833 (74.5%) | 285 (25.5%) |
| $75,000 to $99,999 | 1,241 (88.9%) | 155 (11.1%) |
| $100,000 and over | 1,022 (95.0%) | 54 (5.0%) |
Public vs Private Health Insurance Coverage by Age in Valley Falls
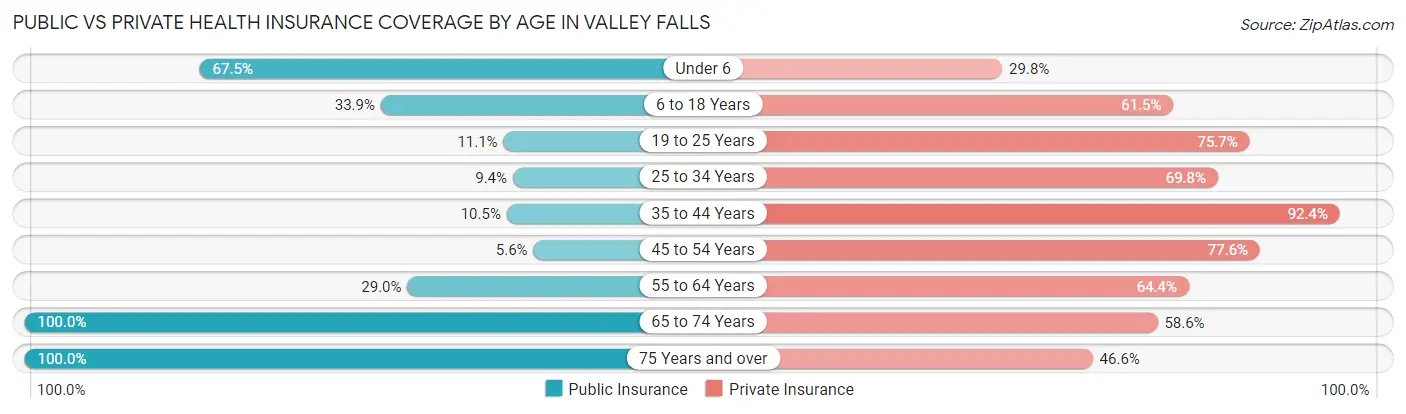
| Age Bracket | Public Insurance | Private Insurance |
| Under 6 | 297 (67.5%) | 131 (29.8%) |
| 6 to 18 Years | 185 (33.9%) | 336 (61.5%) |
| 19 to 25 Years | 296 (11.1%) | 2,015 (75.7%) |
| 25 to 34 Years | 93 (9.4%) | 693 (69.8%) |
| 35 to 44 Years | 43 (10.5%) | 378 (92.4%) |
| 45 to 54 Years | 32 (5.6%) | 447 (77.6%) |
| 55 to 64 Years | 227 (28.9%) | 505 (64.4%) |
| 65 to 74 Years | 297 (100.0%) | 174 (58.6%) |
| 75 Years and over | 305 (100.0%) | 142 (46.6%) |
| Total | 1,775 (25.3%) | 4,821 (68.8%) |
Disability Status by Sex by Age in Valley Falls

| Age Bracket | Male | Female |
| Under 5 Years | 0 (0.0%) | 0 (0.0%) |
| 5 to 17 Years | 0 (0.0%) | 20 (9.3%) |
| 18 to 34 Years | 40 (3.0%) | 198 (7.7%) |
| 35 to 64 Years | 189 (21.3%) | 115 (13.0%) |
| 65 to 74 Years | 64 (47.8%) | 24 (14.7%) |
| 75 Years and over | 32 (34.4%) | 109 (51.4%) |
Disability Class by Sex by Age in Valley Falls
Disability Class: Hearing Difficulty
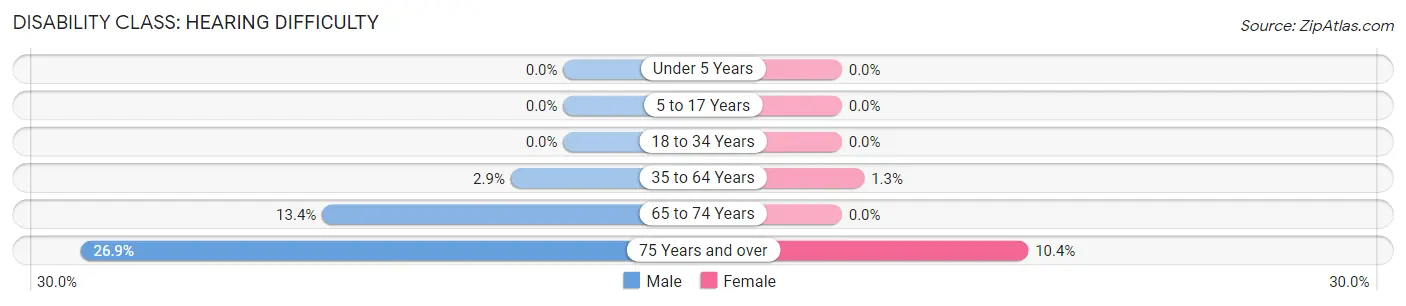
| Age Bracket | Male | Female |
| Under 5 Years | 0 (0.0%) | 0 (0.0%) |
| 5 to 17 Years | 0 (0.0%) | 0 (0.0%) |
| 18 to 34 Years | 0 (0.0%) | 0 (0.0%) |
| 35 to 64 Years | 26 (2.9%) | 11 (1.3%) |
| 65 to 74 Years | 18 (13.4%) | 0 (0.0%) |
| 75 Years and over | 25 (26.9%) | 22 (10.4%) |
Disability Class: Vision Difficulty
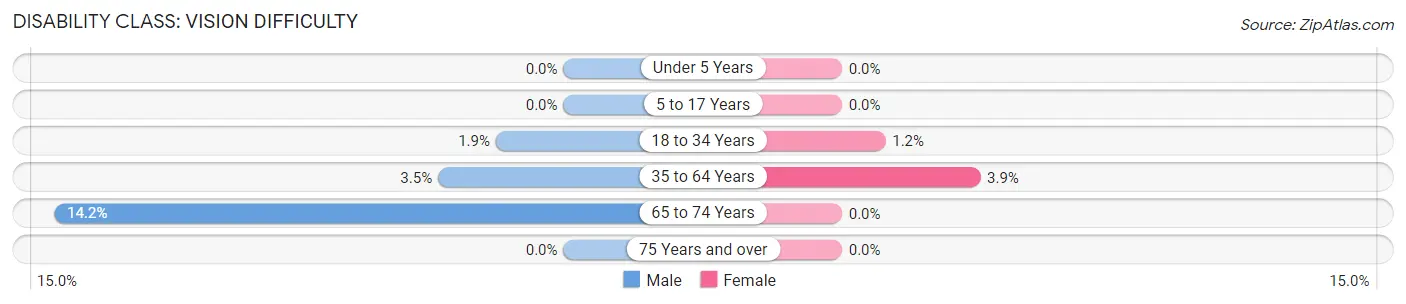
| Age Bracket | Male | Female |
| Under 5 Years | 0 (0.0%) | 0 (0.0%) |
| 5 to 17 Years | 0 (0.0%) | 0 (0.0%) |
| 18 to 34 Years | 25 (1.9%) | 31 (1.2%) |
| 35 to 64 Years | 31 (3.5%) | 34 (3.8%) |
| 65 to 74 Years | 19 (14.2%) | 0 (0.0%) |
| 75 Years and over | 0 (0.0%) | 0 (0.0%) |
Disability Class: Cognitive Difficulty
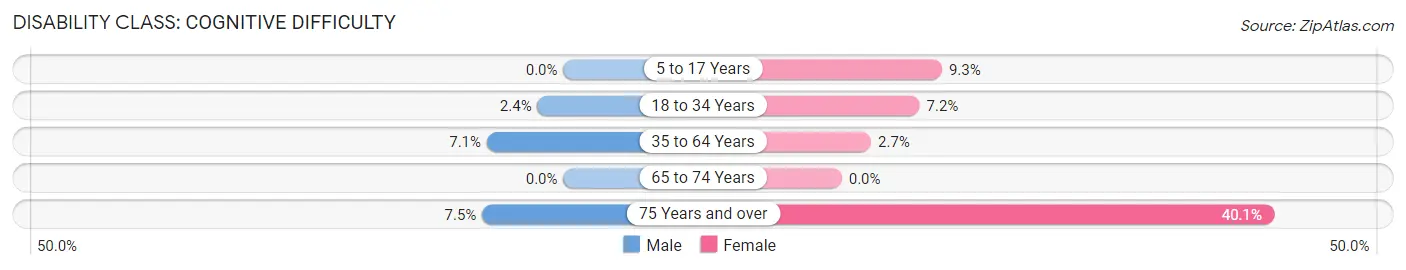
| Age Bracket | Male | Female |
| 5 to 17 Years | 0 (0.0%) | 20 (9.3%) |
| 18 to 34 Years | 32 (2.4%) | 185 (7.2%) |
| 35 to 64 Years | 63 (7.1%) | 24 (2.7%) |
| 65 to 74 Years | 0 (0.0%) | 0 (0.0%) |
| 75 Years and over | 7 (7.5%) | 85 (40.1%) |
Disability Class: Ambulatory Difficulty
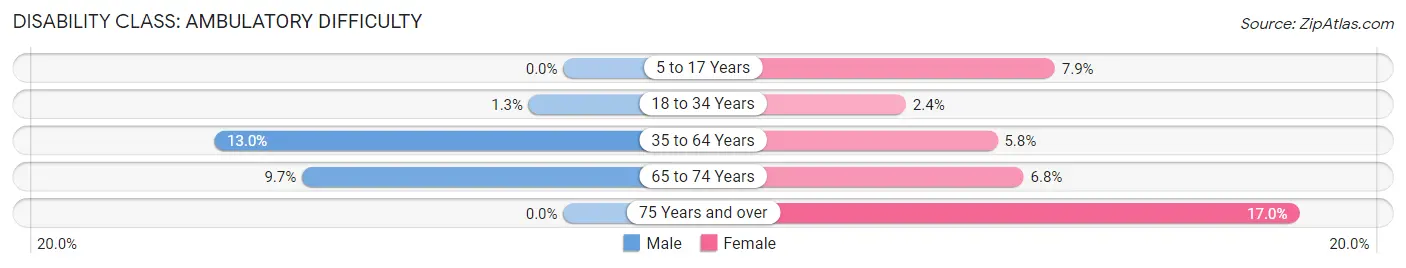
| Age Bracket | Male | Female |
| 5 to 17 Years | 0 (0.0%) | 17 (7.9%) |
| 18 to 34 Years | 17 (1.3%) | 61 (2.4%) |
| 35 to 64 Years | 115 (13.0%) | 51 (5.8%) |
| 65 to 74 Years | 13 (9.7%) | 11 (6.8%) |
| 75 Years and over | 0 (0.0%) | 36 (17.0%) |
Disability Class: Self-Care Difficulty
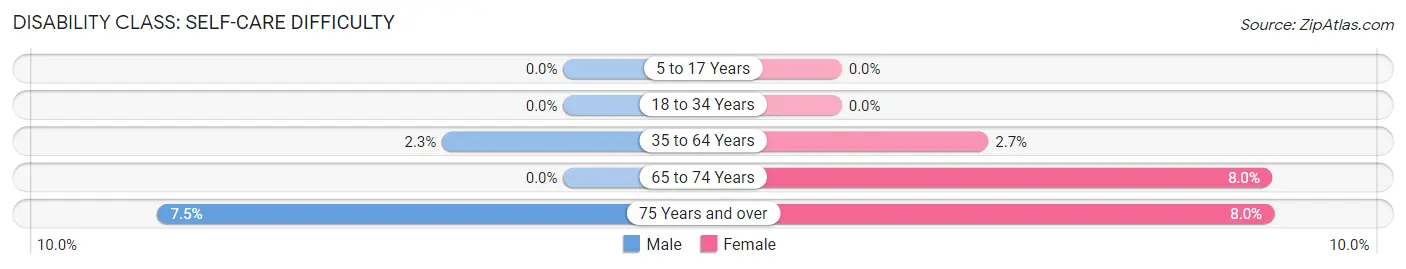
| Age Bracket | Male | Female |
| 5 to 17 Years | 0 (0.0%) | 0 (0.0%) |
| 18 to 34 Years | 0 (0.0%) | 0 (0.0%) |
| 35 to 64 Years | 20 (2.2%) | 24 (2.7%) |
| 65 to 74 Years | 0 (0.0%) | 13 (8.0%) |
| 75 Years and over | 7 (7.5%) | 17 (8.0%) |
Technology Access in Valley Falls
Computing Device Access in Valley Falls
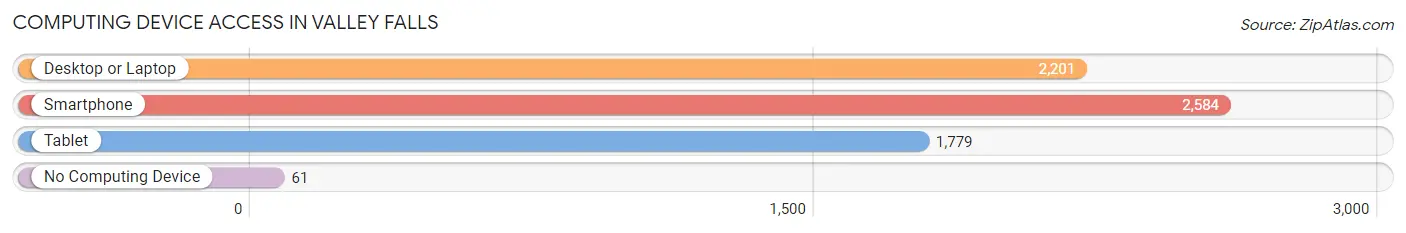
| Device Type | # Households | % Households |
| Desktop or Laptop | 2,201 | 82.4% |
| Smartphone | 2,584 | 96.7% |
| Tablet | 1,779 | 66.6% |
| No Computing Device | 61 | 2.3% |
| Total | 2,671 | 100.0% |
Internet Access in Valley Falls
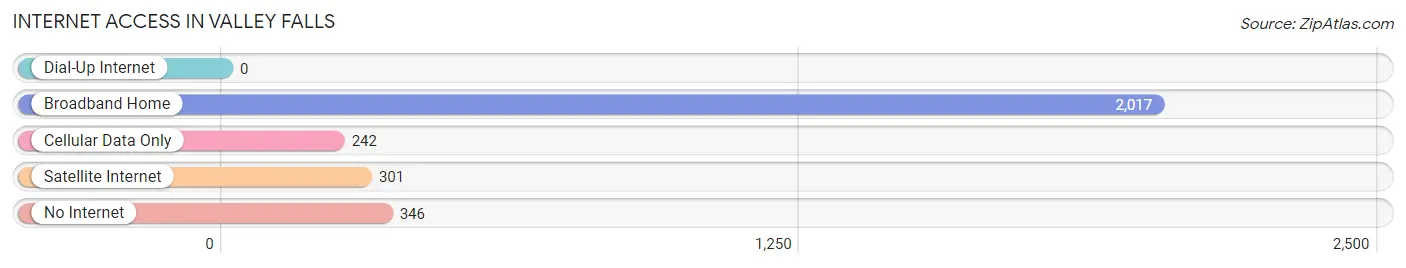
| Internet Type | # Households | % Households |
| Dial-Up Internet | 0 | 0.0% |
| Broadband Home | 2,017 | 75.5% |
| Cellular Data Only | 242 | 9.1% |
| Satellite Internet | 301 | 11.3% |
| No Internet | 346 | 13.0% |
| Total | 2,671 | 100.0% |
Valley Falls Summary
Valley Falls is a small town located in the foothills of the Blue Ridge Mountains in South Carolina. It is situated in the northwestern corner of the state, just south of the North Carolina border. The town is part of the Greenville-Spartanburg-Anderson metropolitan area, and is located approximately 25 miles from the city of Greenville.
History
Valley Falls was founded in 1820 by a group of settlers from North Carolina. The town was originally known as “Valley Falls Station”, and was a stop on the stagecoach route between Greenville and Spartanburg. The town was officially incorporated in 1872, and the name was changed to Valley Falls.
The town was a major center for the textile industry in the late 19th and early 20th centuries. The Valley Falls Cotton Mill was established in 1887, and was the largest employer in the area for many years. The mill closed in the 1950s, and the town’s economy shifted to other industries, such as furniture manufacturing and tourism.
Geography
Valley Falls is located in the foothills of the Blue Ridge Mountains in northwestern South Carolina. The town is situated in the Piedmont region of the state, and is part of the Greenville-Spartanburg-Anderson metropolitan area. The town is located approximately 25 miles from the city of Greenville.
The town is situated at an elevation of 1,000 feet above sea level, and is surrounded by rolling hills and forests. The town is located near the headwaters of the Saluda River, which flows southward through the town and eventually empties into Lake Hartwell.
Economy
Valley Falls is a small town with a population of just over 1,000 people. The town’s economy is largely based on tourism, as well as furniture manufacturing and other light industries. The town is home to several small businesses, including restaurants, shops, and a local newspaper.
The town is also home to several large employers, including the Valley Falls Furniture Company, which manufactures furniture for the home and office. The town is also home to the Valley Falls Resort, which offers a variety of recreational activities, including golf, tennis, and swimming.
Demographics
As of the 2010 census, Valley Falls had a population of 1,072 people. The racial makeup of the town was 94.3% White, 2.7% African American, 0.3% Native American, 0.7% Asian, and 1.9% from other races. The median household income was $37,917, and the median family income was $45,625.
The town is served by the Greenville County School District, and is home to Valley Falls Elementary School. The town is also home to several churches, including Valley Falls Baptist Church, Valley Falls Presbyterian Church, and Valley Falls United Methodist Church.
Valley Falls is a small town with a rich history and a vibrant economy. The town is home to a variety of businesses, churches, and recreational activities, and is a great place to live and work.
Common Questions
What is Per Capita Income in Valley Falls?
Per Capita income in Valley Falls is $26,911.
What is the Median Family Income in Valley Falls?
Median Family Income in Valley Falls is $69,416.
What is the Median Household income in Valley Falls?
Median Household Income in Valley Falls is $47,695.
What is Income or Wage Gap in Valley Falls?
Income or Wage Gap in Valley Falls is 61.7%.
Women in Valley Falls earn 38.3 cents for every dollar earned by a man.
What is Inequality or Gini Index in Valley Falls?
Inequality or Gini Index in Valley Falls is 0.48.
What is the Total Population of Valley Falls?
Total Population of Valley Falls is 7,104.
What is the Total Male Population of Valley Falls?
Total Male Population of Valley Falls is 2,766.
What is the Total Female Population of Valley Falls?
Total Female Population of Valley Falls is 4,338.
What is the Ratio of Males per 100 Females in Valley Falls?
There are 63.76 Males per 100 Females in Valley Falls.
What is the Ratio of Females per 100 Males in Valley Falls?
There are 156.83 Females per 100 Males in Valley Falls.
What is the Median Population Age in Valley Falls?
Median Population Age in Valley Falls is 25.6 Years.
What is the Average Family Size in Valley Falls
Average Family Size in Valley Falls is 2.6 People.
What is the Average Household Size in Valley Falls
Average Household Size in Valley Falls is 2.3 People.
How Large is the Labor Force in Valley Falls?
There are 4,389 People in the Labor Forcein in Valley Falls.
What is the Percentage of People in the Labor Force in Valley Falls?
68.5% of People are in the Labor Force in Valley Falls.
What is the Unemployment Rate in Valley Falls?
Unemployment Rate in Valley Falls is 4.5%.