Blue Eye, MO Map & Demographics
Blue Eye Map
Blue Eye Overview
$25,607
PER CAPITA INCOME
$57,321
AVG FAMILY INCOME
$35,714
AVG HOUSEHOLD INCOME
0.38
INEQUALITY / GINI INDEX
389
TOTAL POPULATION
159
MALE POPULATION
230
FEMALE POPULATION
69.13
MALES / 100 FEMALES
144.65
FEMALES / 100 MALES
63.5
MEDIAN AGE
3.0
AVG FAMILY SIZE
2.0
AVG HOUSEHOLD SIZE
131
LABOR FORCE [ PEOPLE ]
37.3%
PERCENT IN LABOR FORCE
5.3%
UNEMPLOYMENT RATE
Blue Eye Zip Codes
Blue Eye Area Codes
Income in Blue Eye
Income Overview in Blue Eye
Per Capita Income in Blue Eye is $25,607, while median incomes of families and households are $57,321 and $35,714 respectively.
| Characteristic | Number | Measure |
| Per Capita Income | 389 | $25,607 |
| Median Family Income | 93 | $57,321 |
| Mean Family Income | 93 | $65,811 |
| Median Household Income | 194 | $35,714 |
| Mean Household Income | 194 | $44,919 |
| Income Deficit | 93 | $0 |
| Wage / Income Gap (%) | 389 | 0.00% |
| Wage / Income Gap ($) | 389 | 100.00¢ per $1 |
| Gini / Inequality Index | 389 | 0.38 |
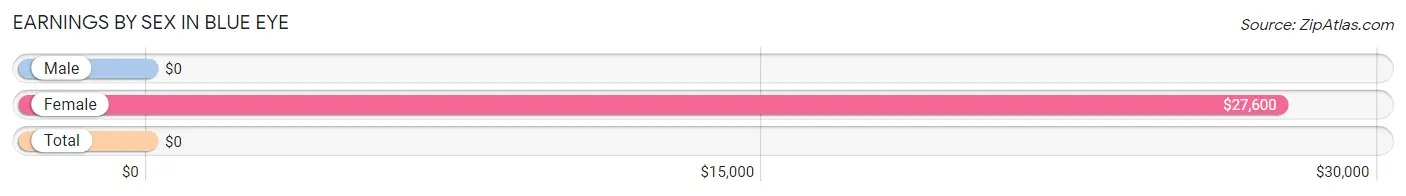
Earnings by Sex in Blue Eye
| Sex | Number | Average Earnings |
| Male | 75 (46.0%) | $0 |
| Female | 88 (54.0%) | $27,600 |
| Total | 163 (100.0%) | $0 |
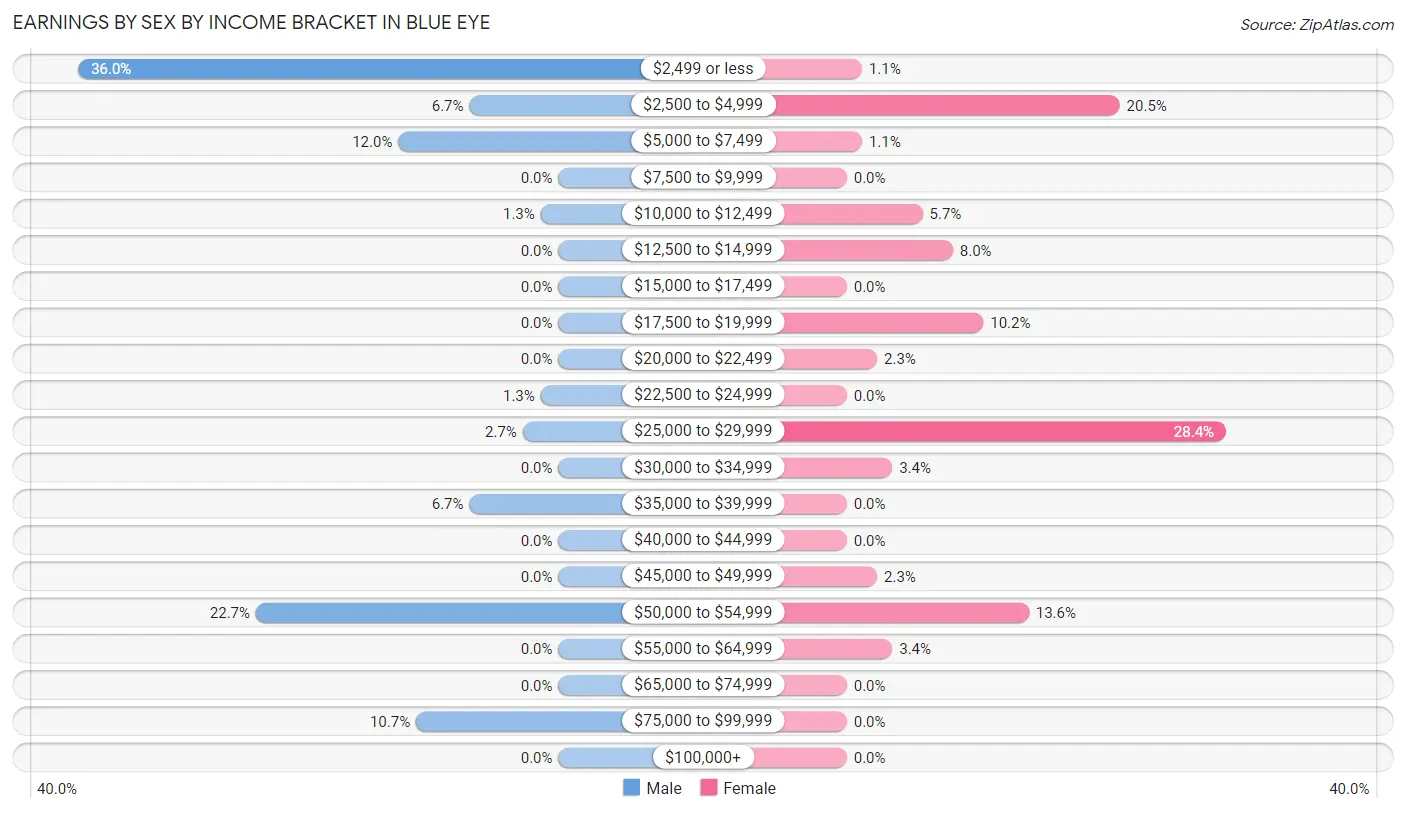
Earnings by Sex by Income Bracket in Blue Eye
The most common earnings brackets in Blue Eye are $2,499 or less for men (27 | 36.0%) and $25,000 to $29,999 for women (25 | 28.4%).
| Income | Male | Female |
| $2,499 or less | 27 (36.0%) | 1 (1.1%) |
| $2,500 to $4,999 | 5 (6.7%) | 18 (20.4%) |
| $5,000 to $7,499 | 9 (12.0%) | 1 (1.1%) |
| $7,500 to $9,999 | 0 (0.0%) | 0 (0.0%) |
| $10,000 to $12,499 | 1 (1.3%) | 5 (5.7%) |
| $12,500 to $14,999 | 0 (0.0%) | 7 (8.0%) |
| $15,000 to $17,499 | 0 (0.0%) | 0 (0.0%) |
| $17,500 to $19,999 | 0 (0.0%) | 9 (10.2%) |
| $20,000 to $22,499 | 0 (0.0%) | 2 (2.3%) |
| $22,500 to $24,999 | 1 (1.3%) | 0 (0.0%) |
| $25,000 to $29,999 | 2 (2.7%) | 25 (28.4%) |
| $30,000 to $34,999 | 0 (0.0%) | 3 (3.4%) |
| $35,000 to $39,999 | 5 (6.7%) | 0 (0.0%) |
| $40,000 to $44,999 | 0 (0.0%) | 0 (0.0%) |
| $45,000 to $49,999 | 0 (0.0%) | 2 (2.3%) |
| $50,000 to $54,999 | 17 (22.7%) | 12 (13.6%) |
| $55,000 to $64,999 | 0 (0.0%) | 3 (3.4%) |
| $65,000 to $74,999 | 0 (0.0%) | 0 (0.0%) |
| $75,000 to $99,999 | 8 (10.7%) | 0 (0.0%) |
| $100,000+ | 0 (0.0%) | 0 (0.0%) |
| Total | 75 (100.0%) | 88 (100.0%) |
Earnings by Sex by Educational Attainment in Blue Eye
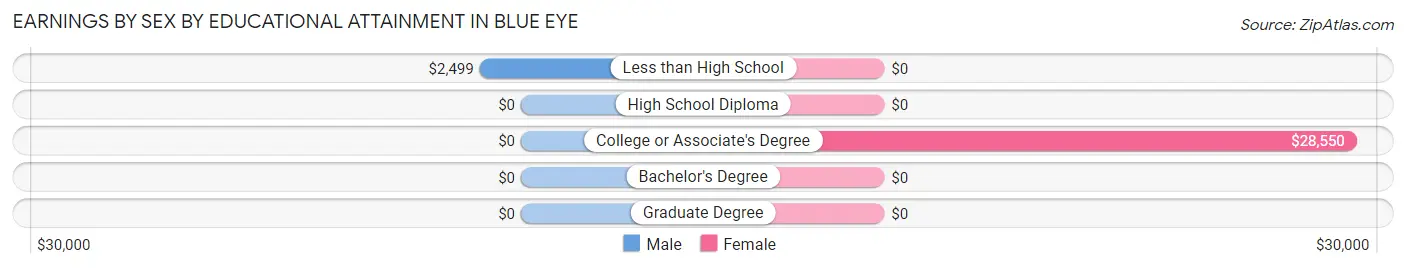
| Educational Attainment | Male Income | Female Income |
| Less than High School | $2,499 | $0 |
| High School Diploma | - | - |
| College or Associate's Degree | - | - |
| Bachelor's Degree | - | - |
| Graduate Degree | - | - |
| Total | - | - |
Family Income in Blue Eye
Family Income Brackets in Blue Eye
According to the Blue Eye family income data, there are 27 families falling into the $75,000 to $99,999 income range, which is the most common income bracket and makes up 29.0% of all families.
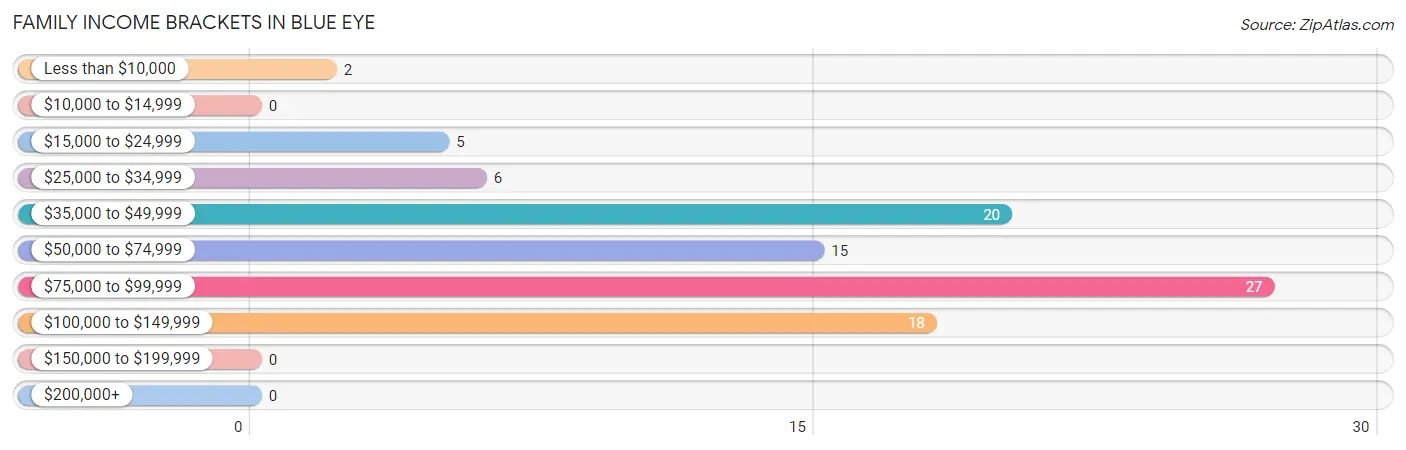
| Income Bracket | # Families | % Families |
| Less than $10,000 | 2 | 2.2% |
| $10,000 to $14,999 | 0 | 0.0% |
| $15,000 to $24,999 | 5 | 5.4% |
| $25,000 to $34,999 | 6 | 6.5% |
| $35,000 to $49,999 | 20 | 21.5% |
| $50,000 to $74,999 | 15 | 16.1% |
| $75,000 to $99,999 | 27 | 29.0% |
| $100,000 to $149,999 | 18 | 19.4% |
| $150,000 to $199,999 | 0 | 0.0% |
| $200,000+ | 0 | 0.0% |
Family Income by Famaliy Size in Blue Eye
3-person families (15 | 16.1%) account for the highest median family income in Blue Eye with $95,417 per family, while 3-person families (15 | 16.1%) have the highest median income of $31,806 per family member.
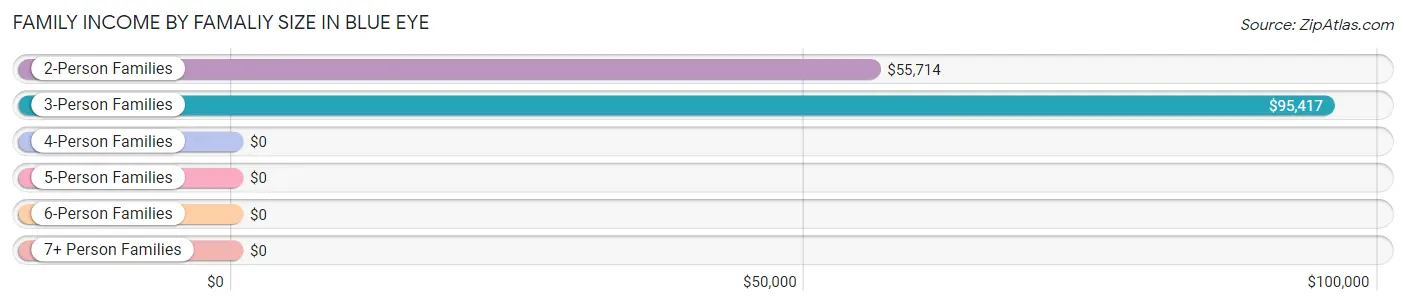
| Income Bracket | # Families | Median Income |
| 2-Person Families | 68 (73.1%) | $55,714 |
| 3-Person Families | 15 (16.1%) | $95,417 |
| 4-Person Families | 10 (10.7%) | $0 |
| 5-Person Families | 0 (0.0%) | $0 |
| 6-Person Families | 0 (0.0%) | $0 |
| 7+ Person Families | 0 (0.0%) | $0 |
| Total | 93 (100.0%) | $57,321 |
Family Income by Number of Earners in Blue Eye
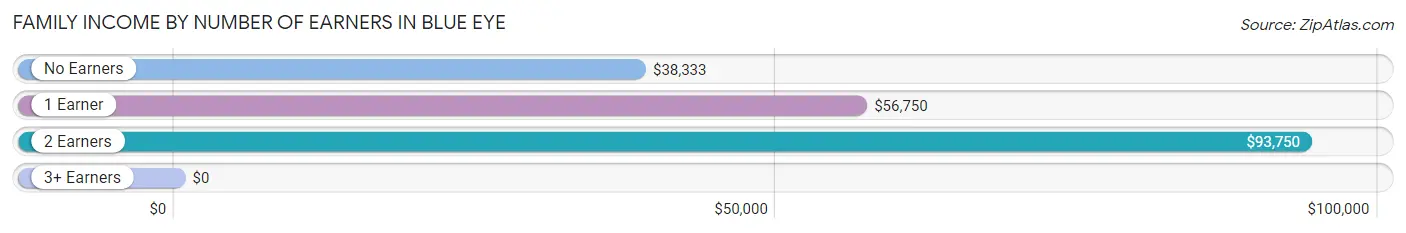
| Number of Earners | # Families | Median Income |
| No Earners | 22 (23.7%) | $38,333 |
| 1 Earner | 51 (54.8%) | $56,750 |
| 2 Earners | 20 (21.5%) | $93,750 |
| 3+ Earners | 0 (0.0%) | $0 |
| Total | 93 (100.0%) | $57,321 |
Household Income in Blue Eye
Household Income Brackets in Blue Eye
With 41 households falling in the category, the $25,000 to $34,999 income range is the most frequent in Blue Eye, accounting for 21.1% of all households.

| Income Bracket | # Households | % Households |
| Less than $10,000 | 19 | 9.8% |
| $10,000 to $14,999 | 12 | 6.2% |
| $15,000 to $24,999 | 23 | 11.9% |
| $25,000 to $34,999 | 41 | 21.1% |
| $35,000 to $49,999 | 34 | 17.5% |
| $50,000 to $74,999 | 17 | 8.8% |
| $75,000 to $99,999 | 30 | 15.5% |
| $100,000 to $149,999 | 18 | 9.3% |
| $150,000 to $199,999 | 0 | 0.0% |
| $200,000+ | 0 | 0.0% |
Household Income by Householder Age in Blue Eye
The median household income in Blue Eye is $35,714, with the highest median household income of $41,458 found in the 65+ years age bracket for the primary householder. A total of 129 households (66.5%) fall into this category. Meanwhile, the 15 to 24 years age bracket for the primary householder has the lowest median household income of $0, with 3 households (1.5%) in this group.
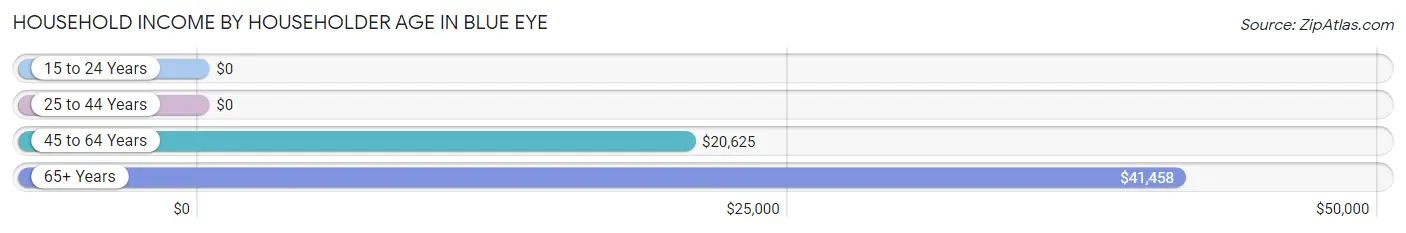
| Income Bracket | # Households | Median Income |
| 15 to 24 Years | 3 (1.5%) | $0 |
| 25 to 44 Years | 42 (21.6%) | $0 |
| 45 to 64 Years | 20 (10.3%) | $20,625 |
| 65+ Years | 129 (66.5%) | $41,458 |
| Total | 194 (100.0%) | $35,714 |
Poverty in Blue Eye
Income Below Poverty by Sex and Age in Blue Eye
With 6.9% poverty level for males and 10.0% for females among the residents of Blue Eye, 75 year old and over males and 55 to 64 year old females are the most vulnerable to poverty, with 4 males (20.0%) and 8 females (19.5%) in their respective age groups living below the poverty level.
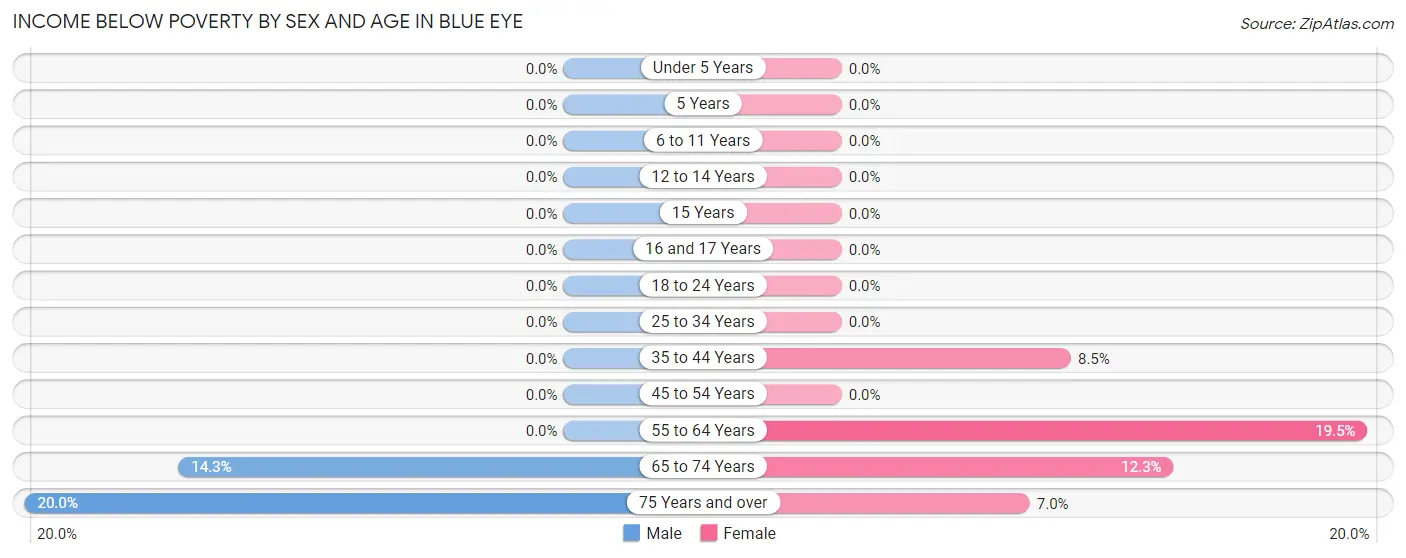
| Age Bracket | Male | Female |
| Under 5 Years | 0 (0.0%) | 0 (0.0%) |
| 5 Years | 0 (0.0%) | 0 (0.0%) |
| 6 to 11 Years | 0 (0.0%) | 0 (0.0%) |
| 12 to 14 Years | 0 (0.0%) | 0 (0.0%) |
| 15 Years | 0 (0.0%) | 0 (0.0%) |
| 16 and 17 Years | 0 (0.0%) | 0 (0.0%) |
| 18 to 24 Years | 0 (0.0%) | 0 (0.0%) |
| 25 to 34 Years | 0 (0.0%) | 0 (0.0%) |
| 35 to 44 Years | 0 (0.0%) | 4 (8.5%) |
| 45 to 54 Years | 0 (0.0%) | 0 (0.0%) |
| 55 to 64 Years | 0 (0.0%) | 8 (19.5%) |
| 65 to 74 Years | 7 (14.3%) | 8 (12.3%) |
| 75 Years and over | 4 (20.0%) | 3 (7.0%) |
| Total | 11 (6.9%) | 23 (10.0%) |
Income Above Poverty by Sex and Age in Blue Eye
According to the poverty statistics in Blue Eye, males aged under 5 years and females aged under 5 years are the age groups that are most secure financially, with 100.0% of males and 100.0% of females in these age groups living above the poverty line.
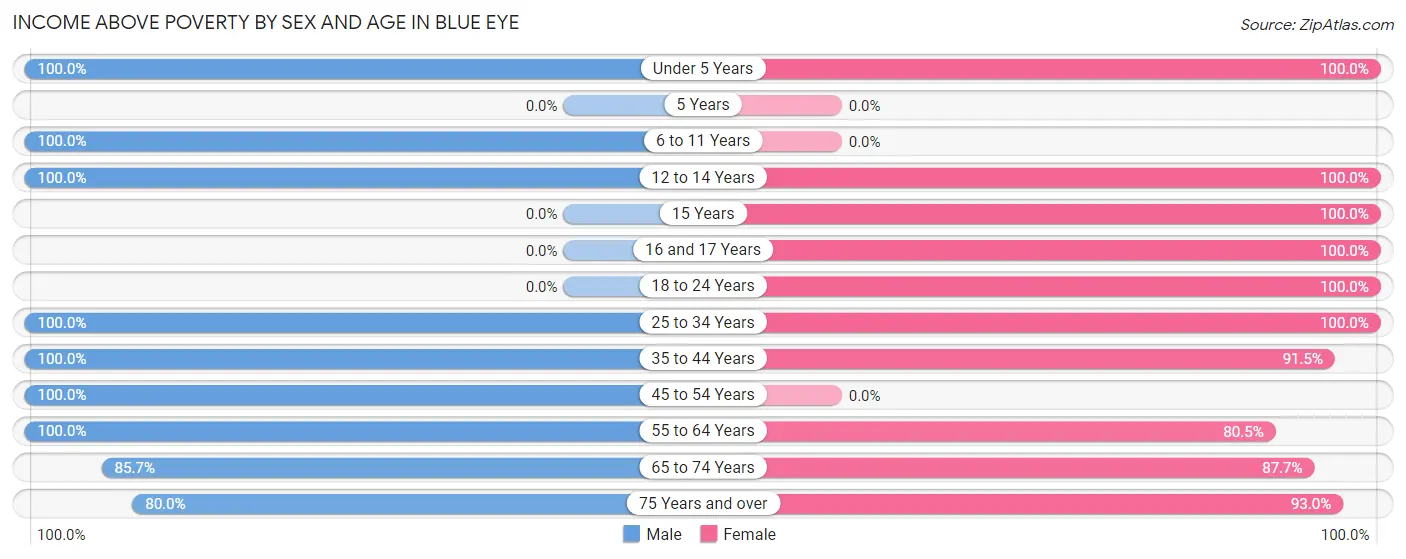
| Age Bracket | Male | Female |
| Under 5 Years | 3 (100.0%) | 15 (100.0%) |
| 5 Years | 0 (0.0%) | 0 (0.0%) |
| 6 to 11 Years | 4 (100.0%) | 0 (0.0%) |
| 12 to 14 Years | 5 (100.0%) | 9 (100.0%) |
| 15 Years | 0 (0.0%) | 2 (100.0%) |
| 16 and 17 Years | 0 (0.0%) | 2 (100.0%) |
| 18 to 24 Years | 0 (0.0%) | 4 (100.0%) |
| 25 to 34 Years | 2 (100.0%) | 2 (100.0%) |
| 35 to 44 Years | 10 (100.0%) | 43 (91.5%) |
| 45 to 54 Years | 1 (100.0%) | 0 (0.0%) |
| 55 to 64 Years | 65 (100.0%) | 33 (80.5%) |
| 65 to 74 Years | 42 (85.7%) | 57 (87.7%) |
| 75 Years and over | 16 (80.0%) | 40 (93.0%) |
| Total | 148 (93.1%) | 207 (90.0%) |
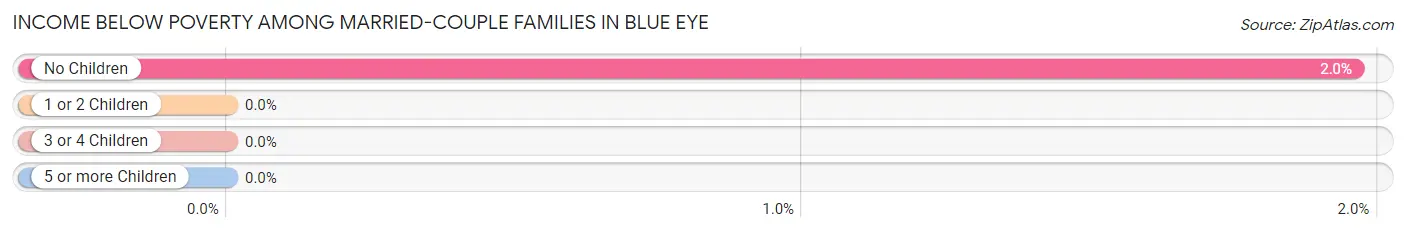
Income Below Poverty Among Married-Couple Families in Blue Eye
The poverty statistics for married-couple families in Blue Eye show that 1.6% or 1 of the total 63 families live below the poverty line. Families with no children have the highest poverty rate of 2.0%, comprising of 1 families. On the other hand, families with 1 or 2 children have the lowest poverty rate of 0.0%, which includes 0 families.
| Children | Above Poverty | Below Poverty |
| No Children | 50 (98.0%) | 1 (2.0%) |
| 1 or 2 Children | 12 (100.0%) | 0 (0.0%) |
| 3 or 4 Children | 0 (0.0%) | 0 (0.0%) |
| 5 or more Children | 0 (0.0%) | 0 (0.0%) |
| Total | 62 (98.4%) | 1 (1.6%) |
Income Below Poverty Among Single-Parent Households in Blue Eye
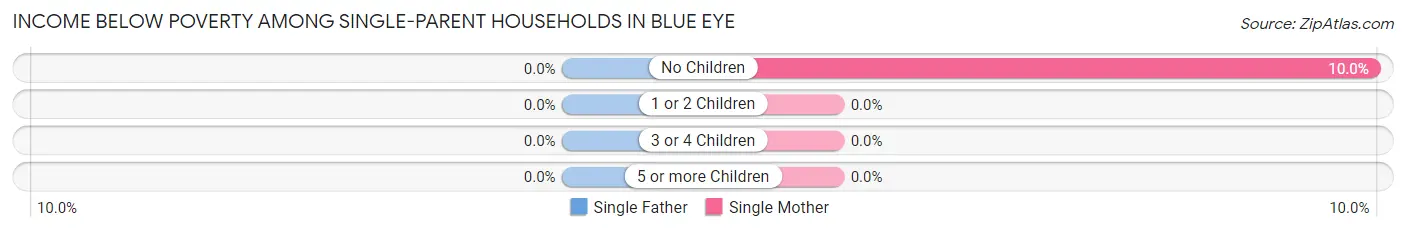
| Children | Single Father | Single Mother |
| No Children | 0 (0.0%) | 2 (10.0%) |
| 1 or 2 Children | 0 (0.0%) | 0 (0.0%) |
| 3 or 4 Children | 0 (0.0%) | 0 (0.0%) |
| 5 or more Children | 0 (0.0%) | 0 (0.0%) |
| Total | 0 (0.0%) | 2 (6.7%) |
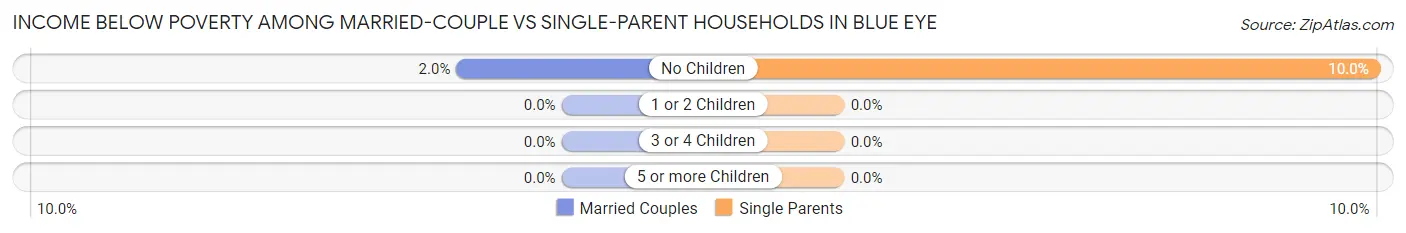
Income Below Poverty Among Married-Couple vs Single-Parent Households in Blue Eye
The poverty data for Blue Eye shows that 1 of the married-couple family households (1.6%) and 2 of the single-parent households (6.7%) are living below the poverty level. Within the married-couple family households, those with no children have the highest poverty rate, with 1 households (2.0%) falling below the poverty line. Among the single-parent households, those with no children have the highest poverty rate, with 2 household (10.0%) living below poverty.
| Children | Married-Couple Families | Single-Parent Households |
| No Children | 1 (2.0%) | 2 (10.0%) |
| 1 or 2 Children | 0 (0.0%) | 0 (0.0%) |
| 3 or 4 Children | 0 (0.0%) | 0 (0.0%) |
| 5 or more Children | 0 (0.0%) | 0 (0.0%) |
| Total | 1 (1.6%) | 2 (6.7%) |
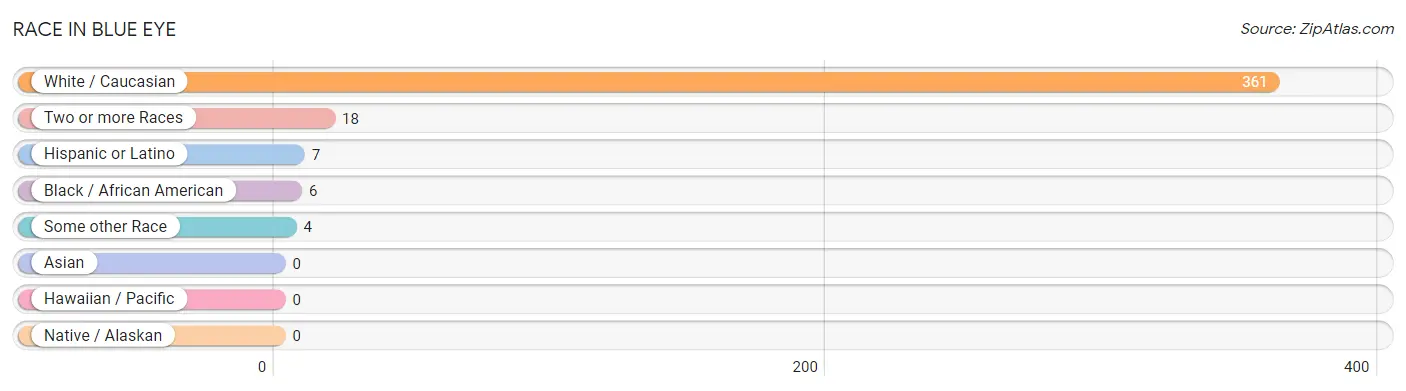
Race in Blue Eye
The most populous races in Blue Eye are White / Caucasian (361 | 92.8%), Two or more Races (18 | 4.6%), and Hispanic or Latino (7 | 1.8%).
| Race | # Population | % Population |
| Asian | 0 | 0.0% |
| Black / African American | 6 | 1.5% |
| Hawaiian / Pacific | 0 | 0.0% |
| Hispanic or Latino | 7 | 1.8% |
| Native / Alaskan | 0 | 0.0% |
| White / Caucasian | 361 | 92.8% |
| Two or more Races | 18 | 4.6% |
| Some other Race | 4 | 1.0% |
| Total | 389 | 100.0% |
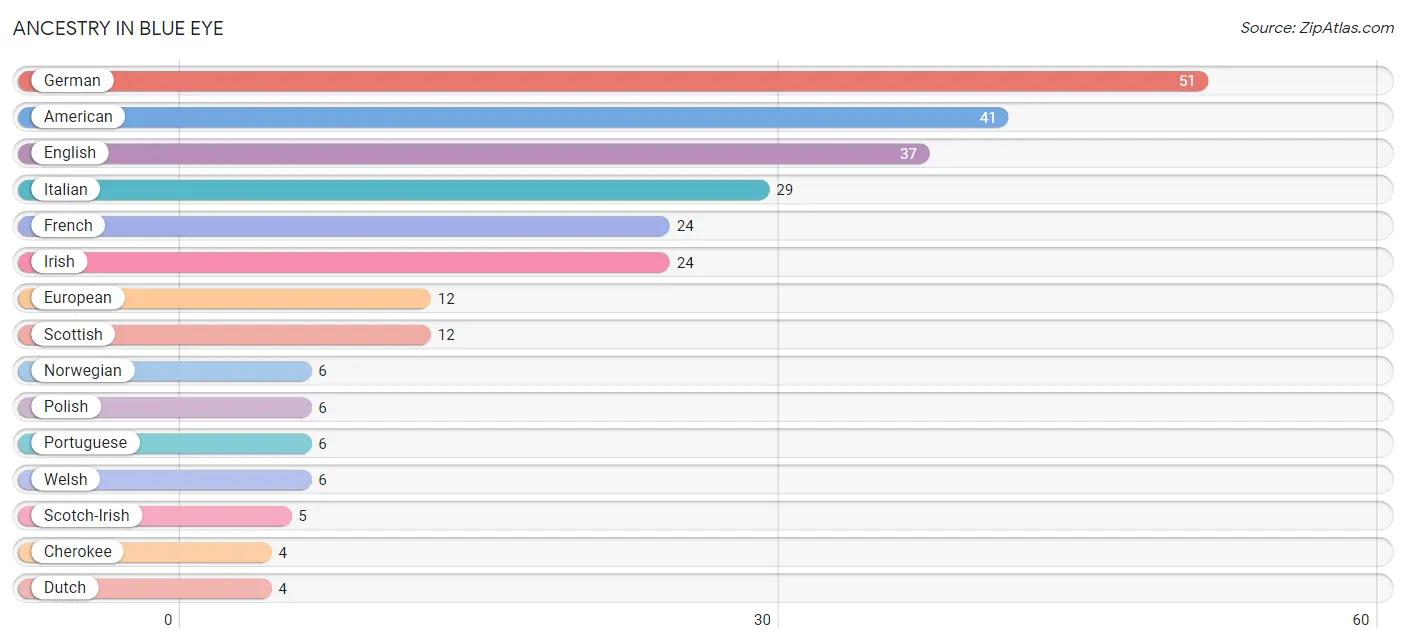
Ancestry in Blue Eye
The most populous ancestries reported in Blue Eye are German (51 | 13.1%), American (41 | 10.5%), English (37 | 9.5%), Italian (29 | 7.5%), and French (24 | 6.2%), together accounting for 46.8% of all Blue Eye residents.
| Ancestry | # Population | % Population |
| American | 41 | 10.5% |
| Arab | 2 | 0.5% |
| Blackfeet | 1 | 0.3% |
| British | 3 | 0.8% |
| Cherokee | 4 | 1.0% |
| Croatian | 2 | 0.5% |
| Danish | 1 | 0.3% |
| Dutch | 4 | 1.0% |
| English | 37 | 9.5% |
| European | 12 | 3.1% |
| French | 24 | 6.2% |
| French Canadian | 1 | 0.3% |
| German | 51 | 13.1% |
| Irish | 24 | 6.2% |
| Italian | 29 | 7.5% |
| Lebanese | 2 | 0.5% |
| Mexican | 4 | 1.0% |
| Norwegian | 6 | 1.5% |
| Polish | 6 | 1.5% |
| Portuguese | 6 | 1.5% |
| Puerto Rican | 3 | 0.8% |
| Scotch-Irish | 5 | 1.3% |
| Scottish | 12 | 3.1% |
| Slavic | 2 | 0.5% |
| Swedish | 2 | 0.5% |
| Swiss | 1 | 0.3% |
| Welsh | 6 | 1.5% | View All 27 Rows |
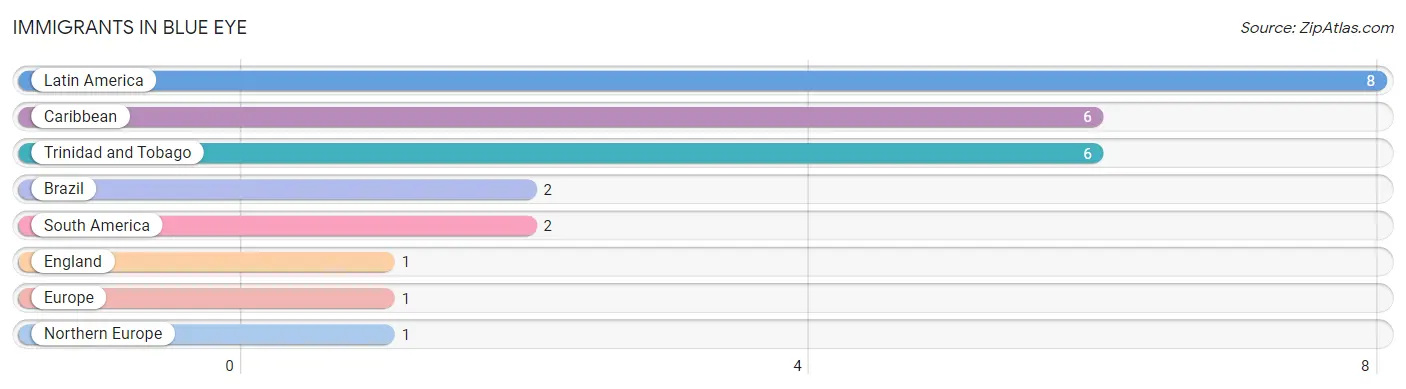
Immigrants in Blue Eye
The most numerous immigrant groups reported in Blue Eye came from Latin America (8 | 2.1%), Caribbean (6 | 1.5%), Trinidad and Tobago (6 | 1.5%), Brazil (2 | 0.5%), and South America (2 | 0.5%), together accounting for 6.2% of all Blue Eye residents.
| Immigration Origin | # Population | % Population |
| Brazil | 2 | 0.5% |
| Caribbean | 6 | 1.5% |
| England | 1 | 0.3% |
| Europe | 1 | 0.3% |
| Latin America | 8 | 2.1% |
| Northern Europe | 1 | 0.3% |
| South America | 2 | 0.5% |
| Trinidad and Tobago | 6 | 1.5% | View All 8 Rows |
Sex and Age in Blue Eye
Sex and Age in Blue Eye
The most populous age groups in Blue Eye are 60 to 64 Years (63 | 39.6%) for men and 35 to 39 Years (42 | 18.3%) for women.
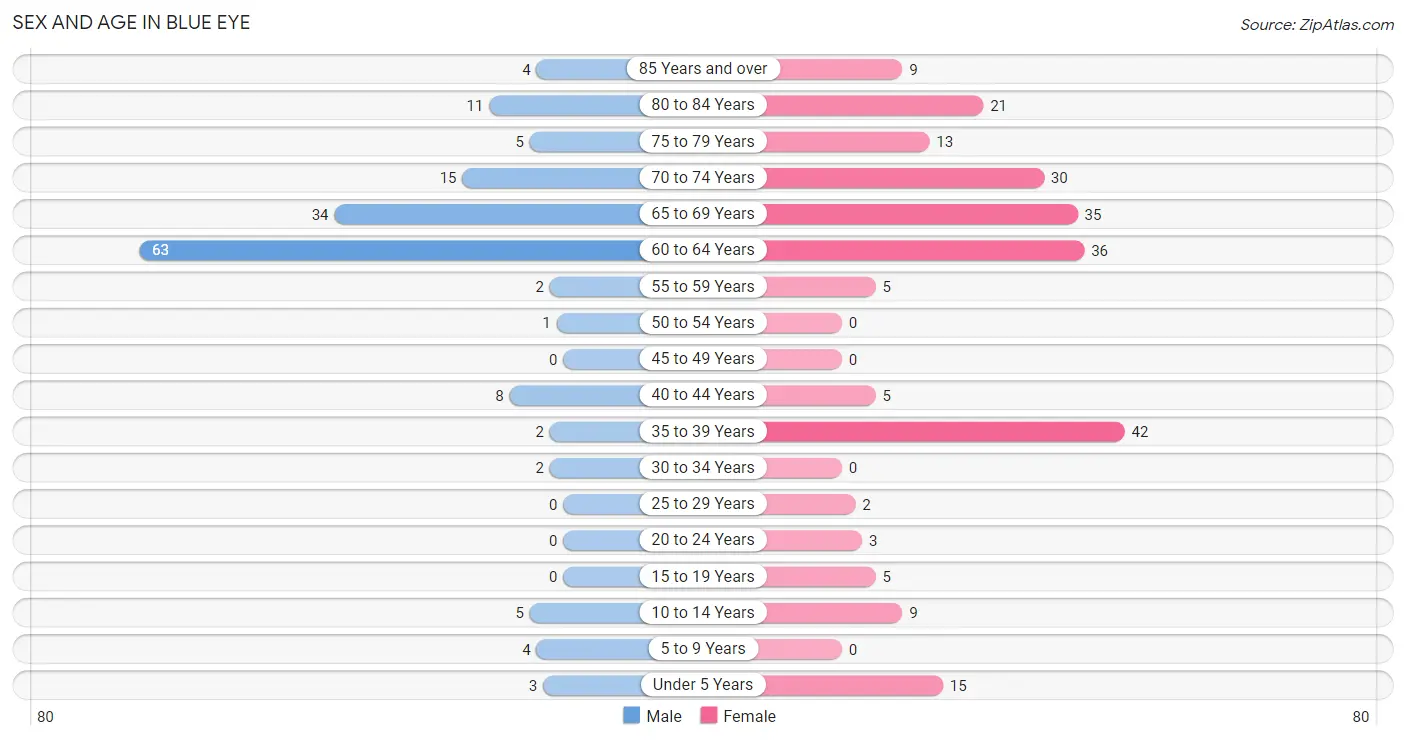
| Age Bracket | Male | Female |
| Under 5 Years | 3 (1.9%) | 15 (6.5%) |
| 5 to 9 Years | 4 (2.5%) | 0 (0.0%) |
| 10 to 14 Years | 5 (3.1%) | 9 (3.9%) |
| 15 to 19 Years | 0 (0.0%) | 5 (2.2%) |
| 20 to 24 Years | 0 (0.0%) | 3 (1.3%) |
| 25 to 29 Years | 0 (0.0%) | 2 (0.9%) |
| 30 to 34 Years | 2 (1.3%) | 0 (0.0%) |
| 35 to 39 Years | 2 (1.3%) | 42 (18.3%) |
| 40 to 44 Years | 8 (5.0%) | 5 (2.2%) |
| 45 to 49 Years | 0 (0.0%) | 0 (0.0%) |
| 50 to 54 Years | 1 (0.6%) | 0 (0.0%) |
| 55 to 59 Years | 2 (1.3%) | 5 (2.2%) |
| 60 to 64 Years | 63 (39.6%) | 36 (15.7%) |
| 65 to 69 Years | 34 (21.4%) | 35 (15.2%) |
| 70 to 74 Years | 15 (9.4%) | 30 (13.0%) |
| 75 to 79 Years | 5 (3.1%) | 13 (5.7%) |
| 80 to 84 Years | 11 (6.9%) | 21 (9.1%) |
| 85 Years and over | 4 (2.5%) | 9 (3.9%) |
| Total | 159 (100.0%) | 230 (100.0%) |
Families and Households in Blue Eye
Median Family Size in Blue Eye
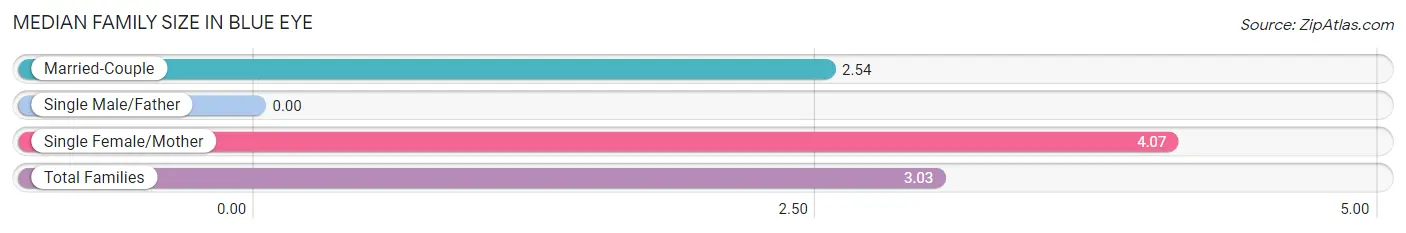
| Family Type | # Families | Family Size |
| Married-Couple | 63 (67.7%) | 2.54 |
| Single Male/Father | 0 (0.0%) | - |
| Single Female/Mother | 30 (32.3%) | 4.07 |
| Total Families | 93 (100.0%) | 3.03 |
Median Household Size in Blue Eye
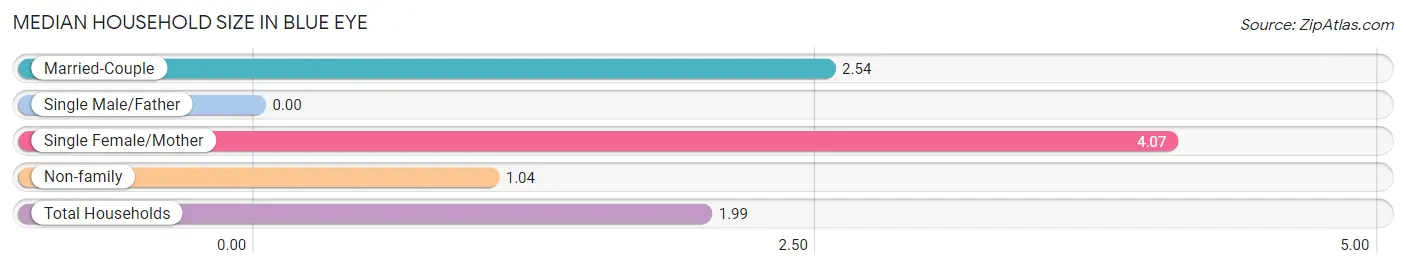
| Household Type | # Households | Household Size |
| Married-Couple | 63 (32.5%) | 2.54 |
| Single Male/Father | 0 (0.0%) | - |
| Single Female/Mother | 30 (15.5%) | 4.07 |
| Non-family | 101 (52.1%) | 1.04 |
| Total Households | 194 (100.0%) | 1.99 |
Household Size by Marriage Status in Blue Eye
Out of a total of 194 households in Blue Eye, 93 (47.9%) are family households, while 101 (52.1%) are nonfamily households. The most numerous type of family households are 2-person households, comprising 68, and the most common type of nonfamily households are 1-person households, comprising 94.
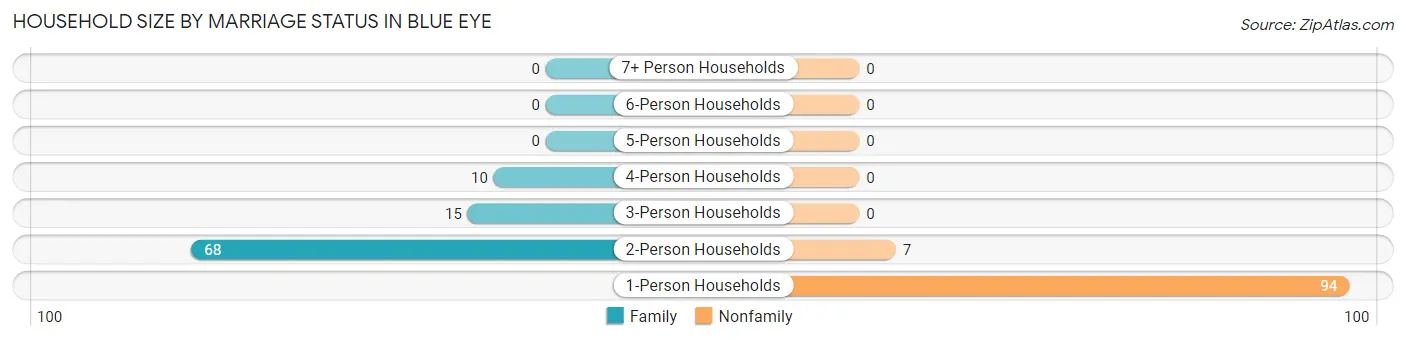
| Household Size | Family Households | Nonfamily Households |
| 1-Person Households | - | 94 (48.4%) |
| 2-Person Households | 68 (35.0%) | 7 (3.6%) |
| 3-Person Households | 15 (7.7%) | 0 (0.0%) |
| 4-Person Households | 10 (5.1%) | 0 (0.0%) |
| 5-Person Households | 0 (0.0%) | 0 (0.0%) |
| 6-Person Households | 0 (0.0%) | 0 (0.0%) |
| 7+ Person Households | 0 (0.0%) | 0 (0.0%) |
| Total | 93 (47.9%) | 101 (52.1%) |
Female Fertility in Blue Eye
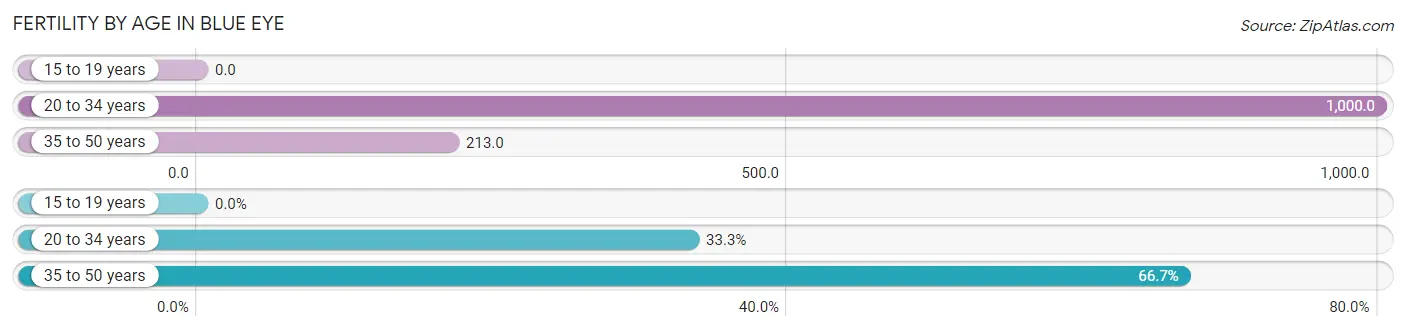
Fertility by Age in Blue Eye
Average fertility rate in Blue Eye is 263.0 births per 1,000 women. Women in the age bracket of 20 to 34 years have the highest fertility rate with 1,000.0 births per 1,000 women. Women in the age bracket of 35 to 50 years acount for 66.7% of all women with births.
| Age Bracket | Women with Births | Births / 1,000 Women |
| 15 to 19 years | 0 (0.0%) | 0.0 |
| 20 to 34 years | 5 (33.3%) | 1,000.0 |
| 35 to 50 years | 10 (66.7%) | 213.0 |
| Total | 15 (100.0%) | 263.0 |
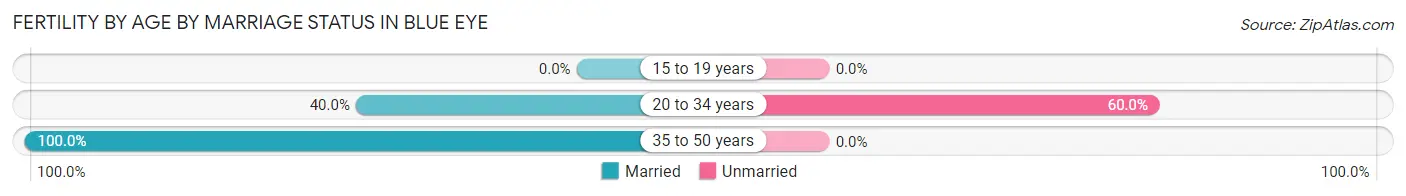
Fertility by Age by Marriage Status in Blue Eye
80.0% of women with births (15) in Blue Eye are married. The highest percentage of unmarried women with births falls into 20 to 34 years age bracket with 60.0% of them unmarried at the time of birth, while the lowest percentage of unmarried women with births belong to 35 to 50 years age bracket with 0.0% of them unmarried.
| Age Bracket | Married | Unmarried |
| 15 to 19 years | 0 (0.0%) | 0 (0.0%) |
| 20 to 34 years | 2 (40.0%) | 3 (60.0%) |
| 35 to 50 years | 10 (100.0%) | 0 (0.0%) |
| Total | 12 (80.0%) | 3 (20.0%) |
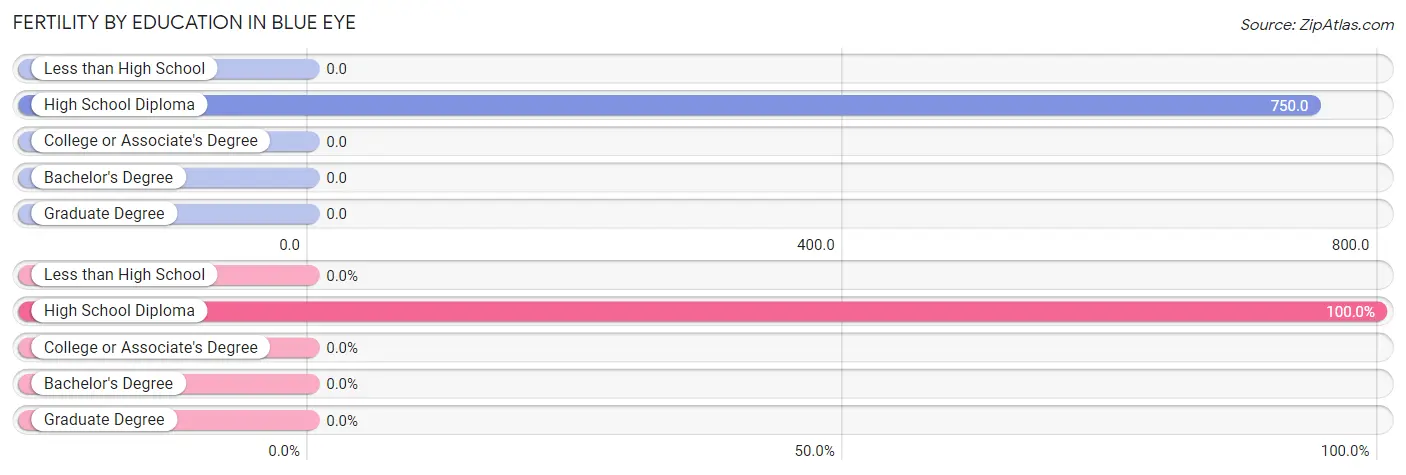
Fertility by Education in Blue Eye
| Educational Attainment | Women with Births | Births / 1,000 Women |
| Less than High School | 0 (0.0%) | 0.0 |
| High School Diploma | 15 (100.0%) | 750.0 |
| College or Associate's Degree | 0 (0.0%) | 0.0 |
| Bachelor's Degree | 0 (0.0%) | 0.0 |
| Graduate Degree | 0 (0.0%) | 0.0 |
| Total | 15 (100.0%) | 263.0 |
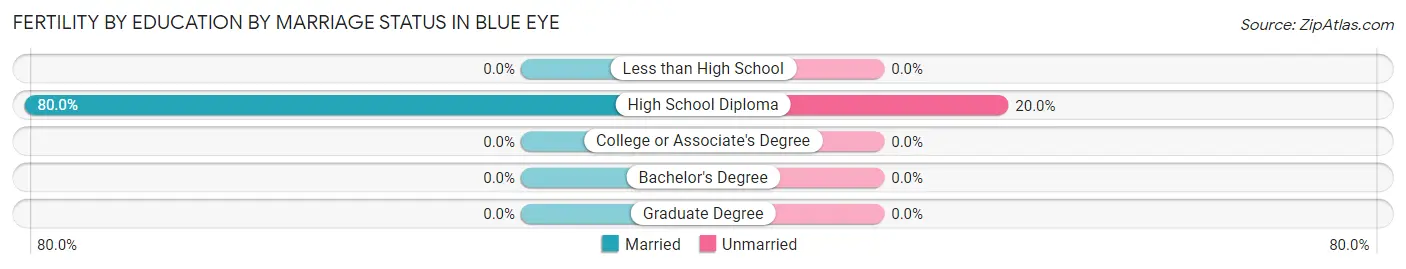
Fertility by Education by Marriage Status in Blue Eye
20.0% of women with births in Blue Eye are unmarried. Women with the educational attainment of high school diploma are most likely to be married with 80.0% of them married at childbirth, while women with the educational attainment of high school diploma are least likely to be married with 20.0% of them unmarried at childbirth.
| Educational Attainment | Married | Unmarried |
| Less than High School | 0 (0.0%) | 0 (0.0%) |
| High School Diploma | 12 (80.0%) | 3 (20.0%) |
| College or Associate's Degree | 0 (0.0%) | 0 (0.0%) |
| Bachelor's Degree | 0 (0.0%) | 0 (0.0%) |
| Graduate Degree | 0 (0.0%) | 0 (0.0%) |
| Total | 12 (80.0%) | 3 (20.0%) |
Employment Characteristics in Blue Eye
Employment by Class of Employer in Blue Eye
Among the 121 employed individuals in Blue Eye, not-for-profit organizations (56 | 46.3%), private company employees (45 | 37.2%), and self-employed (not incorporated) (8 | 6.6%) make up the most common classes of employment.
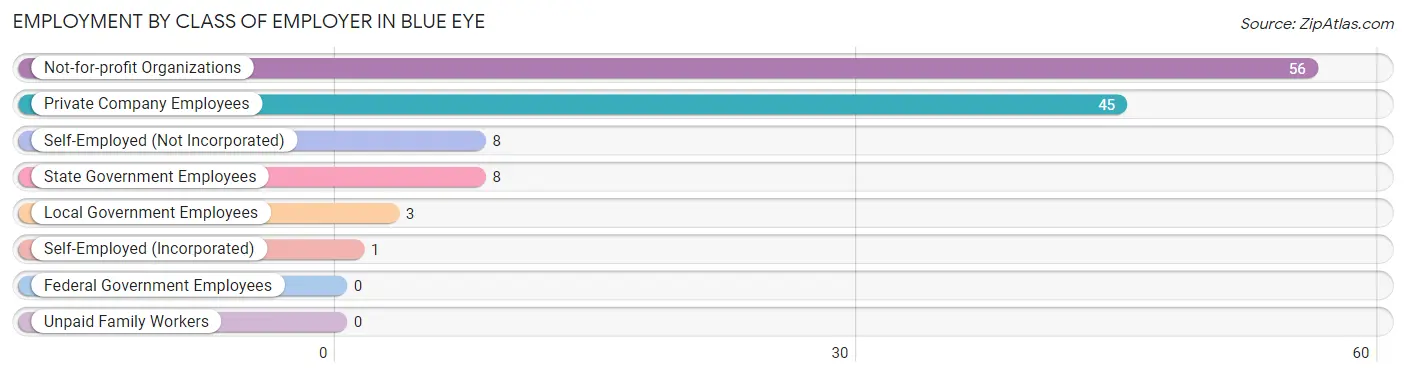
| Employer Class | # Employees | % Employees |
| Private Company Employees | 45 | 37.2% |
| Self-Employed (Incorporated) | 1 | 0.8% |
| Self-Employed (Not Incorporated) | 8 | 6.6% |
| Not-for-profit Organizations | 56 | 46.3% |
| Local Government Employees | 3 | 2.5% |
| State Government Employees | 8 | 6.6% |
| Federal Government Employees | 0 | 0.0% |
| Unpaid Family Workers | 0 | 0.0% |
| Total | 121 | 100.0% |
Employment Status by Age in Blue Eye
According to the labor force statistics for Blue Eye, out of the total population over 16 years of age (351), 37.3% or 131 individuals are in the labor force, with 5.3% or 7 of them unemployed. The age group with the highest labor force participation rate is 20 to 24 years, with 100.0% or 3 individuals in the labor force. Within the labor force, the 75 years and over age range has the highest percentage of unemployed individuals, with 22.2% or 2 of them being unemployed.
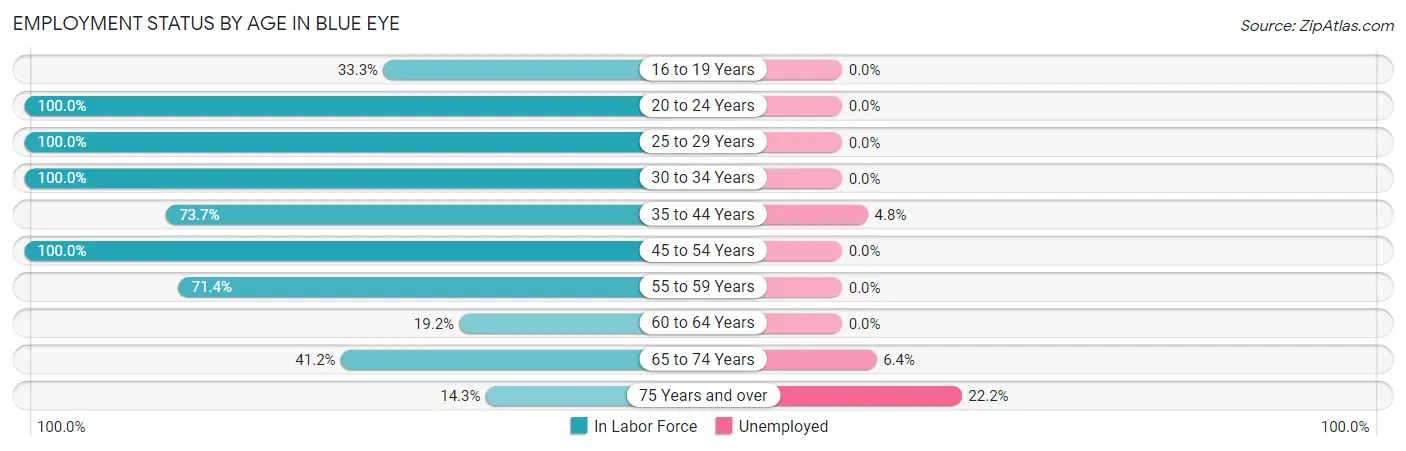
| Age Bracket | In Labor Force | Unemployed |
| 16 to 19 Years | 1 (33.3%) | 0 (0.0%) |
| 20 to 24 Years | 3 (100.0%) | 0 (0.0%) |
| 25 to 29 Years | 2 (100.0%) | 0 (0.0%) |
| 30 to 34 Years | 2 (100.0%) | 0 (0.0%) |
| 35 to 44 Years | 42 (73.7%) | 2 (4.8%) |
| 45 to 54 Years | 1 (100.0%) | 0 (0.0%) |
| 55 to 59 Years | 5 (71.4%) | 0 (0.0%) |
| 60 to 64 Years | 19 (19.2%) | 0 (0.0%) |
| 65 to 74 Years | 47 (41.2%) | 3 (6.4%) |
| 75 Years and over | 9 (14.3%) | 2 (22.2%) |
| Total | 131 (37.3%) | 7 (5.3%) |
Employment Status by Educational Attainment in Blue Eye
According to labor force statistics for Blue Eye, 42.3% of individuals (71) out of the total population between 25 and 64 years of age (168) are in the labor force, with 2.8% or 2 of them being unemployed. The group with the highest labor force participation rate are those with the educational attainment of bachelor's degree or higher, with 100.0% or 2 individuals in the labor force. Within the labor force, individuals with bachelor's degree or higher education have the highest percentage of unemployment, with 100.0% or 2 of them being unemployed.
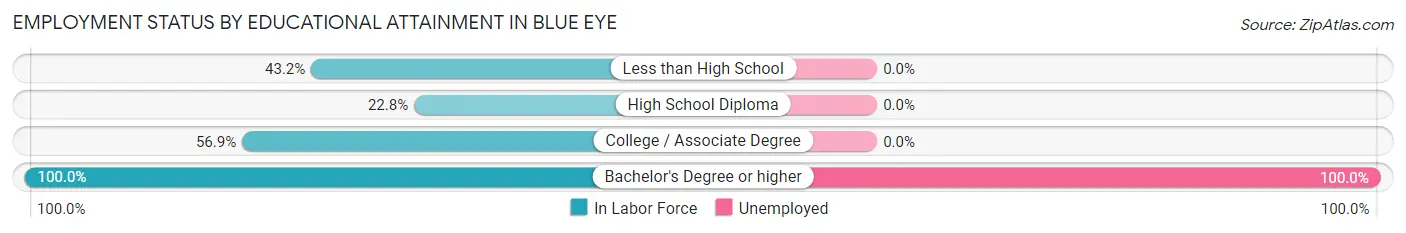
| Educational Attainment | In Labor Force | Unemployed |
| Less than High School | 19 (43.2%) | 0 (0.0%) |
| High School Diploma | 13 (22.8%) | 0 (0.0%) |
| College / Associate Degree | 37 (56.9%) | 0 (0.0%) |
| Bachelor's Degree or higher | 2 (100.0%) | 2 (100.0%) |
| Total | 71 (42.3%) | 5 (2.8%) |
Employment Occupations by Sex in Blue Eye
Management, Business, Science and Arts Occupations
The most common Management, Business, Science and Arts occupations in Blue Eye are Community & Social Service (38 | 30.6%), Computers, Engineering & Science (19 | 15.3%), Computers & Mathematics (19 | 15.3%), Education, Arts & Media (19 | 15.3%), and Education Instruction & Library (12 | 9.7%).
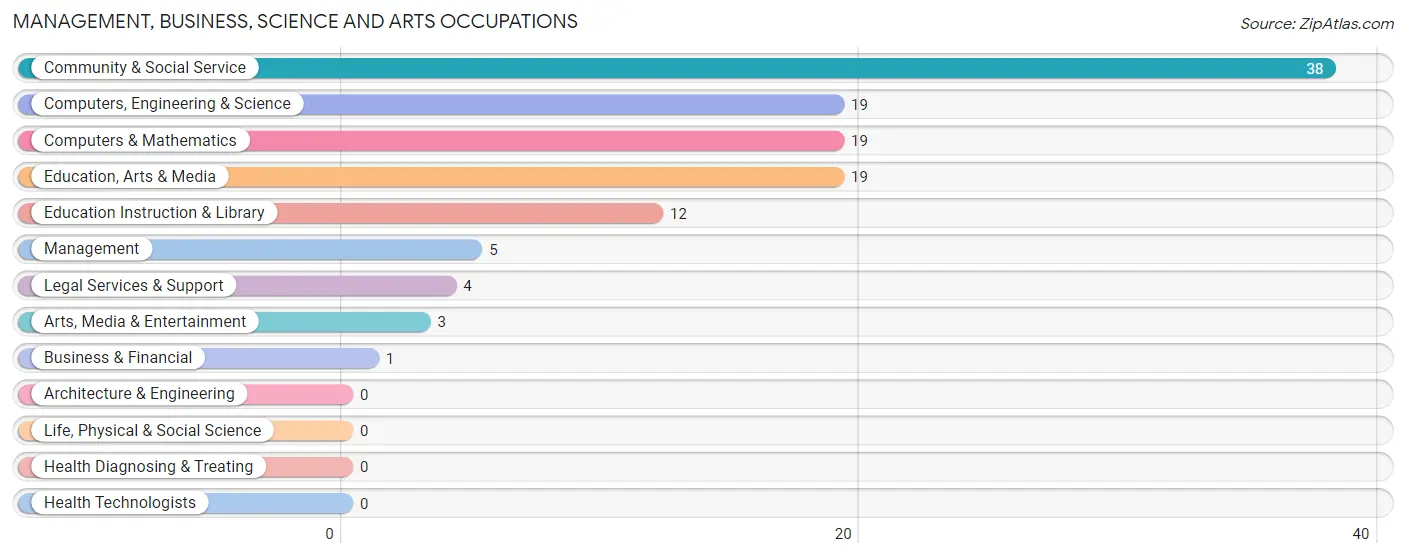
Management, Business, Science and Arts Occupations by Sex
Within the Management, Business, Science and Arts occupations in Blue Eye, the most male-oriented occupations are Computers, Engineering & Science (100.0%), Computers & Mathematics (100.0%), and Arts, Media & Entertainment (100.0%), while the most female-oriented occupations are Management (100.0%), Business & Financial (100.0%), and Legal Services & Support (100.0%).
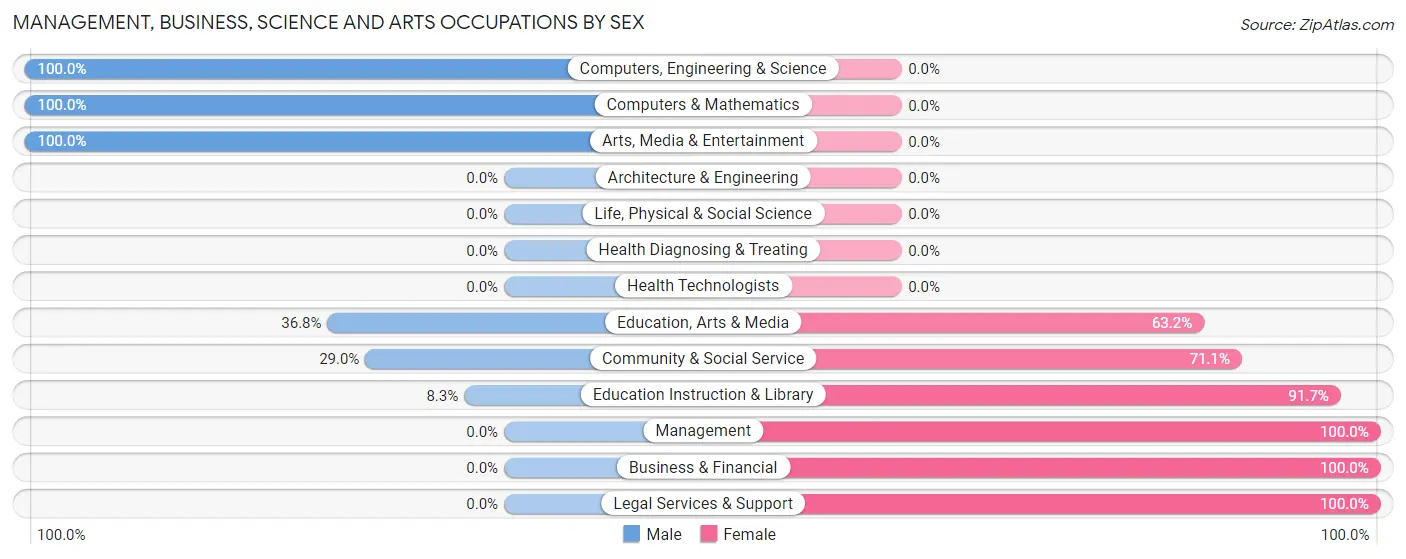
| Occupation | Male | Female |
| Management | 0 (0.0%) | 5 (100.0%) |
| Business & Financial | 0 (0.0%) | 1 (100.0%) |
| Computers, Engineering & Science | 19 (100.0%) | 0 (0.0%) |
| Computers & Mathematics | 19 (100.0%) | 0 (0.0%) |
| Architecture & Engineering | 0 (0.0%) | 0 (0.0%) |
| Life, Physical & Social Science | 0 (0.0%) | 0 (0.0%) |
| Community & Social Service | 11 (28.9%) | 27 (71.1%) |
| Education, Arts & Media | 7 (36.8%) | 12 (63.2%) |
| Legal Services & Support | 0 (0.0%) | 4 (100.0%) |
| Education Instruction & Library | 1 (8.3%) | 11 (91.7%) |
| Arts, Media & Entertainment | 3 (100.0%) | 0 (0.0%) |
| Health Diagnosing & Treating | 0 (0.0%) | 0 (0.0%) |
| Health Technologists | 0 (0.0%) | 0 (0.0%) |
| Total (Category) | 30 (47.6%) | 33 (52.4%) |
| Total (Overall) | 48 (38.7%) | 76 (61.3%) |
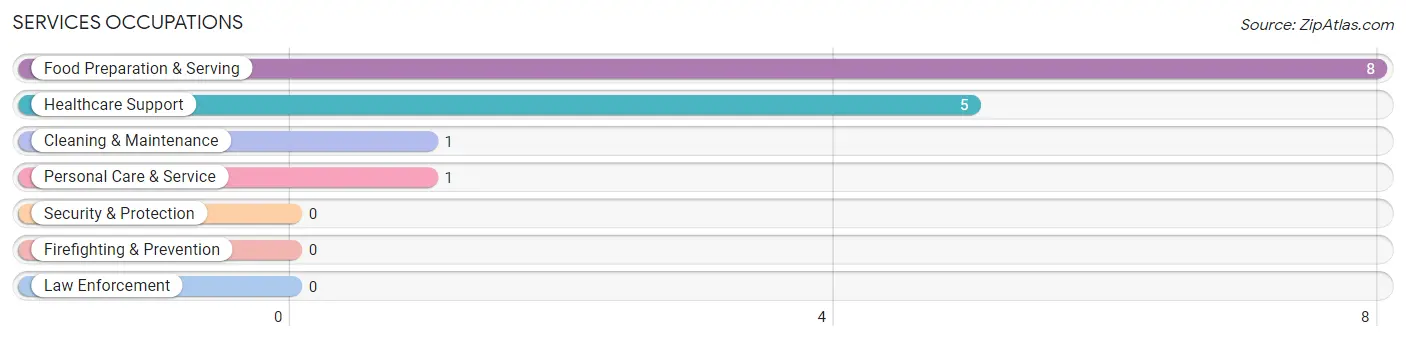
Services Occupations
The most common Services occupations in Blue Eye are Food Preparation & Serving (8 | 6.5%), Healthcare Support (5 | 4.0%), Cleaning & Maintenance (1 | 0.8%), and Personal Care & Service (1 | 0.8%).
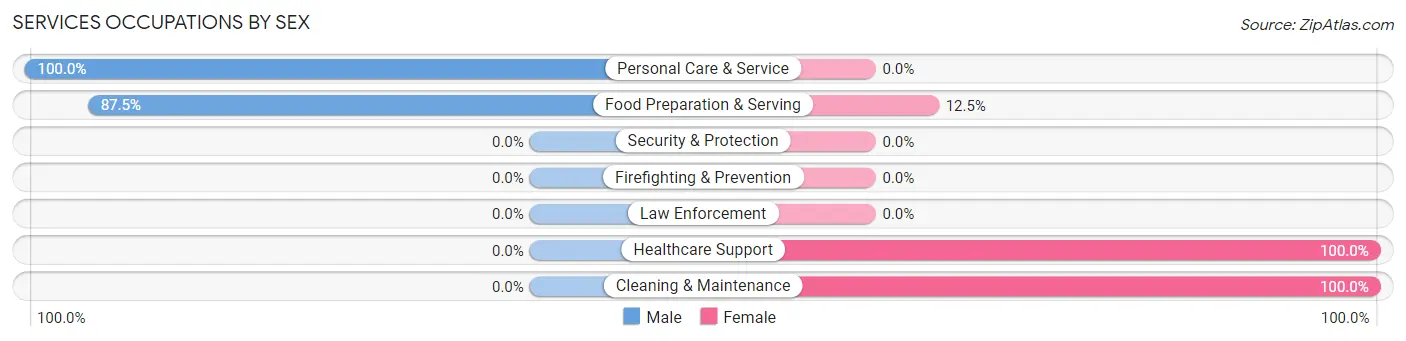
Services Occupations by Sex
Within the Services occupations in Blue Eye, the most male-oriented occupations are Personal Care & Service (100.0%), and Food Preparation & Serving (87.5%), while the most female-oriented occupations are Healthcare Support (100.0%), Cleaning & Maintenance (100.0%), and Food Preparation & Serving (12.5%).
| Occupation | Male | Female |
| Healthcare Support | 0 (0.0%) | 5 (100.0%) |
| Security & Protection | 0 (0.0%) | 0 (0.0%) |
| Firefighting & Prevention | 0 (0.0%) | 0 (0.0%) |
| Law Enforcement | 0 (0.0%) | 0 (0.0%) |
| Food Preparation & Serving | 7 (87.5%) | 1 (12.5%) |
| Cleaning & Maintenance | 0 (0.0%) | 1 (100.0%) |
| Personal Care & Service | 1 (100.0%) | 0 (0.0%) |
| Total (Category) | 8 (53.3%) | 7 (46.7%) |
| Total (Overall) | 48 (38.7%) | 76 (61.3%) |
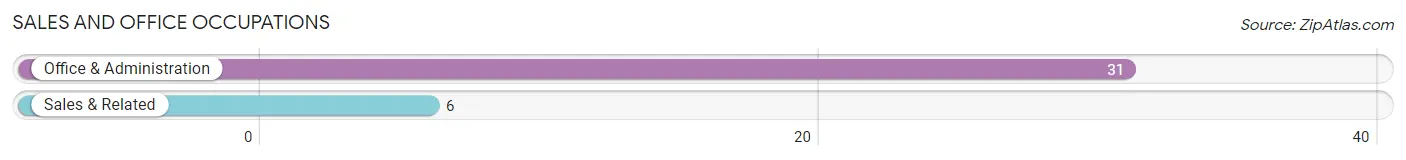
Sales and Office Occupations
The most common Sales and Office occupations in Blue Eye are Office & Administration (31 | 25.0%), and Sales & Related (6 | 4.8%).
Sales and Office Occupations by Sex
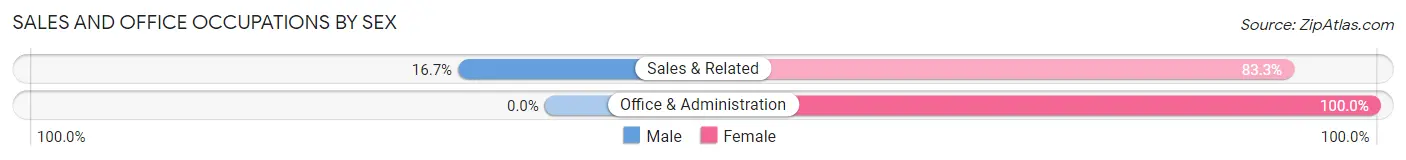
| Occupation | Male | Female |
| Sales & Related | 1 (16.7%) | 5 (83.3%) |
| Office & Administration | 0 (0.0%) | 31 (100.0%) |
| Total (Category) | 1 (2.7%) | 36 (97.3%) |
| Total (Overall) | 48 (38.7%) | 76 (61.3%) |
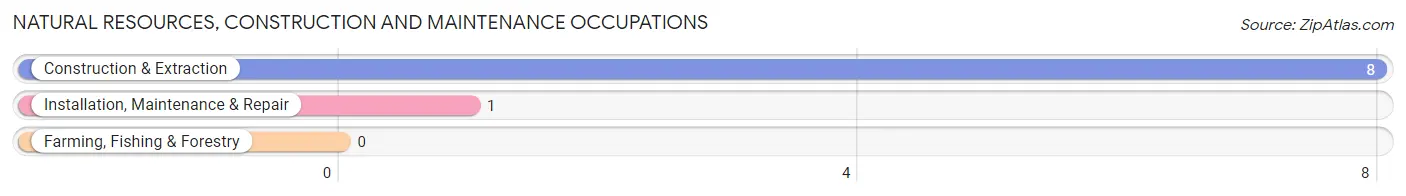
Natural Resources, Construction and Maintenance Occupations
The most common Natural Resources, Construction and Maintenance occupations in Blue Eye are Construction & Extraction (8 | 6.5%), and Installation, Maintenance & Repair (1 | 0.8%).
Natural Resources, Construction and Maintenance Occupations by Sex
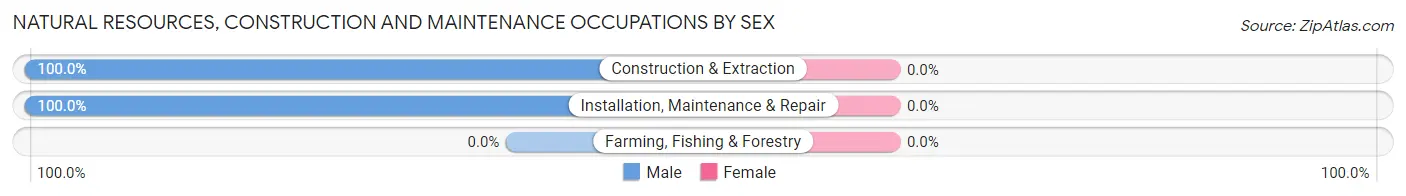
| Occupation | Male | Female |
| Farming, Fishing & Forestry | 0 (0.0%) | 0 (0.0%) |
| Construction & Extraction | 8 (100.0%) | 0 (0.0%) |
| Installation, Maintenance & Repair | 1 (100.0%) | 0 (0.0%) |
| Total (Category) | 9 (100.0%) | 0 (0.0%) |
| Total (Overall) | 48 (38.7%) | 76 (61.3%) |
Production, Transportation and Moving Occupations
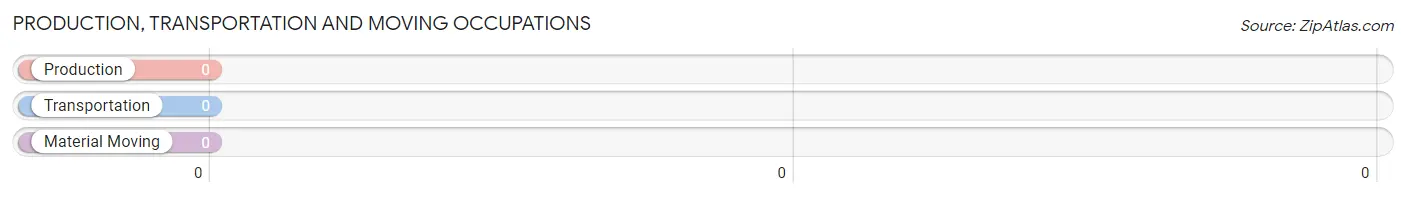
Production, Transportation and Moving Occupations by Sex
| Occupation | Male | Female |
| Production | 0 (0.0%) | 0 (0.0%) |
| Transportation | 0 (0.0%) | 0 (0.0%) |
| Material Moving | 0 (0.0%) | 0 (0.0%) |
| Total (Category) | 0 (0.0%) | 0 (0.0%) |
| Total (Overall) | 48 (38.7%) | 76 (61.3%) |
Employment Industries by Sex in Blue Eye
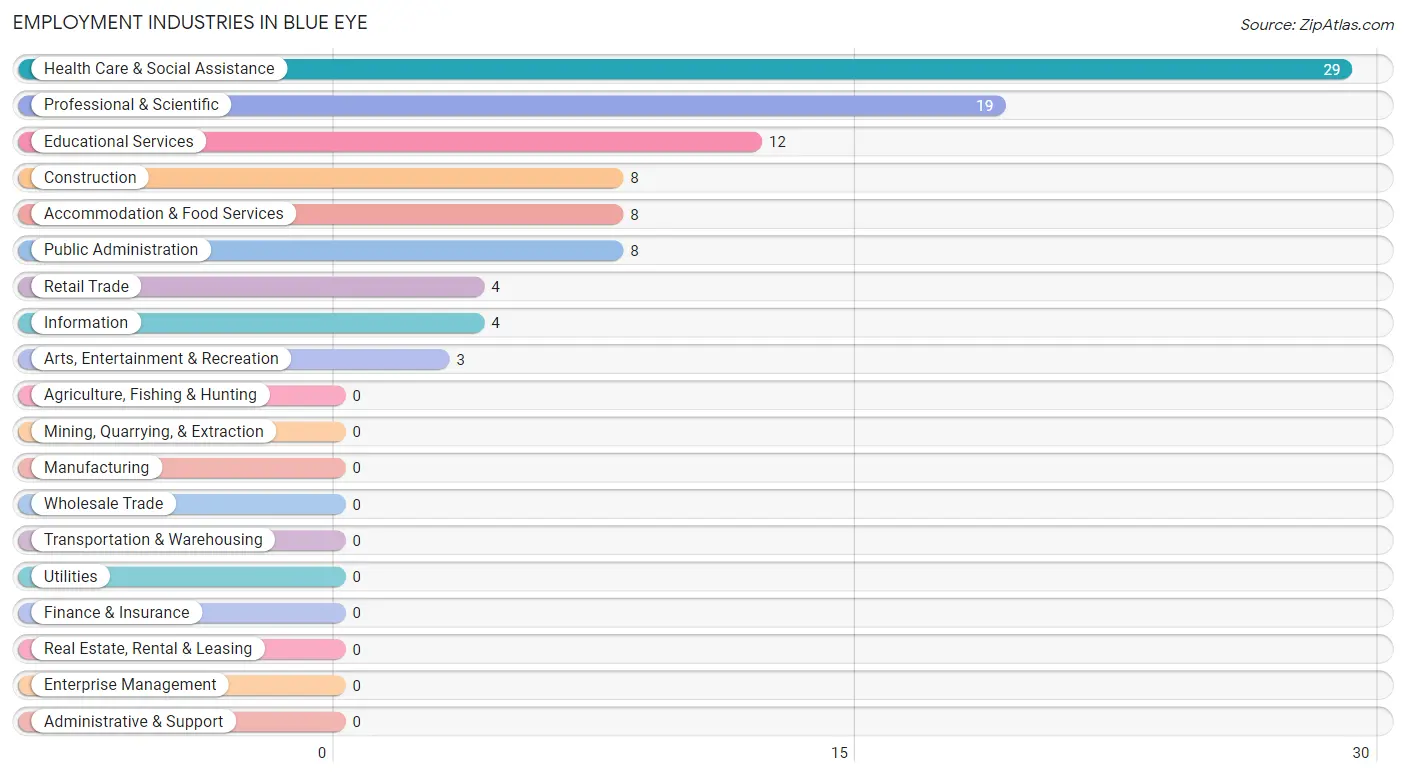
Employment Industries in Blue Eye
The major employment industries in Blue Eye include Health Care & Social Assistance (29 | 23.4%), Professional & Scientific (19 | 15.3%), Educational Services (12 | 9.7%), Construction (8 | 6.5%), and Accommodation & Food Services (8 | 6.5%).
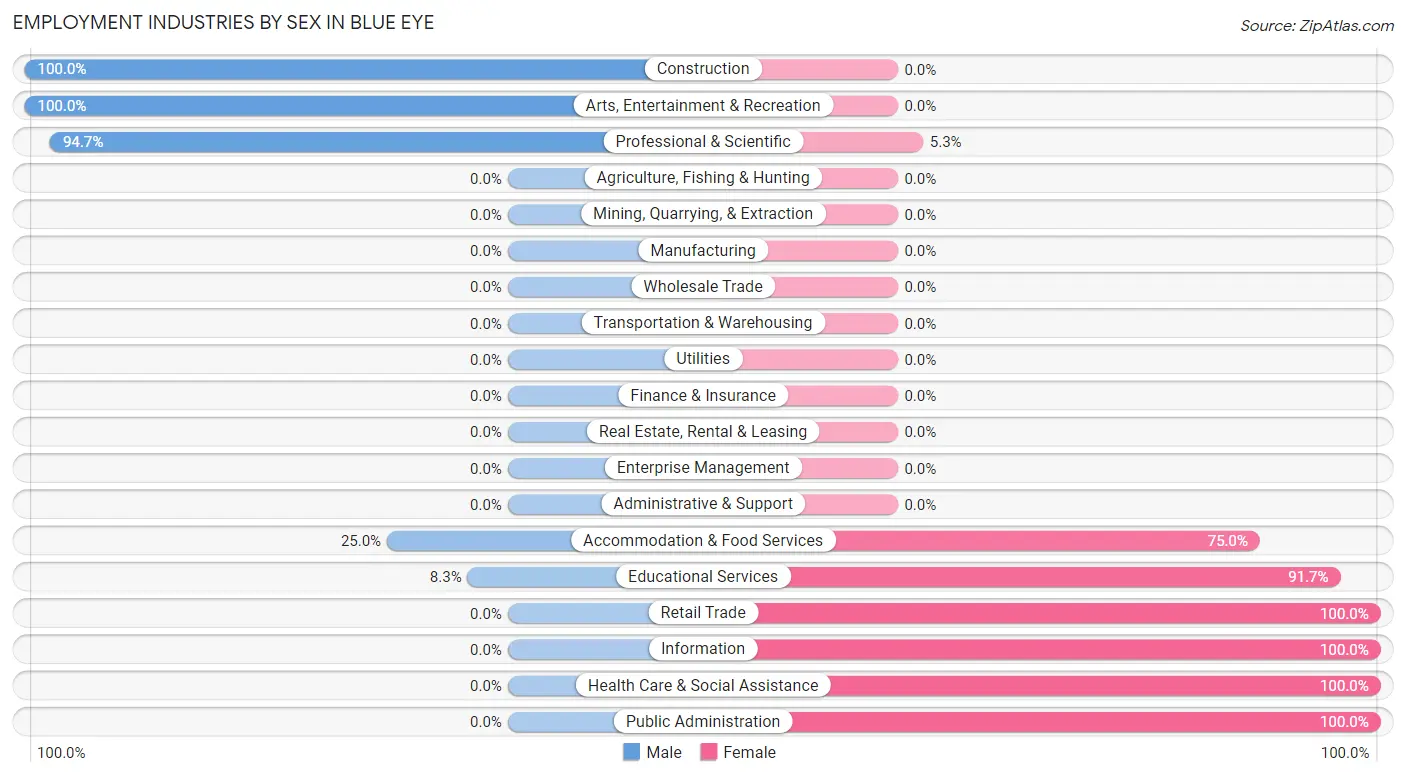
Employment Industries by Sex in Blue Eye
The Blue Eye industries that see more men than women are Construction (100.0%), Arts, Entertainment & Recreation (100.0%), and Professional & Scientific (94.7%), whereas the industries that tend to have a higher number of women are Retail Trade (100.0%), Information (100.0%), and Health Care & Social Assistance (100.0%).
| Industry | Male | Female |
| Agriculture, Fishing & Hunting | 0 (0.0%) | 0 (0.0%) |
| Mining, Quarrying, & Extraction | 0 (0.0%) | 0 (0.0%) |
| Construction | 8 (100.0%) | 0 (0.0%) |
| Manufacturing | 0 (0.0%) | 0 (0.0%) |
| Wholesale Trade | 0 (0.0%) | 0 (0.0%) |
| Retail Trade | 0 (0.0%) | 4 (100.0%) |
| Transportation & Warehousing | 0 (0.0%) | 0 (0.0%) |
| Utilities | 0 (0.0%) | 0 (0.0%) |
| Information | 0 (0.0%) | 4 (100.0%) |
| Finance & Insurance | 0 (0.0%) | 0 (0.0%) |
| Real Estate, Rental & Leasing | 0 (0.0%) | 0 (0.0%) |
| Professional & Scientific | 18 (94.7%) | 1 (5.3%) |
| Enterprise Management | 0 (0.0%) | 0 (0.0%) |
| Administrative & Support | 0 (0.0%) | 0 (0.0%) |
| Educational Services | 1 (8.3%) | 11 (91.7%) |
| Health Care & Social Assistance | 0 (0.0%) | 29 (100.0%) |
| Arts, Entertainment & Recreation | 3 (100.0%) | 0 (0.0%) |
| Accommodation & Food Services | 2 (25.0%) | 6 (75.0%) |
| Public Administration | 0 (0.0%) | 8 (100.0%) |
| Total | 48 (38.7%) | 76 (61.3%) |
Education in Blue Eye
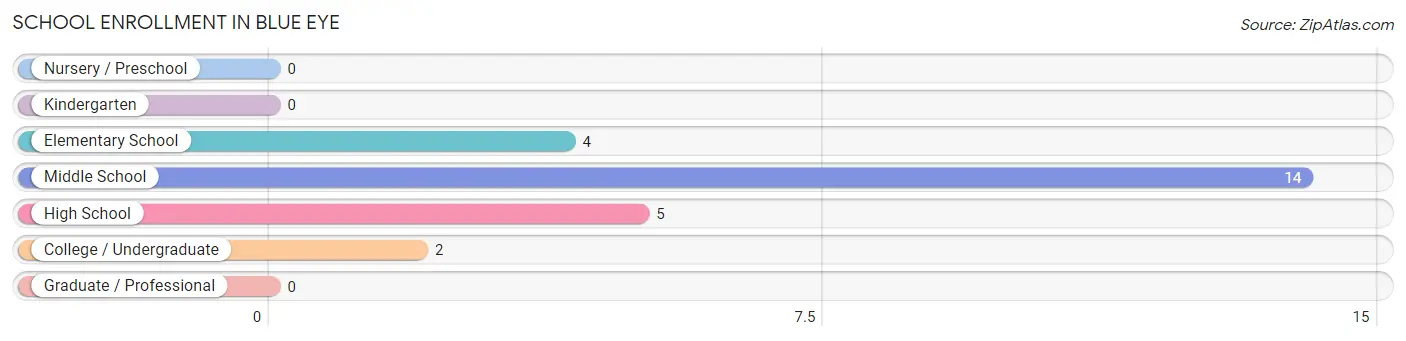
School Enrollment in Blue Eye
The most common levels of schooling among the 25 students in Blue Eye are middle school (14 | 56.0%), high school (5 | 20.0%), and elementary school (4 | 16.0%).
| School Level | # Students | % Students |
| Nursery / Preschool | 0 | 0.0% |
| Kindergarten | 0 | 0.0% |
| Elementary School | 4 | 16.0% |
| Middle School | 14 | 56.0% |
| High School | 5 | 20.0% |
| College / Undergraduate | 2 | 8.0% |
| Graduate / Professional | 0 | 0.0% |
| Total | 25 | 100.0% |
School Enrollment by Age by Funding Source in Blue Eye
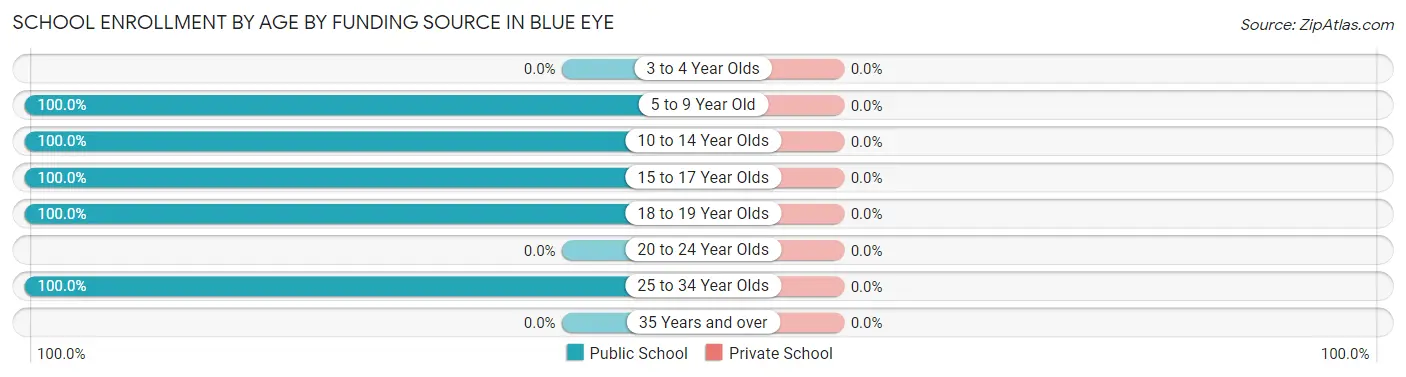
| Age Bracket | Public School | Private School |
| 3 to 4 Year Olds | 0 (0.0%) | 0 (0.0%) |
| 5 to 9 Year Old | 4 (100.0%) | 0 (0.0%) |
| 10 to 14 Year Olds | 14 (100.0%) | 0 (0.0%) |
| 15 to 17 Year Olds | 4 (100.0%) | 0 (0.0%) |
| 18 to 19 Year Olds | 1 (100.0%) | 0 (0.0%) |
| 20 to 24 Year Olds | 0 (0.0%) | 0 (0.0%) |
| 25 to 34 Year Olds | 2 (100.0%) | 0 (0.0%) |
| 35 Years and over | 0 (0.0%) | 0 (0.0%) |
| Total | 25 (100.0%) | 0 (0.0%) |
Educational Attainment by Field of Study in Blue Eye
Social sciences (13 | 26.5%), education (13 | 26.5%), literature & languages (9 | 18.4%), science & technology (4 | 8.2%), and liberal arts & history (4 | 8.2%) are the most common fields of study among 49 individuals in Blue Eye who have obtained a bachelor's degree or higher.
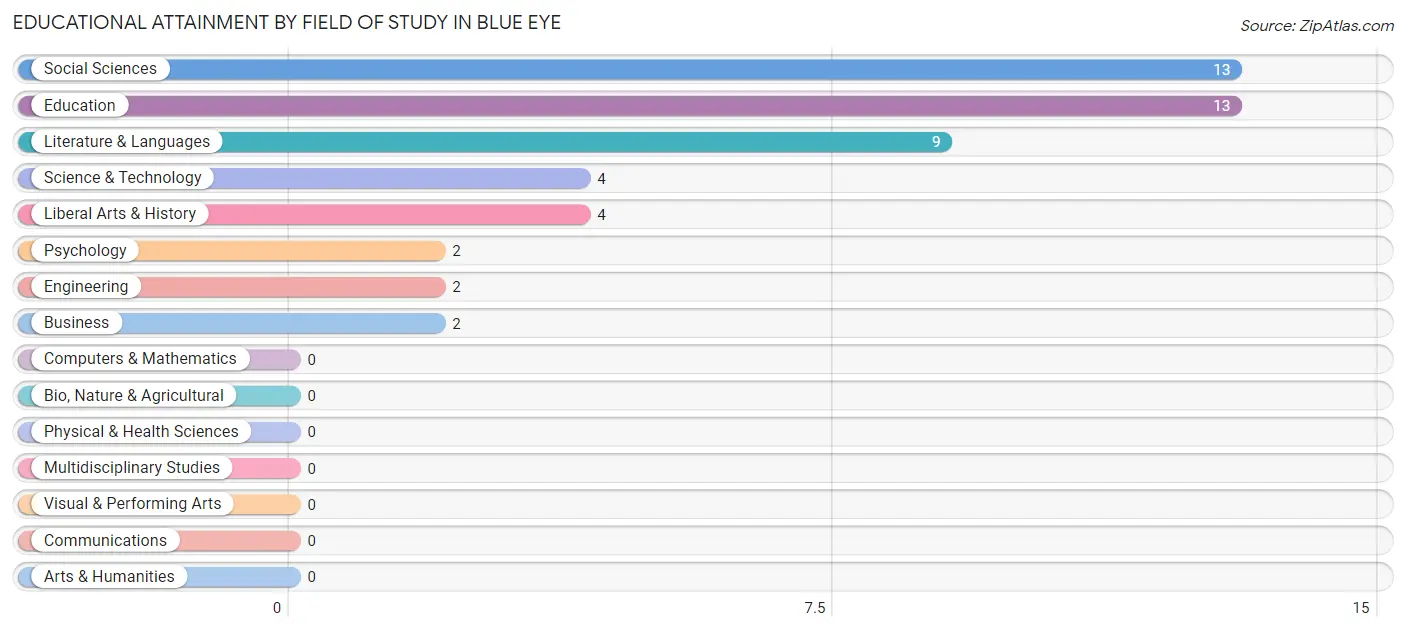
| Field of Study | # Graduates | % Graduates |
| Computers & Mathematics | 0 | 0.0% |
| Bio, Nature & Agricultural | 0 | 0.0% |
| Physical & Health Sciences | 0 | 0.0% |
| Psychology | 2 | 4.1% |
| Social Sciences | 13 | 26.5% |
| Engineering | 2 | 4.1% |
| Multidisciplinary Studies | 0 | 0.0% |
| Science & Technology | 4 | 8.2% |
| Business | 2 | 4.1% |
| Education | 13 | 26.5% |
| Literature & Languages | 9 | 18.4% |
| Liberal Arts & History | 4 | 8.2% |
| Visual & Performing Arts | 0 | 0.0% |
| Communications | 0 | 0.0% |
| Arts & Humanities | 0 | 0.0% |
| Total | 49 | 100.0% |
Transportation & Commute in Blue Eye
Vehicle Availability by Sex in Blue Eye
The most prevalent vehicle ownership categories in Blue Eye are males with 1 vehicle (24, accounting for 50.0%) and females with 1 vehicle (57, making up 32.9%).
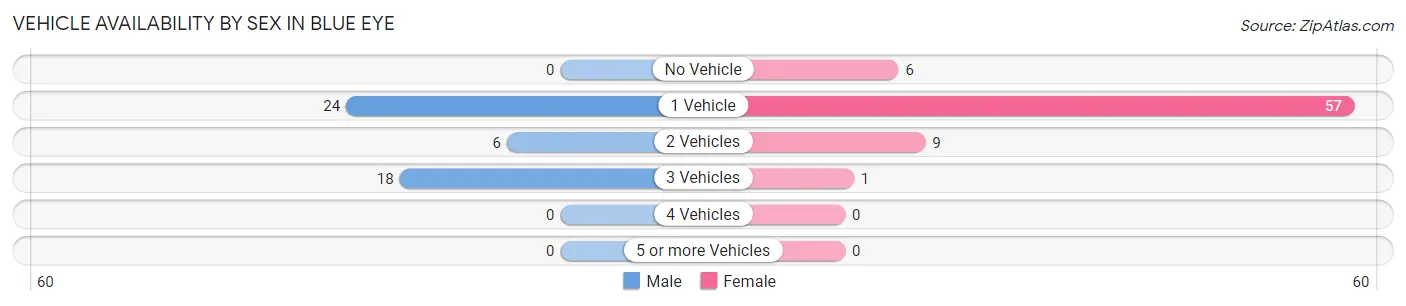
| Vehicles Available | Male | Female |
| No Vehicle | 0 (0.0%) | 6 (8.2%) |
| 1 Vehicle | 24 (50.0%) | 57 (78.1%) |
| 2 Vehicles | 6 (12.5%) | 9 (12.3%) |
| 3 Vehicles | 18 (37.5%) | 1 (1.4%) |
| 4 Vehicles | 0 (0.0%) | 0 (0.0%) |
| 5 or more Vehicles | 0 (0.0%) | 0 (0.0%) |
| Total | 48 (100.0%) | 73 (100.0%) |
Commute Time in Blue Eye
The most frequently occuring commute durations in Blue Eye are 25 to 29 minutes (30 commuters, 34.5%), less than 5 minutes (18 commuters, 20.7%), and 5 to 9 minutes (13 commuters, 14.9%).
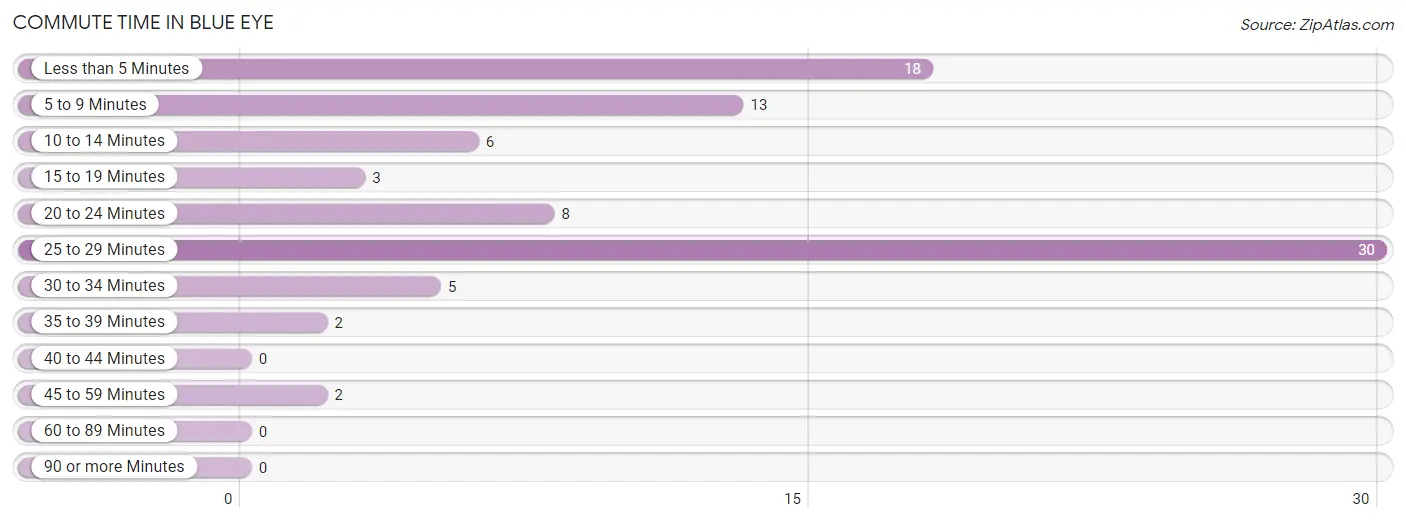
| Commute Time | # Commuters | % Commuters |
| Less than 5 Minutes | 18 | 20.7% |
| 5 to 9 Minutes | 13 | 14.9% |
| 10 to 14 Minutes | 6 | 6.9% |
| 15 to 19 Minutes | 3 | 3.5% |
| 20 to 24 Minutes | 8 | 9.2% |
| 25 to 29 Minutes | 30 | 34.5% |
| 30 to 34 Minutes | 5 | 5.8% |
| 35 to 39 Minutes | 2 | 2.3% |
| 40 to 44 Minutes | 0 | 0.0% |
| 45 to 59 Minutes | 2 | 2.3% |
| 60 to 89 Minutes | 0 | 0.0% |
| 90 or more Minutes | 0 | 0.0% |
Commute Time by Sex in Blue Eye
The most common commute times in Blue Eye are less than 5 minutes (11 commuters, 36.7%) for males and 25 to 29 minutes (29 commuters, 50.9%) for females.
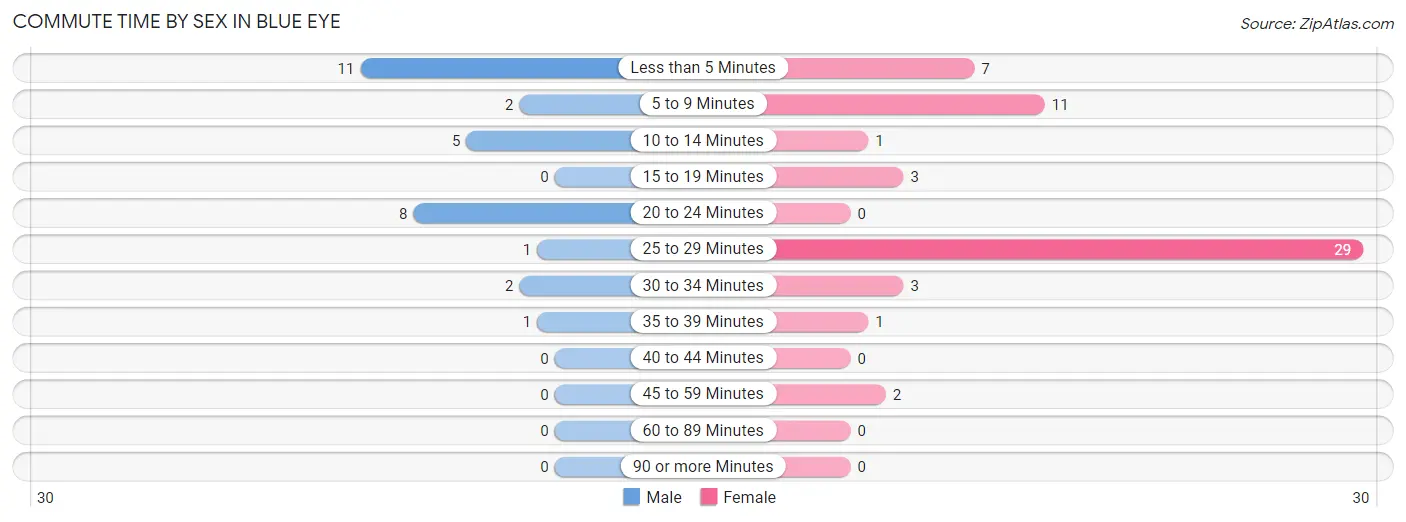
| Commute Time | Male | Female |
| Less than 5 Minutes | 11 (36.7%) | 7 (12.3%) |
| 5 to 9 Minutes | 2 (6.7%) | 11 (19.3%) |
| 10 to 14 Minutes | 5 (16.7%) | 1 (1.8%) |
| 15 to 19 Minutes | 0 (0.0%) | 3 (5.3%) |
| 20 to 24 Minutes | 8 (26.7%) | 0 (0.0%) |
| 25 to 29 Minutes | 1 (3.3%) | 29 (50.9%) |
| 30 to 34 Minutes | 2 (6.7%) | 3 (5.3%) |
| 35 to 39 Minutes | 1 (3.3%) | 1 (1.8%) |
| 40 to 44 Minutes | 0 (0.0%) | 0 (0.0%) |
| 45 to 59 Minutes | 0 (0.0%) | 2 (3.5%) |
| 60 to 89 Minutes | 0 (0.0%) | 0 (0.0%) |
| 90 or more Minutes | 0 (0.0%) | 0 (0.0%) |
Time of Departure to Work by Sex in Blue Eye
The most frequent times of departure to work in Blue Eye are 8:00 AM to 8:29 AM (11, 36.7%) for males and 7:30 AM to 7:59 AM (34, 59.7%) for females.
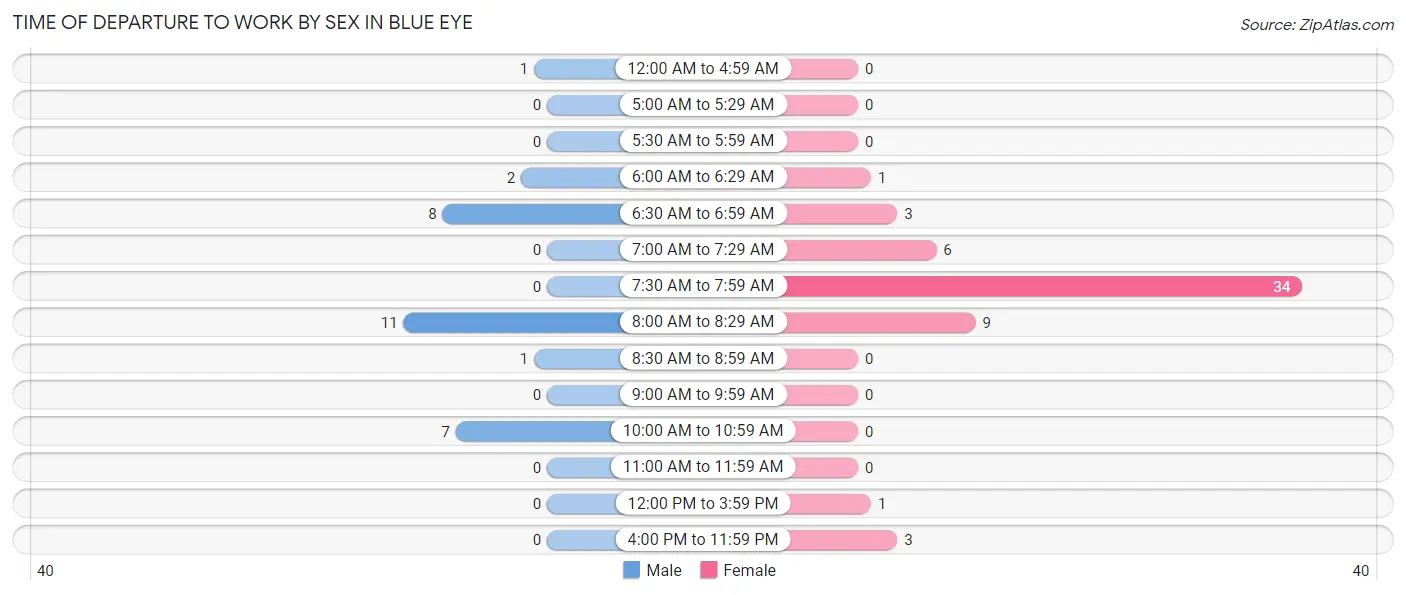
| Time of Departure | Male | Female |
| 12:00 AM to 4:59 AM | 1 (3.3%) | 0 (0.0%) |
| 5:00 AM to 5:29 AM | 0 (0.0%) | 0 (0.0%) |
| 5:30 AM to 5:59 AM | 0 (0.0%) | 0 (0.0%) |
| 6:00 AM to 6:29 AM | 2 (6.7%) | 1 (1.8%) |
| 6:30 AM to 6:59 AM | 8 (26.7%) | 3 (5.3%) |
| 7:00 AM to 7:29 AM | 0 (0.0%) | 6 (10.5%) |
| 7:30 AM to 7:59 AM | 0 (0.0%) | 34 (59.7%) |
| 8:00 AM to 8:29 AM | 11 (36.7%) | 9 (15.8%) |
| 8:30 AM to 8:59 AM | 1 (3.3%) | 0 (0.0%) |
| 9:00 AM to 9:59 AM | 0 (0.0%) | 0 (0.0%) |
| 10:00 AM to 10:59 AM | 7 (23.3%) | 0 (0.0%) |
| 11:00 AM to 11:59 AM | 0 (0.0%) | 0 (0.0%) |
| 12:00 PM to 3:59 PM | 0 (0.0%) | 1 (1.8%) |
| 4:00 PM to 11:59 PM | 0 (0.0%) | 3 (5.3%) |
| Total | 30 (100.0%) | 57 (100.0%) |
Housing Occupancy in Blue Eye
Occupancy by Ownership in Blue Eye
Of the total 194 dwellings in Blue Eye, owner-occupied units account for 109 (56.2%), while renter-occupied units make up 85 (43.8%).
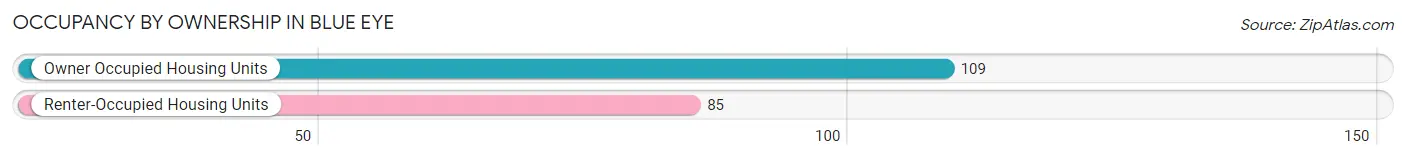
| Occupancy | # Housing Units | % Housing Units |
| Owner Occupied Housing Units | 109 | 56.2% |
| Renter-Occupied Housing Units | 85 | 43.8% |
| Total Occupied Housing Units | 194 | 100.0% |
Occupancy by Household Size in Blue Eye
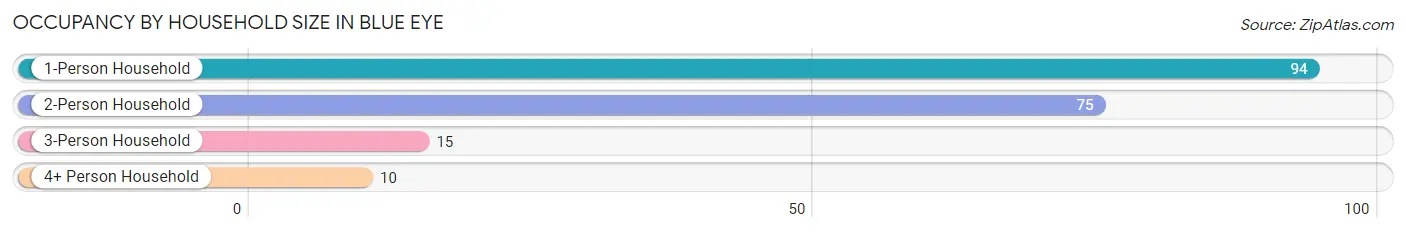
| Household Size | # Housing Units | % Housing Units |
| 1-Person Household | 94 | 48.4% |
| 2-Person Household | 75 | 38.7% |
| 3-Person Household | 15 | 7.7% |
| 4+ Person Household | 10 | 5.1% |
| Total Housing Units | 194 | 100.0% |
Occupancy by Ownership by Household Size in Blue Eye
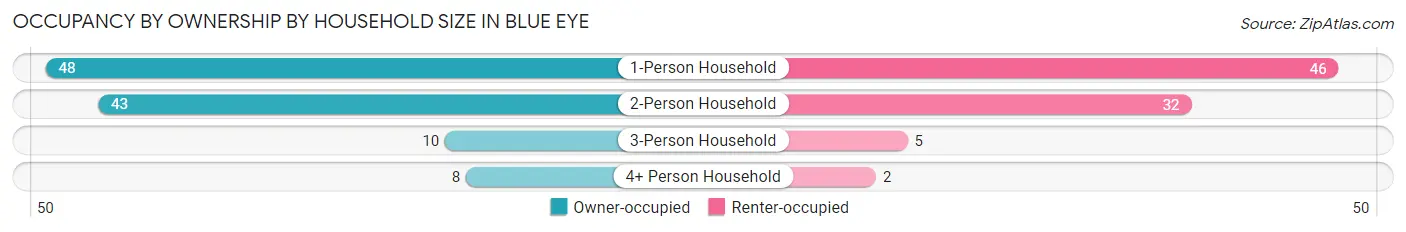
| Household Size | Owner-occupied | Renter-occupied |
| 1-Person Household | 48 (51.1%) | 46 (48.9%) |
| 2-Person Household | 43 (57.3%) | 32 (42.7%) |
| 3-Person Household | 10 (66.7%) | 5 (33.3%) |
| 4+ Person Household | 8 (80.0%) | 2 (20.0%) |
| Total Housing Units | 109 (56.2%) | 85 (43.8%) |
Occupancy by Educational Attainment in Blue Eye
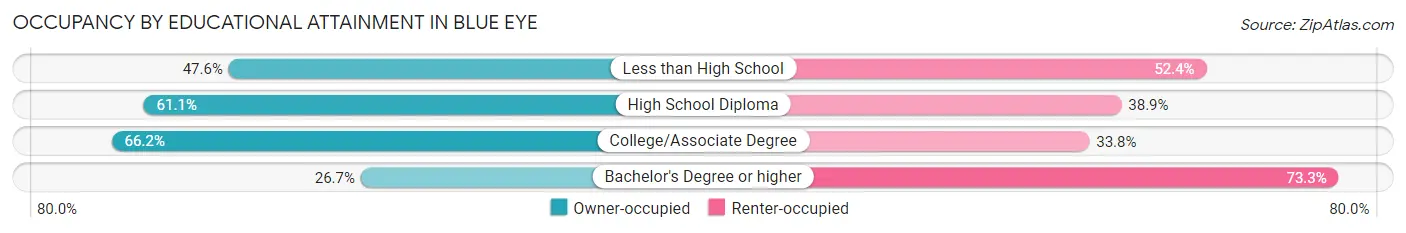
| Household Size | Owner-occupied | Renter-occupied |
| Less than High School | 10 (47.6%) | 11 (52.4%) |
| High School Diploma | 44 (61.1%) | 28 (38.9%) |
| College/Associate Degree | 47 (66.2%) | 24 (33.8%) |
| Bachelor's Degree or higher | 8 (26.7%) | 22 (73.3%) |
Occupancy by Age of Householder in Blue Eye
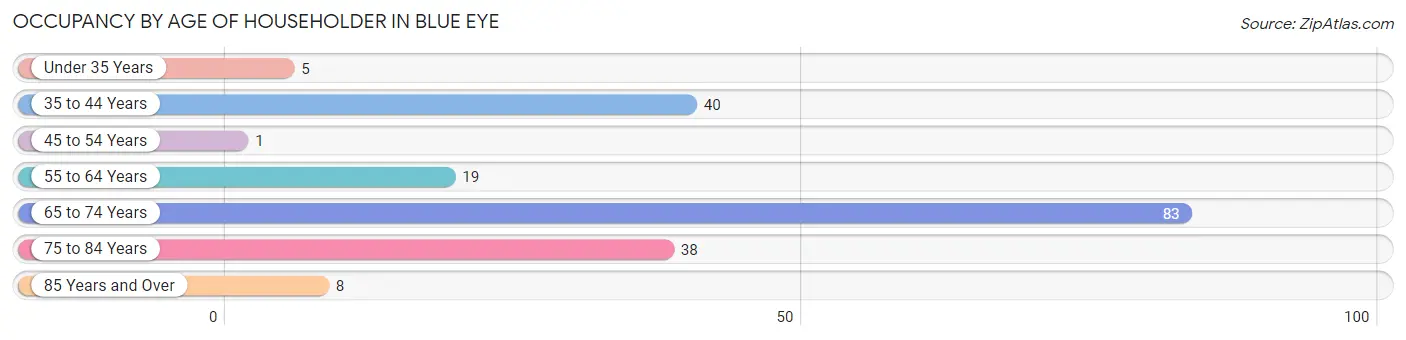
| Age Bracket | # Households | % Households |
| Under 35 Years | 5 | 2.6% |
| 35 to 44 Years | 40 | 20.6% |
| 45 to 54 Years | 1 | 0.5% |
| 55 to 64 Years | 19 | 9.8% |
| 65 to 74 Years | 83 | 42.8% |
| 75 to 84 Years | 38 | 19.6% |
| 85 Years and Over | 8 | 4.1% |
| Total | 194 | 100.0% |
Housing Finances in Blue Eye
Median Income by Occupancy in Blue Eye
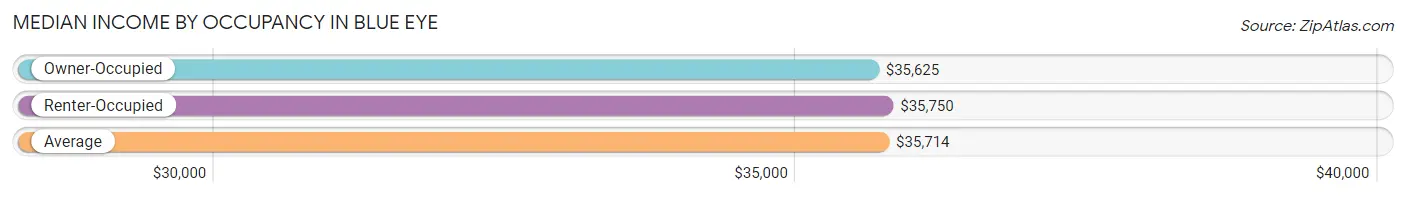
| Occupancy Type | # Households | Median Income |
| Owner-Occupied | 109 (56.2%) | $35,625 |
| Renter-Occupied | 85 (43.8%) | $35,750 |
| Average | 194 (100.0%) | $35,714 |
Occupancy by Householder Income Bracket in Blue Eye
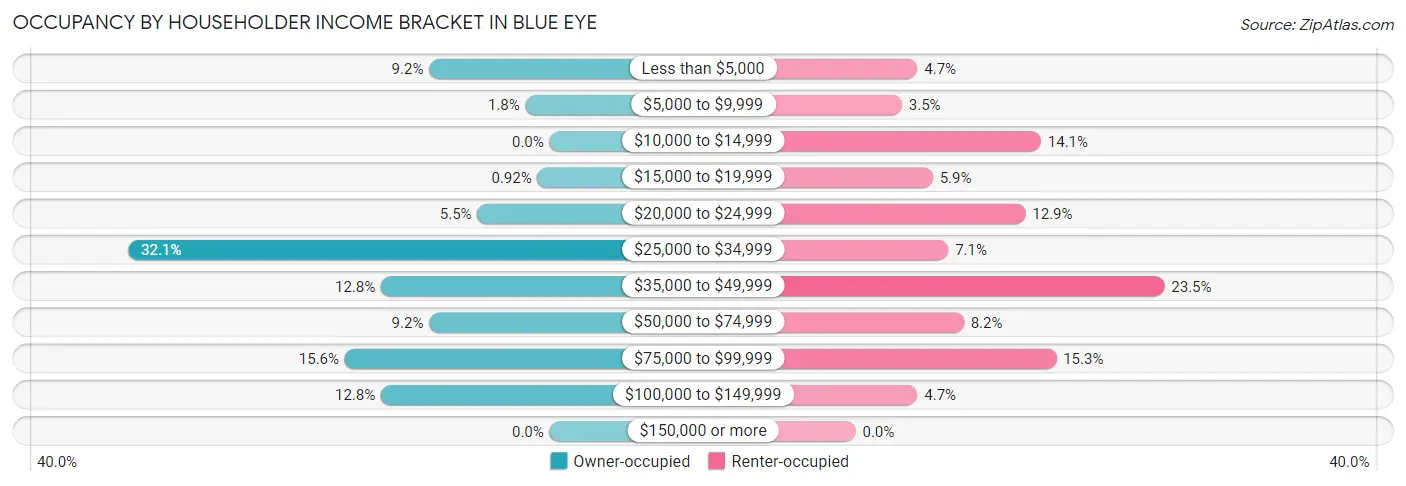
| Income Bracket | Owner-occupied | Renter-occupied |
| Less than $5,000 | 10 (9.2%) | 4 (4.7%) |
| $5,000 to $9,999 | 2 (1.8%) | 3 (3.5%) |
| $10,000 to $14,999 | 0 (0.0%) | 12 (14.1%) |
| $15,000 to $19,999 | 1 (0.9%) | 5 (5.9%) |
| $20,000 to $24,999 | 6 (5.5%) | 11 (12.9%) |
| $25,000 to $34,999 | 35 (32.1%) | 6 (7.1%) |
| $35,000 to $49,999 | 14 (12.8%) | 20 (23.5%) |
| $50,000 to $74,999 | 10 (9.2%) | 7 (8.2%) |
| $75,000 to $99,999 | 17 (15.6%) | 13 (15.3%) |
| $100,000 to $149,999 | 14 (12.8%) | 4 (4.7%) |
| $150,000 or more | 0 (0.0%) | 0 (0.0%) |
| Total | 109 (100.0%) | 85 (100.0%) |
Monthly Housing Cost Tiers in Blue Eye
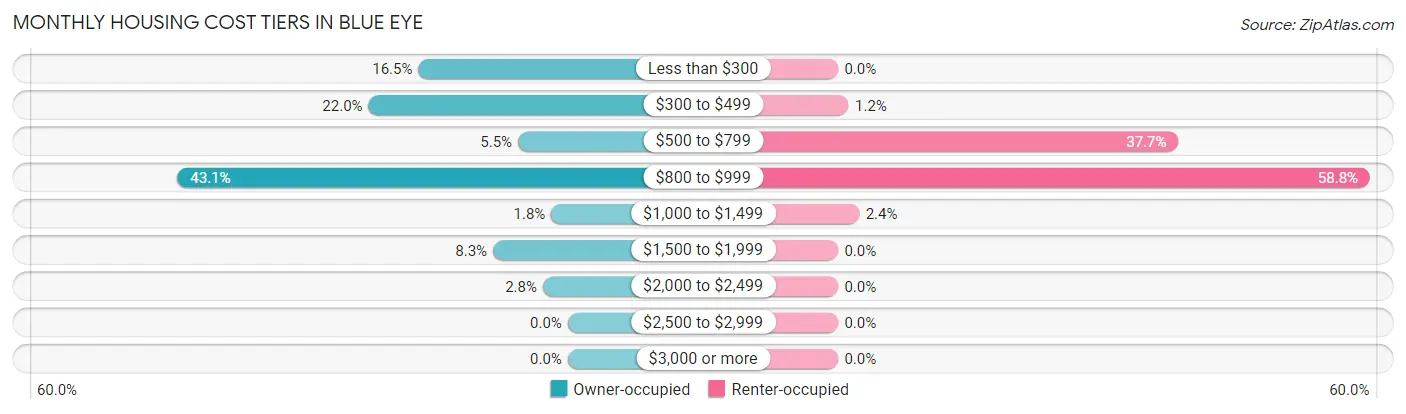
| Monthly Cost | Owner-occupied | Renter-occupied |
| Less than $300 | 18 (16.5%) | 0 (0.0%) |
| $300 to $499 | 24 (22.0%) | 1 (1.2%) |
| $500 to $799 | 6 (5.5%) | 32 (37.7%) |
| $800 to $999 | 47 (43.1%) | 50 (58.8%) |
| $1,000 to $1,499 | 2 (1.8%) | 2 (2.4%) |
| $1,500 to $1,999 | 9 (8.3%) | 0 (0.0%) |
| $2,000 to $2,499 | 3 (2.8%) | 0 (0.0%) |
| $2,500 to $2,999 | 0 (0.0%) | 0 (0.0%) |
| $3,000 or more | 0 (0.0%) | 0 (0.0%) |
| Total | 109 (100.0%) | 85 (100.0%) |
Physical Housing Characteristics in Blue Eye
Housing Structures in Blue Eye
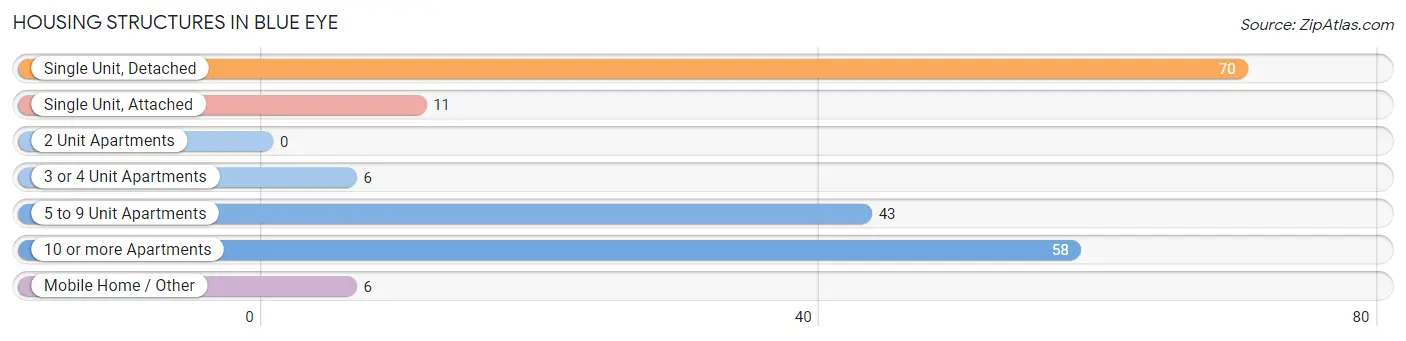
| Structure Type | # Housing Units | % Housing Units |
| Single Unit, Detached | 70 | 36.1% |
| Single Unit, Attached | 11 | 5.7% |
| 2 Unit Apartments | 0 | 0.0% |
| 3 or 4 Unit Apartments | 6 | 3.1% |
| 5 to 9 Unit Apartments | 43 | 22.2% |
| 10 or more Apartments | 58 | 29.9% |
| Mobile Home / Other | 6 | 3.1% |
| Total | 194 | 100.0% |
Housing Structures by Occupancy in Blue Eye
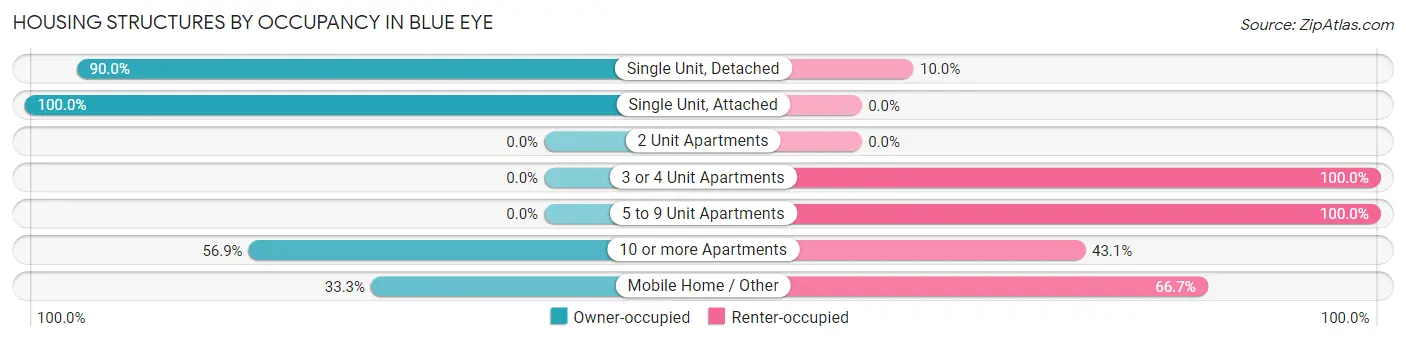
| Structure Type | Owner-occupied | Renter-occupied |
| Single Unit, Detached | 63 (90.0%) | 7 (10.0%) |
| Single Unit, Attached | 11 (100.0%) | 0 (0.0%) |
| 2 Unit Apartments | 0 (0.0%) | 0 (0.0%) |
| 3 or 4 Unit Apartments | 0 (0.0%) | 6 (100.0%) |
| 5 to 9 Unit Apartments | 0 (0.0%) | 43 (100.0%) |
| 10 or more Apartments | 33 (56.9%) | 25 (43.1%) |
| Mobile Home / Other | 2 (33.3%) | 4 (66.7%) |
| Total | 109 (56.2%) | 85 (43.8%) |
Housing Structures by Number of Rooms in Blue Eye
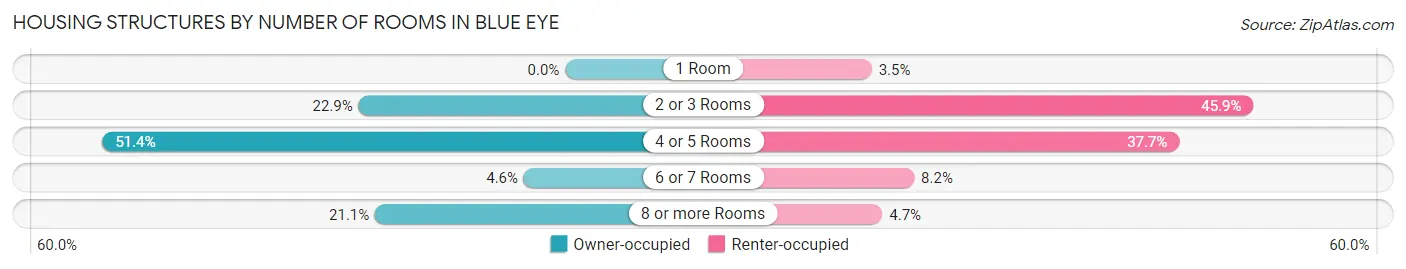
| Number of Rooms | Owner-occupied | Renter-occupied |
| 1 Room | 0 (0.0%) | 3 (3.5%) |
| 2 or 3 Rooms | 25 (22.9%) | 39 (45.9%) |
| 4 or 5 Rooms | 56 (51.4%) | 32 (37.7%) |
| 6 or 7 Rooms | 5 (4.6%) | 7 (8.2%) |
| 8 or more Rooms | 23 (21.1%) | 4 (4.7%) |
| Total | 109 (100.0%) | 85 (100.0%) |
Housing Structure by Heating Type in Blue Eye
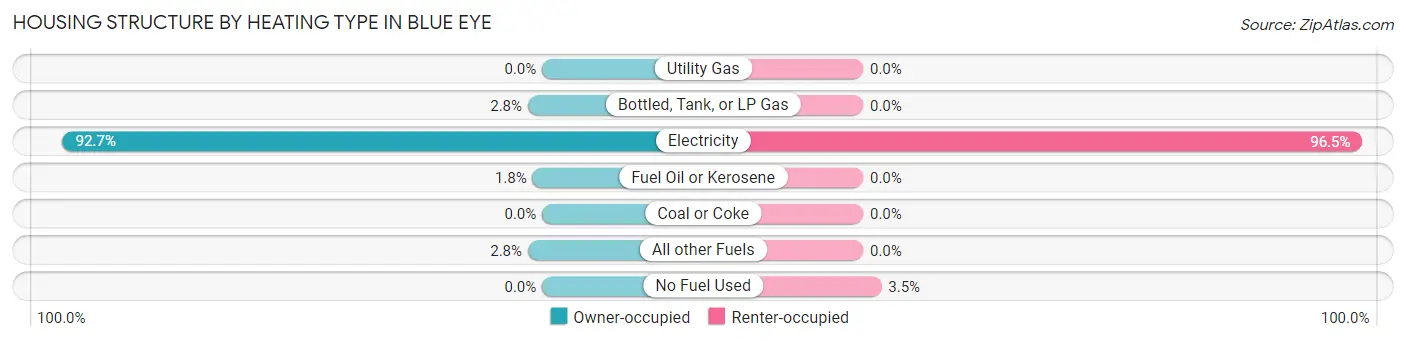
| Heating Type | Owner-occupied | Renter-occupied |
| Utility Gas | 0 (0.0%) | 0 (0.0%) |
| Bottled, Tank, or LP Gas | 3 (2.8%) | 0 (0.0%) |
| Electricity | 101 (92.7%) | 82 (96.5%) |
| Fuel Oil or Kerosene | 2 (1.8%) | 0 (0.0%) |
| Coal or Coke | 0 (0.0%) | 0 (0.0%) |
| All other Fuels | 3 (2.8%) | 0 (0.0%) |
| No Fuel Used | 0 (0.0%) | 3 (3.5%) |
| Total | 109 (100.0%) | 85 (100.0%) |
Household Vehicle Usage in Blue Eye
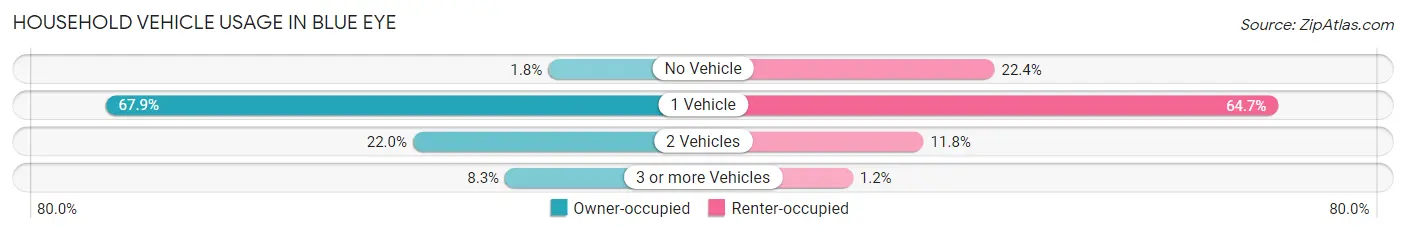
| Vehicles per Household | Owner-occupied | Renter-occupied |
| No Vehicle | 2 (1.8%) | 19 (22.4%) |
| 1 Vehicle | 74 (67.9%) | 55 (64.7%) |
| 2 Vehicles | 24 (22.0%) | 10 (11.8%) |
| 3 or more Vehicles | 9 (8.3%) | 1 (1.2%) |
| Total | 109 (100.0%) | 85 (100.0%) |
Real Estate & Mortgages in Blue Eye
Real Estate and Mortgage Overview in Blue Eye
| Characteristic | Without Mortgage | With Mortgage |
| Housing Units | 42 | 67 |
| Median Property Value | $111,400 | $156,300 |
| Median Household Income | $27,500 | $0 |
| Monthly Housing Costs | $325 | $0 |
| Real Estate Taxes | $689 | $0 |
Property Value by Mortgage Status in Blue Eye
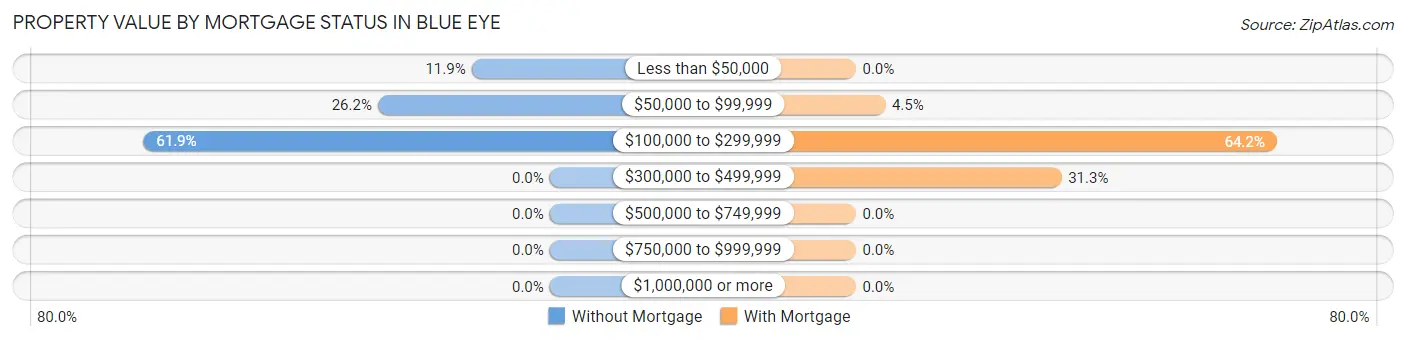
| Property Value | Without Mortgage | With Mortgage |
| Less than $50,000 | 5 (11.9%) | 0 (0.0%) |
| $50,000 to $99,999 | 11 (26.2%) | 3 (4.5%) |
| $100,000 to $299,999 | 26 (61.9%) | 43 (64.2%) |
| $300,000 to $499,999 | 0 (0.0%) | 21 (31.3%) |
| $500,000 to $749,999 | 0 (0.0%) | 0 (0.0%) |
| $750,000 to $999,999 | 0 (0.0%) | 0 (0.0%) |
| $1,000,000 or more | 0 (0.0%) | 0 (0.0%) |
| Total | 42 (100.0%) | 67 (100.0%) |
Household Income by Mortgage Status in Blue Eye
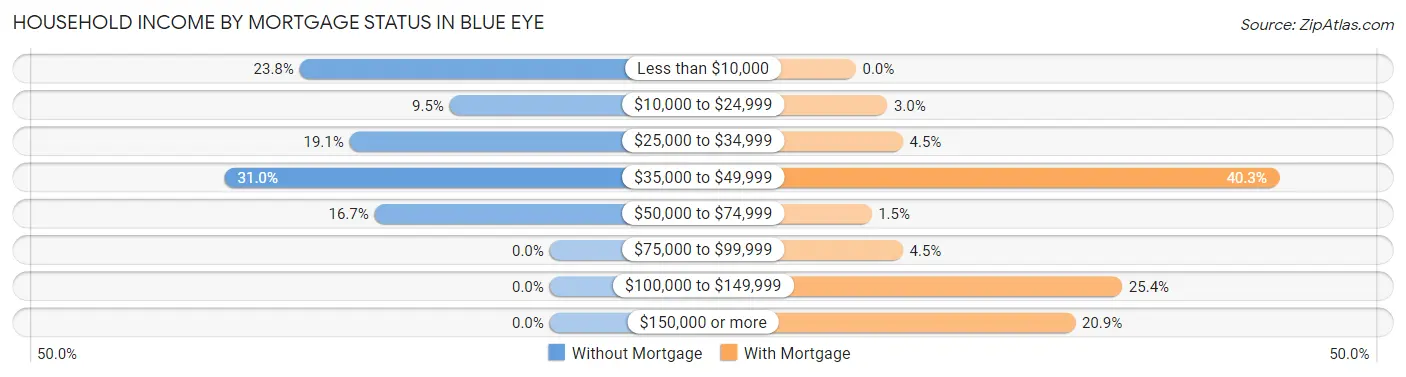
| Household Income | Without Mortgage | With Mortgage |
| Less than $10,000 | 10 (23.8%) | 0 (0.0%) |
| $10,000 to $24,999 | 4 (9.5%) | 2 (3.0%) |
| $25,000 to $34,999 | 8 (19.1%) | 3 (4.5%) |
| $35,000 to $49,999 | 13 (30.9%) | 27 (40.3%) |
| $50,000 to $74,999 | 7 (16.7%) | 1 (1.5%) |
| $75,000 to $99,999 | 0 (0.0%) | 3 (4.5%) |
| $100,000 to $149,999 | 0 (0.0%) | 17 (25.4%) |
| $150,000 or more | 0 (0.0%) | 14 (20.9%) |
| Total | 42 (100.0%) | 67 (100.0%) |
Property Value to Household Income Ratio in Blue Eye
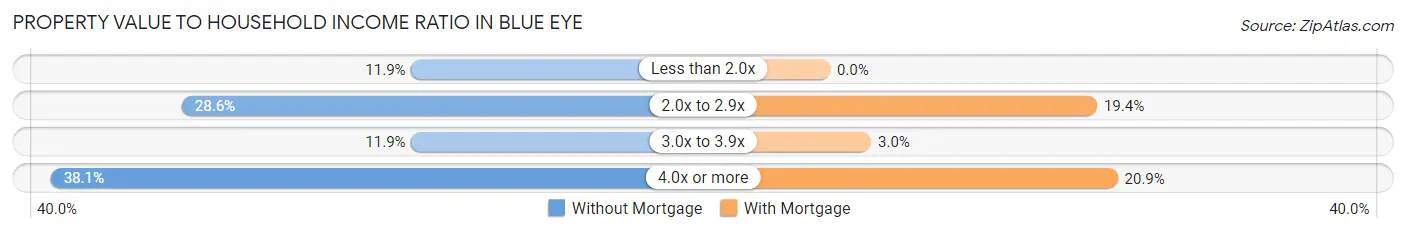
| Value-to-Income Ratio | Without Mortgage | With Mortgage |
| Less than 2.0x | 5 (11.9%) | 0 (0.0%) |
| 2.0x to 2.9x | 12 (28.6%) | 13 (19.4%) |
| 3.0x to 3.9x | 5 (11.9%) | 2 (3.0%) |
| 4.0x or more | 16 (38.1%) | 14 (20.9%) |
| Total | 42 (100.0%) | 67 (100.0%) |
Real Estate Taxes by Mortgage Status in Blue Eye
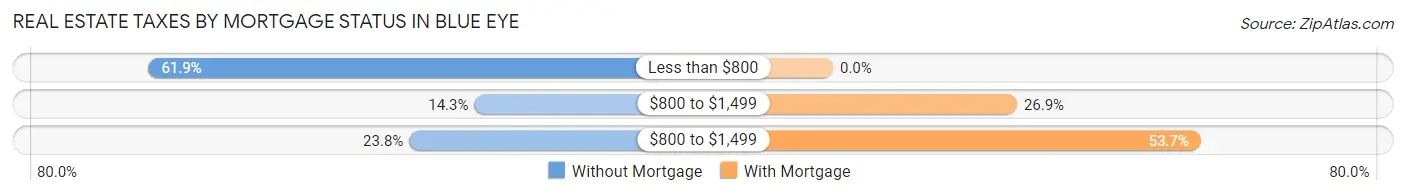
| Property Taxes | Without Mortgage | With Mortgage |
| Less than $800 | 26 (61.9%) | 0 (0.0%) |
| $800 to $1,499 | 6 (14.3%) | 18 (26.9%) |
| $800 to $1,499 | 10 (23.8%) | 36 (53.7%) |
| Total | 42 (100.0%) | 67 (100.0%) |
Health & Disability in Blue Eye
Health Insurance Coverage by Age in Blue Eye
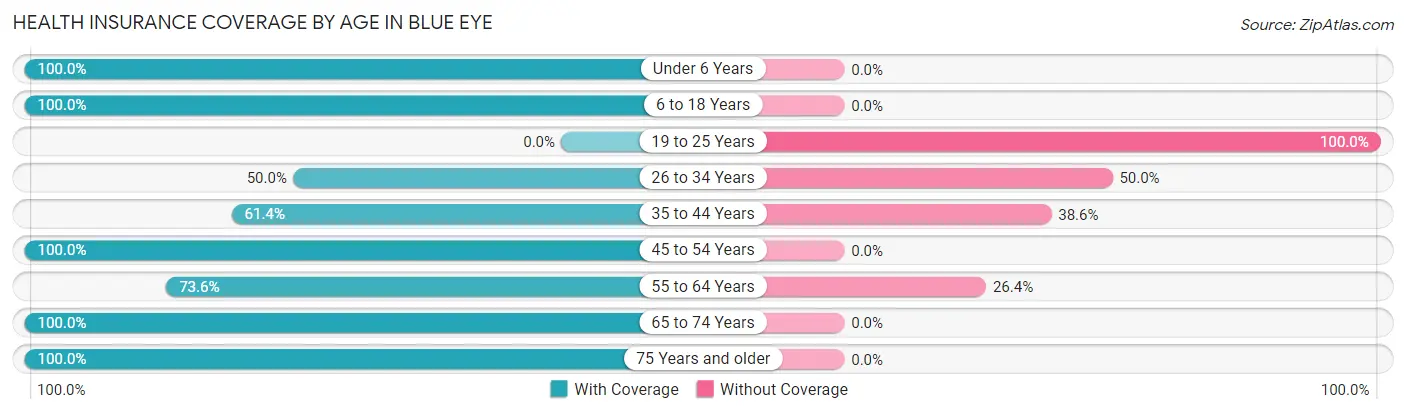
| Age Bracket | With Coverage | Without Coverage |
| Under 6 Years | 18 (100.0%) | 0 (0.0%) |
| 6 to 18 Years | 23 (100.0%) | 0 (0.0%) |
| 19 to 25 Years | 0 (0.0%) | 3 (100.0%) |
| 26 to 34 Years | 2 (50.0%) | 2 (50.0%) |
| 35 to 44 Years | 35 (61.4%) | 22 (38.6%) |
| 45 to 54 Years | 1 (100.0%) | 0 (0.0%) |
| 55 to 64 Years | 78 (73.6%) | 28 (26.4%) |
| 65 to 74 Years | 114 (100.0%) | 0 (0.0%) |
| 75 Years and older | 63 (100.0%) | 0 (0.0%) |
| Total | 334 (85.9%) | 55 (14.1%) |
Health Insurance Coverage by Citizenship Status in Blue Eye
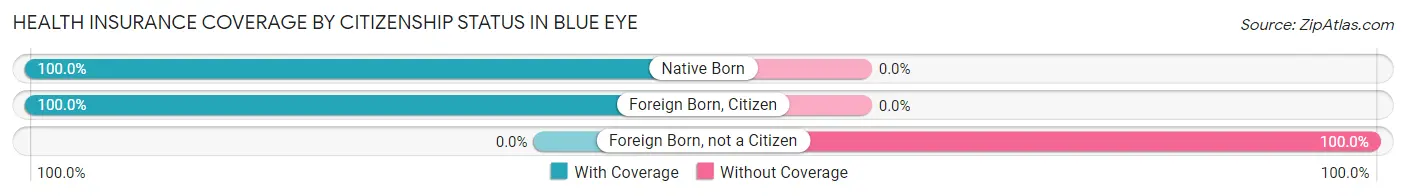
| Citizenship Status | With Coverage | Without Coverage |
| Native Born | 18 (100.0%) | 0 (0.0%) |
| Foreign Born, Citizen | 23 (100.0%) | 0 (0.0%) |
| Foreign Born, not a Citizen | 0 (0.0%) | 3 (100.0%) |
Health Insurance Coverage by Household Income in Blue Eye
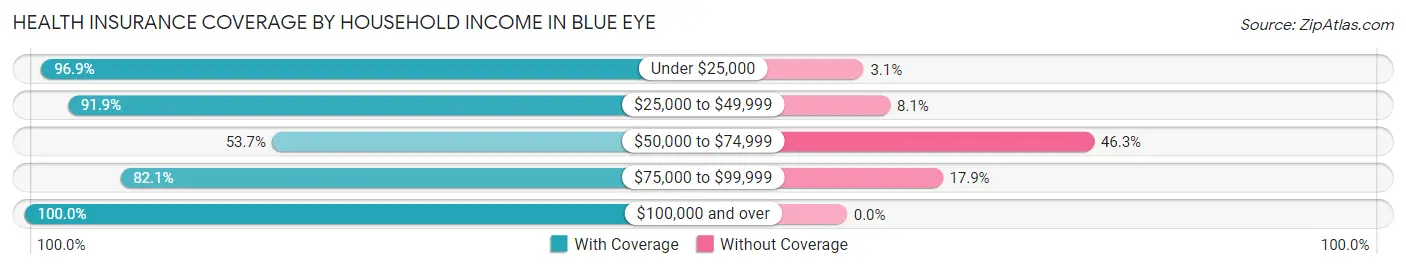
| Household Income | With Coverage | Without Coverage |
| Under $25,000 | 62 (96.9%) | 2 (3.1%) |
| $25,000 to $49,999 | 102 (91.9%) | 9 (8.1%) |
| $50,000 to $74,999 | 29 (53.7%) | 25 (46.3%) |
| $75,000 to $99,999 | 87 (82.1%) | 19 (17.9%) |
| $100,000 and over | 52 (100.0%) | 0 (0.0%) |
Public vs Private Health Insurance Coverage by Age in Blue Eye
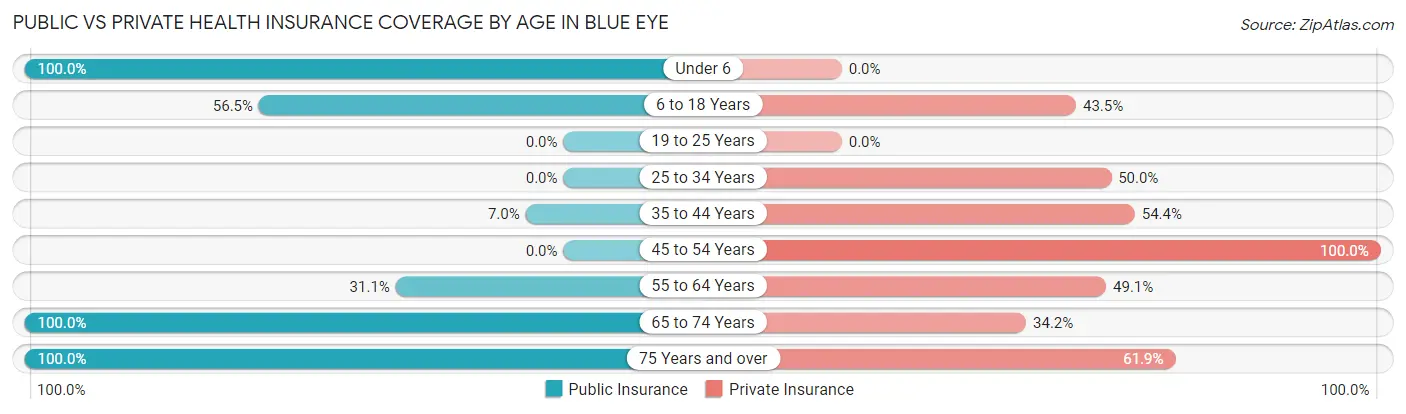
| Age Bracket | Public Insurance | Private Insurance |
| Under 6 | 18 (100.0%) | 0 (0.0%) |
| 6 to 18 Years | 13 (56.5%) | 10 (43.5%) |
| 19 to 25 Years | 0 (0.0%) | 0 (0.0%) |
| 25 to 34 Years | 0 (0.0%) | 2 (50.0%) |
| 35 to 44 Years | 4 (7.0%) | 31 (54.4%) |
| 45 to 54 Years | 0 (0.0%) | 1 (100.0%) |
| 55 to 64 Years | 33 (31.1%) | 52 (49.1%) |
| 65 to 74 Years | 114 (100.0%) | 39 (34.2%) |
| 75 Years and over | 63 (100.0%) | 39 (61.9%) |
| Total | 245 (63.0%) | 174 (44.7%) |
Disability Status by Sex by Age in Blue Eye
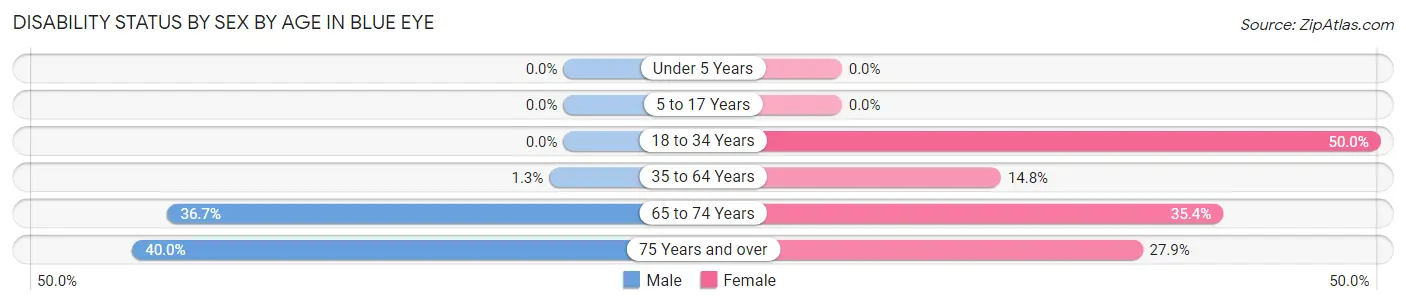
| Age Bracket | Male | Female |
| Under 5 Years | 0 (0.0%) | 0 (0.0%) |
| 5 to 17 Years | 0 (0.0%) | 0 (0.0%) |
| 18 to 34 Years | 0 (0.0%) | 3 (50.0%) |
| 35 to 64 Years | 1 (1.3%) | 13 (14.8%) |
| 65 to 74 Years | 18 (36.7%) | 23 (35.4%) |
| 75 Years and over | 8 (40.0%) | 12 (27.9%) |
Disability Class by Sex by Age in Blue Eye
Disability Class: Hearing Difficulty
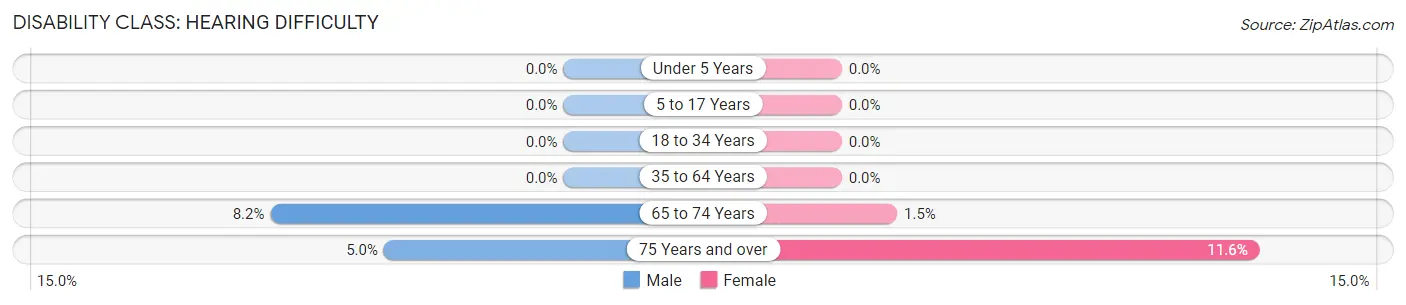
| Age Bracket | Male | Female |
| Under 5 Years | 0 (0.0%) | 0 (0.0%) |
| 5 to 17 Years | 0 (0.0%) | 0 (0.0%) |
| 18 to 34 Years | 0 (0.0%) | 0 (0.0%) |
| 35 to 64 Years | 0 (0.0%) | 0 (0.0%) |
| 65 to 74 Years | 4 (8.2%) | 1 (1.5%) |
| 75 Years and over | 1 (5.0%) | 5 (11.6%) |
Disability Class: Vision Difficulty
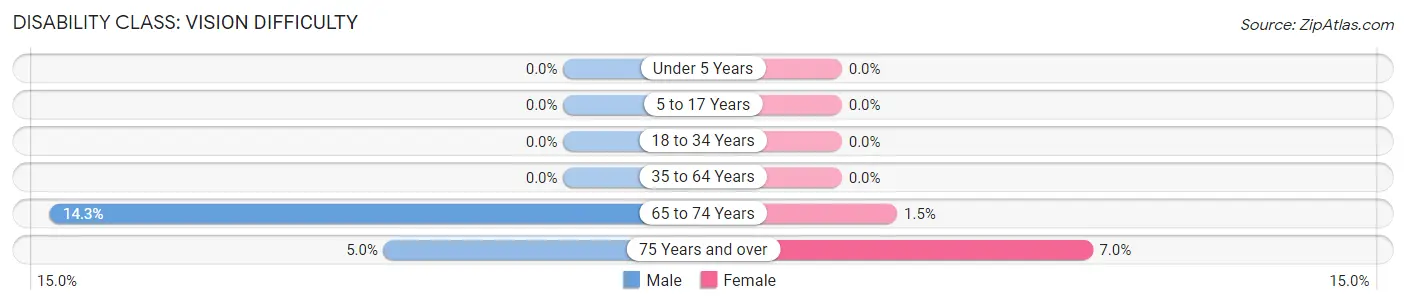
| Age Bracket | Male | Female |
| Under 5 Years | 0 (0.0%) | 0 (0.0%) |
| 5 to 17 Years | 0 (0.0%) | 0 (0.0%) |
| 18 to 34 Years | 0 (0.0%) | 0 (0.0%) |
| 35 to 64 Years | 0 (0.0%) | 0 (0.0%) |
| 65 to 74 Years | 7 (14.3%) | 1 (1.5%) |
| 75 Years and over | 1 (5.0%) | 3 (7.0%) |
Disability Class: Cognitive Difficulty
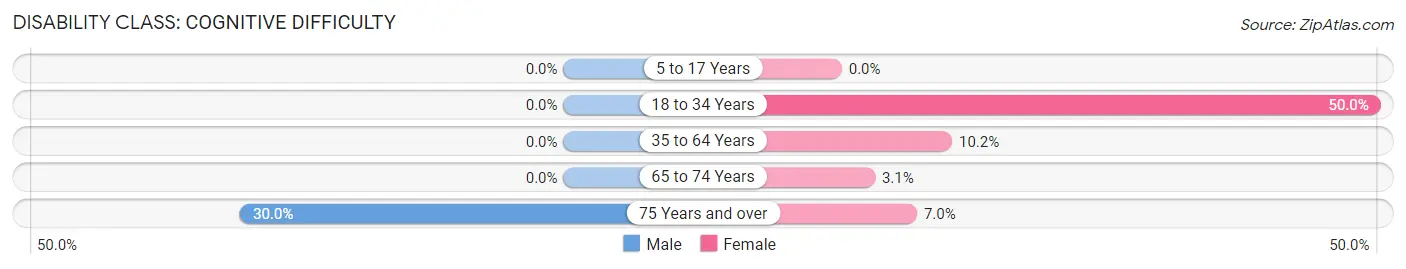
| Age Bracket | Male | Female |
| 5 to 17 Years | 0 (0.0%) | 0 (0.0%) |
| 18 to 34 Years | 0 (0.0%) | 3 (50.0%) |
| 35 to 64 Years | 0 (0.0%) | 9 (10.2%) |
| 65 to 74 Years | 0 (0.0%) | 2 (3.1%) |
| 75 Years and over | 6 (30.0%) | 3 (7.0%) |
Disability Class: Ambulatory Difficulty
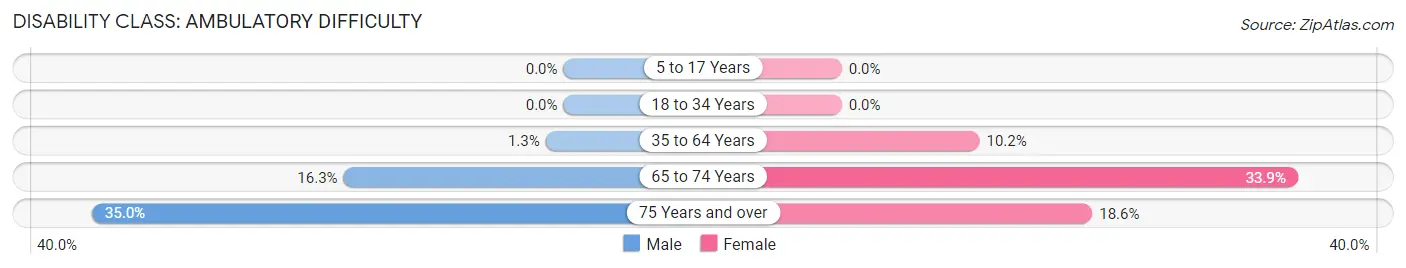
| Age Bracket | Male | Female |
| 5 to 17 Years | 0 (0.0%) | 0 (0.0%) |
| 18 to 34 Years | 0 (0.0%) | 0 (0.0%) |
| 35 to 64 Years | 1 (1.3%) | 9 (10.2%) |
| 65 to 74 Years | 8 (16.3%) | 22 (33.9%) |
| 75 Years and over | 7 (35.0%) | 8 (18.6%) |
Disability Class: Self-Care Difficulty
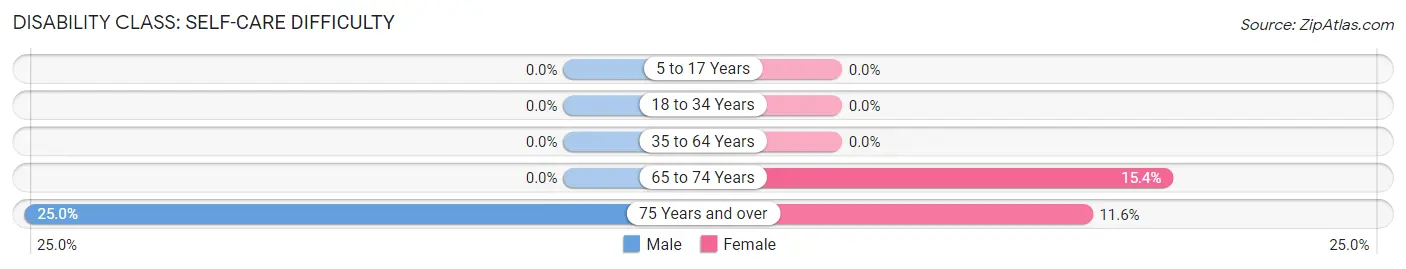
| Age Bracket | Male | Female |
| 5 to 17 Years | 0 (0.0%) | 0 (0.0%) |
| 18 to 34 Years | 0 (0.0%) | 0 (0.0%) |
| 35 to 64 Years | 0 (0.0%) | 0 (0.0%) |
| 65 to 74 Years | 0 (0.0%) | 10 (15.4%) |
| 75 Years and over | 5 (25.0%) | 5 (11.6%) |
Technology Access in Blue Eye
Computing Device Access in Blue Eye
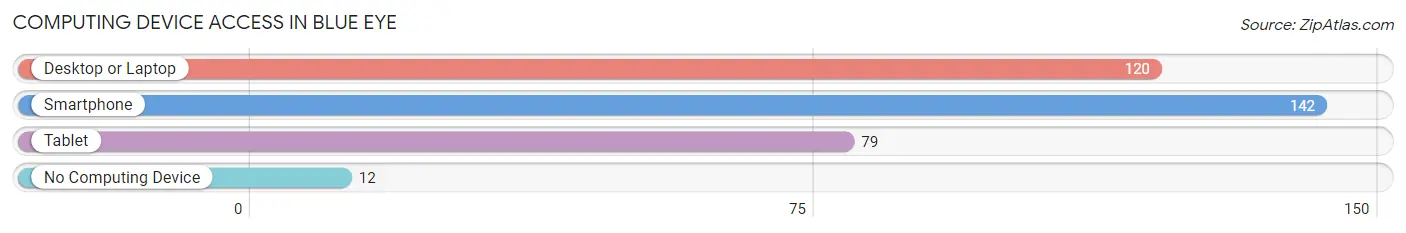
| Device Type | # Households | % Households |
| Desktop or Laptop | 120 | 61.9% |
| Smartphone | 142 | 73.2% |
| Tablet | 79 | 40.7% |
| No Computing Device | 12 | 6.2% |
| Total | 194 | 100.0% |
Internet Access in Blue Eye
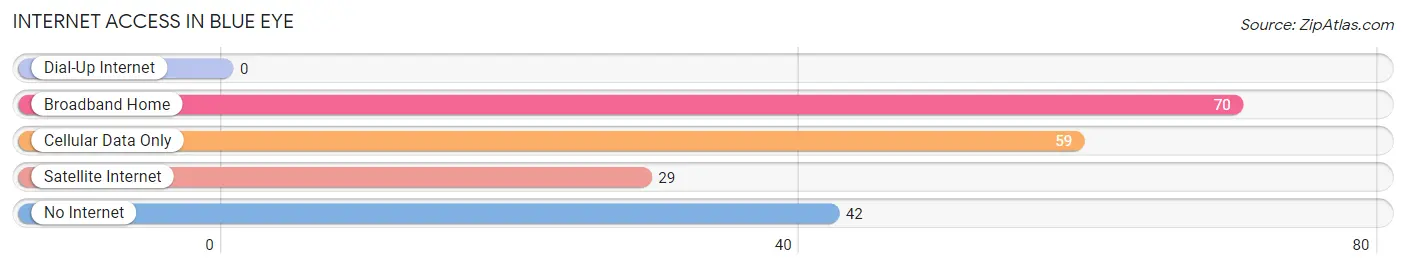
| Internet Type | # Households | % Households |
| Dial-Up Internet | 0 | 0.0% |
| Broadband Home | 70 | 36.1% |
| Cellular Data Only | 59 | 30.4% |
| Satellite Internet | 29 | 14.9% |
| No Internet | 42 | 21.6% |
| Total | 194 | 100.0% |
Blue Eye Summary
Eye, Missouri is a small town located in the Ozark Mountains of southwestern Missouri. The town is situated in Stone County, and is located approximately 25 miles south of Branson, Missouri. The town is home to a population of approximately 500 people, and is known for its rural charm and small-town atmosphere.
History
The town of Blue Eye was founded in 1883 by a group of settlers from the nearby town of Galena, Missouri. The settlers were looking for a place to settle and start a new life, and they chose the area around Blue Eye because of its natural beauty and abundance of resources. The town was named after the nearby Blue Eye Spring, which was a popular spot for swimming and fishing.
The town quickly grew and prospered, and by the early 1900s, it had become a thriving community. The town was home to several businesses, including a general store, a blacksmith shop, a sawmill, and a gristmill. The town also had a school, a post office, and a church.
In the early 1900s, the town was also home to a large number of German immigrants, who had come to the area to work in the local mines. The town was also home to a large number of Native Americans, who had been living in the area for centuries.
Geography
Blue Eye is located in the Ozark Mountains of southwestern Missouri. The town is situated in Stone County, and is located approximately 25 miles south of Branson, Missouri. The town is situated in a valley, surrounded by rolling hills and forests. The town is located near the White River, which is a popular spot for fishing and boating.
The town is located at an elevation of approximately 1,000 feet, and has a humid subtropical climate. The average temperature in the summer is around 80 degrees Fahrenheit, and the average temperature in the winter is around 40 degrees Fahrenheit.
Economy
The economy of Blue Eye is largely based on tourism and agriculture. The town is home to several tourist attractions, including the Blue Eye Spring, which is a popular spot for swimming and fishing. The town is also home to several wineries, which produce a variety of wines.
The town is also home to several farms, which produce a variety of crops, including corn, soybeans, wheat, and hay. The town is also home to several small businesses, including restaurants, shops, and other services.
Demographics
As of the 2010 census, the population of Blue Eye was approximately 500 people. The town is predominantly white, with approximately 95% of the population being white. The town is also home to a small number of African Americans, Hispanics, and Native Americans. The median household income in the town is approximately $35,000, and the median home value is approximately $100,000. The town has a low unemployment rate, and the majority of the population is employed in the tourism and agriculture industries.
Common Questions
What is Per Capita Income in Blue Eye?
Per Capita income in Blue Eye is $25,607.
What is the Median Family Income in Blue Eye?
Median Family Income in Blue Eye is $57,321.
What is the Median Household income in Blue Eye?
Median Household Income in Blue Eye is $35,714.
What is Inequality or Gini Index in Blue Eye?
Inequality or Gini Index in Blue Eye is 0.38.
What is the Total Population of Blue Eye?
Total Population of Blue Eye is 389.
What is the Total Male Population of Blue Eye?
Total Male Population of Blue Eye is 159.
What is the Total Female Population of Blue Eye?
Total Female Population of Blue Eye is 230.
What is the Ratio of Males per 100 Females in Blue Eye?
There are 69.13 Males per 100 Females in Blue Eye.
What is the Ratio of Females per 100 Males in Blue Eye?
There are 144.65 Females per 100 Males in Blue Eye.
What is the Median Population Age in Blue Eye?
Median Population Age in Blue Eye is 63.5 Years.
What is the Average Family Size in Blue Eye
Average Family Size in Blue Eye is 3.0 People.
What is the Average Household Size in Blue Eye
Average Household Size in Blue Eye is 2.0 People.
How Large is the Labor Force in Blue Eye?
There are 131 People in the Labor Forcein in Blue Eye.
What is the Percentage of People in the Labor Force in Blue Eye?
37.3% of People are in the Labor Force in Blue Eye.
What is the Unemployment Rate in Blue Eye?
Unemployment Rate in Blue Eye is 5.3%.