Derwood, MD Map & Demographics
Derwood Map
Derwood Overview
$46,972
PER CAPITA INCOME
$83,036
AVG FAMILY INCOME
$77,083
AVG HOUSEHOLD INCOME
38.1%
WAGE / INCOME GAP [ % ]
61.9¢/ $1
WAGE / INCOME GAP [ $ ]
0.48
INEQUALITY / GINI INDEX
1,850
TOTAL POPULATION
841
MALE POPULATION
1,009
FEMALE POPULATION
83.35
MALES / 100 FEMALES
119.98
FEMALES / 100 MALES
40.9
MEDIAN AGE
3.0
AVG FAMILY SIZE
2.5
AVG HOUSEHOLD SIZE
979
LABOR FORCE [ PEOPLE ]
63.5%
PERCENT IN LABOR FORCE
6.6%
UNEMPLOYMENT RATE
Derwood Zip Codes
Income in Derwood
Income Overview in Derwood
Per Capita Income in Derwood is $46,972, while median incomes of families and households are $83,036 and $77,083 respectively.
| Characteristic | Number | Measure |
| Per Capita Income | 1,850 | $46,972 |
| Median Family Income | 550 | $83,036 |
| Mean Family Income | 550 | $137,683 |
| Median Household Income | 755 | $77,083 |
| Mean Household Income | 755 | $116,112 |
| Income Deficit | 550 | $0 |
| Wage / Income Gap (%) | 1,850 | 38.08% |
| Wage / Income Gap ($) | 1,850 | 61.92¢ per $1 |
| Gini / Inequality Index | 1,850 | 0.48 |
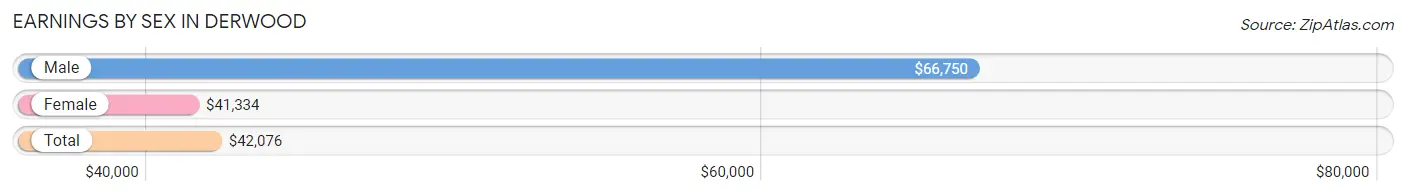
Earnings by Sex in Derwood
Average Earnings in Derwood are $42,076, $66,750 for men and $41,334 for women, a difference of 38.1%.
| Sex | Number | Average Earnings |
| Male | 462 (50.0%) | $66,750 |
| Female | 461 (49.9%) | $41,334 |
| Total | 923 (100.0%) | $42,076 |
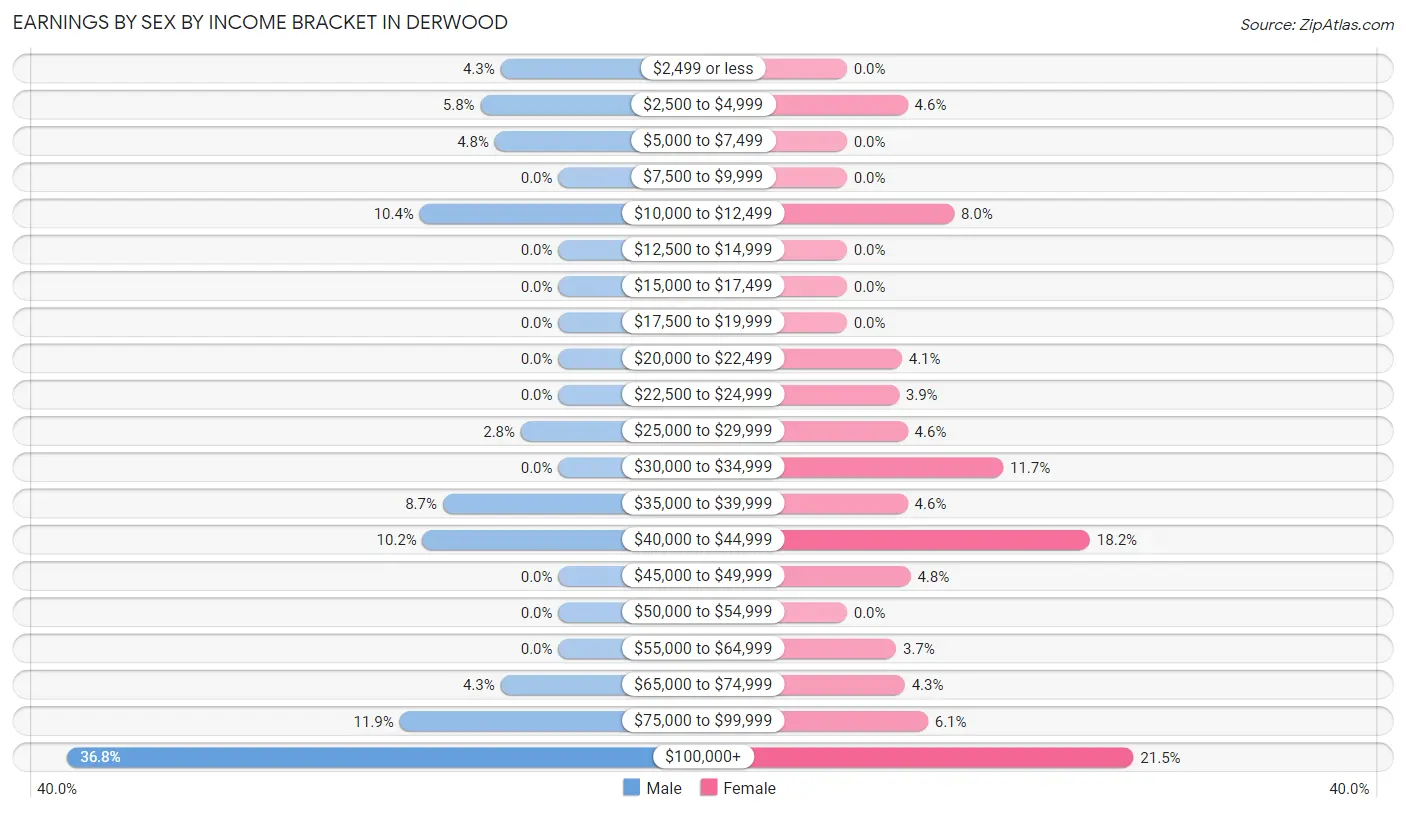
Earnings by Sex by Income Bracket in Derwood
The most common earnings brackets in Derwood are $100,000+ for men (170 | 36.8%) and $100,000+ for women (99 | 21.5%).
| Income | Male | Female |
| $2,499 or less | 20 (4.3%) | 0 (0.0%) |
| $2,500 to $4,999 | 27 (5.8%) | 21 (4.6%) |
| $5,000 to $7,499 | 22 (4.8%) | 0 (0.0%) |
| $7,500 to $9,999 | 0 (0.0%) | 0 (0.0%) |
| $10,000 to $12,499 | 48 (10.4%) | 37 (8.0%) |
| $12,500 to $14,999 | 0 (0.0%) | 0 (0.0%) |
| $15,000 to $17,499 | 0 (0.0%) | 0 (0.0%) |
| $17,500 to $19,999 | 0 (0.0%) | 0 (0.0%) |
| $20,000 to $22,499 | 0 (0.0%) | 19 (4.1%) |
| $22,500 to $24,999 | 0 (0.0%) | 18 (3.9%) |
| $25,000 to $29,999 | 13 (2.8%) | 21 (4.6%) |
| $30,000 to $34,999 | 0 (0.0%) | 54 (11.7%) |
| $35,000 to $39,999 | 40 (8.7%) | 21 (4.6%) |
| $40,000 to $44,999 | 47 (10.2%) | 84 (18.2%) |
| $45,000 to $49,999 | 0 (0.0%) | 22 (4.8%) |
| $50,000 to $54,999 | 0 (0.0%) | 0 (0.0%) |
| $55,000 to $64,999 | 0 (0.0%) | 17 (3.7%) |
| $65,000 to $74,999 | 20 (4.3%) | 20 (4.3%) |
| $75,000 to $99,999 | 55 (11.9%) | 28 (6.1%) |
| $100,000+ | 170 (36.8%) | 99 (21.5%) |
| Total | 462 (100.0%) | 461 (100.0%) |
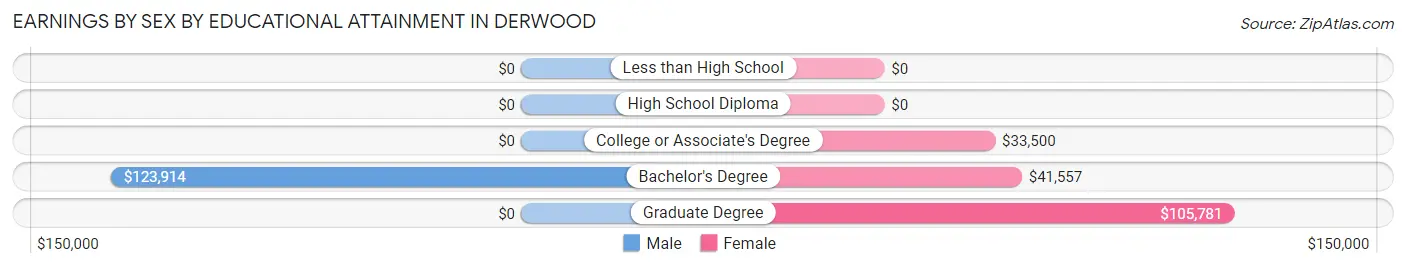
Earnings by Sex by Educational Attainment in Derwood
Average earnings in Derwood are $80,455 for men and $42,303 for women, a difference of 47.4%. Men with an educational attainment of bachelor's degree enjoy the highest average annual earnings of $123,914, while those with bachelor's degree education earn the least with $123,914. Women with an educational attainment of graduate degree earn the most with the average annual earnings of $105,781, while those with college or associate's degree education have the smallest earnings of $33,500.
| Educational Attainment | Male Income | Female Income |
| Less than High School | - | - |
| High School Diploma | - | - |
| College or Associate's Degree | - | - |
| Bachelor's Degree | $123,914 | $41,557 |
| Graduate Degree | - | - |
| Total | $80,455 | $42,303 |
Family Income in Derwood
Family Income Brackets in Derwood
According to the Derwood family income data, there are 139 families falling into the $200,000+ income range, which is the most common income bracket and makes up 25.3% of all families.
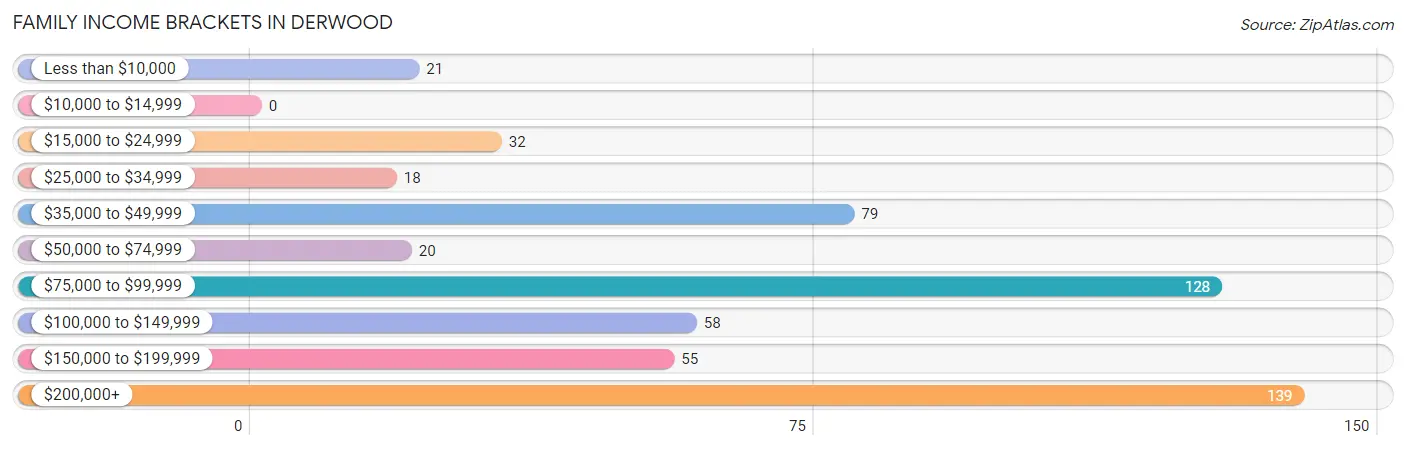
| Income Bracket | # Families | % Families |
| Less than $10,000 | 21 | 3.8% |
| $10,000 to $14,999 | 0 | 0.0% |
| $15,000 to $24,999 | 32 | 5.8% |
| $25,000 to $34,999 | 18 | 3.3% |
| $35,000 to $49,999 | 79 | 14.4% |
| $50,000 to $74,999 | 20 | 3.6% |
| $75,000 to $99,999 | 128 | 23.3% |
| $100,000 to $149,999 | 58 | 10.5% |
| $150,000 to $199,999 | 55 | 10.0% |
| $200,000+ | 139 | 25.3% |
Family Income by Famaliy Size in Derwood
3-person families (90 | 16.4%) account for the highest median family income in Derwood with $123,500 per family, while 3-person families (90 | 16.4%) have the highest median income of $41,167 per family member.
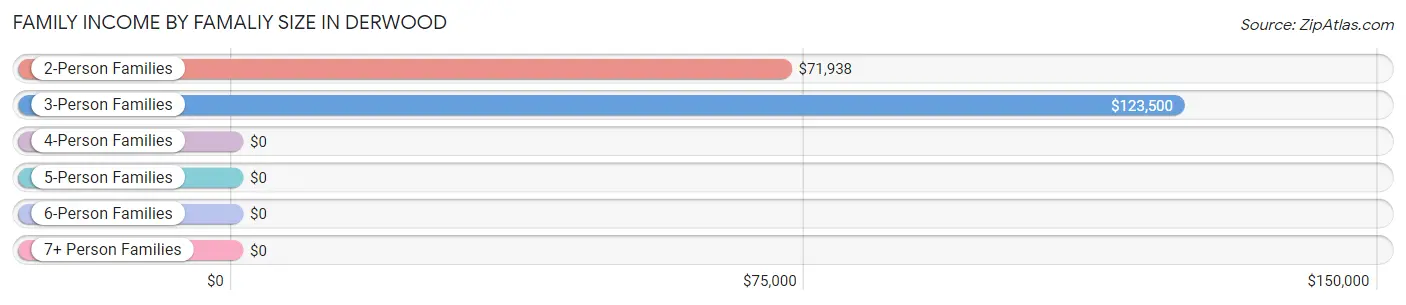
| Income Bracket | # Families | Median Income |
| 2-Person Families | 237 (43.1%) | $71,938 |
| 3-Person Families | 90 (16.4%) | $123,500 |
| 4-Person Families | 203 (36.9%) | $0 |
| 5-Person Families | 20 (3.6%) | $0 |
| 6-Person Families | 0 (0.0%) | $0 |
| 7+ Person Families | 0 (0.0%) | $0 |
| Total | 550 (100.0%) | $83,036 |
Family Income by Number of Earners in Derwood
The median family income in Derwood is $83,036, with families comprising 3+ earners (76) having the highest median family income of $250,001, while families with no earners (109) have the lowest median family income of $49,009, accounting for 13.8% and 19.8% of families, respectively.
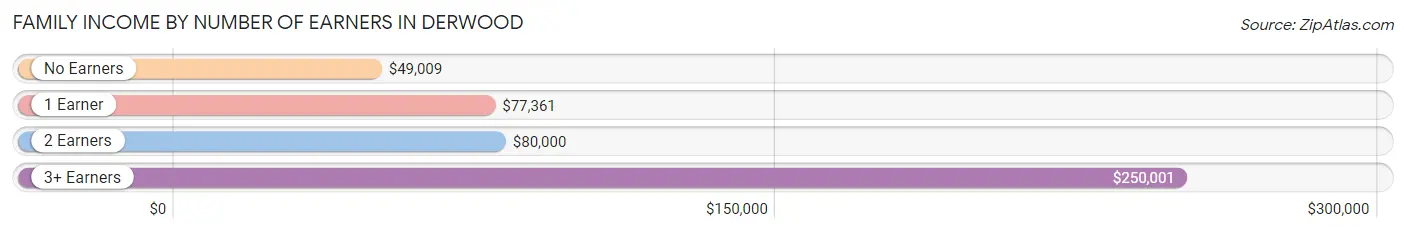
| Number of Earners | # Families | Median Income |
| No Earners | 109 (19.8%) | $49,009 |
| 1 Earner | 161 (29.3%) | $77,361 |
| 2 Earners | 204 (37.1%) | $80,000 |
| 3+ Earners | 76 (13.8%) | $250,001 |
| Total | 550 (100.0%) | $83,036 |
Household Income in Derwood
Household Income Brackets in Derwood
With 139 households falling in the category, the $200,000+ income range is the most frequent in Derwood, accounting for 18.4% of all households. In contrast, only 29 households (3.8%) fall into the $10,000 to $14,999 income bracket, making it the least populous group.
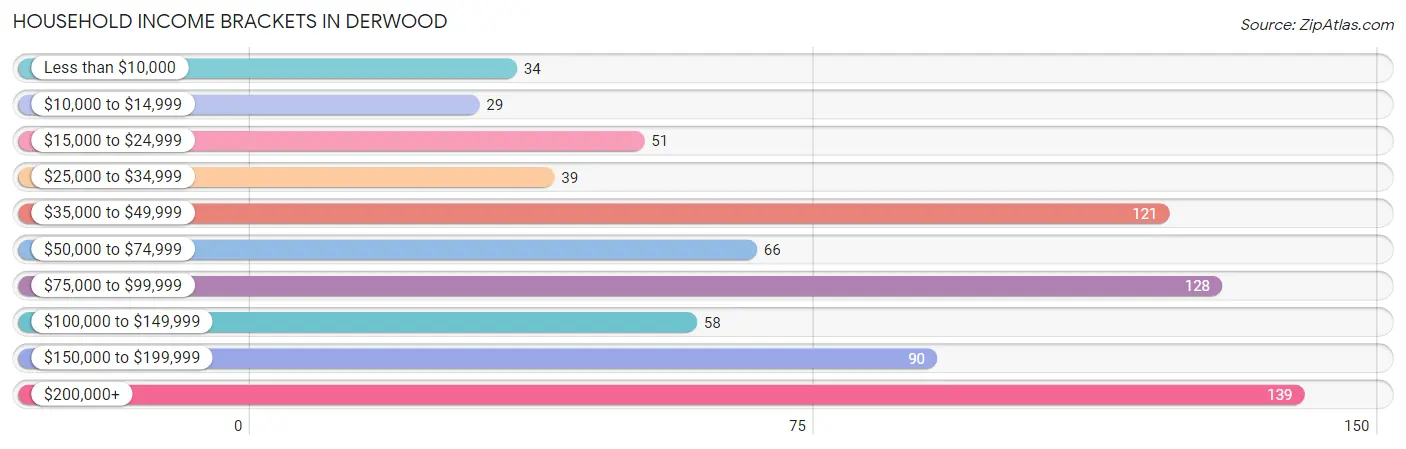
| Income Bracket | # Households | % Households |
| Less than $10,000 | 34 | 4.5% |
| $10,000 to $14,999 | 29 | 3.8% |
| $15,000 to $24,999 | 51 | 6.8% |
| $25,000 to $34,999 | 39 | 5.2% |
| $35,000 to $49,999 | 121 | 16.0% |
| $50,000 to $74,999 | 66 | 8.7% |
| $75,000 to $99,999 | 128 | 17.0% |
| $100,000 to $149,999 | 58 | 7.7% |
| $150,000 to $199,999 | 90 | 11.9% |
| $200,000+ | 139 | 18.4% |
Household Income by Householder Age in Derwood
The median household income in Derwood is $77,083, with the highest median household income of $79,583 found in the 25 to 44 years age bracket for the primary householder. A total of 230 households (30.5%) fall into this category. Meanwhile, the 15 to 24 years age bracket for the primary householder has the lowest median household income of $0, with 21 households (2.8%) in this group.
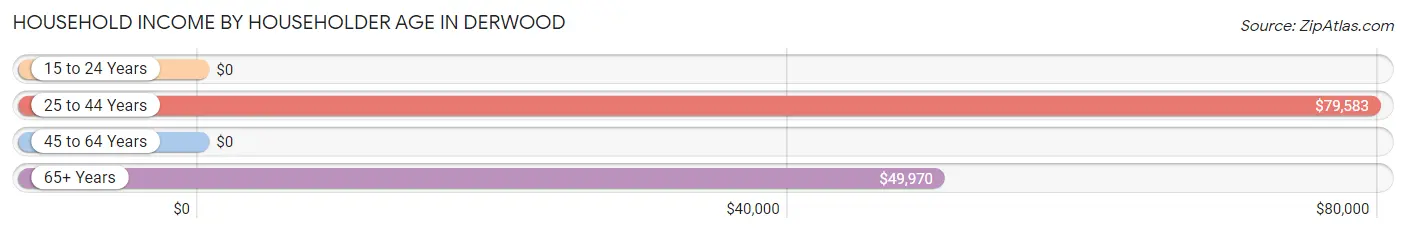
| Income Bracket | # Households | Median Income |
| 15 to 24 Years | 21 (2.8%) | $0 |
| 25 to 44 Years | 230 (30.5%) | $79,583 |
| 45 to 64 Years | 221 (29.3%) | $0 |
| 65+ Years | 283 (37.5%) | $49,970 |
| Total | 755 (100.0%) | $77,083 |
Poverty in Derwood
Income Below Poverty by Sex and Age in Derwood
With 4.6% poverty level for males and 7.8% for females among the residents of Derwood, 65 to 74 year old males and 75 year old and over females are the most vulnerable to poverty, with 22 males (20.7%) and 46 females (90.2%) in their respective age groups living below the poverty level.
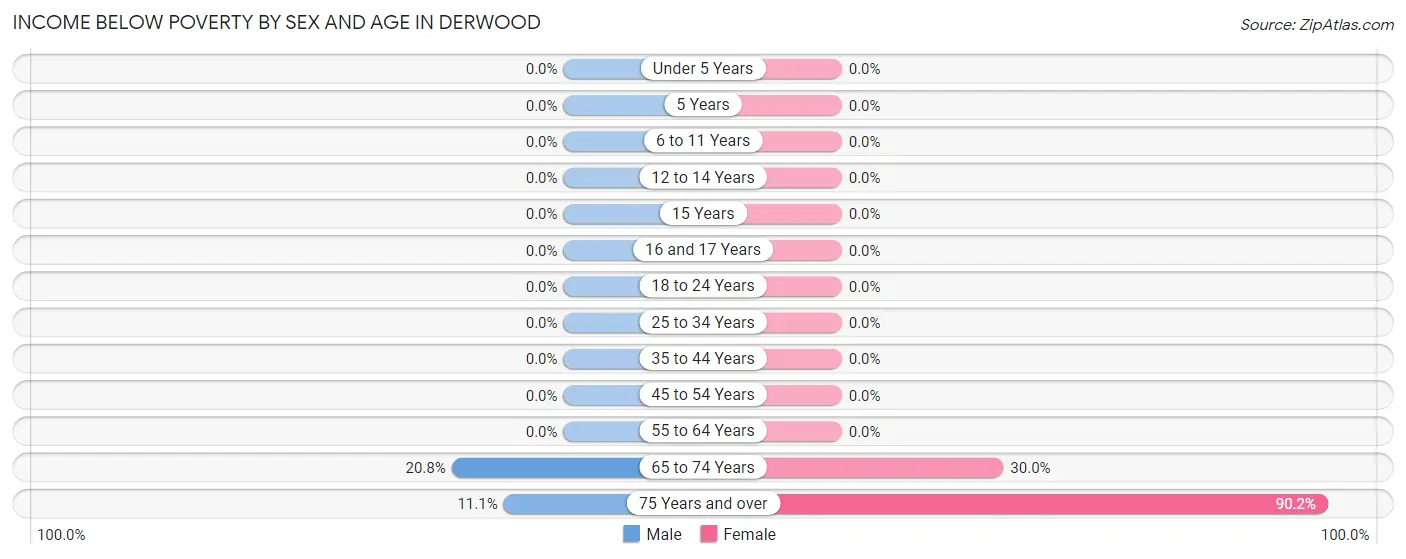
| Age Bracket | Male | Female |
| Under 5 Years | 0 (0.0%) | 0 (0.0%) |
| 5 Years | 0 (0.0%) | 0 (0.0%) |
| 6 to 11 Years | 0 (0.0%) | 0 (0.0%) |
| 12 to 14 Years | 0 (0.0%) | 0 (0.0%) |
| 15 Years | 0 (0.0%) | 0 (0.0%) |
| 16 and 17 Years | 0 (0.0%) | 0 (0.0%) |
| 18 to 24 Years | 0 (0.0%) | 0 (0.0%) |
| 25 to 34 Years | 0 (0.0%) | 0 (0.0%) |
| 35 to 44 Years | 0 (0.0%) | 0 (0.0%) |
| 45 to 54 Years | 0 (0.0%) | 0 (0.0%) |
| 55 to 64 Years | 0 (0.0%) | 0 (0.0%) |
| 65 to 74 Years | 22 (20.7%) | 33 (30.0%) |
| 75 Years and over | 17 (11.1%) | 46 (90.2%) |
| Total | 39 (4.6%) | 79 (7.8%) |
Income Above Poverty by Sex and Age in Derwood
According to the poverty statistics in Derwood, males aged under 5 years and females aged under 5 years are the age groups that are most secure financially, with 100.0% of males and 100.0% of females in these age groups living above the poverty line.
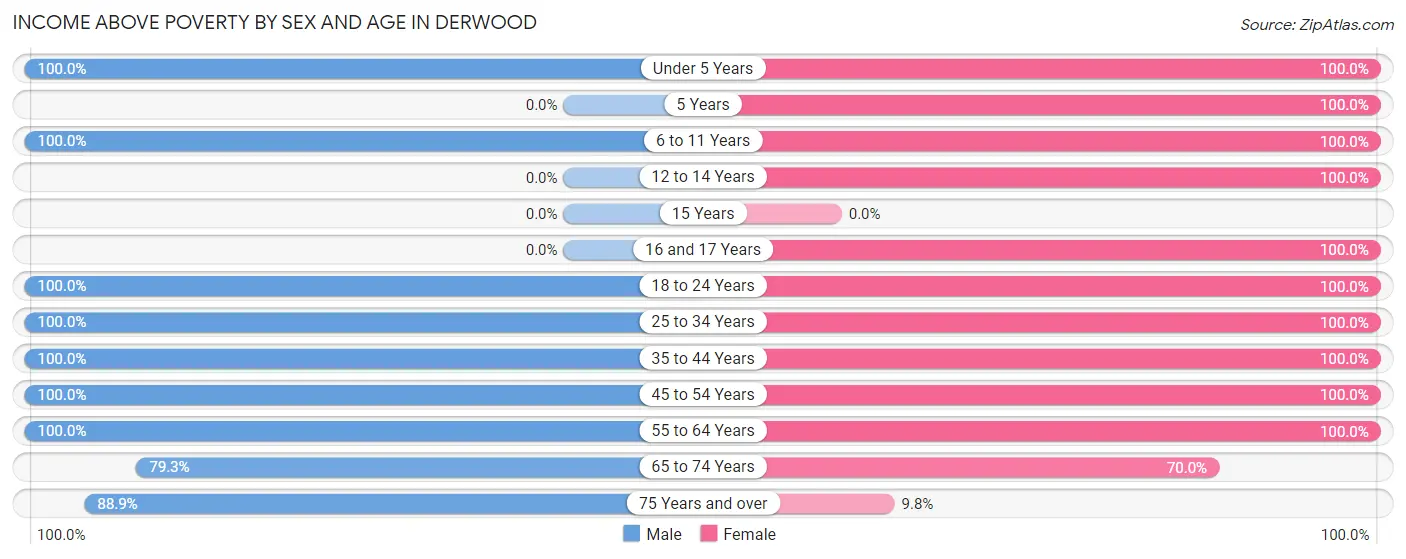
| Age Bracket | Male | Female |
| Under 5 Years | 24 (100.0%) | 53 (100.0%) |
| 5 Years | 0 (0.0%) | 39 (100.0%) |
| 6 to 11 Years | 30 (100.0%) | 148 (100.0%) |
| 12 to 14 Years | 0 (0.0%) | 15 (100.0%) |
| 15 Years | 0 (0.0%) | 0 (0.0%) |
| 16 and 17 Years | 0 (0.0%) | 37 (100.0%) |
| 18 to 24 Years | 78 (100.0%) | 60 (100.0%) |
| 25 to 34 Years | 159 (100.0%) | 187 (100.0%) |
| 35 to 44 Years | 78 (100.0%) | 82 (100.0%) |
| 45 to 54 Years | 102 (100.0%) | 76 (100.0%) |
| 55 to 64 Years | 111 (100.0%) | 151 (100.0%) |
| 65 to 74 Years | 84 (79.2%) | 77 (70.0%) |
| 75 Years and over | 136 (88.9%) | 5 (9.8%) |
| Total | 802 (95.4%) | 930 (92.2%) |
Income Below Poverty Among Married-Couple Families in Derwood
The poverty statistics for married-couple families in Derwood show that 9.5% or 37 of the total 390 families live below the poverty line. Families with no children have the highest poverty rate of 19.3%, comprising of 37 families. On the other hand, families with 1 or 2 children have the lowest poverty rate of 0.0%, which includes 0 families.
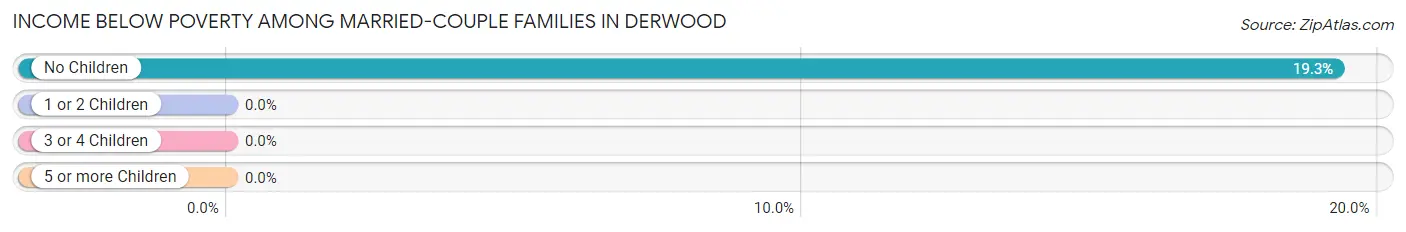
| Children | Above Poverty | Below Poverty |
| No Children | 155 (80.7%) | 37 (19.3%) |
| 1 or 2 Children | 198 (100.0%) | 0 (0.0%) |
| 3 or 4 Children | 0 (0.0%) | 0 (0.0%) |
| 5 or more Children | 0 (0.0%) | 0 (0.0%) |
| Total | 353 (90.5%) | 37 (9.5%) |
Income Below Poverty Among Single-Parent Households in Derwood
| Children | Single Father | Single Mother |
| No Children | 0 (0.0%) | 0 (0.0%) |
| 1 or 2 Children | 0 (0.0%) | 0 (0.0%) |
| 3 or 4 Children | 0 (0.0%) | 0 (0.0%) |
| 5 or more Children | 0 (0.0%) | 0 (0.0%) |
| Total | 0 (0.0%) | 0 (0.0%) |
Income Below Poverty Among Married-Couple vs Single-Parent Households in Derwood
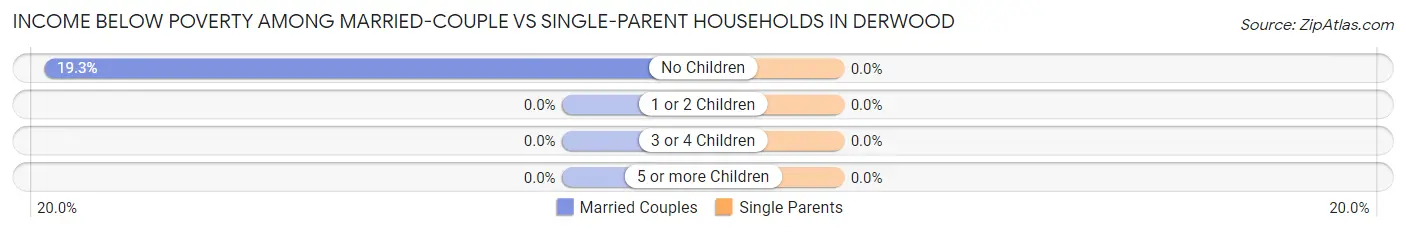
| Children | Married-Couple Families | Single-Parent Households |
| No Children | 37 (19.3%) | 0 (0.0%) |
| 1 or 2 Children | 0 (0.0%) | 0 (0.0%) |
| 3 or 4 Children | 0 (0.0%) | 0 (0.0%) |
| 5 or more Children | 0 (0.0%) | 0 (0.0%) |
| Total | 37 (9.5%) | 0 (0.0%) |
Race in Derwood
The most populous races in Derwood are White / Caucasian (1,102 | 59.6%), Hispanic or Latino (259 | 14.0%), and Black / African American (205 | 11.1%).
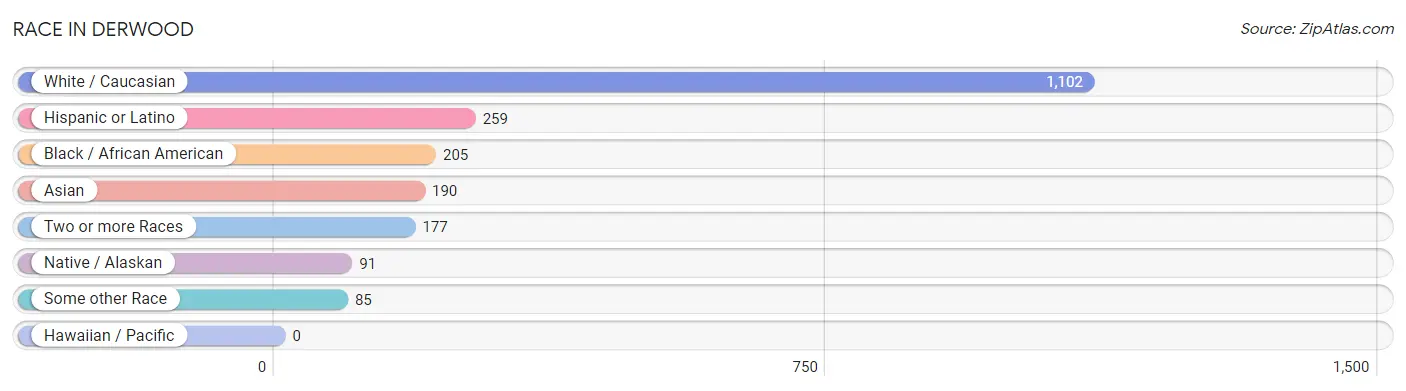
| Race | # Population | % Population |
| Asian | 190 | 10.3% |
| Black / African American | 205 | 11.1% |
| Hawaiian / Pacific | 0 | 0.0% |
| Hispanic or Latino | 259 | 14.0% |
| Native / Alaskan | 91 | 4.9% |
| White / Caucasian | 1,102 | 59.6% |
| Two or more Races | 177 | 9.6% |
| Some other Race | 85 | 4.6% |
| Total | 1,850 | 100.0% |
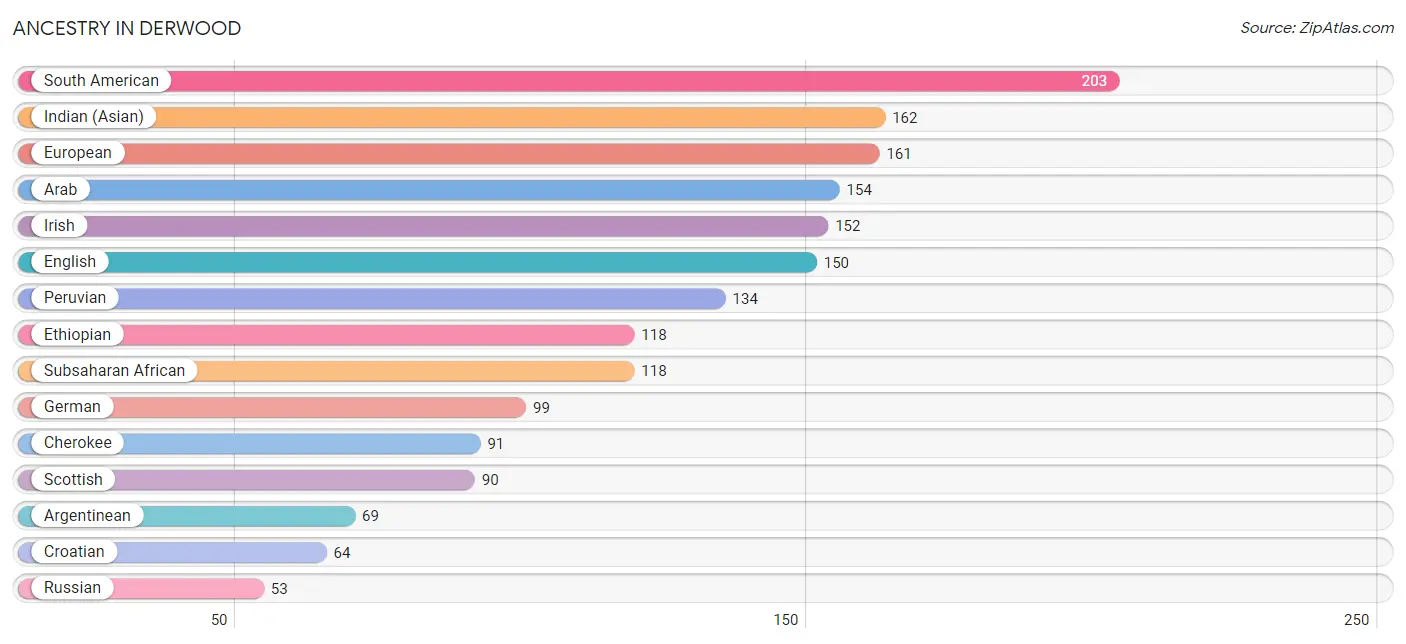
Ancestry in Derwood
The most populous ancestries reported in Derwood are South American (203 | 11.0%), Indian (Asian) (162 | 8.8%), European (161 | 8.7%), Arab (154 | 8.3%), and Irish (152 | 8.2%), together accounting for 45.0% of all Derwood residents.
| Ancestry | # Population | % Population |
| Alsatian | 14 | 0.8% |
| Arab | 154 | 8.3% |
| Argentinean | 69 | 3.7% |
| Armenian | 8 | 0.4% |
| Bhutanese | 19 | 1.0% |
| British | 44 | 2.4% |
| Burmese | 22 | 1.2% |
| Central American | 10 | 0.5% |
| Cherokee | 91 | 4.9% |
| Croatian | 64 | 3.5% |
| Danish | 17 | 0.9% |
| English | 150 | 8.1% |
| Ethiopian | 118 | 6.4% |
| European | 161 | 8.7% |
| Finnish | 17 | 0.9% |
| French | 23 | 1.2% |
| German | 99 | 5.3% |
| Indian (Asian) | 162 | 8.8% |
| Irish | 152 | 8.2% |
| Italian | 34 | 1.8% |
| Korean | 51 | 2.8% |
| Laotian | 45 | 2.4% |
| Mexican | 46 | 2.5% |
| Peruvian | 134 | 7.2% |
| Polish | 47 | 2.5% |
| Russian | 53 | 2.9% |
| Salvadoran | 10 | 0.5% |
| Scottish | 90 | 4.9% |
| South American | 203 | 11.0% |
| Sri Lankan | 22 | 1.2% |
| Subsaharan African | 118 | 6.4% |
| Swiss | 15 | 0.8% |
| Thai | 30 | 1.6% |
| Ukrainian | 17 | 0.9% | View All 34 Rows |
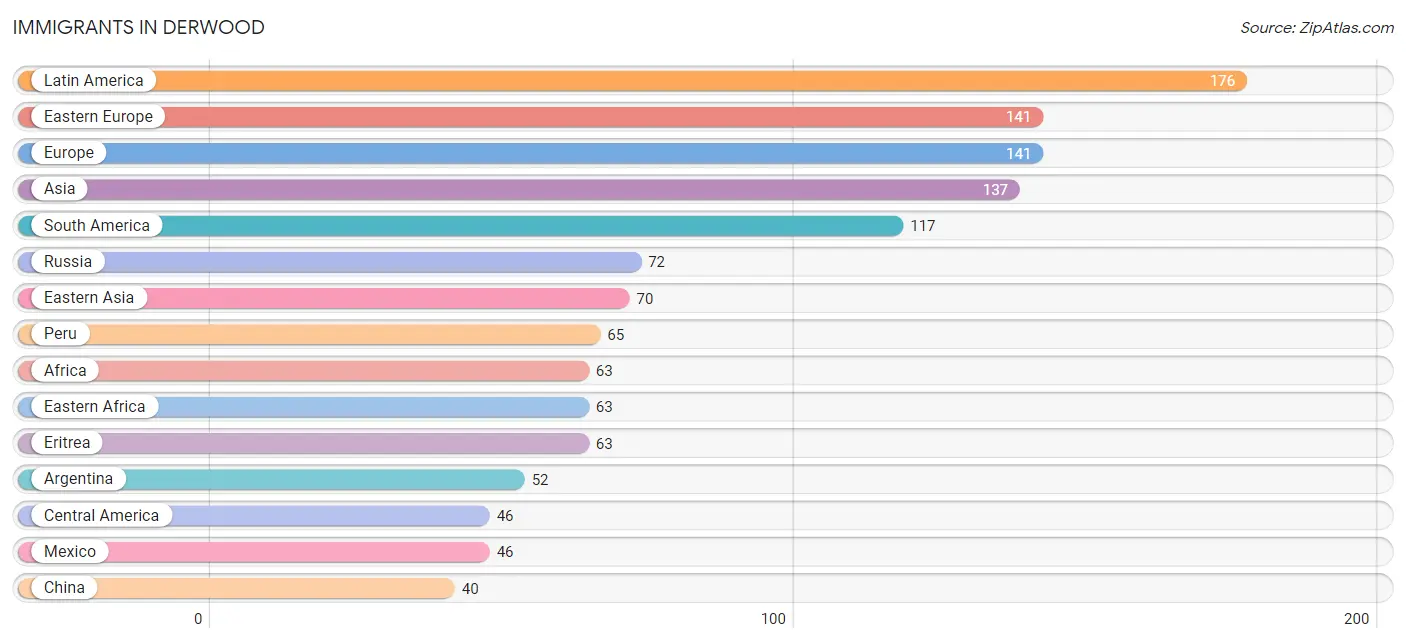
Immigrants in Derwood
The most numerous immigrant groups reported in Derwood came from Latin America (176 | 9.5%), Eastern Europe (141 | 7.6%), Europe (141 | 7.6%), Asia (137 | 7.4%), and South America (117 | 6.3%), together accounting for 38.5% of all Derwood residents.
| Immigration Origin | # Population | % Population |
| Africa | 63 | 3.4% |
| Argentina | 52 | 2.8% |
| Asia | 137 | 7.4% |
| Bahamas | 13 | 0.7% |
| Caribbean | 13 | 0.7% |
| Central America | 46 | 2.5% |
| China | 40 | 2.2% |
| Eastern Africa | 63 | 3.4% |
| Eastern Asia | 70 | 3.8% |
| Eastern Europe | 141 | 7.6% |
| Eritrea | 63 | 3.4% |
| Europe | 141 | 7.6% |
| India | 16 | 0.9% |
| Indonesia | 15 | 0.8% |
| Japan | 19 | 1.0% |
| Korea | 11 | 0.6% |
| Latin America | 176 | 9.5% |
| Mexico | 46 | 2.5% |
| Pakistan | 14 | 0.8% |
| Peru | 65 | 3.5% |
| Russia | 72 | 3.9% |
| South America | 117 | 6.3% |
| South Central Asia | 30 | 1.6% |
| South Eastern Asia | 37 | 2.0% |
| Ukraine | 33 | 1.8% |
| Vietnam | 22 | 1.2% | View All 26 Rows |
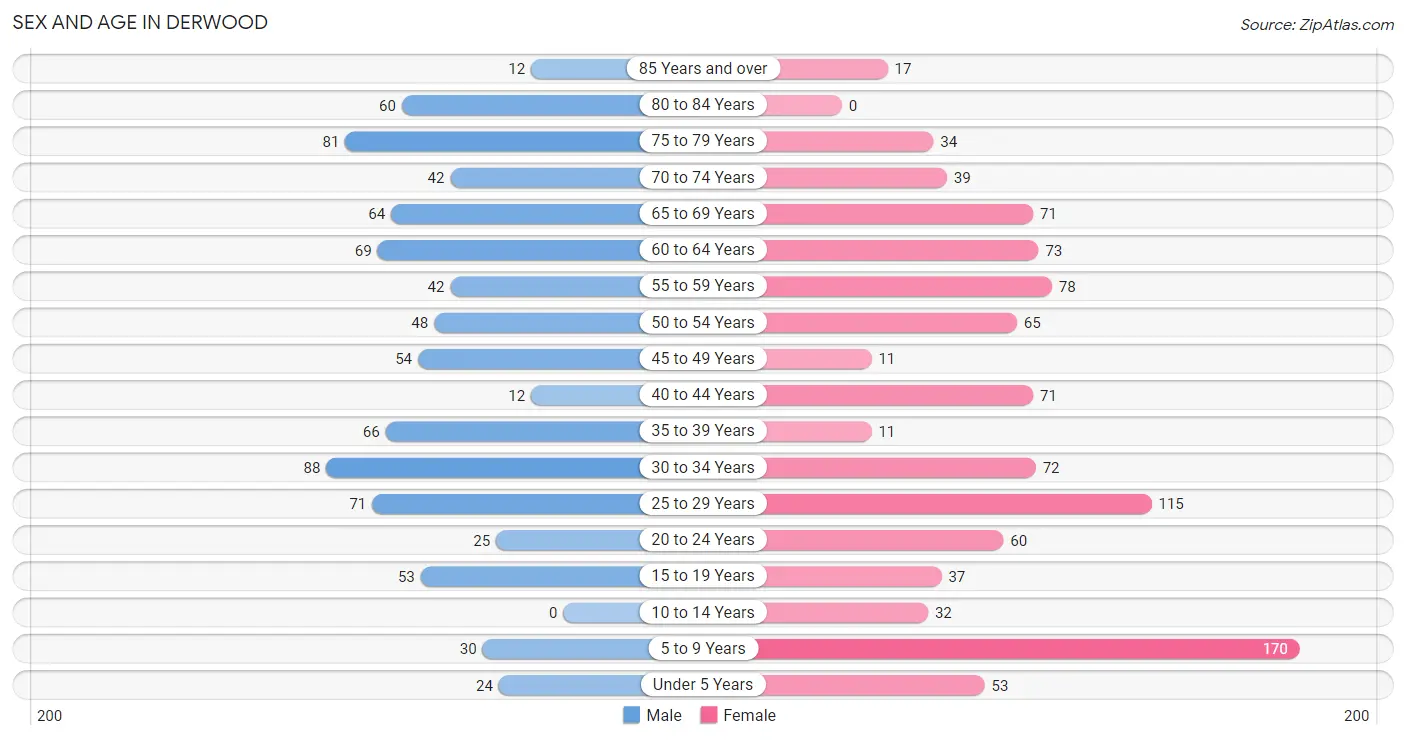
Sex and Age in Derwood
Sex and Age in Derwood
The most populous age groups in Derwood are 30 to 34 Years (88 | 10.5%) for men and 5 to 9 Years (170 | 16.9%) for women.
| Age Bracket | Male | Female |
| Under 5 Years | 24 (2.9%) | 53 (5.2%) |
| 5 to 9 Years | 30 (3.6%) | 170 (16.9%) |
| 10 to 14 Years | 0 (0.0%) | 32 (3.2%) |
| 15 to 19 Years | 53 (6.3%) | 37 (3.7%) |
| 20 to 24 Years | 25 (3.0%) | 60 (5.9%) |
| 25 to 29 Years | 71 (8.4%) | 115 (11.4%) |
| 30 to 34 Years | 88 (10.5%) | 72 (7.1%) |
| 35 to 39 Years | 66 (7.9%) | 11 (1.1%) |
| 40 to 44 Years | 12 (1.4%) | 71 (7.0%) |
| 45 to 49 Years | 54 (6.4%) | 11 (1.1%) |
| 50 to 54 Years | 48 (5.7%) | 65 (6.4%) |
| 55 to 59 Years | 42 (5.0%) | 78 (7.7%) |
| 60 to 64 Years | 69 (8.2%) | 73 (7.2%) |
| 65 to 69 Years | 64 (7.6%) | 71 (7.0%) |
| 70 to 74 Years | 42 (5.0%) | 39 (3.9%) |
| 75 to 79 Years | 81 (9.6%) | 34 (3.4%) |
| 80 to 84 Years | 60 (7.1%) | 0 (0.0%) |
| 85 Years and over | 12 (1.4%) | 17 (1.7%) |
| Total | 841 (100.0%) | 1,009 (100.0%) |
Families and Households in Derwood
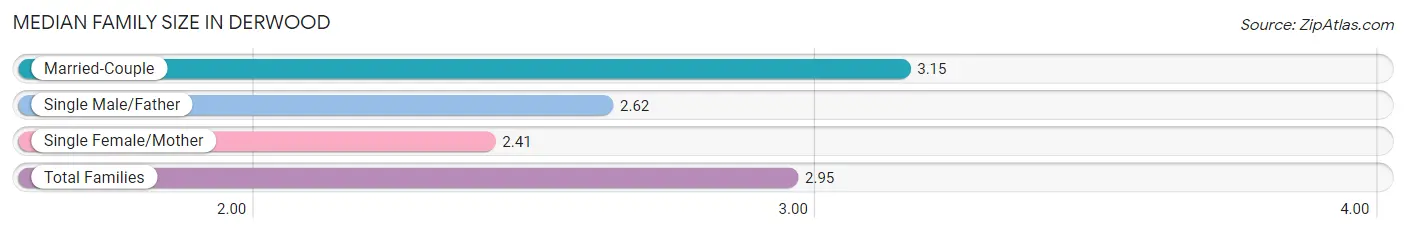
Median Family Size in Derwood
The median family size in Derwood is 2.95 persons per family, with married-couple families (390 | 70.9%) accounting for the largest median family size of 3.15 persons per family. On the other hand, single female/mother families (115 | 20.9%) represent the smallest median family size with 2.41 persons per family.
| Family Type | # Families | Family Size |
| Married-Couple | 390 (70.9%) | 3.15 |
| Single Male/Father | 45 (8.2%) | 2.62 |
| Single Female/Mother | 115 (20.9%) | 2.41 |
| Total Families | 550 (100.0%) | 2.95 |
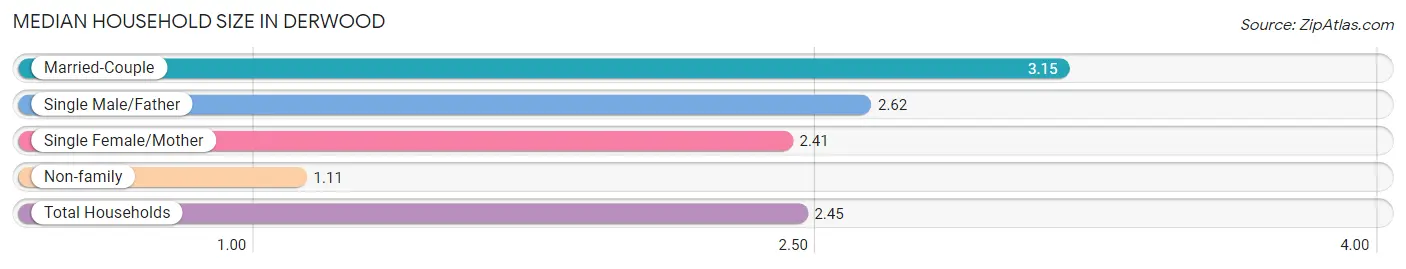
Median Household Size in Derwood
The median household size in Derwood is 2.45 persons per household, with married-couple households (390 | 51.7%) accounting for the largest median household size of 3.15 persons per household. non-family households (205 | 27.2%) represent the smallest median household size with 1.11 persons per household.
| Household Type | # Households | Household Size |
| Married-Couple | 390 (51.7%) | 3.15 |
| Single Male/Father | 45 (6.0%) | 2.62 |
| Single Female/Mother | 115 (15.2%) | 2.41 |
| Non-family | 205 (27.2%) | 1.11 |
| Total Households | 755 (100.0%) | 2.45 |
Household Size by Marriage Status in Derwood
Out of a total of 755 households in Derwood, 550 (72.9%) are family households, while 205 (27.2%) are nonfamily households. The most numerous type of family households are 2-person households, comprising 237, and the most common type of nonfamily households are 1-person households, comprising 182.
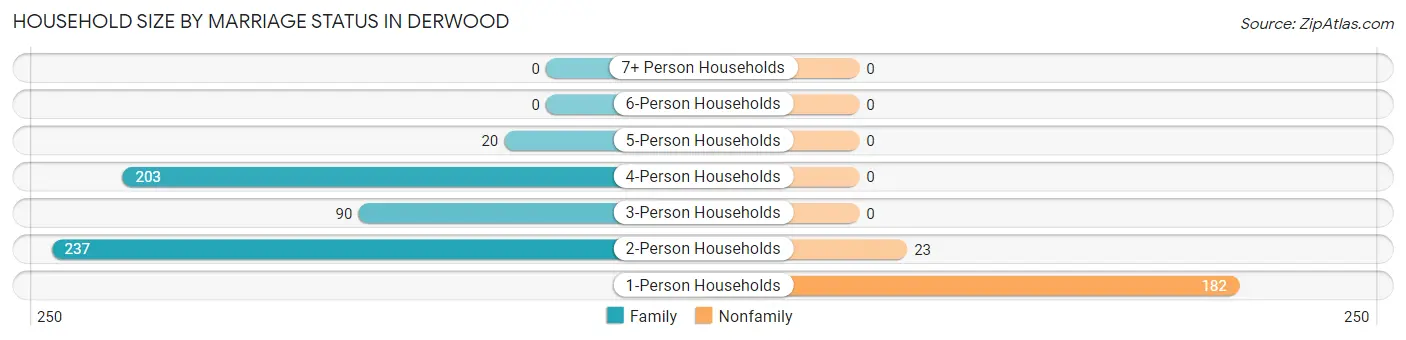
| Household Size | Family Households | Nonfamily Households |
| 1-Person Households | - | 182 (24.1%) |
| 2-Person Households | 237 (31.4%) | 23 (3.0%) |
| 3-Person Households | 90 (11.9%) | 0 (0.0%) |
| 4-Person Households | 203 (26.9%) | 0 (0.0%) |
| 5-Person Households | 20 (2.6%) | 0 (0.0%) |
| 6-Person Households | 0 (0.0%) | 0 (0.0%) |
| 7+ Person Households | 0 (0.0%) | 0 (0.0%) |
| Total | 550 (72.9%) | 205 (27.2%) |
Female Fertility in Derwood
Fertility by Age in Derwood
Average fertility rate in Derwood is 25.0 births per 1,000 women. Women in the age bracket of 20 to 34 years have the highest fertility rate with 40.0 births per 1,000 women. Women in the age bracket of 20 to 34 years acount for 100.0% of all women with births.
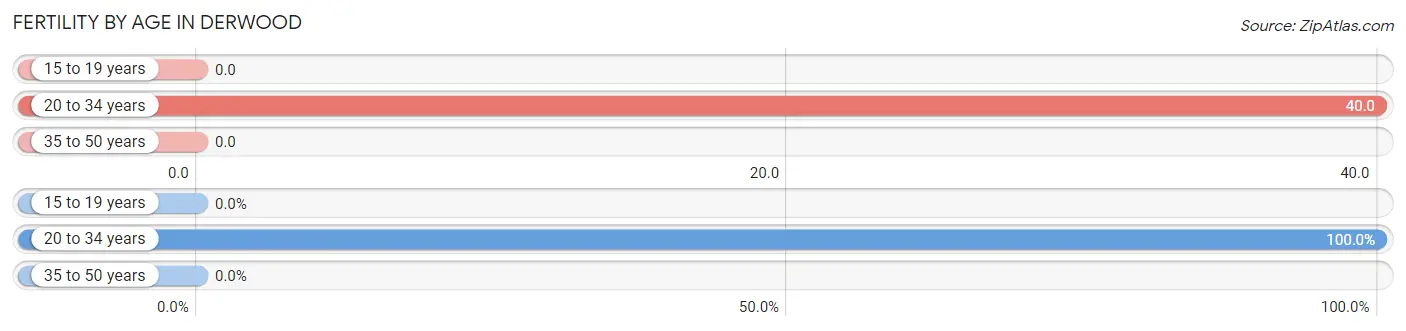
| Age Bracket | Women with Births | Births / 1,000 Women |
| 15 to 19 years | 0 (0.0%) | 0.0 |
| 20 to 34 years | 10 (100.0%) | 40.0 |
| 35 to 50 years | 0 (0.0%) | 0.0 |
| Total | 10 (100.0%) | 25.0 |
Fertility by Age by Marriage Status in Derwood
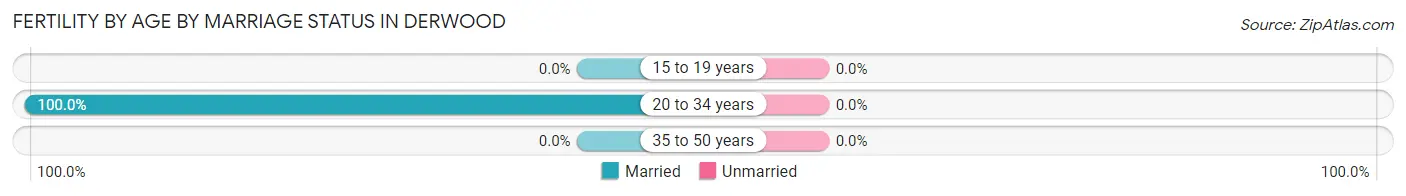
| Age Bracket | Married | Unmarried |
| 15 to 19 years | 0 (0.0%) | 0 (0.0%) |
| 20 to 34 years | 10 (100.0%) | 0 (0.0%) |
| 35 to 50 years | 0 (0.0%) | 0 (0.0%) |
| Total | 10 (100.0%) | 0 (0.0%) |
Fertility by Education in Derwood
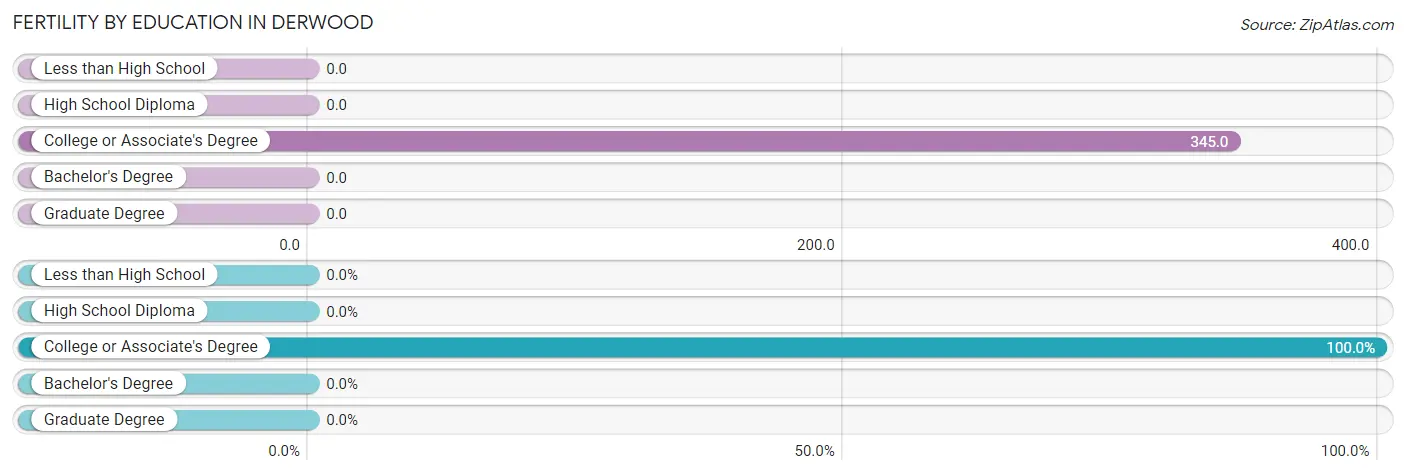
| Educational Attainment | Women with Births | Births / 1,000 Women |
| Less than High School | 0 (0.0%) | 0.0 |
| High School Diploma | 0 (0.0%) | 0.0 |
| College or Associate's Degree | 10 (100.0%) | 345.0 |
| Bachelor's Degree | 0 (0.0%) | 0.0 |
| Graduate Degree | 0 (0.0%) | 0.0 |
| Total | 10 (100.0%) | 25.0 |
Fertility by Education by Marriage Status in Derwood
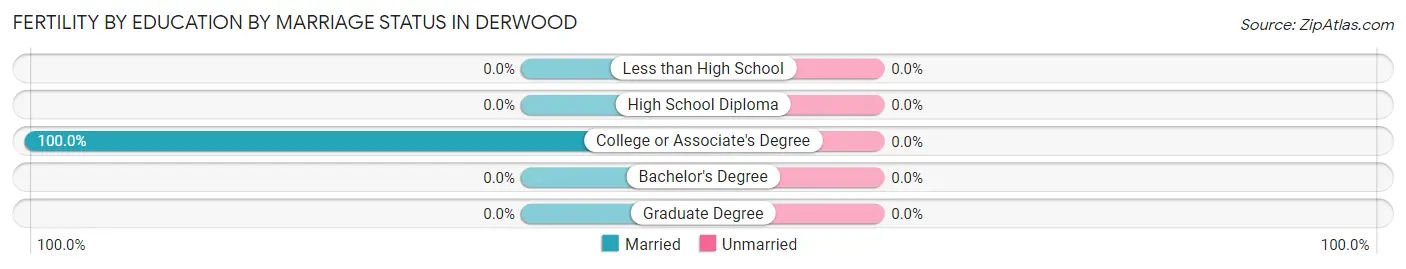
| Educational Attainment | Married | Unmarried |
| Less than High School | 0 (0.0%) | 0 (0.0%) |
| High School Diploma | 0 (0.0%) | 0 (0.0%) |
| College or Associate's Degree | 10 (100.0%) | 0 (0.0%) |
| Bachelor's Degree | 0 (0.0%) | 0 (0.0%) |
| Graduate Degree | 0 (0.0%) | 0 (0.0%) |
| Total | 10 (100.0%) | 0 (0.0%) |
Employment Characteristics in Derwood
Employment by Class of Employer in Derwood
Among the 915 employed individuals in Derwood, private company employees (486 | 53.1%), not-for-profit organizations (199 | 21.7%), and federal government employees (120 | 13.1%) make up the most common classes of employment.
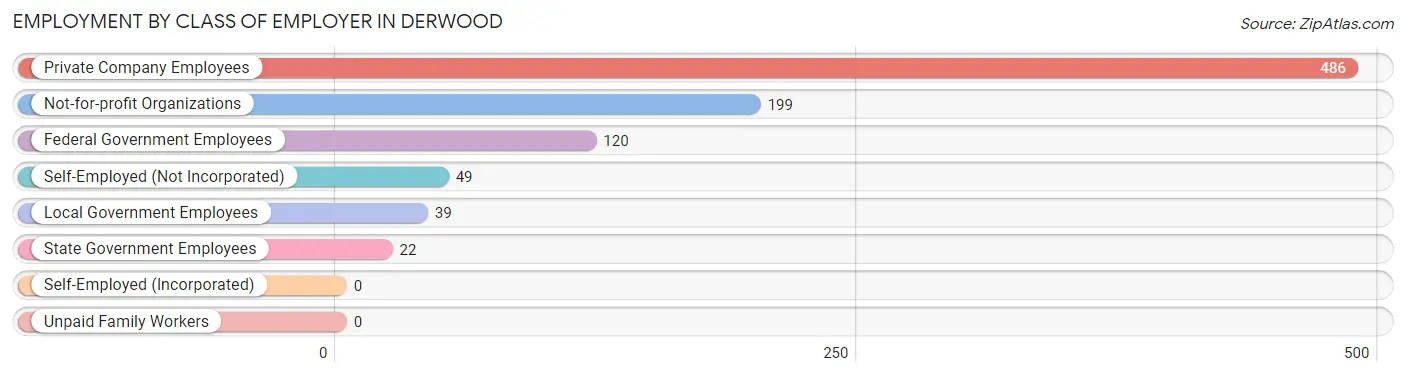
| Employer Class | # Employees | % Employees |
| Private Company Employees | 486 | 53.1% |
| Self-Employed (Incorporated) | 0 | 0.0% |
| Self-Employed (Not Incorporated) | 49 | 5.4% |
| Not-for-profit Organizations | 199 | 21.7% |
| Local Government Employees | 39 | 4.3% |
| State Government Employees | 22 | 2.4% |
| Federal Government Employees | 120 | 13.1% |
| Unpaid Family Workers | 0 | 0.0% |
| Total | 915 | 100.0% |
Employment Status by Age in Derwood
According to the labor force statistics for Derwood, out of the total population over 16 years of age (1,541), 63.5% or 979 individuals are in the labor force, with 6.6% or 65 of them unemployed. The age group with the highest labor force participation rate is 20 to 24 years, with 100.0% or 85 individuals in the labor force. Within the labor force, the 30 to 34 years age range has the highest percentage of unemployed individuals, with 22.8% or 36 of them being unemployed.
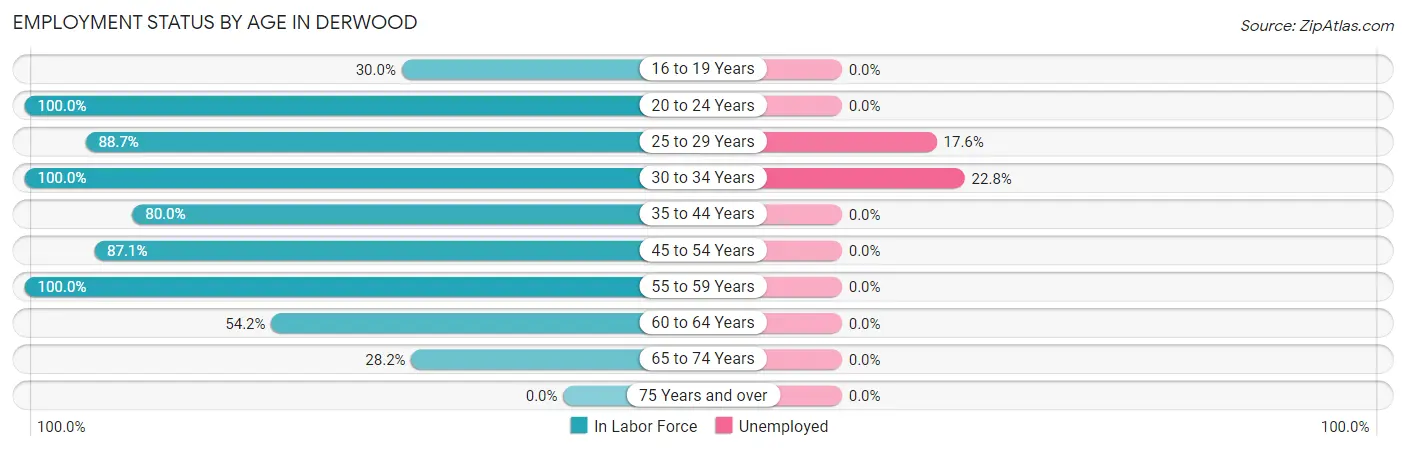
| Age Bracket | In Labor Force | Unemployed |
| 16 to 19 Years | 27 (30.0%) | 0 (0.0%) |
| 20 to 24 Years | 85 (100.0%) | 0 (0.0%) |
| 25 to 29 Years | 165 (88.7%) | 29 (17.6%) |
| 30 to 34 Years | 160 (100.0%) | 36 (22.8%) |
| 35 to 44 Years | 128 (80.0%) | 0 (0.0%) |
| 45 to 54 Years | 155 (87.1%) | 0 (0.0%) |
| 55 to 59 Years | 120 (100.0%) | 0 (0.0%) |
| 60 to 64 Years | 77 (54.2%) | 0 (0.0%) |
| 65 to 74 Years | 61 (28.2%) | 0 (0.0%) |
| 75 Years and over | 0 (0.0%) | 0 (0.0%) |
| Total | 979 (63.5%) | 65 (6.6%) |
Employment Status by Educational Attainment in Derwood
According to labor force statistics for Derwood, 85.1% of individuals (805) out of the total population between 25 and 64 years of age (946) are in the labor force, with 8.1% or 65 of them being unemployed. The group with the highest labor force participation rate are those with the educational attainment of college / associate degree, with 100.0% or 85 individuals in the labor force. Within the labor force, individuals with high school diploma education have the highest percentage of unemployment, with 36.6% or 63 of them being unemployed.
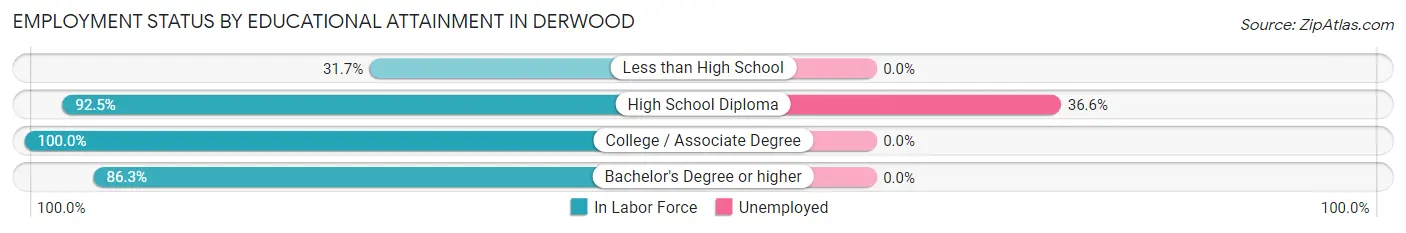
| Educational Attainment | In Labor Force | Unemployed |
| Less than High School | 20 (31.7%) | 0 (0.0%) |
| High School Diploma | 172 (92.5%) | 68 (36.6%) |
| College / Associate Degree | 85 (100.0%) | 0 (0.0%) |
| Bachelor's Degree or higher | 528 (86.3%) | 0 (0.0%) |
| Total | 805 (85.1%) | 77 (8.1%) |
Employment Occupations by Sex in Derwood
Management, Business, Science and Arts Occupations
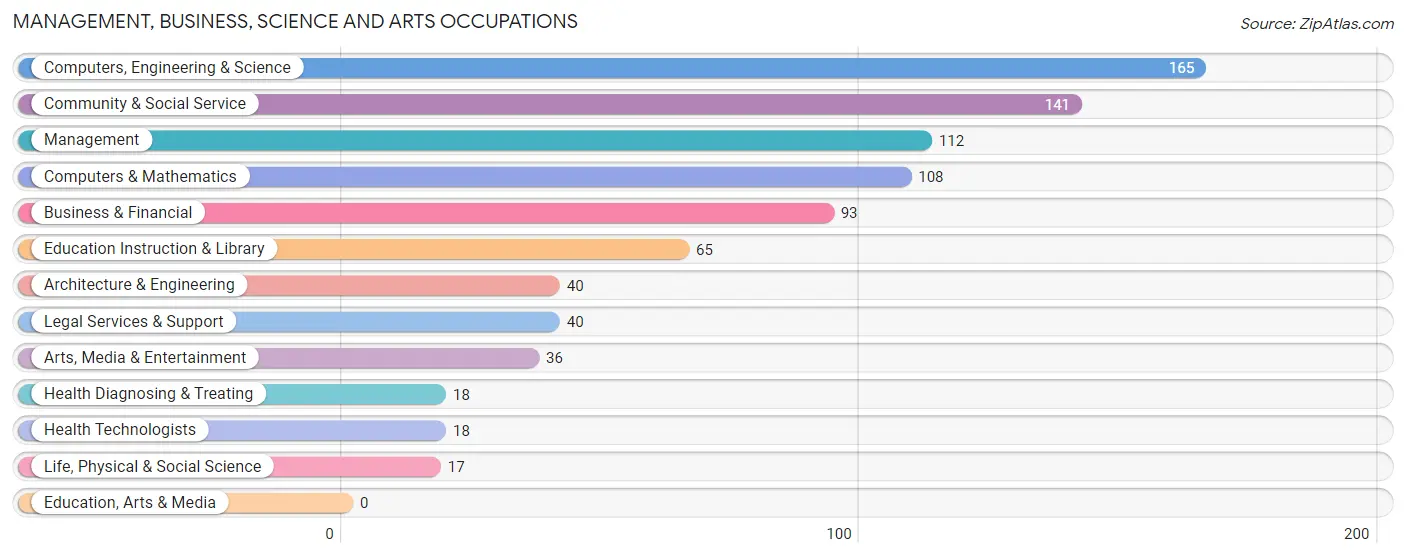
The most common Management, Business, Science and Arts occupations in Derwood are Computers, Engineering & Science (165 | 18.6%), Community & Social Service (141 | 15.9%), Management (112 | 12.6%), Computers & Mathematics (108 | 12.1%), and Business & Financial (93 | 10.5%).
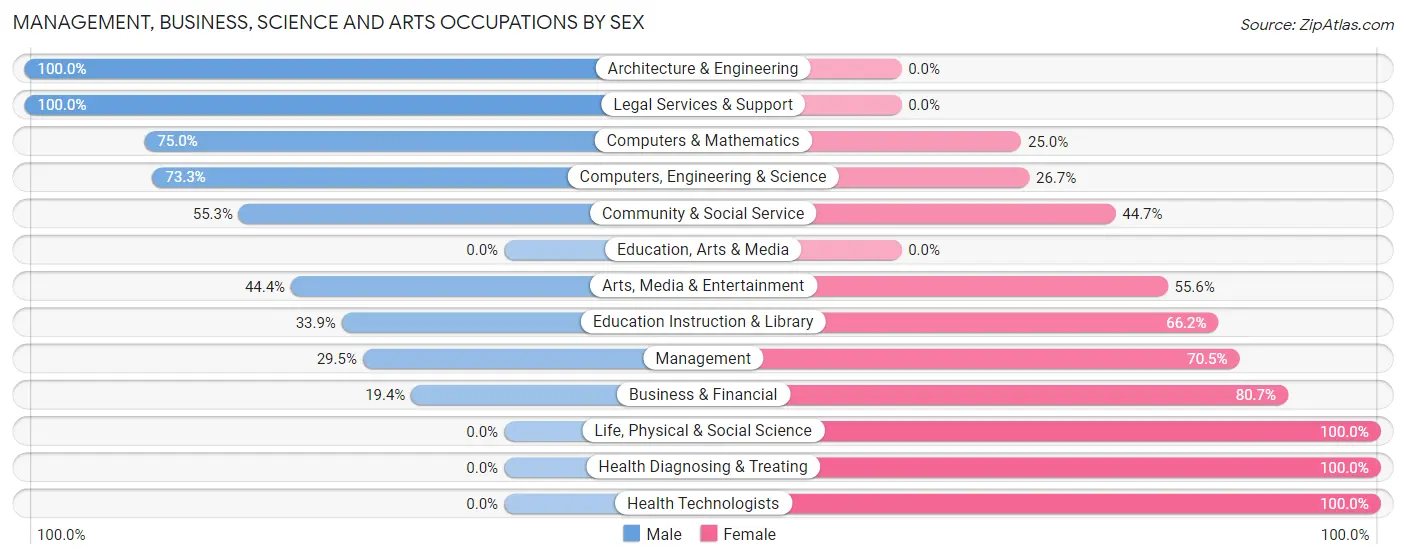
Management, Business, Science and Arts Occupations by Sex
Within the Management, Business, Science and Arts occupations in Derwood, the most male-oriented occupations are Architecture & Engineering (100.0%), Legal Services & Support (100.0%), and Computers & Mathematics (75.0%), while the most female-oriented occupations are Life, Physical & Social Science (100.0%), Health Diagnosing & Treating (100.0%), and Health Technologists (100.0%).
| Occupation | Male | Female |
| Management | 33 (29.5%) | 79 (70.5%) |
| Business & Financial | 18 (19.4%) | 75 (80.6%) |
| Computers, Engineering & Science | 121 (73.3%) | 44 (26.7%) |
| Computers & Mathematics | 81 (75.0%) | 27 (25.0%) |
| Architecture & Engineering | 40 (100.0%) | 0 (0.0%) |
| Life, Physical & Social Science | 0 (0.0%) | 17 (100.0%) |
| Community & Social Service | 78 (55.3%) | 63 (44.7%) |
| Education, Arts & Media | 0 (0.0%) | 0 (0.0%) |
| Legal Services & Support | 40 (100.0%) | 0 (0.0%) |
| Education Instruction & Library | 22 (33.9%) | 43 (66.1%) |
| Arts, Media & Entertainment | 16 (44.4%) | 20 (55.6%) |
| Health Diagnosing & Treating | 0 (0.0%) | 18 (100.0%) |
| Health Technologists | 0 (0.0%) | 18 (100.0%) |
| Total (Category) | 250 (47.3%) | 279 (52.7%) |
| Total (Overall) | 428 (48.1%) | 461 (51.9%) |
Services Occupations
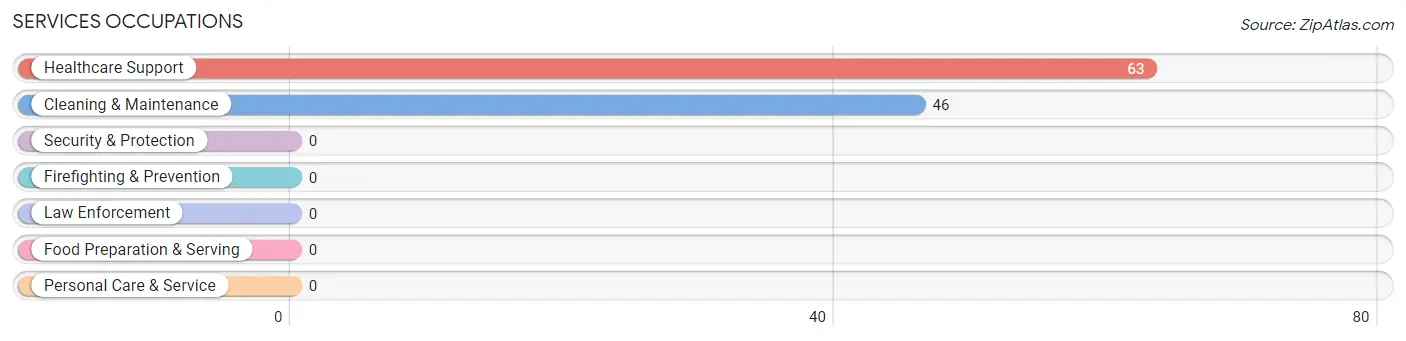
The most common Services occupations in Derwood are Healthcare Support (63 | 7.1%), and Cleaning & Maintenance (46 | 5.2%).
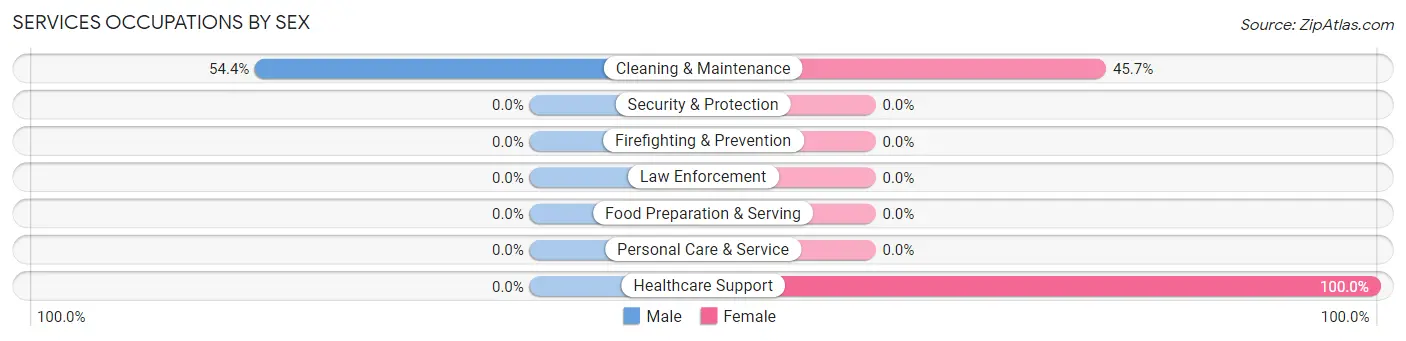
Services Occupations by Sex
| Occupation | Male | Female |
| Healthcare Support | 0 (0.0%) | 63 (100.0%) |
| Security & Protection | 0 (0.0%) | 0 (0.0%) |
| Firefighting & Prevention | 0 (0.0%) | 0 (0.0%) |
| Law Enforcement | 0 (0.0%) | 0 (0.0%) |
| Food Preparation & Serving | 0 (0.0%) | 0 (0.0%) |
| Cleaning & Maintenance | 25 (54.3%) | 21 (45.7%) |
| Personal Care & Service | 0 (0.0%) | 0 (0.0%) |
| Total (Category) | 25 (22.9%) | 84 (77.1%) |
| Total (Overall) | 428 (48.1%) | 461 (51.9%) |
Sales and Office Occupations
The most common Sales and Office occupations in Derwood are Office & Administration (121 | 13.6%), and Sales & Related (97 | 10.9%).
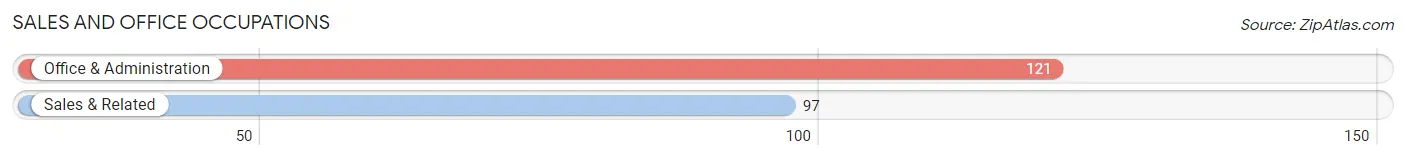
Sales and Office Occupations by Sex
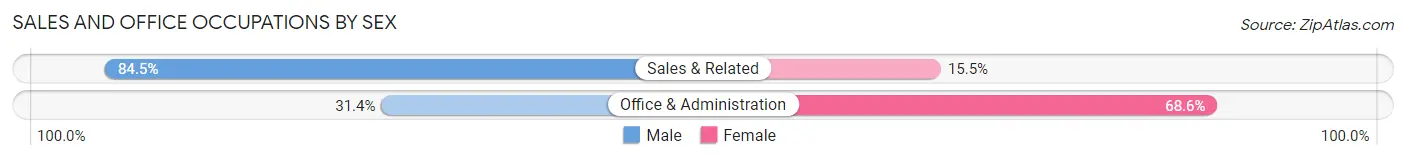
| Occupation | Male | Female |
| Sales & Related | 82 (84.5%) | 15 (15.5%) |
| Office & Administration | 38 (31.4%) | 83 (68.6%) |
| Total (Category) | 120 (55.0%) | 98 (45.0%) |
| Total (Overall) | 428 (48.1%) | 461 (51.9%) |
Natural Resources, Construction and Maintenance Occupations
The most common Natural Resources, Construction and Maintenance occupations in Derwood are , and Construction & Extraction (20 | 2.2%).
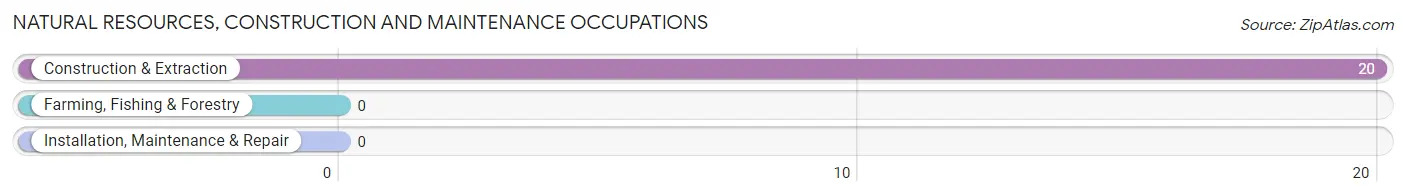
Natural Resources, Construction and Maintenance Occupations by Sex
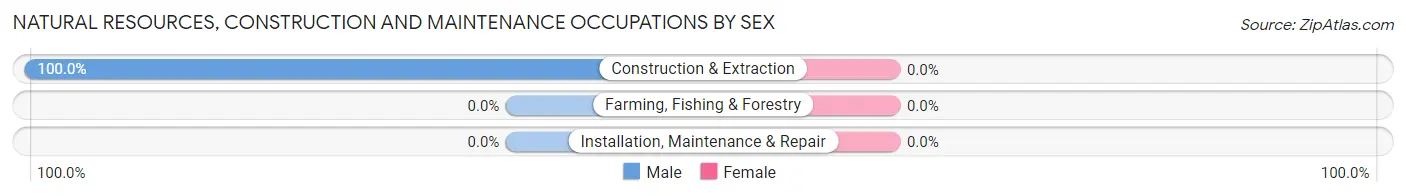
| Occupation | Male | Female |
| Farming, Fishing & Forestry | 0 (0.0%) | 0 (0.0%) |
| Construction & Extraction | 20 (100.0%) | 0 (0.0%) |
| Installation, Maintenance & Repair | 0 (0.0%) | 0 (0.0%) |
| Total (Category) | 20 (100.0%) | 0 (0.0%) |
| Total (Overall) | 428 (48.1%) | 461 (51.9%) |
Production, Transportation and Moving Occupations
The most common Production, Transportation and Moving occupations in Derwood are , and Material Moving (13 | 1.5%).
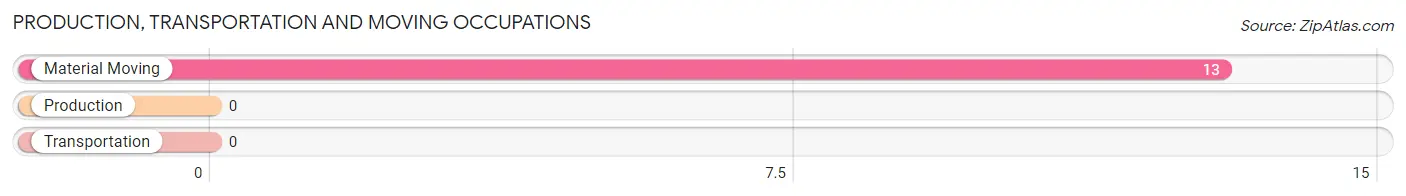
Production, Transportation and Moving Occupations by Sex
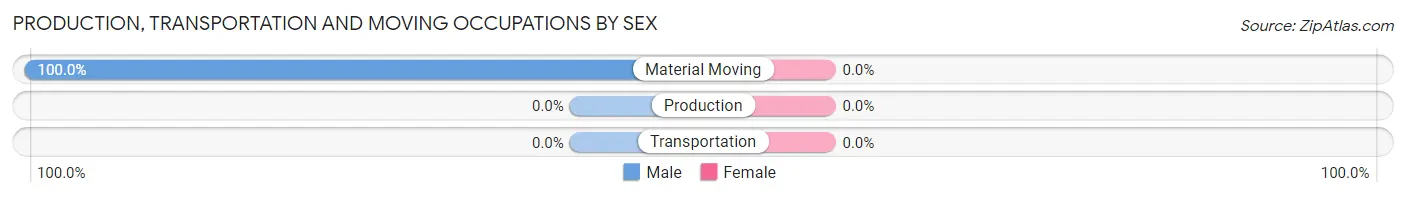
| Occupation | Male | Female |
| Production | 0 (0.0%) | 0 (0.0%) |
| Transportation | 0 (0.0%) | 0 (0.0%) |
| Material Moving | 13 (100.0%) | 0 (0.0%) |
| Total (Category) | 13 (100.0%) | 0 (0.0%) |
| Total (Overall) | 428 (48.1%) | 461 (51.9%) |
Employment Industries by Sex in Derwood
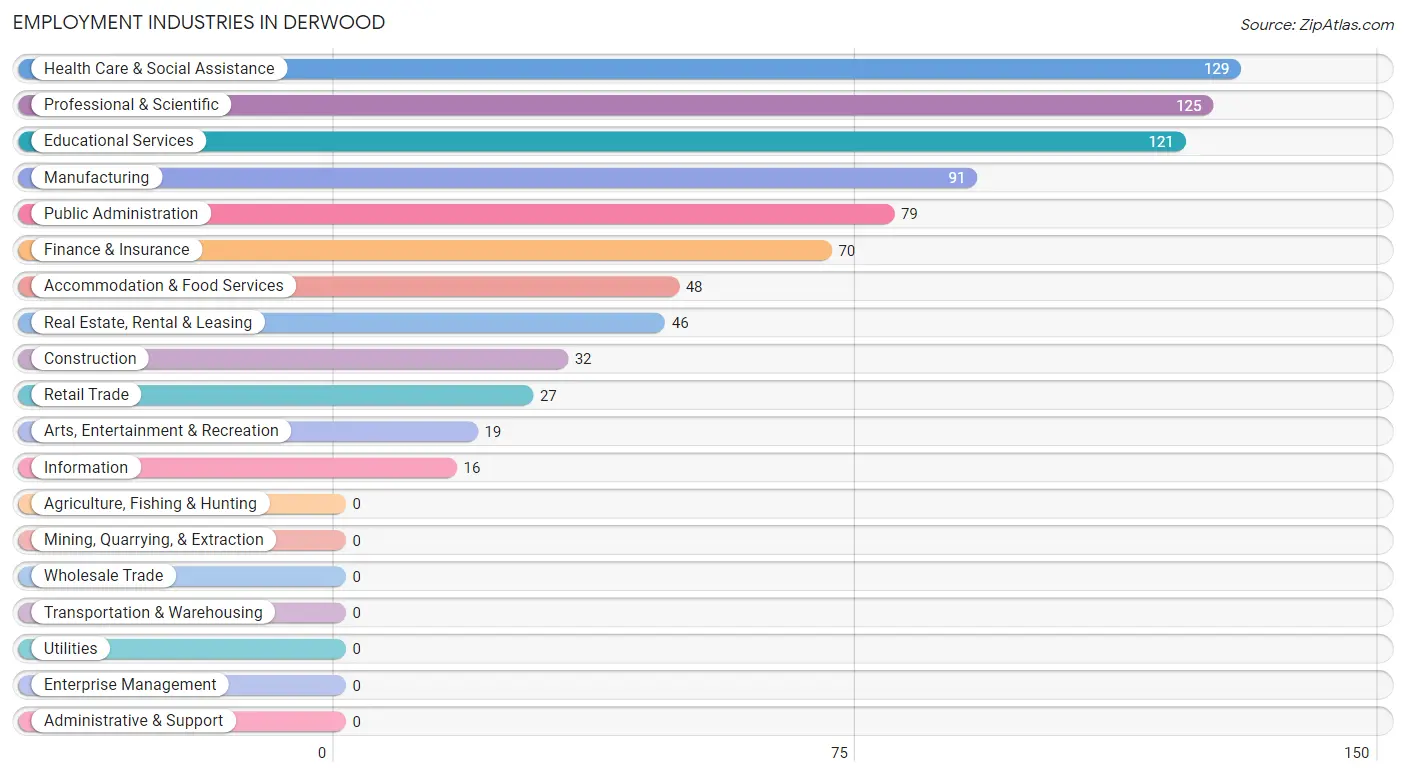
Employment Industries in Derwood
The major employment industries in Derwood include Health Care & Social Assistance (129 | 14.5%), Professional & Scientific (125 | 14.1%), Educational Services (121 | 13.6%), Manufacturing (91 | 10.2%), and Public Administration (79 | 8.9%).
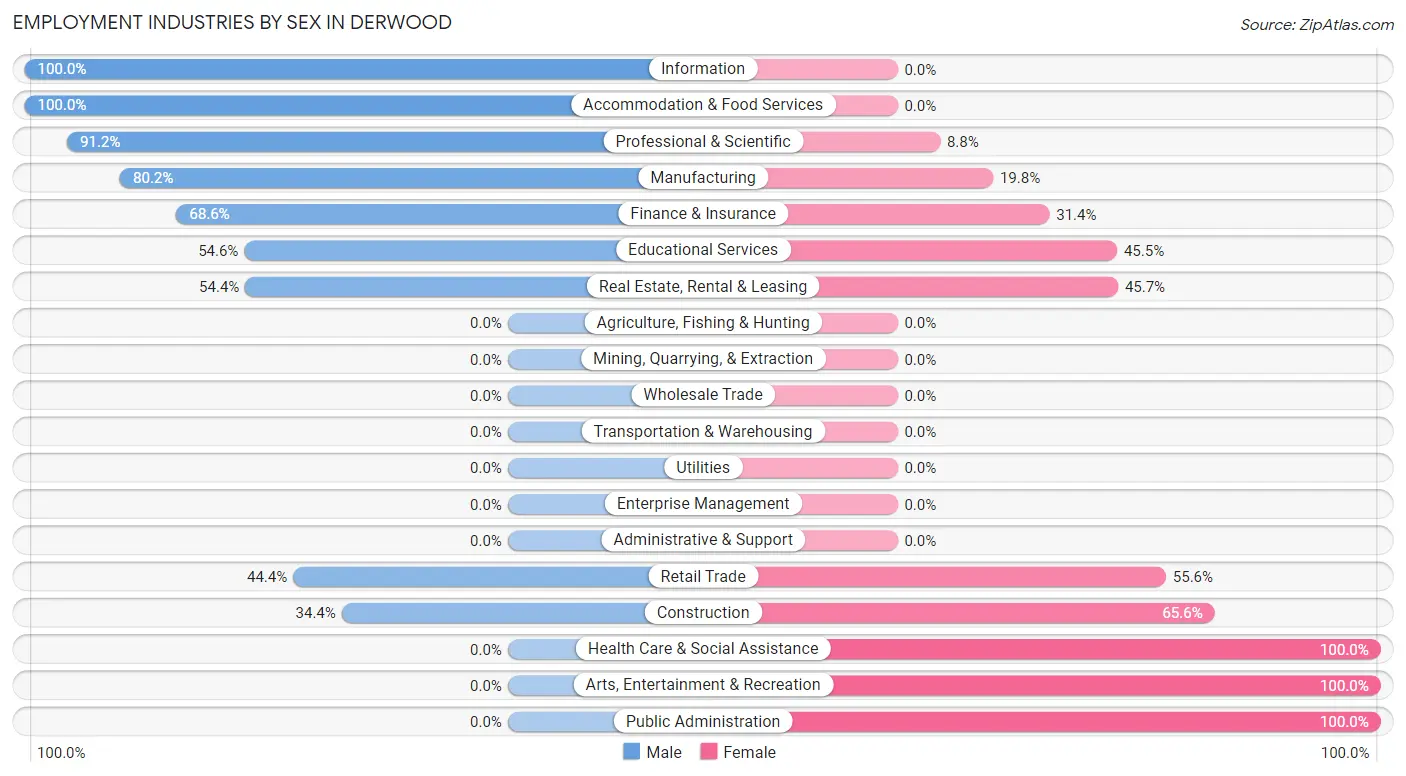
Employment Industries by Sex in Derwood
The Derwood industries that see more men than women are Information (100.0%), Accommodation & Food Services (100.0%), and Professional & Scientific (91.2%), whereas the industries that tend to have a higher number of women are Health Care & Social Assistance (100.0%), Arts, Entertainment & Recreation (100.0%), and Public Administration (100.0%).
| Industry | Male | Female |
| Agriculture, Fishing & Hunting | 0 (0.0%) | 0 (0.0%) |
| Mining, Quarrying, & Extraction | 0 (0.0%) | 0 (0.0%) |
| Construction | 11 (34.4%) | 21 (65.6%) |
| Manufacturing | 73 (80.2%) | 18 (19.8%) |
| Wholesale Trade | 0 (0.0%) | 0 (0.0%) |
| Retail Trade | 12 (44.4%) | 15 (55.6%) |
| Transportation & Warehousing | 0 (0.0%) | 0 (0.0%) |
| Utilities | 0 (0.0%) | 0 (0.0%) |
| Information | 16 (100.0%) | 0 (0.0%) |
| Finance & Insurance | 48 (68.6%) | 22 (31.4%) |
| Real Estate, Rental & Leasing | 25 (54.3%) | 21 (45.7%) |
| Professional & Scientific | 114 (91.2%) | 11 (8.8%) |
| Enterprise Management | 0 (0.0%) | 0 (0.0%) |
| Administrative & Support | 0 (0.0%) | 0 (0.0%) |
| Educational Services | 66 (54.5%) | 55 (45.5%) |
| Health Care & Social Assistance | 0 (0.0%) | 129 (100.0%) |
| Arts, Entertainment & Recreation | 0 (0.0%) | 19 (100.0%) |
| Accommodation & Food Services | 48 (100.0%) | 0 (0.0%) |
| Public Administration | 0 (0.0%) | 79 (100.0%) |
| Total | 428 (48.1%) | 461 (51.9%) |
Education in Derwood
School Enrollment in Derwood
The most common levels of schooling among the 413 students in Derwood are elementary school (161 | 39.0%), college / undergraduate (100 | 24.2%), and high school (78 | 18.9%).
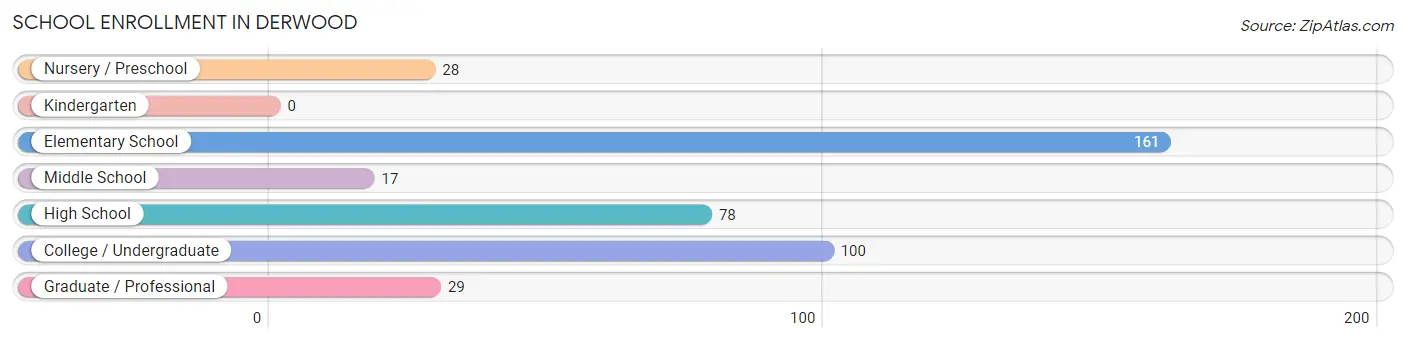
| School Level | # Students | % Students |
| Nursery / Preschool | 28 | 6.8% |
| Kindergarten | 0 | 0.0% |
| Elementary School | 161 | 39.0% |
| Middle School | 17 | 4.1% |
| High School | 78 | 18.9% |
| College / Undergraduate | 100 | 24.2% |
| Graduate / Professional | 29 | 7.0% |
| Total | 413 | 100.0% |
School Enrollment by Age by Funding Source in Derwood
Out of a total of 413 students who are enrolled in schools in Derwood, 132 (32.0%) attend a private institution, while the remaining 281 (68.0%) are enrolled in public schools. The age group of 18 to 19 year olds has the highest likelihood of being enrolled in private schools, with 53 (100.0% in the age bracket) enrolled. Conversely, the age group of 10 to 14 year olds has the lowest likelihood of being enrolled in a private school, with 32 (100.0% in the age bracket) attending a public institution.
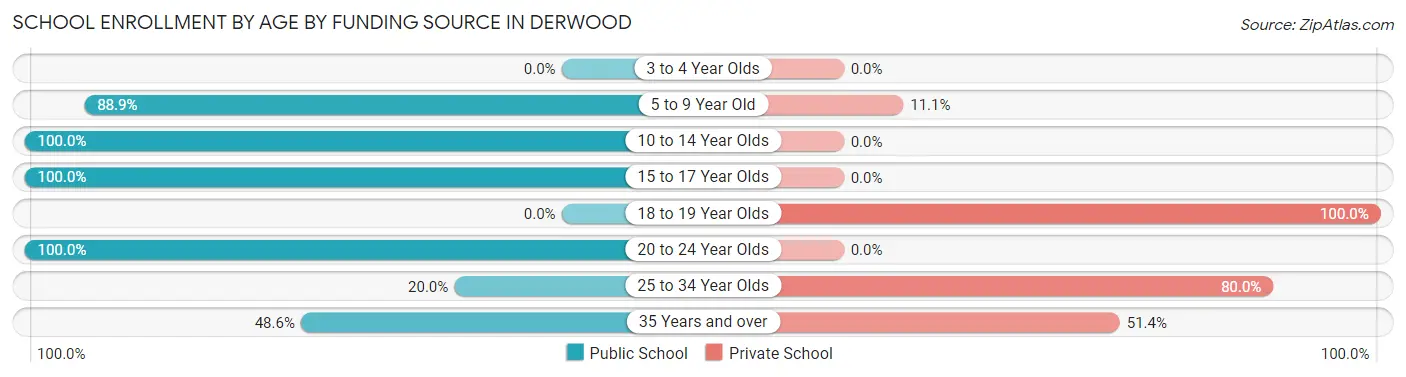
| Age Bracket | Public School | Private School |
| 3 to 4 Year Olds | 0 (0.0%) | 0 (0.0%) |
| 5 to 9 Year Old | 168 (88.9%) | 21 (11.1%) |
| 10 to 14 Year Olds | 32 (100.0%) | 0 (0.0%) |
| 15 to 17 Year Olds | 37 (100.0%) | 0 (0.0%) |
| 18 to 19 Year Olds | 0 (0.0%) | 53 (100.0%) |
| 20 to 24 Year Olds | 17 (100.0%) | 0 (0.0%) |
| 25 to 34 Year Olds | 10 (20.0%) | 40 (80.0%) |
| 35 Years and over | 17 (48.6%) | 18 (51.4%) |
| Total | 281 (68.0%) | 132 (32.0%) |
Educational Attainment by Field of Study in Derwood
Business (173 | 17.5%), social sciences (139 | 14.1%), engineering (138 | 14.0%), computers & mathematics (116 | 11.7%), and education (86 | 8.7%) are the most common fields of study among 987 individuals in Derwood who have obtained a bachelor's degree or higher.
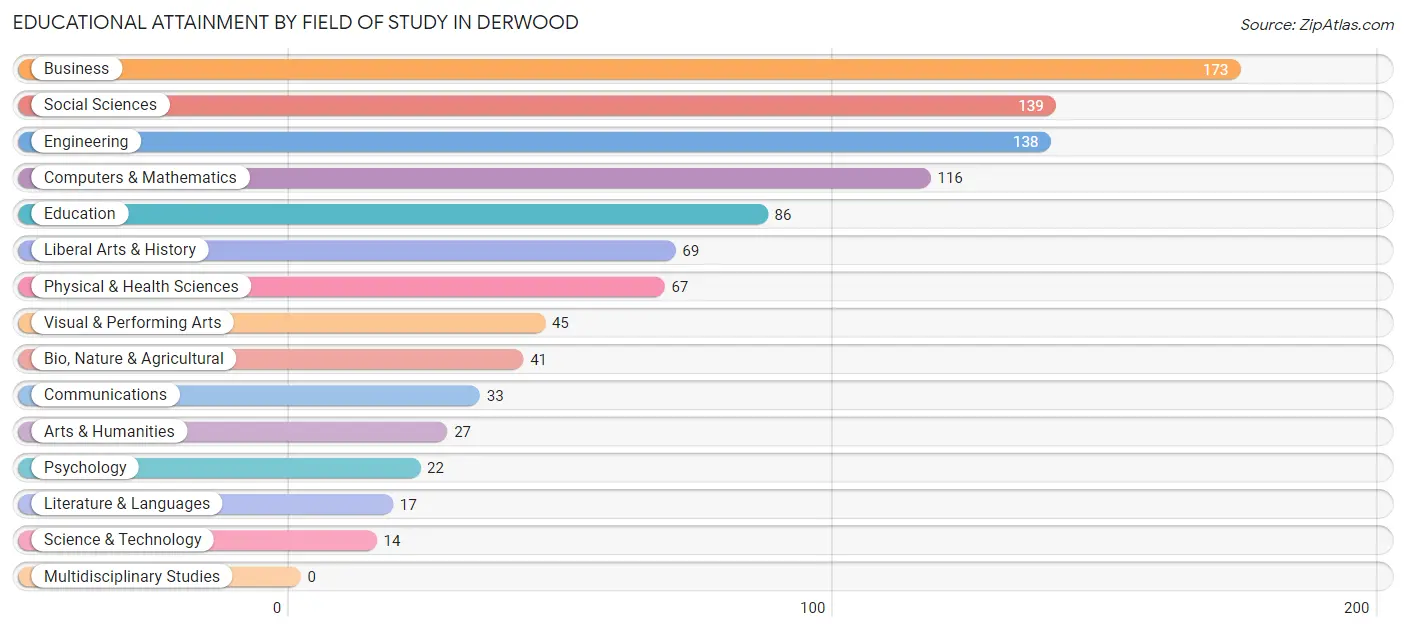
| Field of Study | # Graduates | % Graduates |
| Computers & Mathematics | 116 | 11.7% |
| Bio, Nature & Agricultural | 41 | 4.2% |
| Physical & Health Sciences | 67 | 6.8% |
| Psychology | 22 | 2.2% |
| Social Sciences | 139 | 14.1% |
| Engineering | 138 | 14.0% |
| Multidisciplinary Studies | 0 | 0.0% |
| Science & Technology | 14 | 1.4% |
| Business | 173 | 17.5% |
| Education | 86 | 8.7% |
| Literature & Languages | 17 | 1.7% |
| Liberal Arts & History | 69 | 7.0% |
| Visual & Performing Arts | 45 | 4.6% |
| Communications | 33 | 3.3% |
| Arts & Humanities | 27 | 2.7% |
| Total | 987 | 100.0% |
Transportation & Commute in Derwood
Vehicle Availability by Sex in Derwood
The most prevalent vehicle ownership categories in Derwood are males with 2 vehicles (369, accounting for 81.3%) and females with 2 vehicles (303, making up 80.0%).
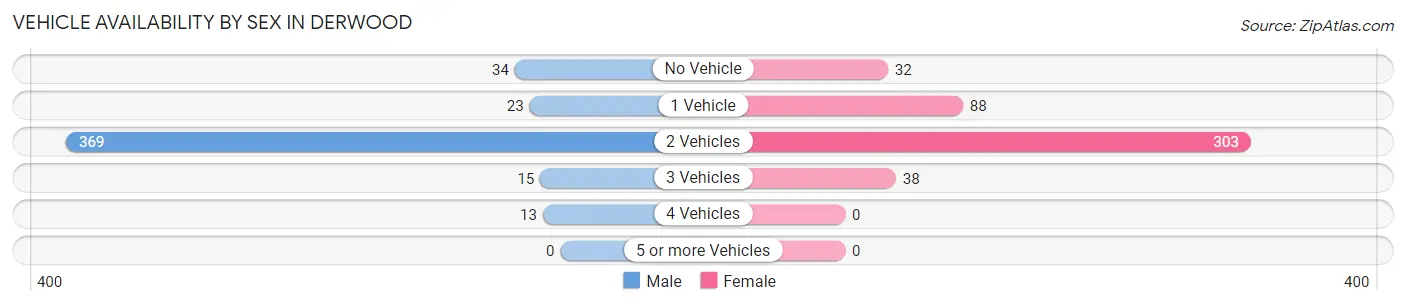
| Vehicles Available | Male | Female |
| No Vehicle | 34 (7.5%) | 32 (6.9%) |
| 1 Vehicle | 23 (5.1%) | 88 (19.1%) |
| 2 Vehicles | 369 (81.3%) | 303 (65.7%) |
| 3 Vehicles | 15 (3.3%) | 38 (8.2%) |
| 4 Vehicles | 13 (2.9%) | 0 (0.0%) |
| 5 or more Vehicles | 0 (0.0%) | 0 (0.0%) |
| Total | 454 (100.0%) | 461 (100.0%) |
Commute Time in Derwood
The most frequently occuring commute durations in Derwood are 60 to 89 minutes (168 commuters, 25.2%), 20 to 24 minutes (147 commuters, 22.0%), and 45 to 59 minutes (111 commuters, 16.6%).
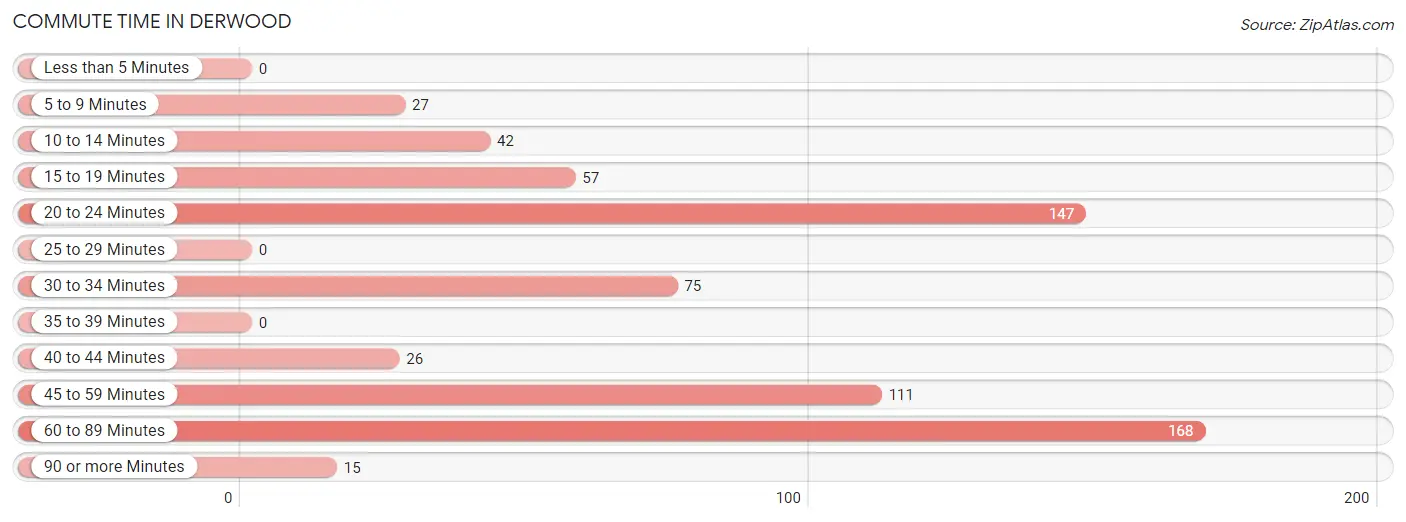
| Commute Time | # Commuters | % Commuters |
| Less than 5 Minutes | 0 | 0.0% |
| 5 to 9 Minutes | 27 | 4.0% |
| 10 to 14 Minutes | 42 | 6.3% |
| 15 to 19 Minutes | 57 | 8.5% |
| 20 to 24 Minutes | 147 | 22.0% |
| 25 to 29 Minutes | 0 | 0.0% |
| 30 to 34 Minutes | 75 | 11.2% |
| 35 to 39 Minutes | 0 | 0.0% |
| 40 to 44 Minutes | 26 | 3.9% |
| 45 to 59 Minutes | 111 | 16.6% |
| 60 to 89 Minutes | 168 | 25.2% |
| 90 or more Minutes | 15 | 2.2% |
Commute Time by Sex in Derwood
The most common commute times in Derwood are 45 to 59 minutes (74 commuters, 24.6%) for males and 20 to 24 minutes (127 commuters, 34.6%) for females.
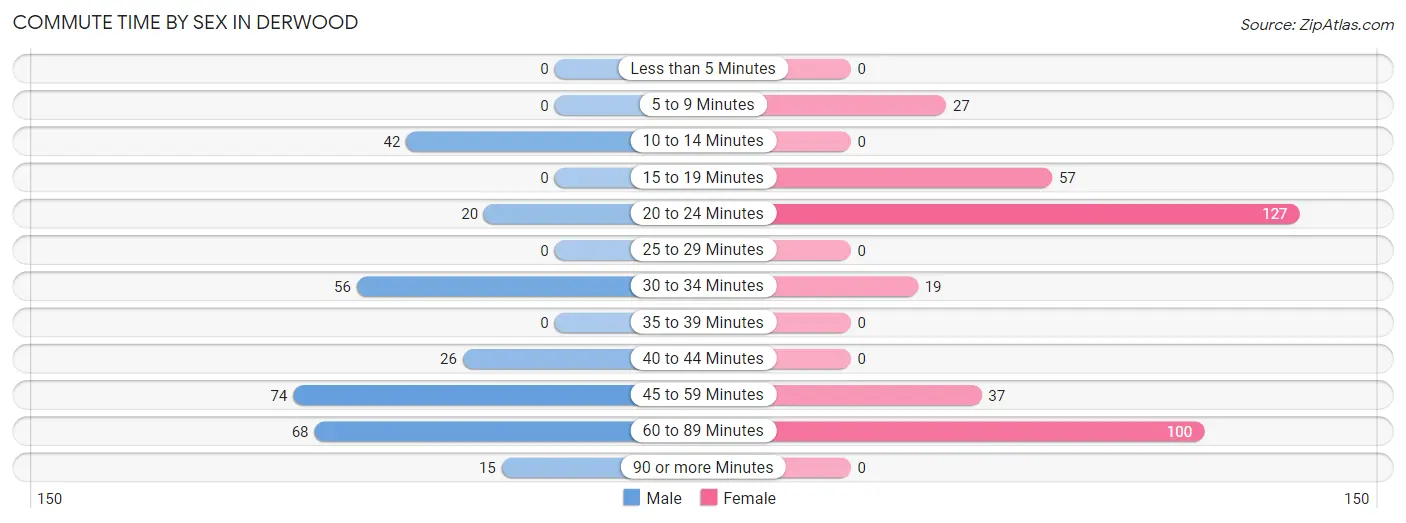
| Commute Time | Male | Female |
| Less than 5 Minutes | 0 (0.0%) | 0 (0.0%) |
| 5 to 9 Minutes | 0 (0.0%) | 27 (7.4%) |
| 10 to 14 Minutes | 42 (14.0%) | 0 (0.0%) |
| 15 to 19 Minutes | 0 (0.0%) | 57 (15.5%) |
| 20 to 24 Minutes | 20 (6.6%) | 127 (34.6%) |
| 25 to 29 Minutes | 0 (0.0%) | 0 (0.0%) |
| 30 to 34 Minutes | 56 (18.6%) | 19 (5.2%) |
| 35 to 39 Minutes | 0 (0.0%) | 0 (0.0%) |
| 40 to 44 Minutes | 26 (8.6%) | 0 (0.0%) |
| 45 to 59 Minutes | 74 (24.6%) | 37 (10.1%) |
| 60 to 89 Minutes | 68 (22.6%) | 100 (27.3%) |
| 90 or more Minutes | 15 (5.0%) | 0 (0.0%) |
Time of Departure to Work by Sex in Derwood
The most frequent times of departure to work in Derwood are 8:00 AM to 8:29 AM (95, 31.6%) for males and 7:30 AM to 7:59 AM (90, 24.5%) for females.
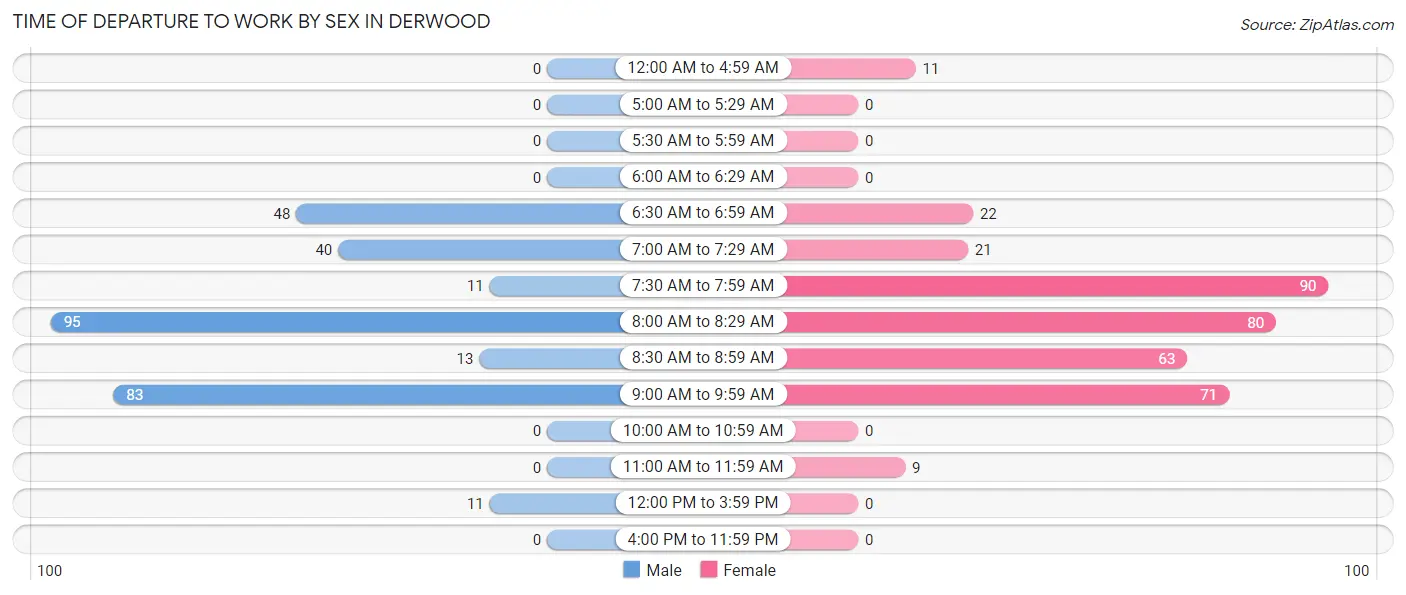
| Time of Departure | Male | Female |
| 12:00 AM to 4:59 AM | 0 (0.0%) | 11 (3.0%) |
| 5:00 AM to 5:29 AM | 0 (0.0%) | 0 (0.0%) |
| 5:30 AM to 5:59 AM | 0 (0.0%) | 0 (0.0%) |
| 6:00 AM to 6:29 AM | 0 (0.0%) | 0 (0.0%) |
| 6:30 AM to 6:59 AM | 48 (16.0%) | 22 (6.0%) |
| 7:00 AM to 7:29 AM | 40 (13.3%) | 21 (5.7%) |
| 7:30 AM to 7:59 AM | 11 (3.6%) | 90 (24.5%) |
| 8:00 AM to 8:29 AM | 95 (31.6%) | 80 (21.8%) |
| 8:30 AM to 8:59 AM | 13 (4.3%) | 63 (17.2%) |
| 9:00 AM to 9:59 AM | 83 (27.6%) | 71 (19.4%) |
| 10:00 AM to 10:59 AM | 0 (0.0%) | 0 (0.0%) |
| 11:00 AM to 11:59 AM | 0 (0.0%) | 9 (2.5%) |
| 12:00 PM to 3:59 PM | 11 (3.6%) | 0 (0.0%) |
| 4:00 PM to 11:59 PM | 0 (0.0%) | 0 (0.0%) |
| Total | 301 (100.0%) | 367 (100.0%) |
Housing Occupancy in Derwood
Occupancy by Ownership in Derwood
Of the total 755 dwellings in Derwood, owner-occupied units account for 510 (67.5%), while renter-occupied units make up 245 (32.5%).
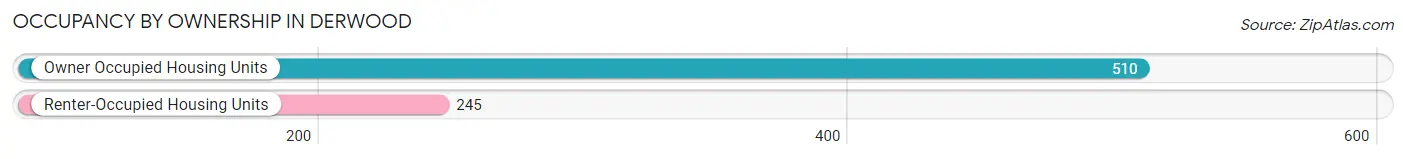
| Occupancy | # Housing Units | % Housing Units |
| Owner Occupied Housing Units | 510 | 67.5% |
| Renter-Occupied Housing Units | 245 | 32.5% |
| Total Occupied Housing Units | 755 | 100.0% |
Occupancy by Household Size in Derwood
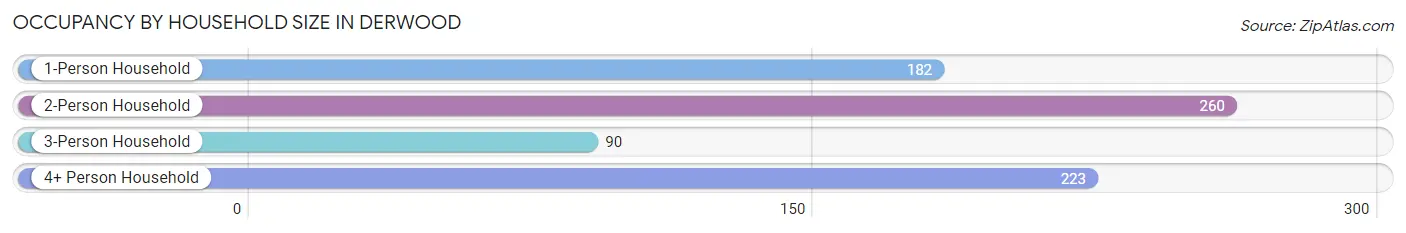
| Household Size | # Housing Units | % Housing Units |
| 1-Person Household | 182 | 24.1% |
| 2-Person Household | 260 | 34.4% |
| 3-Person Household | 90 | 11.9% |
| 4+ Person Household | 223 | 29.5% |
| Total Housing Units | 755 | 100.0% |
Occupancy by Ownership by Household Size in Derwood
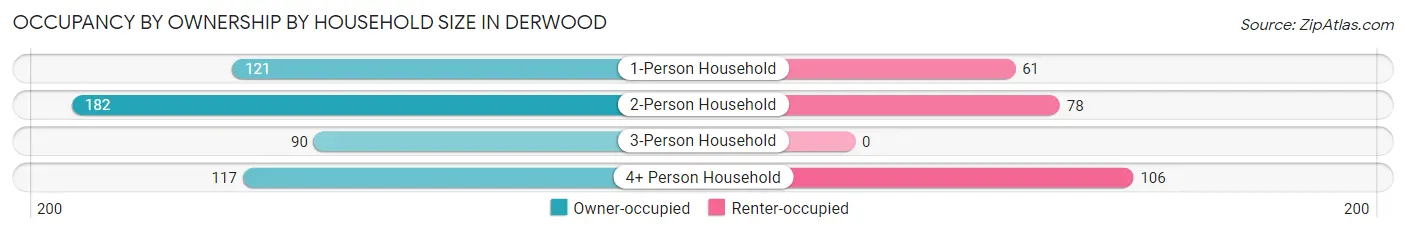
| Household Size | Owner-occupied | Renter-occupied |
| 1-Person Household | 121 (66.5%) | 61 (33.5%) |
| 2-Person Household | 182 (70.0%) | 78 (30.0%) |
| 3-Person Household | 90 (100.0%) | 0 (0.0%) |
| 4+ Person Household | 117 (52.5%) | 106 (47.5%) |
| Total Housing Units | 510 (67.5%) | 245 (32.5%) |
Occupancy by Educational Attainment in Derwood
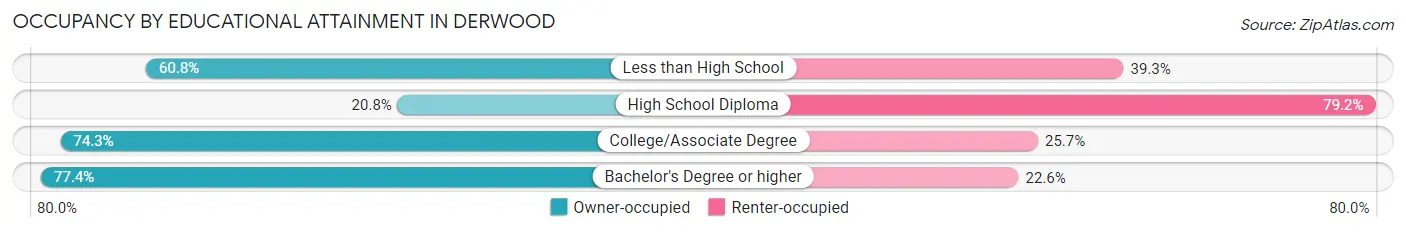
| Household Size | Owner-occupied | Renter-occupied |
| Less than High School | 65 (60.8%) | 42 (39.3%) |
| High School Diploma | 20 (20.8%) | 76 (79.2%) |
| College/Associate Degree | 55 (74.3%) | 19 (25.7%) |
| Bachelor's Degree or higher | 370 (77.4%) | 108 (22.6%) |
Occupancy by Age of Householder in Derwood
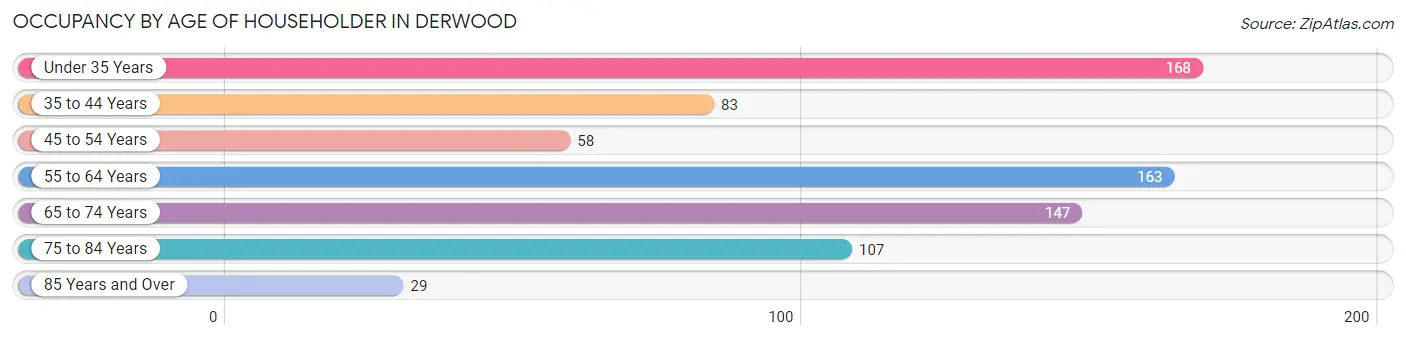
| Age Bracket | # Households | % Households |
| Under 35 Years | 168 | 22.3% |
| 35 to 44 Years | 83 | 11.0% |
| 45 to 54 Years | 58 | 7.7% |
| 55 to 64 Years | 163 | 21.6% |
| 65 to 74 Years | 147 | 19.5% |
| 75 to 84 Years | 107 | 14.2% |
| 85 Years and Over | 29 | 3.8% |
| Total | 755 | 100.0% |
Housing Finances in Derwood
Median Income by Occupancy in Derwood
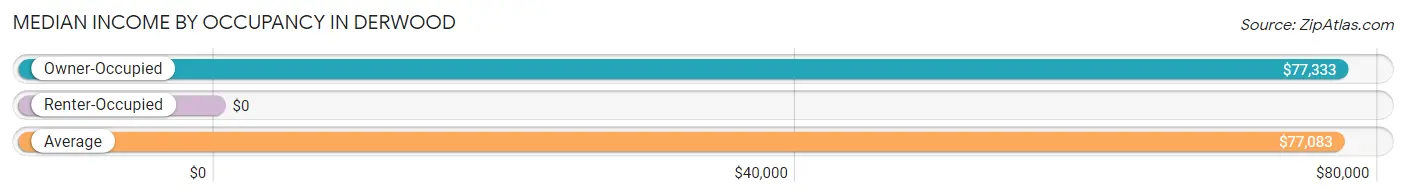
| Occupancy Type | # Households | Median Income |
| Owner-Occupied | 510 (67.5%) | $77,333 |
| Renter-Occupied | 245 (32.5%) | $0 |
| Average | 755 (100.0%) | $77,083 |
Occupancy by Householder Income Bracket in Derwood
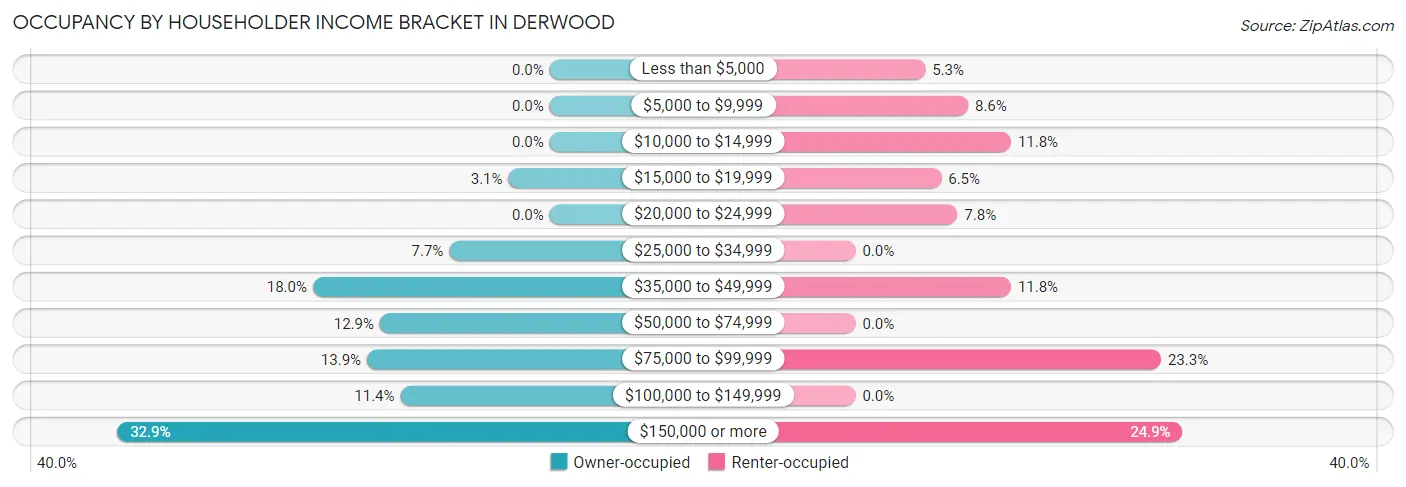
| Income Bracket | Owner-occupied | Renter-occupied |
| Less than $5,000 | 0 (0.0%) | 13 (5.3%) |
| $5,000 to $9,999 | 0 (0.0%) | 21 (8.6%) |
| $10,000 to $14,999 | 0 (0.0%) | 29 (11.8%) |
| $15,000 to $19,999 | 16 (3.1%) | 16 (6.5%) |
| $20,000 to $24,999 | 0 (0.0%) | 19 (7.8%) |
| $25,000 to $34,999 | 39 (7.6%) | 0 (0.0%) |
| $35,000 to $49,999 | 92 (18.0%) | 29 (11.8%) |
| $50,000 to $74,999 | 66 (12.9%) | 0 (0.0%) |
| $75,000 to $99,999 | 71 (13.9%) | 57 (23.3%) |
| $100,000 to $149,999 | 58 (11.4%) | 0 (0.0%) |
| $150,000 or more | 168 (32.9%) | 61 (24.9%) |
| Total | 510 (100.0%) | 245 (100.0%) |
Monthly Housing Cost Tiers in Derwood
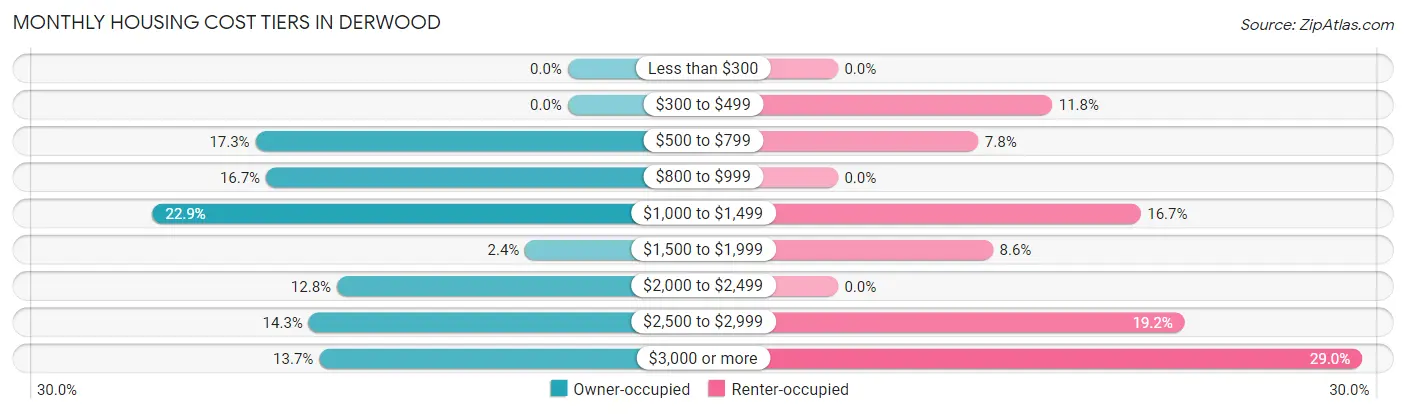
| Monthly Cost | Owner-occupied | Renter-occupied |
| Less than $300 | 0 (0.0%) | 0 (0.0%) |
| $300 to $499 | 0 (0.0%) | 29 (11.8%) |
| $500 to $799 | 88 (17.2%) | 19 (7.8%) |
| $800 to $999 | 85 (16.7%) | 0 (0.0%) |
| $1,000 to $1,499 | 117 (22.9%) | 41 (16.7%) |
| $1,500 to $1,999 | 12 (2.4%) | 21 (8.6%) |
| $2,000 to $2,499 | 65 (12.8%) | 0 (0.0%) |
| $2,500 to $2,999 | 73 (14.3%) | 47 (19.2%) |
| $3,000 or more | 70 (13.7%) | 71 (29.0%) |
| Total | 510 (100.0%) | 245 (100.0%) |
Physical Housing Characteristics in Derwood
Housing Structures in Derwood
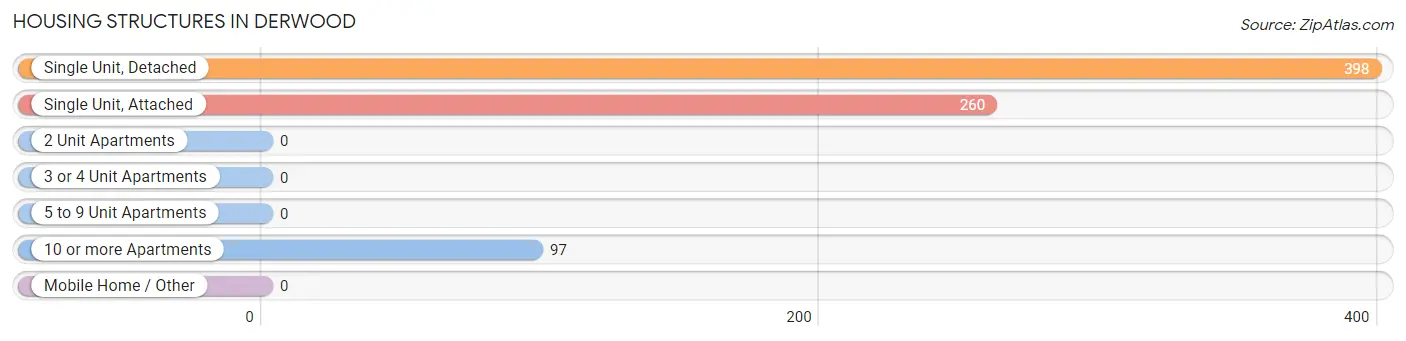
| Structure Type | # Housing Units | % Housing Units |
| Single Unit, Detached | 398 | 52.7% |
| Single Unit, Attached | 260 | 34.4% |
| 2 Unit Apartments | 0 | 0.0% |
| 3 or 4 Unit Apartments | 0 | 0.0% |
| 5 to 9 Unit Apartments | 0 | 0.0% |
| 10 or more Apartments | 97 | 12.9% |
| Mobile Home / Other | 0 | 0.0% |
| Total | 755 | 100.0% |
Housing Structures by Occupancy in Derwood
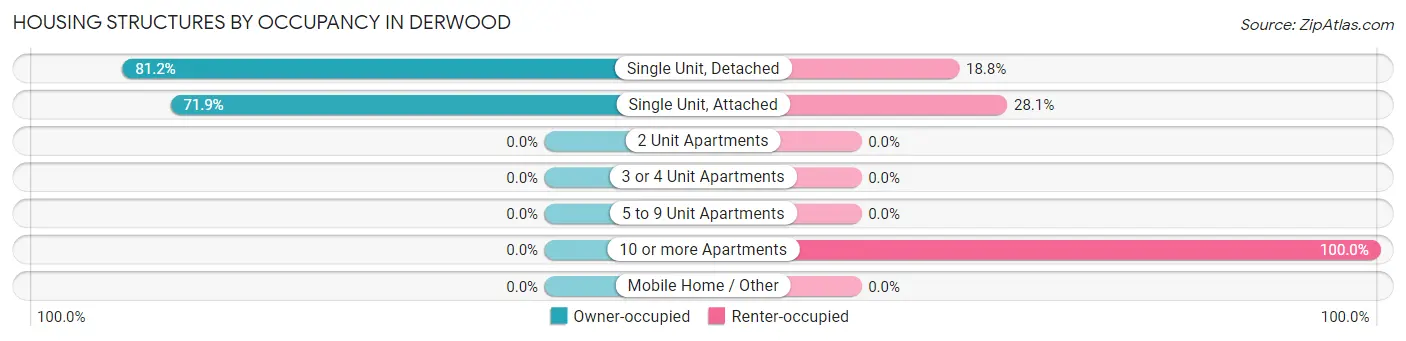
| Structure Type | Owner-occupied | Renter-occupied |
| Single Unit, Detached | 323 (81.2%) | 75 (18.8%) |
| Single Unit, Attached | 187 (71.9%) | 73 (28.1%) |
| 2 Unit Apartments | 0 (0.0%) | 0 (0.0%) |
| 3 or 4 Unit Apartments | 0 (0.0%) | 0 (0.0%) |
| 5 to 9 Unit Apartments | 0 (0.0%) | 0 (0.0%) |
| 10 or more Apartments | 0 (0.0%) | 97 (100.0%) |
| Mobile Home / Other | 0 (0.0%) | 0 (0.0%) |
| Total | 510 (67.5%) | 245 (32.5%) |
Housing Structures by Number of Rooms in Derwood
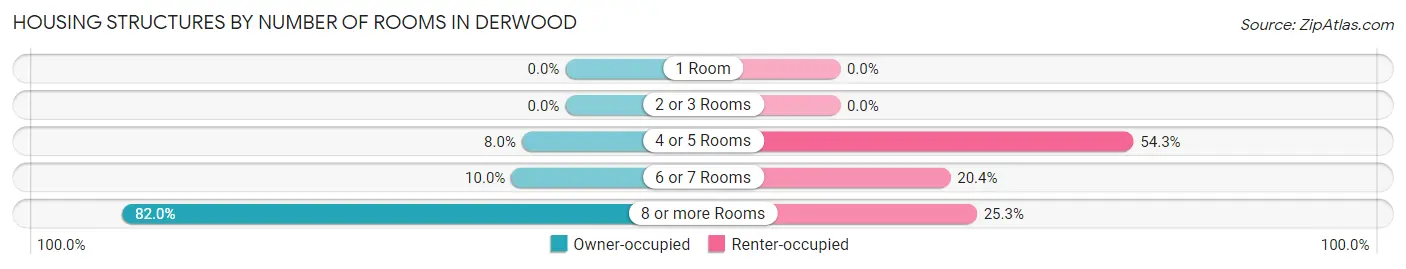
| Number of Rooms | Owner-occupied | Renter-occupied |
| 1 Room | 0 (0.0%) | 0 (0.0%) |
| 2 or 3 Rooms | 0 (0.0%) | 0 (0.0%) |
| 4 or 5 Rooms | 41 (8.0%) | 133 (54.3%) |
| 6 or 7 Rooms | 51 (10.0%) | 50 (20.4%) |
| 8 or more Rooms | 418 (82.0%) | 62 (25.3%) |
| Total | 510 (100.0%) | 245 (100.0%) |
Housing Structure by Heating Type in Derwood
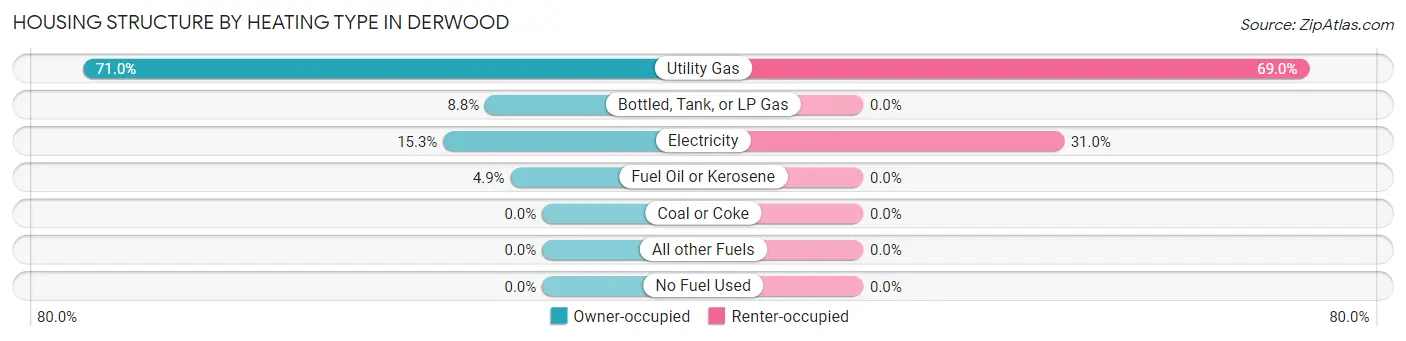
| Heating Type | Owner-occupied | Renter-occupied |
| Utility Gas | 362 (71.0%) | 169 (69.0%) |
| Bottled, Tank, or LP Gas | 45 (8.8%) | 0 (0.0%) |
| Electricity | 78 (15.3%) | 76 (31.0%) |
| Fuel Oil or Kerosene | 25 (4.9%) | 0 (0.0%) |
| Coal or Coke | 0 (0.0%) | 0 (0.0%) |
| All other Fuels | 0 (0.0%) | 0 (0.0%) |
| No Fuel Used | 0 (0.0%) | 0 (0.0%) |
| Total | 510 (100.0%) | 245 (100.0%) |
Household Vehicle Usage in Derwood
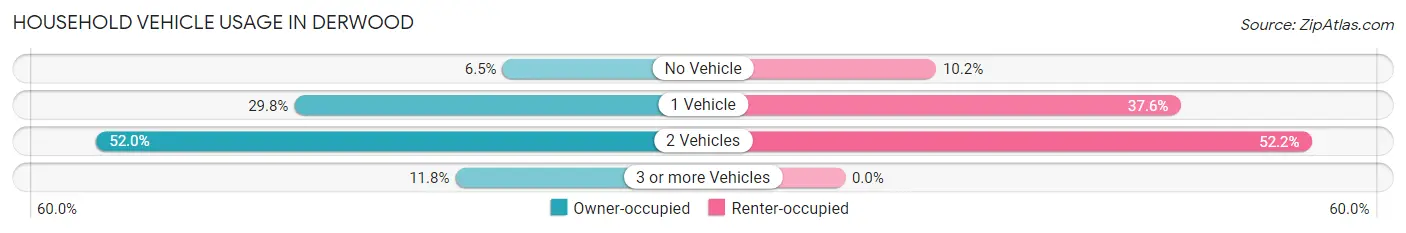
| Vehicles per Household | Owner-occupied | Renter-occupied |
| No Vehicle | 33 (6.5%) | 25 (10.2%) |
| 1 Vehicle | 152 (29.8%) | 92 (37.6%) |
| 2 Vehicles | 265 (52.0%) | 128 (52.2%) |
| 3 or more Vehicles | 60 (11.8%) | 0 (0.0%) |
| Total | 510 (100.0%) | 245 (100.0%) |
Real Estate & Mortgages in Derwood
Real Estate and Mortgage Overview in Derwood
| Characteristic | Without Mortgage | With Mortgage |
| Housing Units | 219 | 291 |
| Median Property Value | $587,200 | $535,300 |
| Median Household Income | $71,563 | $100 |
| Monthly Housing Costs | $880 | $70 |
| Real Estate Taxes | $5,586 | $0 |
Property Value by Mortgage Status in Derwood
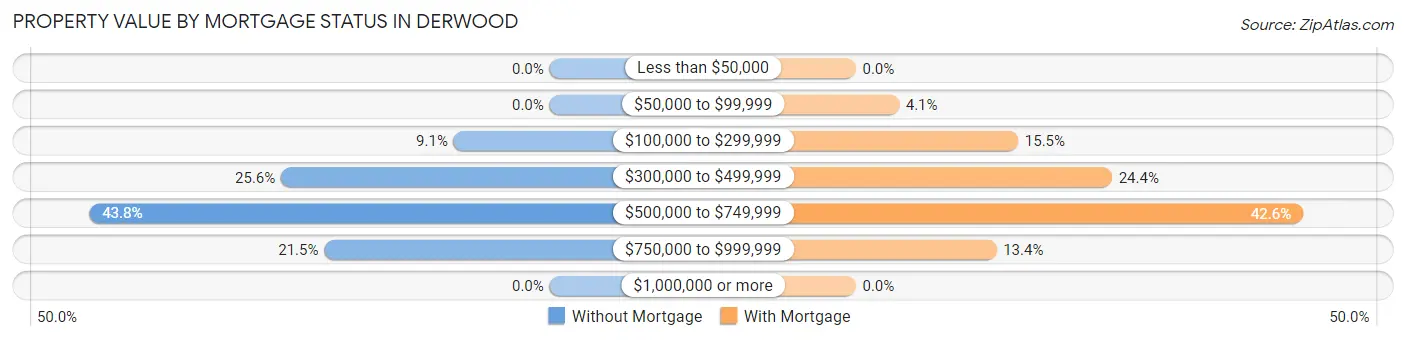
| Property Value | Without Mortgage | With Mortgage |
| Less than $50,000 | 0 (0.0%) | 0 (0.0%) |
| $50,000 to $99,999 | 0 (0.0%) | 12 (4.1%) |
| $100,000 to $299,999 | 20 (9.1%) | 45 (15.5%) |
| $300,000 to $499,999 | 56 (25.6%) | 71 (24.4%) |
| $500,000 to $749,999 | 96 (43.8%) | 124 (42.6%) |
| $750,000 to $999,999 | 47 (21.5%) | 39 (13.4%) |
| $1,000,000 or more | 0 (0.0%) | 0 (0.0%) |
| Total | 219 (100.0%) | 291 (100.0%) |
Household Income by Mortgage Status in Derwood
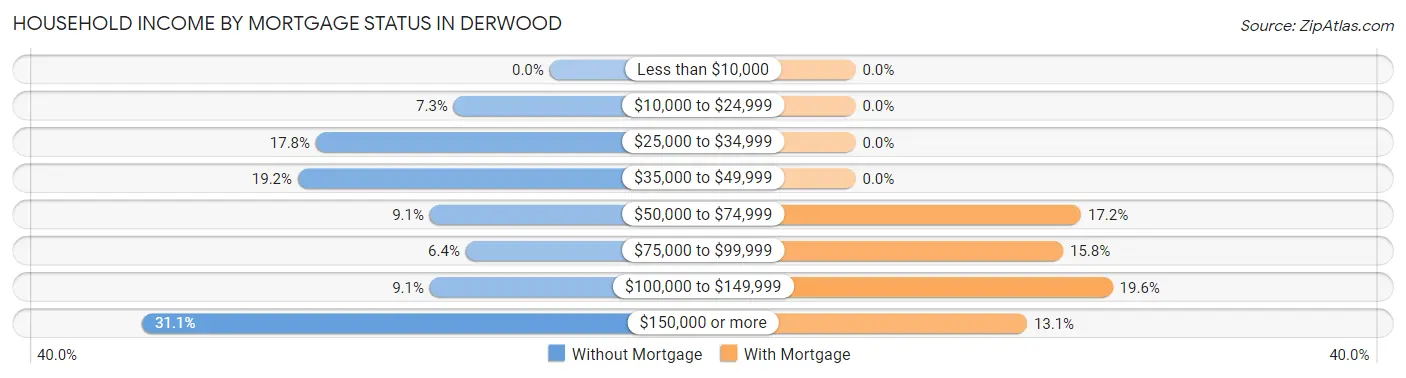
| Household Income | Without Mortgage | With Mortgage |
| Less than $10,000 | 0 (0.0%) | 0 (0.0%) |
| $10,000 to $24,999 | 16 (7.3%) | 0 (0.0%) |
| $25,000 to $34,999 | 39 (17.8%) | 0 (0.0%) |
| $35,000 to $49,999 | 42 (19.2%) | 0 (0.0%) |
| $50,000 to $74,999 | 20 (9.1%) | 50 (17.2%) |
| $75,000 to $99,999 | 14 (6.4%) | 46 (15.8%) |
| $100,000 to $149,999 | 20 (9.1%) | 57 (19.6%) |
| $150,000 or more | 68 (31.0%) | 38 (13.1%) |
| Total | 219 (100.0%) | 291 (100.0%) |
Property Value to Household Income Ratio in Derwood
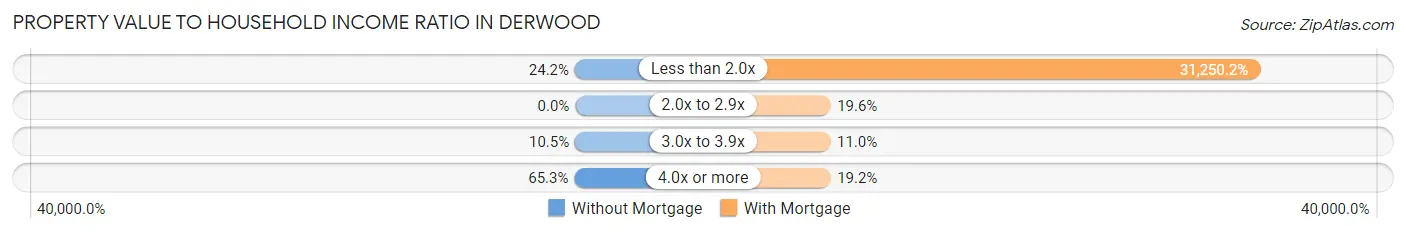
| Value-to-Income Ratio | Without Mortgage | With Mortgage |
| Less than 2.0x | 53 (24.2%) | 90,938 (31,250.2%) |
| 2.0x to 2.9x | 0 (0.0%) | 57 (19.6%) |
| 3.0x to 3.9x | 23 (10.5%) | 32 (11.0%) |
| 4.0x or more | 143 (65.3%) | 56 (19.2%) |
| Total | 219 (100.0%) | 291 (100.0%) |
Real Estate Taxes by Mortgage Status in Derwood
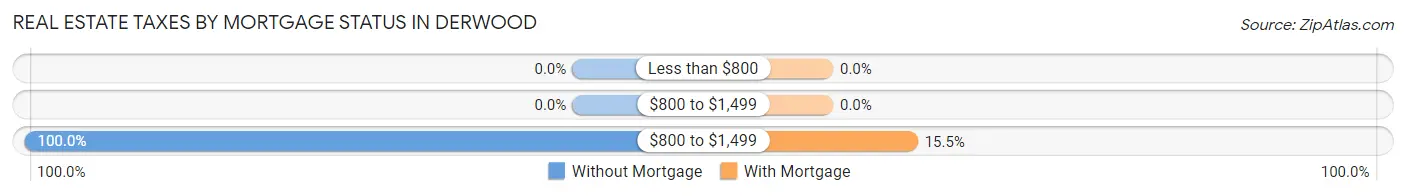
| Property Taxes | Without Mortgage | With Mortgage |
| Less than $800 | 0 (0.0%) | 0 (0.0%) |
| $800 to $1,499 | 0 (0.0%) | 0 (0.0%) |
| $800 to $1,499 | 219 (100.0%) | 45 (15.5%) |
| Total | 219 (100.0%) | 291 (100.0%) |
Health & Disability in Derwood
Health Insurance Coverage by Age in Derwood
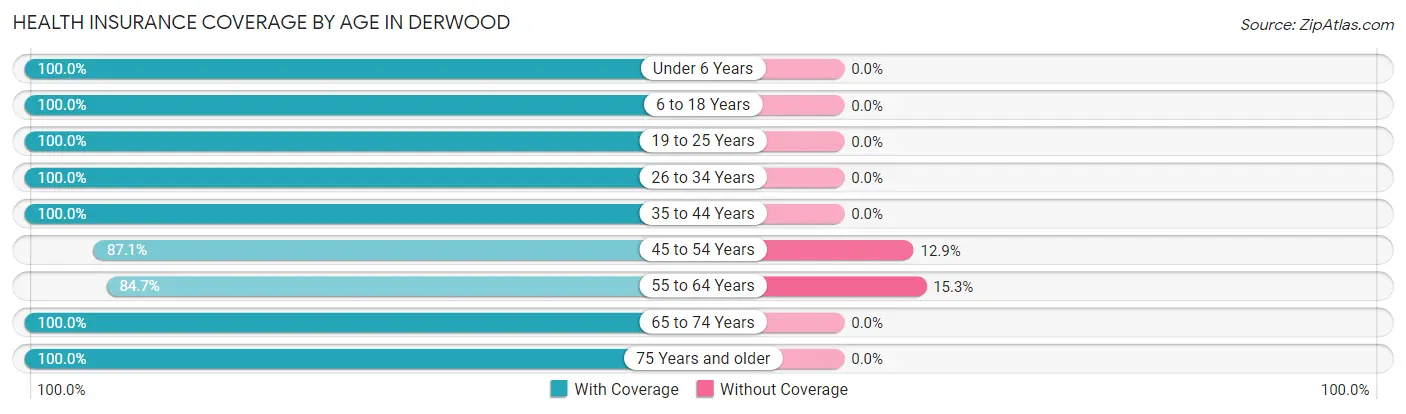
| Age Bracket | With Coverage | Without Coverage |
| Under 6 Years | 116 (100.0%) | 0 (0.0%) |
| 6 to 18 Years | 256 (100.0%) | 0 (0.0%) |
| 19 to 25 Years | 155 (100.0%) | 0 (0.0%) |
| 26 to 34 Years | 292 (100.0%) | 0 (0.0%) |
| 35 to 44 Years | 145 (100.0%) | 0 (0.0%) |
| 45 to 54 Years | 155 (87.1%) | 23 (12.9%) |
| 55 to 64 Years | 222 (84.7%) | 40 (15.3%) |
| 65 to 74 Years | 216 (100.0%) | 0 (0.0%) |
| 75 Years and older | 204 (100.0%) | 0 (0.0%) |
| Total | 1,761 (96.6%) | 63 (3.5%) |
Health Insurance Coverage by Citizenship Status in Derwood
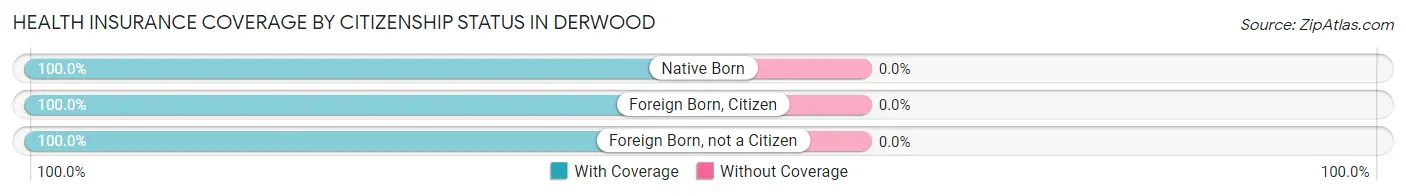
| Citizenship Status | With Coverage | Without Coverage |
| Native Born | 116 (100.0%) | 0 (0.0%) |
| Foreign Born, Citizen | 256 (100.0%) | 0 (0.0%) |
| Foreign Born, not a Citizen | 155 (100.0%) | 0 (0.0%) |
Health Insurance Coverage by Household Income in Derwood
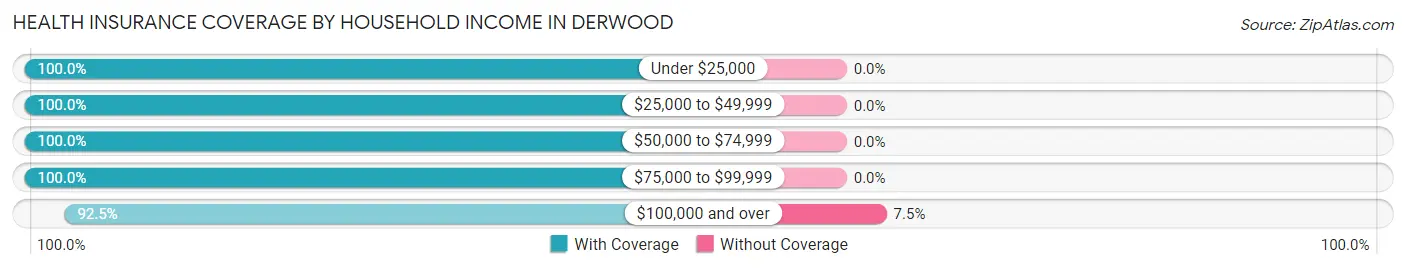
| Household Income | With Coverage | Without Coverage |
| Under $25,000 | 167 (100.0%) | 0 (0.0%) |
| $25,000 to $49,999 | 348 (100.0%) | 0 (0.0%) |
| $50,000 to $74,999 | 87 (100.0%) | 0 (0.0%) |
| $75,000 to $99,999 | 379 (100.0%) | 0 (0.0%) |
| $100,000 and over | 780 (92.5%) | 63 (7.5%) |
Public vs Private Health Insurance Coverage by Age in Derwood
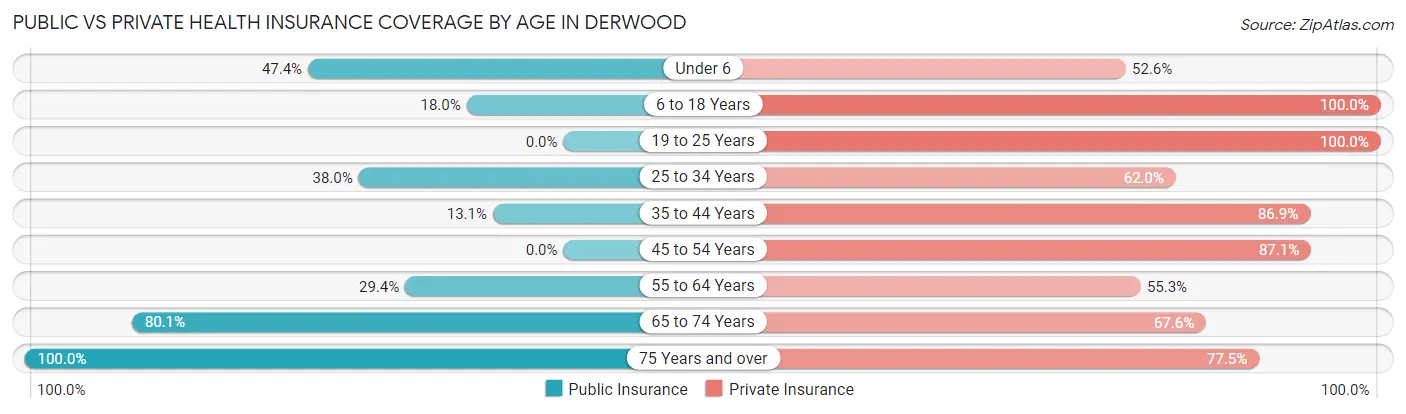
| Age Bracket | Public Insurance | Private Insurance |
| Under 6 | 55 (47.4%) | 61 (52.6%) |
| 6 to 18 Years | 46 (18.0%) | 256 (100.0%) |
| 19 to 25 Years | 0 (0.0%) | 155 (100.0%) |
| 25 to 34 Years | 111 (38.0%) | 181 (62.0%) |
| 35 to 44 Years | 19 (13.1%) | 126 (86.9%) |
| 45 to 54 Years | 0 (0.0%) | 155 (87.1%) |
| 55 to 64 Years | 77 (29.4%) | 145 (55.3%) |
| 65 to 74 Years | 173 (80.1%) | 146 (67.6%) |
| 75 Years and over | 204 (100.0%) | 158 (77.4%) |
| Total | 685 (37.6%) | 1,383 (75.8%) |
Disability Status by Sex by Age in Derwood
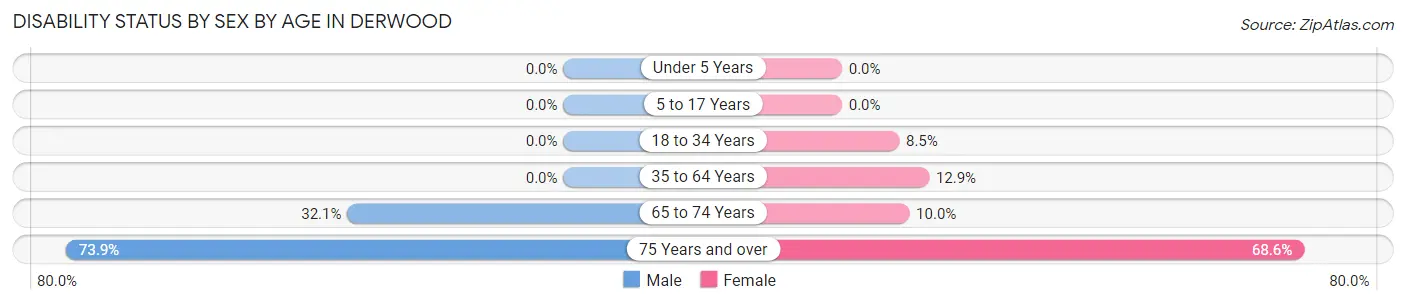
| Age Bracket | Male | Female |
| Under 5 Years | 0 (0.0%) | 0 (0.0%) |
| 5 to 17 Years | 0 (0.0%) | 0 (0.0%) |
| 18 to 34 Years | 0 (0.0%) | 21 (8.5%) |
| 35 to 64 Years | 0 (0.0%) | 40 (12.9%) |
| 65 to 74 Years | 34 (32.1%) | 11 (10.0%) |
| 75 Years and over | 113 (73.9%) | 35 (68.6%) |
Disability Class by Sex by Age in Derwood
Disability Class: Hearing Difficulty
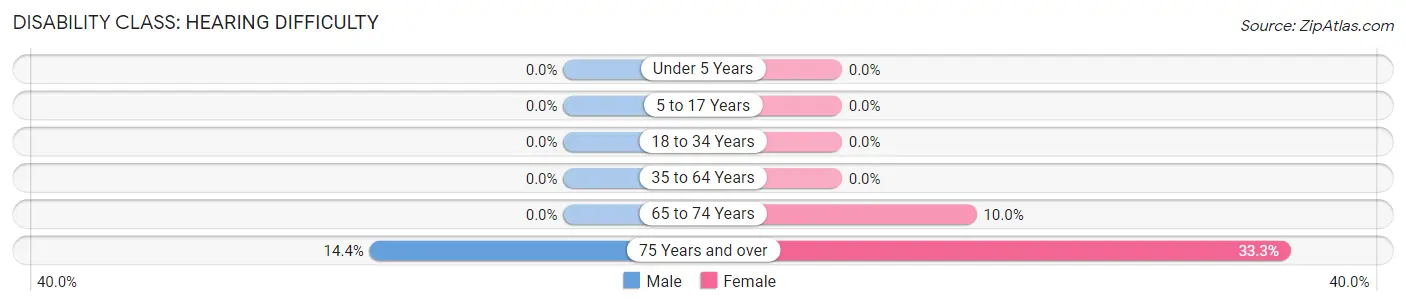
| Age Bracket | Male | Female |
| Under 5 Years | 0 (0.0%) | 0 (0.0%) |
| 5 to 17 Years | 0 (0.0%) | 0 (0.0%) |
| 18 to 34 Years | 0 (0.0%) | 0 (0.0%) |
| 35 to 64 Years | 0 (0.0%) | 0 (0.0%) |
| 65 to 74 Years | 0 (0.0%) | 11 (10.0%) |
| 75 Years and over | 22 (14.4%) | 17 (33.3%) |
Disability Class: Vision Difficulty
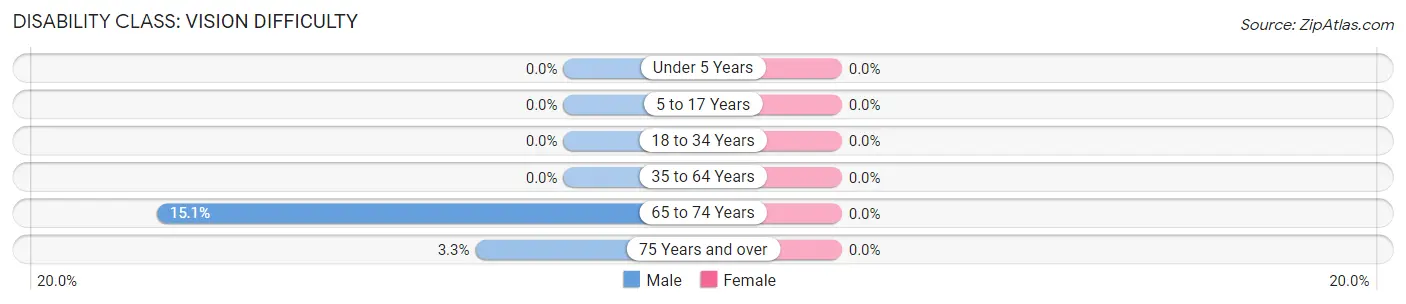
| Age Bracket | Male | Female |
| Under 5 Years | 0 (0.0%) | 0 (0.0%) |
| 5 to 17 Years | 0 (0.0%) | 0 (0.0%) |
| 18 to 34 Years | 0 (0.0%) | 0 (0.0%) |
| 35 to 64 Years | 0 (0.0%) | 0 (0.0%) |
| 65 to 74 Years | 16 (15.1%) | 0 (0.0%) |
| 75 Years and over | 5 (3.3%) | 0 (0.0%) |
Disability Class: Cognitive Difficulty
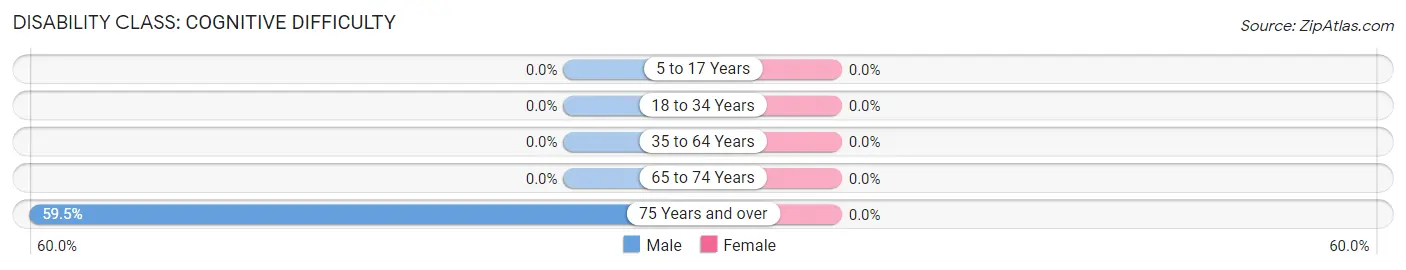
| Age Bracket | Male | Female |
| 5 to 17 Years | 0 (0.0%) | 0 (0.0%) |
| 18 to 34 Years | 0 (0.0%) | 0 (0.0%) |
| 35 to 64 Years | 0 (0.0%) | 0 (0.0%) |
| 65 to 74 Years | 0 (0.0%) | 0 (0.0%) |
| 75 Years and over | 91 (59.5%) | 0 (0.0%) |
Disability Class: Ambulatory Difficulty
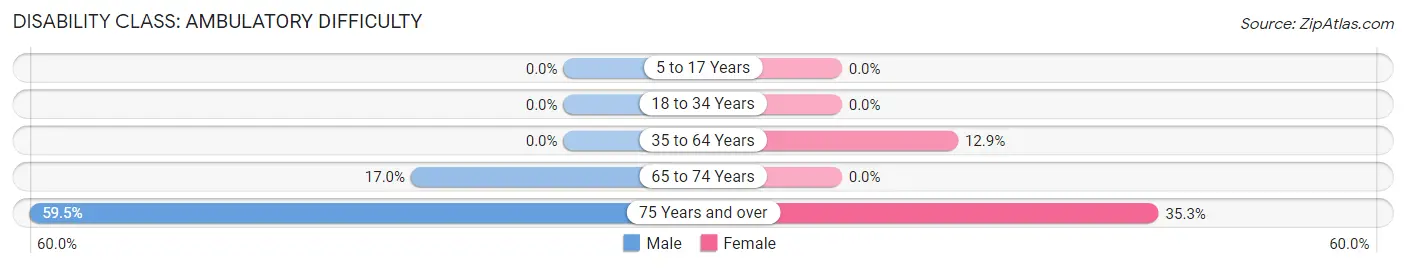
| Age Bracket | Male | Female |
| 5 to 17 Years | 0 (0.0%) | 0 (0.0%) |
| 18 to 34 Years | 0 (0.0%) | 0 (0.0%) |
| 35 to 64 Years | 0 (0.0%) | 40 (12.9%) |
| 65 to 74 Years | 18 (17.0%) | 0 (0.0%) |
| 75 Years and over | 91 (59.5%) | 18 (35.3%) |
Disability Class: Self-Care Difficulty
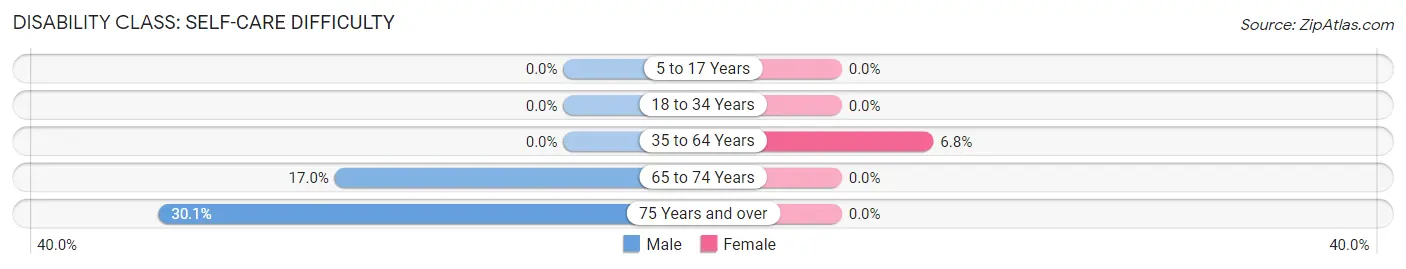
| Age Bracket | Male | Female |
| 5 to 17 Years | 0 (0.0%) | 0 (0.0%) |
| 18 to 34 Years | 0 (0.0%) | 0 (0.0%) |
| 35 to 64 Years | 0 (0.0%) | 21 (6.8%) |
| 65 to 74 Years | 18 (17.0%) | 0 (0.0%) |
| 75 Years and over | 46 (30.1%) | 0 (0.0%) |
Technology Access in Derwood
Computing Device Access in Derwood
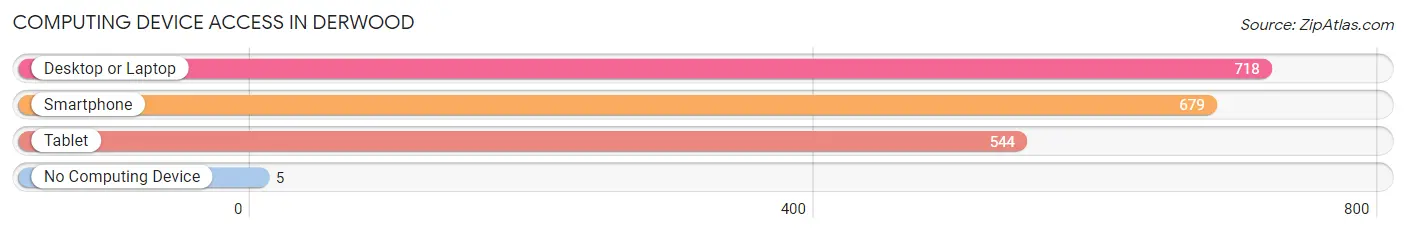
| Device Type | # Households | % Households |
| Desktop or Laptop | 718 | 95.1% |
| Smartphone | 679 | 89.9% |
| Tablet | 544 | 72.1% |
| No Computing Device | 5 | 0.7% |
| Total | 755 | 100.0% |
Internet Access in Derwood
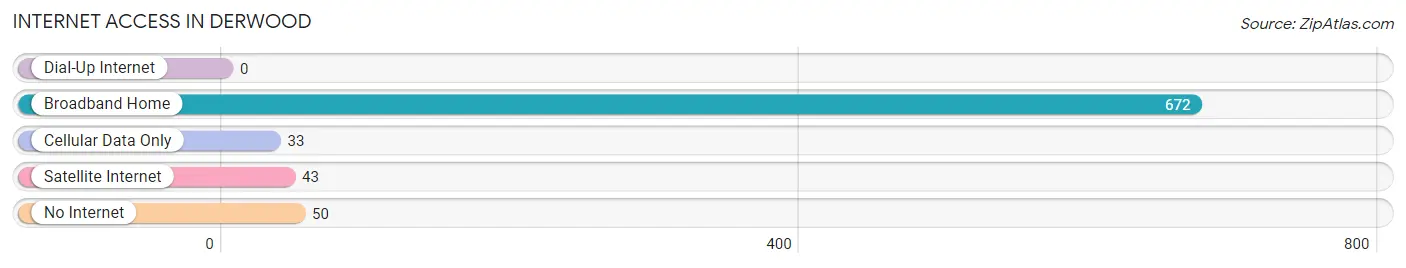
| Internet Type | # Households | % Households |
| Dial-Up Internet | 0 | 0.0% |
| Broadband Home | 672 | 89.0% |
| Cellular Data Only | 33 | 4.4% |
| Satellite Internet | 43 | 5.7% |
| No Internet | 50 | 6.6% |
| Total | 755 | 100.0% |
Derwood Summary
Derwood, Maryland is a census-designated place located in Montgomery County, Maryland. It is situated in the northern part of the county, just south of Rockville. Derwood is a small, unincorporated community with a population of approximately 8,000 people.
History
Derwood was first settled in the late 1700s by a group of German immigrants. The area was originally known as “Derwood’s Crossroads” due to its location at the intersection of two major roads. The name was eventually shortened to Derwood.
In the early 1900s, the area began to develop as a farming community. The area was home to several small farms, as well as a few small businesses. In the 1950s, the area began to experience rapid growth as the Washington, D.C. metropolitan area expanded.
Geography
Derwood is located in the northern part of Montgomery County, Maryland. It is situated just south of Rockville and is bordered by the cities of Gaithersburg and Germantown. The area is characterized by rolling hills and is home to several small streams and creeks.
The climate in Derwood is typical of the mid-Atlantic region. Summers are hot and humid, while winters are cold and wet. The average annual temperature is around 55 degrees Fahrenheit.
Economy
Derwood is primarily a residential community, but it is also home to several small businesses. The area is home to a variety of retail stores, restaurants, and other services. The area is also home to several corporate offices, including those of Lockheed Martin and Northrop Grumman.
Demographics
As of the 2010 census, Derwood had a population of 8,000 people. The racial makeup of the area was 79.3% White, 8.2% African American, 5.2% Asian, and 4.3% Hispanic or Latino. The median household income was $90,000, and the median home value was $400,000.
The majority of Derwood’s residents are employed in the professional and technical services sector. The area is also home to a number of government and military employees. The area is served by the Montgomery County Public Schools system.
Conclusion
Derwood, Maryland is a small, unincorporated community located in Montgomery County, Maryland. It is situated in the northern part of the county, just south of Rockville. Derwood is a residential community with a population of approximately 8,000 people. The area is characterized by rolling hills and is home to several small businesses. The majority of Derwood’s residents are employed in the professional and technical services sector. The area is served by the Montgomery County Public Schools system.
Common Questions
What is Per Capita Income in Derwood?
Per Capita income in Derwood is $46,972.
What is the Median Family Income in Derwood?
Median Family Income in Derwood is $83,036.
What is the Median Household income in Derwood?
Median Household Income in Derwood is $77,083.
What is Income or Wage Gap in Derwood?
Income or Wage Gap in Derwood is 38.1%.
Women in Derwood earn 61.9 cents for every dollar earned by a man.
What is Inequality or Gini Index in Derwood?
Inequality or Gini Index in Derwood is 0.48.
What is the Total Population of Derwood?
Total Population of Derwood is 1,850.
What is the Total Male Population of Derwood?
Total Male Population of Derwood is 841.
What is the Total Female Population of Derwood?
Total Female Population of Derwood is 1,009.
What is the Ratio of Males per 100 Females in Derwood?
There are 83.35 Males per 100 Females in Derwood.
What is the Ratio of Females per 100 Males in Derwood?
There are 119.98 Females per 100 Males in Derwood.
What is the Median Population Age in Derwood?
Median Population Age in Derwood is 40.9 Years.
What is the Average Family Size in Derwood
Average Family Size in Derwood is 3.0 People.
What is the Average Household Size in Derwood
Average Household Size in Derwood is 2.5 People.
How Large is the Labor Force in Derwood?
There are 979 People in the Labor Forcein in Derwood.
What is the Percentage of People in the Labor Force in Derwood?
63.5% of People are in the Labor Force in Derwood.
What is the Unemployment Rate in Derwood?
Unemployment Rate in Derwood is 6.6%.