Delta Junction, AK Map & Demographics
Delta Junction Map
Delta Junction Overview
$40,245
PER CAPITA INCOME
$89,485
AVG FAMILY INCOME
$80,556
AVG HOUSEHOLD INCOME
50.8%
WAGE / INCOME GAP [ % ]
49.2¢/ $1
WAGE / INCOME GAP [ $ ]
0.42
INEQUALITY / GINI INDEX
1,126
TOTAL POPULATION
691
MALE POPULATION
435
FEMALE POPULATION
158.85
MALES / 100 FEMALES
62.95
FEMALES / 100 MALES
36.0
MEDIAN AGE
3.7
AVG FAMILY SIZE
2.7
AVG HOUSEHOLD SIZE
547
LABOR FORCE [ PEOPLE ]
64.6%
PERCENT IN LABOR FORCE
4.1%
UNEMPLOYMENT RATE
Delta Junction Zip Codes
Delta Junction Area Codes
Income in Delta Junction
Income Overview in Delta Junction
Per Capita Income in Delta Junction is $40,245, while median incomes of families and households are $89,485 and $80,556 respectively.
| Characteristic | Number | Measure |
| Per Capita Income | 1,126 | $40,245 |
| Median Family Income | 213 | $89,485 |
| Mean Family Income | 213 | $108,226 |
| Median Household Income | 420 | $80,556 |
| Mean Household Income | 420 | $94,940 |
| Income Deficit | 213 | $0 |
| Wage / Income Gap (%) | 1,126 | 50.78% |
| Wage / Income Gap ($) | 1,126 | 49.22¢ per $1 |
| Gini / Inequality Index | 1,126 | 0.42 |
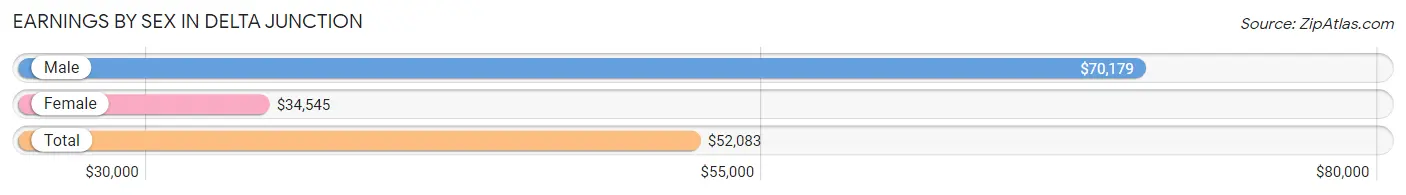
Earnings by Sex in Delta Junction
Average Earnings in Delta Junction are $52,083, $70,179 for men and $34,545 for women, a difference of 50.8%.
| Sex | Number | Average Earnings |
| Male | 378 (70.5%) | $70,179 |
| Female | 158 (29.5%) | $34,545 |
| Total | 536 (100.0%) | $52,083 |
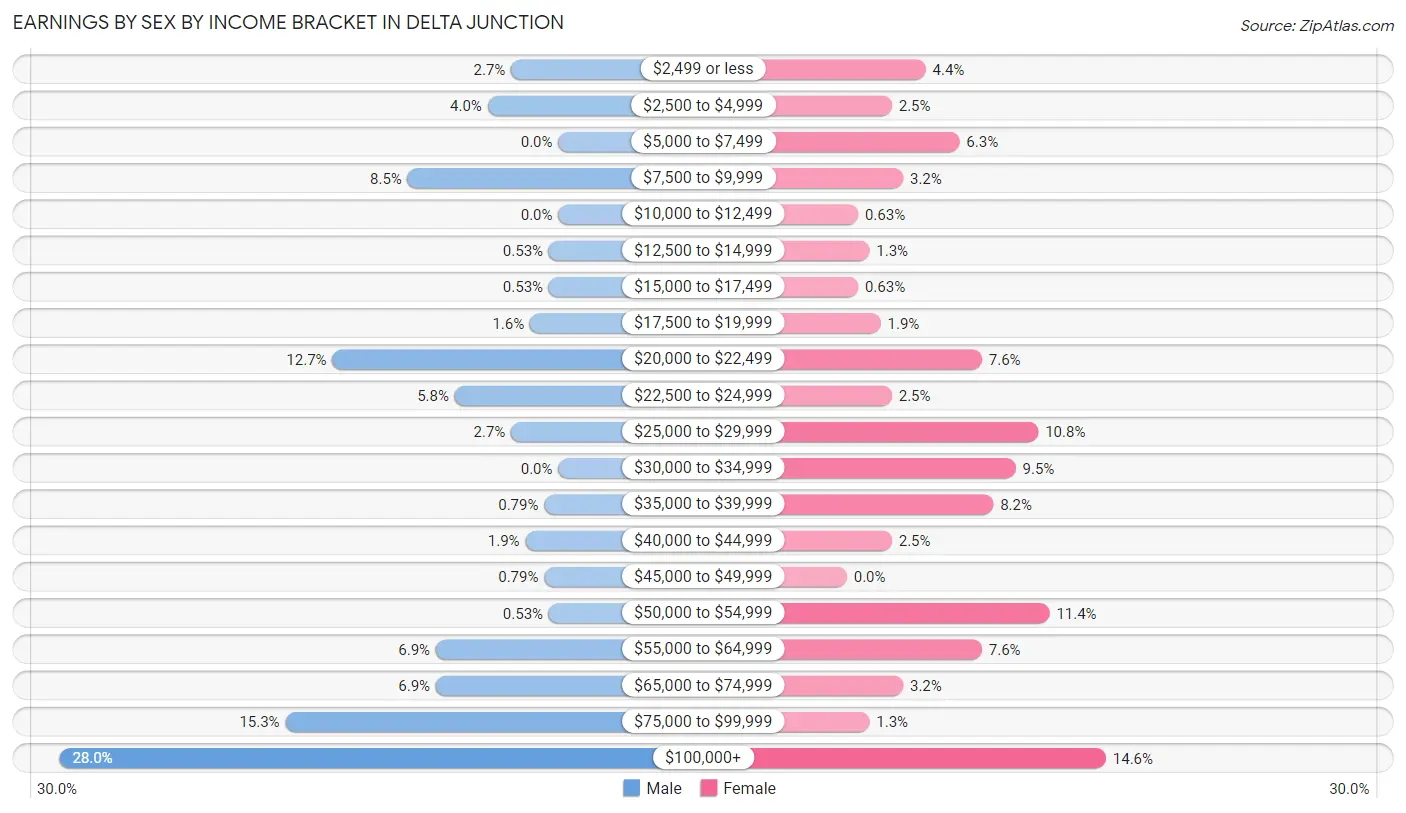
Earnings by Sex by Income Bracket in Delta Junction
The most common earnings brackets in Delta Junction are $100,000+ for men (106 | 28.0%) and $100,000+ for women (23 | 14.6%).
| Income | Male | Female |
| $2,499 or less | 10 (2.6%) | 7 (4.4%) |
| $2,500 to $4,999 | 15 (4.0%) | 4 (2.5%) |
| $5,000 to $7,499 | 0 (0.0%) | 10 (6.3%) |
| $7,500 to $9,999 | 32 (8.5%) | 5 (3.2%) |
| $10,000 to $12,499 | 0 (0.0%) | 1 (0.6%) |
| $12,500 to $14,999 | 2 (0.5%) | 2 (1.3%) |
| $15,000 to $17,499 | 2 (0.5%) | 1 (0.6%) |
| $17,500 to $19,999 | 6 (1.6%) | 3 (1.9%) |
| $20,000 to $22,499 | 48 (12.7%) | 12 (7.6%) |
| $22,500 to $24,999 | 22 (5.8%) | 4 (2.5%) |
| $25,000 to $29,999 | 10 (2.6%) | 17 (10.8%) |
| $30,000 to $34,999 | 0 (0.0%) | 15 (9.5%) |
| $35,000 to $39,999 | 3 (0.8%) | 13 (8.2%) |
| $40,000 to $44,999 | 7 (1.8%) | 4 (2.5%) |
| $45,000 to $49,999 | 3 (0.8%) | 0 (0.0%) |
| $50,000 to $54,999 | 2 (0.5%) | 18 (11.4%) |
| $55,000 to $64,999 | 26 (6.9%) | 12 (7.6%) |
| $65,000 to $74,999 | 26 (6.9%) | 5 (3.2%) |
| $75,000 to $99,999 | 58 (15.3%) | 2 (1.3%) |
| $100,000+ | 106 (28.0%) | 23 (14.6%) |
| Total | 378 (100.0%) | 158 (100.0%) |
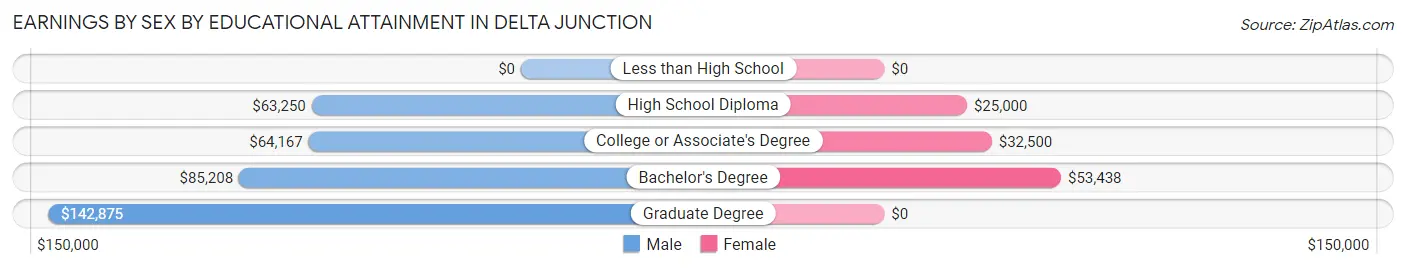
Earnings by Sex by Educational Attainment in Delta Junction
Average earnings in Delta Junction are $75,000 for men and $35,625 for women, a difference of 52.5%. Men with an educational attainment of graduate degree enjoy the highest average annual earnings of $142,875, while those with high school diploma education earn the least with $63,250. Women with an educational attainment of bachelor's degree earn the most with the average annual earnings of $53,438, while those with high school diploma education have the smallest earnings of $25,000.
| Educational Attainment | Male Income | Female Income |
| Less than High School | - | - |
| High School Diploma | $63,250 | $25,000 |
| College or Associate's Degree | $64,167 | $32,500 |
| Bachelor's Degree | $85,208 | $53,438 |
| Graduate Degree | $142,875 | $0 |
| Total | $75,000 | $35,625 |
Family Income in Delta Junction
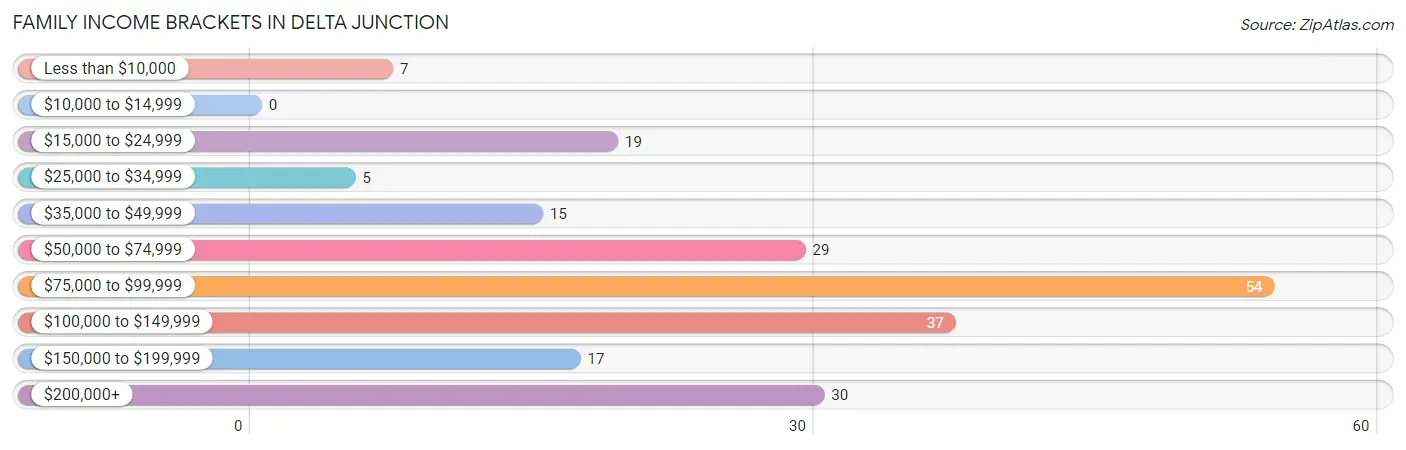
Family Income Brackets in Delta Junction
According to the Delta Junction family income data, there are 54 families falling into the $75,000 to $99,999 income range, which is the most common income bracket and makes up 25.4% of all families.
| Income Bracket | # Families | % Families |
| Less than $10,000 | 7 | 3.3% |
| $10,000 to $14,999 | 0 | 0.0% |
| $15,000 to $24,999 | 19 | 8.9% |
| $25,000 to $34,999 | 5 | 2.3% |
| $35,000 to $49,999 | 15 | 7.0% |
| $50,000 to $74,999 | 29 | 13.6% |
| $75,000 to $99,999 | 54 | 25.4% |
| $100,000 to $149,999 | 37 | 17.4% |
| $150,000 to $199,999 | 17 | 8.0% |
| $200,000+ | 30 | 14.1% |
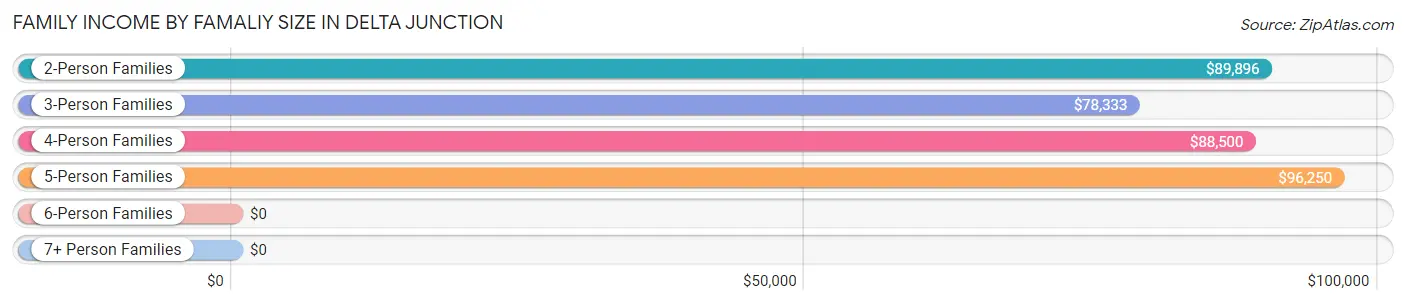
Family Income by Famaliy Size in Delta Junction
5-person families (26 | 12.2%) account for the highest median family income in Delta Junction with $96,250 per family, while 2-person families (89 | 41.8%) have the highest median income of $44,948 per family member.
| Income Bracket | # Families | Median Income |
| 2-Person Families | 89 (41.8%) | $89,896 |
| 3-Person Families | 46 (21.6%) | $78,333 |
| 4-Person Families | 46 (21.6%) | $88,500 |
| 5-Person Families | 26 (12.2%) | $96,250 |
| 6-Person Families | 2 (0.9%) | $0 |
| 7+ Person Families | 4 (1.9%) | $0 |
| Total | 213 (100.0%) | $89,485 |
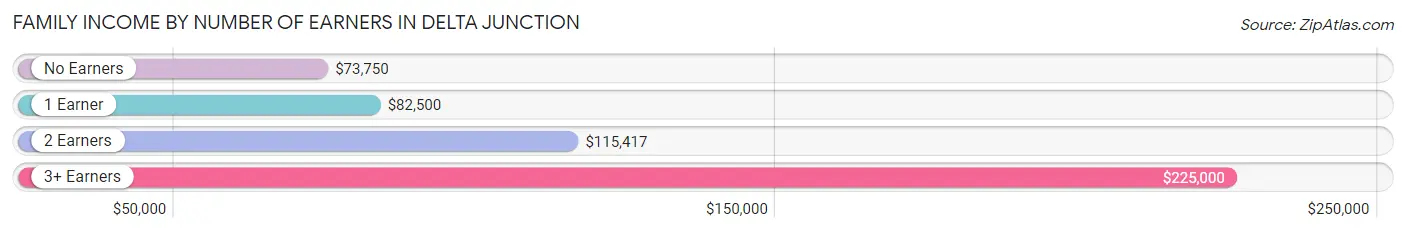
Family Income by Number of Earners in Delta Junction
The median family income in Delta Junction is $89,485, with families comprising 3+ earners (12) having the highest median family income of $225,000, while families with no earners (62) have the lowest median family income of $73,750, accounting for 5.6% and 29.1% of families, respectively.
| Number of Earners | # Families | Median Income |
| No Earners | 62 (29.1%) | $73,750 |
| 1 Earner | 76 (35.7%) | $82,500 |
| 2 Earners | 63 (29.6%) | $115,417 |
| 3+ Earners | 12 (5.6%) | $225,000 |
| Total | 213 (100.0%) | $89,485 |
Household Income in Delta Junction
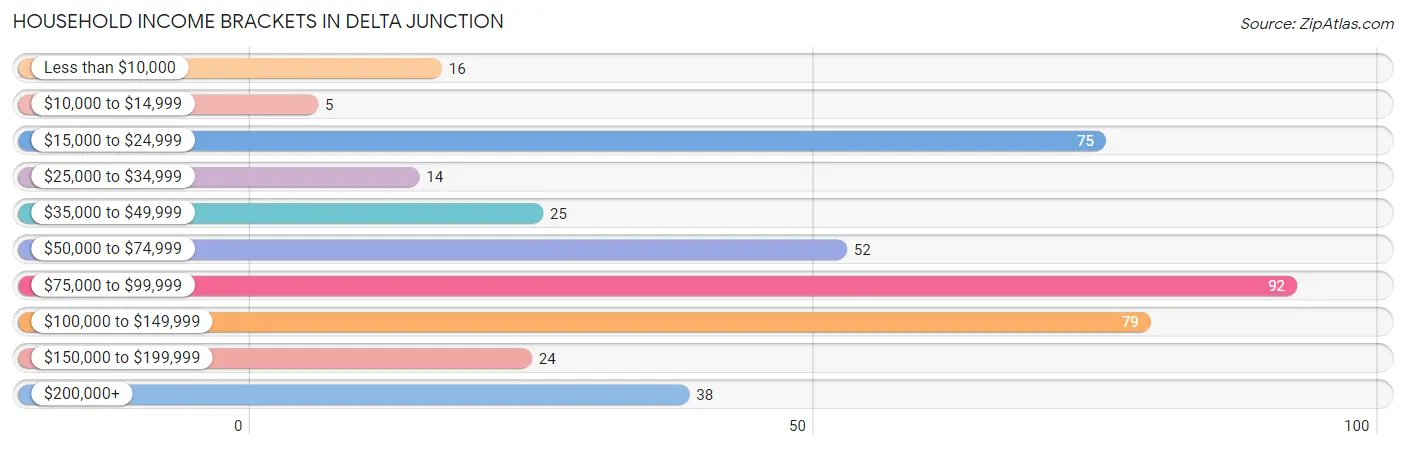
Household Income Brackets in Delta Junction
With 92 households falling in the category, the $75,000 to $99,999 income range is the most frequent in Delta Junction, accounting for 21.9% of all households. In contrast, only 5 households (1.2%) fall into the $10,000 to $14,999 income bracket, making it the least populous group.
| Income Bracket | # Households | % Households |
| Less than $10,000 | 16 | 3.8% |
| $10,000 to $14,999 | 5 | 1.2% |
| $15,000 to $24,999 | 75 | 17.9% |
| $25,000 to $34,999 | 14 | 3.3% |
| $35,000 to $49,999 | 25 | 6.0% |
| $50,000 to $74,999 | 52 | 12.4% |
| $75,000 to $99,999 | 92 | 21.9% |
| $100,000 to $149,999 | 79 | 18.8% |
| $150,000 to $199,999 | 24 | 5.7% |
| $200,000+ | 38 | 9.0% |
Household Income by Householder Age in Delta Junction
The median household income in Delta Junction is $80,556, with the highest median household income of $97,000 found in the 45 to 64 years age bracket for the primary householder. A total of 126 households (30.0%) fall into this category. Meanwhile, the 15 to 24 years age bracket for the primary householder has the lowest median household income of $41,250, with 10 households (2.4%) in this group.
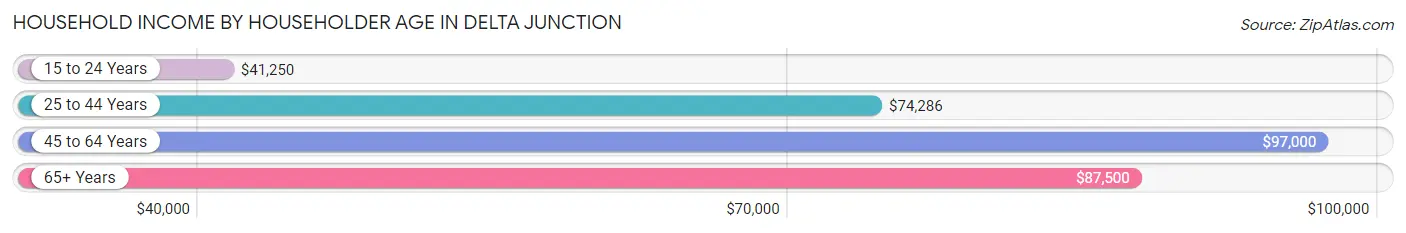
| Income Bracket | # Households | Median Income |
| 15 to 24 Years | 10 (2.4%) | $41,250 |
| 25 to 44 Years | 198 (47.1%) | $74,286 |
| 45 to 64 Years | 126 (30.0%) | $97,000 |
| 65+ Years | 86 (20.5%) | $87,500 |
| Total | 420 (100.0%) | $80,556 |
Poverty in Delta Junction
Income Below Poverty by Sex and Age in Delta Junction
With 7.8% poverty level for males and 11.0% for females among the residents of Delta Junction, 16 and 17 year old males and 12 to 14 year old females are the most vulnerable to poverty, with 13 males (59.1%) and 11 females (47.8%) in their respective age groups living below the poverty level.
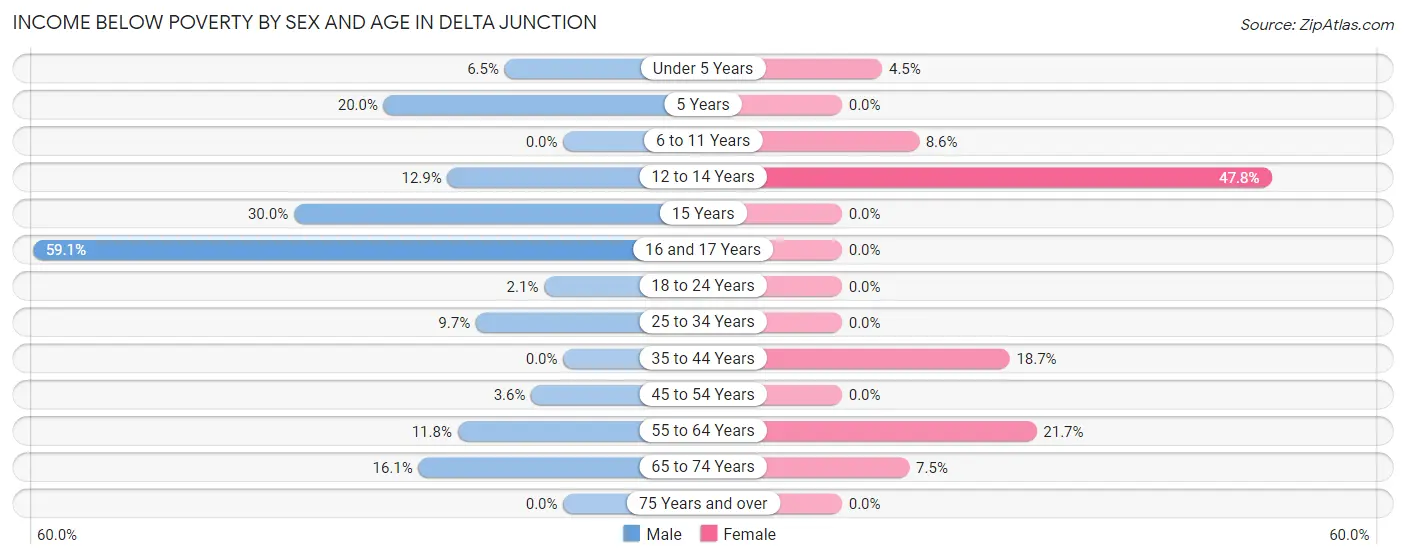
| Age Bracket | Male | Female |
| Under 5 Years | 3 (6.5%) | 3 (4.5%) |
| 5 Years | 3 (20.0%) | 0 (0.0%) |
| 6 to 11 Years | 0 (0.0%) | 3 (8.6%) |
| 12 to 14 Years | 4 (12.9%) | 11 (47.8%) |
| 15 Years | 3 (30.0%) | 0 (0.0%) |
| 16 and 17 Years | 13 (59.1%) | 0 (0.0%) |
| 18 to 24 Years | 1 (2.1%) | 0 (0.0%) |
| 25 to 34 Years | 11 (9.7%) | 0 (0.0%) |
| 35 to 44 Years | 0 (0.0%) | 14 (18.7%) |
| 45 to 54 Years | 3 (3.6%) | 0 (0.0%) |
| 55 to 64 Years | 8 (11.8%) | 13 (21.7%) |
| 65 to 74 Years | 5 (16.1%) | 3 (7.5%) |
| 75 Years and over | 0 (0.0%) | 0 (0.0%) |
| Total | 54 (7.8%) | 47 (11.0%) |
Income Above Poverty by Sex and Age in Delta Junction
According to the poverty statistics in Delta Junction, males aged 6 to 11 years and females aged 5 years are the age groups that are most secure financially, with 100.0% of males and 100.0% of females in these age groups living above the poverty line.
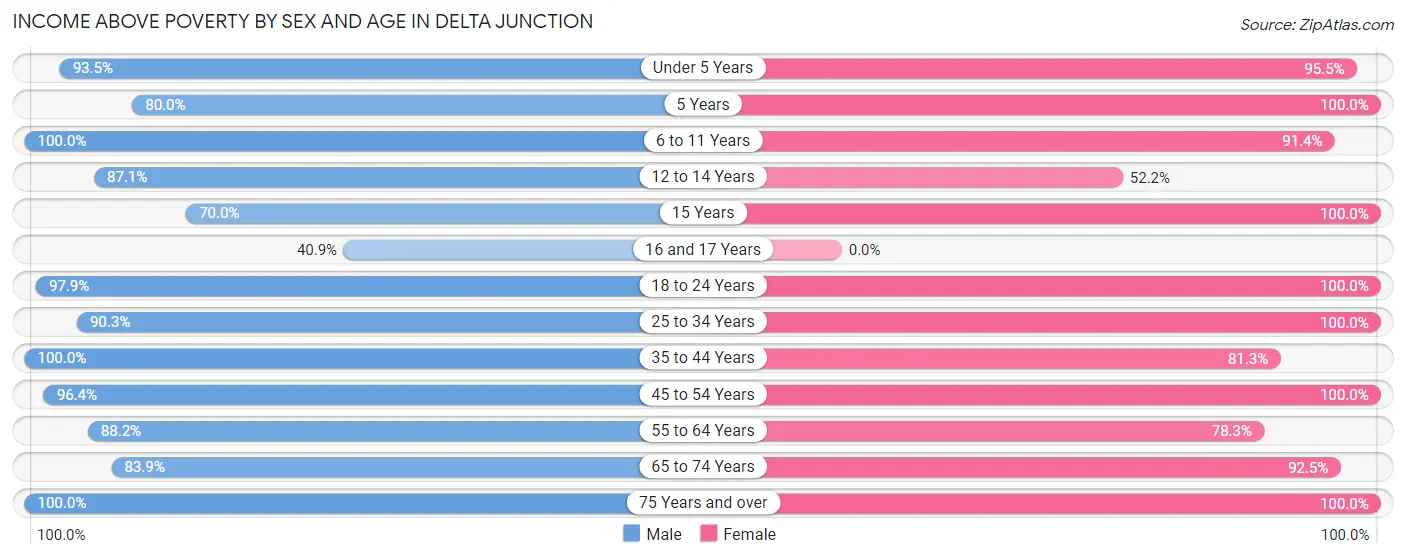
| Age Bracket | Male | Female |
| Under 5 Years | 43 (93.5%) | 64 (95.5%) |
| 5 Years | 12 (80.0%) | 2 (100.0%) |
| 6 to 11 Years | 41 (100.0%) | 32 (91.4%) |
| 12 to 14 Years | 27 (87.1%) | 12 (52.2%) |
| 15 Years | 7 (70.0%) | 2 (100.0%) |
| 16 and 17 Years | 9 (40.9%) | 0 (0.0%) |
| 18 to 24 Years | 46 (97.9%) | 10 (100.0%) |
| 25 to 34 Years | 102 (90.3%) | 68 (100.0%) |
| 35 to 44 Years | 141 (100.0%) | 61 (81.3%) |
| 45 to 54 Years | 81 (96.4%) | 27 (100.0%) |
| 55 to 64 Years | 60 (88.2%) | 47 (78.3%) |
| 65 to 74 Years | 26 (83.9%) | 37 (92.5%) |
| 75 Years and over | 42 (100.0%) | 19 (100.0%) |
| Total | 637 (92.2%) | 381 (89.0%) |
Income Below Poverty Among Married-Couple Families in Delta Junction
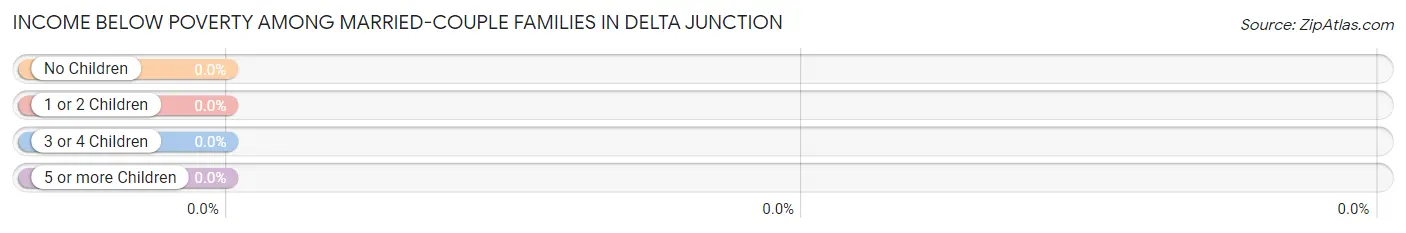
| Children | Above Poverty | Below Poverty |
| No Children | 83 (100.0%) | 0 (0.0%) |
| 1 or 2 Children | 58 (100.0%) | 0 (0.0%) |
| 3 or 4 Children | 19 (100.0%) | 0 (0.0%) |
| 5 or more Children | 4 (100.0%) | 0 (0.0%) |
| Total | 164 (100.0%) | 0 (0.0%) |
Income Below Poverty Among Single-Parent Households in Delta Junction
According to the poverty data in Delta Junction, 25.0% or 3 single-father households and 35.1% or 13 single-mother households are living below the poverty line. Among single-father households, those with 3 or 4 children have the highest poverty rate, with 3 households (100.0%) experiencing poverty. Likewise, among single-mother households, those with 3 or 4 children have the highest poverty rate, with 4 households (80.0%) falling below the poverty line.
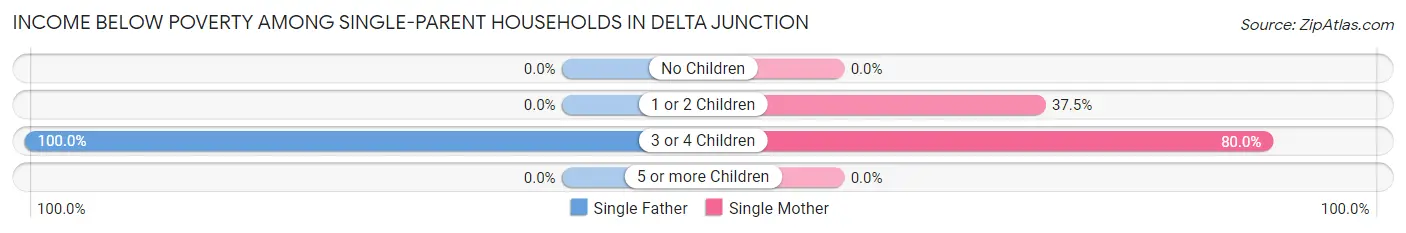
| Children | Single Father | Single Mother |
| No Children | 0 (0.0%) | 0 (0.0%) |
| 1 or 2 Children | 0 (0.0%) | 9 (37.5%) |
| 3 or 4 Children | 3 (100.0%) | 4 (80.0%) |
| 5 or more Children | 0 (0.0%) | 0 (0.0%) |
| Total | 3 (25.0%) | 13 (35.1%) |
Income Below Poverty Among Married-Couple vs Single-Parent Households in Delta Junction
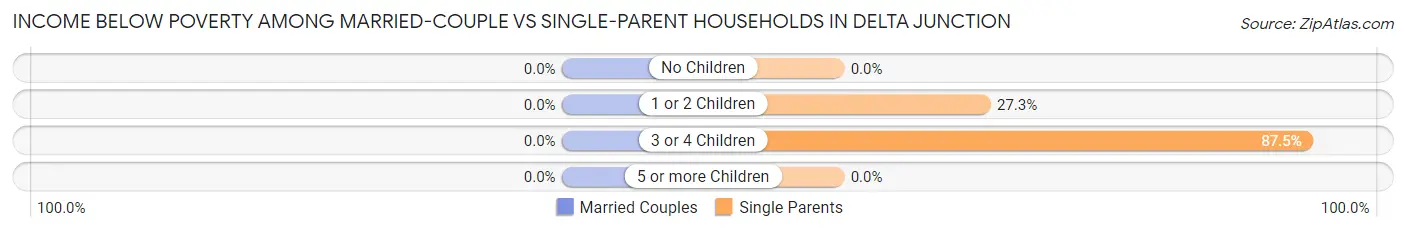
| Children | Married-Couple Families | Single-Parent Households |
| No Children | 0 (0.0%) | 0 (0.0%) |
| 1 or 2 Children | 0 (0.0%) | 9 (27.3%) |
| 3 or 4 Children | 0 (0.0%) | 7 (87.5%) |
| 5 or more Children | 0 (0.0%) | 0 (0.0%) |
| Total | 0 (0.0%) | 16 (32.7%) |
Race in Delta Junction
The most populous races in Delta Junction are White / Caucasian (931 | 82.7%), Hispanic or Latino (109 | 9.7%), and Two or more Races (108 | 9.6%).
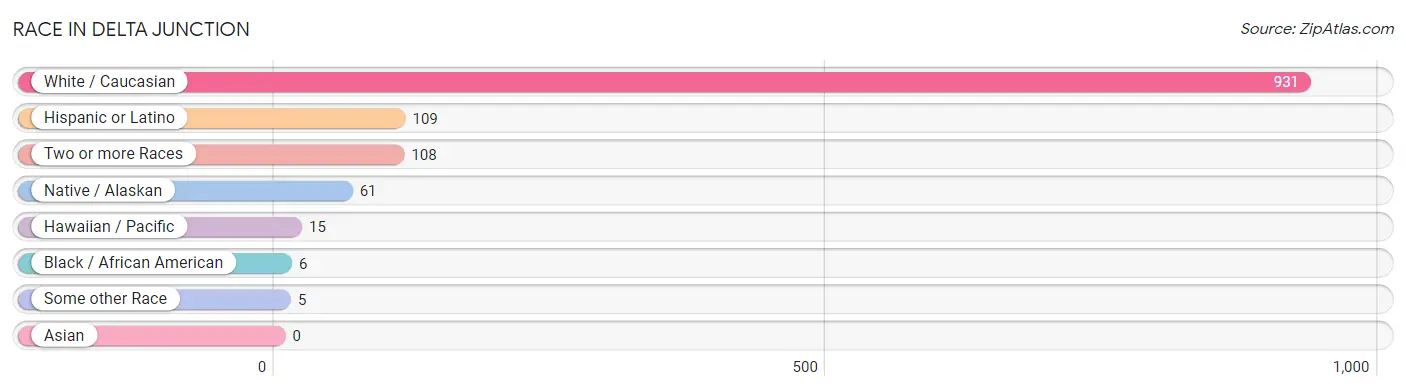
| Race | # Population | % Population |
| Asian | 0 | 0.0% |
| Black / African American | 6 | 0.5% |
| Hawaiian / Pacific | 15 | 1.3% |
| Hispanic or Latino | 109 | 9.7% |
| Native / Alaskan | 61 | 5.4% |
| White / Caucasian | 931 | 82.7% |
| Two or more Races | 108 | 9.6% |
| Some other Race | 5 | 0.4% |
| Total | 1,126 | 100.0% |
Ancestry in Delta Junction
The most populous ancestries reported in Delta Junction are German (238 | 21.1%), Irish (156 | 13.9%), Russian (99 | 8.8%), Ukrainian (82 | 7.3%), and English (71 | 6.3%), together accounting for 57.4% of all Delta Junction residents.
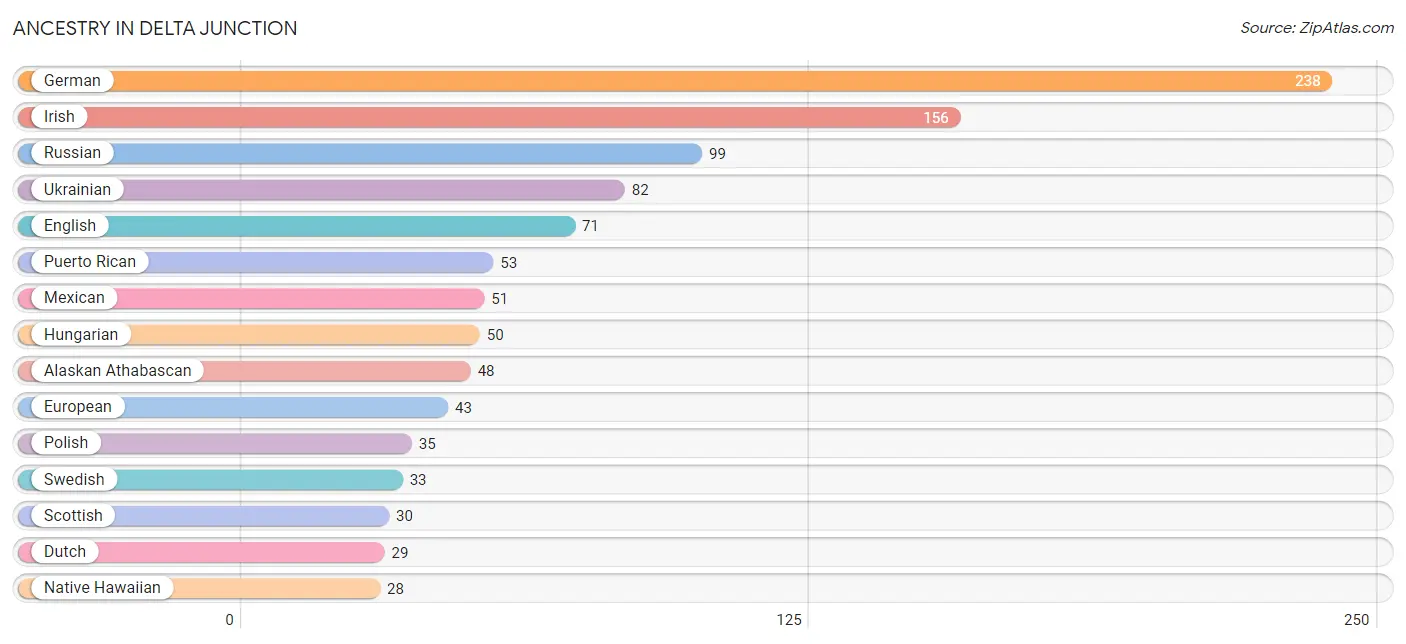
| Ancestry | # Population | % Population |
| Alaska Native | 9 | 0.8% |
| Alaskan Athabascan | 48 | 4.3% |
| Austrian | 5 | 0.4% |
| British | 17 | 1.5% |
| Cherokee | 14 | 1.2% |
| Czech | 4 | 0.4% |
| Danish | 18 | 1.6% |
| Dutch | 29 | 2.6% |
| Eastern European | 3 | 0.3% |
| English | 71 | 6.3% |
| European | 43 | 3.8% |
| French | 15 | 1.3% |
| French Canadian | 16 | 1.4% |
| German | 238 | 21.1% |
| Hungarian | 50 | 4.4% |
| Indian (Asian) | 8 | 0.7% |
| Inupiat | 11 | 1.0% |
| Irish | 156 | 13.9% |
| Italian | 20 | 1.8% |
| Korean | 8 | 0.7% |
| Mexican | 51 | 4.5% |
| Native Hawaiian | 28 | 2.5% |
| Northern European | 6 | 0.5% |
| Norwegian | 5 | 0.4% |
| Polish | 35 | 3.1% |
| Portuguese | 6 | 0.5% |
| Puerto Rican | 53 | 4.7% |
| Russian | 99 | 8.8% |
| Scandinavian | 12 | 1.1% |
| Scotch-Irish | 19 | 1.7% |
| Scottish | 30 | 2.7% |
| Slovene | 3 | 0.3% |
| Swedish | 33 | 2.9% |
| Swiss | 1 | 0.1% |
| Ukrainian | 82 | 7.3% |
| Welsh | 3 | 0.3% | View All 36 Rows |
Immigrants in Delta Junction
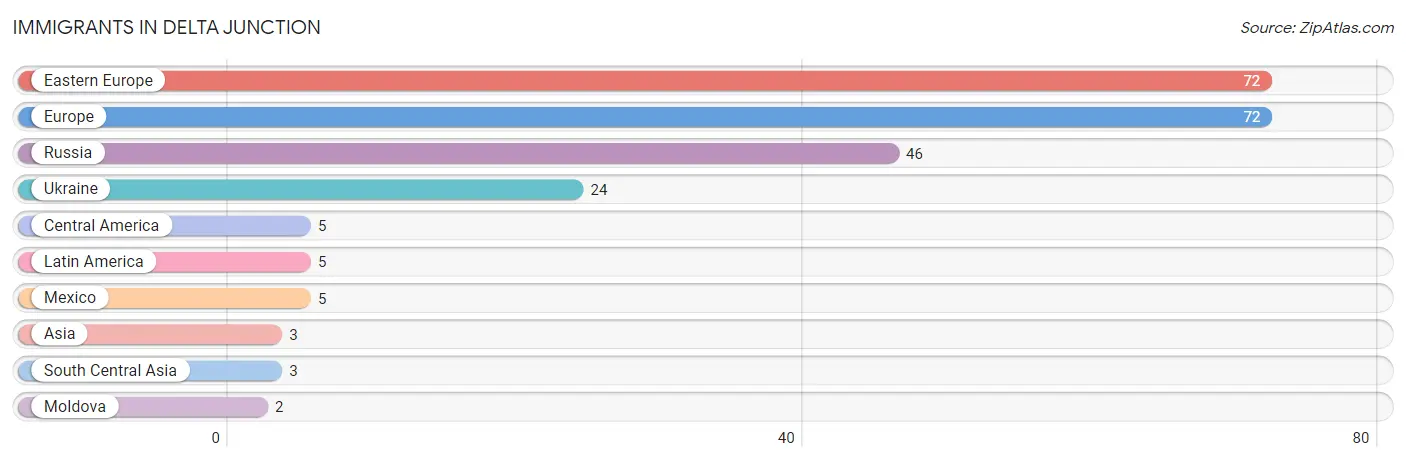
The most numerous immigrant groups reported in Delta Junction came from Eastern Europe (72 | 6.4%), Europe (72 | 6.4%), Russia (46 | 4.1%), Ukraine (24 | 2.1%), and Central America (5 | 0.4%), together accounting for 19.4% of all Delta Junction residents.
| Immigration Origin | # Population | % Population |
| Asia | 3 | 0.3% |
| Central America | 5 | 0.4% |
| Eastern Europe | 72 | 6.4% |
| Europe | 72 | 6.4% |
| Latin America | 5 | 0.4% |
| Mexico | 5 | 0.4% |
| Moldova | 2 | 0.2% |
| Russia | 46 | 4.1% |
| South Central Asia | 3 | 0.3% |
| Ukraine | 24 | 2.1% | View All 10 Rows |
Sex and Age in Delta Junction
Sex and Age in Delta Junction
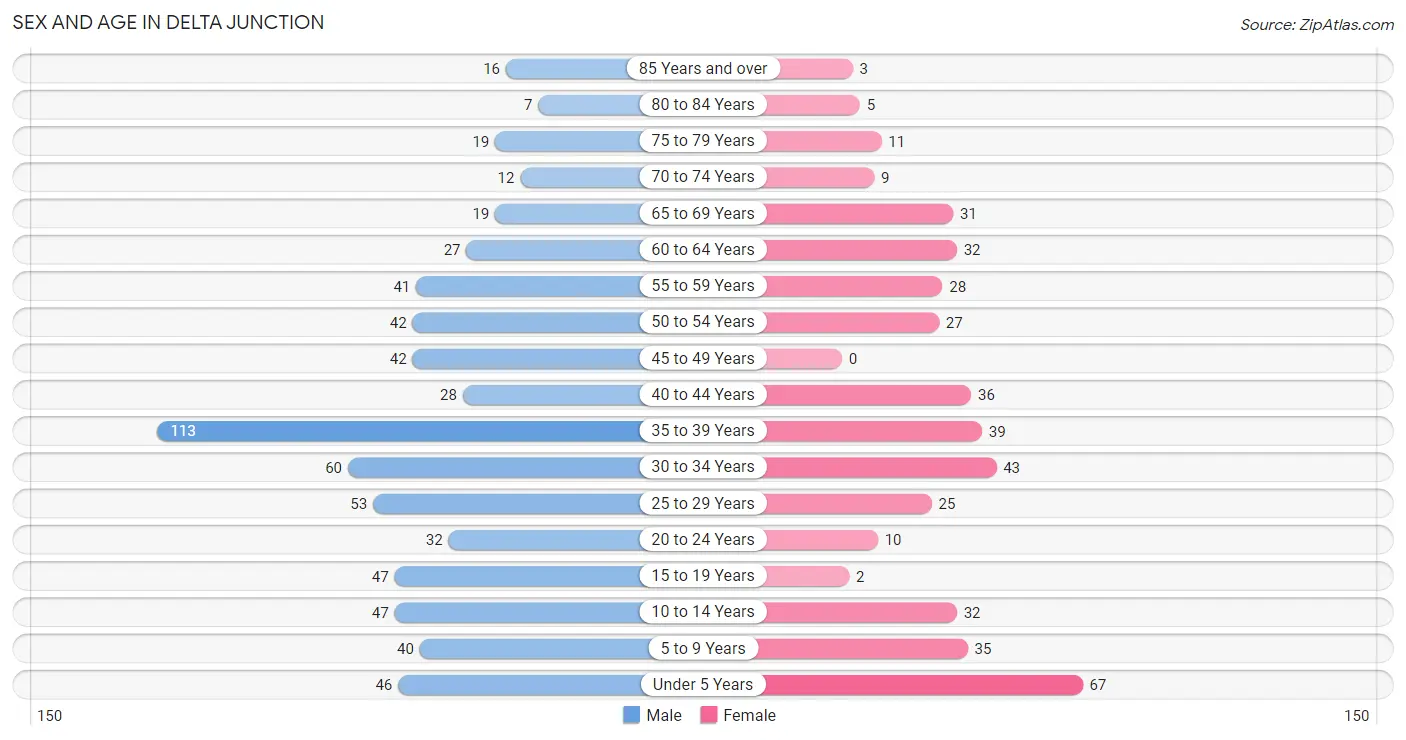
The most populous age groups in Delta Junction are 35 to 39 Years (113 | 16.4%) for men and Under 5 Years (67 | 15.4%) for women.
| Age Bracket | Male | Female |
| Under 5 Years | 46 (6.7%) | 67 (15.4%) |
| 5 to 9 Years | 40 (5.8%) | 35 (8.1%) |
| 10 to 14 Years | 47 (6.8%) | 32 (7.4%) |
| 15 to 19 Years | 47 (6.8%) | 2 (0.5%) |
| 20 to 24 Years | 32 (4.6%) | 10 (2.3%) |
| 25 to 29 Years | 53 (7.7%) | 25 (5.8%) |
| 30 to 34 Years | 60 (8.7%) | 43 (9.9%) |
| 35 to 39 Years | 113 (16.4%) | 39 (9.0%) |
| 40 to 44 Years | 28 (4.1%) | 36 (8.3%) |
| 45 to 49 Years | 42 (6.1%) | 0 (0.0%) |
| 50 to 54 Years | 42 (6.1%) | 27 (6.2%) |
| 55 to 59 Years | 41 (5.9%) | 28 (6.4%) |
| 60 to 64 Years | 27 (3.9%) | 32 (7.4%) |
| 65 to 69 Years | 19 (2.8%) | 31 (7.1%) |
| 70 to 74 Years | 12 (1.7%) | 9 (2.1%) |
| 75 to 79 Years | 19 (2.8%) | 11 (2.5%) |
| 80 to 84 Years | 7 (1.0%) | 5 (1.1%) |
| 85 Years and over | 16 (2.3%) | 3 (0.7%) |
| Total | 691 (100.0%) | 435 (100.0%) |
Families and Households in Delta Junction
Median Family Size in Delta Junction
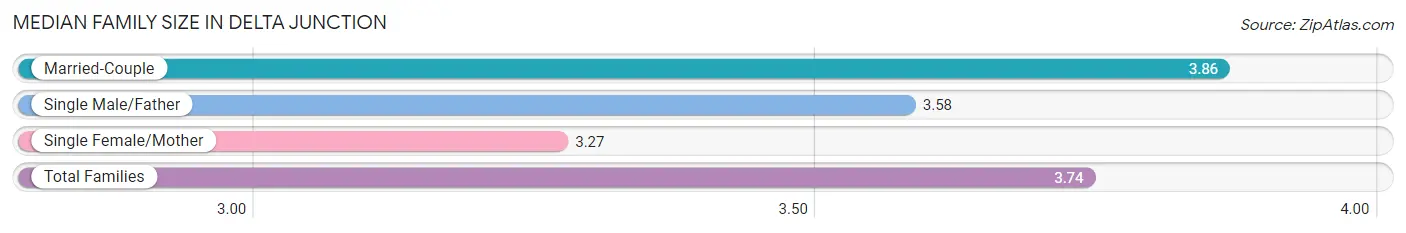
The median family size in Delta Junction is 3.74 persons per family, with married-couple families (164 | 77.0%) accounting for the largest median family size of 3.86 persons per family. On the other hand, single female/mother families (37 | 17.4%) represent the smallest median family size with 3.27 persons per family.
| Family Type | # Families | Family Size |
| Married-Couple | 164 (77.0%) | 3.86 |
| Single Male/Father | 12 (5.6%) | 3.58 |
| Single Female/Mother | 37 (17.4%) | 3.27 |
| Total Families | 213 (100.0%) | 3.74 |
Median Household Size in Delta Junction
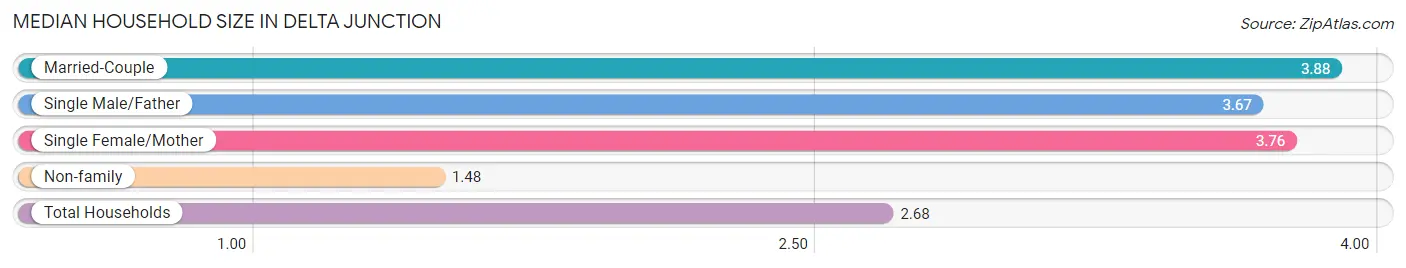
The median household size in Delta Junction is 2.68 persons per household, with married-couple households (164 | 39.1%) accounting for the largest median household size of 3.88 persons per household. non-family households (207 | 49.3%) represent the smallest median household size with 1.48 persons per household.
| Household Type | # Households | Household Size |
| Married-Couple | 164 (39.1%) | 3.88 |
| Single Male/Father | 12 (2.9%) | 3.67 |
| Single Female/Mother | 37 (8.8%) | 3.76 |
| Non-family | 207 (49.3%) | 1.48 |
| Total Households | 420 (100.0%) | 2.68 |
Household Size by Marriage Status in Delta Junction
Out of a total of 420 households in Delta Junction, 213 (50.7%) are family households, while 207 (49.3%) are nonfamily households. The most numerous type of family households are 2-person households, comprising 74, and the most common type of nonfamily households are 1-person households, comprising 174.
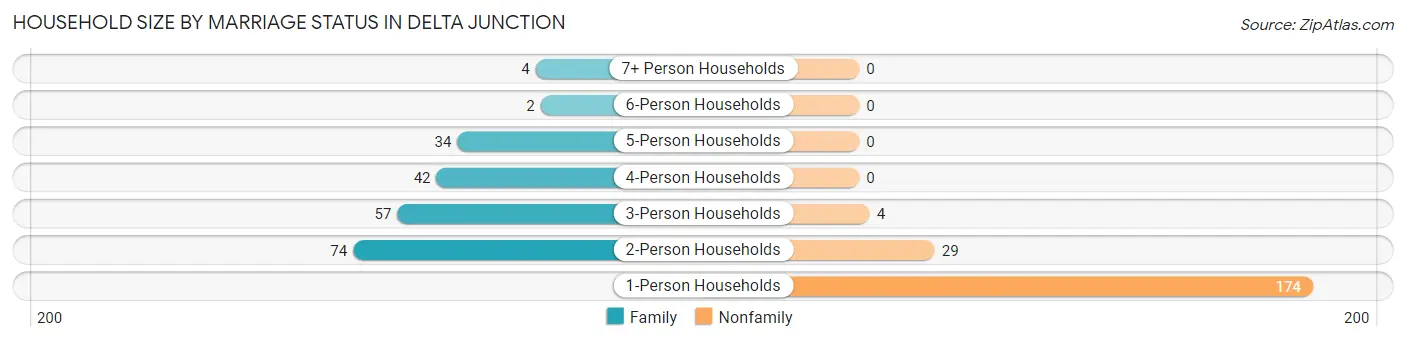
| Household Size | Family Households | Nonfamily Households |
| 1-Person Households | - | 174 (41.4%) |
| 2-Person Households | 74 (17.6%) | 29 (6.9%) |
| 3-Person Households | 57 (13.6%) | 4 (0.9%) |
| 4-Person Households | 42 (10.0%) | 0 (0.0%) |
| 5-Person Households | 34 (8.1%) | 0 (0.0%) |
| 6-Person Households | 2 (0.5%) | 0 (0.0%) |
| 7+ Person Households | 4 (0.9%) | 0 (0.0%) |
| Total | 213 (50.7%) | 207 (49.3%) |
Female Fertility in Delta Junction
Fertility by Age in Delta Junction
Average fertility rate in Delta Junction is 71.0 births per 1,000 women. Women in the age bracket of 20 to 34 years have the highest fertility rate with 141.0 births per 1,000 women. Women in the age bracket of 20 to 34 years acount for 100.0% of all women with births.
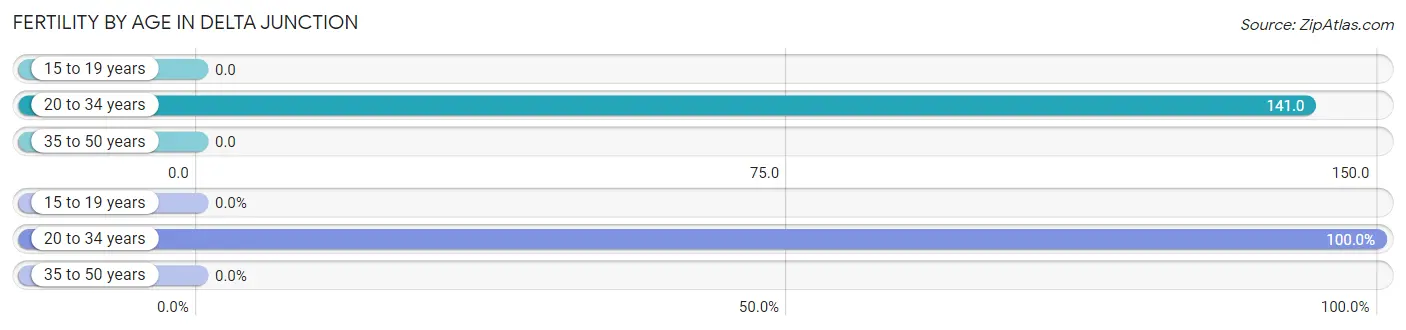
| Age Bracket | Women with Births | Births / 1,000 Women |
| 15 to 19 years | 0 (0.0%) | 0.0 |
| 20 to 34 years | 11 (100.0%) | 141.0 |
| 35 to 50 years | 0 (0.0%) | 0.0 |
| Total | 11 (100.0%) | 71.0 |
Fertility by Age by Marriage Status in Delta Junction
90.9% of women with births (11) in Delta Junction are married. The highest percentage of unmarried women with births falls into 20 to 34 years age bracket with 9.1% of them unmarried at the time of birth, while the lowest percentage of unmarried women with births belong to 20 to 34 years age bracket with 9.1% of them unmarried.
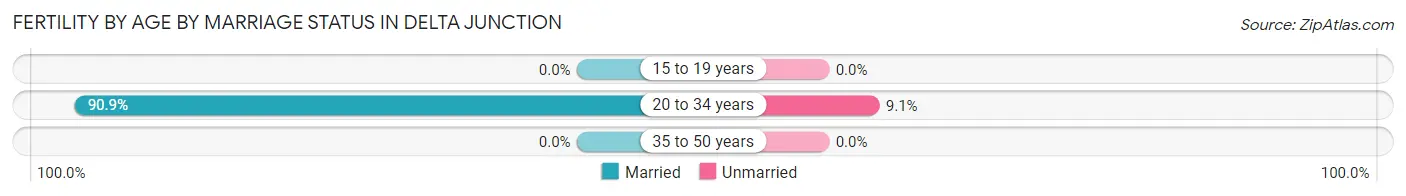
| Age Bracket | Married | Unmarried |
| 15 to 19 years | 0 (0.0%) | 0 (0.0%) |
| 20 to 34 years | 10 (90.9%) | 1 (9.1%) |
| 35 to 50 years | 0 (0.0%) | 0 (0.0%) |
| Total | 10 (90.9%) | 1 (9.1%) |
Fertility by Education in Delta Junction
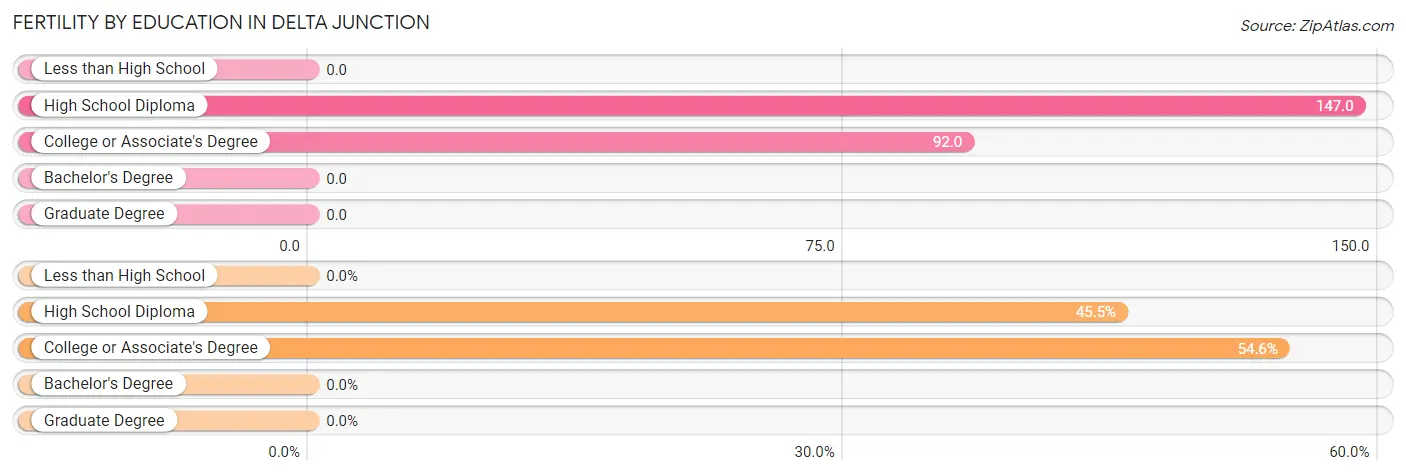
| Educational Attainment | Women with Births | Births / 1,000 Women |
| Less than High School | 0 (0.0%) | 0.0 |
| High School Diploma | 5 (45.5%) | 147.0 |
| College or Associate's Degree | 6 (54.5%) | 92.0 |
| Bachelor's Degree | 0 (0.0%) | 0.0 |
| Graduate Degree | 0 (0.0%) | 0.0 |
| Total | 11 (100.0%) | 71.0 |
Fertility by Education by Marriage Status in Delta Junction
9.1% of women with births in Delta Junction are unmarried. Women with the educational attainment of college or associate's degree are most likely to be married with 100.0% of them married at childbirth, while women with the educational attainment of high school diploma are least likely to be married with 20.0% of them unmarried at childbirth.
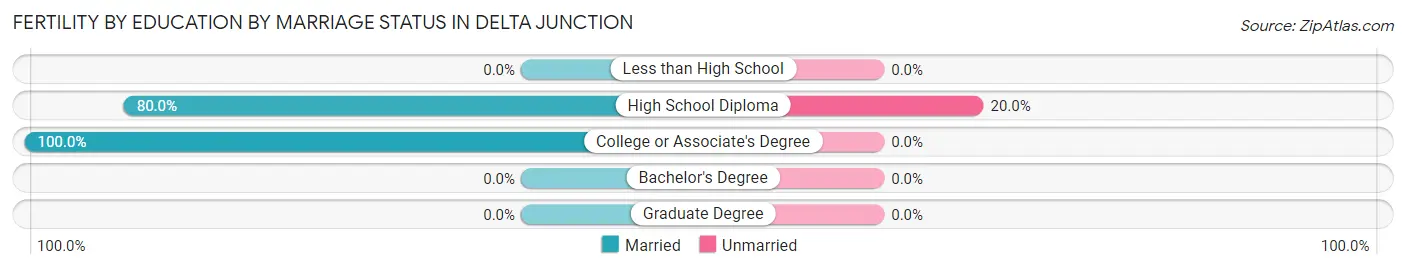
| Educational Attainment | Married | Unmarried |
| Less than High School | 0 (0.0%) | 0 (0.0%) |
| High School Diploma | 4 (80.0%) | 1 (20.0%) |
| College or Associate's Degree | 6 (100.0%) | 0 (0.0%) |
| Bachelor's Degree | 0 (0.0%) | 0 (0.0%) |
| Graduate Degree | 0 (0.0%) | 0 (0.0%) |
| Total | 10 (90.9%) | 1 (9.1%) |
Employment Characteristics in Delta Junction
Employment by Class of Employer in Delta Junction
Among the 502 employed individuals in Delta Junction, private company employees (183 | 36.4%), federal government employees (139 | 27.7%), and local government employees (59 | 11.7%) make up the most common classes of employment.
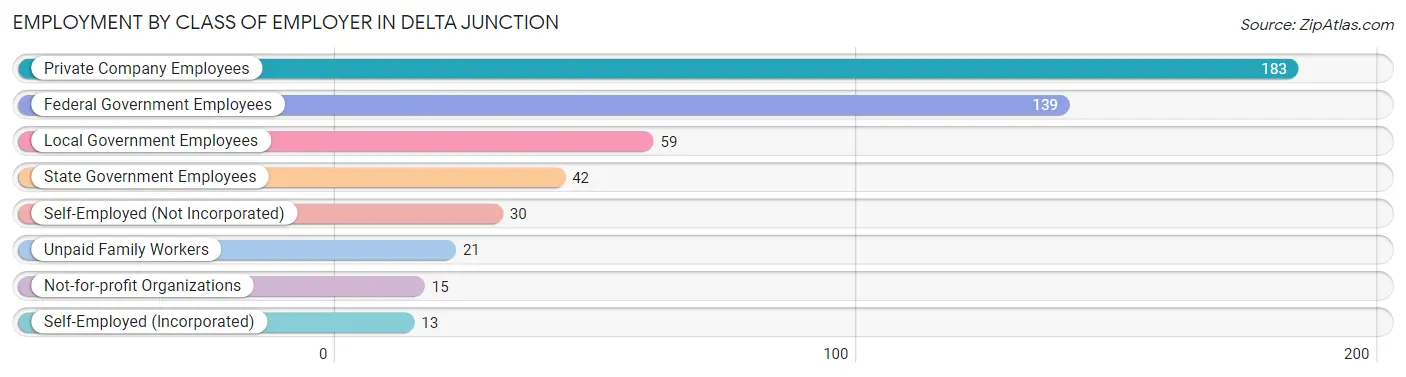
| Employer Class | # Employees | % Employees |
| Private Company Employees | 183 | 36.4% |
| Self-Employed (Incorporated) | 13 | 2.6% |
| Self-Employed (Not Incorporated) | 30 | 6.0% |
| Not-for-profit Organizations | 15 | 3.0% |
| Local Government Employees | 59 | 11.7% |
| State Government Employees | 42 | 8.4% |
| Federal Government Employees | 139 | 27.7% |
| Unpaid Family Workers | 21 | 4.2% |
| Total | 502 | 100.0% |
Employment Status by Age in Delta Junction
According to the labor force statistics for Delta Junction, out of the total population over 16 years of age (847), 64.6% or 547 individuals are in the labor force, with 4.1% or 22 of them unemployed. The age group with the highest labor force participation rate is 20 to 24 years, with 97.6% or 41 individuals in the labor force. Within the labor force, the 16 to 19 years age range has the highest percentage of unemployed individuals, with 17.9% or 5 of them being unemployed.
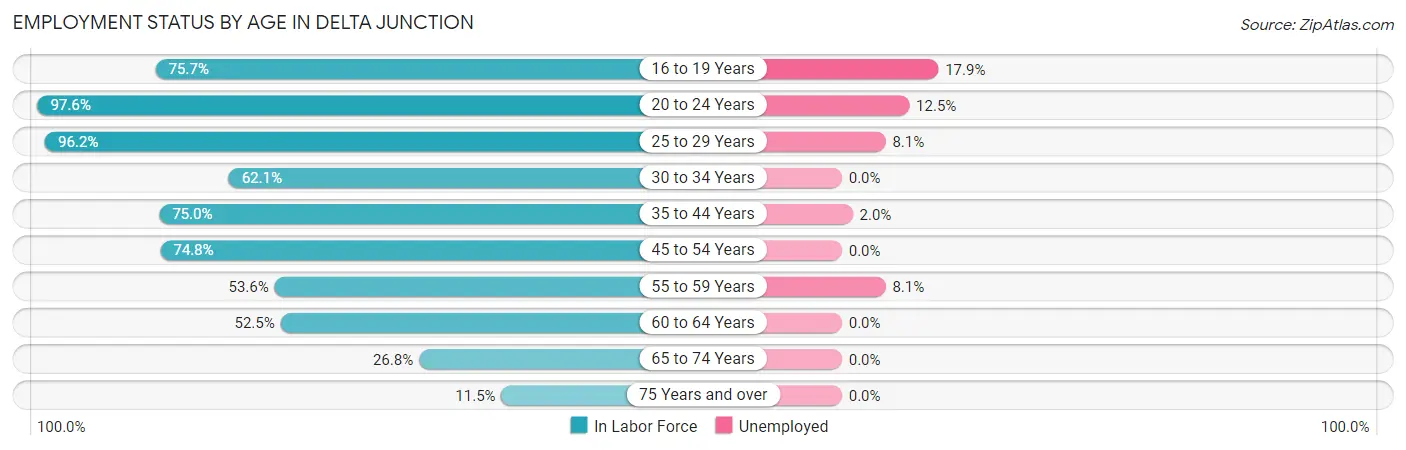
| Age Bracket | In Labor Force | Unemployed |
| 16 to 19 Years | 28 (75.7%) | 5 (17.9%) |
| 20 to 24 Years | 41 (97.6%) | 5 (12.5%) |
| 25 to 29 Years | 75 (96.2%) | 6 (8.1%) |
| 30 to 34 Years | 64 (62.1%) | 0 (0.0%) |
| 35 to 44 Years | 162 (75.0%) | 3 (2.0%) |
| 45 to 54 Years | 83 (74.8%) | 0 (0.0%) |
| 55 to 59 Years | 37 (53.6%) | 3 (8.1%) |
| 60 to 64 Years | 31 (52.5%) | 0 (0.0%) |
| 65 to 74 Years | 19 (26.8%) | 0 (0.0%) |
| 75 Years and over | 7 (11.5%) | 0 (0.0%) |
| Total | 547 (64.6%) | 22 (4.1%) |
Employment Status by Educational Attainment in Delta Junction
According to labor force statistics for Delta Junction, 71.1% of individuals (452) out of the total population between 25 and 64 years of age (636) are in the labor force, with 2.6% or 12 of them being unemployed. The group with the highest labor force participation rate are those with the educational attainment of bachelor's degree or higher, with 91.4% or 128 individuals in the labor force. Within the labor force, individuals with less than high school education have the highest percentage of unemployment, with 17.6% or 3 of them being unemployed.
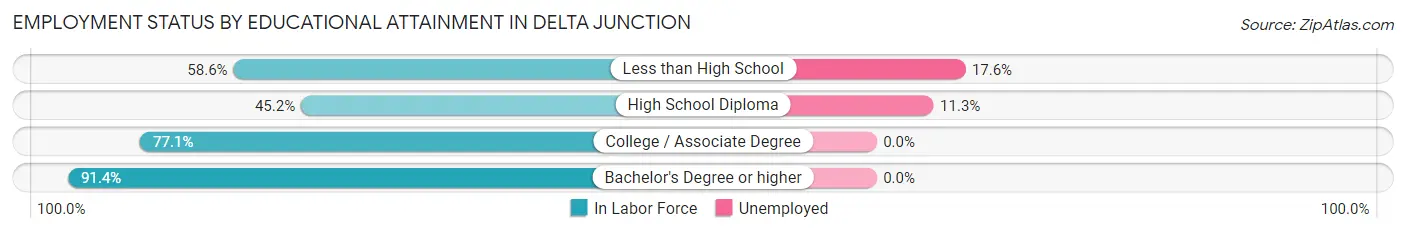
| Educational Attainment | In Labor Force | Unemployed |
| Less than High School | 17 (58.6%) | 5 (17.6%) |
| High School Diploma | 75 (45.2%) | 19 (11.3%) |
| College / Associate Degree | 232 (77.1%) | 0 (0.0%) |
| Bachelor's Degree or higher | 128 (91.4%) | 0 (0.0%) |
| Total | 452 (71.1%) | 17 (2.6%) |
Employment Occupations by Sex in Delta Junction
Management, Business, Science and Arts Occupations
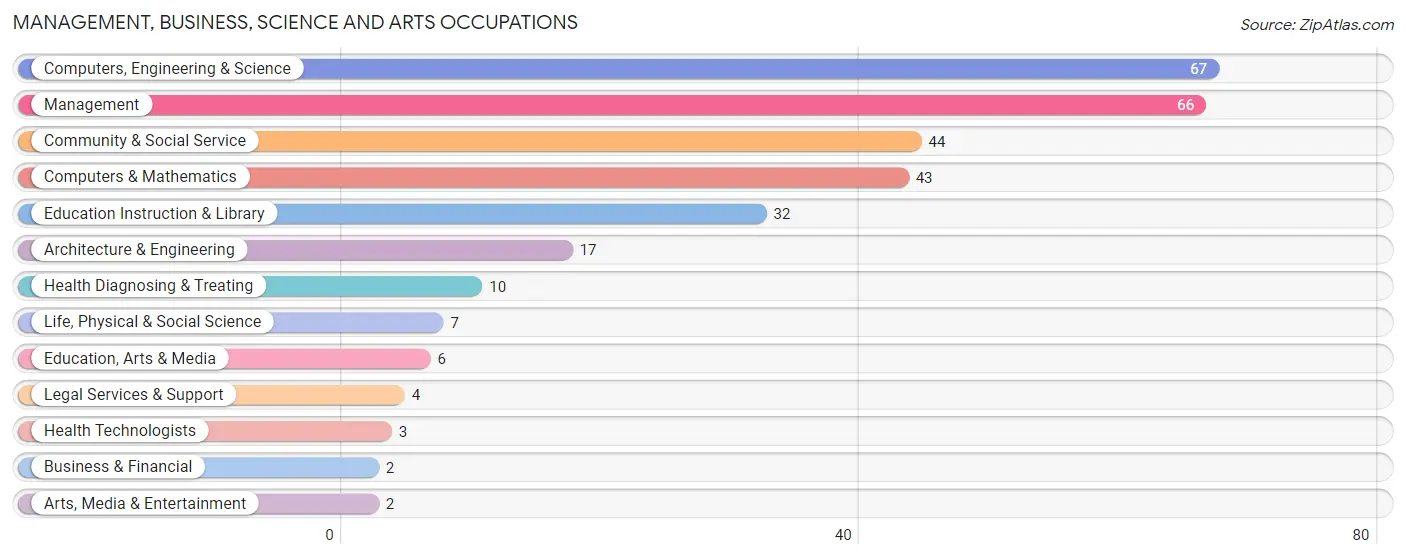
The most common Management, Business, Science and Arts occupations in Delta Junction are Computers, Engineering & Science (67 | 13.7%), Management (66 | 13.4%), Community & Social Service (44 | 9.0%), Computers & Mathematics (43 | 8.8%), and Education Instruction & Library (32 | 6.5%).
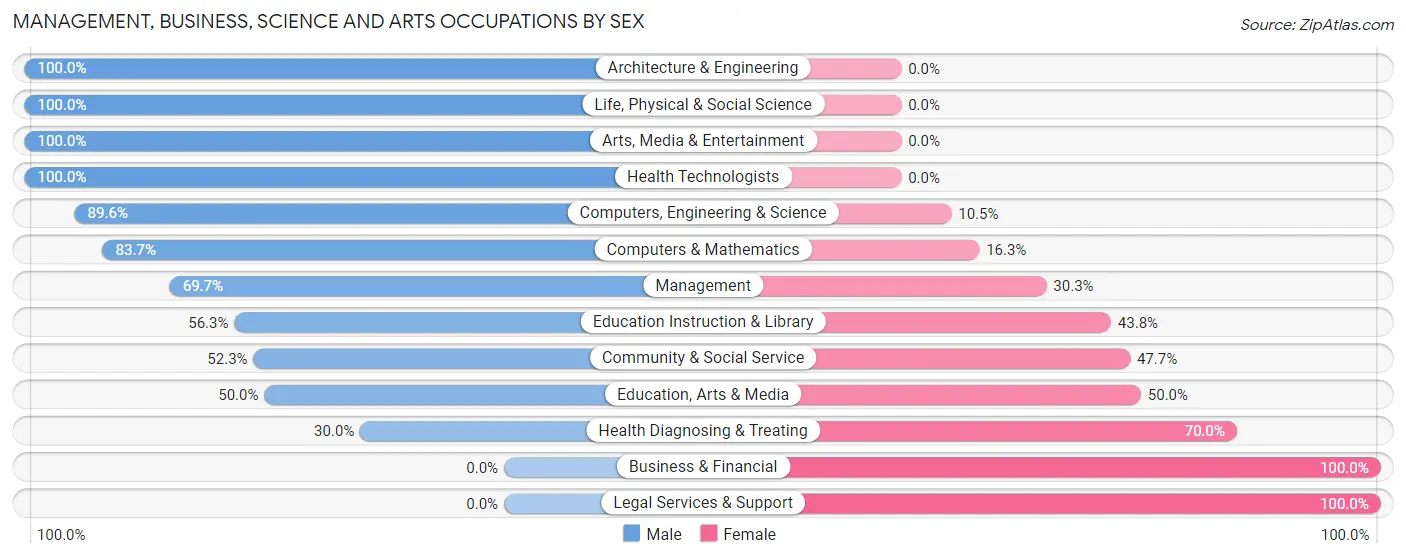
Management, Business, Science and Arts Occupations by Sex
Within the Management, Business, Science and Arts occupations in Delta Junction, the most male-oriented occupations are Architecture & Engineering (100.0%), Life, Physical & Social Science (100.0%), and Arts, Media & Entertainment (100.0%), while the most female-oriented occupations are Business & Financial (100.0%), Legal Services & Support (100.0%), and Health Diagnosing & Treating (70.0%).
| Occupation | Male | Female |
| Management | 46 (69.7%) | 20 (30.3%) |
| Business & Financial | 0 (0.0%) | 2 (100.0%) |
| Computers, Engineering & Science | 60 (89.5%) | 7 (10.4%) |
| Computers & Mathematics | 36 (83.7%) | 7 (16.3%) |
| Architecture & Engineering | 17 (100.0%) | 0 (0.0%) |
| Life, Physical & Social Science | 7 (100.0%) | 0 (0.0%) |
| Community & Social Service | 23 (52.3%) | 21 (47.7%) |
| Education, Arts & Media | 3 (50.0%) | 3 (50.0%) |
| Legal Services & Support | 0 (0.0%) | 4 (100.0%) |
| Education Instruction & Library | 18 (56.2%) | 14 (43.8%) |
| Arts, Media & Entertainment | 2 (100.0%) | 0 (0.0%) |
| Health Diagnosing & Treating | 3 (30.0%) | 7 (70.0%) |
| Health Technologists | 3 (100.0%) | 0 (0.0%) |
| Total (Category) | 132 (69.8%) | 57 (30.2%) |
| Total (Overall) | 342 (69.7%) | 149 (30.3%) |
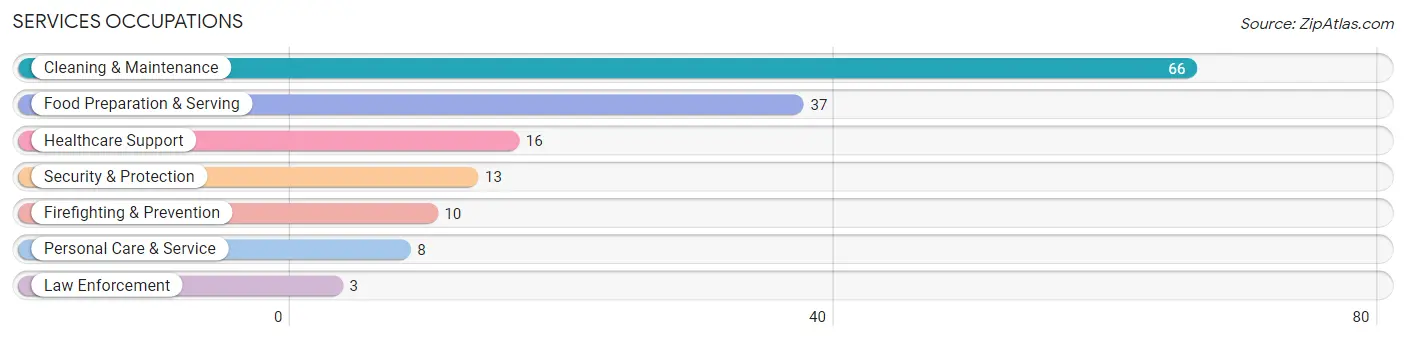
Services Occupations
The most common Services occupations in Delta Junction are Cleaning & Maintenance (66 | 13.4%), Food Preparation & Serving (37 | 7.5%), Healthcare Support (16 | 3.3%), Security & Protection (13 | 2.6%), and Firefighting & Prevention (10 | 2.0%).
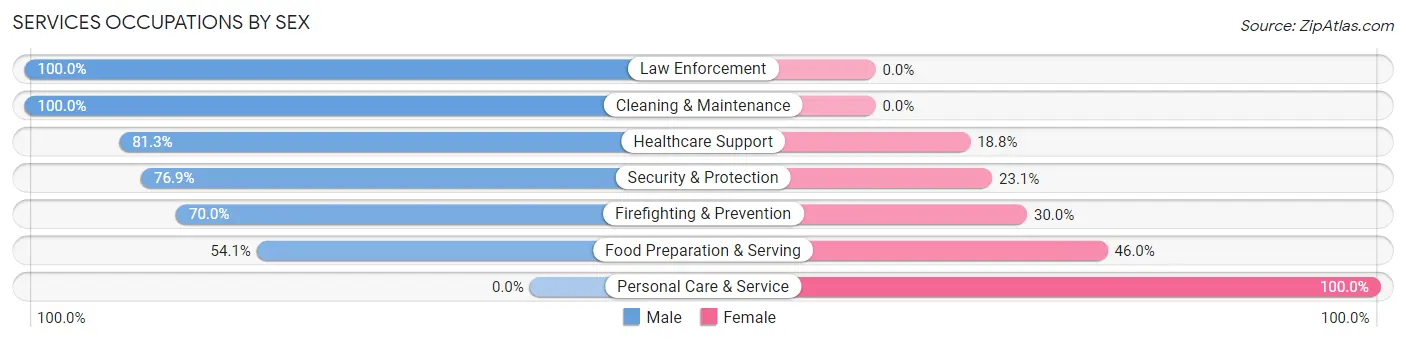
Services Occupations by Sex
Within the Services occupations in Delta Junction, the most male-oriented occupations are Law Enforcement (100.0%), Cleaning & Maintenance (100.0%), and Healthcare Support (81.2%), while the most female-oriented occupations are Personal Care & Service (100.0%), Food Preparation & Serving (46.0%), and Firefighting & Prevention (30.0%).
| Occupation | Male | Female |
| Healthcare Support | 13 (81.2%) | 3 (18.8%) |
| Security & Protection | 10 (76.9%) | 3 (23.1%) |
| Firefighting & Prevention | 7 (70.0%) | 3 (30.0%) |
| Law Enforcement | 3 (100.0%) | 0 (0.0%) |
| Food Preparation & Serving | 20 (54.0%) | 17 (46.0%) |
| Cleaning & Maintenance | 66 (100.0%) | 0 (0.0%) |
| Personal Care & Service | 0 (0.0%) | 8 (100.0%) |
| Total (Category) | 109 (77.9%) | 31 (22.1%) |
| Total (Overall) | 342 (69.7%) | 149 (30.3%) |
Sales and Office Occupations
The most common Sales and Office occupations in Delta Junction are Office & Administration (35 | 7.1%), and Sales & Related (22 | 4.5%).
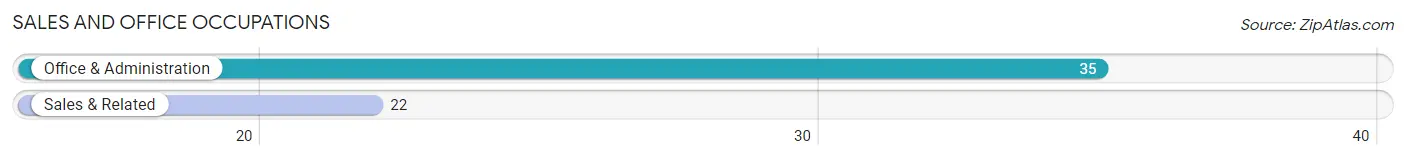
Sales and Office Occupations by Sex

| Occupation | Male | Female |
| Sales & Related | 11 (50.0%) | 11 (50.0%) |
| Office & Administration | 0 (0.0%) | 35 (100.0%) |
| Total (Category) | 11 (19.3%) | 46 (80.7%) |
| Total (Overall) | 342 (69.7%) | 149 (30.3%) |
Natural Resources, Construction and Maintenance Occupations
The most common Natural Resources, Construction and Maintenance occupations in Delta Junction are Construction & Extraction (38 | 7.7%), Installation, Maintenance & Repair (20 | 4.1%), and Farming, Fishing & Forestry (17 | 3.5%).
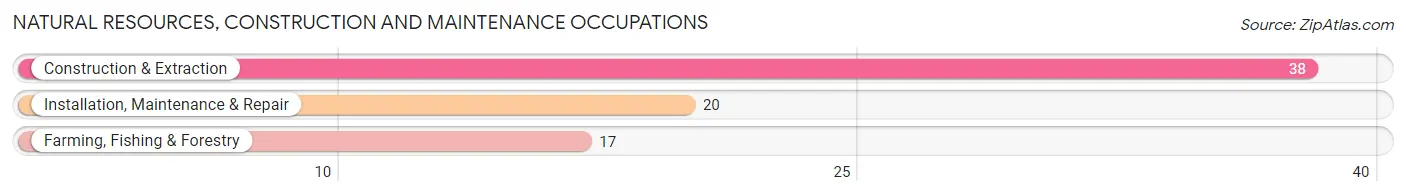
Natural Resources, Construction and Maintenance Occupations by Sex
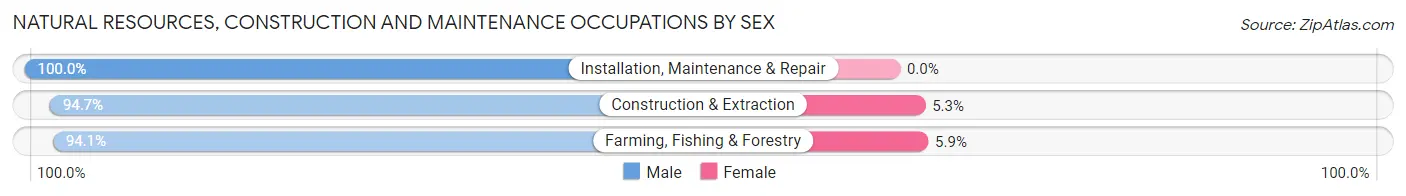
| Occupation | Male | Female |
| Farming, Fishing & Forestry | 16 (94.1%) | 1 (5.9%) |
| Construction & Extraction | 36 (94.7%) | 2 (5.3%) |
| Installation, Maintenance & Repair | 20 (100.0%) | 0 (0.0%) |
| Total (Category) | 72 (96.0%) | 3 (4.0%) |
| Total (Overall) | 342 (69.7%) | 149 (30.3%) |
Production, Transportation and Moving Occupations
The most common Production, Transportation and Moving occupations in Delta Junction are Transportation (14 | 2.9%), Material Moving (12 | 2.4%), and Production (4 | 0.8%).
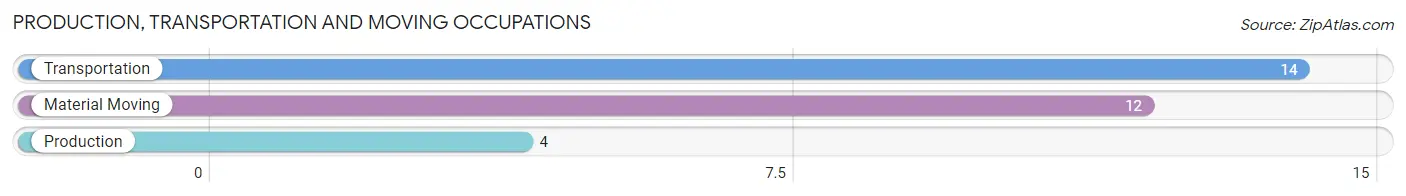
Production, Transportation and Moving Occupations by Sex
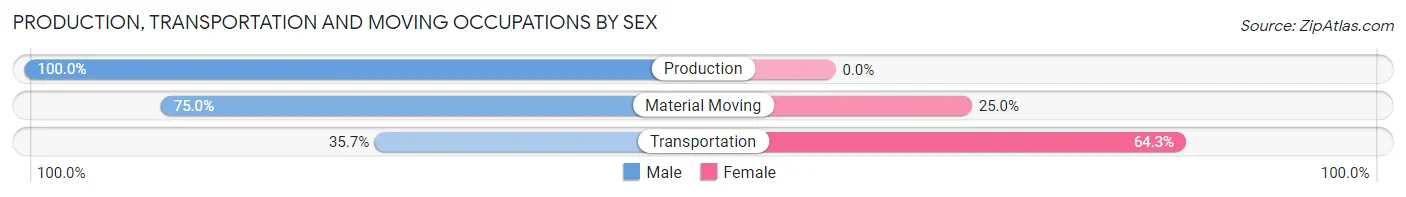
| Occupation | Male | Female |
| Production | 4 (100.0%) | 0 (0.0%) |
| Transportation | 5 (35.7%) | 9 (64.3%) |
| Material Moving | 9 (75.0%) | 3 (25.0%) |
| Total (Category) | 18 (60.0%) | 12 (40.0%) |
| Total (Overall) | 342 (69.7%) | 149 (30.3%) |
Employment Industries by Sex in Delta Junction
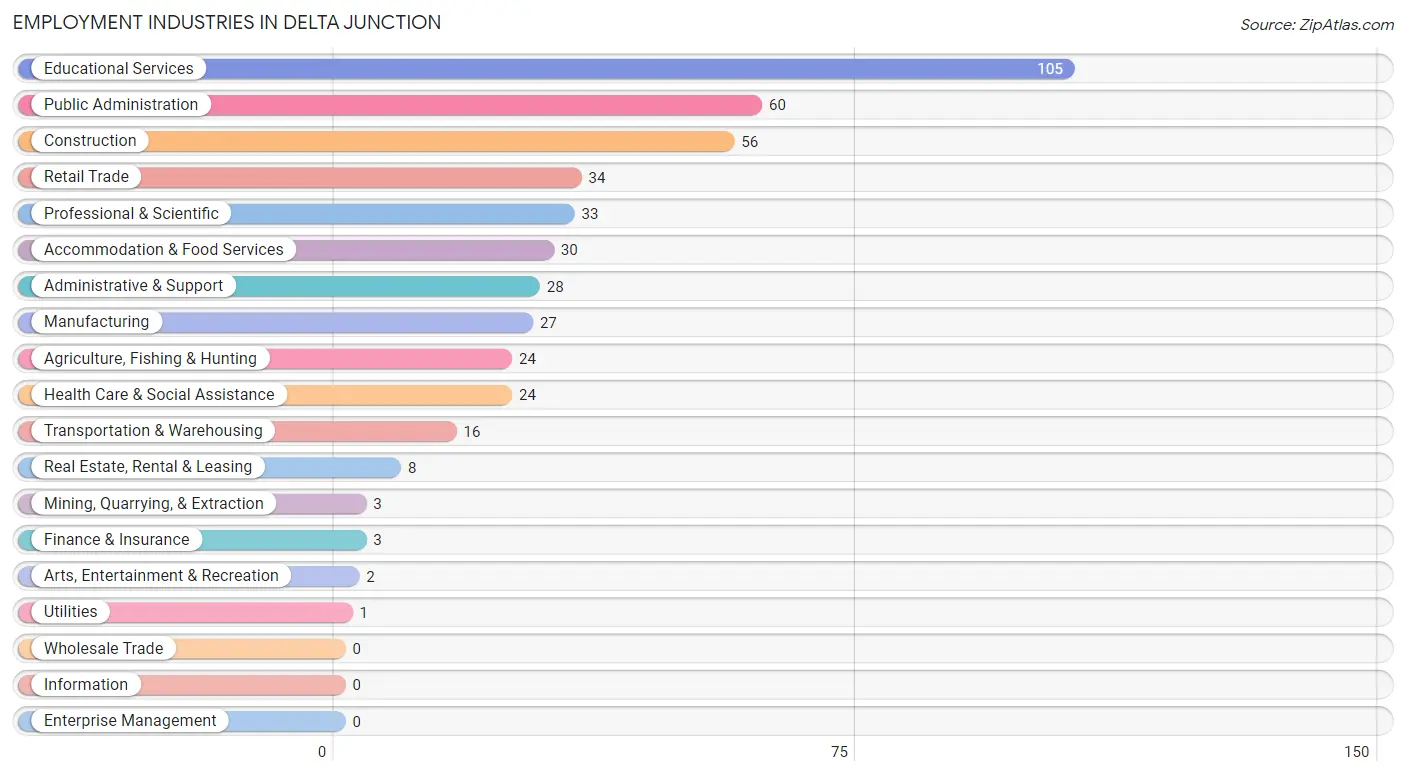
Employment Industries in Delta Junction
The major employment industries in Delta Junction include Educational Services (105 | 21.4%), Public Administration (60 | 12.2%), Construction (56 | 11.4%), Retail Trade (34 | 6.9%), and Professional & Scientific (33 | 6.7%).
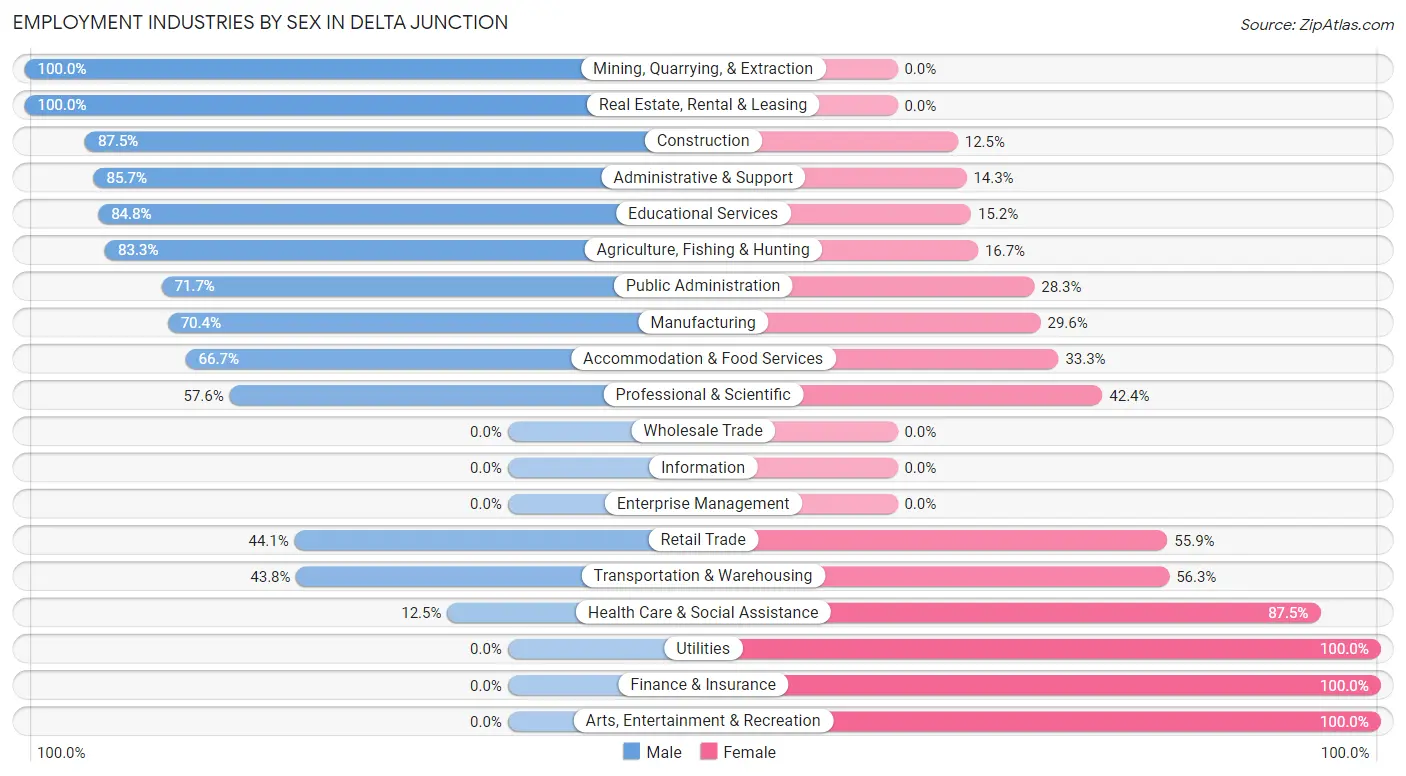
Employment Industries by Sex in Delta Junction
The Delta Junction industries that see more men than women are Mining, Quarrying, & Extraction (100.0%), Real Estate, Rental & Leasing (100.0%), and Construction (87.5%), whereas the industries that tend to have a higher number of women are Utilities (100.0%), Finance & Insurance (100.0%), and Arts, Entertainment & Recreation (100.0%).
| Industry | Male | Female |
| Agriculture, Fishing & Hunting | 20 (83.3%) | 4 (16.7%) |
| Mining, Quarrying, & Extraction | 3 (100.0%) | 0 (0.0%) |
| Construction | 49 (87.5%) | 7 (12.5%) |
| Manufacturing | 19 (70.4%) | 8 (29.6%) |
| Wholesale Trade | 0 (0.0%) | 0 (0.0%) |
| Retail Trade | 15 (44.1%) | 19 (55.9%) |
| Transportation & Warehousing | 7 (43.8%) | 9 (56.2%) |
| Utilities | 0 (0.0%) | 1 (100.0%) |
| Information | 0 (0.0%) | 0 (0.0%) |
| Finance & Insurance | 0 (0.0%) | 3 (100.0%) |
| Real Estate, Rental & Leasing | 8 (100.0%) | 0 (0.0%) |
| Professional & Scientific | 19 (57.6%) | 14 (42.4%) |
| Enterprise Management | 0 (0.0%) | 0 (0.0%) |
| Administrative & Support | 24 (85.7%) | 4 (14.3%) |
| Educational Services | 89 (84.8%) | 16 (15.2%) |
| Health Care & Social Assistance | 3 (12.5%) | 21 (87.5%) |
| Arts, Entertainment & Recreation | 0 (0.0%) | 2 (100.0%) |
| Accommodation & Food Services | 20 (66.7%) | 10 (33.3%) |
| Public Administration | 43 (71.7%) | 17 (28.3%) |
| Total | 342 (69.7%) | 149 (30.3%) |
Education in Delta Junction
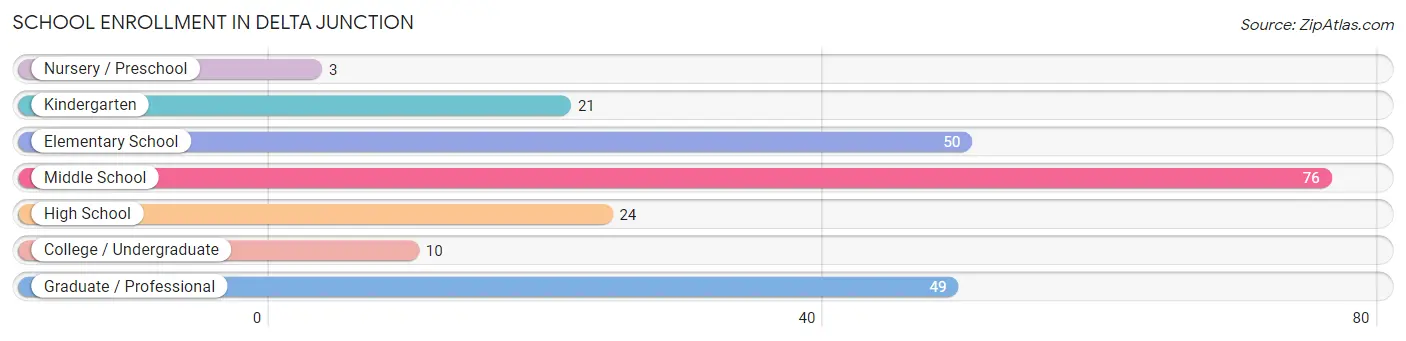
School Enrollment in Delta Junction
The most common levels of schooling among the 233 students in Delta Junction are middle school (76 | 32.6%), elementary school (50 | 21.5%), and graduate / professional (49 | 21.0%).
| School Level | # Students | % Students |
| Nursery / Preschool | 3 | 1.3% |
| Kindergarten | 21 | 9.0% |
| Elementary School | 50 | 21.5% |
| Middle School | 76 | 32.6% |
| High School | 24 | 10.3% |
| College / Undergraduate | 10 | 4.3% |
| Graduate / Professional | 49 | 21.0% |
| Total | 233 | 100.0% |
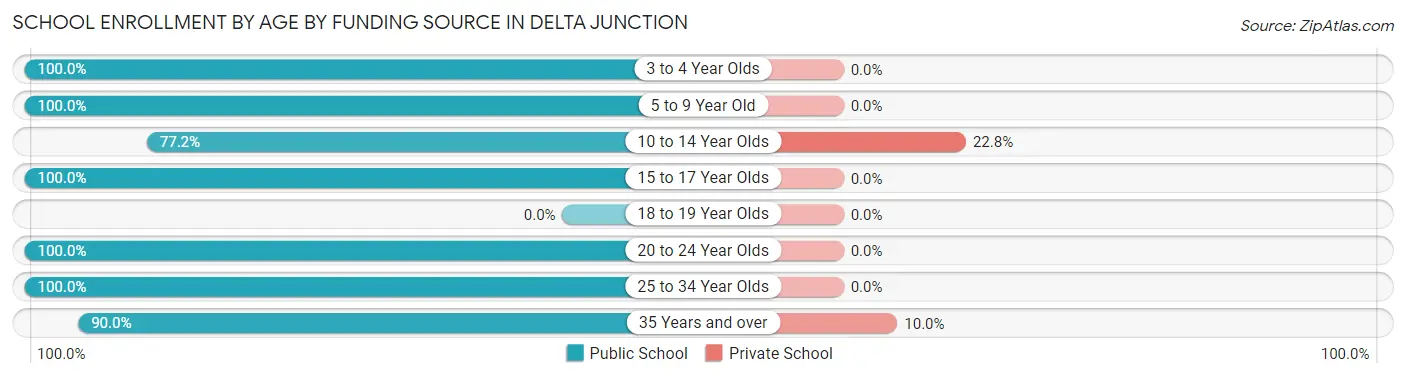
School Enrollment by Age by Funding Source in Delta Junction
Out of a total of 233 students who are enrolled in schools in Delta Junction, 23 (9.9%) attend a private institution, while the remaining 210 (90.1%) are enrolled in public schools. The age group of 10 to 14 year olds has the highest likelihood of being enrolled in private schools, with 18 (22.8% in the age bracket) enrolled. Conversely, the age group of 3 to 4 year olds has the lowest likelihood of being enrolled in a private school, with 3 (100.0% in the age bracket) attending a public institution.
| Age Bracket | Public School | Private School |
| 3 to 4 Year Olds | 3 (100.0%) | 0 (0.0%) |
| 5 to 9 Year Old | 71 (100.0%) | 0 (0.0%) |
| 10 to 14 Year Olds | 61 (77.2%) | 18 (22.8%) |
| 15 to 17 Year Olds | 21 (100.0%) | 0 (0.0%) |
| 18 to 19 Year Olds | 0 (0.0%) | 0 (0.0%) |
| 20 to 24 Year Olds | 4 (100.0%) | 0 (0.0%) |
| 25 to 34 Year Olds | 5 (100.0%) | 0 (0.0%) |
| 35 Years and over | 45 (90.0%) | 5 (10.0%) |
| Total | 210 (90.1%) | 23 (9.9%) |
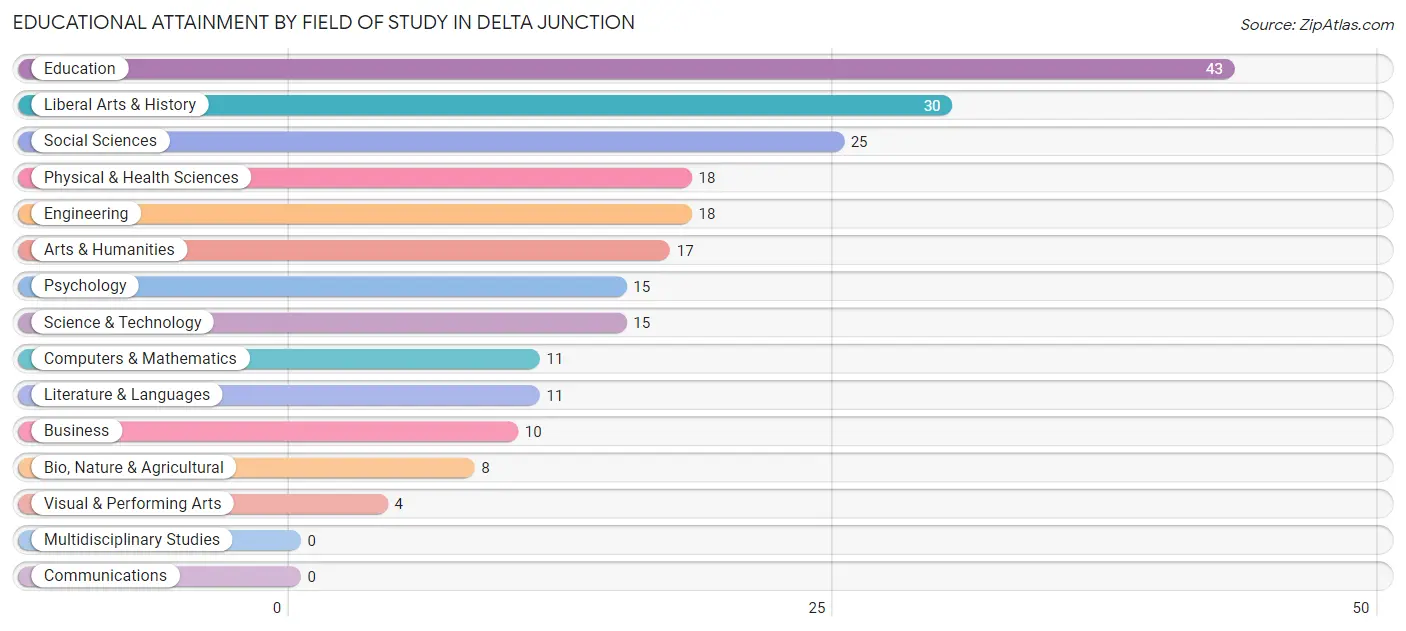
Educational Attainment by Field of Study in Delta Junction
Education (43 | 19.1%), liberal arts & history (30 | 13.3%), social sciences (25 | 11.1%), physical & health sciences (18 | 8.0%), and engineering (18 | 8.0%) are the most common fields of study among 225 individuals in Delta Junction who have obtained a bachelor's degree or higher.
| Field of Study | # Graduates | % Graduates |
| Computers & Mathematics | 11 | 4.9% |
| Bio, Nature & Agricultural | 8 | 3.6% |
| Physical & Health Sciences | 18 | 8.0% |
| Psychology | 15 | 6.7% |
| Social Sciences | 25 | 11.1% |
| Engineering | 18 | 8.0% |
| Multidisciplinary Studies | 0 | 0.0% |
| Science & Technology | 15 | 6.7% |
| Business | 10 | 4.4% |
| Education | 43 | 19.1% |
| Literature & Languages | 11 | 4.9% |
| Liberal Arts & History | 30 | 13.3% |
| Visual & Performing Arts | 4 | 1.8% |
| Communications | 0 | 0.0% |
| Arts & Humanities | 17 | 7.6% |
| Total | 225 | 100.0% |
Transportation & Commute in Delta Junction
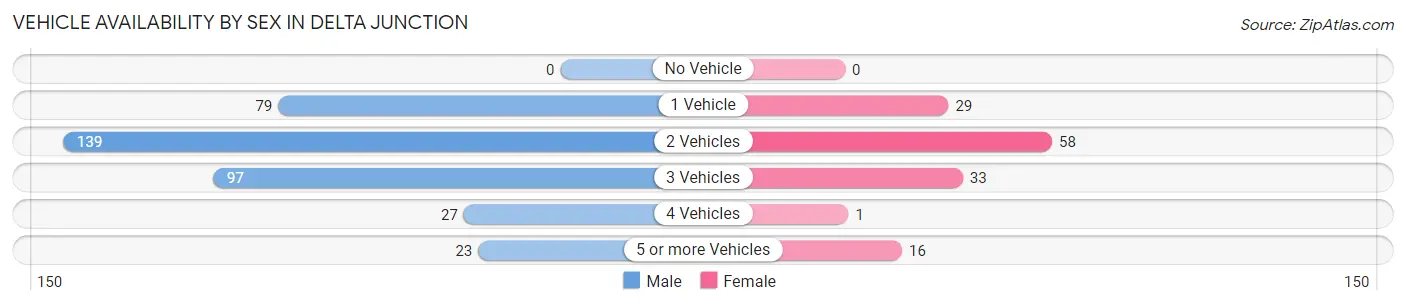
Vehicle Availability by Sex in Delta Junction
The most prevalent vehicle ownership categories in Delta Junction are males with 2 vehicles (139, accounting for 38.1%) and females with 2 vehicles (58, making up 101.5%).
| Vehicles Available | Male | Female |
| No Vehicle | 0 (0.0%) | 0 (0.0%) |
| 1 Vehicle | 79 (21.6%) | 29 (21.2%) |
| 2 Vehicles | 139 (38.1%) | 58 (42.3%) |
| 3 Vehicles | 97 (26.6%) | 33 (24.1%) |
| 4 Vehicles | 27 (7.4%) | 1 (0.7%) |
| 5 or more Vehicles | 23 (6.3%) | 16 (11.7%) |
| Total | 365 (100.0%) | 137 (100.0%) |
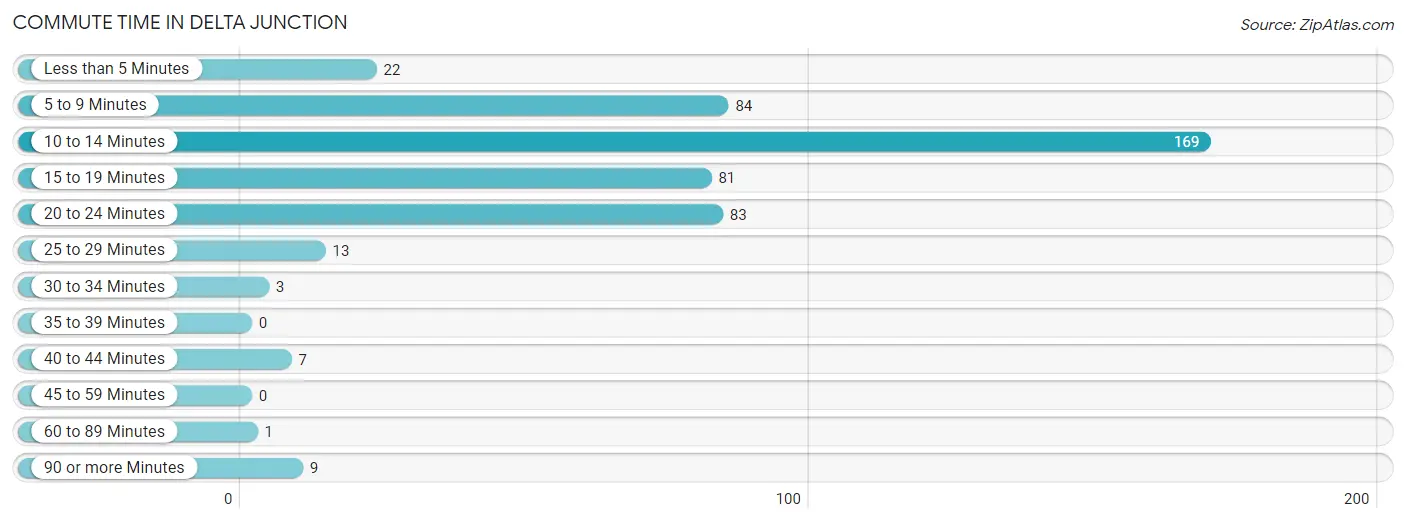
Commute Time in Delta Junction
The most frequently occuring commute durations in Delta Junction are 10 to 14 minutes (169 commuters, 35.8%), 5 to 9 minutes (84 commuters, 17.8%), and 20 to 24 minutes (83 commuters, 17.6%).
| Commute Time | # Commuters | % Commuters |
| Less than 5 Minutes | 22 | 4.7% |
| 5 to 9 Minutes | 84 | 17.8% |
| 10 to 14 Minutes | 169 | 35.8% |
| 15 to 19 Minutes | 81 | 17.2% |
| 20 to 24 Minutes | 83 | 17.6% |
| 25 to 29 Minutes | 13 | 2.8% |
| 30 to 34 Minutes | 3 | 0.6% |
| 35 to 39 Minutes | 0 | 0.0% |
| 40 to 44 Minutes | 7 | 1.5% |
| 45 to 59 Minutes | 0 | 0.0% |
| 60 to 89 Minutes | 1 | 0.2% |
| 90 or more Minutes | 9 | 1.9% |
Commute Time by Sex in Delta Junction
The most common commute times in Delta Junction are 10 to 14 minutes (132 commuters, 37.8%) for males and 10 to 14 minutes (37 commuters, 30.1%) for females.
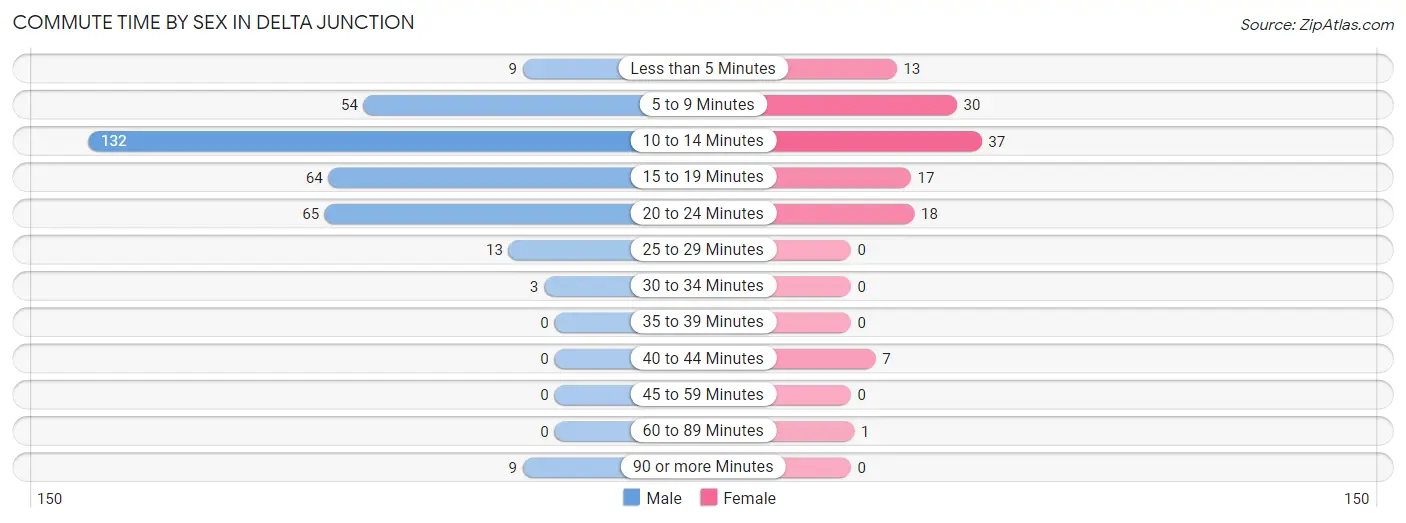
| Commute Time | Male | Female |
| Less than 5 Minutes | 9 (2.6%) | 13 (10.6%) |
| 5 to 9 Minutes | 54 (15.5%) | 30 (24.4%) |
| 10 to 14 Minutes | 132 (37.8%) | 37 (30.1%) |
| 15 to 19 Minutes | 64 (18.3%) | 17 (13.8%) |
| 20 to 24 Minutes | 65 (18.6%) | 18 (14.6%) |
| 25 to 29 Minutes | 13 (3.7%) | 0 (0.0%) |
| 30 to 34 Minutes | 3 (0.9%) | 0 (0.0%) |
| 35 to 39 Minutes | 0 (0.0%) | 0 (0.0%) |
| 40 to 44 Minutes | 0 (0.0%) | 7 (5.7%) |
| 45 to 59 Minutes | 0 (0.0%) | 0 (0.0%) |
| 60 to 89 Minutes | 0 (0.0%) | 1 (0.8%) |
| 90 or more Minutes | 9 (2.6%) | 0 (0.0%) |
Time of Departure to Work by Sex in Delta Junction
The most frequent times of departure to work in Delta Junction are 7:30 AM to 7:59 AM (120, 34.4%) for males and 9:00 AM to 9:59 AM (18, 14.6%) for females.
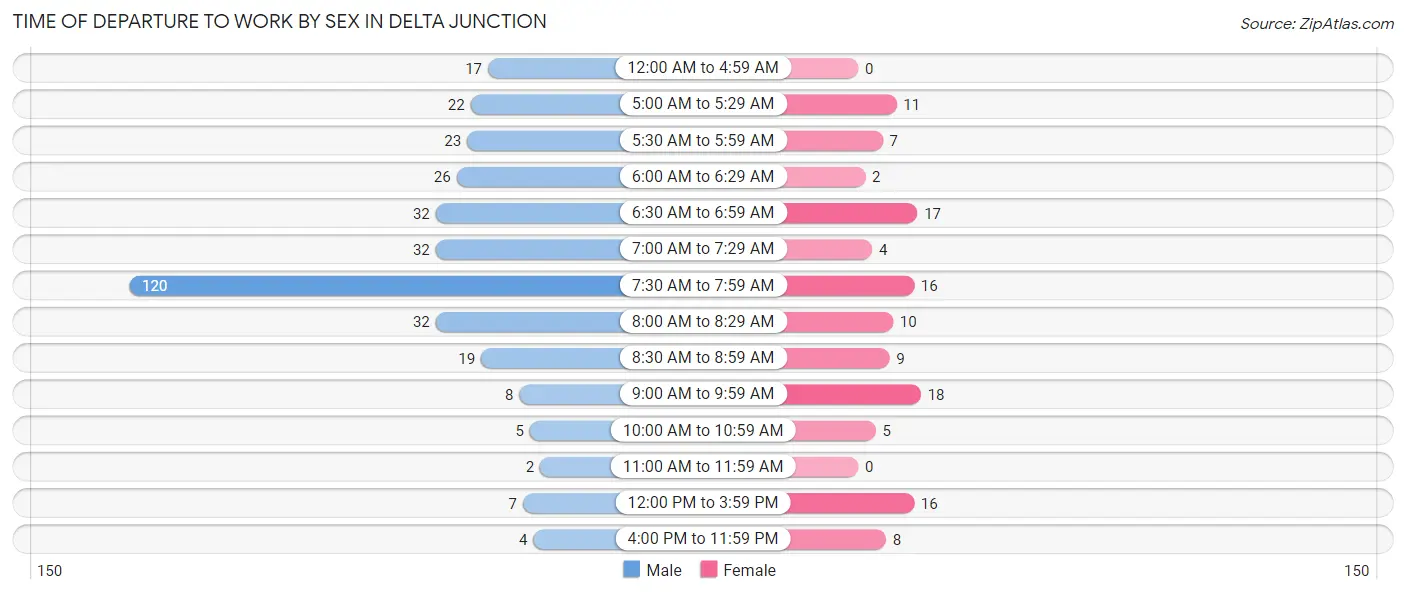
| Time of Departure | Male | Female |
| 12:00 AM to 4:59 AM | 17 (4.9%) | 0 (0.0%) |
| 5:00 AM to 5:29 AM | 22 (6.3%) | 11 (8.9%) |
| 5:30 AM to 5:59 AM | 23 (6.6%) | 7 (5.7%) |
| 6:00 AM to 6:29 AM | 26 (7.4%) | 2 (1.6%) |
| 6:30 AM to 6:59 AM | 32 (9.2%) | 17 (13.8%) |
| 7:00 AM to 7:29 AM | 32 (9.2%) | 4 (3.3%) |
| 7:30 AM to 7:59 AM | 120 (34.4%) | 16 (13.0%) |
| 8:00 AM to 8:29 AM | 32 (9.2%) | 10 (8.1%) |
| 8:30 AM to 8:59 AM | 19 (5.4%) | 9 (7.3%) |
| 9:00 AM to 9:59 AM | 8 (2.3%) | 18 (14.6%) |
| 10:00 AM to 10:59 AM | 5 (1.4%) | 5 (4.1%) |
| 11:00 AM to 11:59 AM | 2 (0.6%) | 0 (0.0%) |
| 12:00 PM to 3:59 PM | 7 (2.0%) | 16 (13.0%) |
| 4:00 PM to 11:59 PM | 4 (1.1%) | 8 (6.5%) |
| Total | 349 (100.0%) | 123 (100.0%) |
Housing Occupancy in Delta Junction
Occupancy by Ownership in Delta Junction
Of the total 420 dwellings in Delta Junction, owner-occupied units account for 305 (72.6%), while renter-occupied units make up 115 (27.4%).
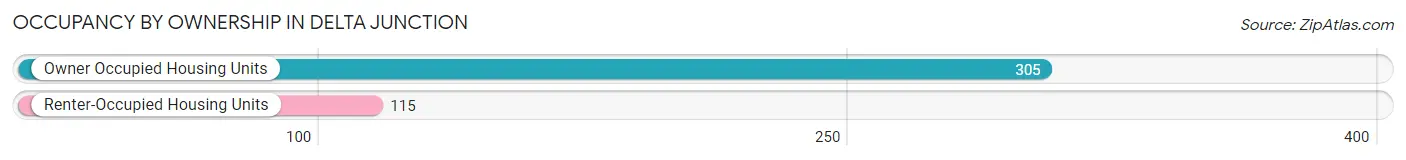
| Occupancy | # Housing Units | % Housing Units |
| Owner Occupied Housing Units | 305 | 72.6% |
| Renter-Occupied Housing Units | 115 | 27.4% |
| Total Occupied Housing Units | 420 | 100.0% |
Occupancy by Household Size in Delta Junction
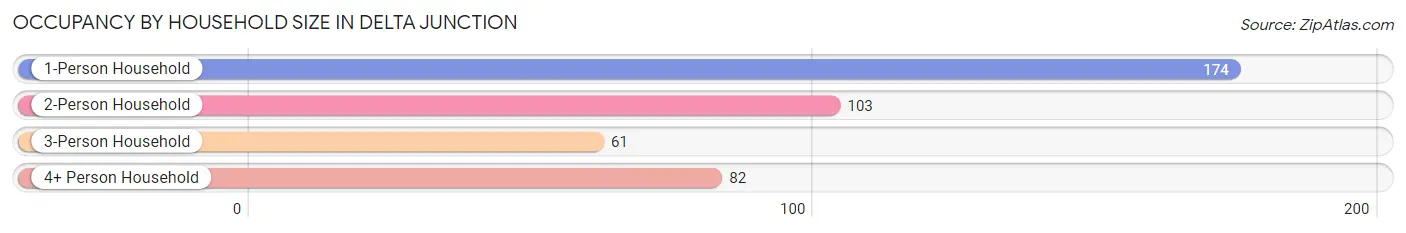
| Household Size | # Housing Units | % Housing Units |
| 1-Person Household | 174 | 41.4% |
| 2-Person Household | 103 | 24.5% |
| 3-Person Household | 61 | 14.5% |
| 4+ Person Household | 82 | 19.5% |
| Total Housing Units | 420 | 100.0% |
Occupancy by Ownership by Household Size in Delta Junction
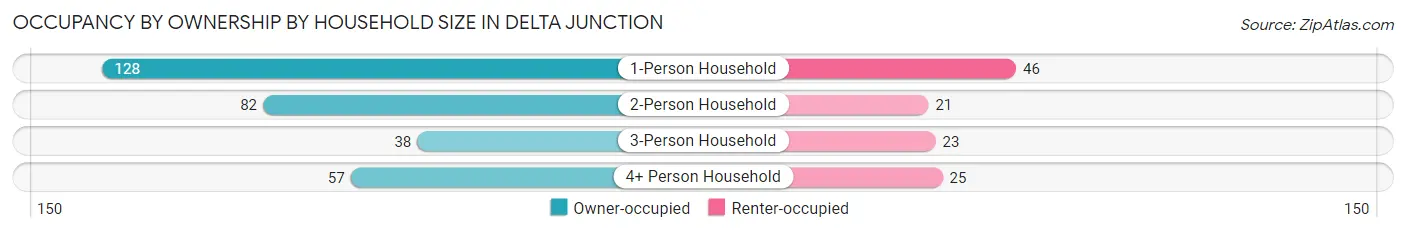
| Household Size | Owner-occupied | Renter-occupied |
| 1-Person Household | 128 (73.6%) | 46 (26.4%) |
| 2-Person Household | 82 (79.6%) | 21 (20.4%) |
| 3-Person Household | 38 (62.3%) | 23 (37.7%) |
| 4+ Person Household | 57 (69.5%) | 25 (30.5%) |
| Total Housing Units | 305 (72.6%) | 115 (27.4%) |
Occupancy by Educational Attainment in Delta Junction
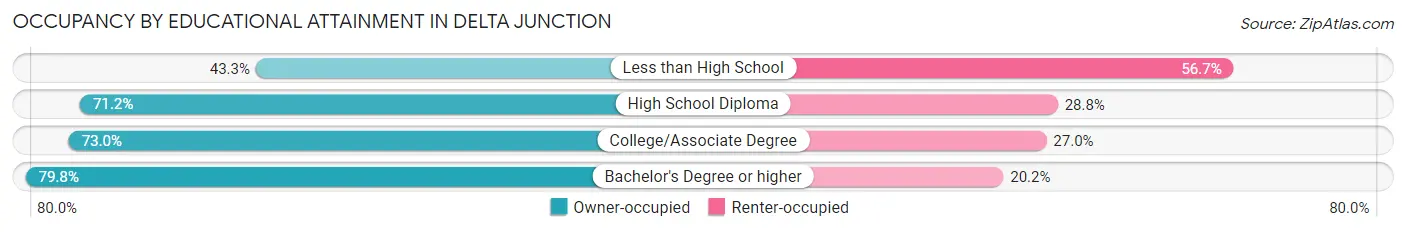
| Household Size | Owner-occupied | Renter-occupied |
| Less than High School | 13 (43.3%) | 17 (56.7%) |
| High School Diploma | 47 (71.2%) | 19 (28.8%) |
| College/Associate Degree | 146 (73.0%) | 54 (27.0%) |
| Bachelor's Degree or higher | 99 (79.8%) | 25 (20.2%) |
Occupancy by Age of Householder in Delta Junction
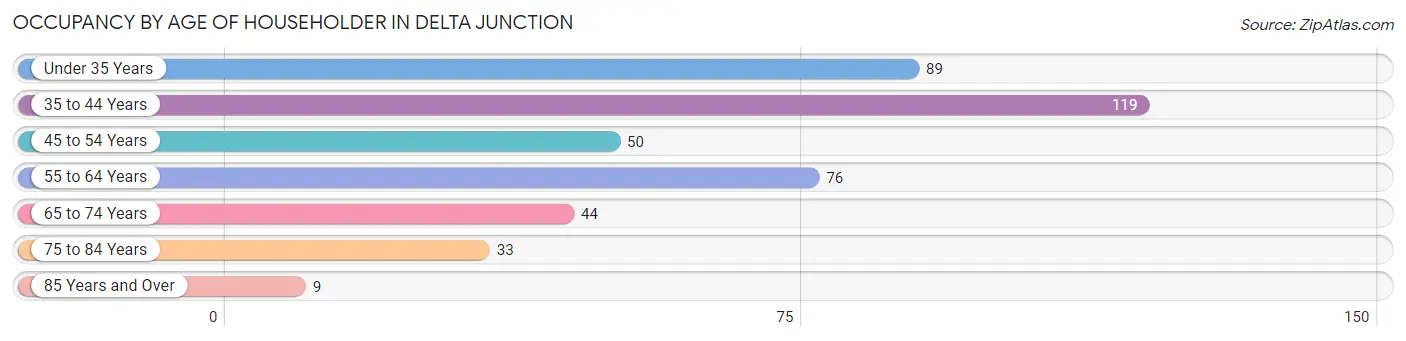
| Age Bracket | # Households | % Households |
| Under 35 Years | 89 | 21.2% |
| 35 to 44 Years | 119 | 28.3% |
| 45 to 54 Years | 50 | 11.9% |
| 55 to 64 Years | 76 | 18.1% |
| 65 to 74 Years | 44 | 10.5% |
| 75 to 84 Years | 33 | 7.9% |
| 85 Years and Over | 9 | 2.1% |
| Total | 420 | 100.0% |
Housing Finances in Delta Junction
Median Income by Occupancy in Delta Junction
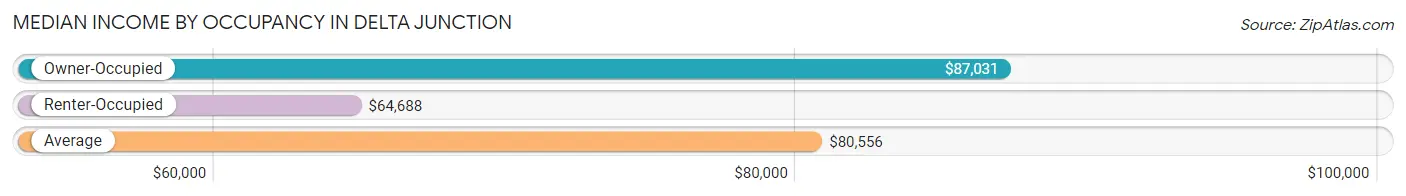
| Occupancy Type | # Households | Median Income |
| Owner-Occupied | 305 (72.6%) | $87,031 |
| Renter-Occupied | 115 (27.4%) | $64,688 |
| Average | 420 (100.0%) | $80,556 |
Occupancy by Householder Income Bracket in Delta Junction
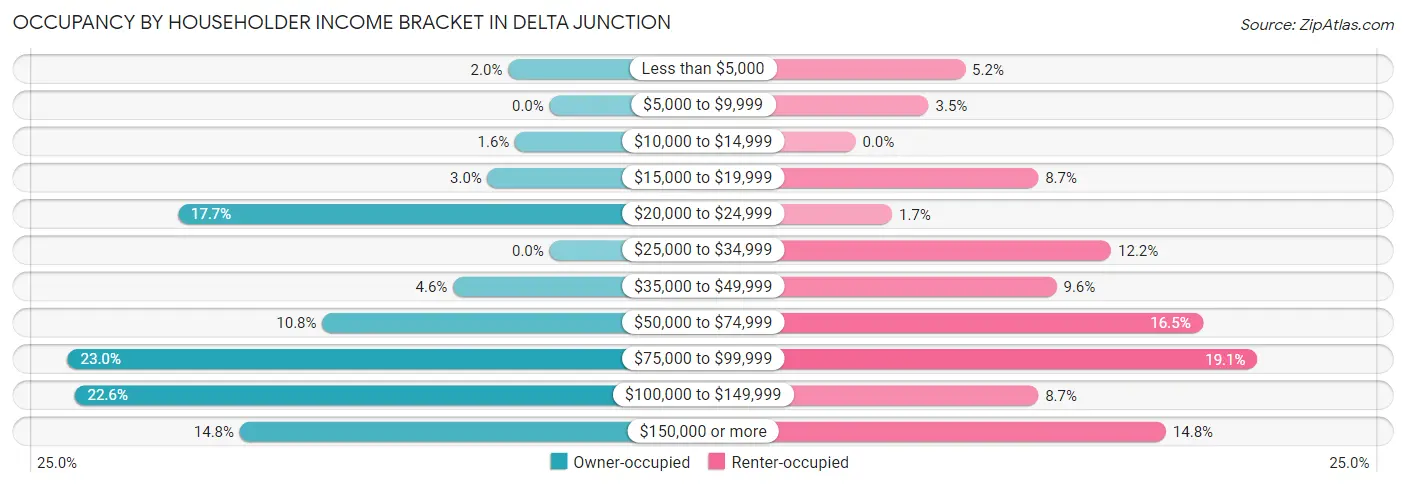
| Income Bracket | Owner-occupied | Renter-occupied |
| Less than $5,000 | 6 (2.0%) | 6 (5.2%) |
| $5,000 to $9,999 | 0 (0.0%) | 4 (3.5%) |
| $10,000 to $14,999 | 5 (1.6%) | 0 (0.0%) |
| $15,000 to $19,999 | 9 (2.9%) | 10 (8.7%) |
| $20,000 to $24,999 | 54 (17.7%) | 2 (1.7%) |
| $25,000 to $34,999 | 0 (0.0%) | 14 (12.2%) |
| $35,000 to $49,999 | 14 (4.6%) | 11 (9.6%) |
| $50,000 to $74,999 | 33 (10.8%) | 19 (16.5%) |
| $75,000 to $99,999 | 70 (23.0%) | 22 (19.1%) |
| $100,000 to $149,999 | 69 (22.6%) | 10 (8.7%) |
| $150,000 or more | 45 (14.7%) | 17 (14.8%) |
| Total | 305 (100.0%) | 115 (100.0%) |
Monthly Housing Cost Tiers in Delta Junction
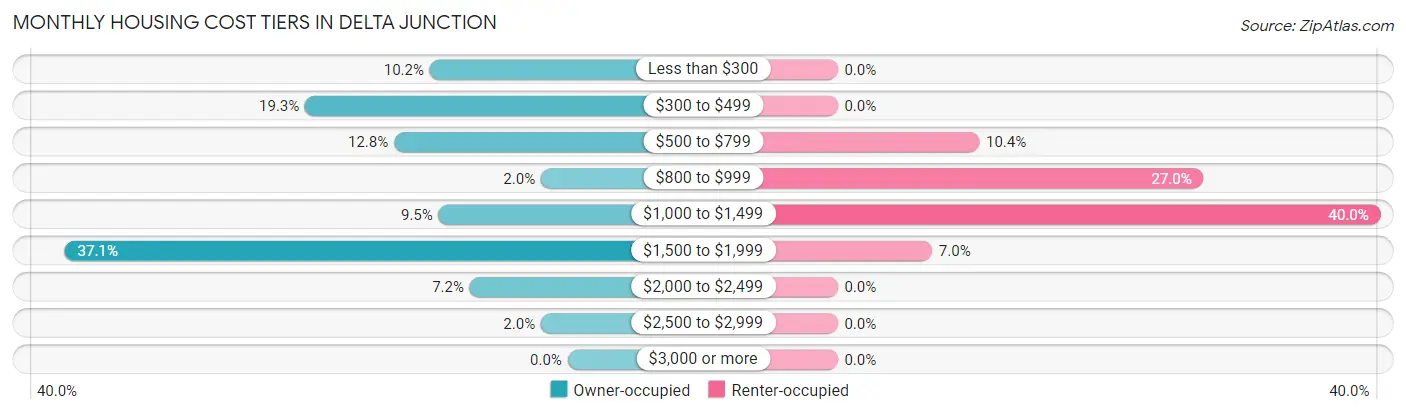
| Monthly Cost | Owner-occupied | Renter-occupied |
| Less than $300 | 31 (10.2%) | 0 (0.0%) |
| $300 to $499 | 59 (19.3%) | 0 (0.0%) |
| $500 to $799 | 39 (12.8%) | 12 (10.4%) |
| $800 to $999 | 6 (2.0%) | 31 (27.0%) |
| $1,000 to $1,499 | 29 (9.5%) | 46 (40.0%) |
| $1,500 to $1,999 | 113 (37.0%) | 8 (7.0%) |
| $2,000 to $2,499 | 22 (7.2%) | 0 (0.0%) |
| $2,500 to $2,999 | 6 (2.0%) | 0 (0.0%) |
| $3,000 or more | 0 (0.0%) | 0 (0.0%) |
| Total | 305 (100.0%) | 115 (100.0%) |
Physical Housing Characteristics in Delta Junction
Housing Structures in Delta Junction
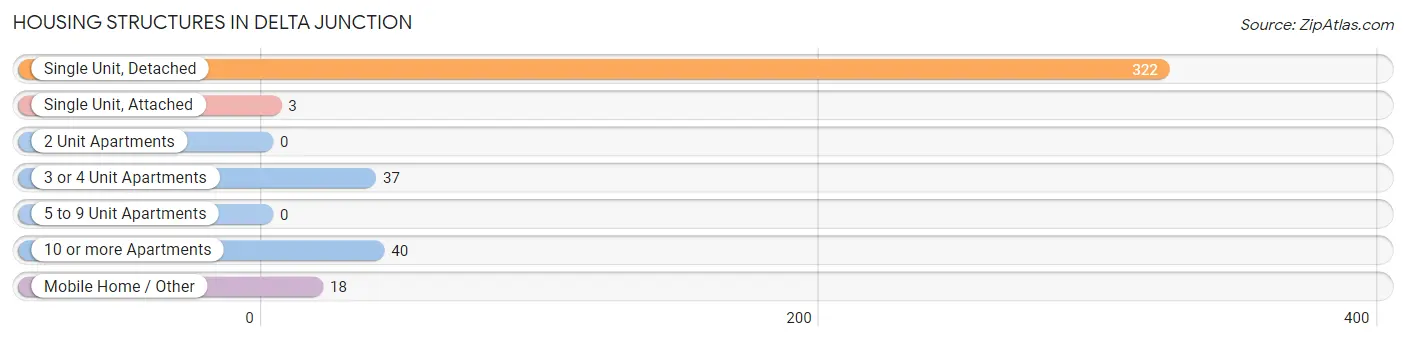
| Structure Type | # Housing Units | % Housing Units |
| Single Unit, Detached | 322 | 76.7% |
| Single Unit, Attached | 3 | 0.7% |
| 2 Unit Apartments | 0 | 0.0% |
| 3 or 4 Unit Apartments | 37 | 8.8% |
| 5 to 9 Unit Apartments | 0 | 0.0% |
| 10 or more Apartments | 40 | 9.5% |
| Mobile Home / Other | 18 | 4.3% |
| Total | 420 | 100.0% |
Housing Structures by Occupancy in Delta Junction
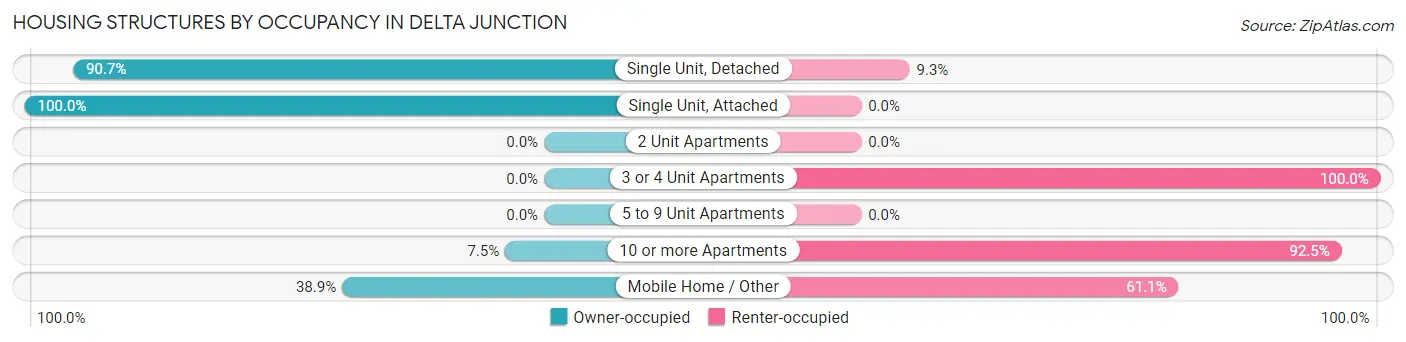
| Structure Type | Owner-occupied | Renter-occupied |
| Single Unit, Detached | 292 (90.7%) | 30 (9.3%) |
| Single Unit, Attached | 3 (100.0%) | 0 (0.0%) |
| 2 Unit Apartments | 0 (0.0%) | 0 (0.0%) |
| 3 or 4 Unit Apartments | 0 (0.0%) | 37 (100.0%) |
| 5 to 9 Unit Apartments | 0 (0.0%) | 0 (0.0%) |
| 10 or more Apartments | 3 (7.5%) | 37 (92.5%) |
| Mobile Home / Other | 7 (38.9%) | 11 (61.1%) |
| Total | 305 (72.6%) | 115 (27.4%) |
Housing Structures by Number of Rooms in Delta Junction
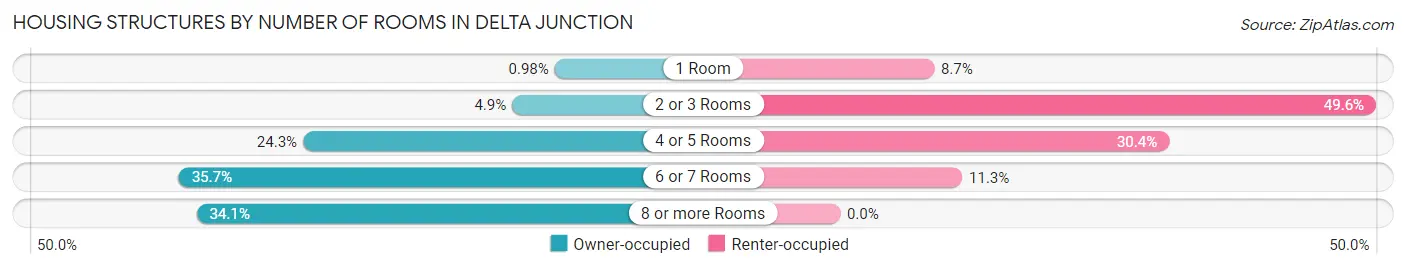
| Number of Rooms | Owner-occupied | Renter-occupied |
| 1 Room | 3 (1.0%) | 10 (8.7%) |
| 2 or 3 Rooms | 15 (4.9%) | 57 (49.6%) |
| 4 or 5 Rooms | 74 (24.3%) | 35 (30.4%) |
| 6 or 7 Rooms | 109 (35.7%) | 13 (11.3%) |
| 8 or more Rooms | 104 (34.1%) | 0 (0.0%) |
| Total | 305 (100.0%) | 115 (100.0%) |
Housing Structure by Heating Type in Delta Junction
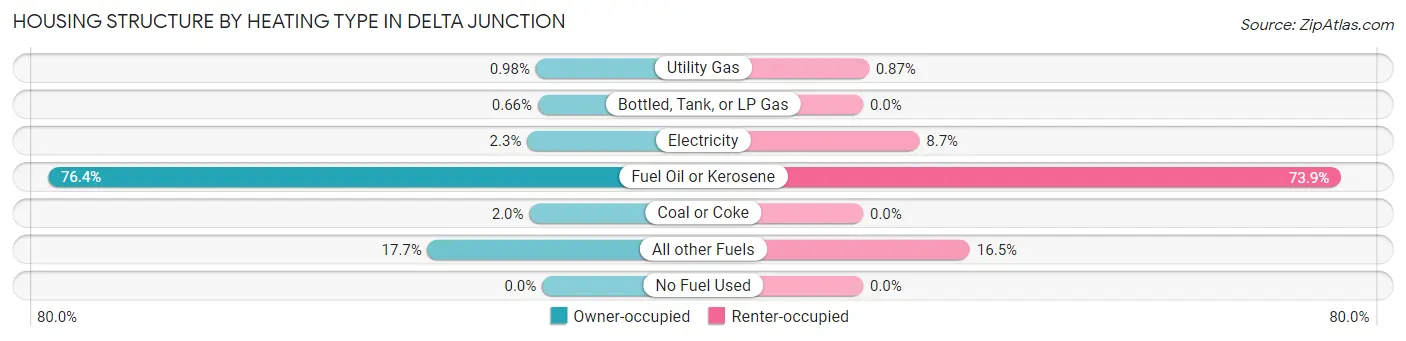
| Heating Type | Owner-occupied | Renter-occupied |
| Utility Gas | 3 (1.0%) | 1 (0.9%) |
| Bottled, Tank, or LP Gas | 2 (0.7%) | 0 (0.0%) |
| Electricity | 7 (2.3%) | 10 (8.7%) |
| Fuel Oil or Kerosene | 233 (76.4%) | 85 (73.9%) |
| Coal or Coke | 6 (2.0%) | 0 (0.0%) |
| All other Fuels | 54 (17.7%) | 19 (16.5%) |
| No Fuel Used | 0 (0.0%) | 0 (0.0%) |
| Total | 305 (100.0%) | 115 (100.0%) |
Household Vehicle Usage in Delta Junction
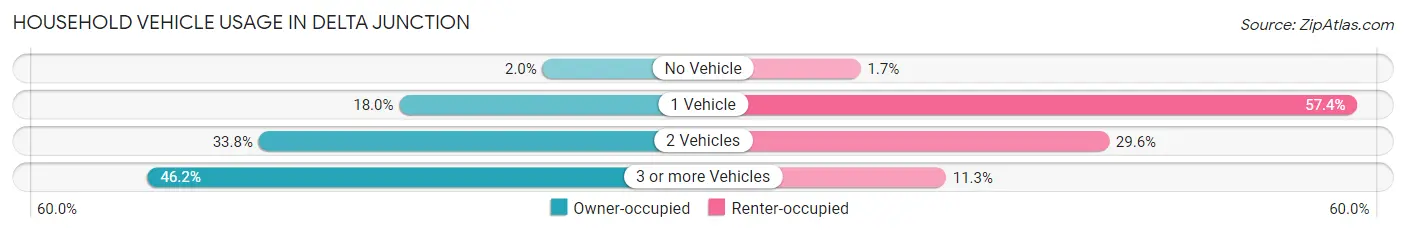
| Vehicles per Household | Owner-occupied | Renter-occupied |
| No Vehicle | 6 (2.0%) | 2 (1.7%) |
| 1 Vehicle | 55 (18.0%) | 66 (57.4%) |
| 2 Vehicles | 103 (33.8%) | 34 (29.6%) |
| 3 or more Vehicles | 141 (46.2%) | 13 (11.3%) |
| Total | 305 (100.0%) | 115 (100.0%) |
Real Estate & Mortgages in Delta Junction
Real Estate and Mortgage Overview in Delta Junction
| Characteristic | Without Mortgage | With Mortgage |
| Housing Units | 144 | 161 |
| Median Property Value | $269,300 | $251,700 |
| Median Household Income | $90,833 | $25 |
| Monthly Housing Costs | $455 | $0 |
| Real Estate Taxes | - | - |
Property Value by Mortgage Status in Delta Junction
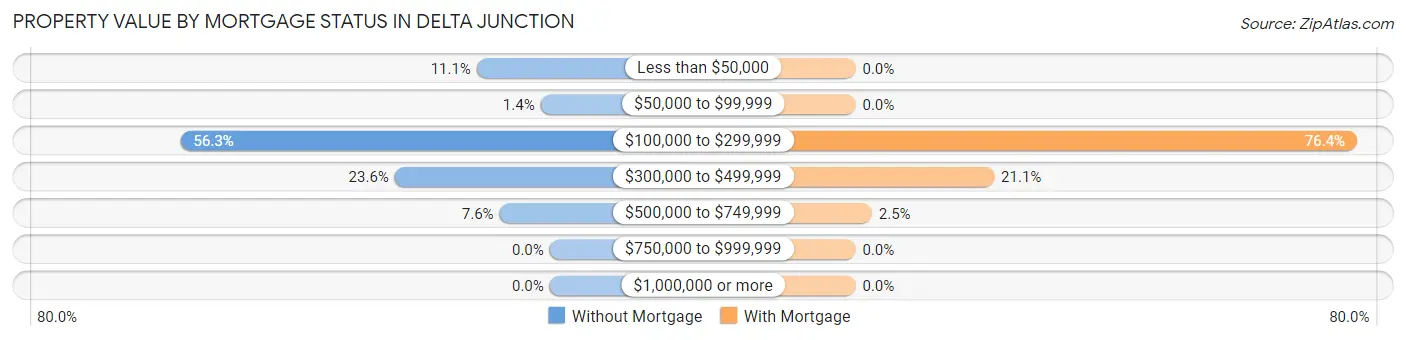
| Property Value | Without Mortgage | With Mortgage |
| Less than $50,000 | 16 (11.1%) | 0 (0.0%) |
| $50,000 to $99,999 | 2 (1.4%) | 0 (0.0%) |
| $100,000 to $299,999 | 81 (56.2%) | 123 (76.4%) |
| $300,000 to $499,999 | 34 (23.6%) | 34 (21.1%) |
| $500,000 to $749,999 | 11 (7.6%) | 4 (2.5%) |
| $750,000 to $999,999 | 0 (0.0%) | 0 (0.0%) |
| $1,000,000 or more | 0 (0.0%) | 0 (0.0%) |
| Total | 144 (100.0%) | 161 (100.0%) |
Household Income by Mortgage Status in Delta Junction
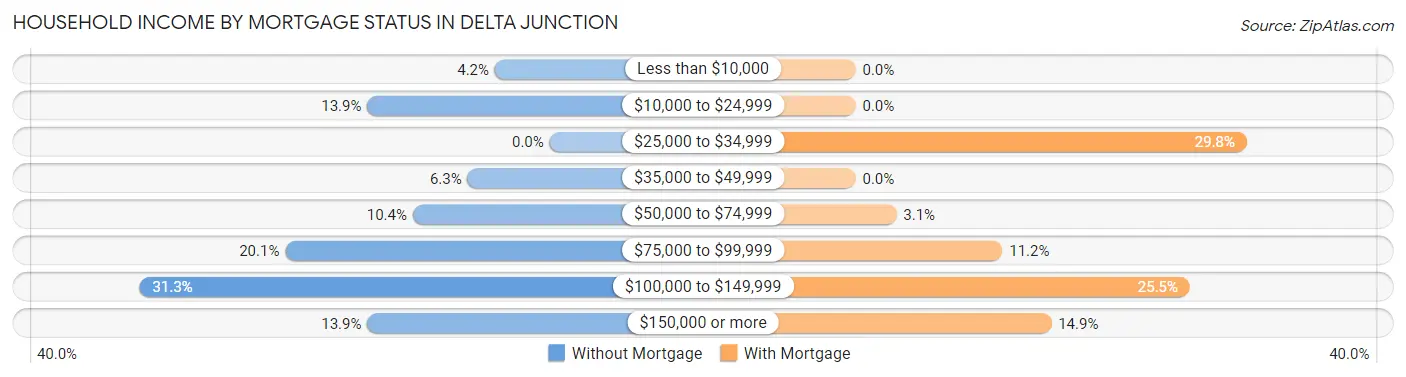
| Household Income | Without Mortgage | With Mortgage |
| Less than $10,000 | 6 (4.2%) | 0 (0.0%) |
| $10,000 to $24,999 | 20 (13.9%) | 0 (0.0%) |
| $25,000 to $34,999 | 0 (0.0%) | 48 (29.8%) |
| $35,000 to $49,999 | 9 (6.2%) | 0 (0.0%) |
| $50,000 to $74,999 | 15 (10.4%) | 5 (3.1%) |
| $75,000 to $99,999 | 29 (20.1%) | 18 (11.2%) |
| $100,000 to $149,999 | 45 (31.2%) | 41 (25.5%) |
| $150,000 or more | 20 (13.9%) | 24 (14.9%) |
| Total | 144 (100.0%) | 161 (100.0%) |
Property Value to Household Income Ratio in Delta Junction
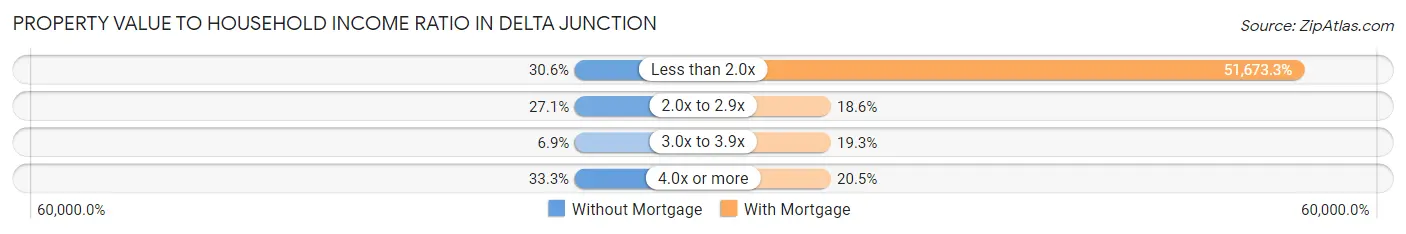
| Value-to-Income Ratio | Without Mortgage | With Mortgage |
| Less than 2.0x | 44 (30.6%) | 83,194 (51,673.3%) |
| 2.0x to 2.9x | 39 (27.1%) | 30 (18.6%) |
| 3.0x to 3.9x | 10 (6.9%) | 31 (19.3%) |
| 4.0x or more | 48 (33.3%) | 33 (20.5%) |
| Total | 144 (100.0%) | 161 (100.0%) |
Real Estate Taxes by Mortgage Status in Delta Junction
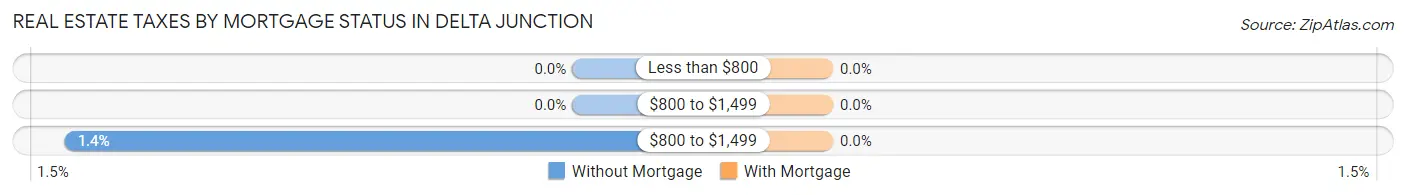
| Property Taxes | Without Mortgage | With Mortgage |
| Less than $800 | 0 (0.0%) | 0 (0.0%) |
| $800 to $1,499 | 0 (0.0%) | 0 (0.0%) |
| $800 to $1,499 | 2 (1.4%) | 0 (0.0%) |
| Total | 144 (100.0%) | 161 (100.0%) |
Health & Disability in Delta Junction
Health Insurance Coverage by Age in Delta Junction
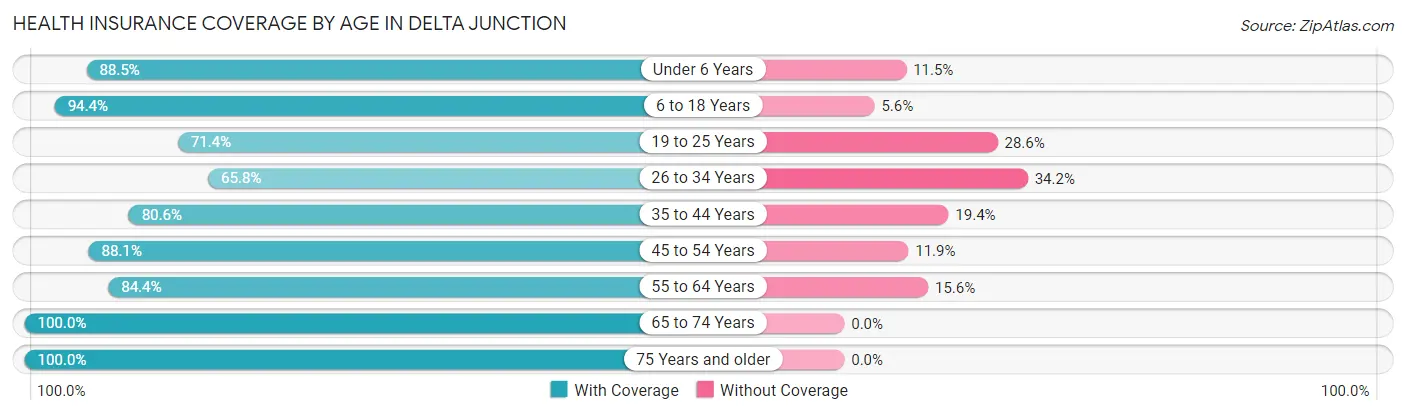
| Age Bracket | With Coverage | Without Coverage |
| Under 6 Years | 115 (88.5%) | 15 (11.5%) |
| 6 to 18 Years | 168 (94.4%) | 10 (5.6%) |
| 19 to 25 Years | 40 (71.4%) | 16 (28.6%) |
| 26 to 34 Years | 100 (65.8%) | 52 (34.2%) |
| 35 to 44 Years | 166 (80.6%) | 40 (19.4%) |
| 45 to 54 Years | 96 (88.1%) | 13 (11.9%) |
| 55 to 64 Years | 108 (84.4%) | 20 (15.6%) |
| 65 to 74 Years | 71 (100.0%) | 0 (0.0%) |
| 75 Years and older | 61 (100.0%) | 0 (0.0%) |
| Total | 925 (84.8%) | 166 (15.2%) |
Health Insurance Coverage by Citizenship Status in Delta Junction
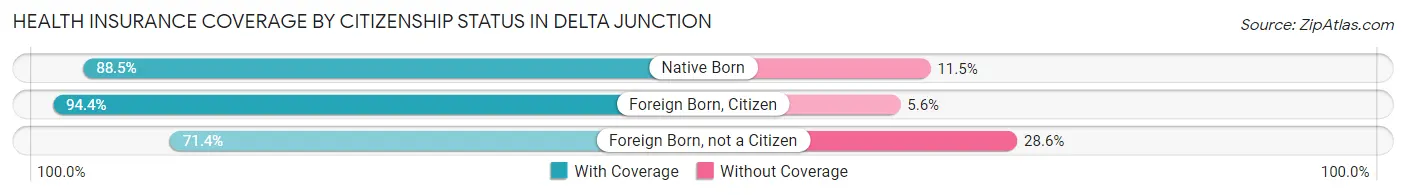
| Citizenship Status | With Coverage | Without Coverage |
| Native Born | 115 (88.5%) | 15 (11.5%) |
| Foreign Born, Citizen | 168 (94.4%) | 10 (5.6%) |
| Foreign Born, not a Citizen | 40 (71.4%) | 16 (28.6%) |
Health Insurance Coverage by Household Income in Delta Junction
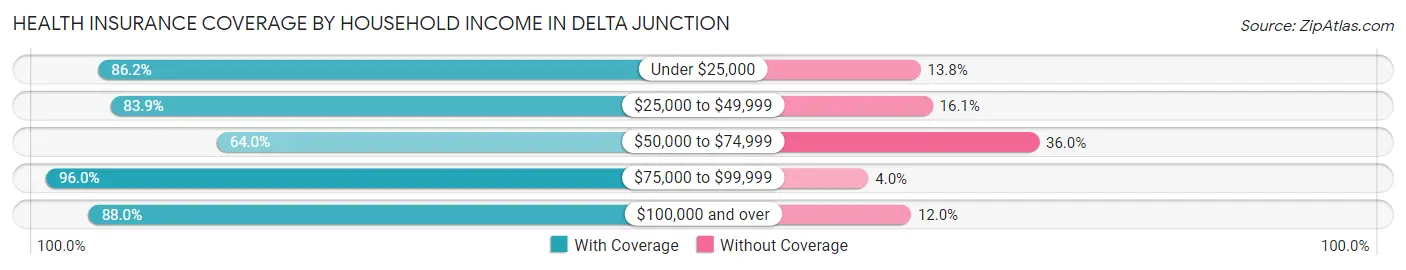
| Household Income | With Coverage | Without Coverage |
| Under $25,000 | 106 (86.2%) | 17 (13.8%) |
| $25,000 to $49,999 | 120 (83.9%) | 23 (16.1%) |
| $50,000 to $74,999 | 119 (64.0%) | 67 (36.0%) |
| $75,000 to $99,999 | 214 (96.0%) | 9 (4.0%) |
| $100,000 and over | 366 (88.0%) | 50 (12.0%) |
Public vs Private Health Insurance Coverage by Age in Delta Junction
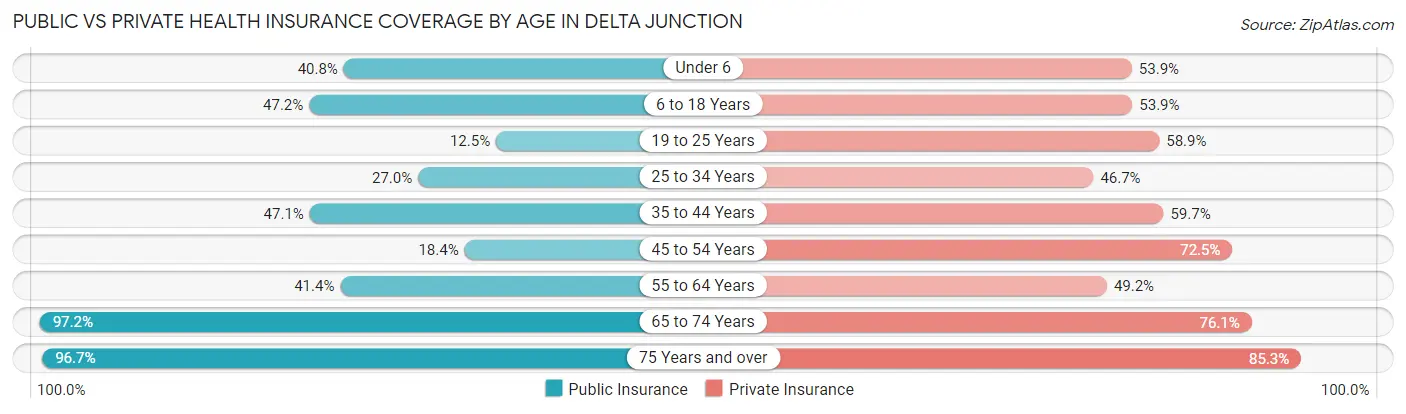
| Age Bracket | Public Insurance | Private Insurance |
| Under 6 | 53 (40.8%) | 70 (53.8%) |
| 6 to 18 Years | 84 (47.2%) | 96 (53.9%) |
| 19 to 25 Years | 7 (12.5%) | 33 (58.9%) |
| 25 to 34 Years | 41 (27.0%) | 71 (46.7%) |
| 35 to 44 Years | 97 (47.1%) | 123 (59.7%) |
| 45 to 54 Years | 20 (18.3%) | 79 (72.5%) |
| 55 to 64 Years | 53 (41.4%) | 63 (49.2%) |
| 65 to 74 Years | 69 (97.2%) | 54 (76.1%) |
| 75 Years and over | 59 (96.7%) | 52 (85.3%) |
| Total | 483 (44.3%) | 641 (58.8%) |
Disability Status by Sex by Age in Delta Junction
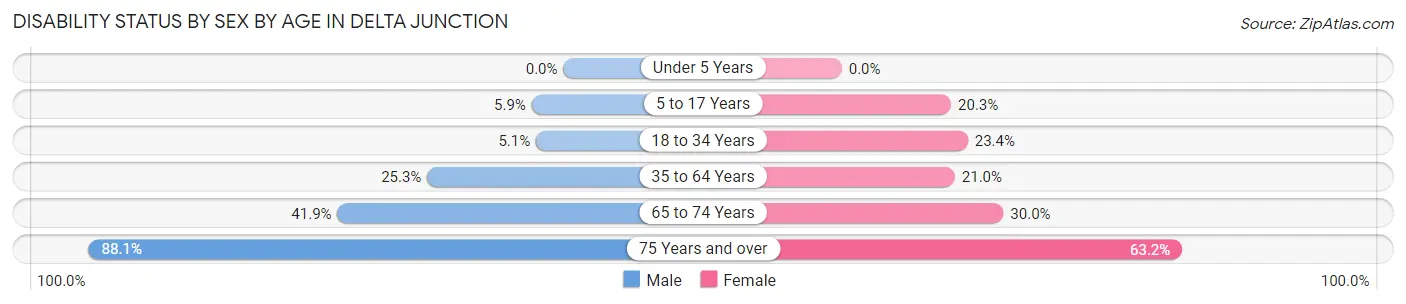
| Age Bracket | Male | Female |
| Under 5 Years | 0 (0.0%) | 0 (0.0%) |
| 5 to 17 Years | 7 (5.9%) | 14 (20.3%) |
| 18 to 34 Years | 7 (5.1%) | 18 (23.4%) |
| 35 to 64 Years | 71 (25.3%) | 34 (21.0%) |
| 65 to 74 Years | 13 (41.9%) | 12 (30.0%) |
| 75 Years and over | 37 (88.1%) | 12 (63.2%) |
Disability Class by Sex by Age in Delta Junction
Disability Class: Hearing Difficulty
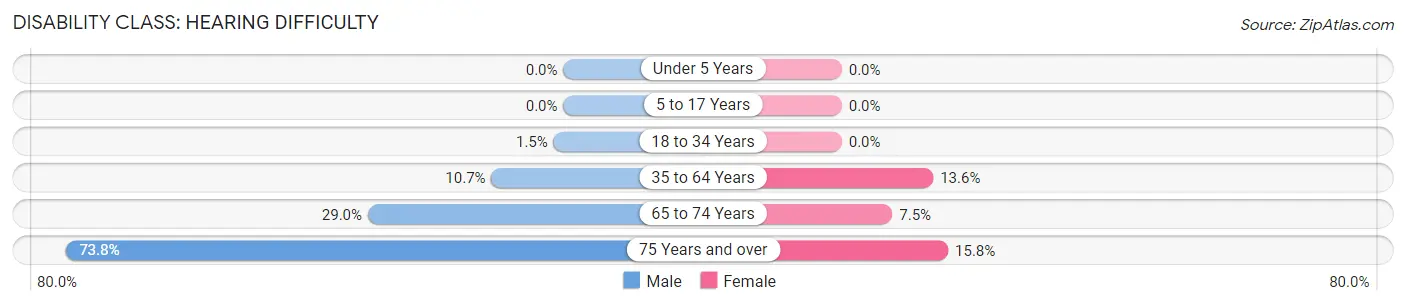
| Age Bracket | Male | Female |
| Under 5 Years | 0 (0.0%) | 0 (0.0%) |
| 5 to 17 Years | 0 (0.0%) | 0 (0.0%) |
| 18 to 34 Years | 2 (1.5%) | 0 (0.0%) |
| 35 to 64 Years | 30 (10.7%) | 22 (13.6%) |
| 65 to 74 Years | 9 (29.0%) | 3 (7.5%) |
| 75 Years and over | 31 (73.8%) | 3 (15.8%) |
Disability Class: Vision Difficulty
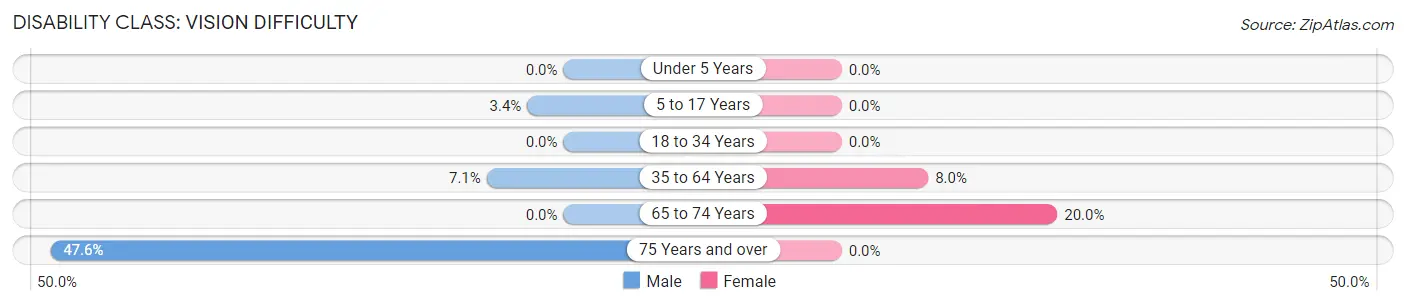
| Age Bracket | Male | Female |
| Under 5 Years | 0 (0.0%) | 0 (0.0%) |
| 5 to 17 Years | 4 (3.4%) | 0 (0.0%) |
| 18 to 34 Years | 0 (0.0%) | 0 (0.0%) |
| 35 to 64 Years | 20 (7.1%) | 13 (8.0%) |
| 65 to 74 Years | 0 (0.0%) | 8 (20.0%) |
| 75 Years and over | 20 (47.6%) | 0 (0.0%) |
Disability Class: Cognitive Difficulty
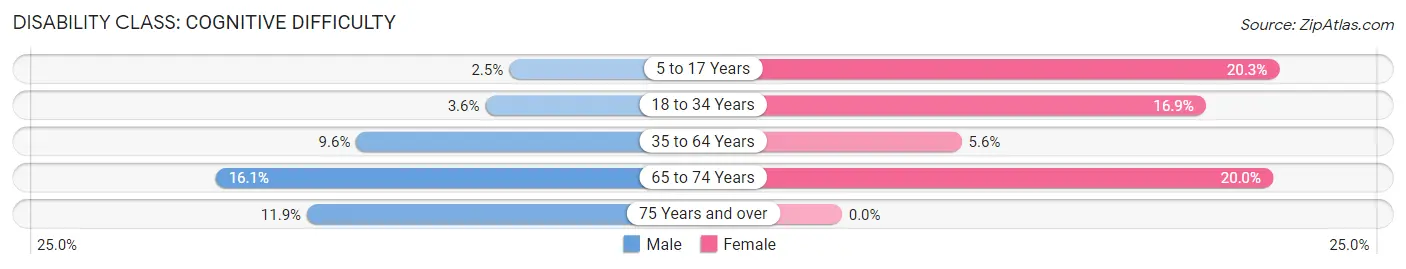
| Age Bracket | Male | Female |
| 5 to 17 Years | 3 (2.5%) | 14 (20.3%) |
| 18 to 34 Years | 5 (3.6%) | 13 (16.9%) |
| 35 to 64 Years | 27 (9.6%) | 9 (5.6%) |
| 65 to 74 Years | 5 (16.1%) | 8 (20.0%) |
| 75 Years and over | 5 (11.9%) | 0 (0.0%) |
Disability Class: Ambulatory Difficulty
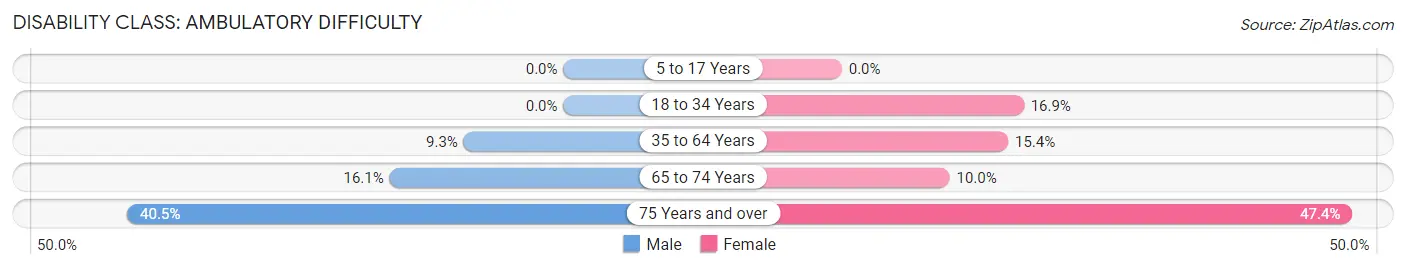
| Age Bracket | Male | Female |
| 5 to 17 Years | 0 (0.0%) | 0 (0.0%) |
| 18 to 34 Years | 0 (0.0%) | 13 (16.9%) |
| 35 to 64 Years | 26 (9.2%) | 25 (15.4%) |
| 65 to 74 Years | 5 (16.1%) | 4 (10.0%) |
| 75 Years and over | 17 (40.5%) | 9 (47.4%) |
Disability Class: Self-Care Difficulty
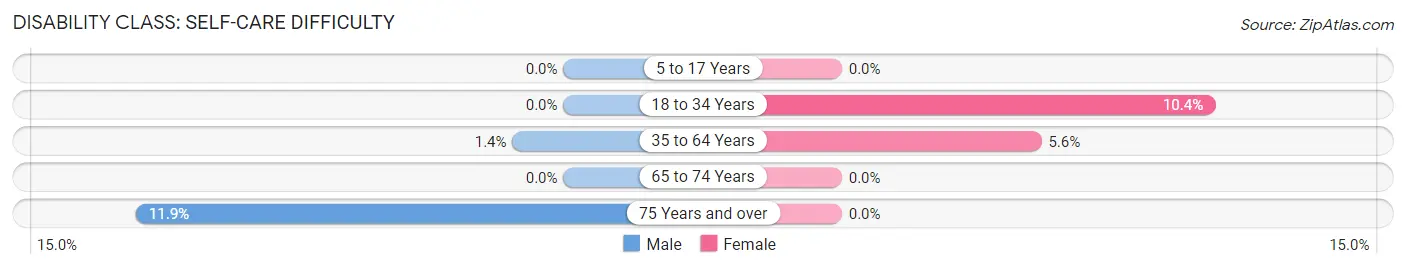
| Age Bracket | Male | Female |
| 5 to 17 Years | 0 (0.0%) | 0 (0.0%) |
| 18 to 34 Years | 0 (0.0%) | 8 (10.4%) |
| 35 to 64 Years | 4 (1.4%) | 9 (5.6%) |
| 65 to 74 Years | 0 (0.0%) | 0 (0.0%) |
| 75 Years and over | 5 (11.9%) | 0 (0.0%) |
Technology Access in Delta Junction
Computing Device Access in Delta Junction
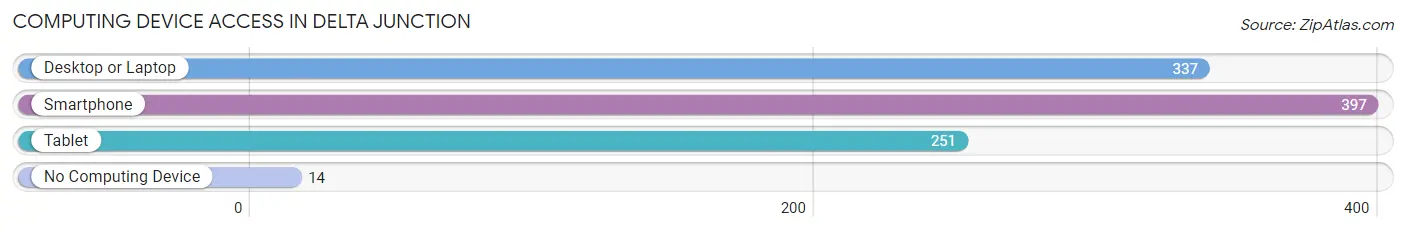
| Device Type | # Households | % Households |
| Desktop or Laptop | 337 | 80.2% |
| Smartphone | 397 | 94.5% |
| Tablet | 251 | 59.8% |
| No Computing Device | 14 | 3.3% |
| Total | 420 | 100.0% |
Internet Access in Delta Junction
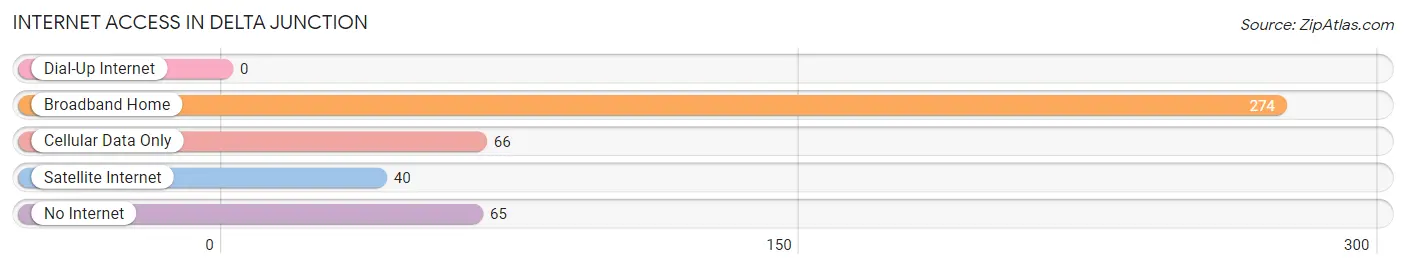
| Internet Type | # Households | % Households |
| Dial-Up Internet | 0 | 0.0% |
| Broadband Home | 274 | 65.2% |
| Cellular Data Only | 66 | 15.7% |
| Satellite Internet | 40 | 9.5% |
| No Internet | 65 | 15.5% |
| Total | 420 | 100.0% |
Delta Junction Summary
Introduction
Delta Junction is a small city located in the interior of Alaska, approximately 100 miles southeast of Fairbanks. It is the northernmost point of the Alaska Highway, and is the gateway to the Alaska Interior. The city is situated on the banks of the Tanana River, and is surrounded by the Delta Mountains. The population of Delta Junction was 1,171 as of the 2010 census.
History
The area around Delta Junction has been inhabited by the Athabascan people for thousands of years. The first Europeans to explore the area were Russian fur traders in the late 18th century. The area was later explored by American and British explorers in the early 19th century.
The city of Delta Junction was founded in 1901 by gold prospectors. The city was named after the nearby Delta River, which was named by explorer Lt. Henry T. Allen in 1885. The city was incorporated in 1903.
In 1942, the U.S. Army established the Alaska Highway, which runs through Delta Junction. The highway was built to provide a supply route to Alaska during World War II. The highway was completed in 1943, and is now a major tourist attraction.
Geography
Delta Junction is located in the interior of Alaska, approximately 100 miles southeast of Fairbanks. The city is situated on the banks of the Tanana River, and is surrounded by the Delta Mountains. The city has a total area of 4.2 square miles, all of which is land.
The climate in Delta Junction is subarctic, with cold winters and mild summers. The average temperature in January is -17°F, and the average temperature in July is 63°F. The average annual precipitation is 11.5 inches.
Economy
The economy of Delta Junction is largely based on tourism and agriculture. The city is a popular destination for tourists, who come to explore the Alaska Interior and take part in outdoor activities such as fishing, hunting, and camping.
Agriculture is also an important part of the economy. The area is known for its production of potatoes, carrots, and other vegetables. Livestock production is also important, with cattle, sheep, and horses being raised in the area.
Demographics
As of the 2010 census, the population of Delta Junction was 1,171. The racial makeup of the city was 87.3% White, 0.3% African American, 5.2% Native American, 0.3% Asian, 0.1% Pacific Islander, 0.7% from other races, and 5.3% from two or more races.
The median household income in Delta Junction was $50,938, and the median family income was $58,750. The per capita income was $25,945. About 11.2% of the population was below the poverty line.
Conclusion
Delta Junction is a small city located in the interior of Alaska, approximately 100 miles southeast of Fairbanks. The city is situated on the banks of the Tanana River, and is surrounded by the Delta Mountains. The economy of Delta Junction is largely based on tourism and agriculture. As of the 2010 census, the population of Delta Junction was 1,171. The median household income in Delta Junction was $50,938, and the median family income was $58,750.
Common Questions
What is Per Capita Income in Delta Junction?
Per Capita income in Delta Junction is $40,245.
What is the Median Family Income in Delta Junction?
Median Family Income in Delta Junction is $89,485.
What is the Median Household income in Delta Junction?
Median Household Income in Delta Junction is $80,556.
What is Income or Wage Gap in Delta Junction?
Income or Wage Gap in Delta Junction is 50.8%.
Women in Delta Junction earn 49.2 cents for every dollar earned by a man.
What is Inequality or Gini Index in Delta Junction?
Inequality or Gini Index in Delta Junction is 0.42.
What is the Total Population of Delta Junction?
Total Population of Delta Junction is 1,126.
What is the Total Male Population of Delta Junction?
Total Male Population of Delta Junction is 691.
What is the Total Female Population of Delta Junction?
Total Female Population of Delta Junction is 435.
What is the Ratio of Males per 100 Females in Delta Junction?
There are 158.85 Males per 100 Females in Delta Junction.
What is the Ratio of Females per 100 Males in Delta Junction?
There are 62.95 Females per 100 Males in Delta Junction.
What is the Median Population Age in Delta Junction?
Median Population Age in Delta Junction is 36.0 Years.
What is the Average Family Size in Delta Junction
Average Family Size in Delta Junction is 3.7 People.
What is the Average Household Size in Delta Junction
Average Household Size in Delta Junction is 2.7 People.
How Large is the Labor Force in Delta Junction?
There are 547 People in the Labor Forcein in Delta Junction.
What is the Percentage of People in the Labor Force in Delta Junction?
64.6% of People are in the Labor Force in Delta Junction.
What is the Unemployment Rate in Delta Junction?
Unemployment Rate in Delta Junction is 4.1%.