Clintondale, NY Map & Demographics
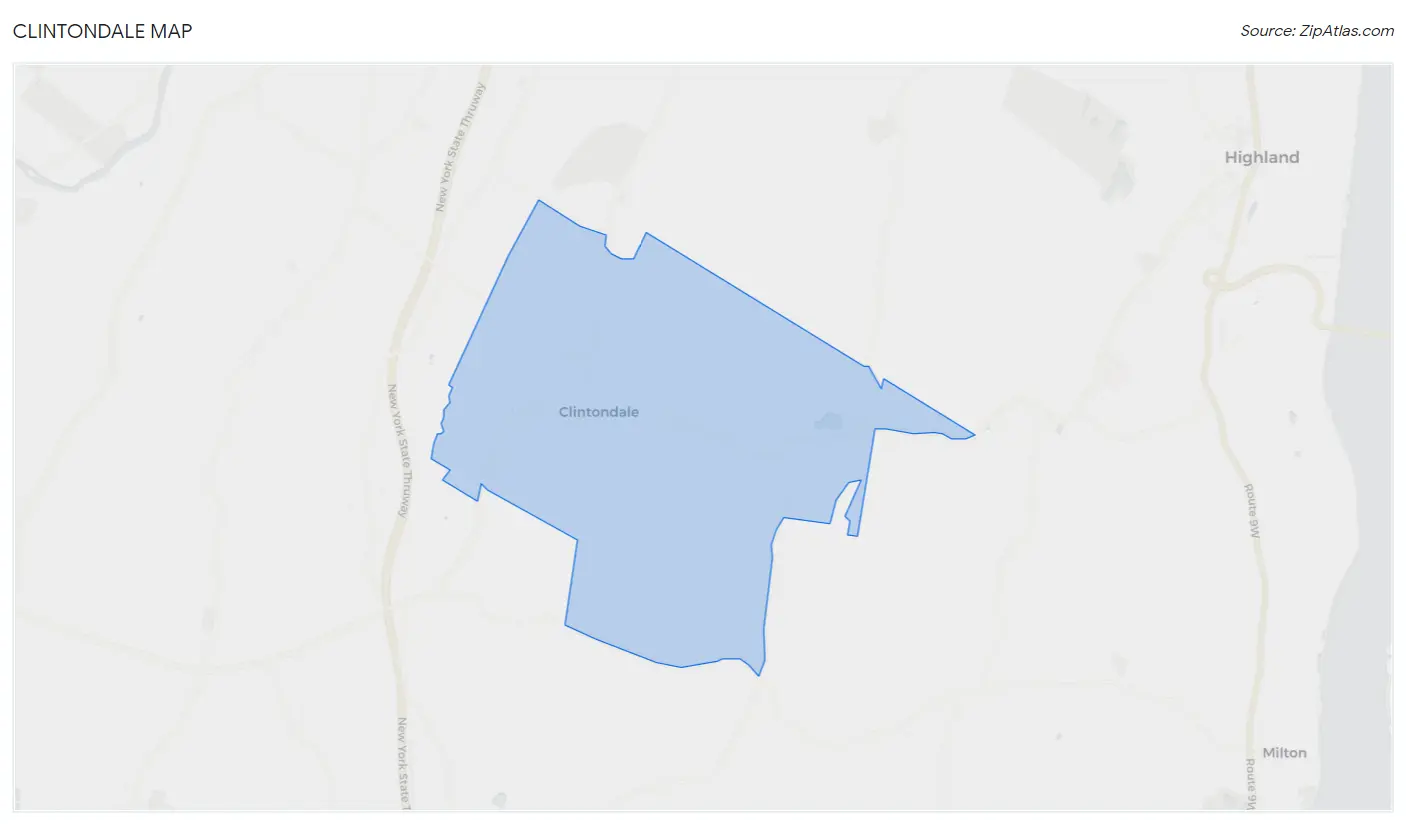
Clintondale Map
Clintondale Overview
$44,754
PER CAPITA INCOME
$47,292
AVG HOUSEHOLD INCOME
8.4%
WAGE / INCOME GAP [ % ]
91.6¢/ $1
WAGE / INCOME GAP [ $ ]
0.47
INEQUALITY / GINI INDEX
1,493
TOTAL POPULATION
777
MALE POPULATION
716
FEMALE POPULATION
108.52
MALES / 100 FEMALES
92.15
FEMALES / 100 MALES
48.5
MEDIAN AGE
2.5
AVG FAMILY SIZE
2.0
AVG HOUSEHOLD SIZE
760
LABOR FORCE [ PEOPLE ]
59.4%
PERCENT IN LABOR FORCE
6.4%
UNEMPLOYMENT RATE
Clintondale Zip Codes
Clintondale Area Codes
Income in Clintondale
Income Overview in Clintondale
| Characteristic | Number | Measure |
| Per Capita Income | 1,493 | $44,754 |
| Median Family Income | 437 | $0 |
| Mean Family Income | 437 | $109,241 |
| Median Household Income | 724 | $47,292 |
| Mean Household Income | 724 | $91,832 |
| Income Deficit | 437 | $0 |
| Wage / Income Gap (%) | 1,493 | 8.43% |
| Wage / Income Gap ($) | 1,493 | 91.57¢ per $1 |
| Gini / Inequality Index | 1,493 | 0.47 |
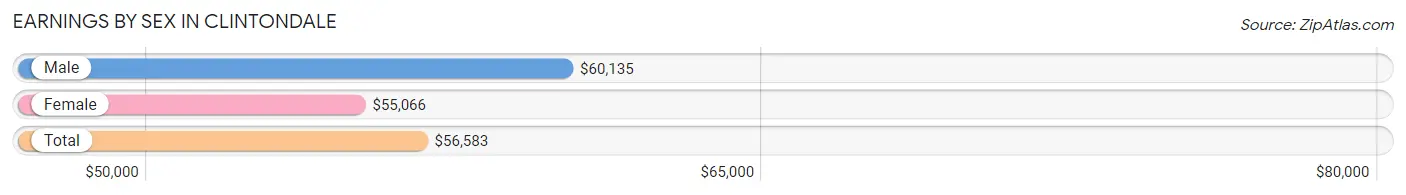
Earnings by Sex in Clintondale
Average Earnings in Clintondale are $56,583, $60,135 for men and $55,066 for women, a difference of 8.4%.
| Sex | Number | Average Earnings |
| Male | 488 (61.9%) | $60,135 |
| Female | 301 (38.2%) | $55,066 |
| Total | 789 (100.0%) | $56,583 |
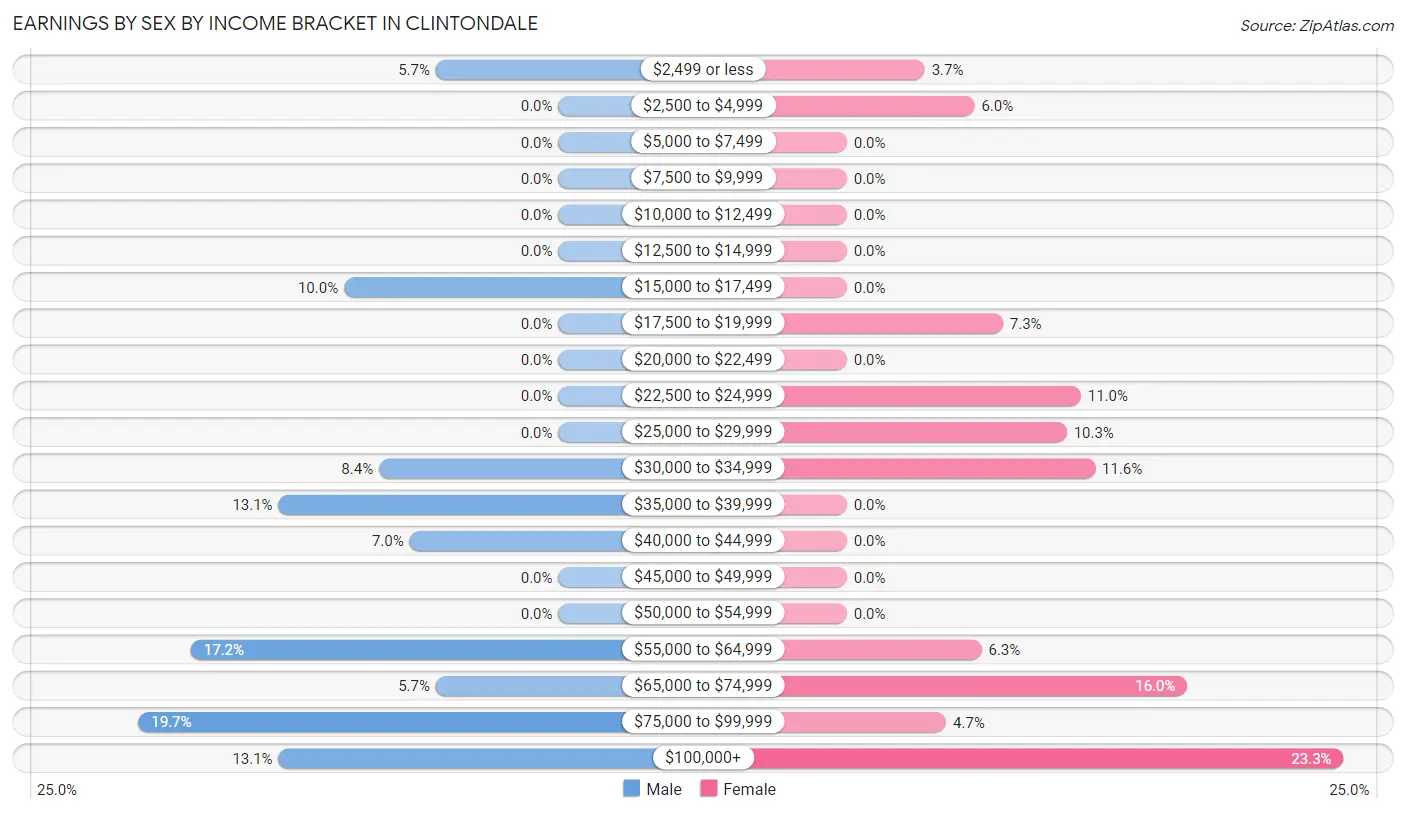
Earnings by Sex by Income Bracket in Clintondale
The most common earnings brackets in Clintondale are $75,000 to $99,999 for men (96 | 19.7%) and $100,000+ for women (70 | 23.3%).
| Income | Male | Female |
| $2,499 or less | 28 (5.7%) | 11 (3.6%) |
| $2,500 to $4,999 | 0 (0.0%) | 18 (6.0%) |
| $5,000 to $7,499 | 0 (0.0%) | 0 (0.0%) |
| $7,500 to $9,999 | 0 (0.0%) | 0 (0.0%) |
| $10,000 to $12,499 | 0 (0.0%) | 0 (0.0%) |
| $12,500 to $14,999 | 0 (0.0%) | 0 (0.0%) |
| $15,000 to $17,499 | 49 (10.0%) | 0 (0.0%) |
| $17,500 to $19,999 | 0 (0.0%) | 22 (7.3%) |
| $20,000 to $22,499 | 0 (0.0%) | 0 (0.0%) |
| $22,500 to $24,999 | 0 (0.0%) | 33 (11.0%) |
| $25,000 to $29,999 | 0 (0.0%) | 31 (10.3%) |
| $30,000 to $34,999 | 41 (8.4%) | 35 (11.6%) |
| $35,000 to $39,999 | 64 (13.1%) | 0 (0.0%) |
| $40,000 to $44,999 | 34 (7.0%) | 0 (0.0%) |
| $45,000 to $49,999 | 0 (0.0%) | 0 (0.0%) |
| $50,000 to $54,999 | 0 (0.0%) | 0 (0.0%) |
| $55,000 to $64,999 | 84 (17.2%) | 19 (6.3%) |
| $65,000 to $74,999 | 28 (5.7%) | 48 (16.0%) |
| $75,000 to $99,999 | 96 (19.7%) | 14 (4.6%) |
| $100,000+ | 64 (13.1%) | 70 (23.3%) |
| Total | 488 (100.0%) | 301 (100.0%) |
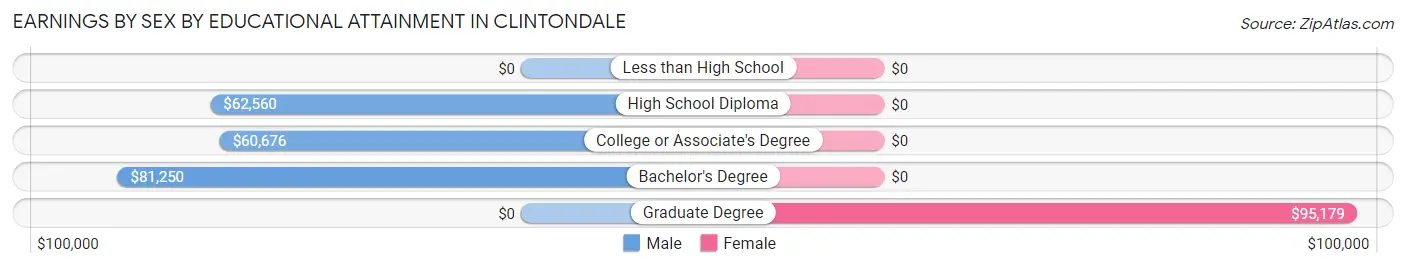
Earnings by Sex by Educational Attainment in Clintondale
Average earnings in Clintondale are $61,047 for men and $56,974 for women, a difference of 6.7%. Men with an educational attainment of bachelor's degree enjoy the highest average annual earnings of $81,250, while those with college or associate's degree education earn the least with $60,676. Women with an educational attainment of graduate degree earn the most with the average annual earnings of $95,179, while those with graduate degree education have the smallest earnings of $95,179.
| Educational Attainment | Male Income | Female Income |
| Less than High School | - | - |
| High School Diploma | $62,560 | $0 |
| College or Associate's Degree | $60,676 | $0 |
| Bachelor's Degree | $81,250 | $0 |
| Graduate Degree | - | - |
| Total | $61,047 | $56,974 |
Family Income in Clintondale
Family Income Brackets in Clintondale
According to the Clintondale family income data, there are 147 families falling into the $35,000 to $49,999 income range, which is the most common income bracket and makes up 33.6% of all families.
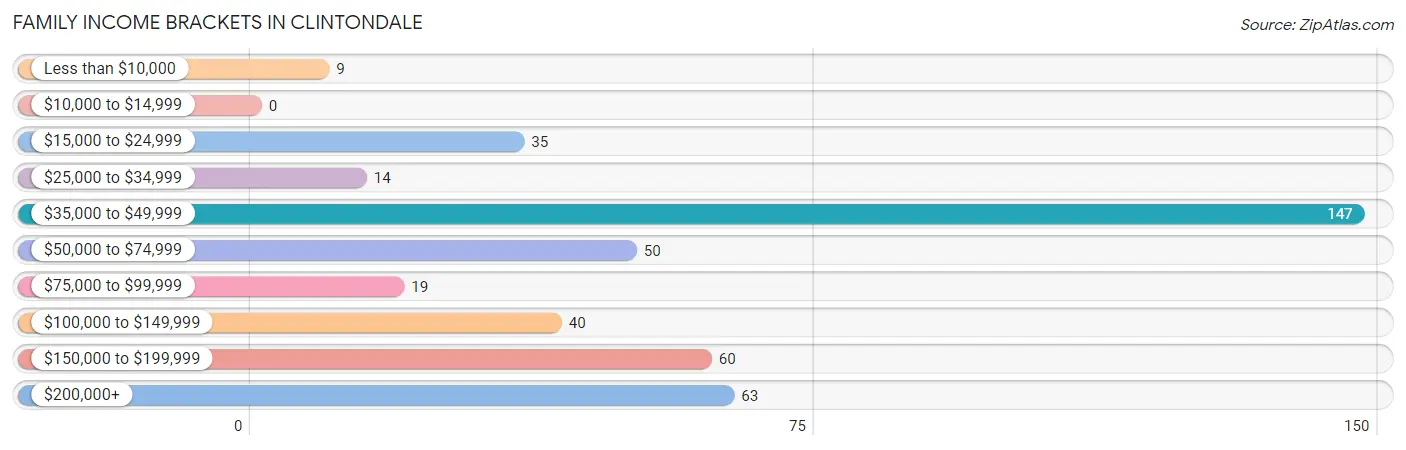
| Income Bracket | # Families | % Families |
| Less than $10,000 | 9 | 2.1% |
| $10,000 to $14,999 | 0 | 0.0% |
| $15,000 to $24,999 | 35 | 8.0% |
| $25,000 to $34,999 | 14 | 3.2% |
| $35,000 to $49,999 | 147 | 33.6% |
| $50,000 to $74,999 | 50 | 11.4% |
| $75,000 to $99,999 | 19 | 4.3% |
| $100,000 to $149,999 | 40 | 9.2% |
| $150,000 to $199,999 | 60 | 13.7% |
| $200,000+ | 63 | 14.4% |
Family Income by Famaliy Size in Clintondale
2-person families (229 | 52.4%) account for the highest median family income in Clintondale with $68,347 per family, while 2-person families (229 | 52.4%) have the highest median income of $34,174 per family member.
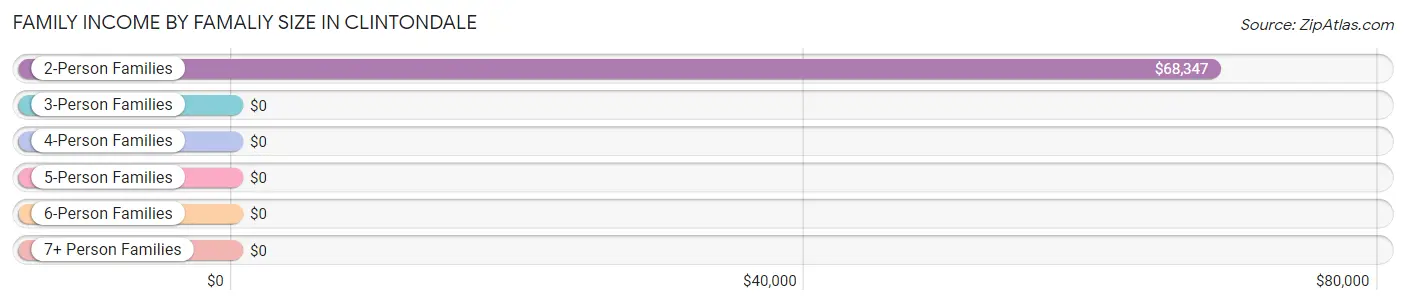
| Income Bracket | # Families | Median Income |
| 2-Person Families | 229 (52.4%) | $68,347 |
| 3-Person Families | 172 (39.4%) | $0 |
| 4-Person Families | 13 (3.0%) | $0 |
| 5-Person Families | 23 (5.3%) | $0 |
| 6-Person Families | 0 (0.0%) | $0 |
| 7+ Person Families | 0 (0.0%) | $0 |
| Total | 437 (100.0%) | $0 |
Family Income by Number of Earners in Clintondale
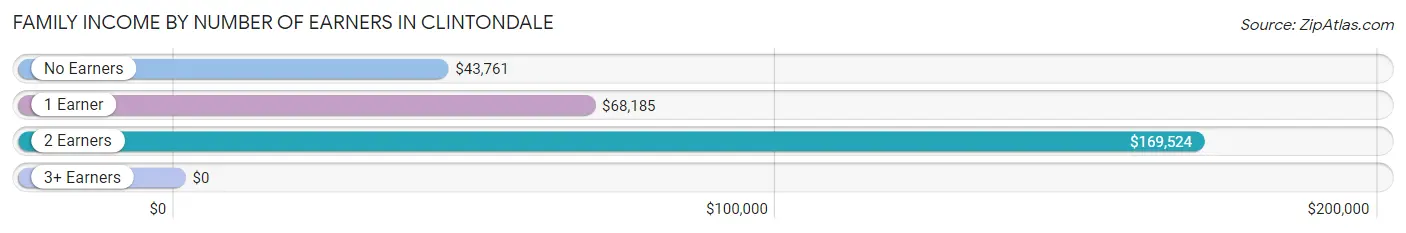
| Number of Earners | # Families | Median Income |
| No Earners | 182 (41.6%) | $43,761 |
| 1 Earner | 83 (19.0%) | $68,185 |
| 2 Earners | 132 (30.2%) | $169,524 |
| 3+ Earners | 40 (9.1%) | $0 |
| Total | 437 (100.0%) | $0 |
Household Income in Clintondale
Household Income Brackets in Clintondale
With 147 households falling in the category, the $35,000 to $49,999 income range is the most frequent in Clintondale, accounting for 20.3% of all households.
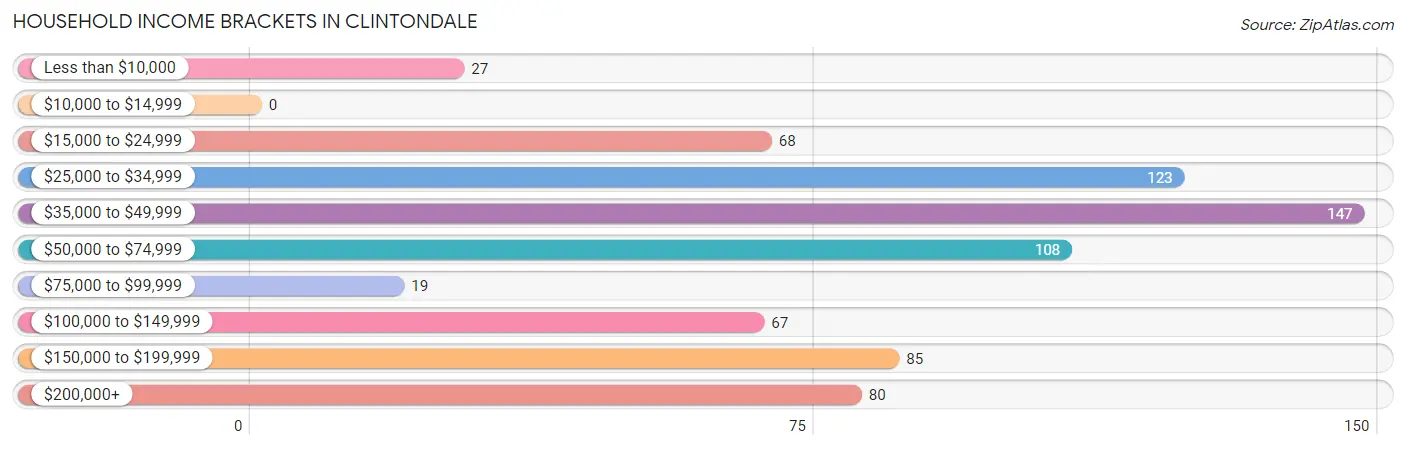
| Income Bracket | # Households | % Households |
| Less than $10,000 | 27 | 3.7% |
| $10,000 to $14,999 | 0 | 0.0% |
| $15,000 to $24,999 | 68 | 9.4% |
| $25,000 to $34,999 | 123 | 17.0% |
| $35,000 to $49,999 | 147 | 20.3% |
| $50,000 to $74,999 | 108 | 14.9% |
| $75,000 to $99,999 | 19 | 2.6% |
| $100,000 to $149,999 | 67 | 9.3% |
| $150,000 to $199,999 | 85 | 11.7% |
| $200,000+ | 80 | 11.0% |
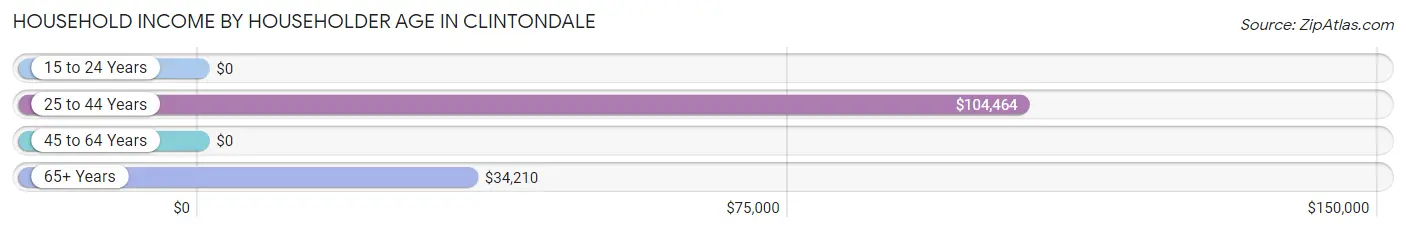
Household Income by Householder Age in Clintondale
The median household income in Clintondale is $47,292, with the highest median household income of $104,464 found in the 25 to 44 years age bracket for the primary householder. A total of 193 households (26.7%) fall into this category. Meanwhile, the 15 to 24 years age bracket for the primary householder has the lowest median household income of $0, with 14 households (1.9%) in this group.
| Income Bracket | # Households | Median Income |
| 15 to 24 Years | 14 (1.9%) | $0 |
| 25 to 44 Years | 193 (26.7%) | $104,464 |
| 45 to 64 Years | 340 (47.0%) | $0 |
| 65+ Years | 177 (24.4%) | $34,210 |
| Total | 724 (100.0%) | $47,292 |
Poverty in Clintondale
Income Below Poverty by Sex and Age in Clintondale
With 4.9% poverty level for males and 9.2% for females among the residents of Clintondale, 45 to 54 year old males and 16 and 17 year old females are the most vulnerable to poverty, with 31 males (22.0%) and 13 females (48.1%) in their respective age groups living below the poverty level.
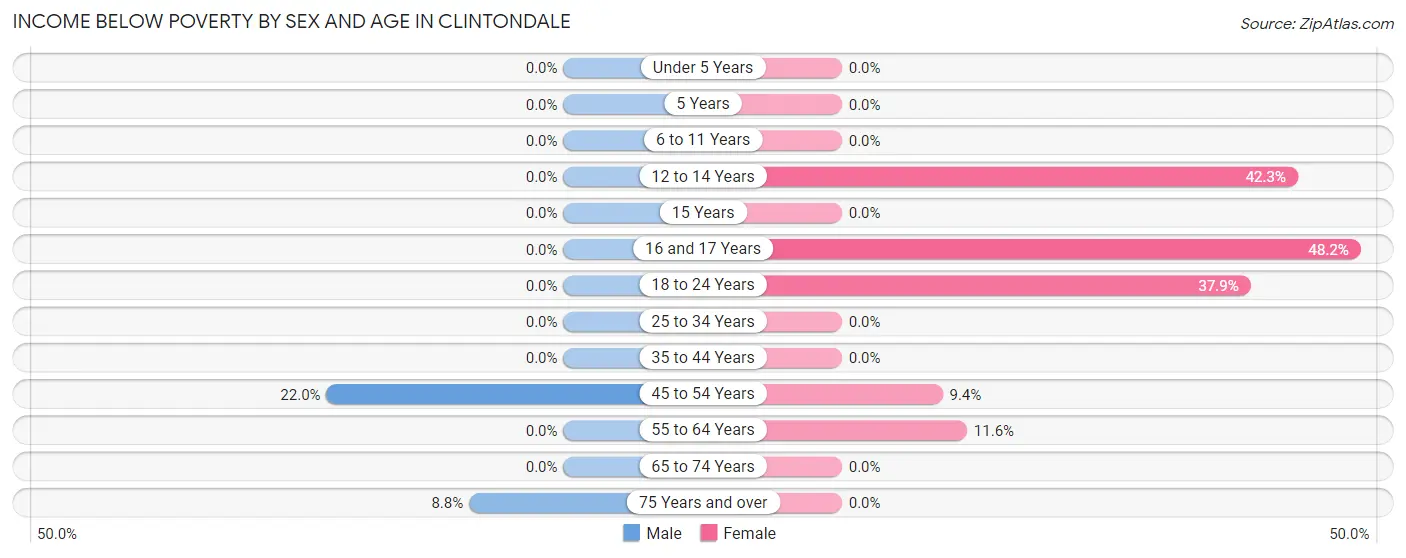
| Age Bracket | Male | Female |
| Under 5 Years | 0 (0.0%) | 0 (0.0%) |
| 5 Years | 0 (0.0%) | 0 (0.0%) |
| 6 to 11 Years | 0 (0.0%) | 0 (0.0%) |
| 12 to 14 Years | 0 (0.0%) | 11 (42.3%) |
| 15 Years | 0 (0.0%) | 0 (0.0%) |
| 16 and 17 Years | 0 (0.0%) | 13 (48.1%) |
| 18 to 24 Years | 0 (0.0%) | 11 (37.9%) |
| 25 to 34 Years | 0 (0.0%) | 0 (0.0%) |
| 35 to 44 Years | 0 (0.0%) | 0 (0.0%) |
| 45 to 54 Years | 31 (22.0%) | 13 (9.3%) |
| 55 to 64 Years | 0 (0.0%) | 18 (11.6%) |
| 65 to 74 Years | 0 (0.0%) | 0 (0.0%) |
| 75 Years and over | 7 (8.7%) | 0 (0.0%) |
| Total | 38 (4.9%) | 66 (9.2%) |
Income Above Poverty by Sex and Age in Clintondale
According to the poverty statistics in Clintondale, males aged under 5 years and females aged 6 to 11 years are the age groups that are most secure financially, with 100.0% of males and 100.0% of females in these age groups living above the poverty line.
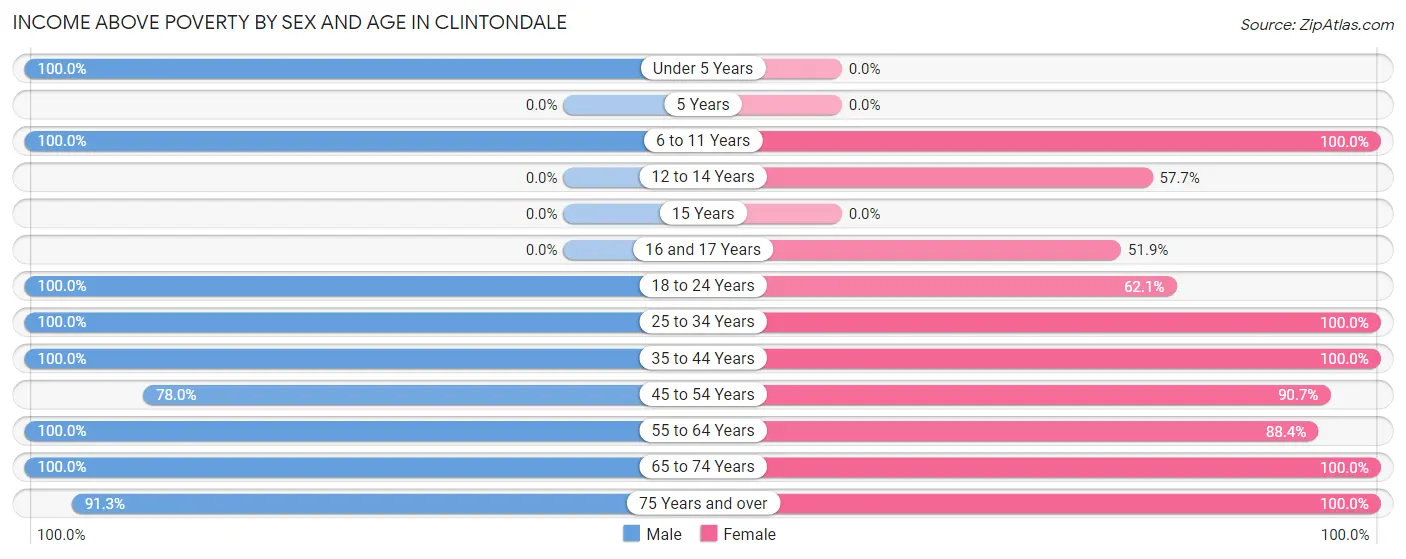
| Age Bracket | Male | Female |
| Under 5 Years | 39 (100.0%) | 0 (0.0%) |
| 5 Years | 0 (0.0%) | 0 (0.0%) |
| 6 to 11 Years | 25 (100.0%) | 124 (100.0%) |
| 12 to 14 Years | 0 (0.0%) | 15 (57.7%) |
| 15 Years | 0 (0.0%) | 0 (0.0%) |
| 16 and 17 Years | 0 (0.0%) | 14 (51.8%) |
| 18 to 24 Years | 61 (100.0%) | 18 (62.1%) |
| 25 to 34 Years | 55 (100.0%) | 87 (100.0%) |
| 35 to 44 Years | 106 (100.0%) | 52 (100.0%) |
| 45 to 54 Years | 110 (78.0%) | 126 (90.6%) |
| 55 to 64 Years | 135 (100.0%) | 137 (88.4%) |
| 65 to 74 Years | 135 (100.0%) | 38 (100.0%) |
| 75 Years and over | 73 (91.2%) | 39 (100.0%) |
| Total | 739 (95.1%) | 650 (90.8%) |
Income Below Poverty Among Married-Couple Families in Clintondale
The poverty statistics for married-couple families in Clintondale show that 2.5% or 9 of the total 359 families live below the poverty line. Families with 1 or 2 children have the highest poverty rate of 5.8%, comprising of 9 families. On the other hand, families with no children have the lowest poverty rate of 0.0%, which includes 0 families.
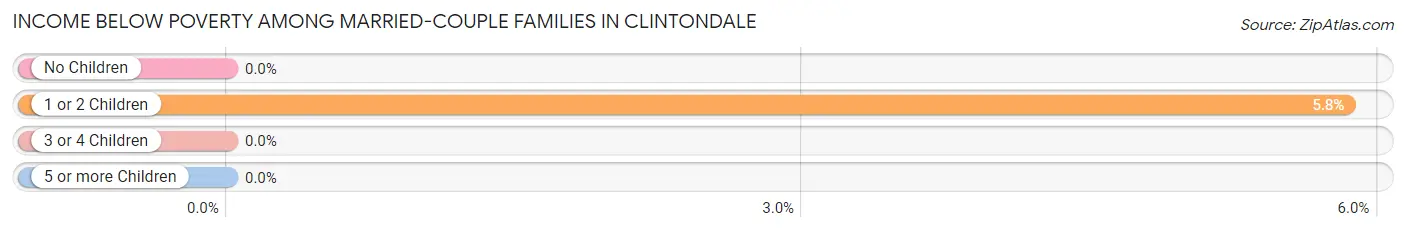
| Children | Above Poverty | Below Poverty |
| No Children | 191 (100.0%) | 0 (0.0%) |
| 1 or 2 Children | 145 (94.2%) | 9 (5.8%) |
| 3 or 4 Children | 14 (100.0%) | 0 (0.0%) |
| 5 or more Children | 0 (0.0%) | 0 (0.0%) |
| Total | 350 (97.5%) | 9 (2.5%) |
Income Below Poverty Among Single-Parent Households in Clintondale
| Children | Single Father | Single Mother |
| No Children | 0 (0.0%) | 0 (0.0%) |
| 1 or 2 Children | 0 (0.0%) | 0 (0.0%) |
| 3 or 4 Children | 0 (0.0%) | 0 (0.0%) |
| 5 or more Children | 0 (0.0%) | 0 (0.0%) |
| Total | 0 (0.0%) | 0 (0.0%) |
Income Below Poverty Among Married-Couple vs Single-Parent Households in Clintondale
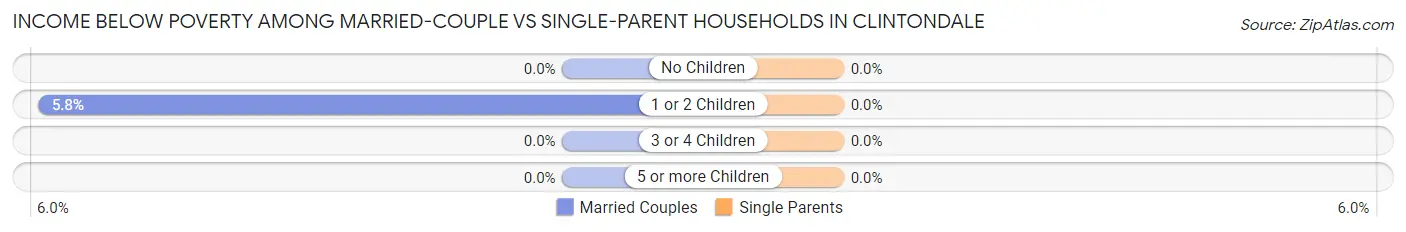
| Children | Married-Couple Families | Single-Parent Households |
| No Children | 0 (0.0%) | 0 (0.0%) |
| 1 or 2 Children | 9 (5.8%) | 0 (0.0%) |
| 3 or 4 Children | 0 (0.0%) | 0 (0.0%) |
| 5 or more Children | 0 (0.0%) | 0 (0.0%) |
| Total | 9 (2.5%) | 0 (0.0%) |
Race in Clintondale
The most populous races in Clintondale are White / Caucasian (1,358 | 91.0%), Hispanic or Latino (154 | 10.3%), and Two or more Races (62 | 4.2%).
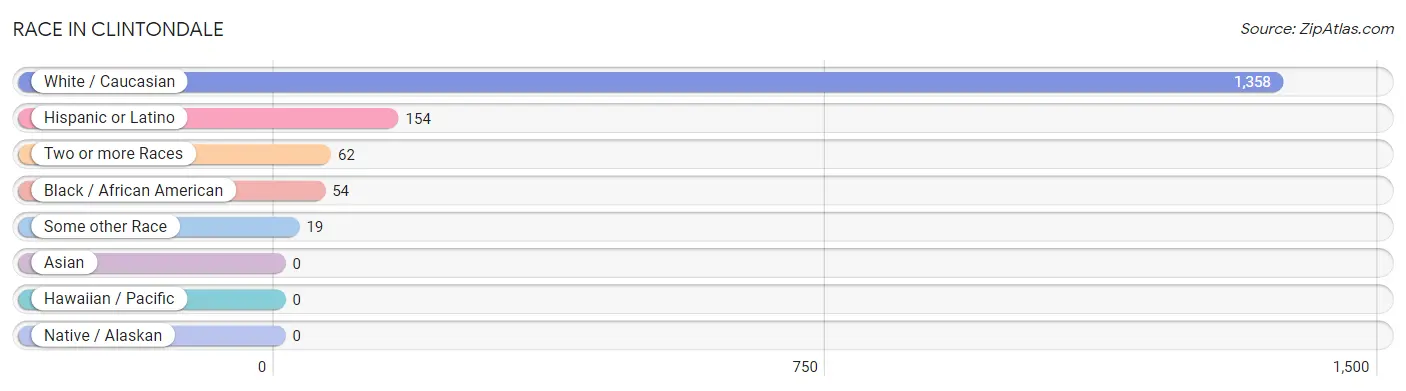
| Race | # Population | % Population |
| Asian | 0 | 0.0% |
| Black / African American | 54 | 3.6% |
| Hawaiian / Pacific | 0 | 0.0% |
| Hispanic or Latino | 154 | 10.3% |
| Native / Alaskan | 0 | 0.0% |
| White / Caucasian | 1,358 | 91.0% |
| Two or more Races | 62 | 4.2% |
| Some other Race | 19 | 1.3% |
| Total | 1,493 | 100.0% |
Ancestry in Clintondale
The most populous ancestries reported in Clintondale are Italian (587 | 39.3%), Irish (243 | 16.3%), English (141 | 9.4%), German (113 | 7.6%), and Puerto Rican (112 | 7.5%), together accounting for 80.1% of all Clintondale residents.
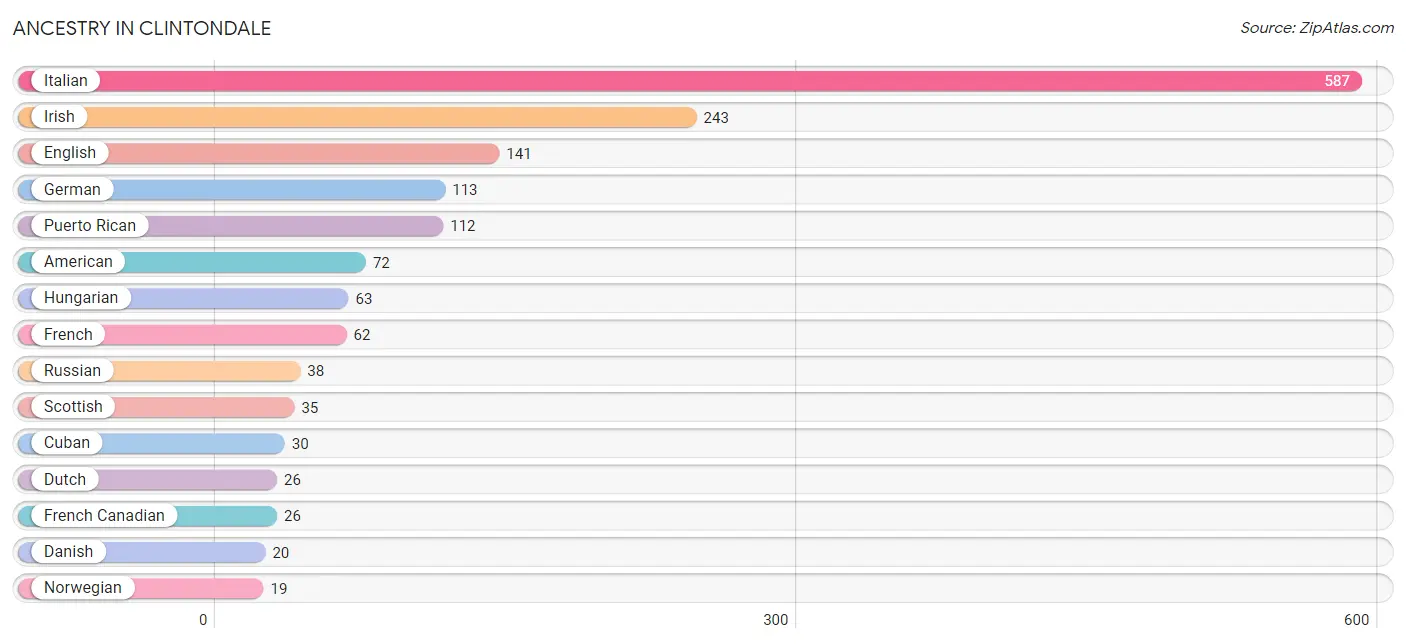
| Ancestry | # Population | % Population |
| American | 72 | 4.8% |
| Central American | 12 | 0.8% |
| Cuban | 30 | 2.0% |
| Danish | 20 | 1.3% |
| Dutch | 26 | 1.7% |
| English | 141 | 9.4% |
| French | 62 | 4.2% |
| French Canadian | 26 | 1.7% |
| German | 113 | 7.6% |
| Guatemalan | 12 | 0.8% |
| Hungarian | 63 | 4.2% |
| Irish | 243 | 16.3% |
| Italian | 587 | 39.3% |
| Jamaican | 12 | 0.8% |
| Korean | 7 | 0.5% |
| Norwegian | 19 | 1.3% |
| Polish | 15 | 1.0% |
| Puerto Rican | 112 | 7.5% |
| Russian | 38 | 2.5% |
| Scottish | 35 | 2.3% | View All 20 Rows |
Immigrants in Clintondale
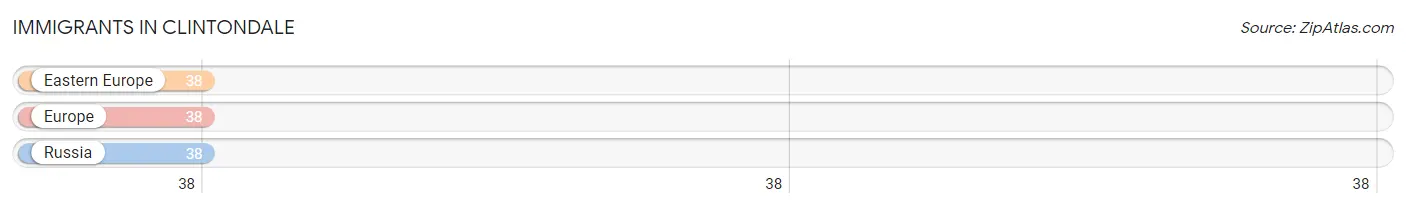
The most numerous immigrant groups reported in Clintondale came from Eastern Europe (38 | 2.5%), Europe (38 | 2.5%), and Russia (38 | 2.5%), together accounting for 7.6% of all Clintondale residents.
| Immigration Origin | # Population | % Population |
| Eastern Europe | 38 | 2.5% |
| Europe | 38 | 2.5% |
| Russia | 38 | 2.5% | View All 3 Rows |
Sex and Age in Clintondale
Sex and Age in Clintondale
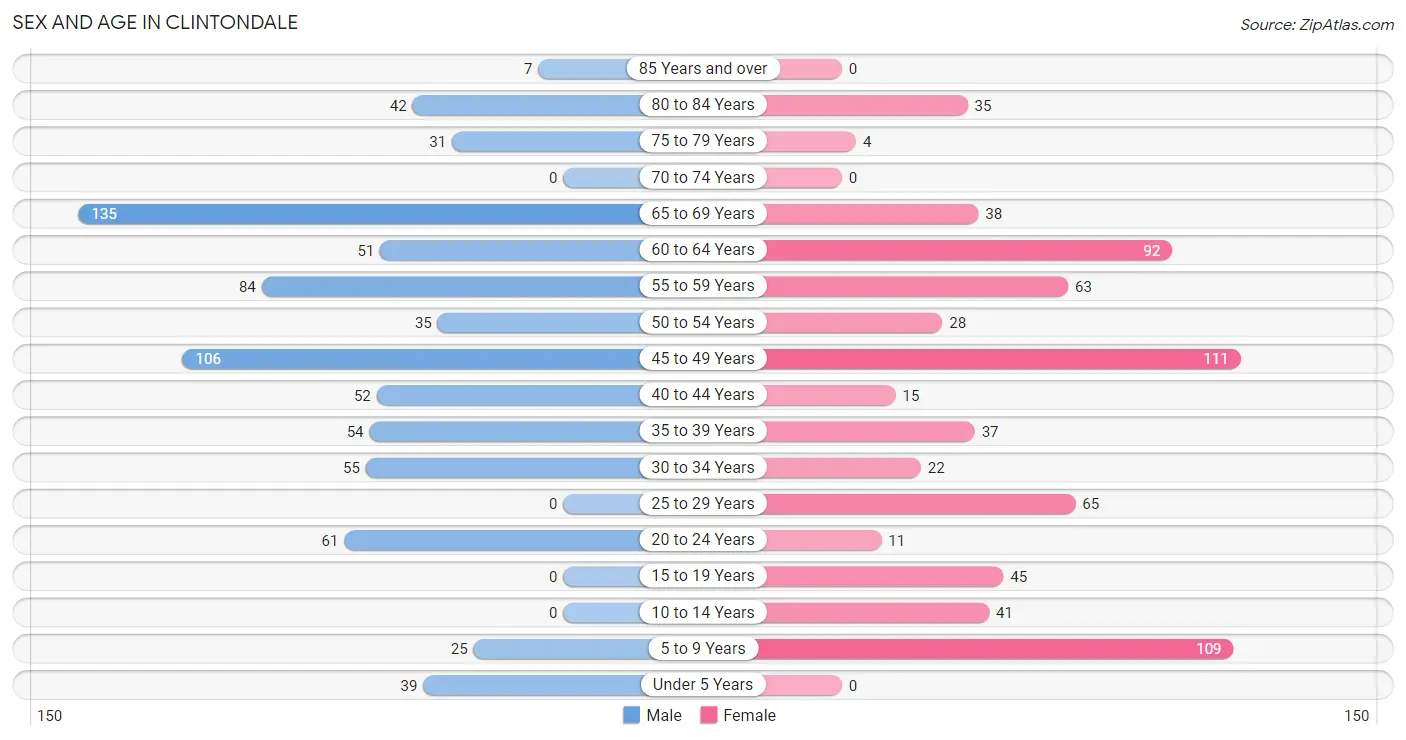
The most populous age groups in Clintondale are 65 to 69 Years (135 | 17.4%) for men and 45 to 49 Years (111 | 15.5%) for women.
| Age Bracket | Male | Female |
| Under 5 Years | 39 (5.0%) | 0 (0.0%) |
| 5 to 9 Years | 25 (3.2%) | 109 (15.2%) |
| 10 to 14 Years | 0 (0.0%) | 41 (5.7%) |
| 15 to 19 Years | 0 (0.0%) | 45 (6.3%) |
| 20 to 24 Years | 61 (7.9%) | 11 (1.5%) |
| 25 to 29 Years | 0 (0.0%) | 65 (9.1%) |
| 30 to 34 Years | 55 (7.1%) | 22 (3.1%) |
| 35 to 39 Years | 54 (7.0%) | 37 (5.2%) |
| 40 to 44 Years | 52 (6.7%) | 15 (2.1%) |
| 45 to 49 Years | 106 (13.6%) | 111 (15.5%) |
| 50 to 54 Years | 35 (4.5%) | 28 (3.9%) |
| 55 to 59 Years | 84 (10.8%) | 63 (8.8%) |
| 60 to 64 Years | 51 (6.6%) | 92 (12.9%) |
| 65 to 69 Years | 135 (17.4%) | 38 (5.3%) |
| 70 to 74 Years | 0 (0.0%) | 0 (0.0%) |
| 75 to 79 Years | 31 (4.0%) | 4 (0.6%) |
| 80 to 84 Years | 42 (5.4%) | 35 (4.9%) |
| 85 Years and over | 7 (0.9%) | 0 (0.0%) |
| Total | 777 (100.0%) | 716 (100.0%) |
Families and Households in Clintondale
Median Family Size in Clintondale
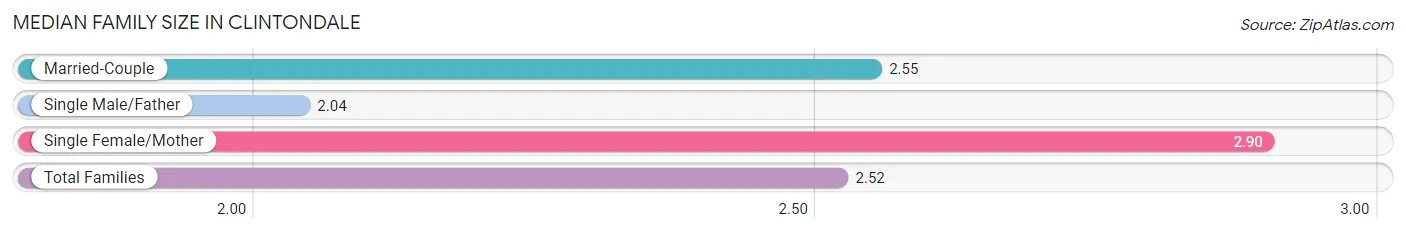
The median family size in Clintondale is 2.52 persons per family, with single female/mother families (29 | 6.6%) accounting for the largest median family size of 2.9 persons per family. On the other hand, single male/father families (49 | 11.2%) represent the smallest median family size with 2.04 persons per family.
| Family Type | # Families | Family Size |
| Married-Couple | 359 (82.2%) | 2.55 |
| Single Male/Father | 49 (11.2%) | 2.04 |
| Single Female/Mother | 29 (6.6%) | 2.90 |
| Total Families | 437 (100.0%) | 2.52 |
Median Household Size in Clintondale
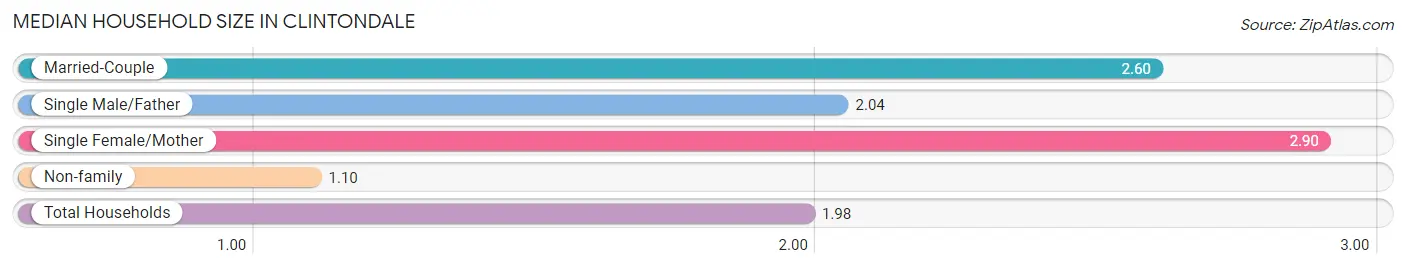
The median household size in Clintondale is 1.98 persons per household, with single female/mother households (29 | 4.0%) accounting for the largest median household size of 2.9 persons per household. non-family households (287 | 39.6%) represent the smallest median household size with 1.10 persons per household.
| Household Type | # Households | Household Size |
| Married-Couple | 359 (49.6%) | 2.60 |
| Single Male/Father | 49 (6.8%) | 2.04 |
| Single Female/Mother | 29 (4.0%) | 2.90 |
| Non-family | 287 (39.6%) | 1.10 |
| Total Households | 724 (100.0%) | 1.98 |
Household Size by Marriage Status in Clintondale
Out of a total of 724 households in Clintondale, 437 (60.4%) are family households, while 287 (39.6%) are nonfamily households. The most numerous type of family households are 2-person households, comprising 210, and the most common type of nonfamily households are 1-person households, comprising 260.
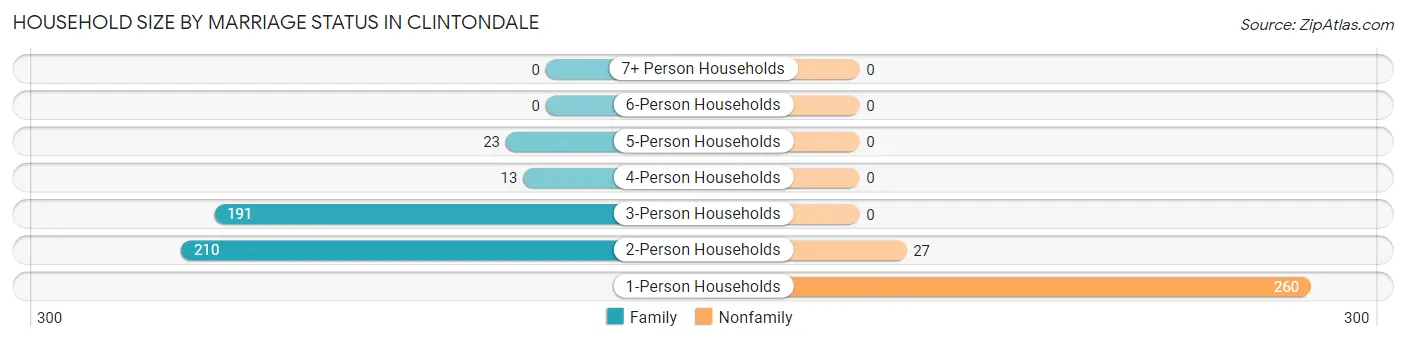
| Household Size | Family Households | Nonfamily Households |
| 1-Person Households | - | 260 (35.9%) |
| 2-Person Households | 210 (29.0%) | 27 (3.7%) |
| 3-Person Households | 191 (26.4%) | 0 (0.0%) |
| 4-Person Households | 13 (1.8%) | 0 (0.0%) |
| 5-Person Households | 23 (3.2%) | 0 (0.0%) |
| 6-Person Households | 0 (0.0%) | 0 (0.0%) |
| 7+ Person Households | 0 (0.0%) | 0 (0.0%) |
| Total | 437 (60.4%) | 287 (39.6%) |
Female Fertility in Clintondale
Fertility by Age in Clintondale
| Age Bracket | Women with Births | Births / 1,000 Women |
| 15 to 19 years | 0 (0.0%) | 0.0 |
| 20 to 34 years | 0 (0.0%) | 0.0 |
| 35 to 50 years | 0 (0.0%) | 0.0 |
| Total | 0 (0.0%) | 0.0 |
Fertility by Age by Marriage Status in Clintondale
| Age Bracket | Married | Unmarried |
| 15 to 19 years | 0 (0.0%) | 0 (0.0%) |
| 20 to 34 years | 0 (0.0%) | 0 (0.0%) |
| 35 to 50 years | 0 (0.0%) | 0 (0.0%) |
| Total | 0 (0.0%) | 0 (0.0%) |
Fertility by Education in Clintondale
| Educational Attainment | Women with Births | Births / 1,000 Women |
| Less than High School | 0 (0.0%) | 0.0 |
| High School Diploma | 0 (0.0%) | 0.0 |
| College or Associate's Degree | 0 (0.0%) | 0.0 |
| Bachelor's Degree | 0 (0.0%) | 0.0 |
| Graduate Degree | 0 (0.0%) | 0.0 |
| Total | 0 (0.0%) | 0.0 |
Fertility by Education by Marriage Status in Clintondale
| Educational Attainment | Married | Unmarried |
| Less than High School | 0 (0.0%) | 0 (0.0%) |
| High School Diploma | 0 (0.0%) | 0 (0.0%) |
| College or Associate's Degree | 0 (0.0%) | 0 (0.0%) |
| Bachelor's Degree | 0 (0.0%) | 0 (0.0%) |
| Graduate Degree | 0 (0.0%) | 0 (0.0%) |
| Total | 0 (0.0%) | 0 (0.0%) |
Employment Characteristics in Clintondale
Employment by Class of Employer in Clintondale
Among the 711 employed individuals in Clintondale, private company employees (527 | 74.1%), local government employees (60 | 8.4%), and self-employed (not incorporated) (49 | 6.9%) make up the most common classes of employment.
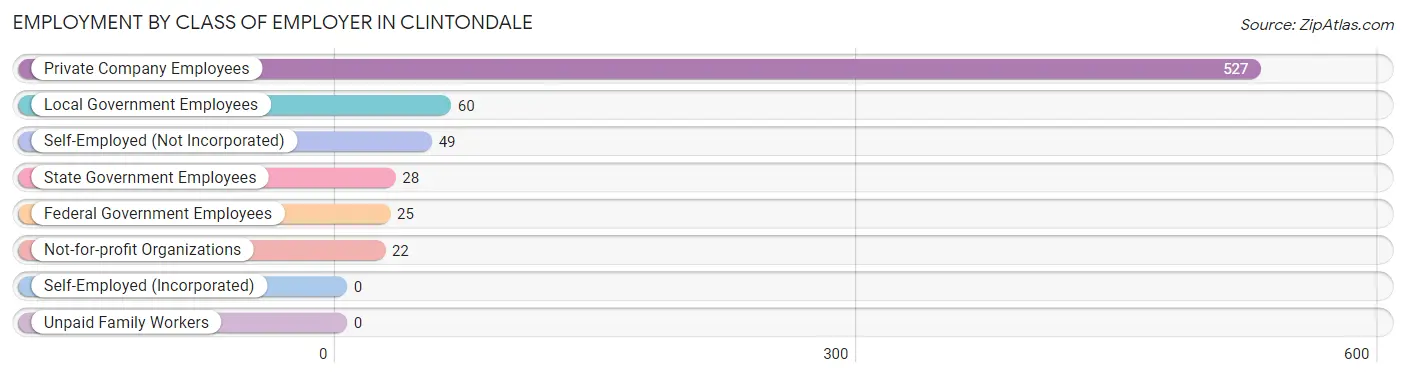
| Employer Class | # Employees | % Employees |
| Private Company Employees | 527 | 74.1% |
| Self-Employed (Incorporated) | 0 | 0.0% |
| Self-Employed (Not Incorporated) | 49 | 6.9% |
| Not-for-profit Organizations | 22 | 3.1% |
| Local Government Employees | 60 | 8.4% |
| State Government Employees | 28 | 3.9% |
| Federal Government Employees | 25 | 3.5% |
| Unpaid Family Workers | 0 | 0.0% |
| Total | 711 | 100.0% |
Employment Status by Age in Clintondale
According to the labor force statistics for Clintondale, out of the total population over 16 years of age (1,279), 59.4% or 760 individuals are in the labor force, with 6.4% or 49 of them unemployed. The age group with the highest labor force participation rate is 25 to 29 years, with 100.0% or 65 individuals in the labor force. Within the labor force, the 65 to 74 years age range has the highest percentage of unemployed individuals, with 100.0% or 49 of them being unemployed.
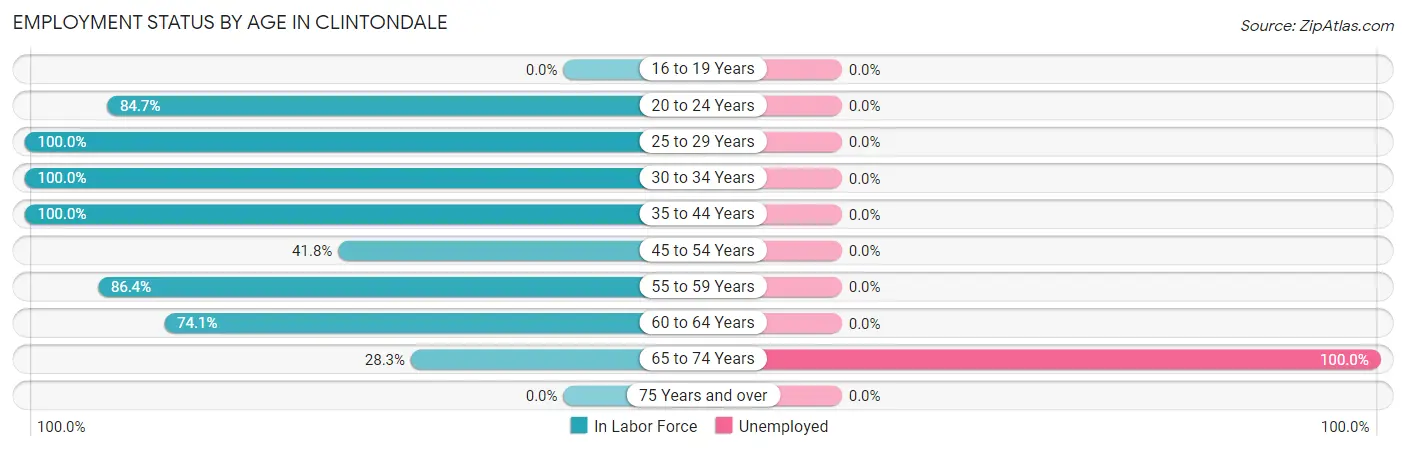
| Age Bracket | In Labor Force | Unemployed |
| 16 to 19 Years | 0 (0.0%) | 0 (0.0%) |
| 20 to 24 Years | 61 (84.7%) | 0 (0.0%) |
| 25 to 29 Years | 65 (100.0%) | 0 (0.0%) |
| 30 to 34 Years | 77 (100.0%) | 0 (0.0%) |
| 35 to 44 Years | 158 (100.0%) | 0 (0.0%) |
| 45 to 54 Years | 117 (41.8%) | 0 (0.0%) |
| 55 to 59 Years | 127 (86.4%) | 0 (0.0%) |
| 60 to 64 Years | 106 (74.1%) | 0 (0.0%) |
| 65 to 74 Years | 49 (28.3%) | 49 (100.0%) |
| 75 Years and over | 0 (0.0%) | 0 (0.0%) |
| Total | 760 (59.4%) | 49 (6.4%) |
Employment Status by Educational Attainment in Clintondale
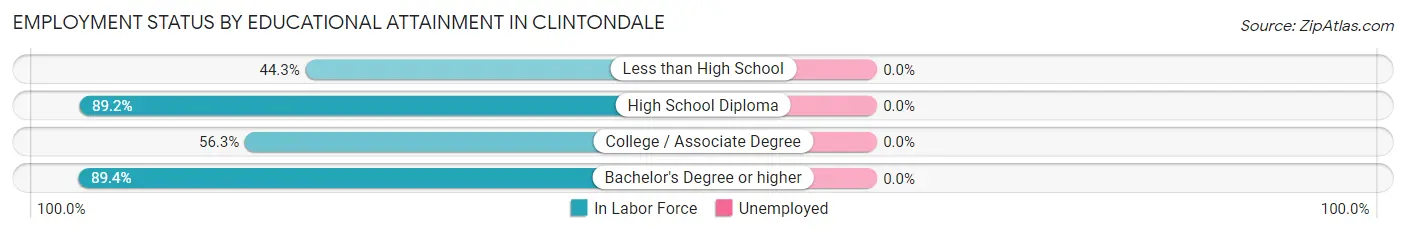
| Educational Attainment | In Labor Force | Unemployed |
| Less than High School | 27 (44.3%) | 0 (0.0%) |
| High School Diploma | 199 (89.2%) | 0 (0.0%) |
| College / Associate Degree | 170 (56.3%) | 0 (0.0%) |
| Bachelor's Degree or higher | 254 (89.4%) | 0 (0.0%) |
| Total | 650 (74.7%) | 0 (0.0%) |
Employment Occupations by Sex in Clintondale
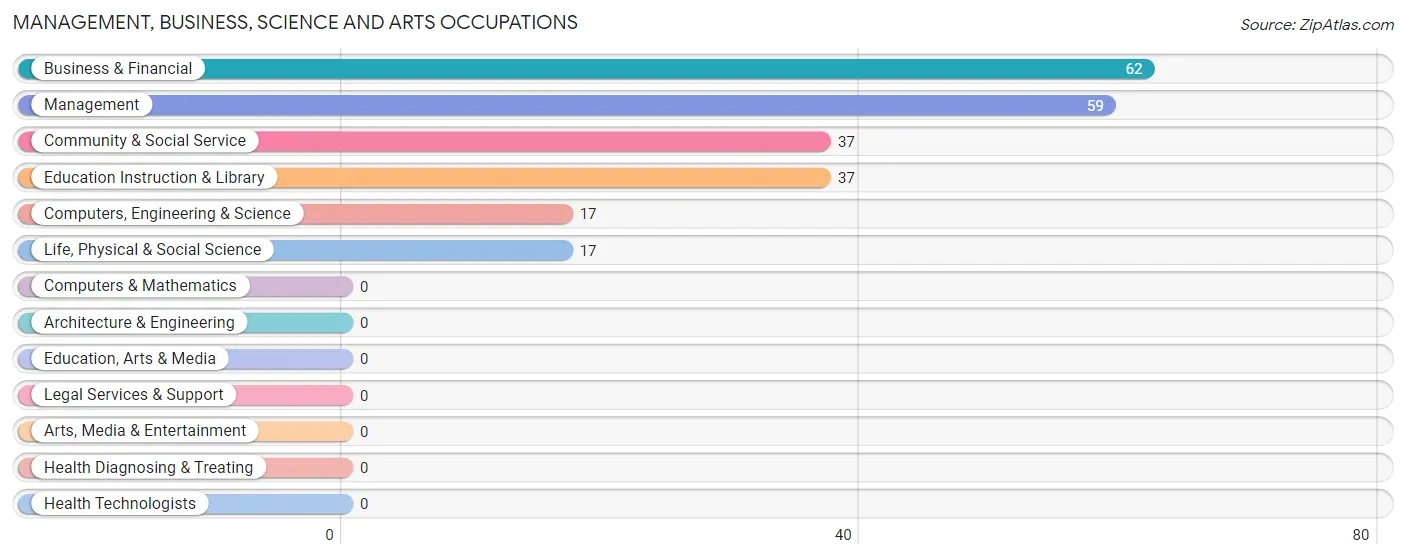
Management, Business, Science and Arts Occupations
The most common Management, Business, Science and Arts occupations in Clintondale are Business & Financial (62 | 8.7%), Management (59 | 8.3%), Community & Social Service (37 | 5.2%), Education Instruction & Library (37 | 5.2%), and Computers, Engineering & Science (17 | 2.4%).
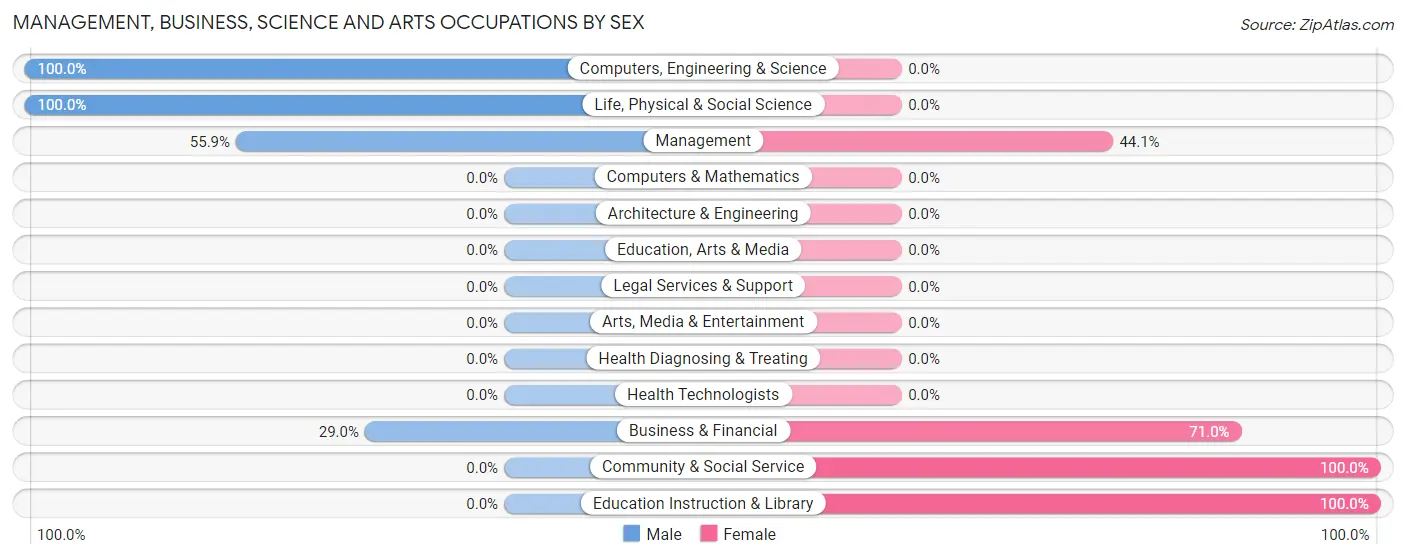
Management, Business, Science and Arts Occupations by Sex
Within the Management, Business, Science and Arts occupations in Clintondale, the most male-oriented occupations are Computers, Engineering & Science (100.0%), Life, Physical & Social Science (100.0%), and Management (55.9%), while the most female-oriented occupations are Community & Social Service (100.0%), Education Instruction & Library (100.0%), and Business & Financial (71.0%).
| Occupation | Male | Female |
| Management | 33 (55.9%) | 26 (44.1%) |
| Business & Financial | 18 (29.0%) | 44 (71.0%) |
| Computers, Engineering & Science | 17 (100.0%) | 0 (0.0%) |
| Computers & Mathematics | 0 (0.0%) | 0 (0.0%) |
| Architecture & Engineering | 0 (0.0%) | 0 (0.0%) |
| Life, Physical & Social Science | 17 (100.0%) | 0 (0.0%) |
| Community & Social Service | 0 (0.0%) | 37 (100.0%) |
| Education, Arts & Media | 0 (0.0%) | 0 (0.0%) |
| Legal Services & Support | 0 (0.0%) | 0 (0.0%) |
| Education Instruction & Library | 0 (0.0%) | 37 (100.0%) |
| Arts, Media & Entertainment | 0 (0.0%) | 0 (0.0%) |
| Health Diagnosing & Treating | 0 (0.0%) | 0 (0.0%) |
| Health Technologists | 0 (0.0%) | 0 (0.0%) |
| Total (Category) | 68 (38.9%) | 107 (61.1%) |
| Total (Overall) | 439 (61.7%) | 272 (38.3%) |
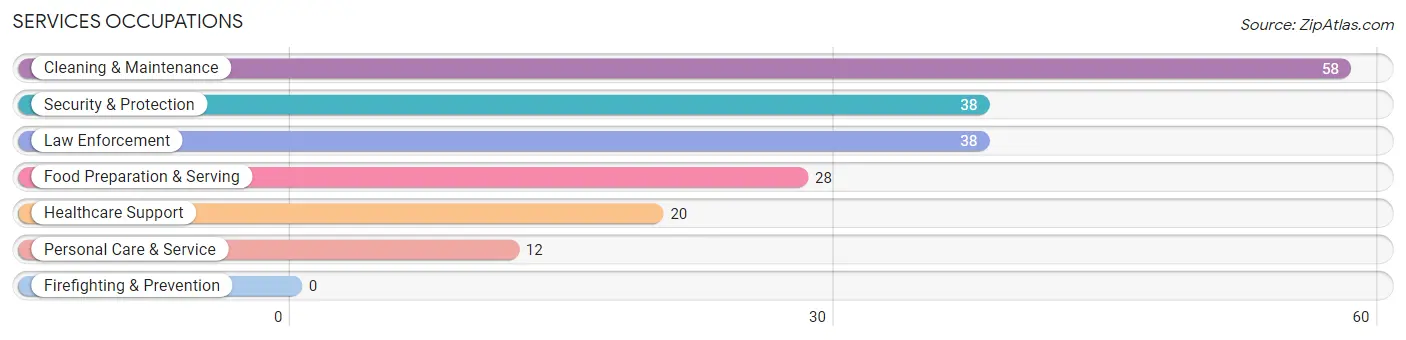
Services Occupations
The most common Services occupations in Clintondale are Cleaning & Maintenance (58 | 8.2%), Security & Protection (38 | 5.3%), Law Enforcement (38 | 5.3%), Food Preparation & Serving (28 | 3.9%), and Healthcare Support (20 | 2.8%).
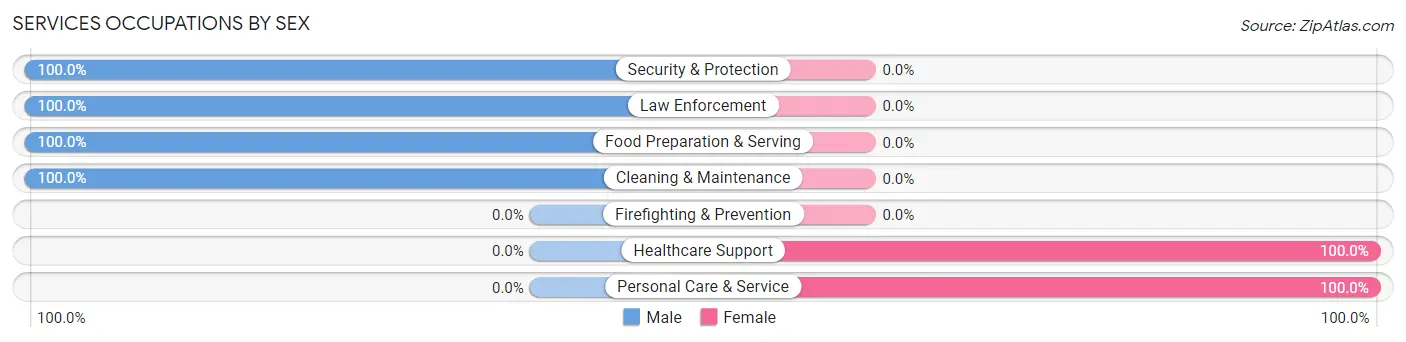
Services Occupations by Sex
Within the Services occupations in Clintondale, the most male-oriented occupations are Security & Protection (100.0%), Law Enforcement (100.0%), and Food Preparation & Serving (100.0%), while the most female-oriented occupations are Healthcare Support (100.0%), and Personal Care & Service (100.0%).
| Occupation | Male | Female |
| Healthcare Support | 0 (0.0%) | 20 (100.0%) |
| Security & Protection | 38 (100.0%) | 0 (0.0%) |
| Firefighting & Prevention | 0 (0.0%) | 0 (0.0%) |
| Law Enforcement | 38 (100.0%) | 0 (0.0%) |
| Food Preparation & Serving | 28 (100.0%) | 0 (0.0%) |
| Cleaning & Maintenance | 58 (100.0%) | 0 (0.0%) |
| Personal Care & Service | 0 (0.0%) | 12 (100.0%) |
| Total (Category) | 124 (79.5%) | 32 (20.5%) |
| Total (Overall) | 439 (61.7%) | 272 (38.3%) |
Sales and Office Occupations
The most common Sales and Office occupations in Clintondale are Sales & Related (52 | 7.3%), and Office & Administration (47 | 6.6%).
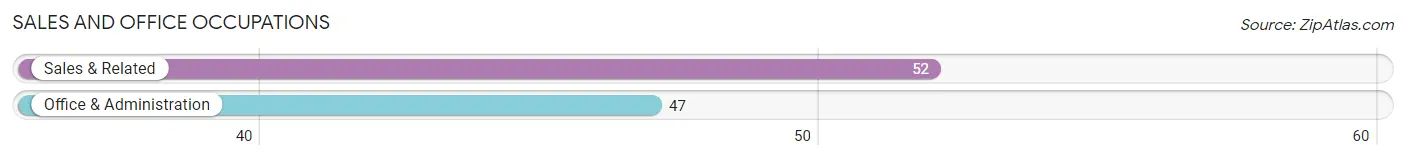
Sales and Office Occupations by Sex
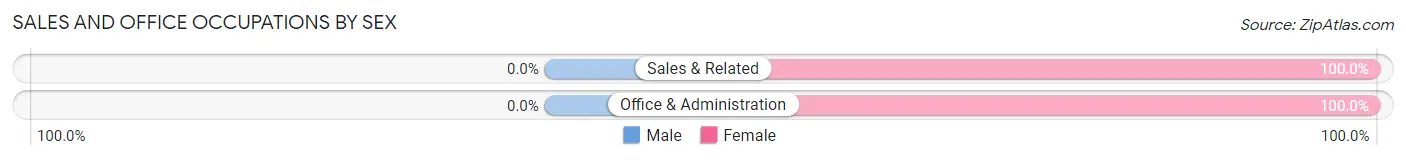
| Occupation | Male | Female |
| Sales & Related | 0 (0.0%) | 52 (100.0%) |
| Office & Administration | 0 (0.0%) | 47 (100.0%) |
| Total (Category) | 0 (0.0%) | 99 (100.0%) |
| Total (Overall) | 439 (61.7%) | 272 (38.3%) |
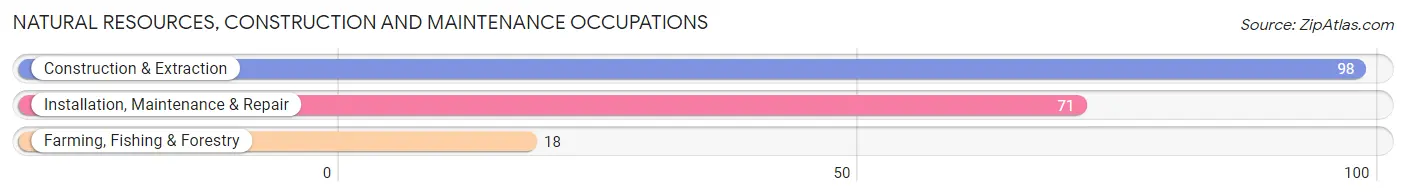
Natural Resources, Construction and Maintenance Occupations
The most common Natural Resources, Construction and Maintenance occupations in Clintondale are Construction & Extraction (98 | 13.8%), Installation, Maintenance & Repair (71 | 10.0%), and Farming, Fishing & Forestry (18 | 2.5%).
Natural Resources, Construction and Maintenance Occupations by Sex
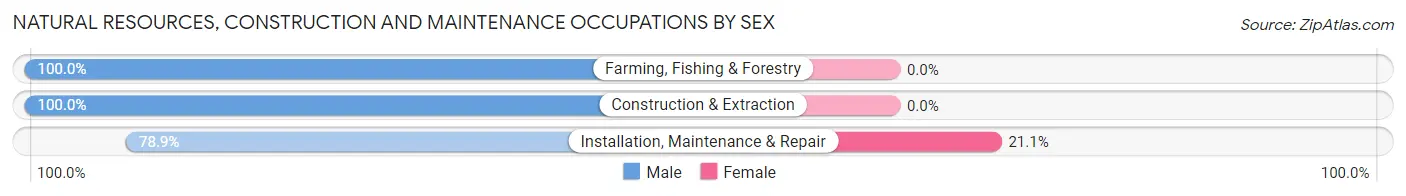
| Occupation | Male | Female |
| Farming, Fishing & Forestry | 18 (100.0%) | 0 (0.0%) |
| Construction & Extraction | 98 (100.0%) | 0 (0.0%) |
| Installation, Maintenance & Repair | 56 (78.9%) | 15 (21.1%) |
| Total (Category) | 172 (92.0%) | 15 (8.0%) |
| Total (Overall) | 439 (61.7%) | 272 (38.3%) |
Production, Transportation and Moving Occupations
The most common Production, Transportation and Moving occupations in Clintondale are Production (61 | 8.6%), and Transportation (33 | 4.6%).
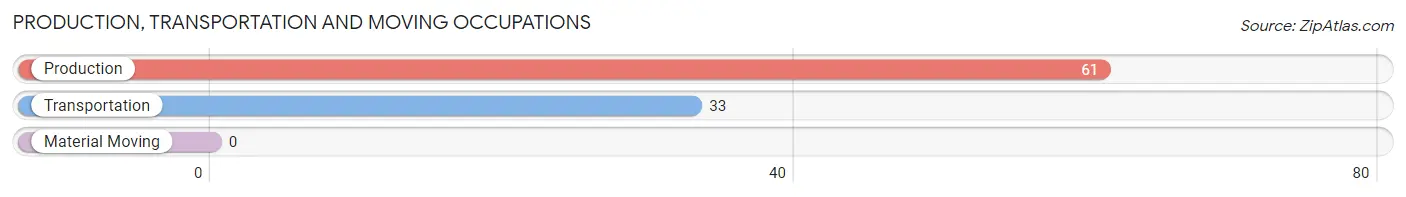
Production, Transportation and Moving Occupations by Sex
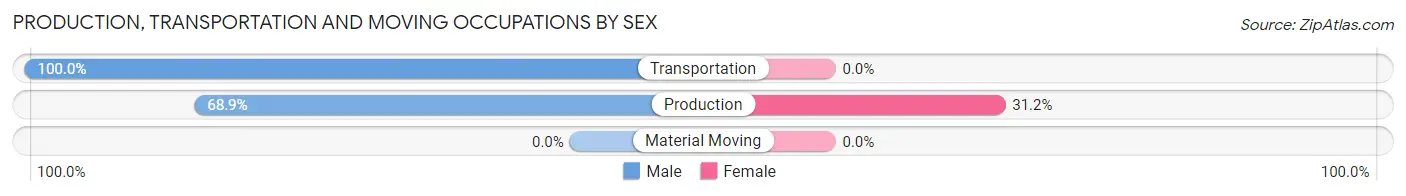
| Occupation | Male | Female |
| Production | 42 (68.9%) | 19 (31.1%) |
| Transportation | 33 (100.0%) | 0 (0.0%) |
| Material Moving | 0 (0.0%) | 0 (0.0%) |
| Total (Category) | 75 (79.8%) | 19 (20.2%) |
| Total (Overall) | 439 (61.7%) | 272 (38.3%) |
Employment Industries by Sex in Clintondale
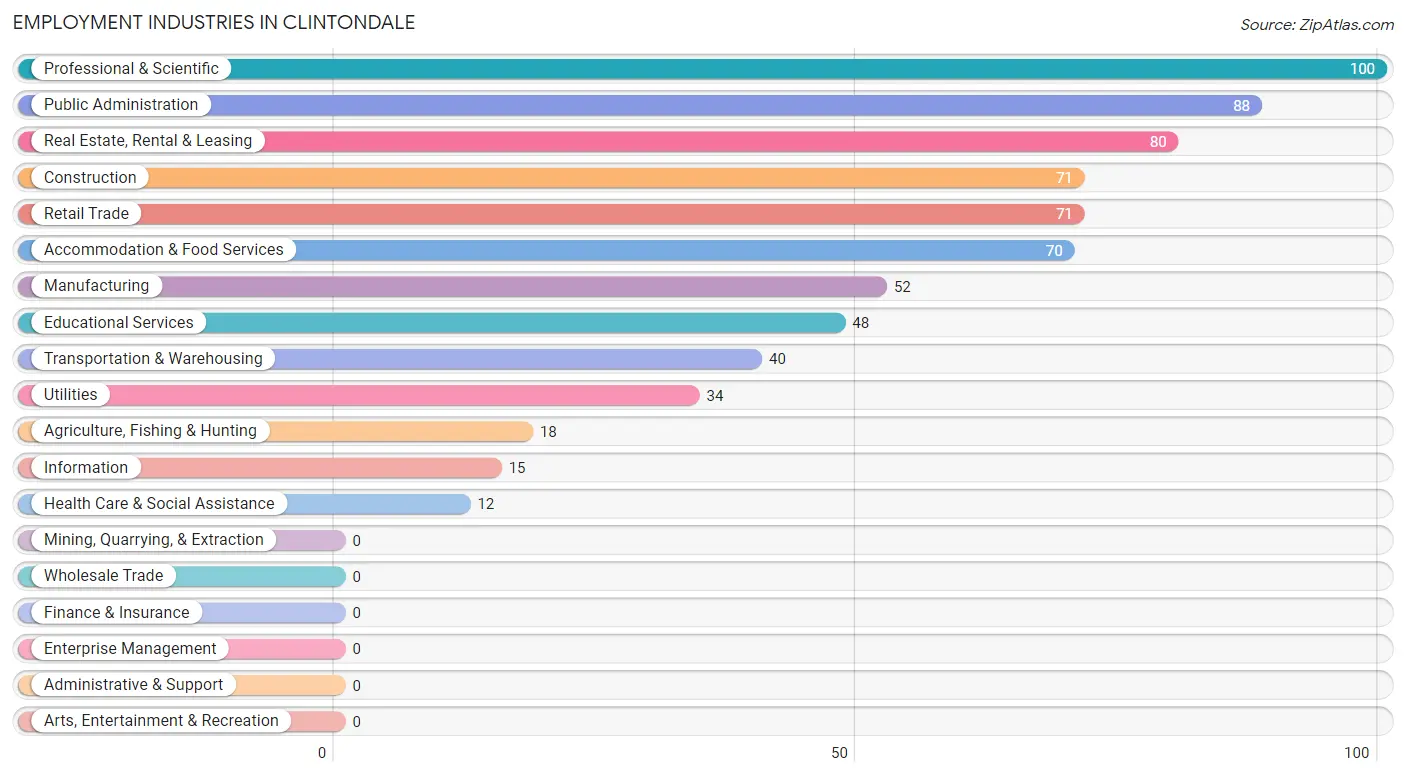
Employment Industries in Clintondale
The major employment industries in Clintondale include Professional & Scientific (100 | 14.1%), Public Administration (88 | 12.4%), Real Estate, Rental & Leasing (80 | 11.3%), Construction (71 | 10.0%), and Retail Trade (71 | 10.0%).
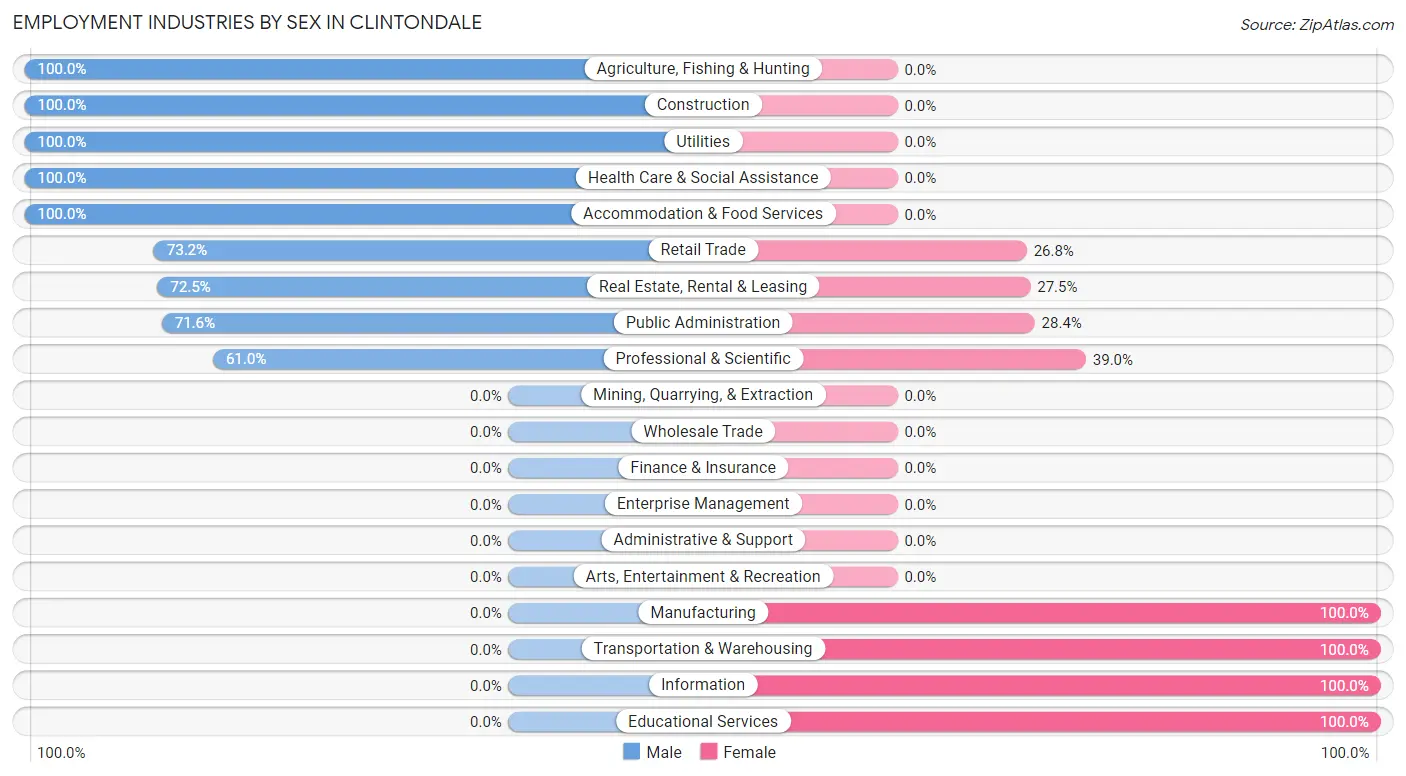
Employment Industries by Sex in Clintondale
The Clintondale industries that see more men than women are Agriculture, Fishing & Hunting (100.0%), Construction (100.0%), and Utilities (100.0%), whereas the industries that tend to have a higher number of women are Manufacturing (100.0%), Transportation & Warehousing (100.0%), and Information (100.0%).
| Industry | Male | Female |
| Agriculture, Fishing & Hunting | 18 (100.0%) | 0 (0.0%) |
| Mining, Quarrying, & Extraction | 0 (0.0%) | 0 (0.0%) |
| Construction | 71 (100.0%) | 0 (0.0%) |
| Manufacturing | 0 (0.0%) | 52 (100.0%) |
| Wholesale Trade | 0 (0.0%) | 0 (0.0%) |
| Retail Trade | 52 (73.2%) | 19 (26.8%) |
| Transportation & Warehousing | 0 (0.0%) | 40 (100.0%) |
| Utilities | 34 (100.0%) | 0 (0.0%) |
| Information | 0 (0.0%) | 15 (100.0%) |
| Finance & Insurance | 0 (0.0%) | 0 (0.0%) |
| Real Estate, Rental & Leasing | 58 (72.5%) | 22 (27.5%) |
| Professional & Scientific | 61 (61.0%) | 39 (39.0%) |
| Enterprise Management | 0 (0.0%) | 0 (0.0%) |
| Administrative & Support | 0 (0.0%) | 0 (0.0%) |
| Educational Services | 0 (0.0%) | 48 (100.0%) |
| Health Care & Social Assistance | 12 (100.0%) | 0 (0.0%) |
| Arts, Entertainment & Recreation | 0 (0.0%) | 0 (0.0%) |
| Accommodation & Food Services | 70 (100.0%) | 0 (0.0%) |
| Public Administration | 63 (71.6%) | 25 (28.4%) |
| Total | 439 (61.7%) | 272 (38.3%) |
Education in Clintondale
School Enrollment in Clintondale
The most common levels of schooling among the 231 students in Clintondale are elementary school (109 | 47.2%), middle school (41 | 17.7%), and college / undergraduate (29 | 12.6%).
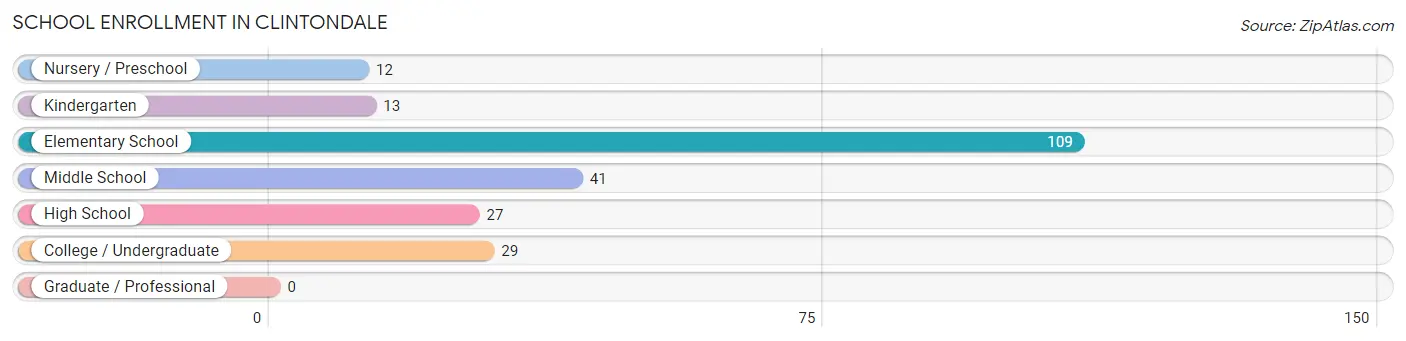
| School Level | # Students | % Students |
| Nursery / Preschool | 12 | 5.2% |
| Kindergarten | 13 | 5.6% |
| Elementary School | 109 | 47.2% |
| Middle School | 41 | 17.7% |
| High School | 27 | 11.7% |
| College / Undergraduate | 29 | 12.6% |
| Graduate / Professional | 0 | 0.0% |
| Total | 231 | 100.0% |
School Enrollment by Age by Funding Source in Clintondale
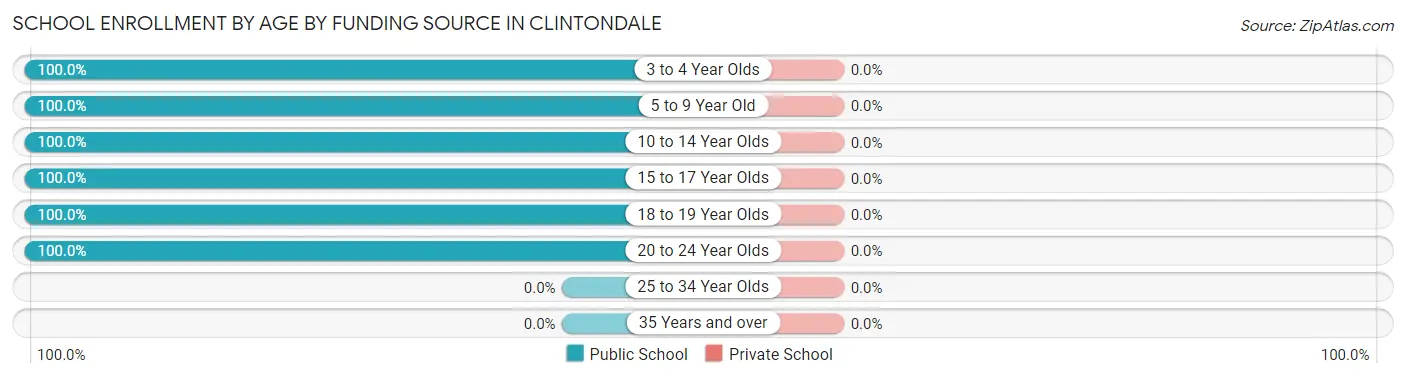
| Age Bracket | Public School | Private School |
| 3 to 4 Year Olds | 12 (100.0%) | 0 (0.0%) |
| 5 to 9 Year Old | 122 (100.0%) | 0 (0.0%) |
| 10 to 14 Year Olds | 41 (100.0%) | 0 (0.0%) |
| 15 to 17 Year Olds | 27 (100.0%) | 0 (0.0%) |
| 18 to 19 Year Olds | 18 (100.0%) | 0 (0.0%) |
| 20 to 24 Year Olds | 11 (100.0%) | 0 (0.0%) |
| 25 to 34 Year Olds | 0 (0.0%) | 0 (0.0%) |
| 35 Years and over | 0 (0.0%) | 0 (0.0%) |
| Total | 231 (100.0%) | 0 (0.0%) |
Educational Attainment by Field of Study in Clintondale
Business (142 | 35.3%), literature & languages (75 | 18.7%), bio, nature & agricultural (40 | 10.0%), communications (40 | 10.0%), and liberal arts & history (36 | 9.0%) are the most common fields of study among 402 individuals in Clintondale who have obtained a bachelor's degree or higher.
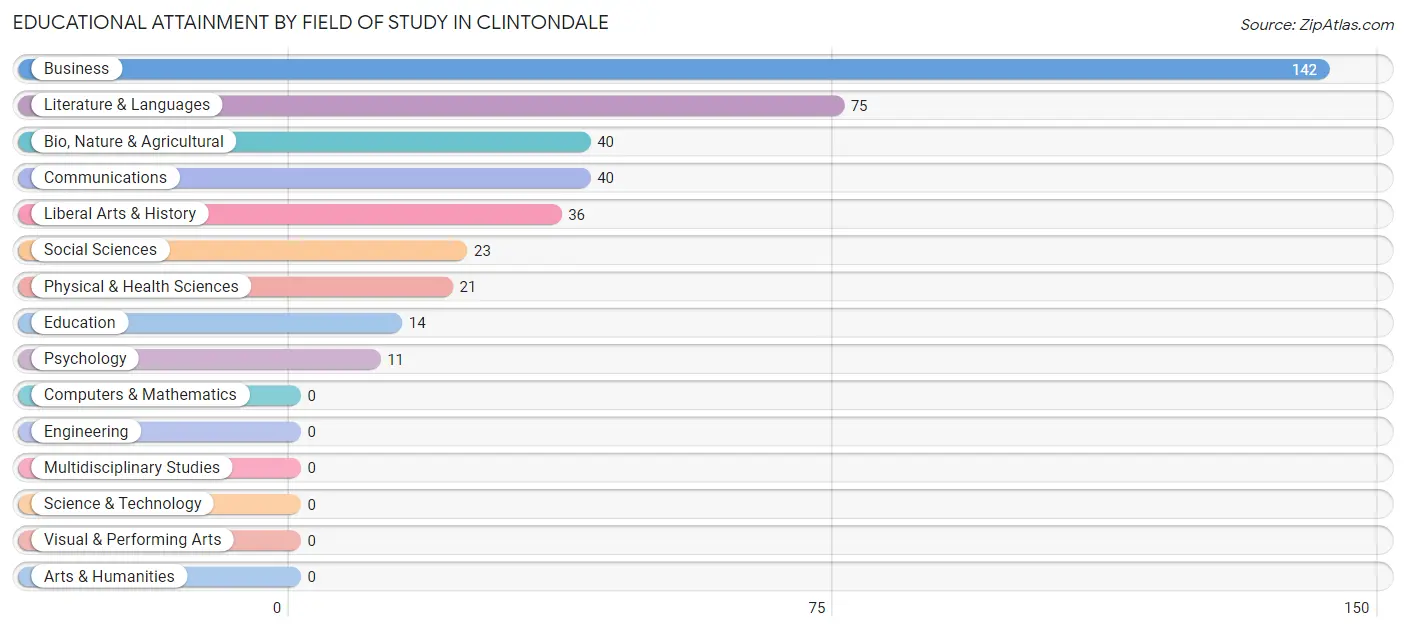
| Field of Study | # Graduates | % Graduates |
| Computers & Mathematics | 0 | 0.0% |
| Bio, Nature & Agricultural | 40 | 10.0% |
| Physical & Health Sciences | 21 | 5.2% |
| Psychology | 11 | 2.7% |
| Social Sciences | 23 | 5.7% |
| Engineering | 0 | 0.0% |
| Multidisciplinary Studies | 0 | 0.0% |
| Science & Technology | 0 | 0.0% |
| Business | 142 | 35.3% |
| Education | 14 | 3.5% |
| Literature & Languages | 75 | 18.7% |
| Liberal Arts & History | 36 | 9.0% |
| Visual & Performing Arts | 0 | 0.0% |
| Communications | 40 | 10.0% |
| Arts & Humanities | 0 | 0.0% |
| Total | 402 | 100.0% |
Transportation & Commute in Clintondale
Vehicle Availability by Sex in Clintondale
The most prevalent vehicle ownership categories in Clintondale are males with 2 vehicles (175, accounting for 41.9%) and females with 2 vehicles (83, making up 64.3%).
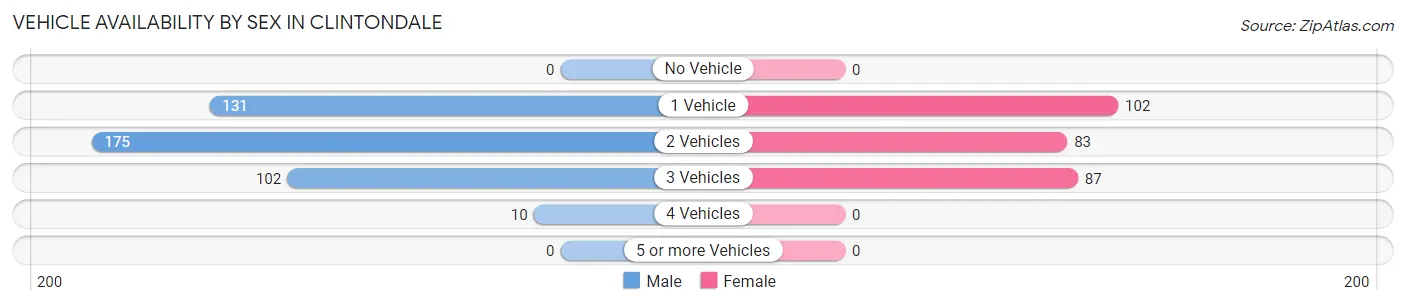
| Vehicles Available | Male | Female |
| No Vehicle | 0 (0.0%) | 0 (0.0%) |
| 1 Vehicle | 131 (31.3%) | 102 (37.5%) |
| 2 Vehicles | 175 (41.9%) | 83 (30.5%) |
| 3 Vehicles | 102 (24.4%) | 87 (32.0%) |
| 4 Vehicles | 10 (2.4%) | 0 (0.0%) |
| 5 or more Vehicles | 0 (0.0%) | 0 (0.0%) |
| Total | 418 (100.0%) | 272 (100.0%) |
Commute Time in Clintondale
The most frequently occuring commute durations in Clintondale are 90 or more minutes (117 commuters, 18.7%), 15 to 19 minutes (99 commuters, 15.8%), and 30 to 34 minutes (72 commuters, 11.5%).
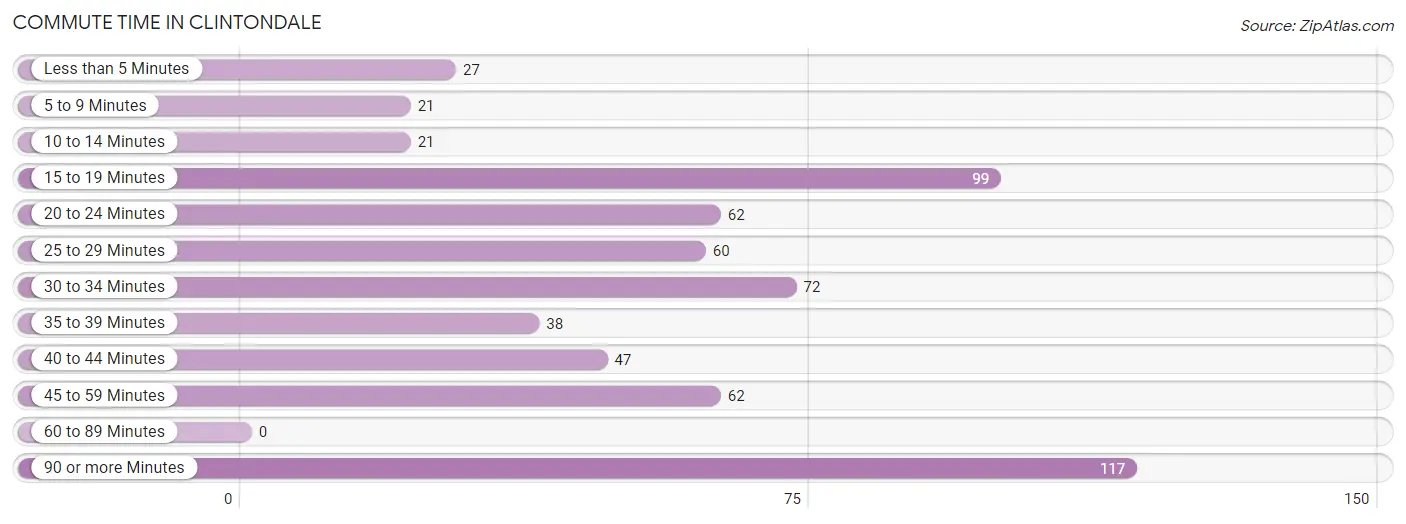
| Commute Time | # Commuters | % Commuters |
| Less than 5 Minutes | 27 | 4.3% |
| 5 to 9 Minutes | 21 | 3.4% |
| 10 to 14 Minutes | 21 | 3.4% |
| 15 to 19 Minutes | 99 | 15.8% |
| 20 to 24 Minutes | 62 | 9.9% |
| 25 to 29 Minutes | 60 | 9.6% |
| 30 to 34 Minutes | 72 | 11.5% |
| 35 to 39 Minutes | 38 | 6.1% |
| 40 to 44 Minutes | 47 | 7.5% |
| 45 to 59 Minutes | 62 | 9.9% |
| 60 to 89 Minutes | 0 | 0.0% |
| 90 or more Minutes | 117 | 18.7% |
Commute Time by Sex in Clintondale
The most common commute times in Clintondale are 90 or more minutes (73 commuters, 17.8%) for males and 40 to 44 minutes (47 commuters, 21.7%) for females.
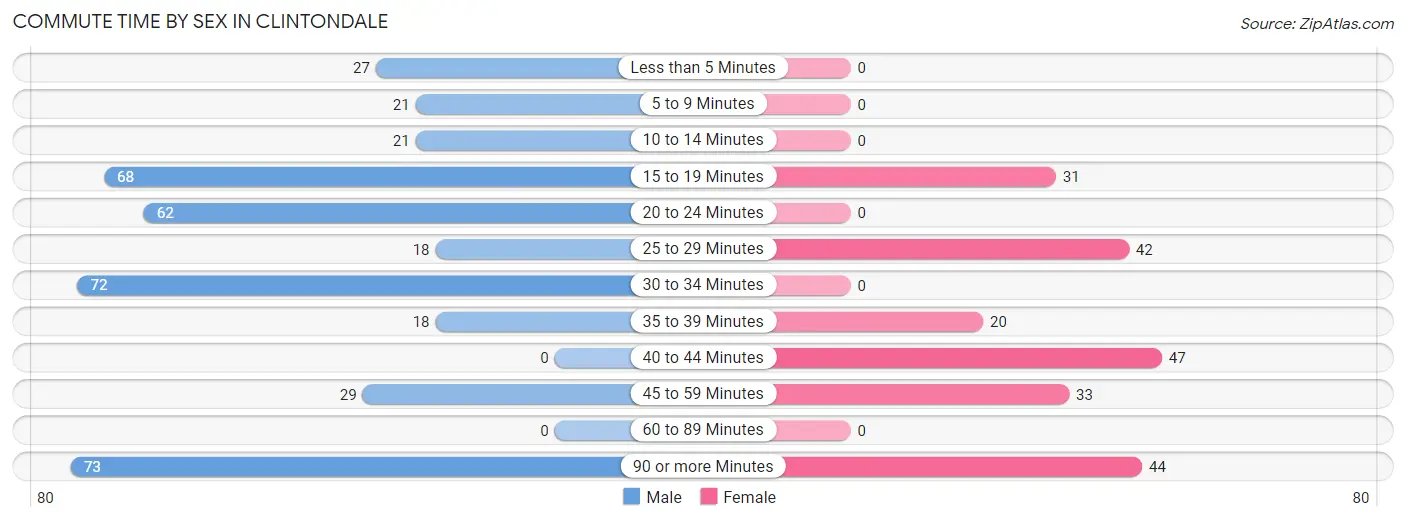
| Commute Time | Male | Female |
| Less than 5 Minutes | 27 (6.6%) | 0 (0.0%) |
| 5 to 9 Minutes | 21 (5.1%) | 0 (0.0%) |
| 10 to 14 Minutes | 21 (5.1%) | 0 (0.0%) |
| 15 to 19 Minutes | 68 (16.6%) | 31 (14.3%) |
| 20 to 24 Minutes | 62 (15.2%) | 0 (0.0%) |
| 25 to 29 Minutes | 18 (4.4%) | 42 (19.4%) |
| 30 to 34 Minutes | 72 (17.6%) | 0 (0.0%) |
| 35 to 39 Minutes | 18 (4.4%) | 20 (9.2%) |
| 40 to 44 Minutes | 0 (0.0%) | 47 (21.7%) |
| 45 to 59 Minutes | 29 (7.1%) | 33 (15.2%) |
| 60 to 89 Minutes | 0 (0.0%) | 0 (0.0%) |
| 90 or more Minutes | 73 (17.8%) | 44 (20.3%) |
Time of Departure to Work by Sex in Clintondale
The most frequent times of departure to work in Clintondale are 6:30 AM to 6:59 AM (126, 30.8%) for males and 8:00 AM to 8:29 AM (84, 38.7%) for females.
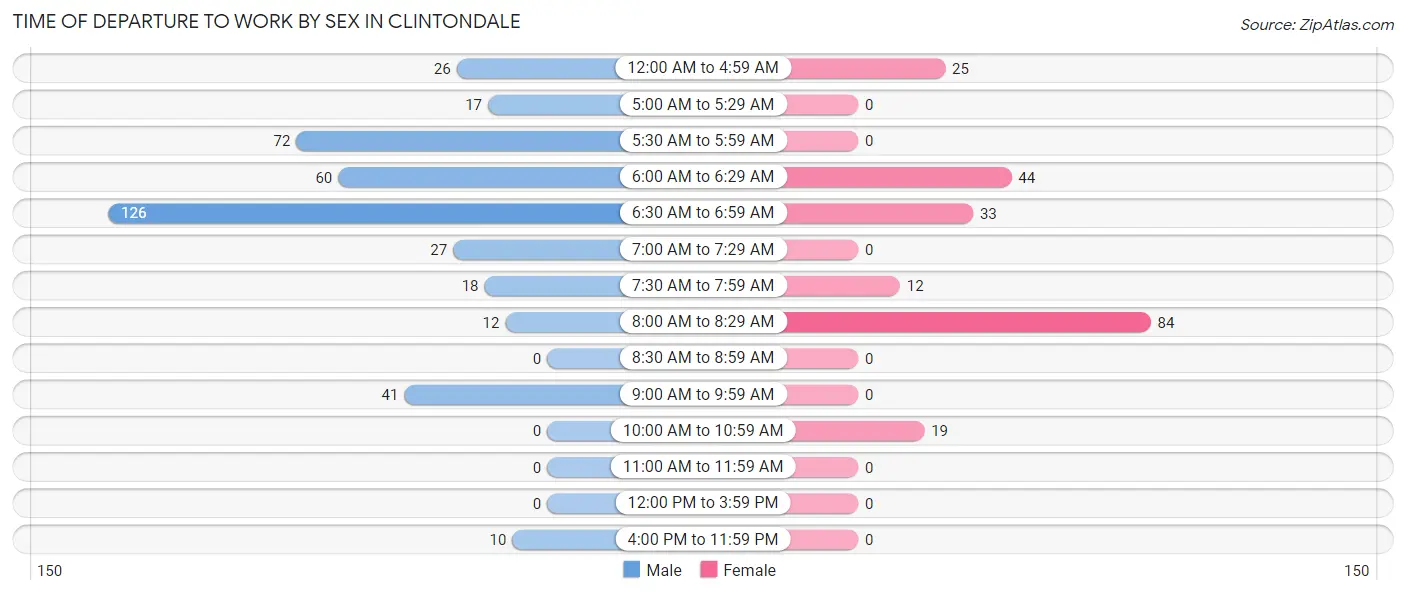
| Time of Departure | Male | Female |
| 12:00 AM to 4:59 AM | 26 (6.4%) | 25 (11.5%) |
| 5:00 AM to 5:29 AM | 17 (4.2%) | 0 (0.0%) |
| 5:30 AM to 5:59 AM | 72 (17.6%) | 0 (0.0%) |
| 6:00 AM to 6:29 AM | 60 (14.7%) | 44 (20.3%) |
| 6:30 AM to 6:59 AM | 126 (30.8%) | 33 (15.2%) |
| 7:00 AM to 7:29 AM | 27 (6.6%) | 0 (0.0%) |
| 7:30 AM to 7:59 AM | 18 (4.4%) | 12 (5.5%) |
| 8:00 AM to 8:29 AM | 12 (2.9%) | 84 (38.7%) |
| 8:30 AM to 8:59 AM | 0 (0.0%) | 0 (0.0%) |
| 9:00 AM to 9:59 AM | 41 (10.0%) | 0 (0.0%) |
| 10:00 AM to 10:59 AM | 0 (0.0%) | 19 (8.8%) |
| 11:00 AM to 11:59 AM | 0 (0.0%) | 0 (0.0%) |
| 12:00 PM to 3:59 PM | 0 (0.0%) | 0 (0.0%) |
| 4:00 PM to 11:59 PM | 10 (2.4%) | 0 (0.0%) |
| Total | 409 (100.0%) | 217 (100.0%) |
Housing Occupancy in Clintondale
Occupancy by Ownership in Clintondale
Of the total 724 dwellings in Clintondale, owner-occupied units account for 420 (58.0%), while renter-occupied units make up 304 (42.0%).
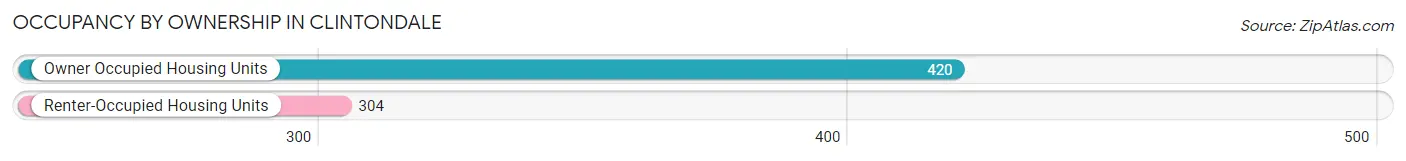
| Occupancy | # Housing Units | % Housing Units |
| Owner Occupied Housing Units | 420 | 58.0% |
| Renter-Occupied Housing Units | 304 | 42.0% |
| Total Occupied Housing Units | 724 | 100.0% |
Occupancy by Household Size in Clintondale
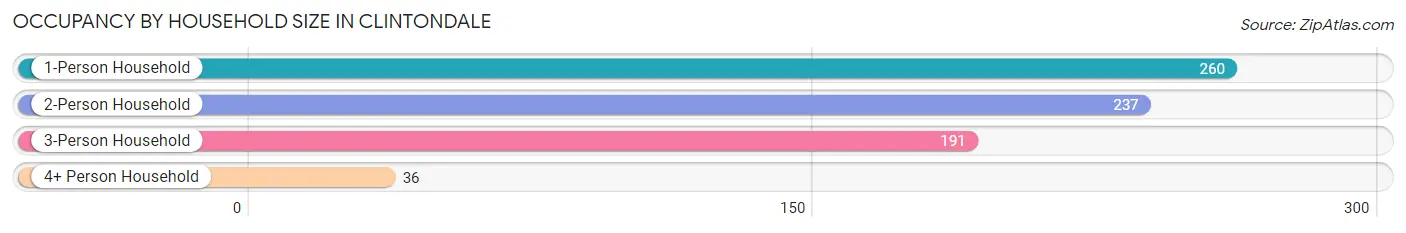
| Household Size | # Housing Units | % Housing Units |
| 1-Person Household | 260 | 35.9% |
| 2-Person Household | 237 | 32.7% |
| 3-Person Household | 191 | 26.4% |
| 4+ Person Household | 36 | 5.0% |
| Total Housing Units | 724 | 100.0% |
Occupancy by Ownership by Household Size in Clintondale
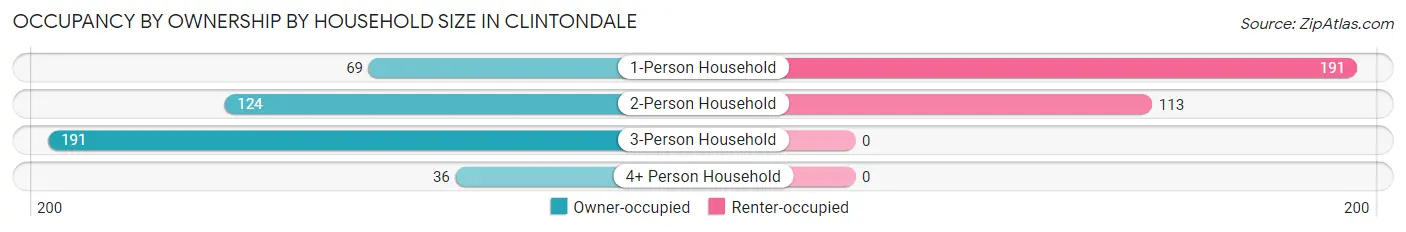
| Household Size | Owner-occupied | Renter-occupied |
| 1-Person Household | 69 (26.5%) | 191 (73.5%) |
| 2-Person Household | 124 (52.3%) | 113 (47.7%) |
| 3-Person Household | 191 (100.0%) | 0 (0.0%) |
| 4+ Person Household | 36 (100.0%) | 0 (0.0%) |
| Total Housing Units | 420 (58.0%) | 304 (42.0%) |
Occupancy by Educational Attainment in Clintondale
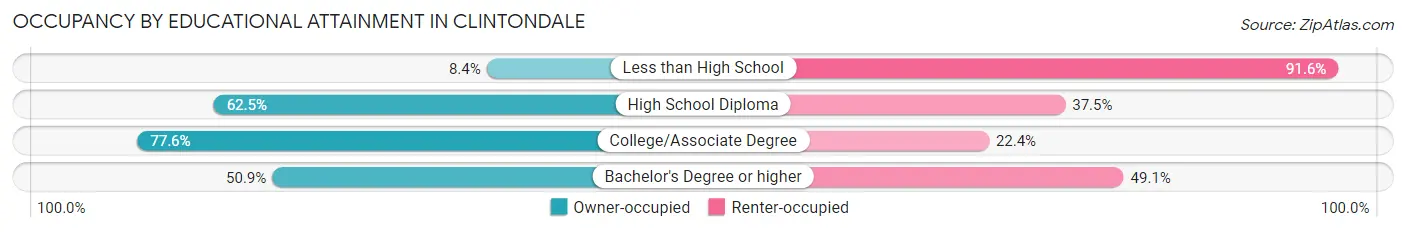
| Household Size | Owner-occupied | Renter-occupied |
| Less than High School | 9 (8.4%) | 98 (91.6%) |
| High School Diploma | 45 (62.5%) | 27 (37.5%) |
| College/Associate Degree | 257 (77.6%) | 74 (22.4%) |
| Bachelor's Degree or higher | 109 (50.9%) | 105 (49.1%) |
Occupancy by Age of Householder in Clintondale
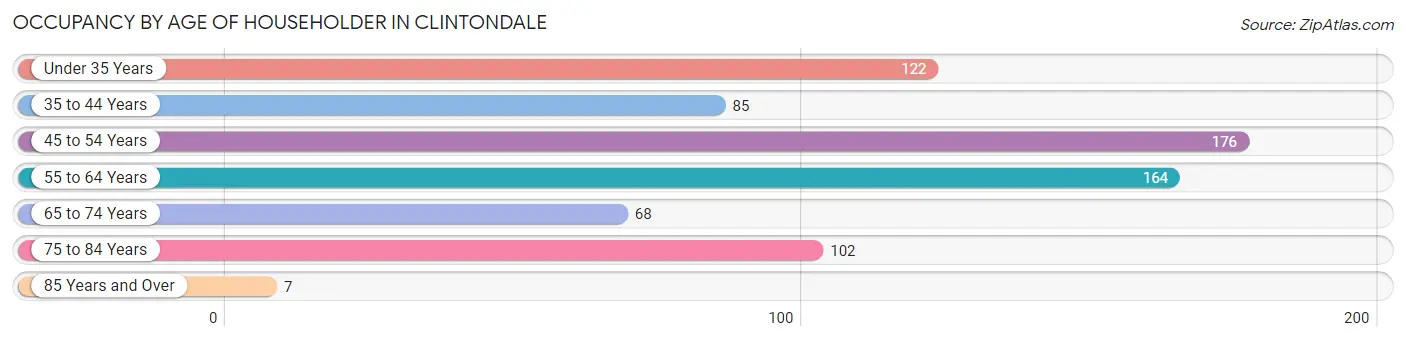
| Age Bracket | # Households | % Households |
| Under 35 Years | 122 | 16.9% |
| 35 to 44 Years | 85 | 11.7% |
| 45 to 54 Years | 176 | 24.3% |
| 55 to 64 Years | 164 | 22.7% |
| 65 to 74 Years | 68 | 9.4% |
| 75 to 84 Years | 102 | 14.1% |
| 85 Years and Over | 7 | 1.0% |
| Total | 724 | 100.0% |
Housing Finances in Clintondale
Median Income by Occupancy in Clintondale
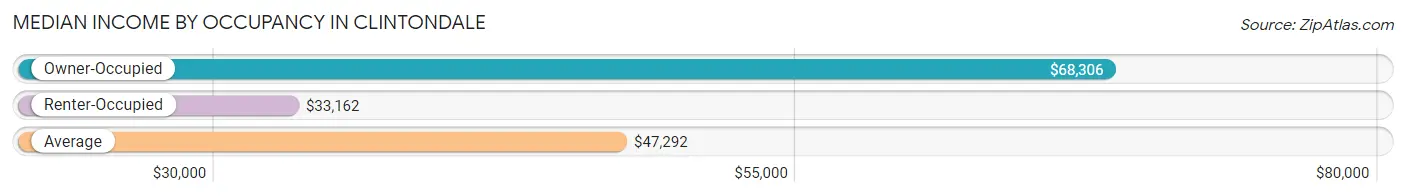
| Occupancy Type | # Households | Median Income |
| Owner-Occupied | 420 (58.0%) | $68,306 |
| Renter-Occupied | 304 (42.0%) | $33,162 |
| Average | 724 (100.0%) | $47,292 |
Occupancy by Householder Income Bracket in Clintondale
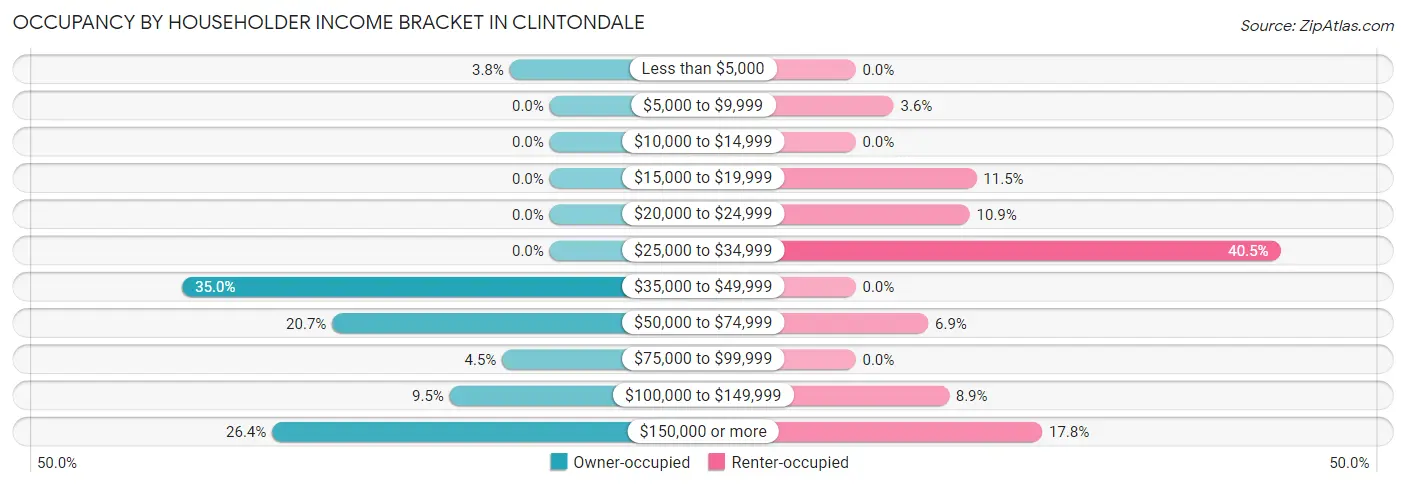
| Income Bracket | Owner-occupied | Renter-occupied |
| Less than $5,000 | 16 (3.8%) | 0 (0.0%) |
| $5,000 to $9,999 | 0 (0.0%) | 11 (3.6%) |
| $10,000 to $14,999 | 0 (0.0%) | 0 (0.0%) |
| $15,000 to $19,999 | 0 (0.0%) | 35 (11.5%) |
| $20,000 to $24,999 | 0 (0.0%) | 33 (10.9%) |
| $25,000 to $34,999 | 0 (0.0%) | 123 (40.5%) |
| $35,000 to $49,999 | 147 (35.0%) | 0 (0.0%) |
| $50,000 to $74,999 | 87 (20.7%) | 21 (6.9%) |
| $75,000 to $99,999 | 19 (4.5%) | 0 (0.0%) |
| $100,000 to $149,999 | 40 (9.5%) | 27 (8.9%) |
| $150,000 or more | 111 (26.4%) | 54 (17.8%) |
| Total | 420 (100.0%) | 304 (100.0%) |
Monthly Housing Cost Tiers in Clintondale
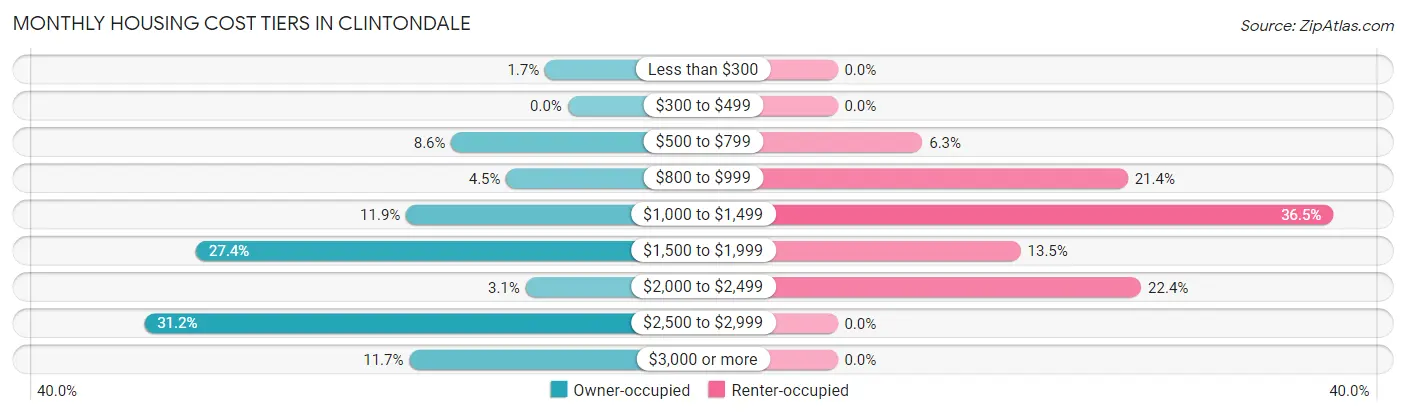
| Monthly Cost | Owner-occupied | Renter-occupied |
| Less than $300 | 7 (1.7%) | 0 (0.0%) |
| $300 to $499 | 0 (0.0%) | 0 (0.0%) |
| $500 to $799 | 36 (8.6%) | 19 (6.2%) |
| $800 to $999 | 19 (4.5%) | 65 (21.4%) |
| $1,000 to $1,499 | 50 (11.9%) | 111 (36.5%) |
| $1,500 to $1,999 | 115 (27.4%) | 41 (13.5%) |
| $2,000 to $2,499 | 13 (3.1%) | 68 (22.4%) |
| $2,500 to $2,999 | 131 (31.2%) | 0 (0.0%) |
| $3,000 or more | 49 (11.7%) | 0 (0.0%) |
| Total | 420 (100.0%) | 304 (100.0%) |
Physical Housing Characteristics in Clintondale
Housing Structures in Clintondale
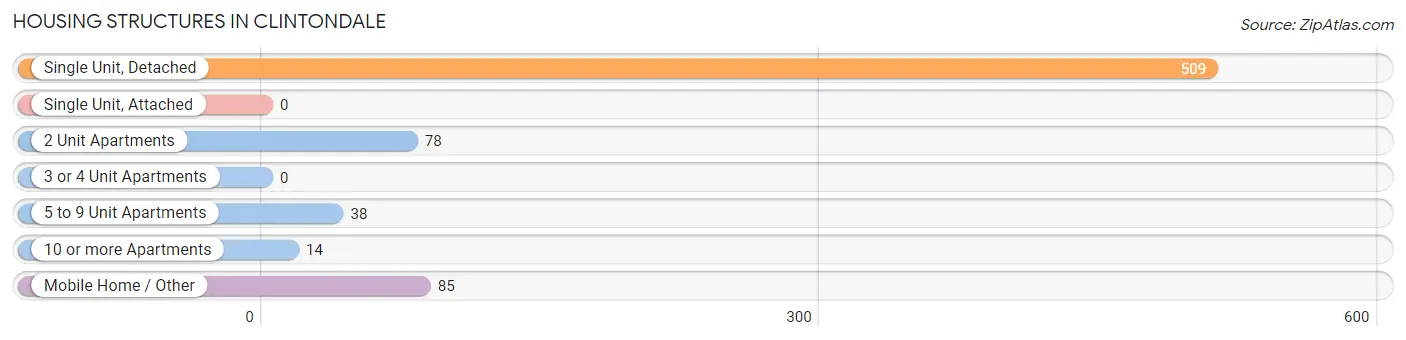
| Structure Type | # Housing Units | % Housing Units |
| Single Unit, Detached | 509 | 70.3% |
| Single Unit, Attached | 0 | 0.0% |
| 2 Unit Apartments | 78 | 10.8% |
| 3 or 4 Unit Apartments | 0 | 0.0% |
| 5 to 9 Unit Apartments | 38 | 5.2% |
| 10 or more Apartments | 14 | 1.9% |
| Mobile Home / Other | 85 | 11.7% |
| Total | 724 | 100.0% |
Housing Structures by Occupancy in Clintondale
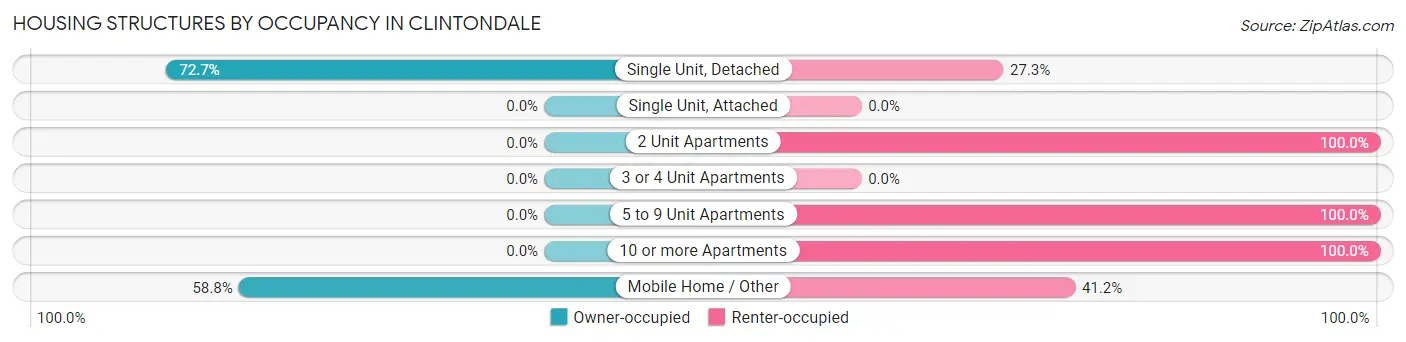
| Structure Type | Owner-occupied | Renter-occupied |
| Single Unit, Detached | 370 (72.7%) | 139 (27.3%) |
| Single Unit, Attached | 0 (0.0%) | 0 (0.0%) |
| 2 Unit Apartments | 0 (0.0%) | 78 (100.0%) |
| 3 or 4 Unit Apartments | 0 (0.0%) | 0 (0.0%) |
| 5 to 9 Unit Apartments | 0 (0.0%) | 38 (100.0%) |
| 10 or more Apartments | 0 (0.0%) | 14 (100.0%) |
| Mobile Home / Other | 50 (58.8%) | 35 (41.2%) |
| Total | 420 (58.0%) | 304 (42.0%) |
Housing Structures by Number of Rooms in Clintondale
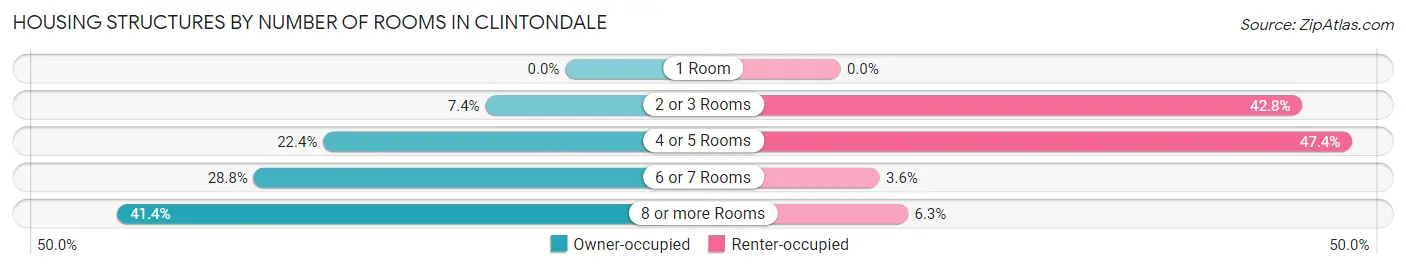
| Number of Rooms | Owner-occupied | Renter-occupied |
| 1 Room | 0 (0.0%) | 0 (0.0%) |
| 2 or 3 Rooms | 31 (7.4%) | 130 (42.8%) |
| 4 or 5 Rooms | 94 (22.4%) | 144 (47.4%) |
| 6 or 7 Rooms | 121 (28.8%) | 11 (3.6%) |
| 8 or more Rooms | 174 (41.4%) | 19 (6.2%) |
| Total | 420 (100.0%) | 304 (100.0%) |
Housing Structure by Heating Type in Clintondale
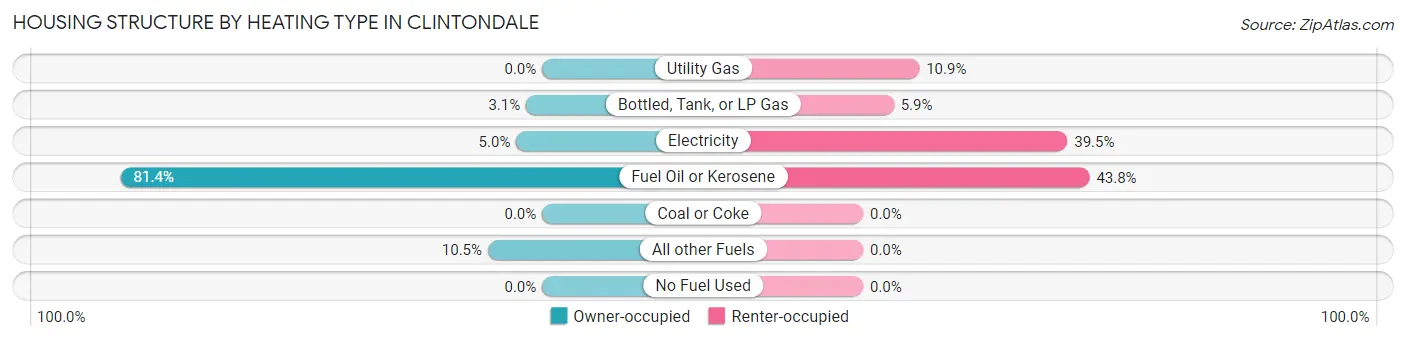
| Heating Type | Owner-occupied | Renter-occupied |
| Utility Gas | 0 (0.0%) | 33 (10.9%) |
| Bottled, Tank, or LP Gas | 13 (3.1%) | 18 (5.9%) |
| Electricity | 21 (5.0%) | 120 (39.5%) |
| Fuel Oil or Kerosene | 342 (81.4%) | 133 (43.8%) |
| Coal or Coke | 0 (0.0%) | 0 (0.0%) |
| All other Fuels | 44 (10.5%) | 0 (0.0%) |
| No Fuel Used | 0 (0.0%) | 0 (0.0%) |
| Total | 420 (100.0%) | 304 (100.0%) |
Household Vehicle Usage in Clintondale
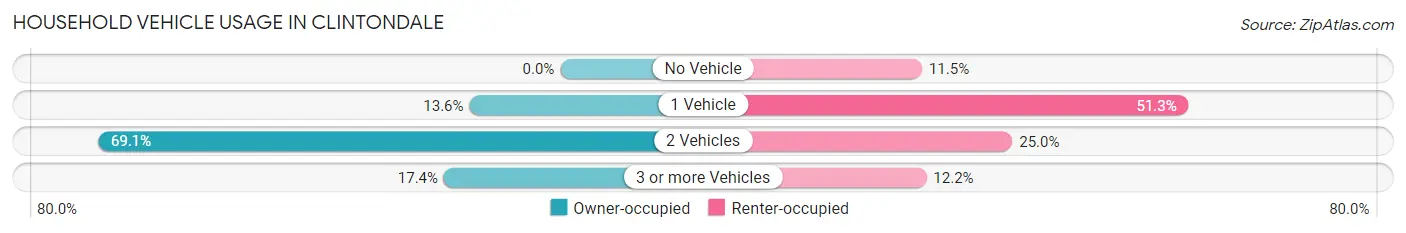
| Vehicles per Household | Owner-occupied | Renter-occupied |
| No Vehicle | 0 (0.0%) | 35 (11.5%) |
| 1 Vehicle | 57 (13.6%) | 156 (51.3%) |
| 2 Vehicles | 290 (69.1%) | 76 (25.0%) |
| 3 or more Vehicles | 73 (17.4%) | 37 (12.2%) |
| Total | 420 (100.0%) | 304 (100.0%) |
Real Estate & Mortgages in Clintondale
Real Estate and Mortgage Overview in Clintondale
| Characteristic | Without Mortgage | With Mortgage |
| Housing Units | 87 | 333 |
| Median Property Value | - | - |
| Median Household Income | - | - |
| Monthly Housing Costs | $803 | $49 |
| Real Estate Taxes | - | - |
Property Value by Mortgage Status in Clintondale
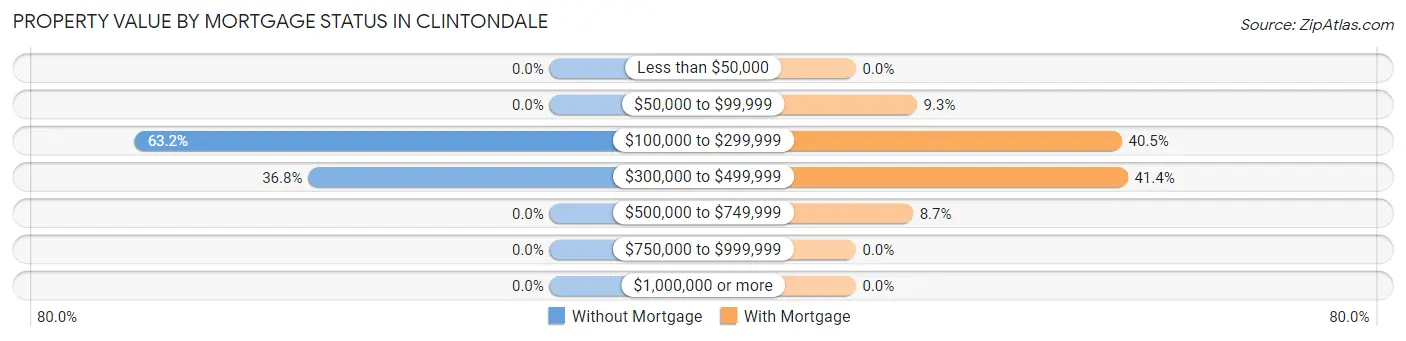
| Property Value | Without Mortgage | With Mortgage |
| Less than $50,000 | 0 (0.0%) | 0 (0.0%) |
| $50,000 to $99,999 | 0 (0.0%) | 31 (9.3%) |
| $100,000 to $299,999 | 55 (63.2%) | 135 (40.5%) |
| $300,000 to $499,999 | 32 (36.8%) | 138 (41.4%) |
| $500,000 to $749,999 | 0 (0.0%) | 29 (8.7%) |
| $750,000 to $999,999 | 0 (0.0%) | 0 (0.0%) |
| $1,000,000 or more | 0 (0.0%) | 0 (0.0%) |
| Total | 87 (100.0%) | 333 (100.0%) |
Household Income by Mortgage Status in Clintondale
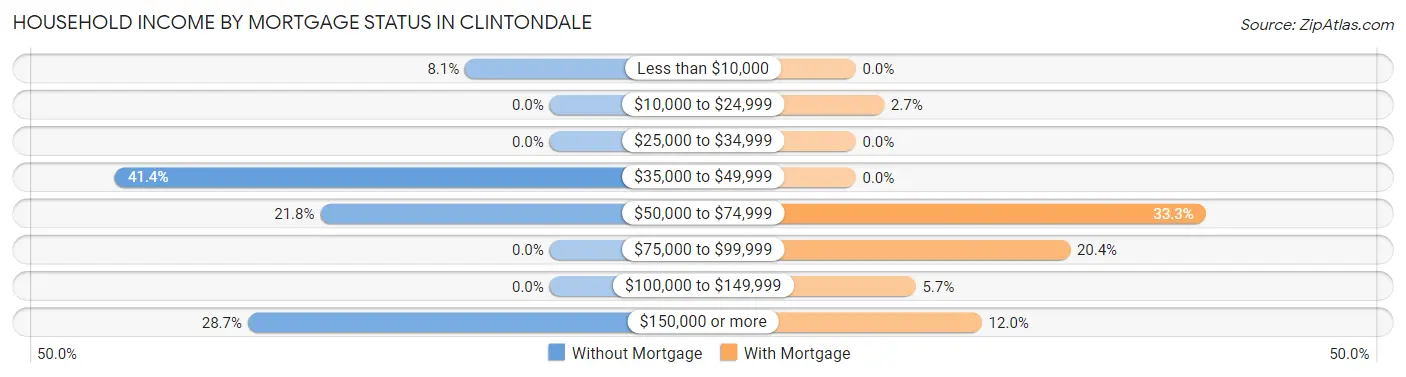
| Household Income | Without Mortgage | With Mortgage |
| Less than $10,000 | 7 (8.1%) | 0 (0.0%) |
| $10,000 to $24,999 | 0 (0.0%) | 9 (2.7%) |
| $25,000 to $34,999 | 0 (0.0%) | 0 (0.0%) |
| $35,000 to $49,999 | 36 (41.4%) | 0 (0.0%) |
| $50,000 to $74,999 | 19 (21.8%) | 111 (33.3%) |
| $75,000 to $99,999 | 0 (0.0%) | 68 (20.4%) |
| $100,000 to $149,999 | 0 (0.0%) | 19 (5.7%) |
| $150,000 or more | 25 (28.7%) | 40 (12.0%) |
| Total | 87 (100.0%) | 333 (100.0%) |
Property Value to Household Income Ratio in Clintondale
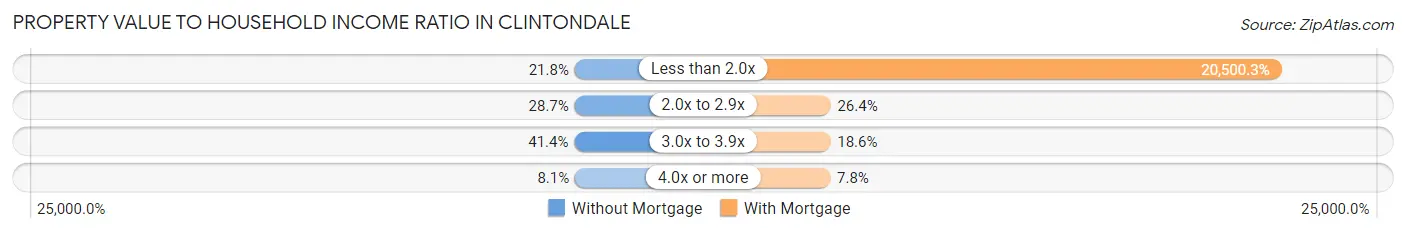
| Value-to-Income Ratio | Without Mortgage | With Mortgage |
| Less than 2.0x | 19 (21.8%) | 68,266 (20,500.3%) |
| 2.0x to 2.9x | 25 (28.7%) | 88 (26.4%) |
| 3.0x to 3.9x | 36 (41.4%) | 62 (18.6%) |
| 4.0x or more | 7 (8.1%) | 26 (7.8%) |
| Total | 87 (100.0%) | 333 (100.0%) |
Real Estate Taxes by Mortgage Status in Clintondale
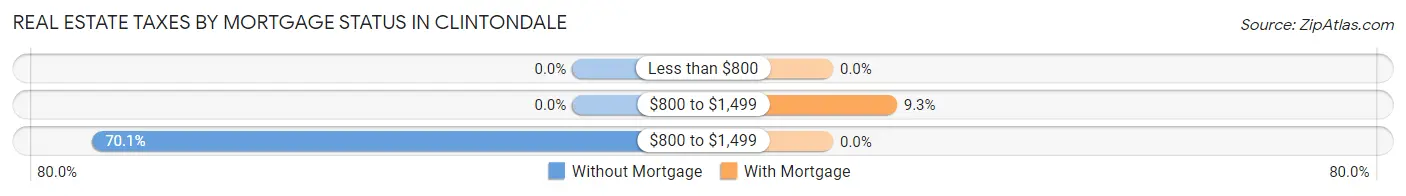
| Property Taxes | Without Mortgage | With Mortgage |
| Less than $800 | 0 (0.0%) | 0 (0.0%) |
| $800 to $1,499 | 0 (0.0%) | 31 (9.3%) |
| $800 to $1,499 | 61 (70.1%) | 0 (0.0%) |
| Total | 87 (100.0%) | 333 (100.0%) |
Health & Disability in Clintondale
Health Insurance Coverage by Age in Clintondale
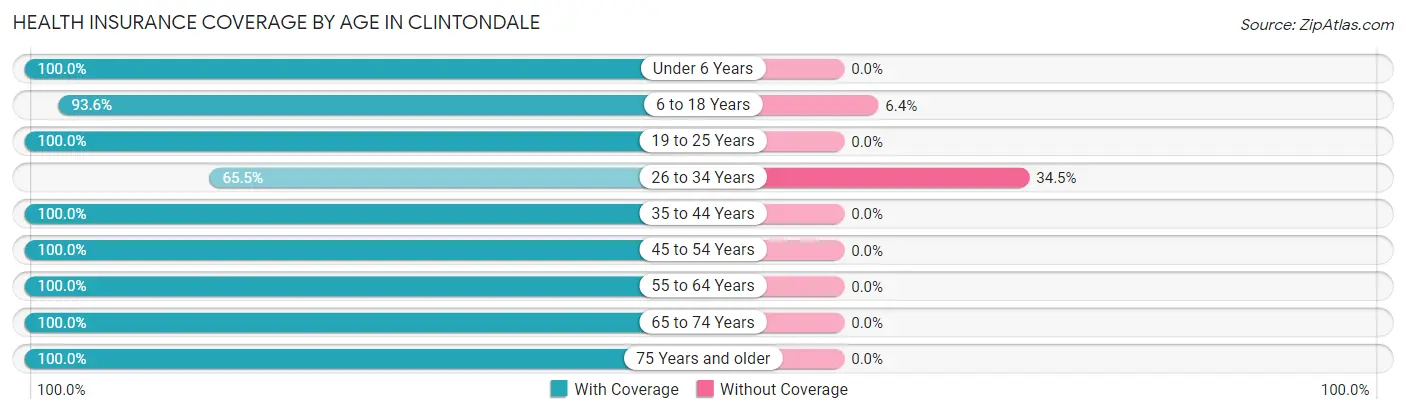
| Age Bracket | With Coverage | Without Coverage |
| Under 6 Years | 39 (100.0%) | 0 (0.0%) |
| 6 to 18 Years | 206 (93.6%) | 14 (6.4%) |
| 19 to 25 Years | 72 (100.0%) | 0 (0.0%) |
| 26 to 34 Years | 93 (65.5%) | 49 (34.5%) |
| 35 to 44 Years | 158 (100.0%) | 0 (0.0%) |
| 45 to 54 Years | 280 (100.0%) | 0 (0.0%) |
| 55 to 64 Years | 290 (100.0%) | 0 (0.0%) |
| 65 to 74 Years | 173 (100.0%) | 0 (0.0%) |
| 75 Years and older | 119 (100.0%) | 0 (0.0%) |
| Total | 1,430 (95.8%) | 63 (4.2%) |
Health Insurance Coverage by Citizenship Status in Clintondale
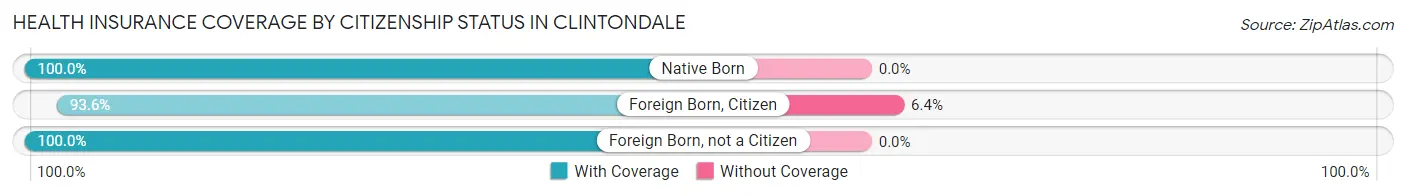
| Citizenship Status | With Coverage | Without Coverage |
| Native Born | 39 (100.0%) | 0 (0.0%) |
| Foreign Born, Citizen | 206 (93.6%) | 14 (6.4%) |
| Foreign Born, not a Citizen | 72 (100.0%) | 0 (0.0%) |
Health Insurance Coverage by Household Income in Clintondale
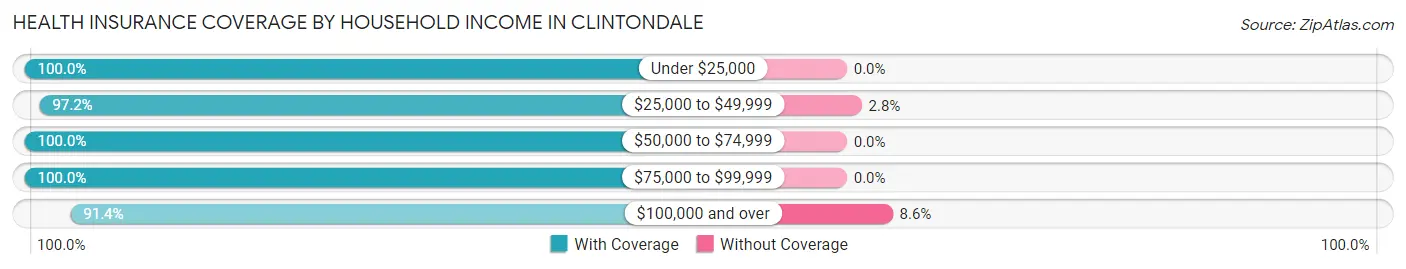
| Household Income | With Coverage | Without Coverage |
| Under $25,000 | 146 (100.0%) | 0 (0.0%) |
| $25,000 to $49,999 | 489 (97.2%) | 14 (2.8%) |
| $50,000 to $74,999 | 177 (100.0%) | 0 (0.0%) |
| $75,000 to $99,999 | 39 (100.0%) | 0 (0.0%) |
| $100,000 and over | 522 (91.4%) | 49 (8.6%) |
Public vs Private Health Insurance Coverage by Age in Clintondale
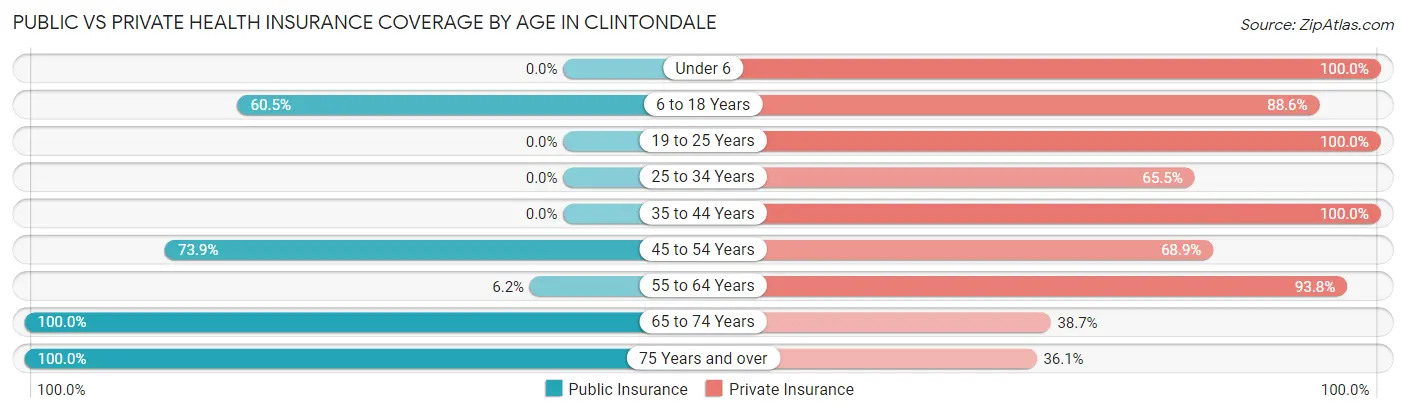
| Age Bracket | Public Insurance | Private Insurance |
| Under 6 | 0 (0.0%) | 39 (100.0%) |
| 6 to 18 Years | 133 (60.5%) | 195 (88.6%) |
| 19 to 25 Years | 0 (0.0%) | 72 (100.0%) |
| 25 to 34 Years | 0 (0.0%) | 93 (65.5%) |
| 35 to 44 Years | 0 (0.0%) | 158 (100.0%) |
| 45 to 54 Years | 207 (73.9%) | 193 (68.9%) |
| 55 to 64 Years | 18 (6.2%) | 272 (93.8%) |
| 65 to 74 Years | 173 (100.0%) | 67 (38.7%) |
| 75 Years and over | 119 (100.0%) | 43 (36.1%) |
| Total | 650 (43.5%) | 1,132 (75.8%) |
Disability Status by Sex by Age in Clintondale
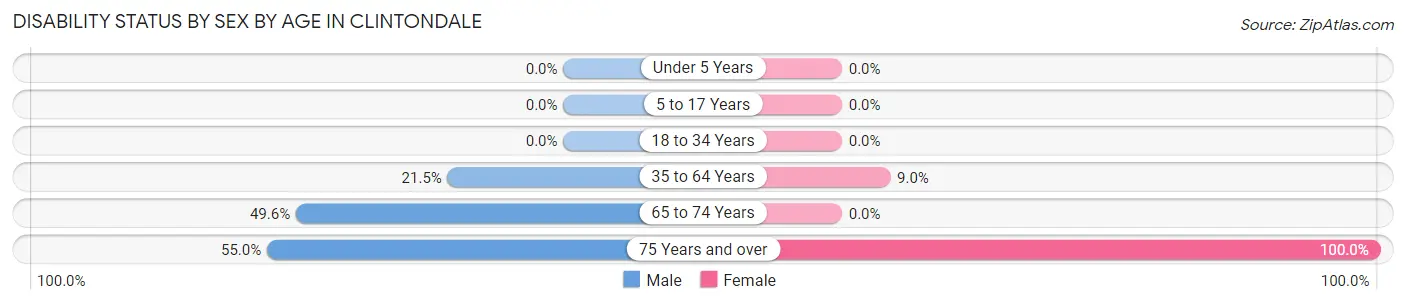
| Age Bracket | Male | Female |
| Under 5 Years | 0 (0.0%) | 0 (0.0%) |
| 5 to 17 Years | 0 (0.0%) | 0 (0.0%) |
| 18 to 34 Years | 0 (0.0%) | 0 (0.0%) |
| 35 to 64 Years | 82 (21.5%) | 31 (9.0%) |
| 65 to 74 Years | 67 (49.6%) | 0 (0.0%) |
| 75 Years and over | 44 (55.0%) | 39 (100.0%) |
Disability Class by Sex by Age in Clintondale
Disability Class: Hearing Difficulty
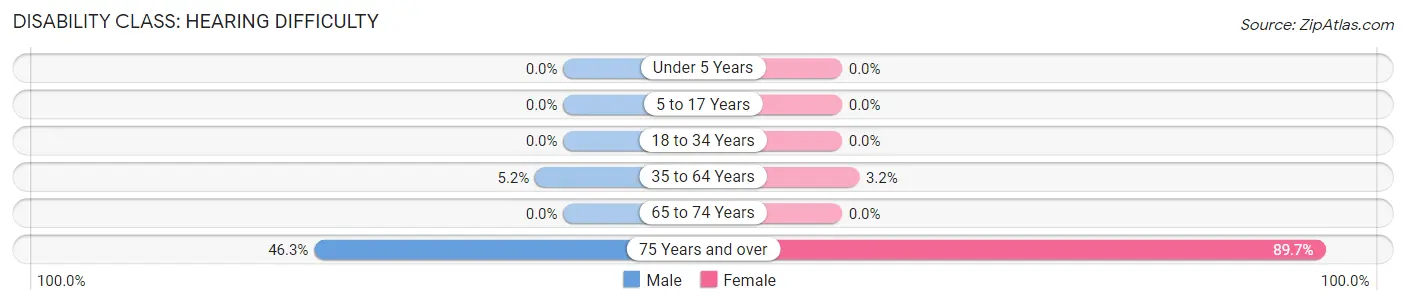
| Age Bracket | Male | Female |
| Under 5 Years | 0 (0.0%) | 0 (0.0%) |
| 5 to 17 Years | 0 (0.0%) | 0 (0.0%) |
| 18 to 34 Years | 0 (0.0%) | 0 (0.0%) |
| 35 to 64 Years | 20 (5.2%) | 11 (3.2%) |
| 65 to 74 Years | 0 (0.0%) | 0 (0.0%) |
| 75 Years and over | 37 (46.3%) | 35 (89.7%) |
Disability Class: Vision Difficulty
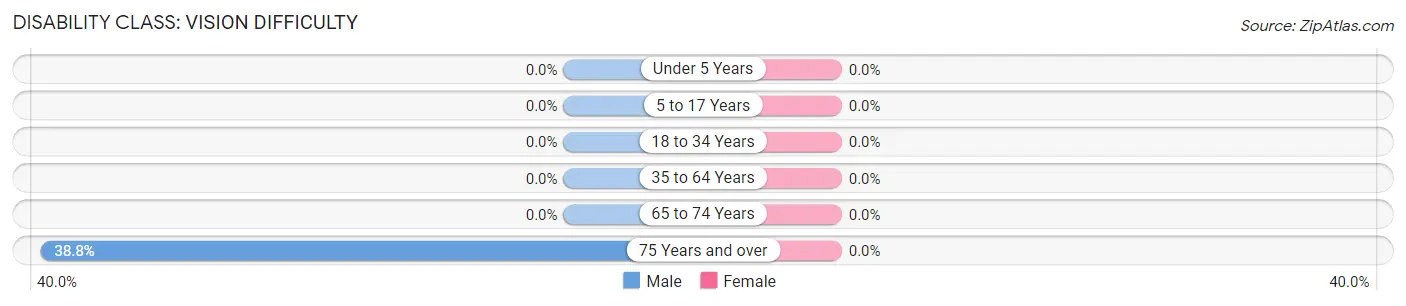
| Age Bracket | Male | Female |
| Under 5 Years | 0 (0.0%) | 0 (0.0%) |
| 5 to 17 Years | 0 (0.0%) | 0 (0.0%) |
| 18 to 34 Years | 0 (0.0%) | 0 (0.0%) |
| 35 to 64 Years | 0 (0.0%) | 0 (0.0%) |
| 65 to 74 Years | 0 (0.0%) | 0 (0.0%) |
| 75 Years and over | 31 (38.8%) | 0 (0.0%) |
Disability Class: Cognitive Difficulty
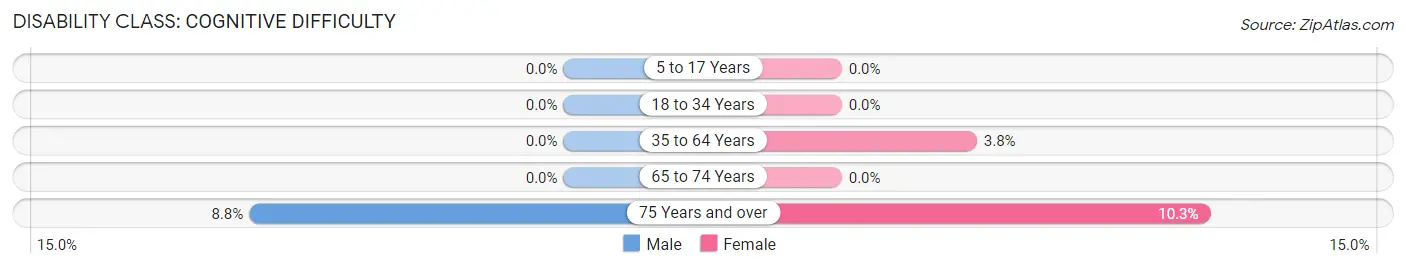
| Age Bracket | Male | Female |
| 5 to 17 Years | 0 (0.0%) | 0 (0.0%) |
| 18 to 34 Years | 0 (0.0%) | 0 (0.0%) |
| 35 to 64 Years | 0 (0.0%) | 13 (3.8%) |
| 65 to 74 Years | 0 (0.0%) | 0 (0.0%) |
| 75 Years and over | 7 (8.7%) | 4 (10.3%) |
Disability Class: Ambulatory Difficulty
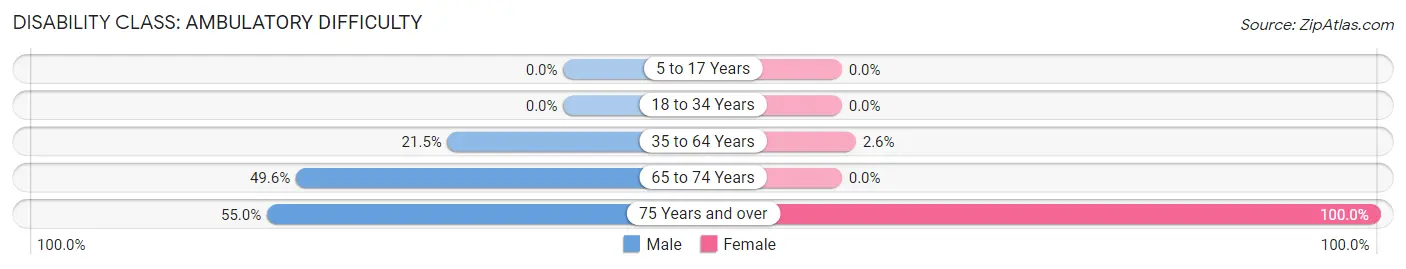
| Age Bracket | Male | Female |
| 5 to 17 Years | 0 (0.0%) | 0 (0.0%) |
| 18 to 34 Years | 0 (0.0%) | 0 (0.0%) |
| 35 to 64 Years | 82 (21.5%) | 9 (2.6%) |
| 65 to 74 Years | 67 (49.6%) | 0 (0.0%) |
| 75 Years and over | 44 (55.0%) | 39 (100.0%) |
Disability Class: Self-Care Difficulty
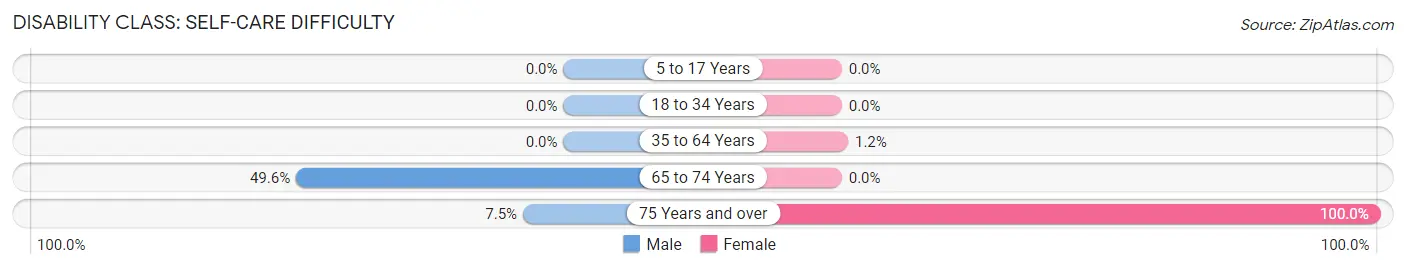
| Age Bracket | Male | Female |
| 5 to 17 Years | 0 (0.0%) | 0 (0.0%) |
| 18 to 34 Years | 0 (0.0%) | 0 (0.0%) |
| 35 to 64 Years | 0 (0.0%) | 4 (1.2%) |
| 65 to 74 Years | 67 (49.6%) | 0 (0.0%) |
| 75 Years and over | 6 (7.5%) | 39 (100.0%) |
Technology Access in Clintondale
Computing Device Access in Clintondale
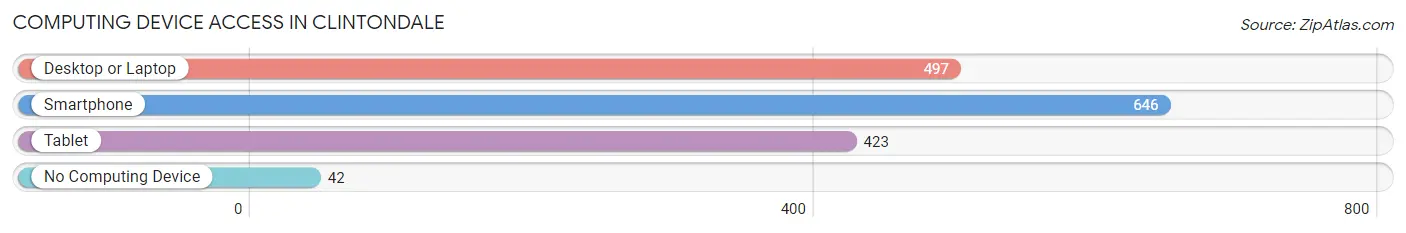
| Device Type | # Households | % Households |
| Desktop or Laptop | 497 | 68.6% |
| Smartphone | 646 | 89.2% |
| Tablet | 423 | 58.4% |
| No Computing Device | 42 | 5.8% |
| Total | 724 | 100.0% |
Internet Access in Clintondale
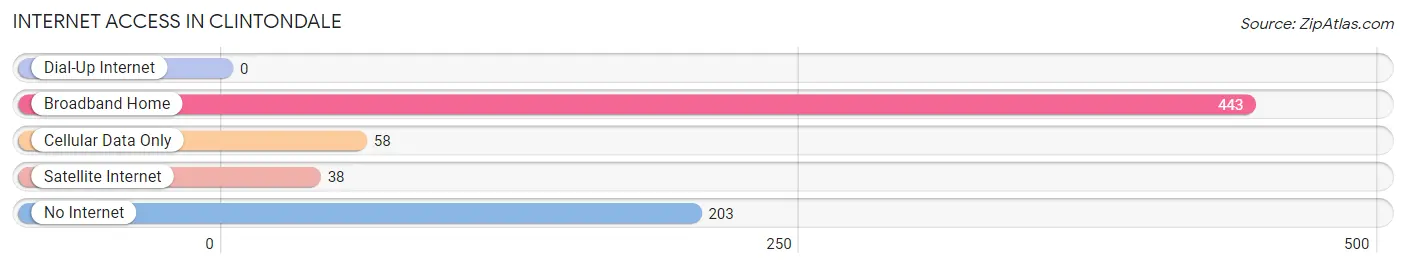
| Internet Type | # Households | % Households |
| Dial-Up Internet | 0 | 0.0% |
| Broadband Home | 443 | 61.2% |
| Cellular Data Only | 58 | 8.0% |
| Satellite Internet | 38 | 5.2% |
| No Internet | 203 | 28.0% |
| Total | 724 | 100.0% |
Clintondale Summary
Clintondale is a hamlet located in the town of Plattekill, Ulster County, New York. It is situated in the Hudson Valley region of the state, approximately 90 miles north of New York City. The hamlet is bordered by the towns of Marlborough, Newburgh, and Shawangunk. The population of Clintondale was 1,845 as of the 2010 census.
History
Clintondale was first settled in the late 1700s by Dutch and German immigrants. The hamlet was originally known as “Clinton’s Dale” after the Clinton family, who owned much of the land in the area. The hamlet was officially incorporated in 1845.
In the late 1800s, Clintondale was a thriving agricultural community. The hamlet was home to several farms, a grist mill, a saw mill, and a cider mill. The hamlet also had a post office, a blacksmith shop, and a general store.
In the early 1900s, the hamlet began to decline as many of the farms were abandoned and the population began to decline. The hamlet was revitalized in the 1950s when the New York State Thruway was built through the area. This brought new businesses and residents to the area.
Geography
Clintondale is located in the Hudson Valley region of New York. The hamlet is situated in the town of Plattekill, Ulster County, approximately 90 miles north of New York City. The hamlet is bordered by the towns of Marlborough, Newburgh, and Shawangunk.
The terrain of Clintondale is mostly flat, with some rolling hills. The hamlet is located in the Rondout Creek watershed. The hamlet is located in the Catskill Mountains, and is surrounded by forests and farmland.
Economy
The economy of Clintondale is largely based on agriculture and tourism. The hamlet is home to several farms, which produce a variety of fruits and vegetables. The hamlet is also home to several wineries and breweries, which attract tourists from all over the region.
The hamlet is also home to several small businesses, including restaurants, shops, and services. The hamlet is also home to several manufacturing companies, which produce a variety of products.
Demographics
As of the 2010 census, the population of Clintondale was 1,845. The population is largely white (94.3%), with small percentages of African American (2.2%), Hispanic (1.7%), and Asian (1.2%) residents. The median household income is $60,938, and the median home value is $219,400.
The hamlet is served by the Marlboro Central School District. The hamlet is also home to several churches, including the Clintondale United Methodist Church and the Clintondale Presbyterian Church.
Conclusion
Clintondale is a small hamlet located in the Hudson Valley region of New York. The hamlet is bordered by the towns of Marlborough, Newburgh, and Shawangunk. The hamlet was first settled in the late 1700s by Dutch and German immigrants, and was officially incorporated in 1845. The economy of Clintondale is largely based on agriculture and tourism. The population of Clintondale was 1,845 as of the 2010 census. The hamlet is served by the Marlboro Central School District, and is home to several churches.
Common Questions
What is Per Capita Income in Clintondale?
Per Capita income in Clintondale is $44,754.
What is the Median Household income in Clintondale?
Median Household Income in Clintondale is $47,292.
What is Income or Wage Gap in Clintondale?
Income or Wage Gap in Clintondale is 8.4%.
Women in Clintondale earn 91.6 cents for every dollar earned by a man.
What is Inequality or Gini Index in Clintondale?
Inequality or Gini Index in Clintondale is 0.47.
What is the Total Population of Clintondale?
Total Population of Clintondale is 1,493.
What is the Total Male Population of Clintondale?
Total Male Population of Clintondale is 777.
What is the Total Female Population of Clintondale?
Total Female Population of Clintondale is 716.
What is the Ratio of Males per 100 Females in Clintondale?
There are 108.52 Males per 100 Females in Clintondale.
What is the Ratio of Females per 100 Males in Clintondale?
There are 92.15 Females per 100 Males in Clintondale.
What is the Median Population Age in Clintondale?
Median Population Age in Clintondale is 48.5 Years.
What is the Average Family Size in Clintondale
Average Family Size in Clintondale is 2.5 People.
What is the Average Household Size in Clintondale
Average Household Size in Clintondale is 2.0 People.
How Large is the Labor Force in Clintondale?
There are 760 People in the Labor Forcein in Clintondale.
What is the Percentage of People in the Labor Force in Clintondale?
59.4% of People are in the Labor Force in Clintondale.
What is the Unemployment Rate in Clintondale?
Unemployment Rate in Clintondale is 6.4%.