Ware, MA Map & Demographics
Ware Map
Ware Overview
$28,363
PER CAPITA INCOME
$68,777
AVG FAMILY INCOME
$44,107
AVG HOUSEHOLD INCOME
35.2%
WAGE / INCOME GAP [ % ]
64.8¢/ $1
WAGE / INCOME GAP [ $ ]
0.46
INEQUALITY / GINI INDEX
6,253
TOTAL POPULATION
2,896
MALE POPULATION
3,357
FEMALE POPULATION
86.27
MALES / 100 FEMALES
115.92
FEMALES / 100 MALES
38.6
MEDIAN AGE
2.9
AVG FAMILY SIZE
2.2
AVG HOUSEHOLD SIZE
3,103
LABOR FORCE [ PEOPLE ]
62.4%
PERCENT IN LABOR FORCE
12.3%
UNEMPLOYMENT RATE
Ware Zip Codes
Ware Area Codes
Income in Ware
Income Overview in Ware
Per Capita Income in Ware is $28,363, while median incomes of families and households are $68,777 and $44,107 respectively.
| Characteristic | Number | Measure |
| Per Capita Income | 6,253 | $28,363 |
| Median Family Income | 1,554 | $68,777 |
| Mean Family Income | 1,554 | $75,431 |
| Median Household Income | 2,880 | $44,107 |
| Mean Household Income | 2,880 | $62,055 |
| Income Deficit | 1,554 | $0 |
| Wage / Income Gap (%) | 6,253 | 35.21% |
| Wage / Income Gap ($) | 6,253 | 64.79¢ per $1 |
| Gini / Inequality Index | 6,253 | 0.46 |
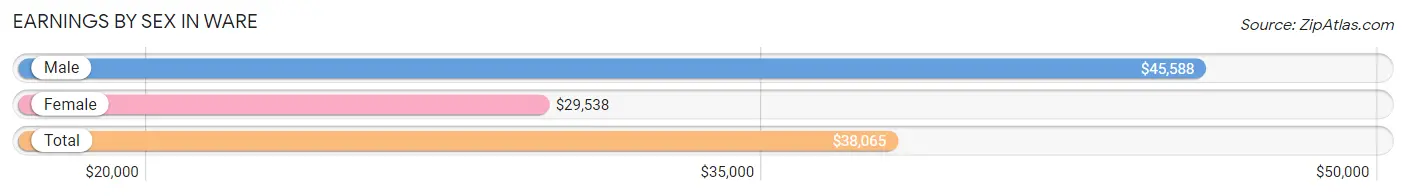
Earnings by Sex in Ware
Average Earnings in Ware are $38,065, $45,588 for men and $29,538 for women, a difference of 35.2%.
| Sex | Number | Average Earnings |
| Male | 1,540 (52.9%) | $45,588 |
| Female | 1,371 (47.1%) | $29,538 |
| Total | 2,911 (100.0%) | $38,065 |
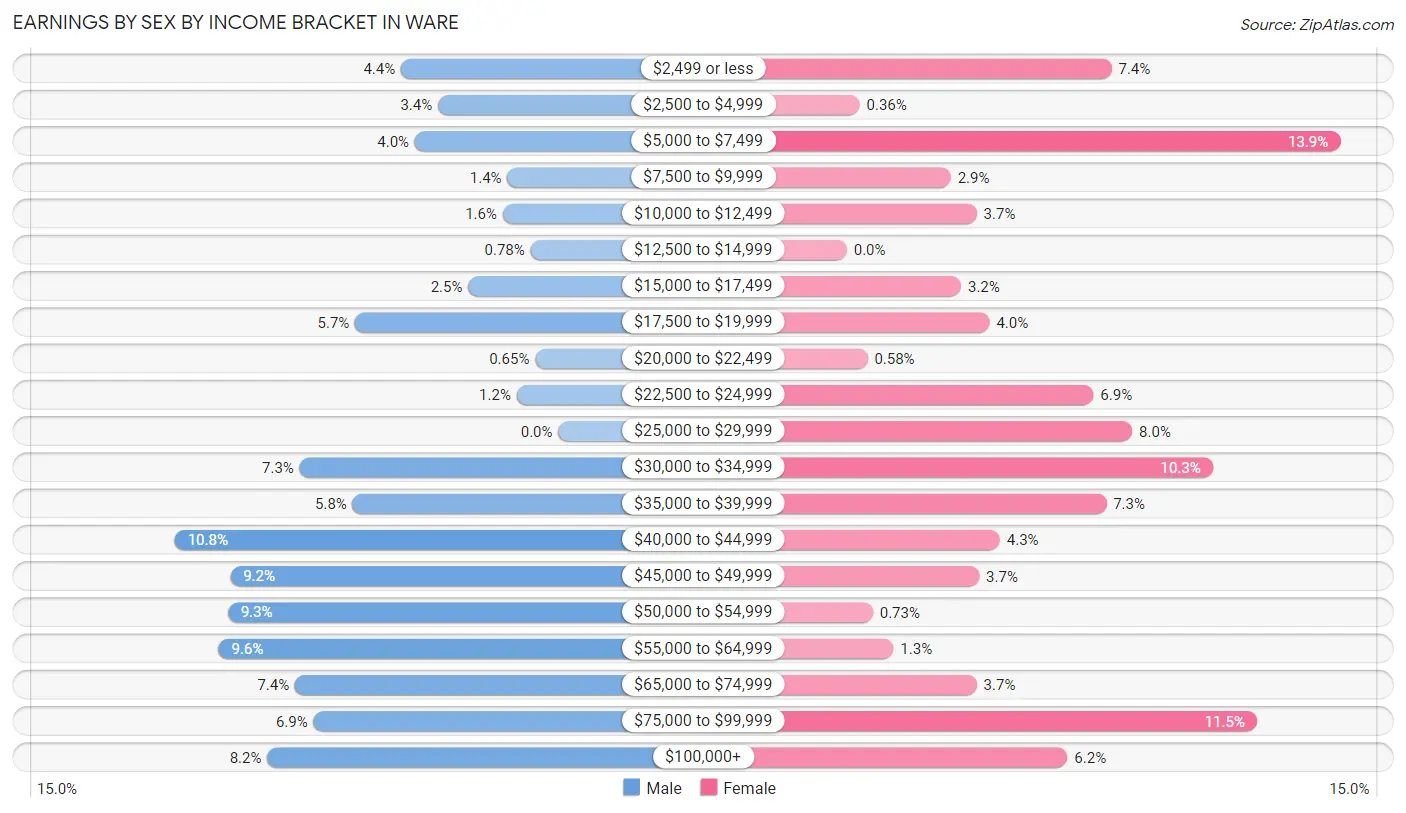
Earnings by Sex by Income Bracket in Ware
The most common earnings brackets in Ware are $40,000 to $44,999 for men (166 | 10.8%) and $5,000 to $7,499 for women (190 | 13.9%).
| Income | Male | Female |
| $2,499 or less | 68 (4.4%) | 102 (7.4%) |
| $2,500 to $4,999 | 52 (3.4%) | 5 (0.4%) |
| $5,000 to $7,499 | 62 (4.0%) | 190 (13.9%) |
| $7,500 to $9,999 | 22 (1.4%) | 40 (2.9%) |
| $10,000 to $12,499 | 24 (1.6%) | 50 (3.6%) |
| $12,500 to $14,999 | 12 (0.8%) | 0 (0.0%) |
| $15,000 to $17,499 | 39 (2.5%) | 44 (3.2%) |
| $17,500 to $19,999 | 88 (5.7%) | 55 (4.0%) |
| $20,000 to $22,499 | 10 (0.6%) | 8 (0.6%) |
| $22,500 to $24,999 | 18 (1.2%) | 95 (6.9%) |
| $25,000 to $29,999 | 0 (0.0%) | 110 (8.0%) |
| $30,000 to $34,999 | 112 (7.3%) | 141 (10.3%) |
| $35,000 to $39,999 | 89 (5.8%) | 100 (7.3%) |
| $40,000 to $44,999 | 166 (10.8%) | 59 (4.3%) |
| $45,000 to $49,999 | 142 (9.2%) | 51 (3.7%) |
| $50,000 to $54,999 | 143 (9.3%) | 10 (0.7%) |
| $55,000 to $64,999 | 147 (9.6%) | 18 (1.3%) |
| $65,000 to $74,999 | 114 (7.4%) | 50 (3.6%) |
| $75,000 to $99,999 | 106 (6.9%) | 158 (11.5%) |
| $100,000+ | 126 (8.2%) | 85 (6.2%) |
| Total | 1,540 (100.0%) | 1,371 (100.0%) |
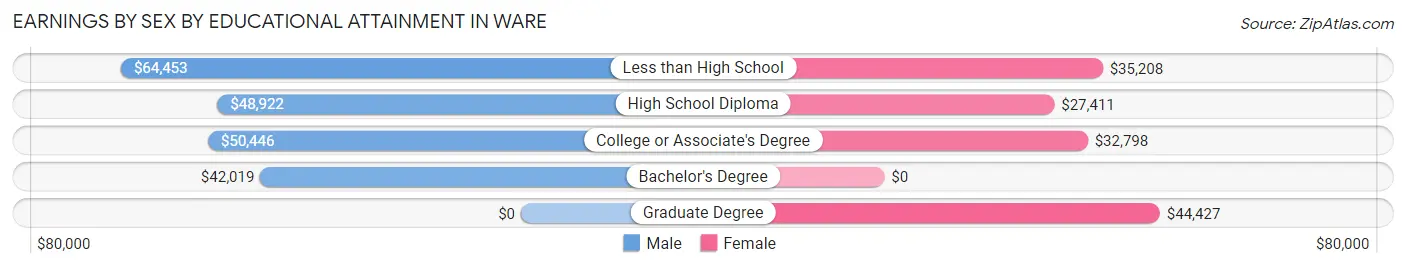
Earnings by Sex by Educational Attainment in Ware
Average earnings in Ware are $50,264 for men and $32,259 for women, a difference of 35.8%. Men with an educational attainment of less than high school enjoy the highest average annual earnings of $64,453, while those with bachelor's degree education earn the least with $42,019. Women with an educational attainment of graduate degree earn the most with the average annual earnings of $44,427, while those with high school diploma education have the smallest earnings of $27,411.
| Educational Attainment | Male Income | Female Income |
| Less than High School | $64,453 | $35,208 |
| High School Diploma | $48,922 | $27,411 |
| College or Associate's Degree | $50,446 | $32,798 |
| Bachelor's Degree | $42,019 | $0 |
| Graduate Degree | - | - |
| Total | $50,264 | $32,259 |
Family Income in Ware
Family Income Brackets in Ware
According to the Ware family income data, there are 381 families falling into the $75,000 to $99,999 income range, which is the most common income bracket and makes up 24.5% of all families. Conversely, the $15,000 to $24,999 income bracket is the least frequent group with only 31 families (2.0%) belonging to this category.
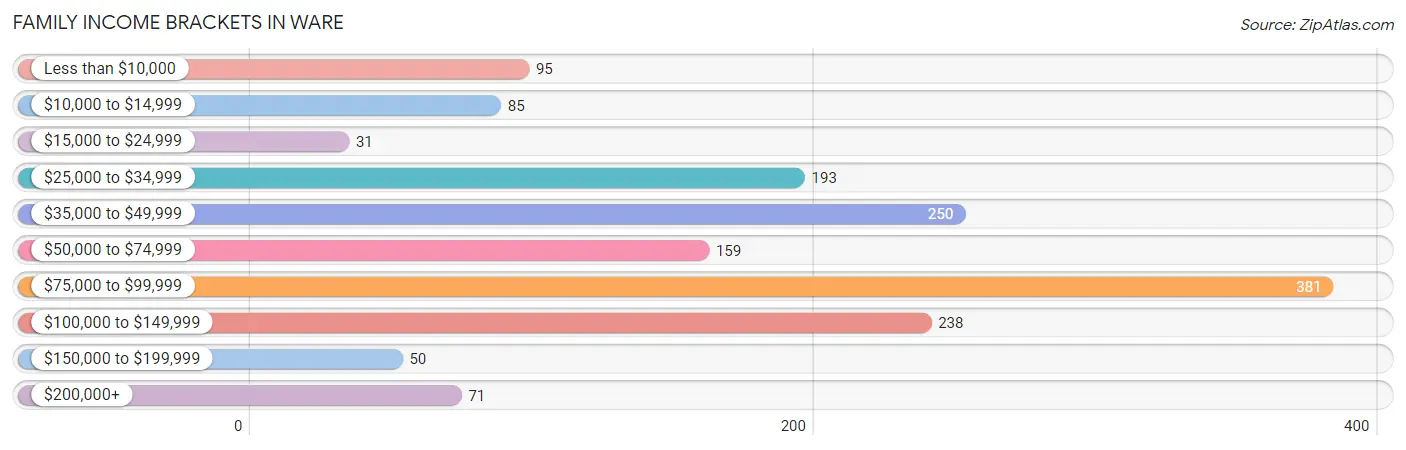
| Income Bracket | # Families | % Families |
| Less than $10,000 | 95 | 6.1% |
| $10,000 to $14,999 | 85 | 5.5% |
| $15,000 to $24,999 | 31 | 2.0% |
| $25,000 to $34,999 | 193 | 12.4% |
| $35,000 to $49,999 | 250 | 16.1% |
| $50,000 to $74,999 | 159 | 10.2% |
| $75,000 to $99,999 | 381 | 24.5% |
| $100,000 to $149,999 | 238 | 15.3% |
| $150,000 to $199,999 | 50 | 3.2% |
| $200,000+ | 71 | 4.6% |
Family Income by Famaliy Size in Ware
5-person families (147 | 9.5%) account for the highest median family income in Ware with $83,058 per family, while 3-person families (316 | 20.3%) have the highest median income of $26,981 per family member.
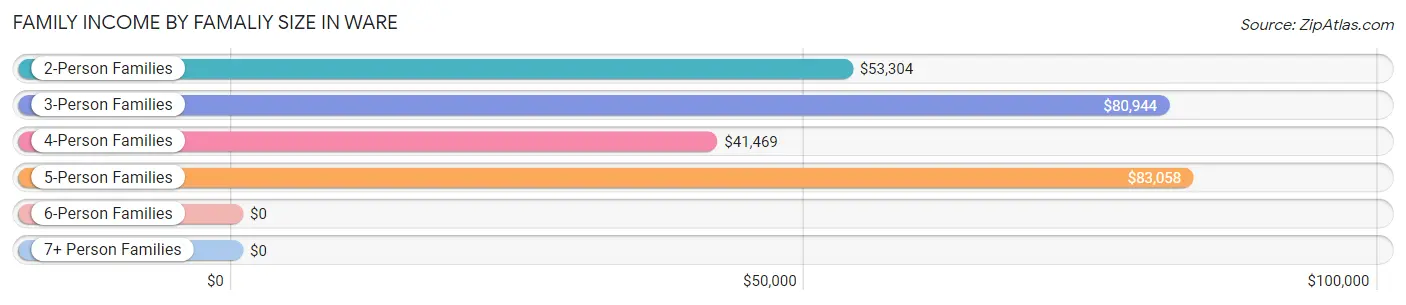
| Income Bracket | # Families | Median Income |
| 2-Person Families | 739 (47.5%) | $53,304 |
| 3-Person Families | 316 (20.3%) | $80,944 |
| 4-Person Families | 329 (21.2%) | $41,469 |
| 5-Person Families | 147 (9.5%) | $83,058 |
| 6-Person Families | 0 (0.0%) | $0 |
| 7+ Person Families | 23 (1.5%) | $0 |
| Total | 1,554 (100.0%) | $68,777 |
Family Income by Number of Earners in Ware
The median family income in Ware is $68,777, with families comprising 3+ earners (100) having the highest median family income of $91,964, while families with no earners (433) have the lowest median family income of $26,464, accounting for 6.4% and 27.9% of families, respectively.
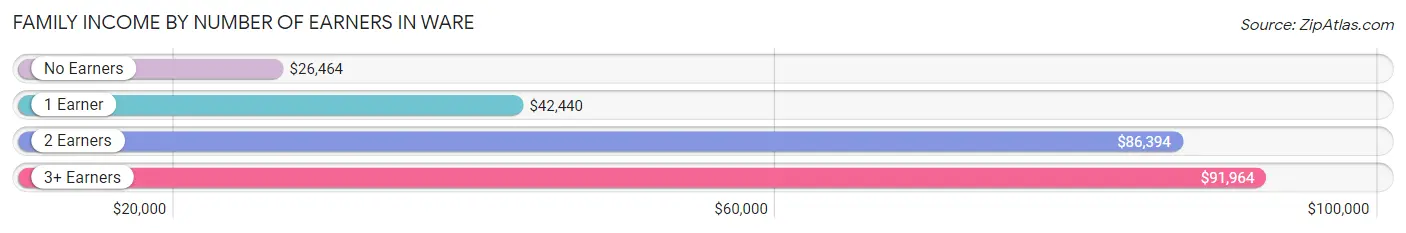
| Number of Earners | # Families | Median Income |
| No Earners | 433 (27.9%) | $26,464 |
| 1 Earner | 466 (30.0%) | $42,440 |
| 2 Earners | 555 (35.7%) | $86,394 |
| 3+ Earners | 100 (6.4%) | $91,964 |
| Total | 1,554 (100.0%) | $68,777 |
Household Income in Ware
Household Income Brackets in Ware
With 449 households falling in the category, the $75,000 to $99,999 income range is the most frequent in Ware, accounting for 15.6% of all households. In contrast, only 86 households (3.0%) fall into the $150,000 to $199,999 income bracket, making it the least populous group.

| Income Bracket | # Households | % Households |
| Less than $10,000 | 184 | 6.4% |
| $10,000 to $14,999 | 225 | 7.8% |
| $15,000 to $24,999 | 415 | 14.4% |
| $25,000 to $34,999 | 357 | 12.4% |
| $35,000 to $49,999 | 354 | 12.3% |
| $50,000 to $74,999 | 412 | 14.3% |
| $75,000 to $99,999 | 449 | 15.6% |
| $100,000 to $149,999 | 297 | 10.3% |
| $150,000 to $199,999 | 86 | 3.0% |
| $200,000+ | 98 | 3.4% |
Household Income by Householder Age in Ware
The median household income in Ware is $44,107, with the highest median household income of $63,156 found in the 45 to 64 years age bracket for the primary householder. A total of 1,271 households (44.1%) fall into this category. Meanwhile, the 25 to 44 years age bracket for the primary householder has the lowest median household income of $0, with 713 households (24.8%) in this group.
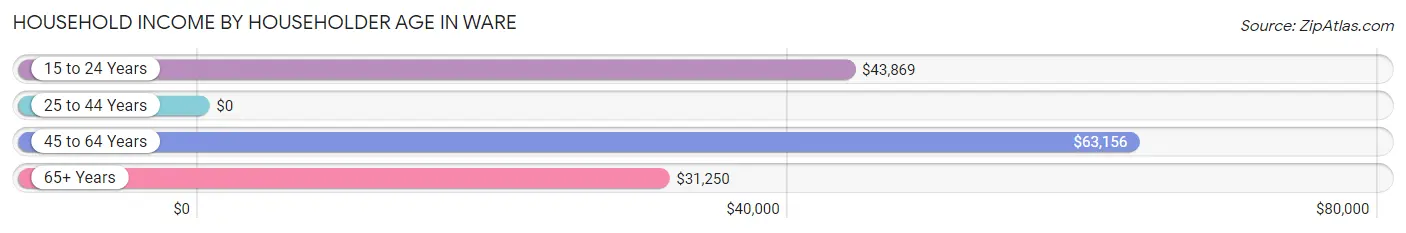
| Income Bracket | # Households | Median Income |
| 15 to 24 Years | 229 (8.0%) | $43,869 |
| 25 to 44 Years | 713 (24.8%) | $0 |
| 45 to 64 Years | 1,271 (44.1%) | $63,156 |
| 65+ Years | 667 (23.2%) | $31,250 |
| Total | 2,880 (100.0%) | $44,107 |
Poverty in Ware
Income Below Poverty by Sex and Age in Ware
With 12.2% poverty level for males and 18.1% for females among the residents of Ware, 6 to 11 year old males and 15 year old females are the most vulnerable to poverty, with 71 males (28.9%) and 14 females (63.6%) in their respective age groups living below the poverty level.
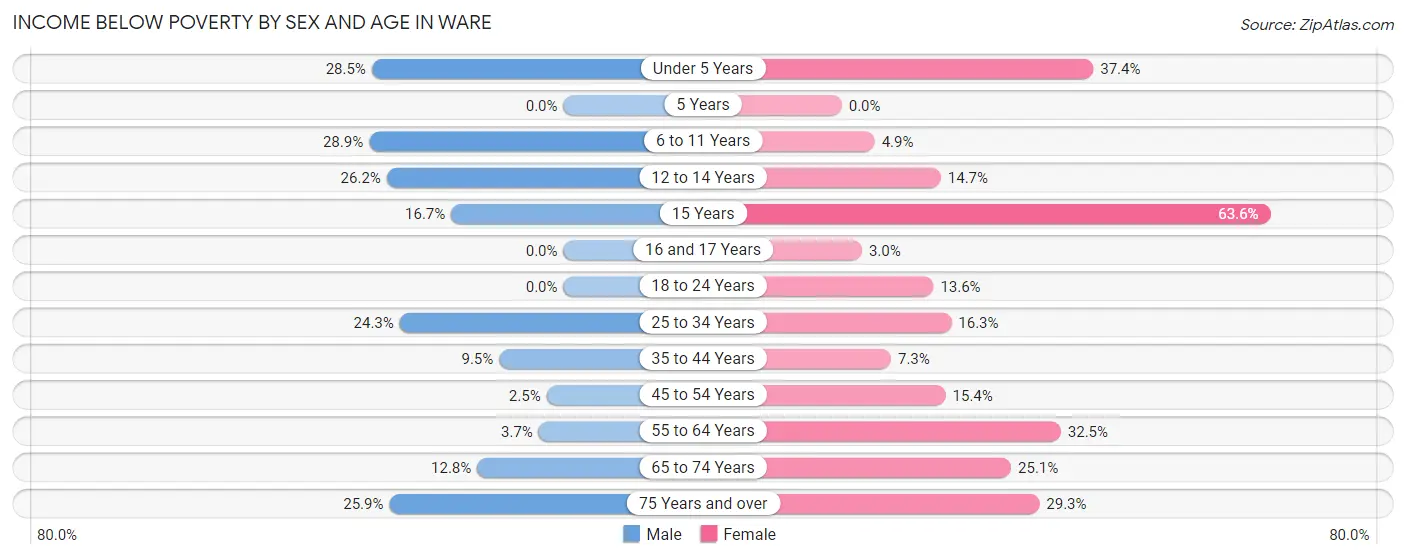
| Age Bracket | Male | Female |
| Under 5 Years | 35 (28.5%) | 62 (37.3%) |
| 5 Years | 0 (0.0%) | 0 (0.0%) |
| 6 to 11 Years | 71 (28.9%) | 16 (4.9%) |
| 12 to 14 Years | 37 (26.2%) | 20 (14.7%) |
| 15 Years | 7 (16.7%) | 14 (63.6%) |
| 16 and 17 Years | 0 (0.0%) | 8 (3.0%) |
| 18 to 24 Years | 0 (0.0%) | 23 (13.6%) |
| 25 to 34 Years | 79 (24.3%) | 75 (16.3%) |
| 35 to 44 Years | 33 (9.5%) | 25 (7.3%) |
| 45 to 54 Years | 11 (2.5%) | 70 (15.4%) |
| 55 to 64 Years | 14 (3.7%) | 121 (32.5%) |
| 65 to 74 Years | 26 (12.8%) | 46 (25.1%) |
| 75 Years and over | 38 (25.9%) | 120 (29.3%) |
| Total | 351 (12.2%) | 600 (18.1%) |
Income Above Poverty by Sex and Age in Ware
According to the poverty statistics in Ware, males aged 16 and 17 years and females aged 16 and 17 years are the age groups that are most secure financially, with 100.0% of males and 97.0% of females in these age groups living above the poverty line.
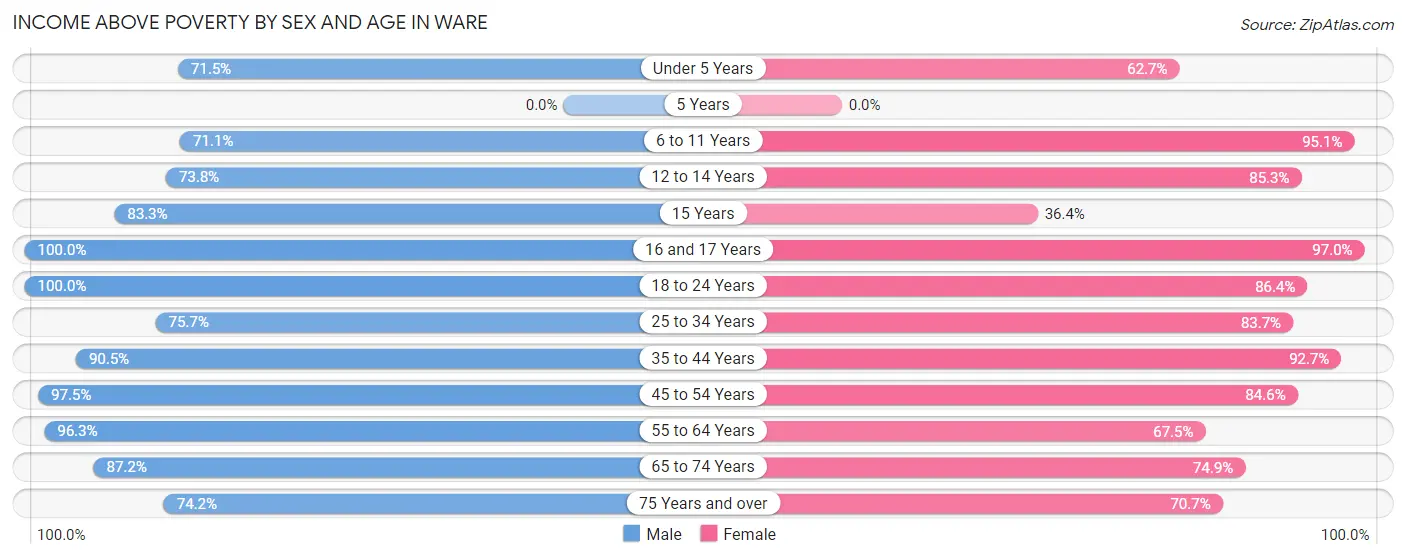
| Age Bracket | Male | Female |
| Under 5 Years | 88 (71.5%) | 104 (62.6%) |
| 5 Years | 0 (0.0%) | 0 (0.0%) |
| 6 to 11 Years | 175 (71.1%) | 311 (95.1%) |
| 12 to 14 Years | 104 (73.8%) | 116 (85.3%) |
| 15 Years | 35 (83.3%) | 8 (36.4%) |
| 16 and 17 Years | 122 (100.0%) | 259 (97.0%) |
| 18 to 24 Years | 349 (100.0%) | 146 (86.4%) |
| 25 to 34 Years | 246 (75.7%) | 386 (83.7%) |
| 35 to 44 Years | 313 (90.5%) | 317 (92.7%) |
| 45 to 54 Years | 429 (97.5%) | 384 (84.6%) |
| 55 to 64 Years | 369 (96.3%) | 251 (67.5%) |
| 65 to 74 Years | 177 (87.2%) | 137 (74.9%) |
| 75 Years and over | 109 (74.2%) | 289 (70.7%) |
| Total | 2,516 (87.8%) | 2,708 (81.9%) |
Income Below Poverty Among Married-Couple Families in Ware
The poverty statistics for married-couple families in Ware show that 6.0% or 48 of the total 796 families live below the poverty line. Families with no children have the highest poverty rate of 7.1%, comprising of 38 families. On the other hand, families with 3 or 4 children have the lowest poverty rate of 0.0%, which includes 0 families.
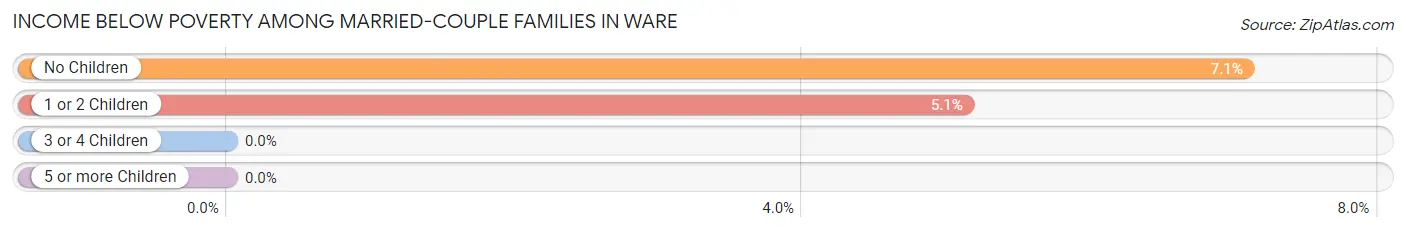
| Children | Above Poverty | Below Poverty |
| No Children | 499 (92.9%) | 38 (7.1%) |
| 1 or 2 Children | 185 (94.9%) | 10 (5.1%) |
| 3 or 4 Children | 64 (100.0%) | 0 (0.0%) |
| 5 or more Children | 0 (0.0%) | 0 (0.0%) |
| Total | 748 (94.0%) | 48 (6.0%) |
Income Below Poverty Among Single-Parent Households in Ware
According to the poverty data in Ware, 7.0% or 10 single-father households and 21.6% or 133 single-mother households are living below the poverty line. Among single-father households, those with 1 or 2 children have the highest poverty rate, with 10 households (11.5%) experiencing poverty. Likewise, among single-mother households, those with 1 or 2 children have the highest poverty rate, with 112 households (30.7%) falling below the poverty line.
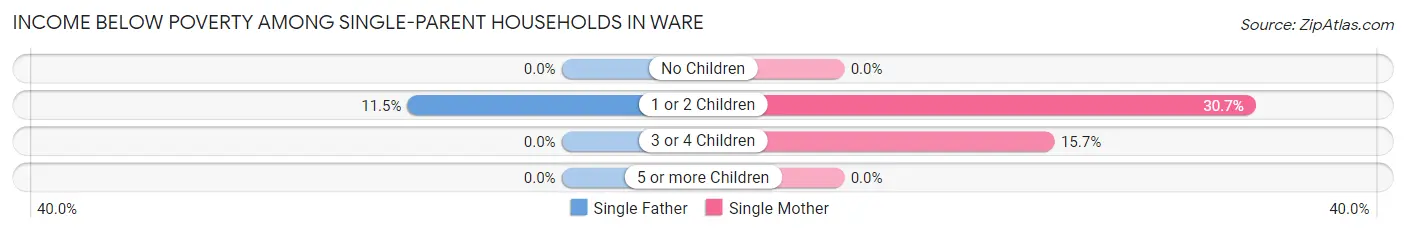
| Children | Single Father | Single Mother |
| No Children | 0 (0.0%) | 0 (0.0%) |
| 1 or 2 Children | 10 (11.5%) | 112 (30.7%) |
| 3 or 4 Children | 0 (0.0%) | 21 (15.7%) |
| 5 or more Children | 0 (0.0%) | 0 (0.0%) |
| Total | 10 (7.0%) | 133 (21.6%) |
Income Below Poverty Among Married-Couple vs Single-Parent Households in Ware
The poverty data for Ware shows that 48 of the married-couple family households (6.0%) and 143 of the single-parent households (18.9%) are living below the poverty level. Within the married-couple family households, those with no children have the highest poverty rate, with 38 households (7.1%) falling below the poverty line. Among the single-parent households, those with 1 or 2 children have the highest poverty rate, with 122 household (27.0%) living below poverty.
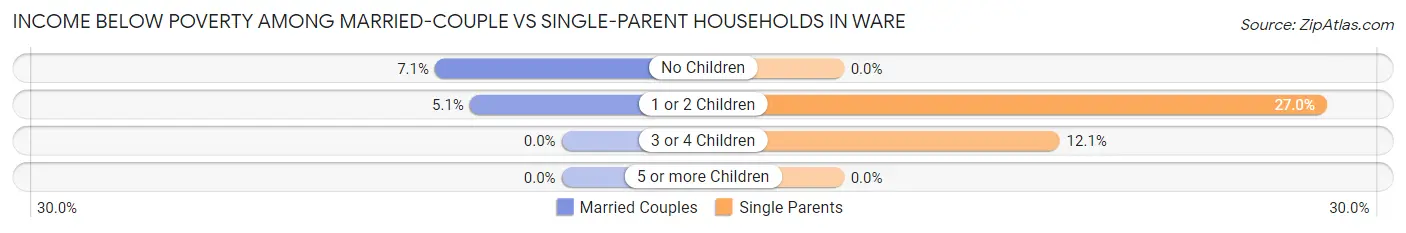
| Children | Married-Couple Families | Single-Parent Households |
| No Children | 38 (7.1%) | 0 (0.0%) |
| 1 or 2 Children | 10 (5.1%) | 122 (27.0%) |
| 3 or 4 Children | 0 (0.0%) | 21 (12.1%) |
| 5 or more Children | 0 (0.0%) | 0 (0.0%) |
| Total | 48 (6.0%) | 143 (18.9%) |
Race in Ware
The most populous races in Ware are White / Caucasian (5,553 | 88.8%), Hispanic or Latino (356 | 5.7%), and Black / African American (295 | 4.7%).
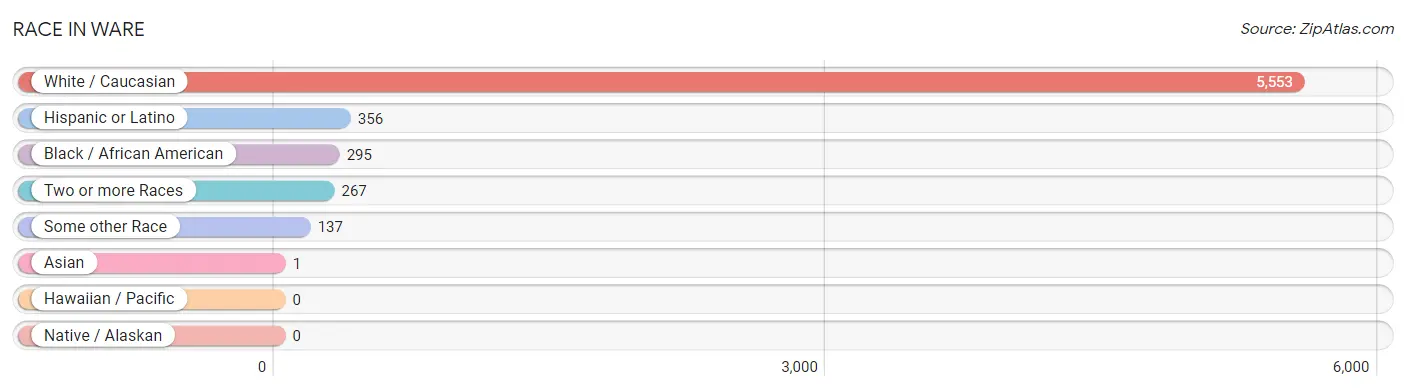
| Race | # Population | % Population |
| Asian | 1 | 0.0% |
| Black / African American | 295 | 4.7% |
| Hawaiian / Pacific | 0 | 0.0% |
| Hispanic or Latino | 356 | 5.7% |
| Native / Alaskan | 0 | 0.0% |
| White / Caucasian | 5,553 | 88.8% |
| Two or more Races | 267 | 4.3% |
| Some other Race | 137 | 2.2% |
| Total | 6,253 | 100.0% |
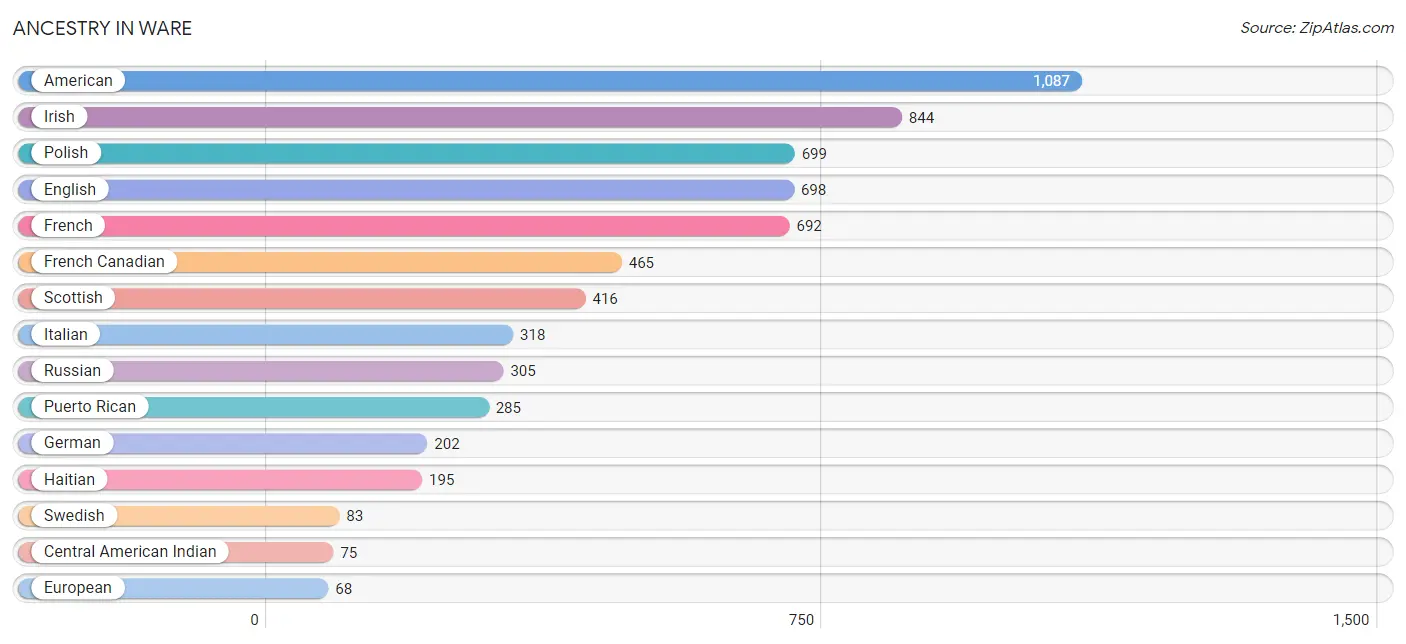
Ancestry in Ware
The most populous ancestries reported in Ware are American (1,087 | 17.4%), Irish (844 | 13.5%), Polish (699 | 11.2%), English (698 | 11.2%), and French (692 | 11.1%), together accounting for 64.3% of all Ware residents.
| Ancestry | # Population | % Population |
| Albanian | 43 | 0.7% |
| American | 1,087 | 17.4% |
| Arab | 28 | 0.4% |
| Argentinean | 31 | 0.5% |
| Austrian | 10 | 0.2% |
| British | 8 | 0.1% |
| Canadian | 50 | 0.8% |
| Central American | 27 | 0.4% |
| Central American Indian | 75 | 1.2% |
| Choctaw | 27 | 0.4% |
| Colombian | 12 | 0.2% |
| Cuban | 1 | 0.0% |
| English | 698 | 11.2% |
| European | 68 | 1.1% |
| French | 692 | 11.1% |
| French Canadian | 465 | 7.4% |
| German | 202 | 3.2% |
| Greek | 26 | 0.4% |
| Haitian | 195 | 3.1% |
| Honduran | 27 | 0.4% |
| Irish | 844 | 13.5% |
| Italian | 318 | 5.1% |
| Jamaican | 22 | 0.4% |
| Lebanese | 28 | 0.4% |
| Norwegian | 19 | 0.3% |
| Polish | 699 | 11.2% |
| Portuguese | 19 | 0.3% |
| Puerto Rican | 285 | 4.6% |
| Russian | 305 | 4.9% |
| Scotch-Irish | 19 | 0.3% |
| Scottish | 416 | 6.7% |
| South American | 43 | 0.7% |
| Swedish | 83 | 1.3% |
| Thai | 1 | 0.0% |
| Ukrainian | 24 | 0.4% |
| Welsh | 17 | 0.3% | View All 36 Rows |
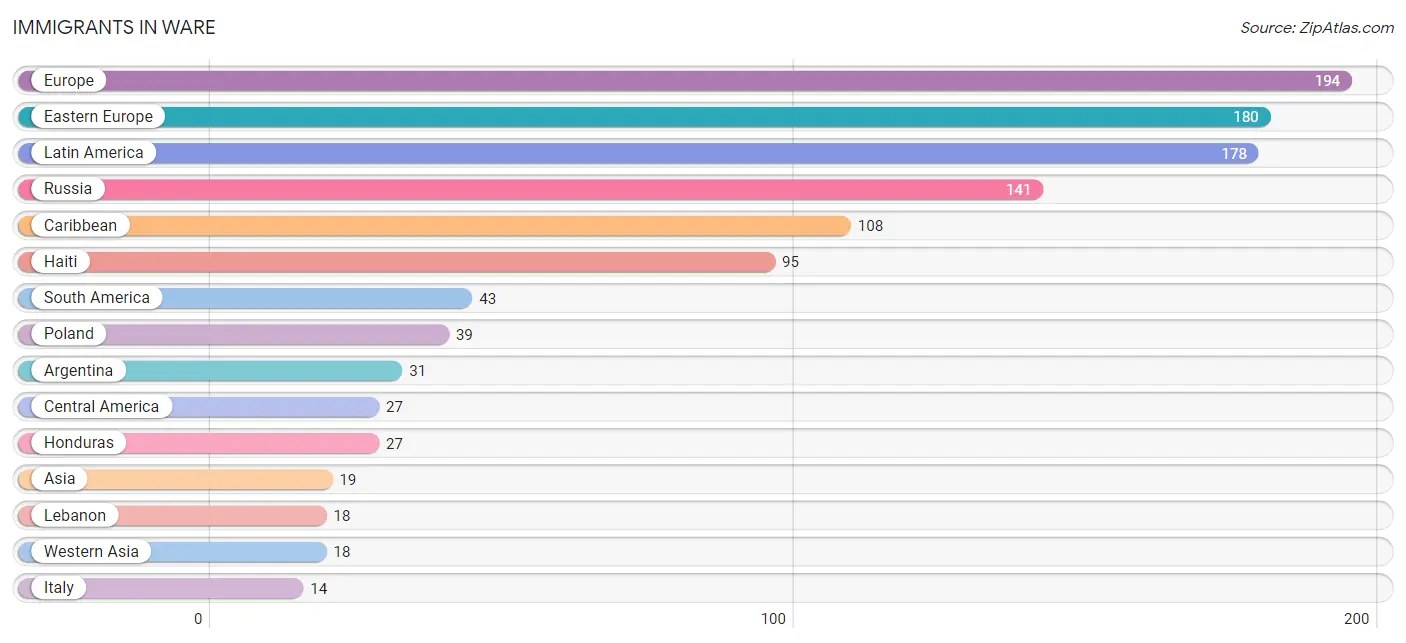
Immigrants in Ware
The most numerous immigrant groups reported in Ware came from Europe (194 | 3.1%), Eastern Europe (180 | 2.9%), Latin America (178 | 2.9%), Russia (141 | 2.2%), and Caribbean (108 | 1.7%), together accounting for 12.8% of all Ware residents.
| Immigration Origin | # Population | % Population |
| Argentina | 31 | 0.5% |
| Asia | 19 | 0.3% |
| Canada | 1 | 0.0% |
| Caribbean | 108 | 1.7% |
| Central America | 27 | 0.4% |
| Colombia | 12 | 0.2% |
| Cuba | 1 | 0.0% |
| Eastern Europe | 180 | 2.9% |
| Europe | 194 | 3.1% |
| Haiti | 95 | 1.5% |
| Honduras | 27 | 0.4% |
| India | 1 | 0.0% |
| Italy | 14 | 0.2% |
| Jamaica | 12 | 0.2% |
| Latin America | 178 | 2.9% |
| Lebanon | 18 | 0.3% |
| Poland | 39 | 0.6% |
| Russia | 141 | 2.2% |
| South America | 43 | 0.7% |
| South Central Asia | 1 | 0.0% |
| Southern Europe | 14 | 0.2% |
| Western Asia | 18 | 0.3% | View All 22 Rows |
Sex and Age in Ware
Sex and Age in Ware
The most populous age groups in Ware are 60 to 64 Years (265 | 9.1%) for men and 10 to 14 Years (353 | 10.5%) for women.
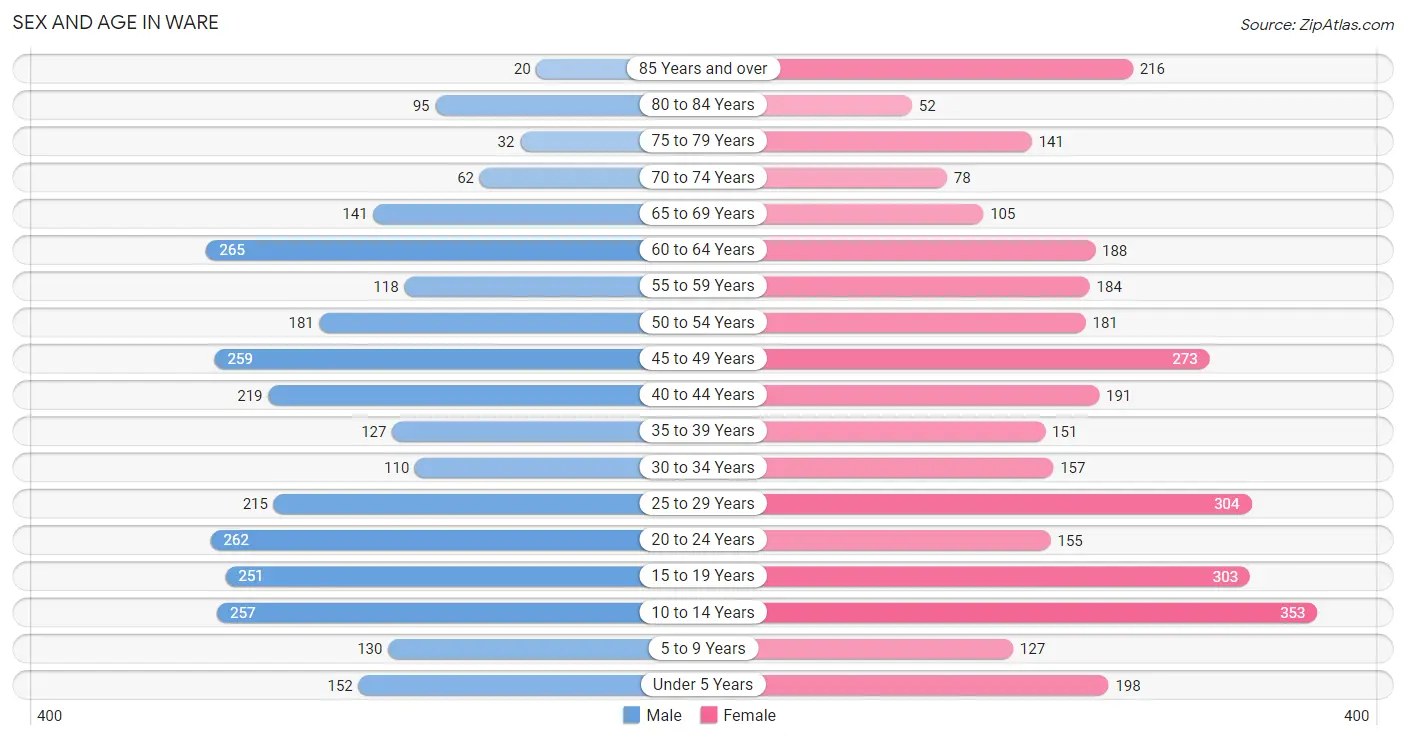
| Age Bracket | Male | Female |
| Under 5 Years | 152 (5.2%) | 198 (5.9%) |
| 5 to 9 Years | 130 (4.5%) | 127 (3.8%) |
| 10 to 14 Years | 257 (8.9%) | 353 (10.5%) |
| 15 to 19 Years | 251 (8.7%) | 303 (9.0%) |
| 20 to 24 Years | 262 (9.0%) | 155 (4.6%) |
| 25 to 29 Years | 215 (7.4%) | 304 (9.1%) |
| 30 to 34 Years | 110 (3.8%) | 157 (4.7%) |
| 35 to 39 Years | 127 (4.4%) | 151 (4.5%) |
| 40 to 44 Years | 219 (7.6%) | 191 (5.7%) |
| 45 to 49 Years | 259 (8.9%) | 273 (8.1%) |
| 50 to 54 Years | 181 (6.2%) | 181 (5.4%) |
| 55 to 59 Years | 118 (4.1%) | 184 (5.5%) |
| 60 to 64 Years | 265 (9.1%) | 188 (5.6%) |
| 65 to 69 Years | 141 (4.9%) | 105 (3.1%) |
| 70 to 74 Years | 62 (2.1%) | 78 (2.3%) |
| 75 to 79 Years | 32 (1.1%) | 141 (4.2%) |
| 80 to 84 Years | 95 (3.3%) | 52 (1.5%) |
| 85 Years and over | 20 (0.7%) | 216 (6.4%) |
| Total | 2,896 (100.0%) | 3,357 (100.0%) |
Families and Households in Ware
Median Family Size in Ware
The median family size in Ware is 2.93 persons per family, with single male/father families (142 | 9.1%) accounting for the largest median family size of 3.73 persons per family. On the other hand, married-couple families (796 | 51.2%) represent the smallest median family size with 2.81 persons per family.
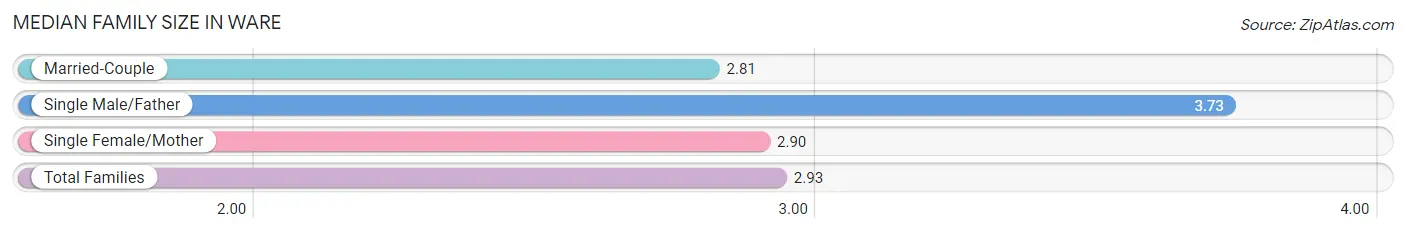
| Family Type | # Families | Family Size |
| Married-Couple | 796 (51.2%) | 2.81 |
| Single Male/Father | 142 (9.1%) | 3.73 |
| Single Female/Mother | 616 (39.6%) | 2.90 |
| Total Families | 1,554 (100.0%) | 2.93 |
Median Household Size in Ware
The median household size in Ware is 2.17 persons per household, with single male/father households (142 | 4.9%) accounting for the largest median household size of 3.93 persons per household. non-family households (1,326 | 46.0%) represent the smallest median household size with 1.21 persons per household.
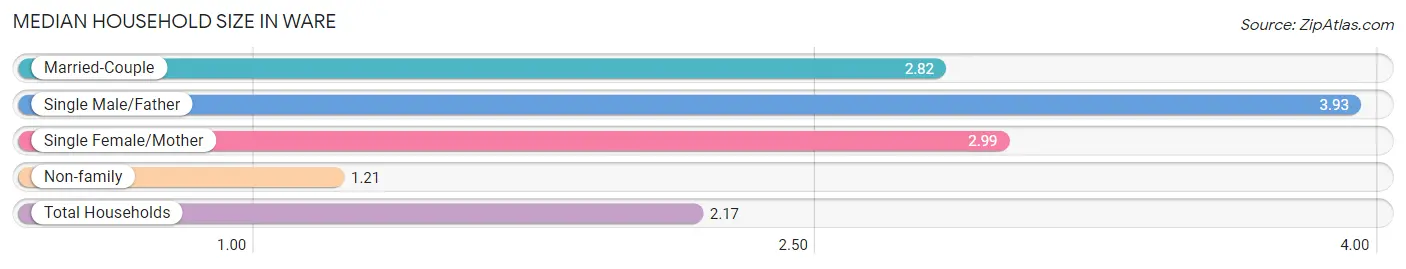
| Household Type | # Households | Household Size |
| Married-Couple | 796 (27.6%) | 2.82 |
| Single Male/Father | 142 (4.9%) | 3.93 |
| Single Female/Mother | 616 (21.4%) | 2.99 |
| Non-family | 1,326 (46.0%) | 1.21 |
| Total Households | 2,880 (100.0%) | 2.17 |
Household Size by Marriage Status in Ware
Out of a total of 2,880 households in Ware, 1,554 (54.0%) are family households, while 1,326 (46.0%) are nonfamily households. The most numerous type of family households are 2-person households, comprising 719, and the most common type of nonfamily households are 1-person households, comprising 1,145.
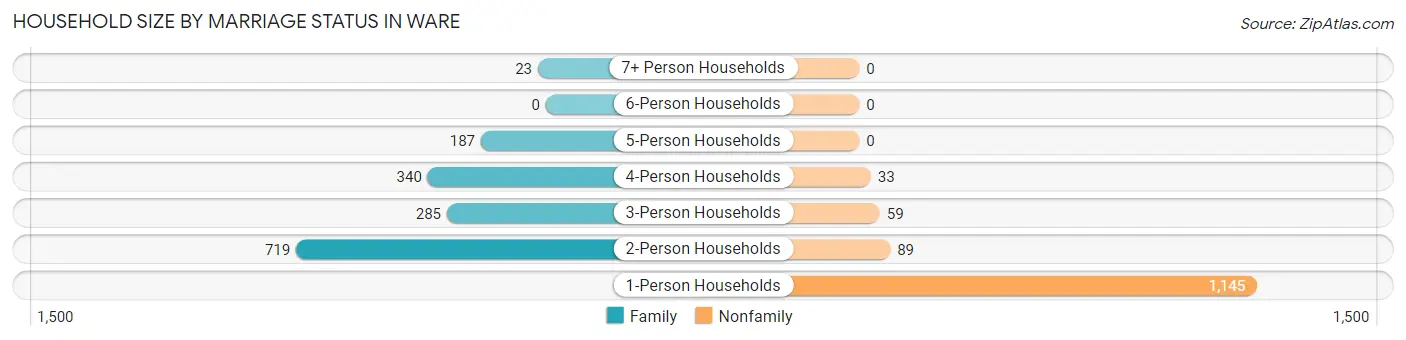
| Household Size | Family Households | Nonfamily Households |
| 1-Person Households | - | 1,145 (39.8%) |
| 2-Person Households | 719 (25.0%) | 89 (3.1%) |
| 3-Person Households | 285 (9.9%) | 59 (2.1%) |
| 4-Person Households | 340 (11.8%) | 33 (1.1%) |
| 5-Person Households | 187 (6.5%) | 0 (0.0%) |
| 6-Person Households | 0 (0.0%) | 0 (0.0%) |
| 7+ Person Households | 23 (0.8%) | 0 (0.0%) |
| Total | 1,554 (54.0%) | 1,326 (46.0%) |
Female Fertility in Ware
Fertility by Age in Ware
Average fertility rate in Ware is 34.0 births per 1,000 women. Women in the age bracket of 20 to 34 years have the highest fertility rate with 76.0 births per 1,000 women. Women in the age bracket of 20 to 34 years acount for 88.7% of all women with births.
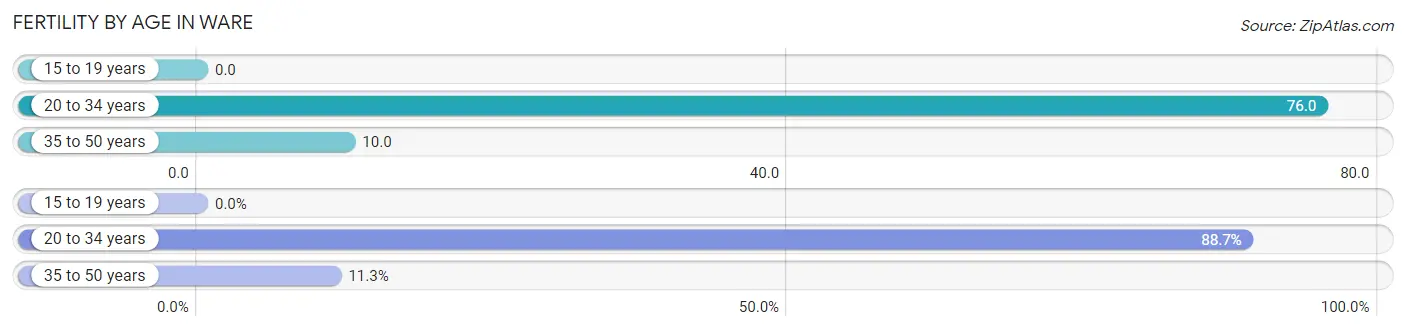
| Age Bracket | Women with Births | Births / 1,000 Women |
| 15 to 19 years | 0 (0.0%) | 0.0 |
| 20 to 34 years | 47 (88.7%) | 76.0 |
| 35 to 50 years | 6 (11.3%) | 10.0 |
| Total | 53 (100.0%) | 34.0 |
Fertility by Age by Marriage Status in Ware
15.1% of women with births (53) in Ware are married. The highest percentage of unmarried women with births falls into 35 to 50 years age bracket with 100.0% of them unmarried at the time of birth, while the lowest percentage of unmarried women with births belong to 20 to 34 years age bracket with 83.0% of them unmarried.
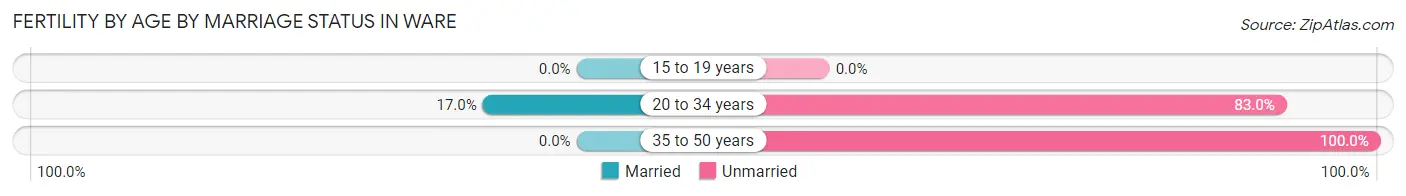
| Age Bracket | Married | Unmarried |
| 15 to 19 years | 0 (0.0%) | 0 (0.0%) |
| 20 to 34 years | 8 (17.0%) | 39 (83.0%) |
| 35 to 50 years | 0 (0.0%) | 6 (100.0%) |
| Total | 8 (15.1%) | 45 (84.9%) |
Fertility by Education in Ware
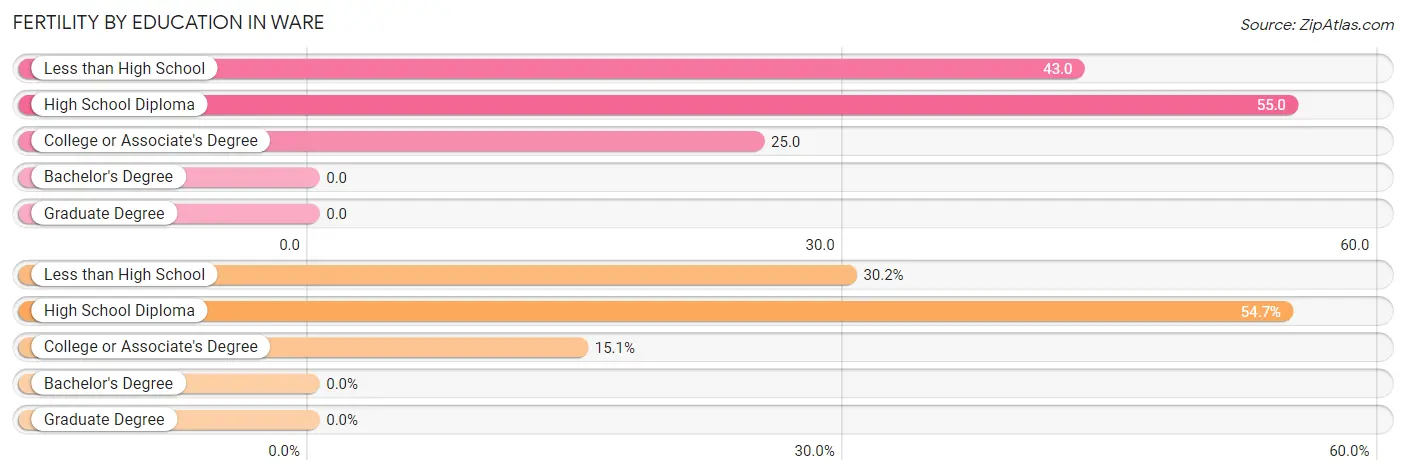
| Educational Attainment | Women with Births | Births / 1,000 Women |
| Less than High School | 16 (30.2%) | 43.0 |
| High School Diploma | 29 (54.7%) | 55.0 |
| College or Associate's Degree | 8 (15.1%) | 25.0 |
| Bachelor's Degree | 0 (0.0%) | 0.0 |
| Graduate Degree | 0 (0.0%) | 0.0 |
| Total | 53 (100.0%) | 34.0 |
Fertility by Education by Marriage Status in Ware
84.9% of women with births in Ware are unmarried. Women with the educational attainment of college or associate's degree are most likely to be married with 100.0% of them married at childbirth, while women with the educational attainment of less than high school are least likely to be married with 100.0% of them unmarried at childbirth.
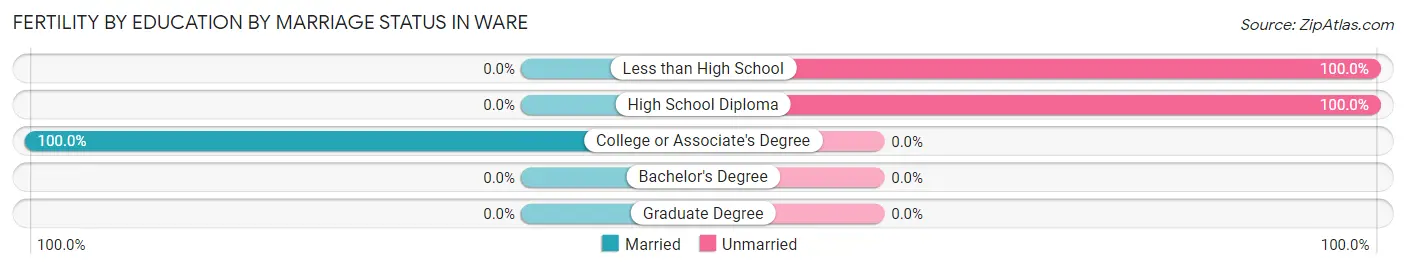
| Educational Attainment | Married | Unmarried |
| Less than High School | 0 (0.0%) | 16 (100.0%) |
| High School Diploma | 0 (0.0%) | 29 (100.0%) |
| College or Associate's Degree | 8 (100.0%) | 0 (0.0%) |
| Bachelor's Degree | 0 (0.0%) | 0 (0.0%) |
| Graduate Degree | 0 (0.0%) | 0 (0.0%) |
| Total | 8 (15.1%) | 45 (84.9%) |
Employment Characteristics in Ware
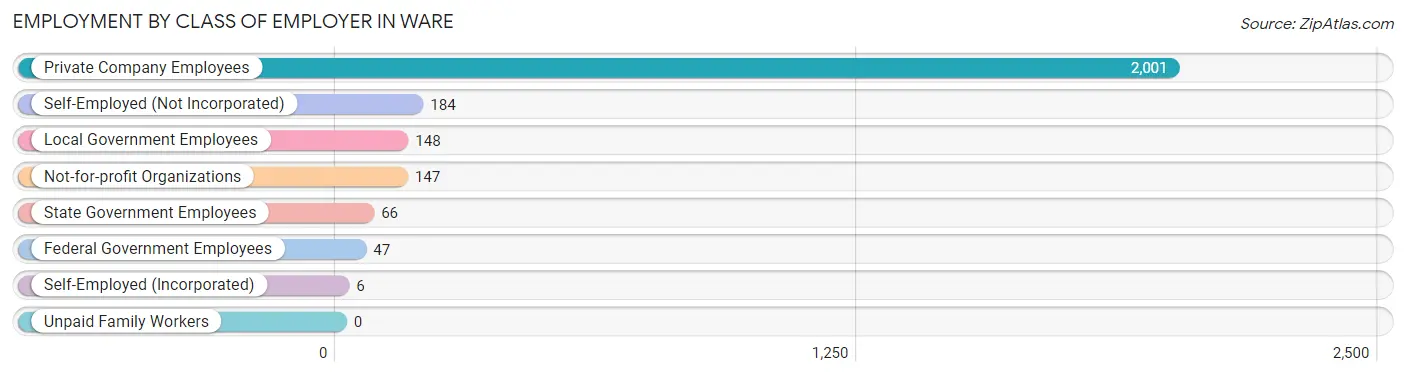
Employment by Class of Employer in Ware
Among the 2,599 employed individuals in Ware, private company employees (2,001 | 77.0%), self-employed (not incorporated) (184 | 7.1%), and local government employees (148 | 5.7%) make up the most common classes of employment.
| Employer Class | # Employees | % Employees |
| Private Company Employees | 2,001 | 77.0% |
| Self-Employed (Incorporated) | 6 | 0.2% |
| Self-Employed (Not Incorporated) | 184 | 7.1% |
| Not-for-profit Organizations | 147 | 5.7% |
| Local Government Employees | 148 | 5.7% |
| State Government Employees | 66 | 2.5% |
| Federal Government Employees | 47 | 1.8% |
| Unpaid Family Workers | 0 | 0.0% |
| Total | 2,599 | 100.0% |
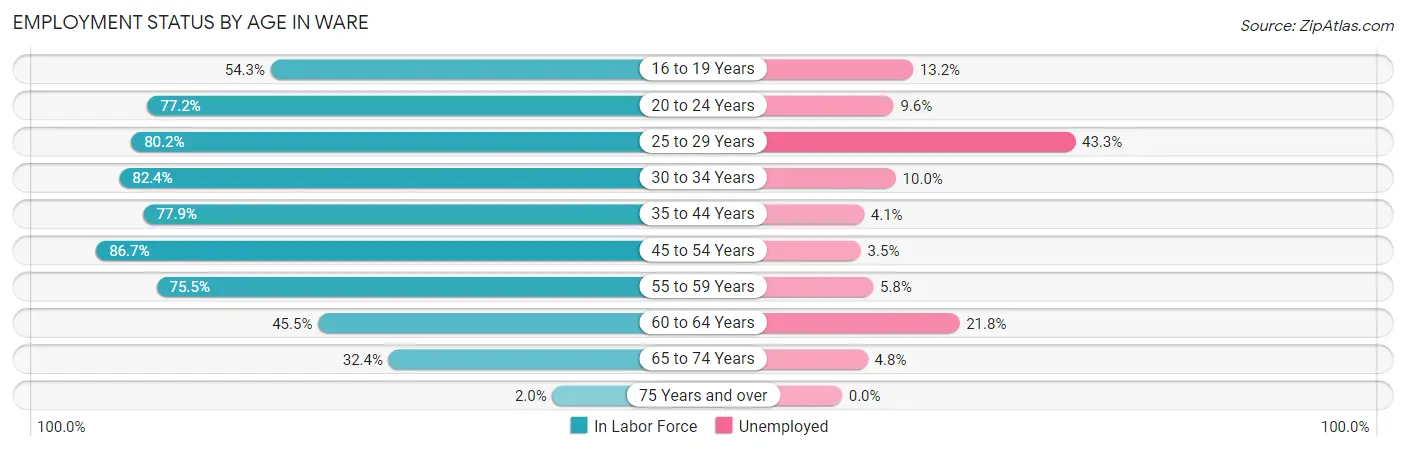
Employment Status by Age in Ware
According to the labor force statistics for Ware, out of the total population over 16 years of age (4,972), 62.4% or 3,103 individuals are in the labor force, with 12.3% or 382 of them unemployed. The age group with the highest labor force participation rate is 45 to 54 years, with 86.7% or 775 individuals in the labor force. Within the labor force, the 25 to 29 years age range has the highest percentage of unemployed individuals, with 43.3% or 180 of them being unemployed.
| Age Bracket | In Labor Force | Unemployed |
| 16 to 19 Years | 266 (54.3%) | 35 (13.2%) |
| 20 to 24 Years | 322 (77.2%) | 31 (9.6%) |
| 25 to 29 Years | 416 (80.2%) | 180 (43.3%) |
| 30 to 34 Years | 220 (82.4%) | 22 (10.0%) |
| 35 to 44 Years | 536 (77.9%) | 22 (4.1%) |
| 45 to 54 Years | 775 (86.7%) | 27 (3.5%) |
| 55 to 59 Years | 228 (75.5%) | 13 (5.8%) |
| 60 to 64 Years | 206 (45.5%) | 45 (21.8%) |
| 65 to 74 Years | 125 (32.4%) | 6 (4.8%) |
| 75 Years and over | 11 (2.0%) | 0 (0.0%) |
| Total | 3,103 (62.4%) | 382 (12.3%) |
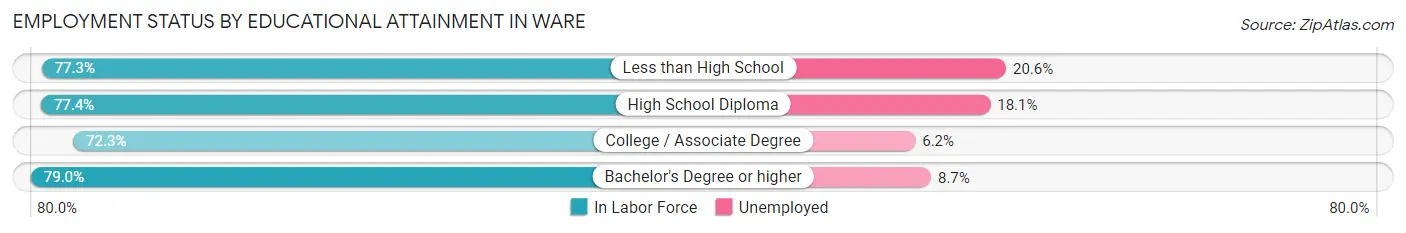
Employment Status by Educational Attainment in Ware
According to labor force statistics for Ware, 76.2% of individuals (2,380) out of the total population between 25 and 64 years of age (3,123) are in the labor force, with 13.0% or 309 of them being unemployed. The group with the highest labor force participation rate are those with the educational attainment of bachelor's degree or higher, with 79.0% or 518 individuals in the labor force. Within the labor force, individuals with less than high school education have the highest percentage of unemployment, with 20.6% or 47 of them being unemployed.
| Educational Attainment | In Labor Force | Unemployed |
| Less than High School | 228 (77.3%) | 61 (20.6%) |
| High School Diploma | 980 (77.4%) | 229 (18.1%) |
| College / Associate Degree | 655 (72.3%) | 56 (6.2%) |
| Bachelor's Degree or higher | 518 (79.0%) | 57 (8.7%) |
| Total | 2,380 (76.2%) | 406 (13.0%) |
Employment Occupations by Sex in Ware
Management, Business, Science and Arts Occupations
The most common Management, Business, Science and Arts occupations in Ware are Community & Social Service (231 | 8.5%), Management (172 | 6.3%), Business & Financial (151 | 5.6%), Education Instruction & Library (131 | 4.8%), and Health Diagnosing & Treating (109 | 4.0%).
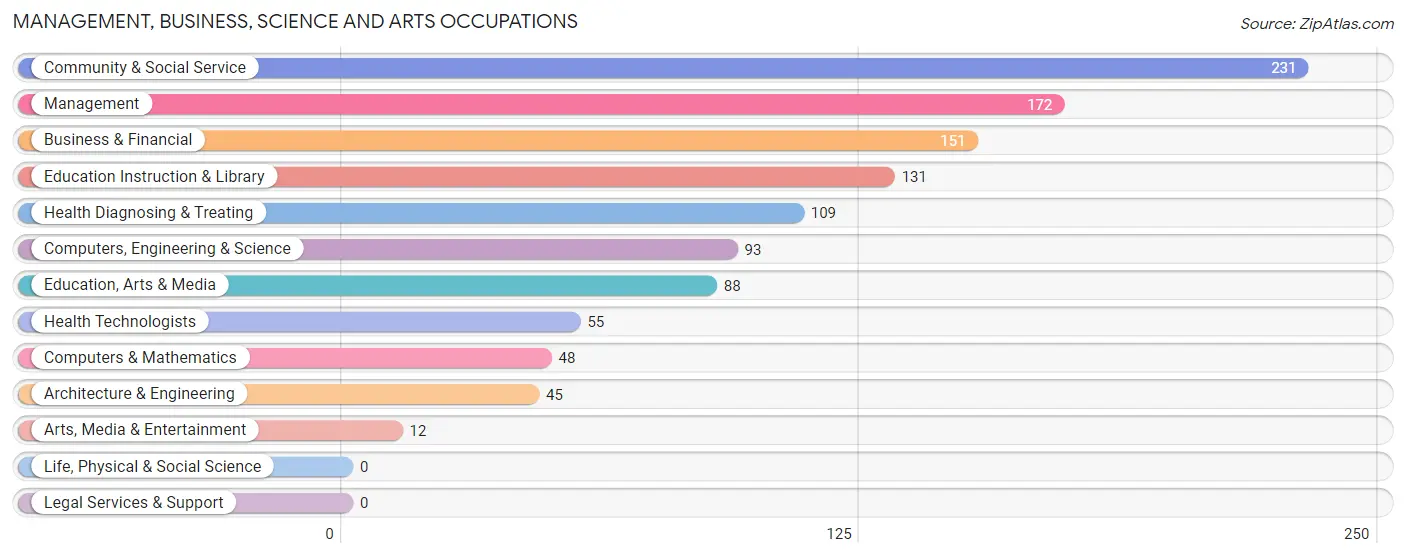
Management, Business, Science and Arts Occupations by Sex
Within the Management, Business, Science and Arts occupations in Ware, the most male-oriented occupations are Computers & Mathematics (100.0%), Computers, Engineering & Science (72.0%), and Education, Arts & Media (64.8%), while the most female-oriented occupations are Arts, Media & Entertainment (100.0%), Health Technologists (100.0%), and Health Diagnosing & Treating (89.0%).
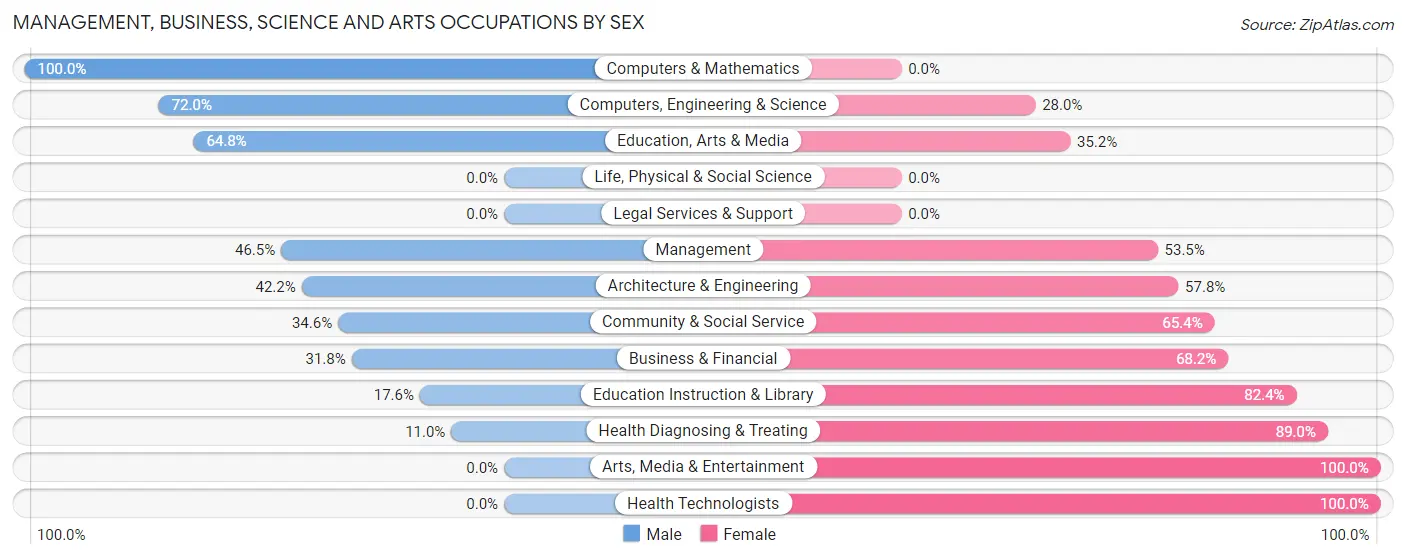
| Occupation | Male | Female |
| Management | 80 (46.5%) | 92 (53.5%) |
| Business & Financial | 48 (31.8%) | 103 (68.2%) |
| Computers, Engineering & Science | 67 (72.0%) | 26 (28.0%) |
| Computers & Mathematics | 48 (100.0%) | 0 (0.0%) |
| Architecture & Engineering | 19 (42.2%) | 26 (57.8%) |
| Life, Physical & Social Science | 0 (0.0%) | 0 (0.0%) |
| Community & Social Service | 80 (34.6%) | 151 (65.4%) |
| Education, Arts & Media | 57 (64.8%) | 31 (35.2%) |
| Legal Services & Support | 0 (0.0%) | 0 (0.0%) |
| Education Instruction & Library | 23 (17.6%) | 108 (82.4%) |
| Arts, Media & Entertainment | 0 (0.0%) | 12 (100.0%) |
| Health Diagnosing & Treating | 12 (11.0%) | 97 (89.0%) |
| Health Technologists | 0 (0.0%) | 55 (100.0%) |
| Total (Category) | 287 (38.0%) | 469 (62.0%) |
| Total (Overall) | 1,435 (52.8%) | 1,284 (47.2%) |
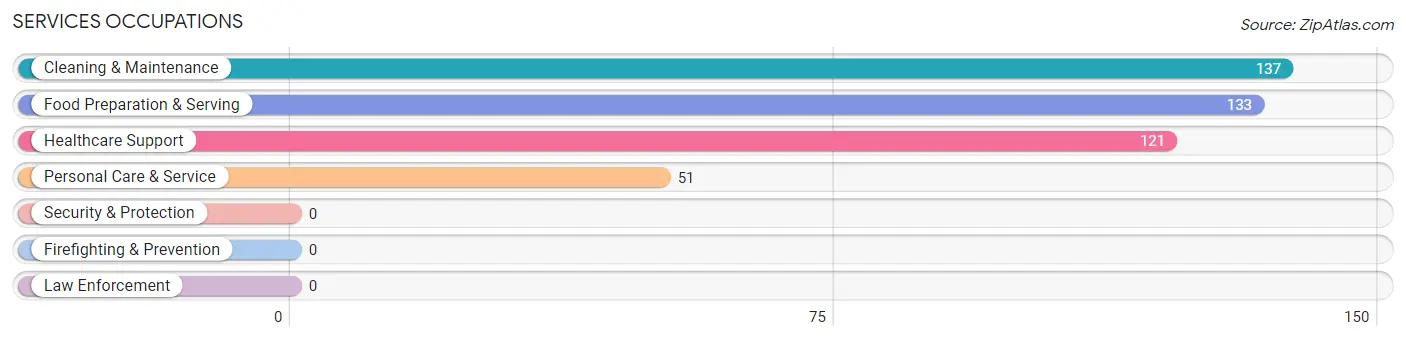
Services Occupations
The most common Services occupations in Ware are Cleaning & Maintenance (137 | 5.0%), Food Preparation & Serving (133 | 4.9%), Healthcare Support (121 | 4.4%), and Personal Care & Service (51 | 1.9%).
Services Occupations by Sex
Within the Services occupations in Ware, the most male-oriented occupations are Cleaning & Maintenance (79.6%), Food Preparation & Serving (38.4%), and Personal Care & Service (19.6%), while the most female-oriented occupations are Healthcare Support (86.8%), Personal Care & Service (80.4%), and Food Preparation & Serving (61.7%).
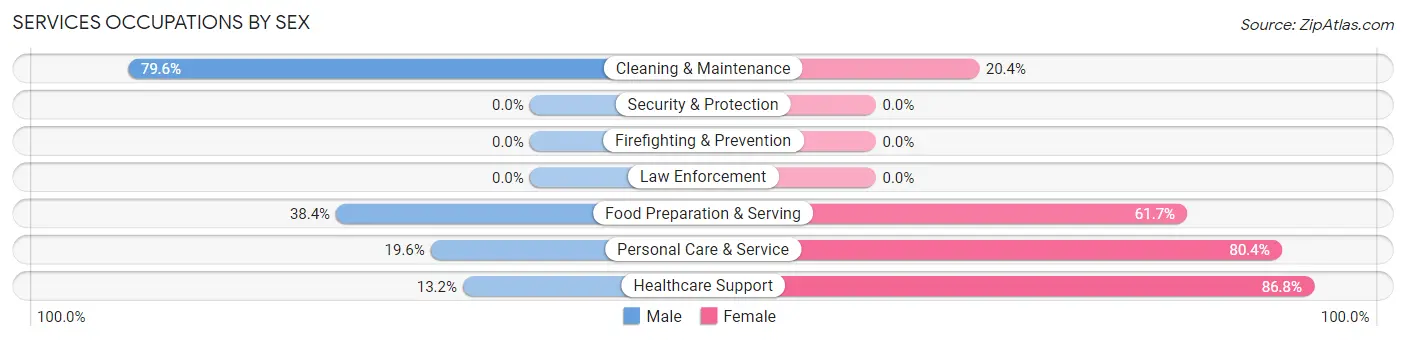
| Occupation | Male | Female |
| Healthcare Support | 16 (13.2%) | 105 (86.8%) |
| Security & Protection | 0 (0.0%) | 0 (0.0%) |
| Firefighting & Prevention | 0 (0.0%) | 0 (0.0%) |
| Law Enforcement | 0 (0.0%) | 0 (0.0%) |
| Food Preparation & Serving | 51 (38.4%) | 82 (61.7%) |
| Cleaning & Maintenance | 109 (79.6%) | 28 (20.4%) |
| Personal Care & Service | 10 (19.6%) | 41 (80.4%) |
| Total (Category) | 186 (42.1%) | 256 (57.9%) |
| Total (Overall) | 1,435 (52.8%) | 1,284 (47.2%) |
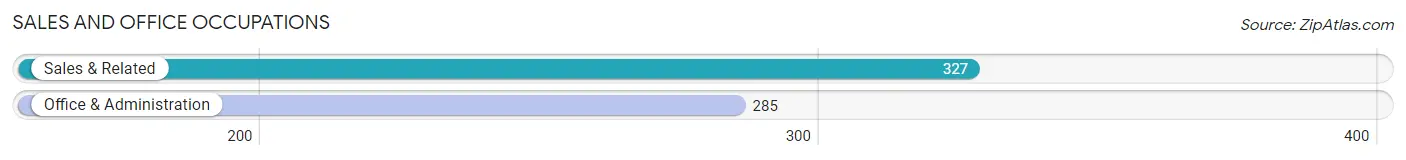
Sales and Office Occupations
The most common Sales and Office occupations in Ware are Sales & Related (327 | 12.0%), and Office & Administration (285 | 10.5%).
Sales and Office Occupations by Sex
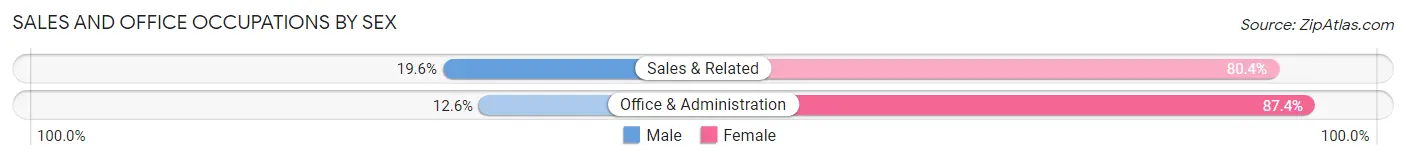
| Occupation | Male | Female |
| Sales & Related | 64 (19.6%) | 263 (80.4%) |
| Office & Administration | 36 (12.6%) | 249 (87.4%) |
| Total (Category) | 100 (16.3%) | 512 (83.7%) |
| Total (Overall) | 1,435 (52.8%) | 1,284 (47.2%) |
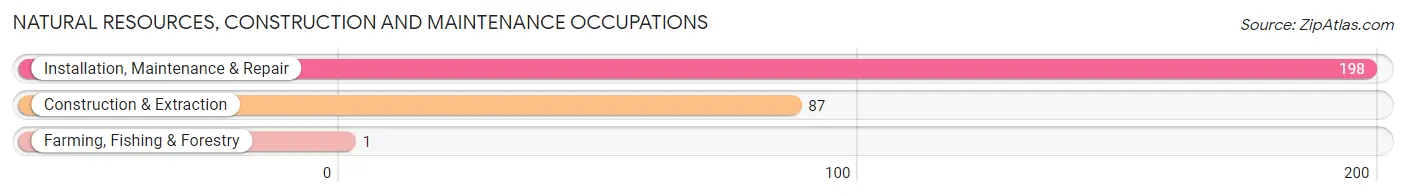
Natural Resources, Construction and Maintenance Occupations
The most common Natural Resources, Construction and Maintenance occupations in Ware are Installation, Maintenance & Repair (198 | 7.3%), Construction & Extraction (87 | 3.2%), and Farming, Fishing & Forestry (1 | 0.0%).
Natural Resources, Construction and Maintenance Occupations by Sex
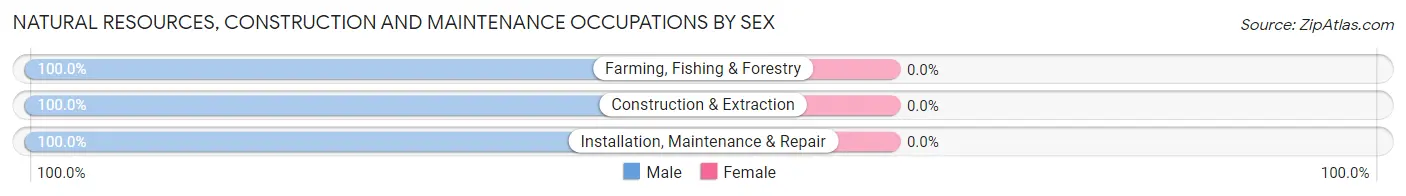
| Occupation | Male | Female |
| Farming, Fishing & Forestry | 1 (100.0%) | 0 (0.0%) |
| Construction & Extraction | 87 (100.0%) | 0 (0.0%) |
| Installation, Maintenance & Repair | 198 (100.0%) | 0 (0.0%) |
| Total (Category) | 286 (100.0%) | 0 (0.0%) |
| Total (Overall) | 1,435 (52.8%) | 1,284 (47.2%) |
Production, Transportation and Moving Occupations
The most common Production, Transportation and Moving occupations in Ware are Production (452 | 16.6%), Transportation (123 | 4.5%), and Material Moving (48 | 1.8%).
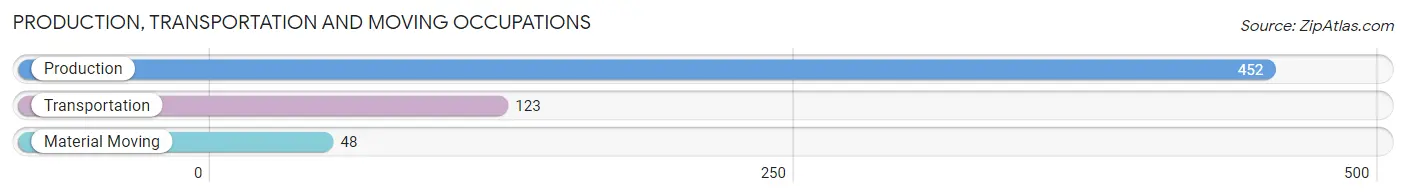
Production, Transportation and Moving Occupations by Sex
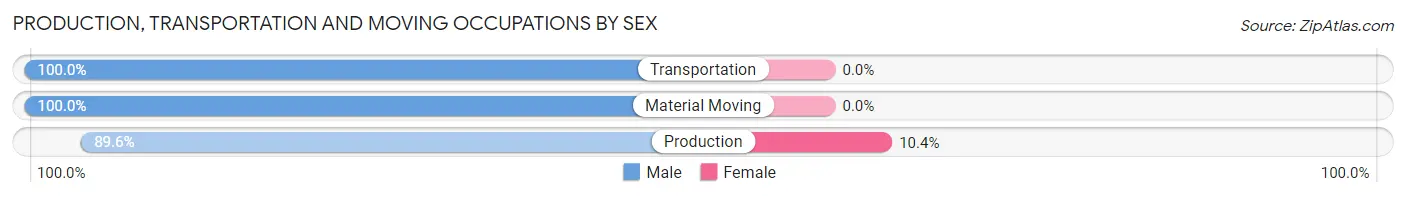
| Occupation | Male | Female |
| Production | 405 (89.6%) | 47 (10.4%) |
| Transportation | 123 (100.0%) | 0 (0.0%) |
| Material Moving | 48 (100.0%) | 0 (0.0%) |
| Total (Category) | 576 (92.5%) | 47 (7.5%) |
| Total (Overall) | 1,435 (52.8%) | 1,284 (47.2%) |
Employment Industries by Sex in Ware
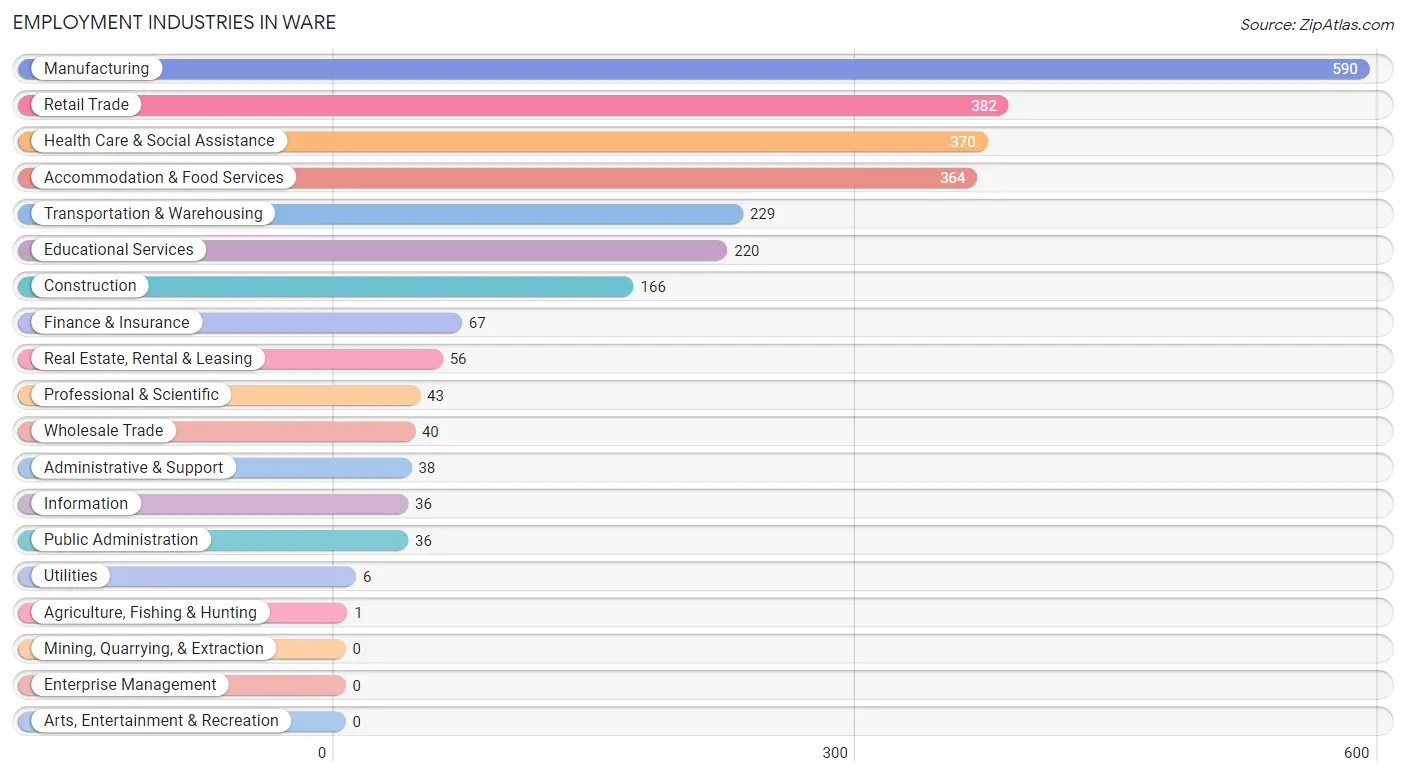
Employment Industries in Ware
The major employment industries in Ware include Manufacturing (590 | 21.7%), Retail Trade (382 | 14.1%), Health Care & Social Assistance (370 | 13.6%), Accommodation & Food Services (364 | 13.4%), and Transportation & Warehousing (229 | 8.4%).
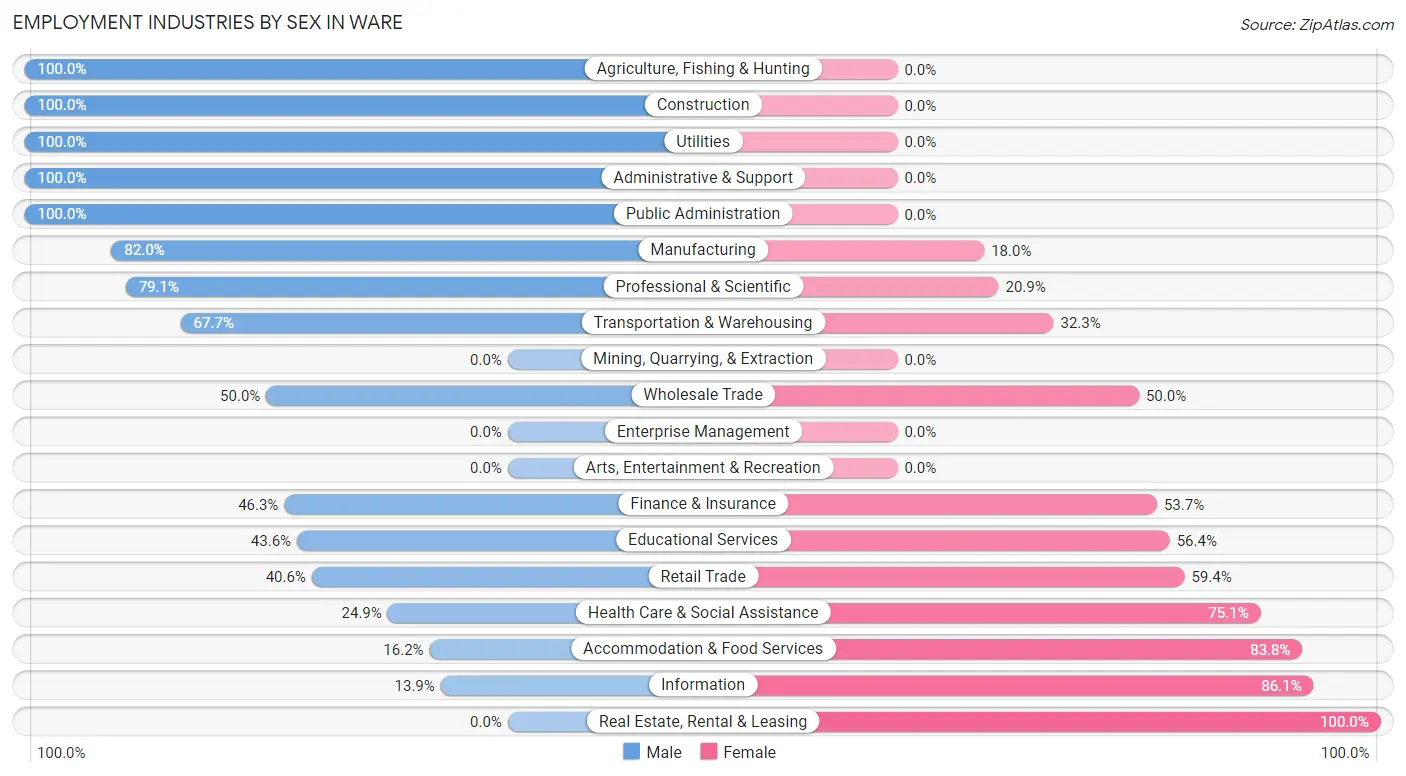
Employment Industries by Sex in Ware
The Ware industries that see more men than women are Agriculture, Fishing & Hunting (100.0%), Construction (100.0%), and Utilities (100.0%), whereas the industries that tend to have a higher number of women are Real Estate, Rental & Leasing (100.0%), Information (86.1%), and Accommodation & Food Services (83.8%).
| Industry | Male | Female |
| Agriculture, Fishing & Hunting | 1 (100.0%) | 0 (0.0%) |
| Mining, Quarrying, & Extraction | 0 (0.0%) | 0 (0.0%) |
| Construction | 166 (100.0%) | 0 (0.0%) |
| Manufacturing | 484 (82.0%) | 106 (18.0%) |
| Wholesale Trade | 20 (50.0%) | 20 (50.0%) |
| Retail Trade | 155 (40.6%) | 227 (59.4%) |
| Transportation & Warehousing | 155 (67.7%) | 74 (32.3%) |
| Utilities | 6 (100.0%) | 0 (0.0%) |
| Information | 5 (13.9%) | 31 (86.1%) |
| Finance & Insurance | 31 (46.3%) | 36 (53.7%) |
| Real Estate, Rental & Leasing | 0 (0.0%) | 56 (100.0%) |
| Professional & Scientific | 34 (79.1%) | 9 (20.9%) |
| Enterprise Management | 0 (0.0%) | 0 (0.0%) |
| Administrative & Support | 38 (100.0%) | 0 (0.0%) |
| Educational Services | 96 (43.6%) | 124 (56.4%) |
| Health Care & Social Assistance | 92 (24.9%) | 278 (75.1%) |
| Arts, Entertainment & Recreation | 0 (0.0%) | 0 (0.0%) |
| Accommodation & Food Services | 59 (16.2%) | 305 (83.8%) |
| Public Administration | 36 (100.0%) | 0 (0.0%) |
| Total | 1,435 (52.8%) | 1,284 (47.2%) |
Education in Ware
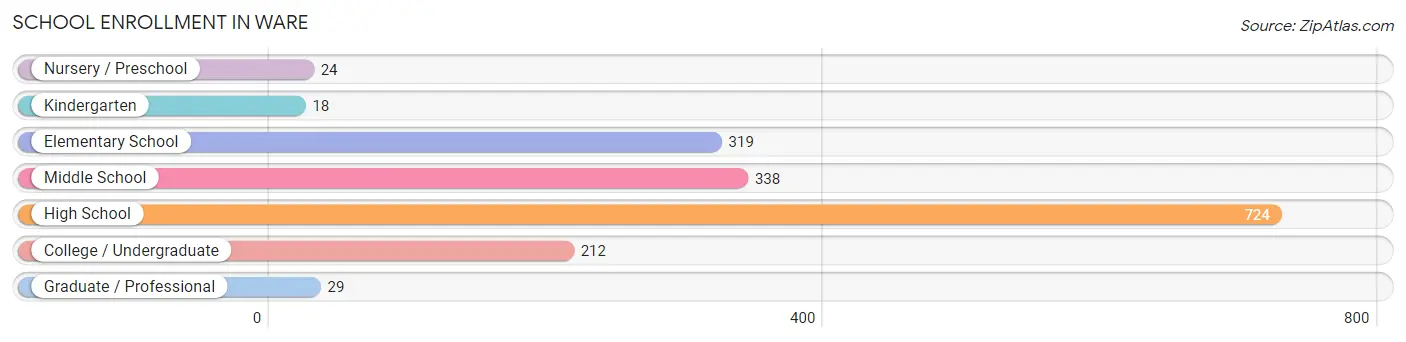
School Enrollment in Ware
The most common levels of schooling among the 1,664 students in Ware are high school (724 | 43.5%), middle school (338 | 20.3%), and elementary school (319 | 19.2%).
| School Level | # Students | % Students |
| Nursery / Preschool | 24 | 1.4% |
| Kindergarten | 18 | 1.1% |
| Elementary School | 319 | 19.2% |
| Middle School | 338 | 20.3% |
| High School | 724 | 43.5% |
| College / Undergraduate | 212 | 12.7% |
| Graduate / Professional | 29 | 1.7% |
| Total | 1,664 | 100.0% |
School Enrollment by Age by Funding Source in Ware
Out of a total of 1,664 students who are enrolled in schools in Ware, 201 (12.1%) attend a private institution, while the remaining 1,463 (87.9%) are enrolled in public schools. The age group of 20 to 24 year olds has the highest likelihood of being enrolled in private schools, with 22 (100.0% in the age bracket) enrolled. Conversely, the age group of 3 to 4 year olds has the lowest likelihood of being enrolled in a private school, with 24 (100.0% in the age bracket) attending a public institution.
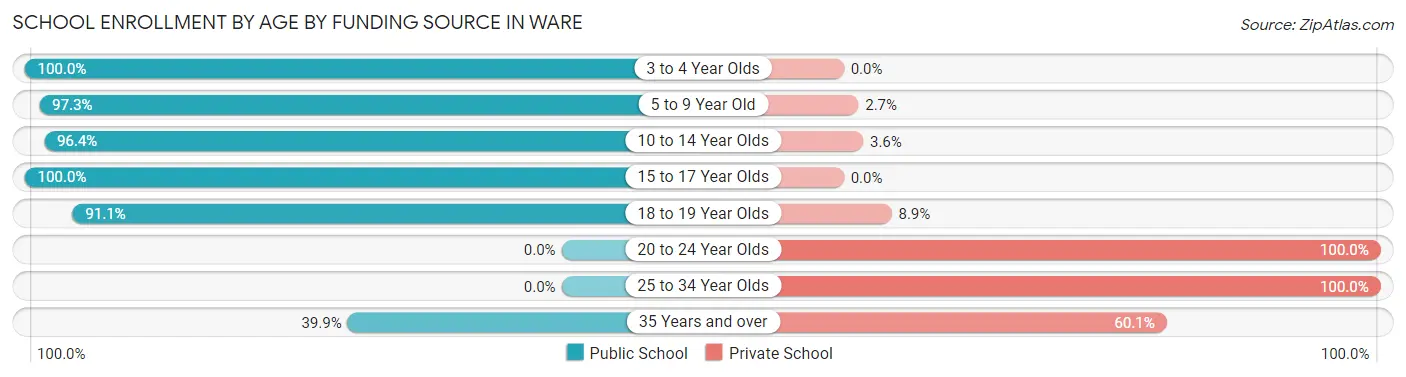
| Age Bracket | Public School | Private School |
| 3 to 4 Year Olds | 24 (100.0%) | 0 (0.0%) |
| 5 to 9 Year Old | 250 (97.3%) | 7 (2.7%) |
| 10 to 14 Year Olds | 588 (96.4%) | 22 (3.6%) |
| 15 to 17 Year Olds | 453 (100.0%) | 0 (0.0%) |
| 18 to 19 Year Olds | 92 (91.1%) | 9 (8.9%) |
| 20 to 24 Year Olds | 0 (0.0%) | 22 (100.0%) |
| 25 to 34 Year Olds | 0 (0.0%) | 59 (100.0%) |
| 35 Years and over | 55 (39.9%) | 83 (60.1%) |
| Total | 1,463 (87.9%) | 201 (12.1%) |
Educational Attainment by Field of Study in Ware
Science & technology (135 | 16.5%), education (119 | 14.5%), arts & humanities (106 | 12.9%), social sciences (95 | 11.6%), and bio, nature & agricultural (86 | 10.5%) are the most common fields of study among 820 individuals in Ware who have obtained a bachelor's degree or higher.
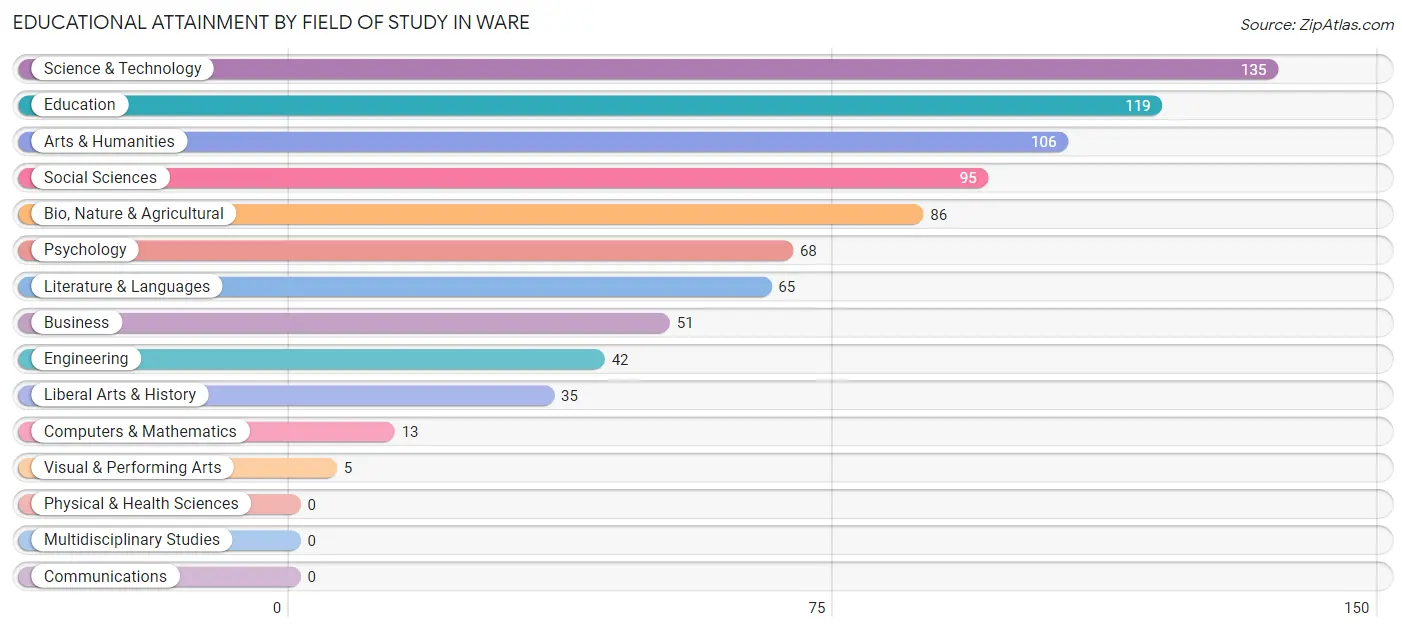
| Field of Study | # Graduates | % Graduates |
| Computers & Mathematics | 13 | 1.6% |
| Bio, Nature & Agricultural | 86 | 10.5% |
| Physical & Health Sciences | 0 | 0.0% |
| Psychology | 68 | 8.3% |
| Social Sciences | 95 | 11.6% |
| Engineering | 42 | 5.1% |
| Multidisciplinary Studies | 0 | 0.0% |
| Science & Technology | 135 | 16.5% |
| Business | 51 | 6.2% |
| Education | 119 | 14.5% |
| Literature & Languages | 65 | 7.9% |
| Liberal Arts & History | 35 | 4.3% |
| Visual & Performing Arts | 5 | 0.6% |
| Communications | 0 | 0.0% |
| Arts & Humanities | 106 | 12.9% |
| Total | 820 | 100.0% |
Transportation & Commute in Ware
Vehicle Availability by Sex in Ware
The most prevalent vehicle ownership categories in Ware are males with 2 vehicles (609, accounting for 46.4%) and females with 2 vehicles (470, making up 47.4%).
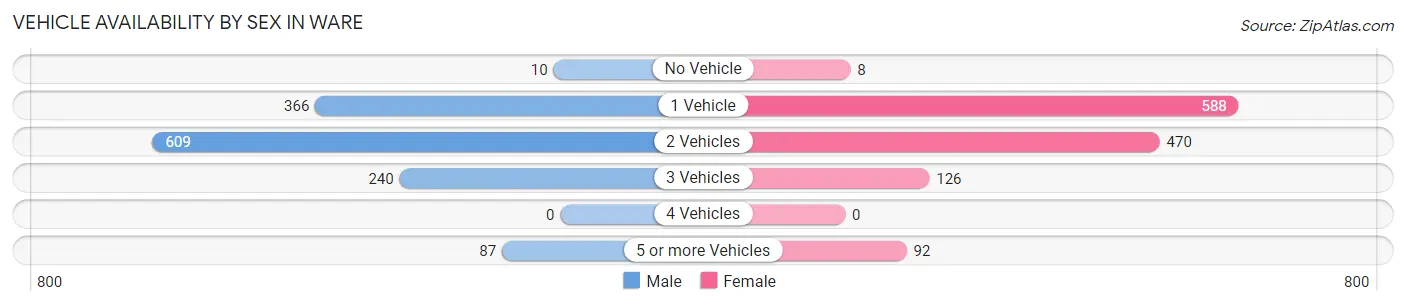
| Vehicles Available | Male | Female |
| No Vehicle | 10 (0.8%) | 8 (0.6%) |
| 1 Vehicle | 366 (27.9%) | 588 (45.8%) |
| 2 Vehicles | 609 (46.4%) | 470 (36.6%) |
| 3 Vehicles | 240 (18.3%) | 126 (9.8%) |
| 4 Vehicles | 0 (0.0%) | 0 (0.0%) |
| 5 or more Vehicles | 87 (6.6%) | 92 (7.2%) |
| Total | 1,312 (100.0%) | 1,284 (100.0%) |
Commute Time in Ware
The most frequently occuring commute durations in Ware are 45 to 59 minutes (563 commuters, 22.8%), 15 to 19 minutes (438 commuters, 17.7%), and 5 to 9 minutes (237 commuters, 9.6%).
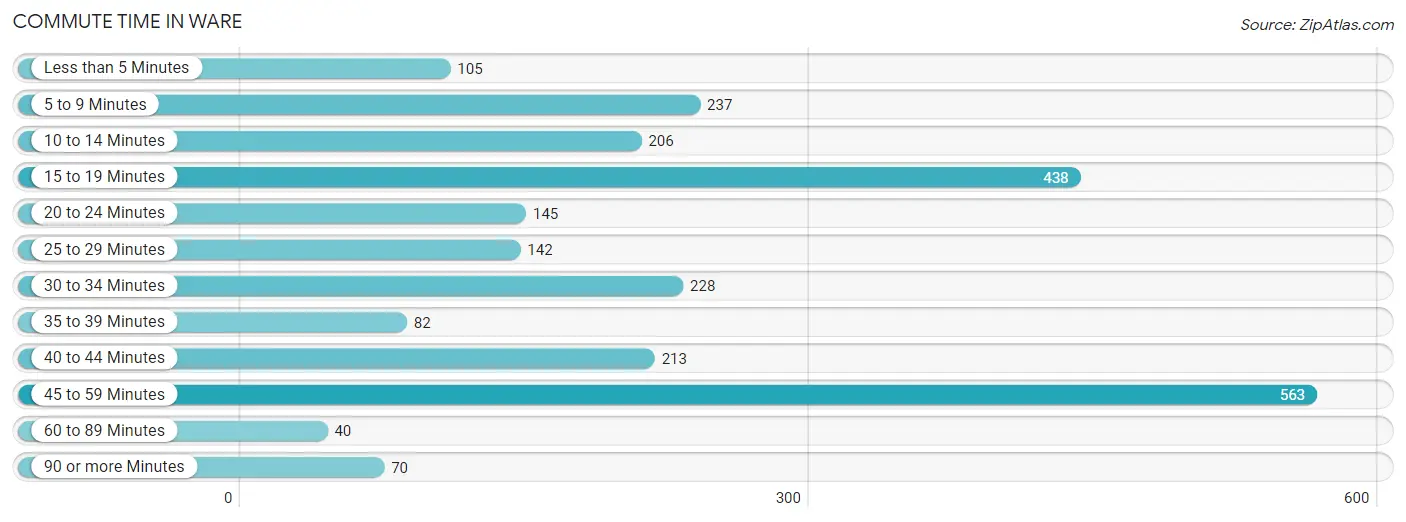
| Commute Time | # Commuters | % Commuters |
| Less than 5 Minutes | 105 | 4.3% |
| 5 to 9 Minutes | 237 | 9.6% |
| 10 to 14 Minutes | 206 | 8.3% |
| 15 to 19 Minutes | 438 | 17.7% |
| 20 to 24 Minutes | 145 | 5.9% |
| 25 to 29 Minutes | 142 | 5.8% |
| 30 to 34 Minutes | 228 | 9.2% |
| 35 to 39 Minutes | 82 | 3.3% |
| 40 to 44 Minutes | 213 | 8.6% |
| 45 to 59 Minutes | 563 | 22.8% |
| 60 to 89 Minutes | 40 | 1.6% |
| 90 or more Minutes | 70 | 2.8% |
Commute Time by Sex in Ware
The most common commute times in Ware are 45 to 59 minutes (403 commuters, 32.3%) for males and 15 to 19 minutes (326 commuters, 26.7%) for females.
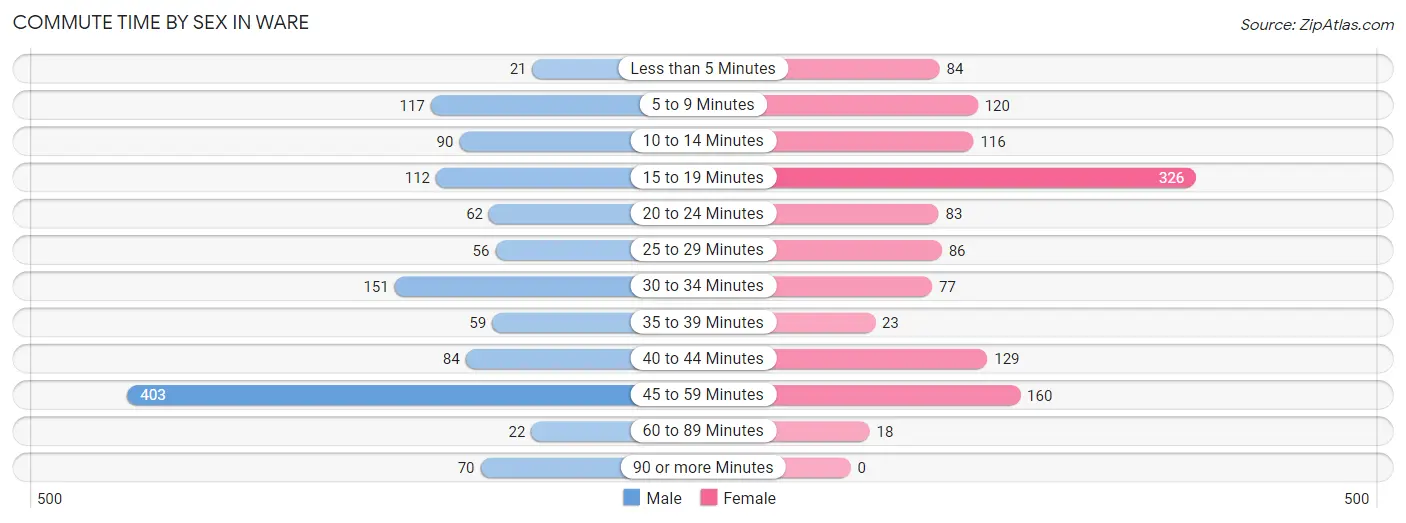
| Commute Time | Male | Female |
| Less than 5 Minutes | 21 (1.7%) | 84 (6.9%) |
| 5 to 9 Minutes | 117 (9.4%) | 120 (9.8%) |
| 10 to 14 Minutes | 90 (7.2%) | 116 (9.5%) |
| 15 to 19 Minutes | 112 (9.0%) | 326 (26.7%) |
| 20 to 24 Minutes | 62 (5.0%) | 83 (6.8%) |
| 25 to 29 Minutes | 56 (4.5%) | 86 (7.0%) |
| 30 to 34 Minutes | 151 (12.1%) | 77 (6.3%) |
| 35 to 39 Minutes | 59 (4.7%) | 23 (1.9%) |
| 40 to 44 Minutes | 84 (6.7%) | 129 (10.6%) |
| 45 to 59 Minutes | 403 (32.3%) | 160 (13.1%) |
| 60 to 89 Minutes | 22 (1.8%) | 18 (1.5%) |
| 90 or more Minutes | 70 (5.6%) | 0 (0.0%) |
Time of Departure to Work by Sex in Ware
The most frequent times of departure to work in Ware are 7:00 AM to 7:29 AM (266, 21.3%) for males and 8:00 AM to 8:29 AM (283, 23.2%) for females.
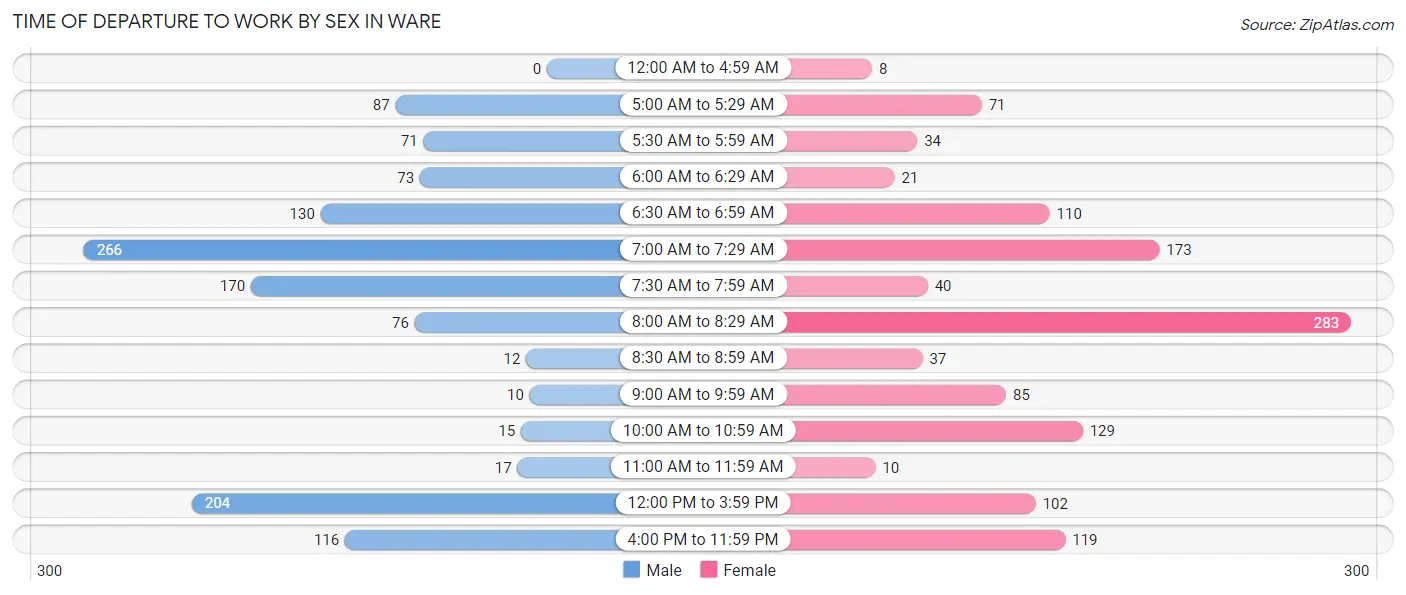
| Time of Departure | Male | Female |
| 12:00 AM to 4:59 AM | 0 (0.0%) | 8 (0.6%) |
| 5:00 AM to 5:29 AM | 87 (7.0%) | 71 (5.8%) |
| 5:30 AM to 5:59 AM | 71 (5.7%) | 34 (2.8%) |
| 6:00 AM to 6:29 AM | 73 (5.9%) | 21 (1.7%) |
| 6:30 AM to 6:59 AM | 130 (10.4%) | 110 (9.0%) |
| 7:00 AM to 7:29 AM | 266 (21.3%) | 173 (14.2%) |
| 7:30 AM to 7:59 AM | 170 (13.6%) | 40 (3.3%) |
| 8:00 AM to 8:29 AM | 76 (6.1%) | 283 (23.2%) |
| 8:30 AM to 8:59 AM | 12 (1.0%) | 37 (3.0%) |
| 9:00 AM to 9:59 AM | 10 (0.8%) | 85 (7.0%) |
| 10:00 AM to 10:59 AM | 15 (1.2%) | 129 (10.6%) |
| 11:00 AM to 11:59 AM | 17 (1.4%) | 10 (0.8%) |
| 12:00 PM to 3:59 PM | 204 (16.4%) | 102 (8.4%) |
| 4:00 PM to 11:59 PM | 116 (9.3%) | 119 (9.7%) |
| Total | 1,247 (100.0%) | 1,222 (100.0%) |
Housing Occupancy in Ware
Occupancy by Ownership in Ware
Of the total 2,880 dwellings in Ware, owner-occupied units account for 1,501 (52.1%), while renter-occupied units make up 1,379 (47.9%).
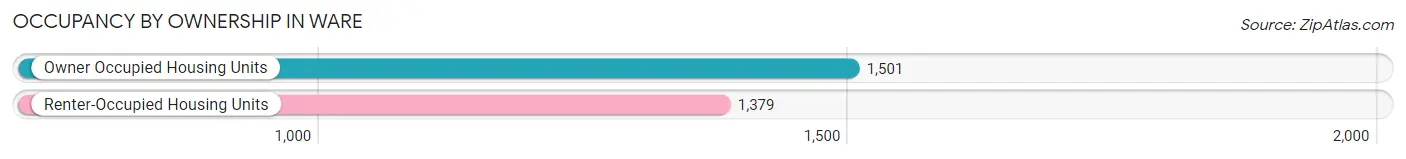
| Occupancy | # Housing Units | % Housing Units |
| Owner Occupied Housing Units | 1,501 | 52.1% |
| Renter-Occupied Housing Units | 1,379 | 47.9% |
| Total Occupied Housing Units | 2,880 | 100.0% |
Occupancy by Household Size in Ware
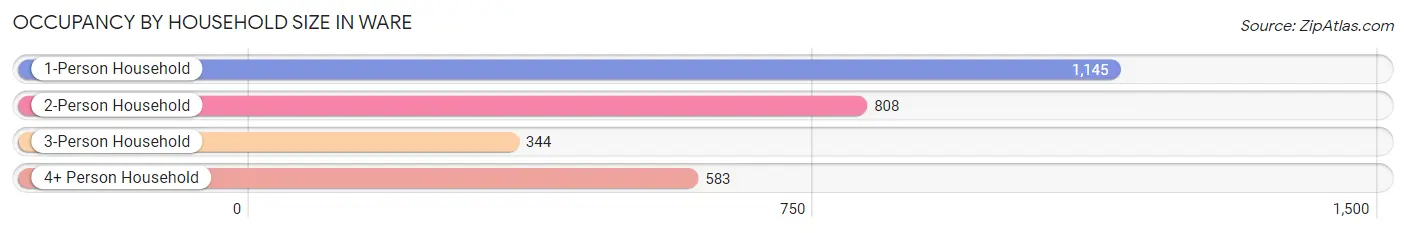
| Household Size | # Housing Units | % Housing Units |
| 1-Person Household | 1,145 | 39.8% |
| 2-Person Household | 808 | 28.1% |
| 3-Person Household | 344 | 11.9% |
| 4+ Person Household | 583 | 20.2% |
| Total Housing Units | 2,880 | 100.0% |
Occupancy by Ownership by Household Size in Ware
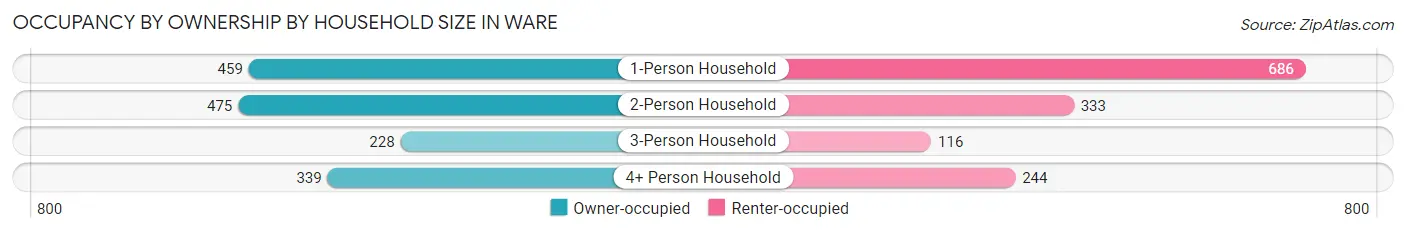
| Household Size | Owner-occupied | Renter-occupied |
| 1-Person Household | 459 (40.1%) | 686 (59.9%) |
| 2-Person Household | 475 (58.8%) | 333 (41.2%) |
| 3-Person Household | 228 (66.3%) | 116 (33.7%) |
| 4+ Person Household | 339 (58.2%) | 244 (41.8%) |
| Total Housing Units | 1,501 (52.1%) | 1,379 (47.9%) |
Occupancy by Educational Attainment in Ware
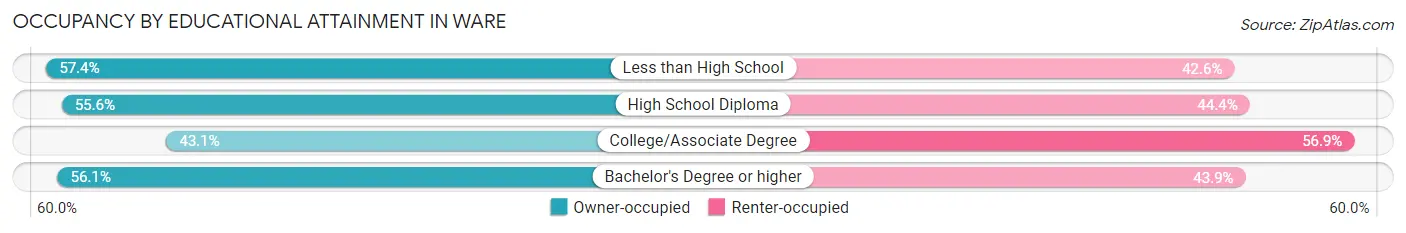
| Household Size | Owner-occupied | Renter-occupied |
| Less than High School | 155 (57.4%) | 115 (42.6%) |
| High School Diploma | 712 (55.6%) | 569 (44.4%) |
| College/Associate Degree | 371 (43.1%) | 489 (56.9%) |
| Bachelor's Degree or higher | 263 (56.1%) | 206 (43.9%) |
Occupancy by Age of Householder in Ware
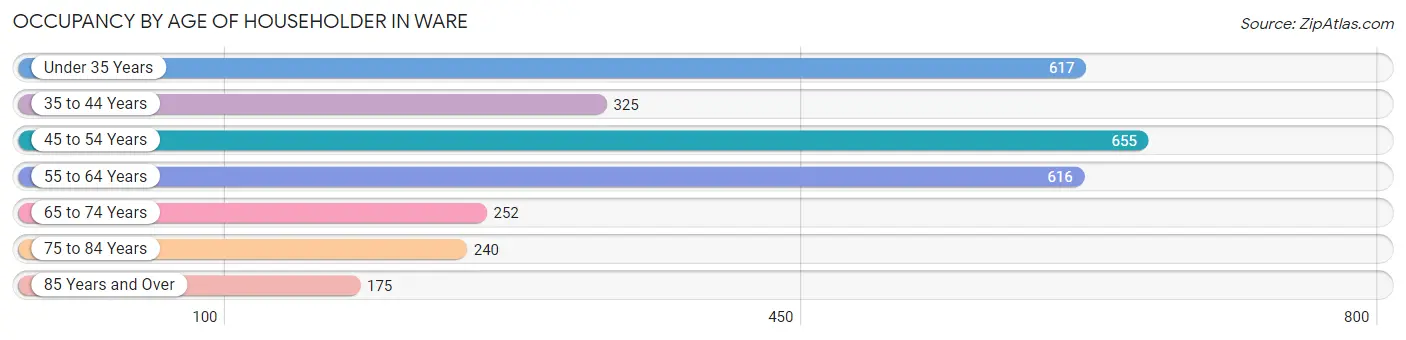
| Age Bracket | # Households | % Households |
| Under 35 Years | 617 | 21.4% |
| 35 to 44 Years | 325 | 11.3% |
| 45 to 54 Years | 655 | 22.7% |
| 55 to 64 Years | 616 | 21.4% |
| 65 to 74 Years | 252 | 8.7% |
| 75 to 84 Years | 240 | 8.3% |
| 85 Years and Over | 175 | 6.1% |
| Total | 2,880 | 100.0% |
Housing Finances in Ware
Median Income by Occupancy in Ware
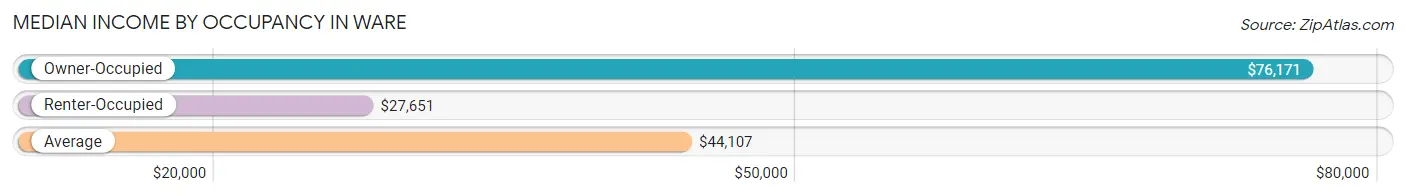
| Occupancy Type | # Households | Median Income |
| Owner-Occupied | 1,501 (52.1%) | $76,171 |
| Renter-Occupied | 1,379 (47.9%) | $27,651 |
| Average | 2,880 (100.0%) | $44,107 |
Occupancy by Householder Income Bracket in Ware
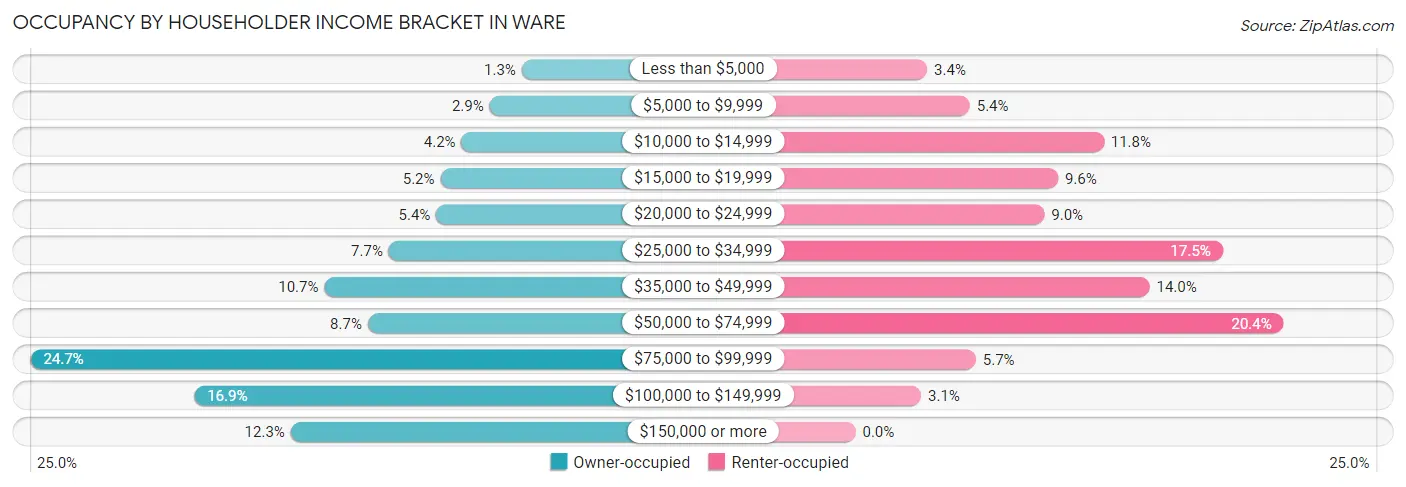
| Income Bracket | Owner-occupied | Renter-occupied |
| Less than $5,000 | 20 (1.3%) | 47 (3.4%) |
| $5,000 to $9,999 | 43 (2.9%) | 75 (5.4%) |
| $10,000 to $14,999 | 63 (4.2%) | 163 (11.8%) |
| $15,000 to $19,999 | 78 (5.2%) | 133 (9.6%) |
| $20,000 to $24,999 | 81 (5.4%) | 124 (9.0%) |
| $25,000 to $34,999 | 115 (7.7%) | 241 (17.5%) |
| $35,000 to $49,999 | 161 (10.7%) | 193 (14.0%) |
| $50,000 to $74,999 | 130 (8.7%) | 281 (20.4%) |
| $75,000 to $99,999 | 371 (24.7%) | 79 (5.7%) |
| $100,000 to $149,999 | 254 (16.9%) | 43 (3.1%) |
| $150,000 or more | 185 (12.3%) | 0 (0.0%) |
| Total | 1,501 (100.0%) | 1,379 (100.0%) |
Monthly Housing Cost Tiers in Ware
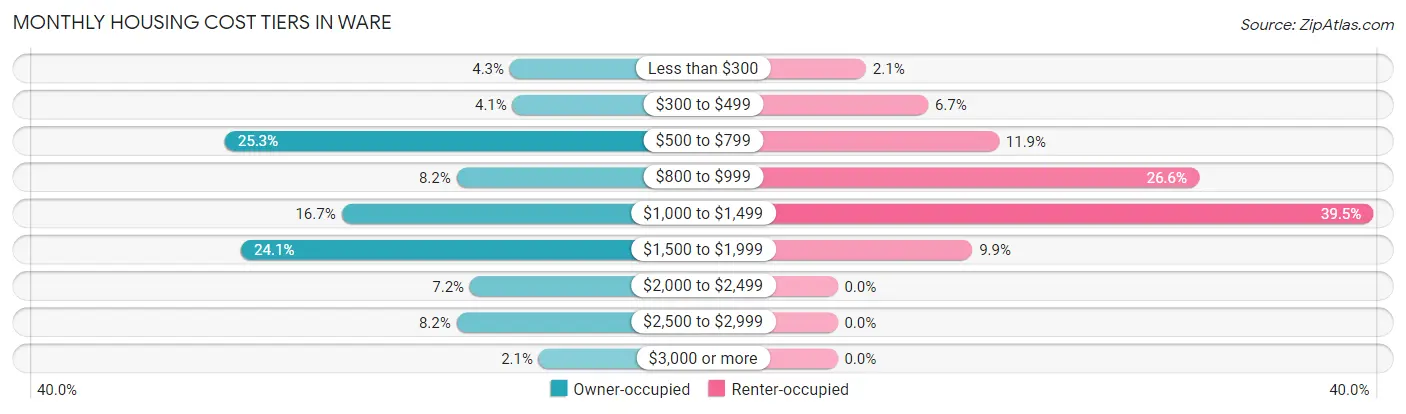
| Monthly Cost | Owner-occupied | Renter-occupied |
| Less than $300 | 64 (4.3%) | 29 (2.1%) |
| $300 to $499 | 61 (4.1%) | 92 (6.7%) |
| $500 to $799 | 379 (25.3%) | 164 (11.9%) |
| $800 to $999 | 123 (8.2%) | 367 (26.6%) |
| $1,000 to $1,499 | 250 (16.7%) | 544 (39.5%) |
| $1,500 to $1,999 | 361 (24.0%) | 137 (9.9%) |
| $2,000 to $2,499 | 108 (7.2%) | 0 (0.0%) |
| $2,500 to $2,999 | 123 (8.2%) | 0 (0.0%) |
| $3,000 or more | 32 (2.1%) | 0 (0.0%) |
| Total | 1,501 (100.0%) | 1,379 (100.0%) |
Physical Housing Characteristics in Ware
Housing Structures in Ware
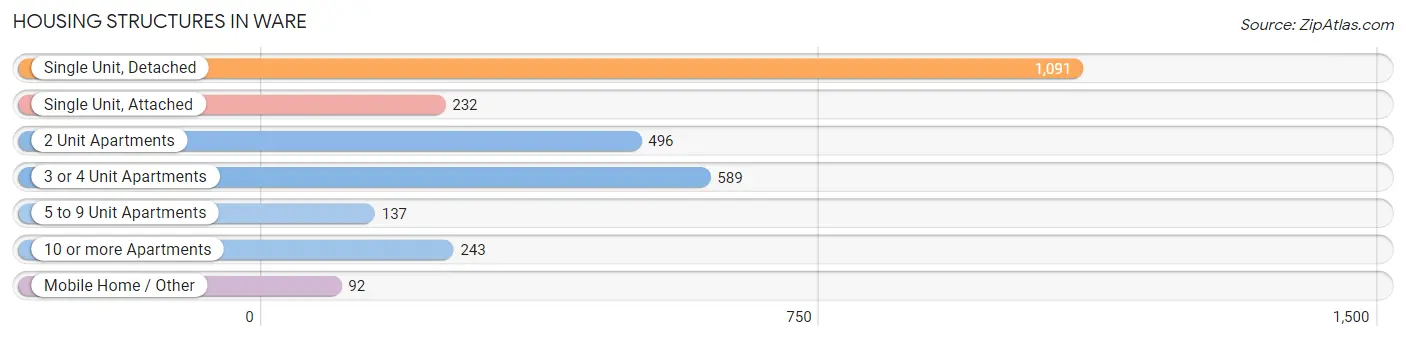
| Structure Type | # Housing Units | % Housing Units |
| Single Unit, Detached | 1,091 | 37.9% |
| Single Unit, Attached | 232 | 8.1% |
| 2 Unit Apartments | 496 | 17.2% |
| 3 or 4 Unit Apartments | 589 | 20.4% |
| 5 to 9 Unit Apartments | 137 | 4.8% |
| 10 or more Apartments | 243 | 8.4% |
| Mobile Home / Other | 92 | 3.2% |
| Total | 2,880 | 100.0% |
Housing Structures by Occupancy in Ware
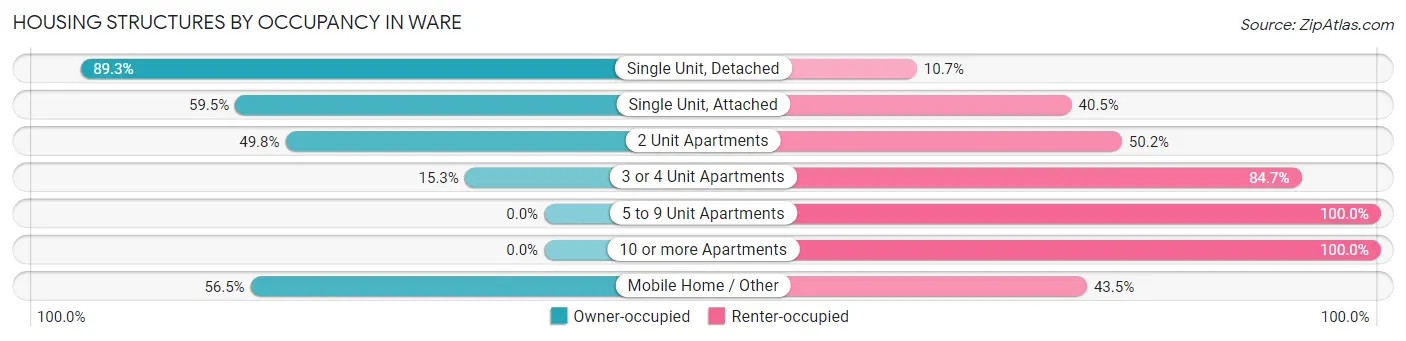
| Structure Type | Owner-occupied | Renter-occupied |
| Single Unit, Detached | 974 (89.3%) | 117 (10.7%) |
| Single Unit, Attached | 138 (59.5%) | 94 (40.5%) |
| 2 Unit Apartments | 247 (49.8%) | 249 (50.2%) |
| 3 or 4 Unit Apartments | 90 (15.3%) | 499 (84.7%) |
| 5 to 9 Unit Apartments | 0 (0.0%) | 137 (100.0%) |
| 10 or more Apartments | 0 (0.0%) | 243 (100.0%) |
| Mobile Home / Other | 52 (56.5%) | 40 (43.5%) |
| Total | 1,501 (52.1%) | 1,379 (47.9%) |
Housing Structures by Number of Rooms in Ware
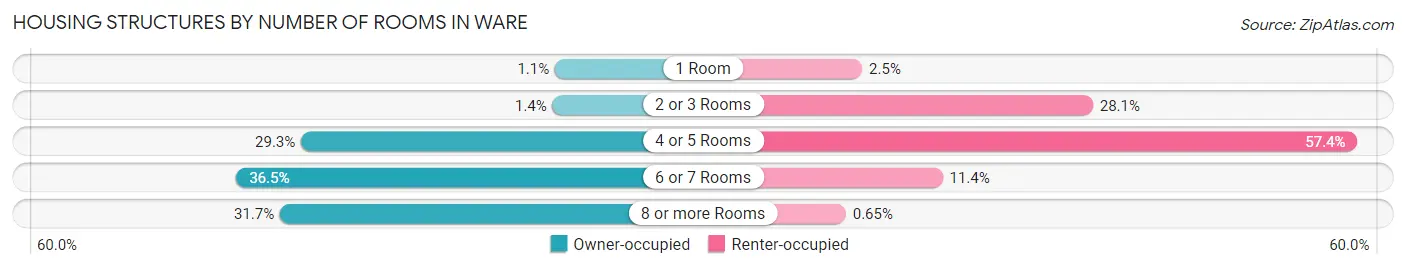
| Number of Rooms | Owner-occupied | Renter-occupied |
| 1 Room | 17 (1.1%) | 34 (2.5%) |
| 2 or 3 Rooms | 21 (1.4%) | 387 (28.1%) |
| 4 or 5 Rooms | 440 (29.3%) | 792 (57.4%) |
| 6 or 7 Rooms | 548 (36.5%) | 157 (11.4%) |
| 8 or more Rooms | 475 (31.7%) | 9 (0.6%) |
| Total | 1,501 (100.0%) | 1,379 (100.0%) |
Housing Structure by Heating Type in Ware
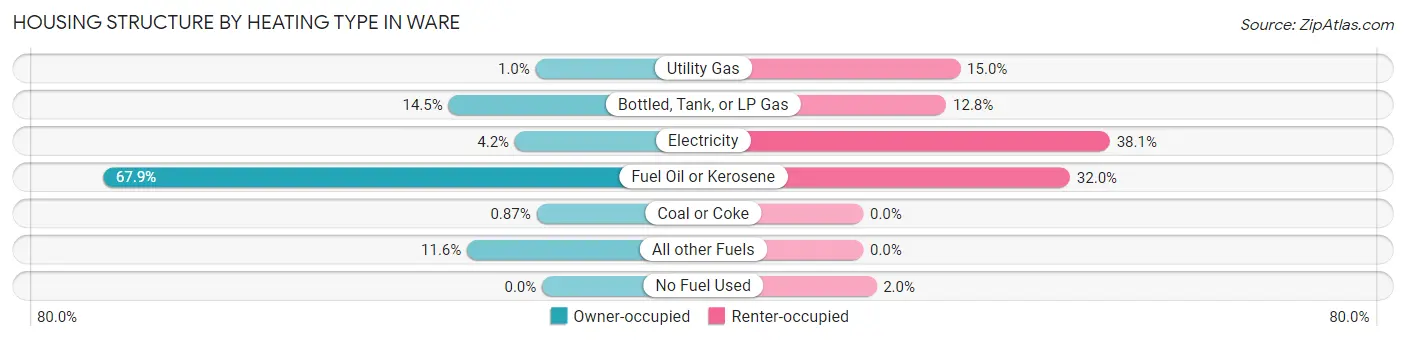
| Heating Type | Owner-occupied | Renter-occupied |
| Utility Gas | 15 (1.0%) | 207 (15.0%) |
| Bottled, Tank, or LP Gas | 217 (14.5%) | 177 (12.8%) |
| Electricity | 63 (4.2%) | 526 (38.1%) |
| Fuel Oil or Kerosene | 1,019 (67.9%) | 441 (32.0%) |
| Coal or Coke | 13 (0.9%) | 0 (0.0%) |
| All other Fuels | 174 (11.6%) | 0 (0.0%) |
| No Fuel Used | 0 (0.0%) | 28 (2.0%) |
| Total | 1,501 (100.0%) | 1,379 (100.0%) |
Household Vehicle Usage in Ware
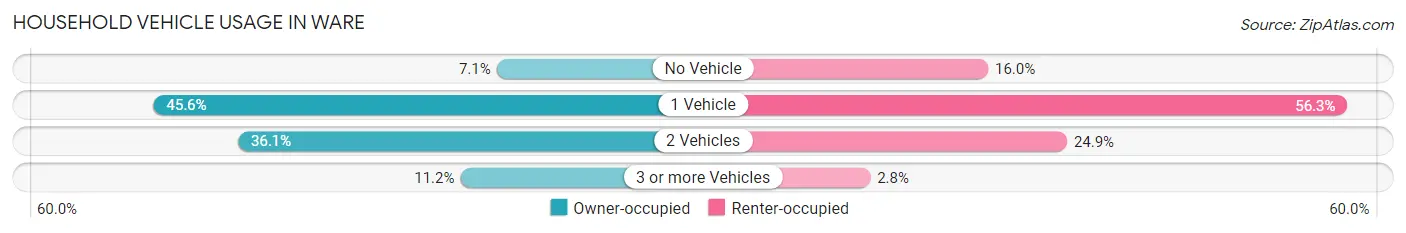
| Vehicles per Household | Owner-occupied | Renter-occupied |
| No Vehicle | 107 (7.1%) | 221 (16.0%) |
| 1 Vehicle | 684 (45.6%) | 776 (56.3%) |
| 2 Vehicles | 542 (36.1%) | 343 (24.9%) |
| 3 or more Vehicles | 168 (11.2%) | 39 (2.8%) |
| Total | 1,501 (100.0%) | 1,379 (100.0%) |
Real Estate & Mortgages in Ware
Real Estate and Mortgage Overview in Ware
| Characteristic | Without Mortgage | With Mortgage |
| Housing Units | 652 | 849 |
| Median Property Value | $203,000 | $199,500 |
| Median Household Income | $31,882 | $109 |
| Monthly Housing Costs | $649 | $32 |
| Real Estate Taxes | $2,951 | $21 |
Property Value by Mortgage Status in Ware
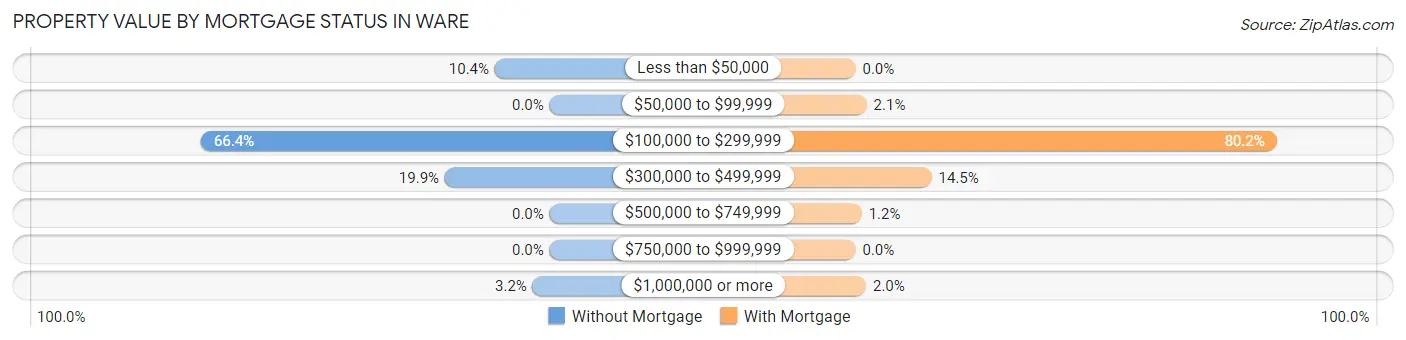
| Property Value | Without Mortgage | With Mortgage |
| Less than $50,000 | 68 (10.4%) | 0 (0.0%) |
| $50,000 to $99,999 | 0 (0.0%) | 18 (2.1%) |
| $100,000 to $299,999 | 433 (66.4%) | 681 (80.2%) |
| $300,000 to $499,999 | 130 (19.9%) | 123 (14.5%) |
| $500,000 to $749,999 | 0 (0.0%) | 10 (1.2%) |
| $750,000 to $999,999 | 0 (0.0%) | 0 (0.0%) |
| $1,000,000 or more | 21 (3.2%) | 17 (2.0%) |
| Total | 652 (100.0%) | 849 (100.0%) |
Household Income by Mortgage Status in Ware
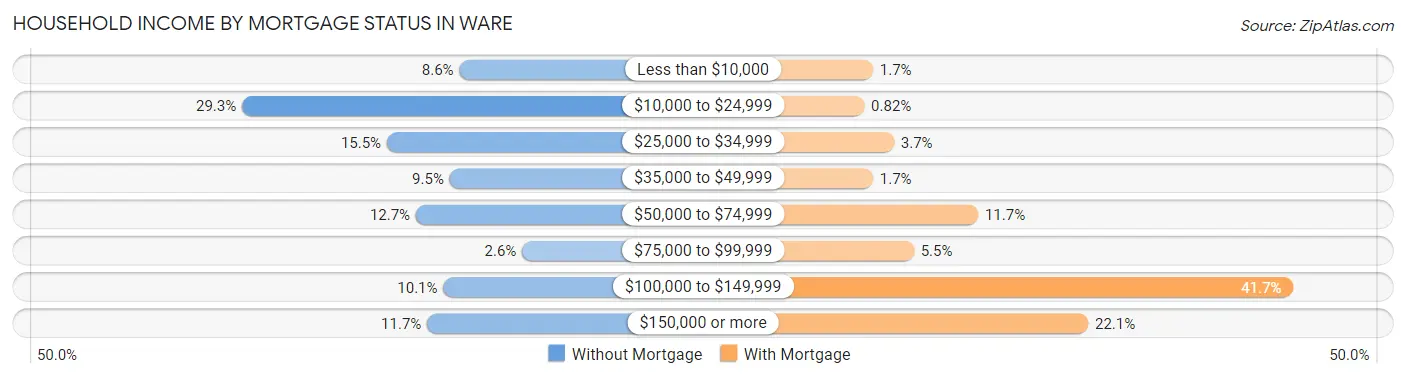
| Household Income | Without Mortgage | With Mortgage |
| Less than $10,000 | 56 (8.6%) | 14 (1.7%) |
| $10,000 to $24,999 | 191 (29.3%) | 7 (0.8%) |
| $25,000 to $34,999 | 101 (15.5%) | 31 (3.6%) |
| $35,000 to $49,999 | 62 (9.5%) | 14 (1.7%) |
| $50,000 to $74,999 | 83 (12.7%) | 99 (11.7%) |
| $75,000 to $99,999 | 17 (2.6%) | 47 (5.5%) |
| $100,000 to $149,999 | 66 (10.1%) | 354 (41.7%) |
| $150,000 or more | 76 (11.7%) | 188 (22.1%) |
| Total | 652 (100.0%) | 849 (100.0%) |
Property Value to Household Income Ratio in Ware
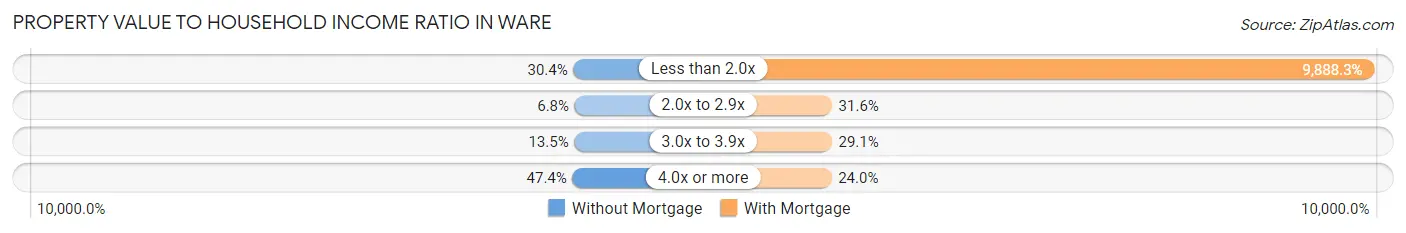
| Value-to-Income Ratio | Without Mortgage | With Mortgage |
| Less than 2.0x | 198 (30.4%) | 83,952 (9,888.3%) |
| 2.0x to 2.9x | 44 (6.8%) | 268 (31.6%) |
| 3.0x to 3.9x | 88 (13.5%) | 247 (29.1%) |
| 4.0x or more | 309 (47.4%) | 204 (24.0%) |
| Total | 652 (100.0%) | 849 (100.0%) |
Real Estate Taxes by Mortgage Status in Ware
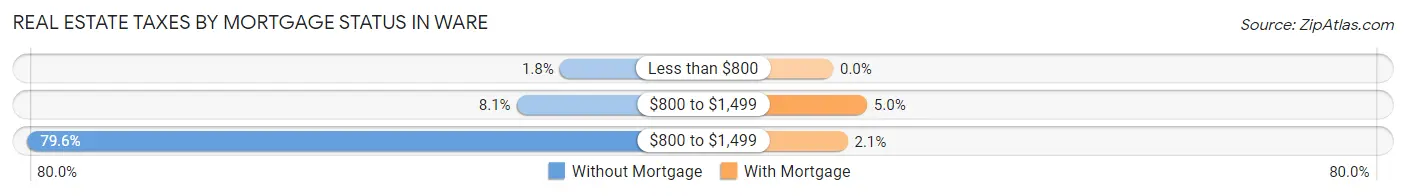
| Property Taxes | Without Mortgage | With Mortgage |
| Less than $800 | 12 (1.8%) | 0 (0.0%) |
| $800 to $1,499 | 53 (8.1%) | 42 (5.0%) |
| $800 to $1,499 | 519 (79.6%) | 18 (2.1%) |
| Total | 652 (100.0%) | 849 (100.0%) |
Health & Disability in Ware
Health Insurance Coverage by Age in Ware
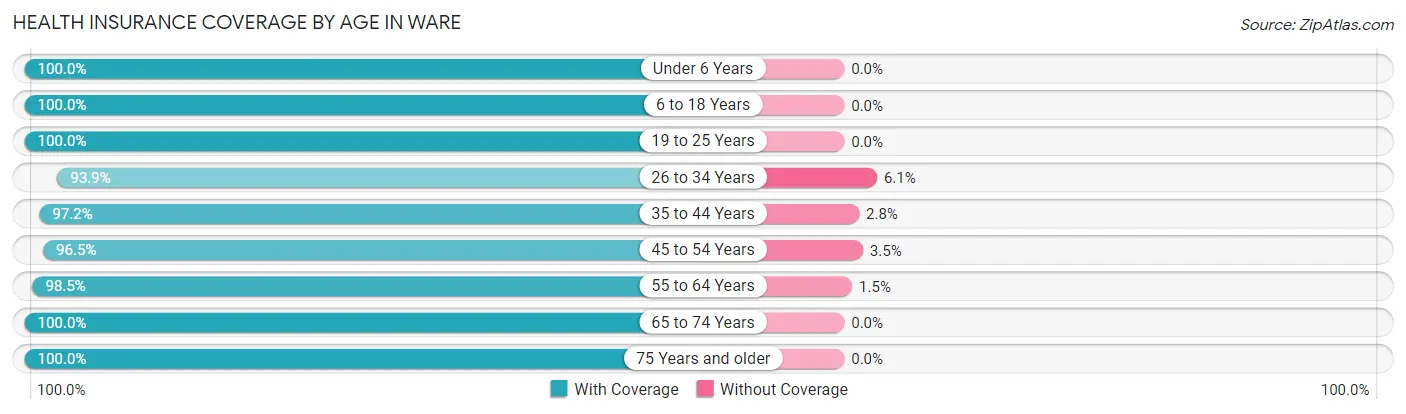
| Age Bracket | With Coverage | Without Coverage |
| Under 6 Years | 350 (100.0%) | 0 (0.0%) |
| 6 to 18 Years | 1,386 (100.0%) | 0 (0.0%) |
| 19 to 25 Years | 484 (100.0%) | 0 (0.0%) |
| 26 to 34 Years | 708 (93.9%) | 46 (6.1%) |
| 35 to 44 Years | 669 (97.2%) | 19 (2.8%) |
| 45 to 54 Years | 863 (96.5%) | 31 (3.5%) |
| 55 to 64 Years | 739 (98.5%) | 11 (1.5%) |
| 65 to 74 Years | 386 (100.0%) | 0 (0.0%) |
| 75 Years and older | 556 (100.0%) | 0 (0.0%) |
| Total | 6,141 (98.3%) | 107 (1.7%) |
Health Insurance Coverage by Citizenship Status in Ware
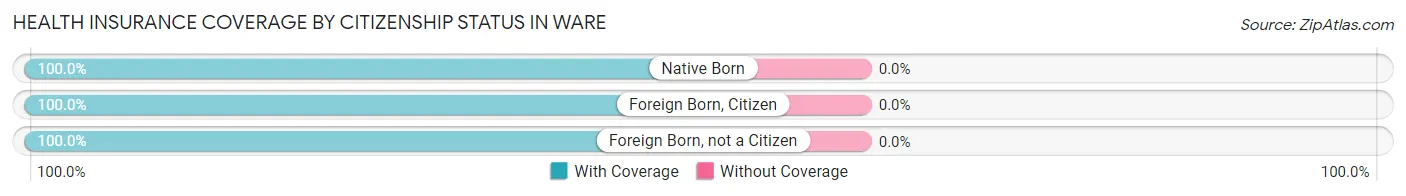
| Citizenship Status | With Coverage | Without Coverage |
| Native Born | 350 (100.0%) | 0 (0.0%) |
| Foreign Born, Citizen | 1,386 (100.0%) | 0 (0.0%) |
| Foreign Born, not a Citizen | 484 (100.0%) | 0 (0.0%) |
Health Insurance Coverage by Household Income in Ware
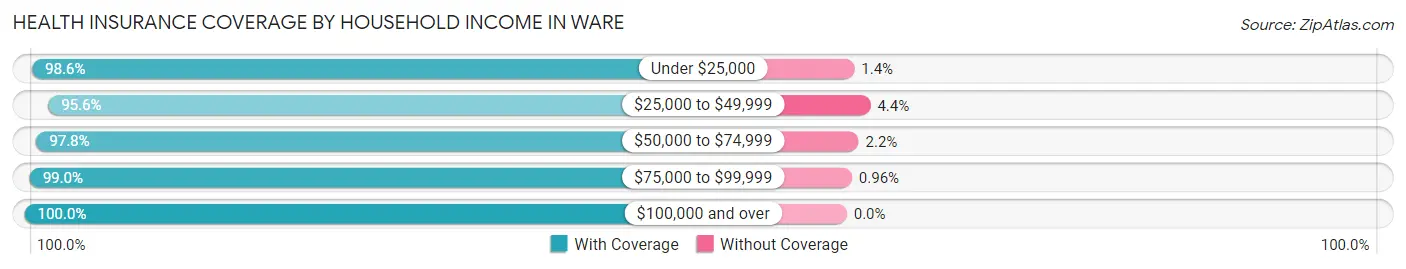
| Household Income | With Coverage | Without Coverage |
| Under $25,000 | 1,257 (98.6%) | 18 (1.4%) |
| $25,000 to $49,999 | 1,164 (95.6%) | 54 (4.4%) |
| $50,000 to $74,999 | 931 (97.8%) | 21 (2.2%) |
| $75,000 to $99,999 | 1,338 (99.0%) | 13 (1.0%) |
| $100,000 and over | 1,446 (100.0%) | 0 (0.0%) |
Public vs Private Health Insurance Coverage by Age in Ware
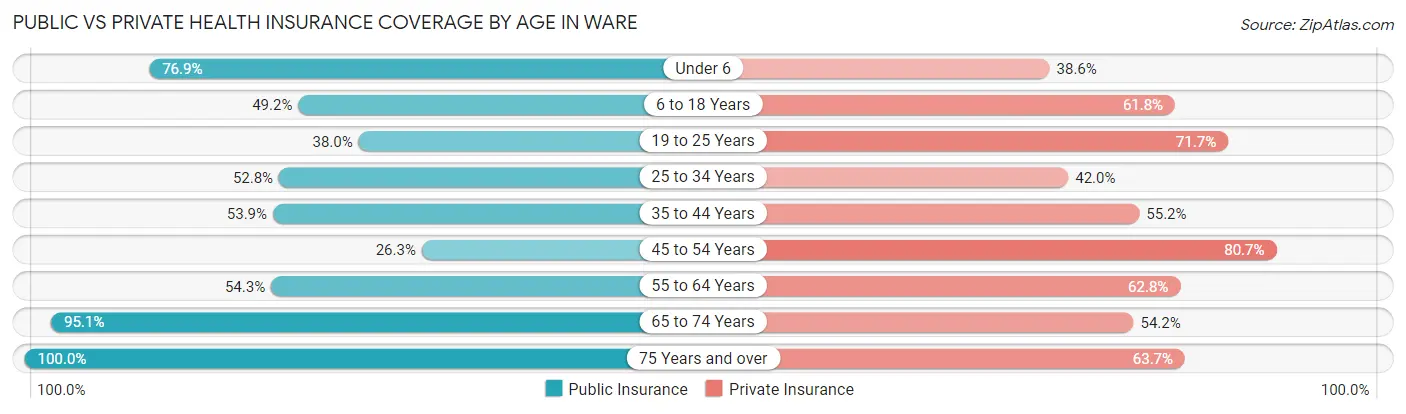
| Age Bracket | Public Insurance | Private Insurance |
| Under 6 | 269 (76.9%) | 135 (38.6%) |
| 6 to 18 Years | 682 (49.2%) | 857 (61.8%) |
| 19 to 25 Years | 184 (38.0%) | 347 (71.7%) |
| 25 to 34 Years | 398 (52.8%) | 317 (42.0%) |
| 35 to 44 Years | 371 (53.9%) | 380 (55.2%) |
| 45 to 54 Years | 235 (26.3%) | 721 (80.6%) |
| 55 to 64 Years | 407 (54.3%) | 471 (62.8%) |
| 65 to 74 Years | 367 (95.1%) | 209 (54.1%) |
| 75 Years and over | 556 (100.0%) | 354 (63.7%) |
| Total | 3,469 (55.5%) | 3,791 (60.7%) |
Disability Status by Sex by Age in Ware
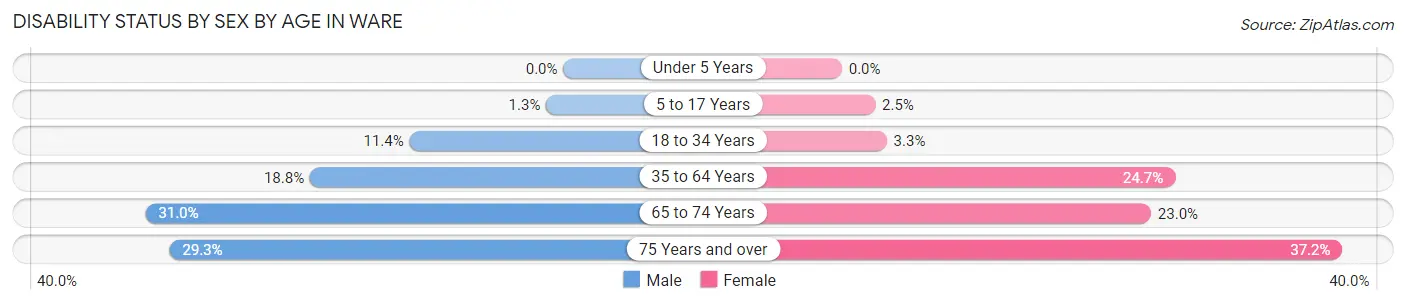
| Age Bracket | Male | Female |
| Under 5 Years | 0 (0.0%) | 0 (0.0%) |
| 5 to 17 Years | 7 (1.3%) | 19 (2.5%) |
| 18 to 34 Years | 77 (11.4%) | 21 (3.3%) |
| 35 to 64 Years | 219 (18.8%) | 289 (24.7%) |
| 65 to 74 Years | 63 (31.0%) | 42 (23.0%) |
| 75 Years and over | 43 (29.2%) | 152 (37.2%) |
Disability Class by Sex by Age in Ware
Disability Class: Hearing Difficulty
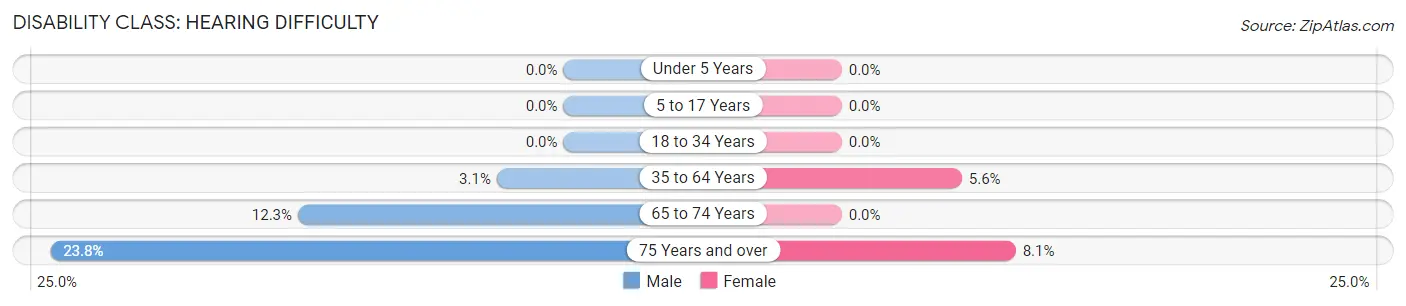
| Age Bracket | Male | Female |
| Under 5 Years | 0 (0.0%) | 0 (0.0%) |
| 5 to 17 Years | 0 (0.0%) | 0 (0.0%) |
| 18 to 34 Years | 0 (0.0%) | 0 (0.0%) |
| 35 to 64 Years | 36 (3.1%) | 65 (5.6%) |
| 65 to 74 Years | 25 (12.3%) | 0 (0.0%) |
| 75 Years and over | 35 (23.8%) | 33 (8.1%) |
Disability Class: Vision Difficulty
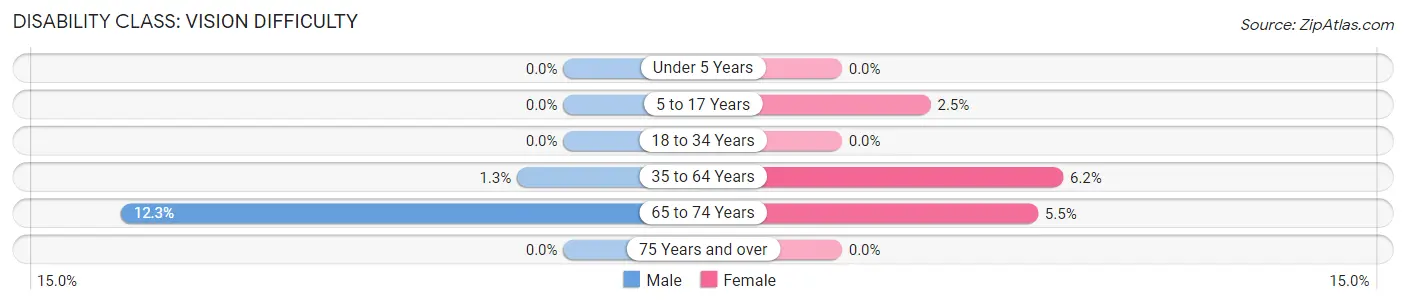
| Age Bracket | Male | Female |
| Under 5 Years | 0 (0.0%) | 0 (0.0%) |
| 5 to 17 Years | 0 (0.0%) | 19 (2.5%) |
| 18 to 34 Years | 0 (0.0%) | 0 (0.0%) |
| 35 to 64 Years | 15 (1.3%) | 72 (6.2%) |
| 65 to 74 Years | 25 (12.3%) | 10 (5.5%) |
| 75 Years and over | 0 (0.0%) | 0 (0.0%) |
Disability Class: Cognitive Difficulty

| Age Bracket | Male | Female |
| 5 to 17 Years | 7 (1.3%) | 0 (0.0%) |
| 18 to 34 Years | 63 (9.3%) | 10 (1.6%) |
| 35 to 64 Years | 75 (6.4%) | 96 (8.2%) |
| 65 to 74 Years | 0 (0.0%) | 19 (10.4%) |
| 75 Years and over | 8 (5.4%) | 22 (5.4%) |
Disability Class: Ambulatory Difficulty
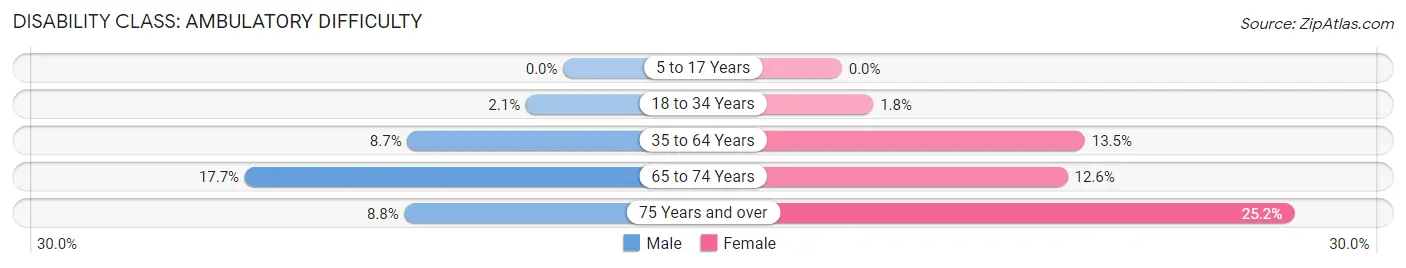
| Age Bracket | Male | Female |
| 5 to 17 Years | 0 (0.0%) | 0 (0.0%) |
| 18 to 34 Years | 14 (2.1%) | 11 (1.8%) |
| 35 to 64 Years | 101 (8.7%) | 158 (13.5%) |
| 65 to 74 Years | 36 (17.7%) | 23 (12.6%) |
| 75 Years and over | 13 (8.8%) | 103 (25.2%) |
Disability Class: Self-Care Difficulty
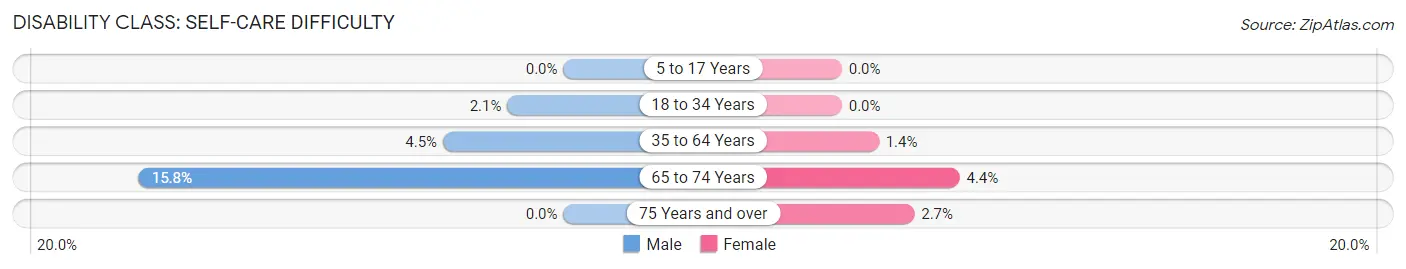
| Age Bracket | Male | Female |
| 5 to 17 Years | 0 (0.0%) | 0 (0.0%) |
| 18 to 34 Years | 14 (2.1%) | 0 (0.0%) |
| 35 to 64 Years | 52 (4.5%) | 16 (1.4%) |
| 65 to 74 Years | 32 (15.8%) | 8 (4.4%) |
| 75 Years and over | 0 (0.0%) | 11 (2.7%) |
Technology Access in Ware
Computing Device Access in Ware
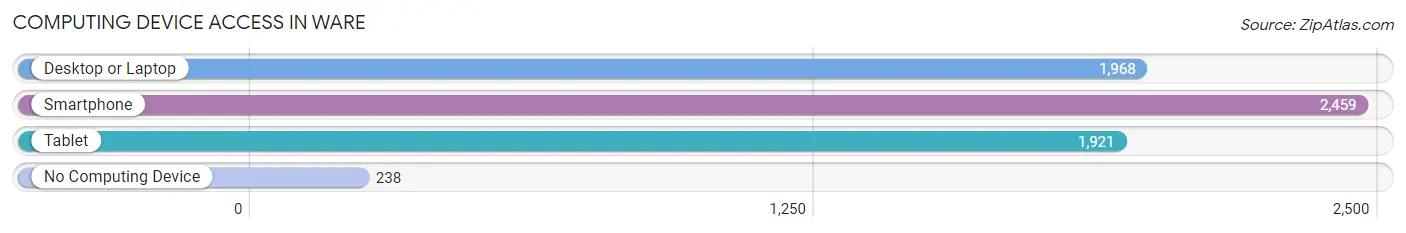
| Device Type | # Households | % Households |
| Desktop or Laptop | 1,968 | 68.3% |
| Smartphone | 2,459 | 85.4% |
| Tablet | 1,921 | 66.7% |
| No Computing Device | 238 | 8.3% |
| Total | 2,880 | 100.0% |
Internet Access in Ware
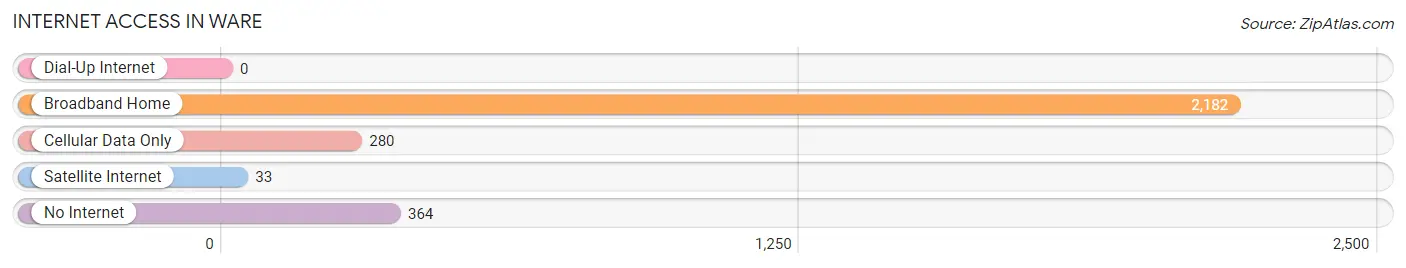
| Internet Type | # Households | % Households |
| Dial-Up Internet | 0 | 0.0% |
| Broadband Home | 2,182 | 75.8% |
| Cellular Data Only | 280 | 9.7% |
| Satellite Internet | 33 | 1.1% |
| No Internet | 364 | 12.6% |
| Total | 2,880 | 100.0% |
Ware Summary
Ware is a town located in Hampshire County, Massachusetts, United States. The population was 9,872 at the 2010 census. It is part of the Springfield, Massachusetts Metropolitan Statistical Area.
History
The area that is now Ware was first settled in 1717 and was officially incorporated in 1775. The town was named after the English town of Ware in Hertfordshire. Ware was the birthplace of the American Industrial Revolution, as the first water-powered cotton mill in the United States was built there in 1790. The mill was built by industrialist and inventor Eli Whitney, who is best known for inventing the cotton gin.
Geography
Ware is located in central Hampshire County, bordered by Belchertown to the north, Palmer to the east, Warren to the south, and Hardwick to the west. The town is located at the confluence of the Quaboag and Ware rivers, which form the Chicopee River. The town is located approximately 20 miles west of Springfield and 50 miles west of Boston.
The town has a total area of 24.2 square miles, of which 23.9 square miles is land and 0.3 square miles is water. The town is mostly rural, with a few small villages scattered throughout.
Economy
The economy of Ware is largely based on agriculture and manufacturing. The town is home to several small farms, which produce a variety of crops, including corn, hay, and apples. The town is also home to several small manufacturing companies, which produce a variety of products, including textiles, paper products, and furniture.
Demographics
As of the 2010 census, there were 9,872 people, 3,845 households, and 2,619 families residing in the town. The population density was 412.2 people per square mile. The racial makeup of the town was 94.2% White, 1.7% African American, 0.3% Native American, 0.7% Asian, 0.1% Pacific Islander, 1.2% from other races, and 1.9% from two or more races. Hispanic or Latino of any race were 3.2% of the population.
The median income for a household in the town was $50,945, and the median income for a family was $60,945. The per capita income for the town was $23,945. About 6.2% of families and 8.2% of the population were below the poverty line, including 10.2% of those under age 18 and 6.2% of those age 65 or over.
Common Questions
What is Per Capita Income in Ware?
Per Capita income in Ware is $28,363.
What is the Median Family Income in Ware?
Median Family Income in Ware is $68,777.
What is the Median Household income in Ware?
Median Household Income in Ware is $44,107.
What is Income or Wage Gap in Ware?
Income or Wage Gap in Ware is 35.2%.
Women in Ware earn 64.8 cents for every dollar earned by a man.
What is Inequality or Gini Index in Ware?
Inequality or Gini Index in Ware is 0.46.
What is the Total Population of Ware?
Total Population of Ware is 6,253.
What is the Total Male Population of Ware?
Total Male Population of Ware is 2,896.
What is the Total Female Population of Ware?
Total Female Population of Ware is 3,357.
What is the Ratio of Males per 100 Females in Ware?
There are 86.27 Males per 100 Females in Ware.
What is the Ratio of Females per 100 Males in Ware?
There are 115.92 Females per 100 Males in Ware.
What is the Median Population Age in Ware?
Median Population Age in Ware is 38.6 Years.
What is the Average Family Size in Ware
Average Family Size in Ware is 2.9 People.
What is the Average Household Size in Ware
Average Household Size in Ware is 2.2 People.
How Large is the Labor Force in Ware?
There are 3,103 People in the Labor Forcein in Ware.
What is the Percentage of People in the Labor Force in Ware?
62.4% of People are in the Labor Force in Ware.
What is the Unemployment Rate in Ware?
Unemployment Rate in Ware is 12.3%.