Gotha, FL Map & Demographics
Gotha Map
Gotha Overview
$72,747
PER CAPITA INCOME
$176,058
AVG FAMILY INCOME
$174,750
AVG HOUSEHOLD INCOME
42.7%
WAGE / INCOME GAP [ % ]
57.3¢/ $1
WAGE / INCOME GAP [ $ ]
0.50
INEQUALITY / GINI INDEX
1,640
TOTAL POPULATION
790
MALE POPULATION
850
FEMALE POPULATION
92.94
MALES / 100 FEMALES
107.59
FEMALES / 100 MALES
28.9
MEDIAN AGE
3.9
AVG FAMILY SIZE
3.8
AVG HOUSEHOLD SIZE
716
LABOR FORCE [ PEOPLE ]
67.8%
PERCENT IN LABOR FORCE
2.1%
UNEMPLOYMENT RATE
Gotha Zip Codes
Gotha Area Codes
Income in Gotha
Income Overview in Gotha
Per Capita Income in Gotha is $72,747, while median incomes of families and households are $176,058 and $174,750 respectively.
| Characteristic | Number | Measure |
| Per Capita Income | 1,640 | $72,747 |
| Median Family Income | 421 | $176,058 |
| Mean Family Income | 421 | $283,519 |
| Median Household Income | 436 | $174,750 |
| Mean Household Income | 436 | $274,334 |
| Income Deficit | 421 | $0 |
| Wage / Income Gap (%) | 1,640 | 42.70% |
| Wage / Income Gap ($) | 1,640 | 57.30¢ per $1 |
| Gini / Inequality Index | 1,640 | 0.50 |
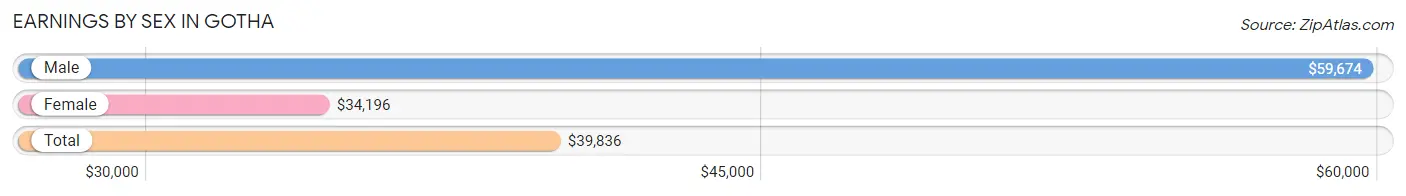
Earnings by Sex in Gotha
Average Earnings in Gotha are $39,836, $59,674 for men and $34,196 for women, a difference of 42.7%.
| Sex | Number | Average Earnings |
| Male | 452 (54.7%) | $59,674 |
| Female | 375 (45.3%) | $34,196 |
| Total | 827 (100.0%) | $39,836 |
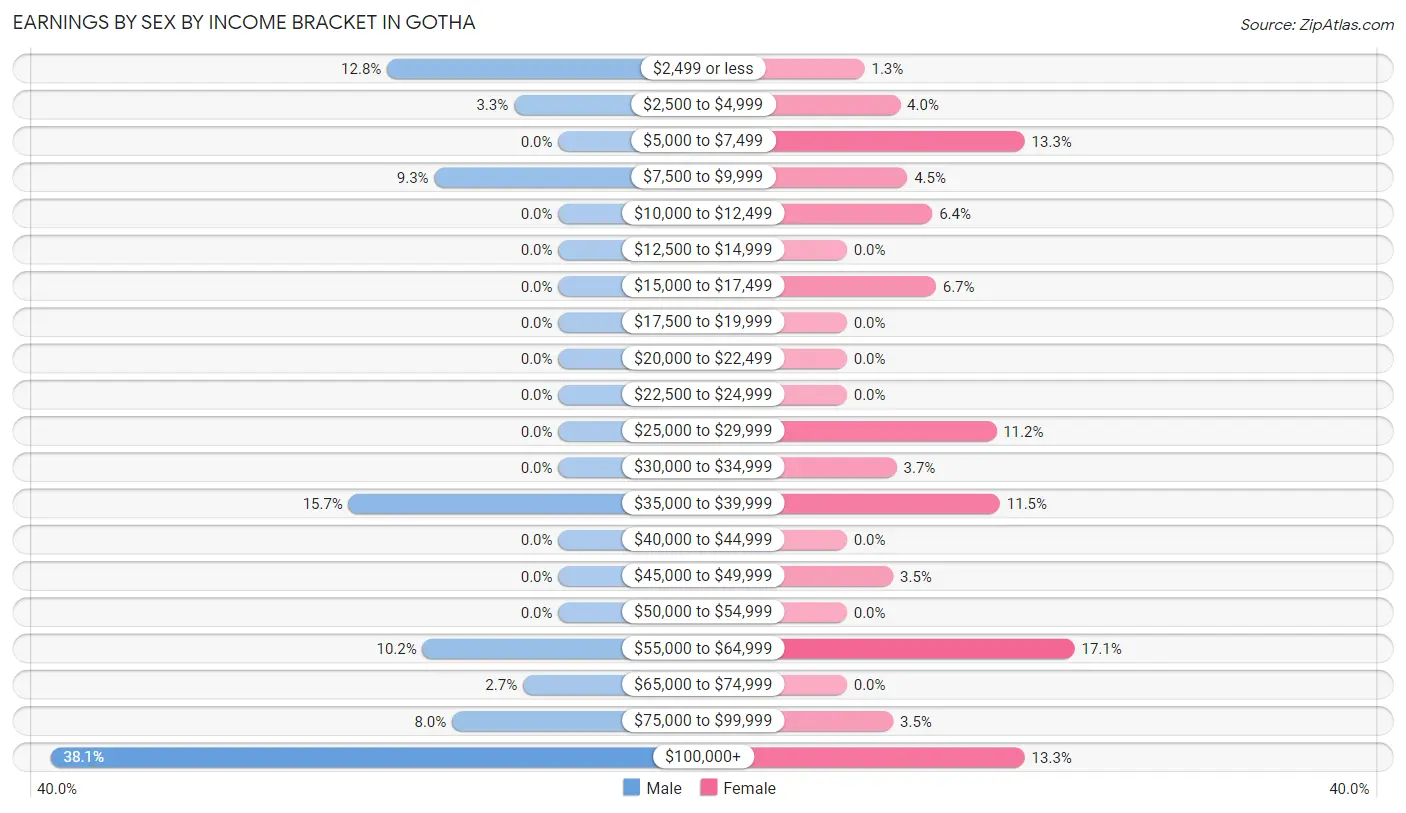
Earnings by Sex by Income Bracket in Gotha
The most common earnings brackets in Gotha are $100,000+ for men (172 | 38.1%) and $55,000 to $64,999 for women (64 | 17.1%).
| Income | Male | Female |
| $2,499 or less | 58 (12.8%) | 5 (1.3%) |
| $2,500 to $4,999 | 15 (3.3%) | 15 (4.0%) |
| $5,000 to $7,499 | 0 (0.0%) | 50 (13.3%) |
| $7,500 to $9,999 | 42 (9.3%) | 17 (4.5%) |
| $10,000 to $12,499 | 0 (0.0%) | 24 (6.4%) |
| $12,500 to $14,999 | 0 (0.0%) | 0 (0.0%) |
| $15,000 to $17,499 | 0 (0.0%) | 25 (6.7%) |
| $17,500 to $19,999 | 0 (0.0%) | 0 (0.0%) |
| $20,000 to $22,499 | 0 (0.0%) | 0 (0.0%) |
| $22,500 to $24,999 | 0 (0.0%) | 0 (0.0%) |
| $25,000 to $29,999 | 0 (0.0%) | 42 (11.2%) |
| $30,000 to $34,999 | 0 (0.0%) | 14 (3.7%) |
| $35,000 to $39,999 | 71 (15.7%) | 43 (11.5%) |
| $40,000 to $44,999 | 0 (0.0%) | 0 (0.0%) |
| $45,000 to $49,999 | 0 (0.0%) | 13 (3.5%) |
| $50,000 to $54,999 | 0 (0.0%) | 0 (0.0%) |
| $55,000 to $64,999 | 46 (10.2%) | 64 (17.1%) |
| $65,000 to $74,999 | 12 (2.6%) | 0 (0.0%) |
| $75,000 to $99,999 | 36 (8.0%) | 13 (3.5%) |
| $100,000+ | 172 (38.1%) | 50 (13.3%) |
| Total | 452 (100.0%) | 375 (100.0%) |
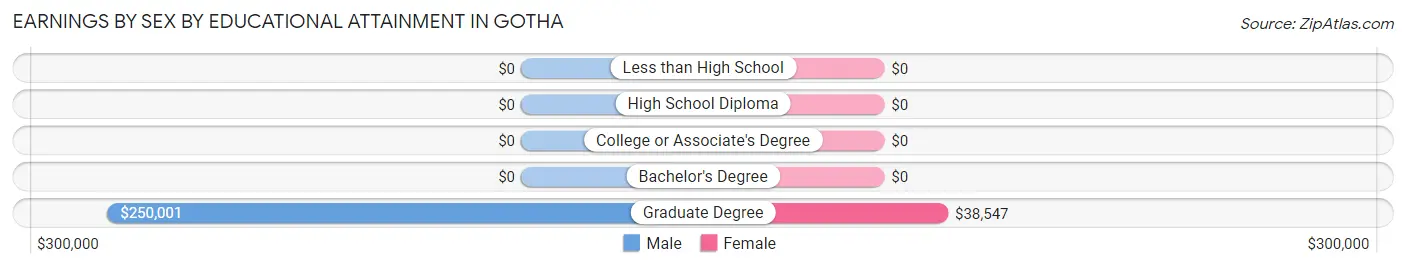
Earnings by Sex by Educational Attainment in Gotha
Average earnings in Gotha are $85,069 for men and $39,593 for women, a difference of 53.5%. Men with an educational attainment of graduate degree enjoy the highest average annual earnings of $250,001, while those with graduate degree education earn the least with $250,001. Women with an educational attainment of graduate degree earn the most with the average annual earnings of $38,547, while those with graduate degree education have the smallest earnings of $38,547.
| Educational Attainment | Male Income | Female Income |
| Less than High School | - | - |
| High School Diploma | - | - |
| College or Associate's Degree | - | - |
| Bachelor's Degree | - | - |
| Graduate Degree | $250,001 | $38,547 |
| Total | $85,069 | $39,593 |
Family Income in Gotha
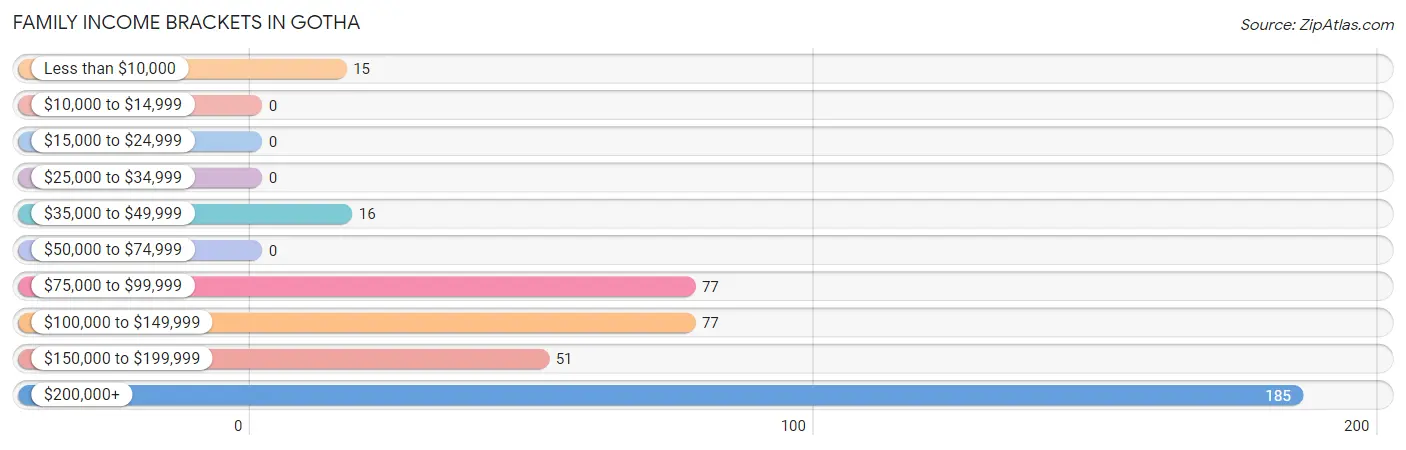
Family Income Brackets in Gotha
According to the Gotha family income data, there are 185 families falling into the $200,000+ income range, which is the most common income bracket and makes up 43.9% of all families.
| Income Bracket | # Families | % Families |
| Less than $10,000 | 15 | 3.6% |
| $10,000 to $14,999 | 0 | 0.0% |
| $15,000 to $24,999 | 0 | 0.0% |
| $25,000 to $34,999 | 0 | 0.0% |
| $35,000 to $49,999 | 16 | 3.8% |
| $50,000 to $74,999 | 0 | 0.0% |
| $75,000 to $99,999 | 77 | 18.3% |
| $100,000 to $149,999 | 77 | 18.3% |
| $150,000 to $199,999 | 51 | 12.1% |
| $200,000+ | 185 | 43.9% |
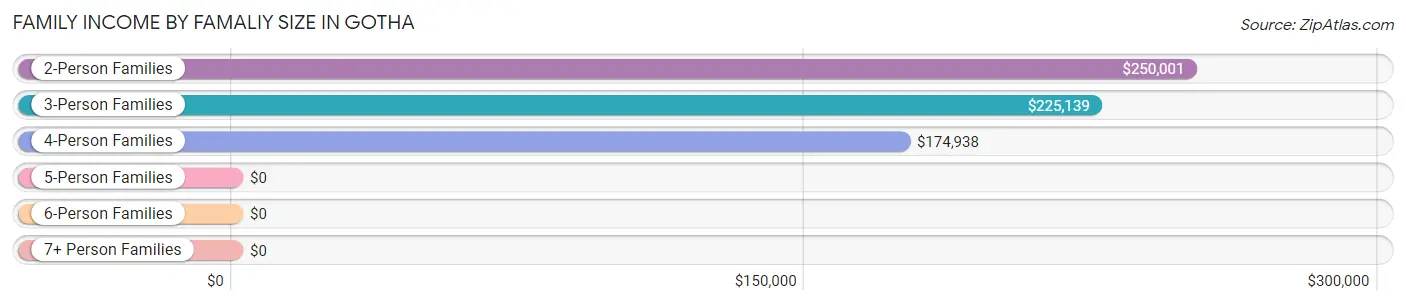
Family Income by Famaliy Size in Gotha
2-person families (101 | 24.0%) account for the highest median family income in Gotha with $250,001 per family, while 2-person families (101 | 24.0%) have the highest median income of $125,000 per family member.
| Income Bracket | # Families | Median Income |
| 2-Person Families | 101 (24.0%) | $250,001 |
| 3-Person Families | 95 (22.6%) | $225,139 |
| 4-Person Families | 89 (21.1%) | $174,938 |
| 5-Person Families | 92 (21.8%) | $0 |
| 6-Person Families | 44 (10.4%) | $0 |
| 7+ Person Families | 0 (0.0%) | $0 |
| Total | 421 (100.0%) | $176,058 |
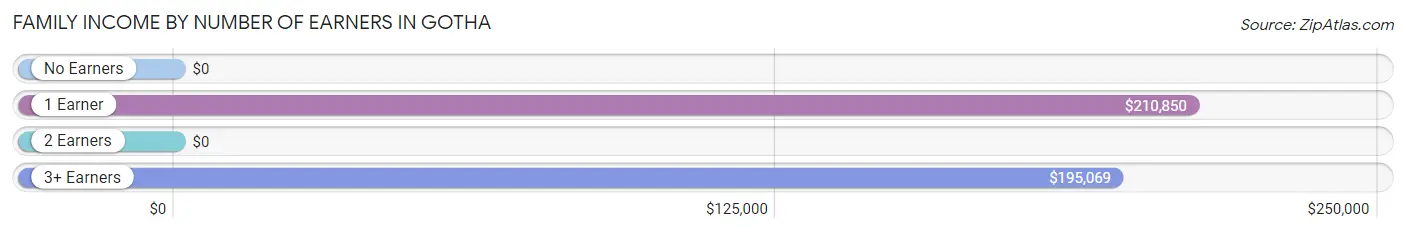
Family Income by Number of Earners in Gotha
| Number of Earners | # Families | Median Income |
| No Earners | 16 (3.8%) | $0 |
| 1 Earner | 87 (20.7%) | $210,850 |
| 2 Earners | 229 (54.4%) | $0 |
| 3+ Earners | 89 (21.1%) | $195,069 |
| Total | 421 (100.0%) | $176,058 |
Household Income in Gotha
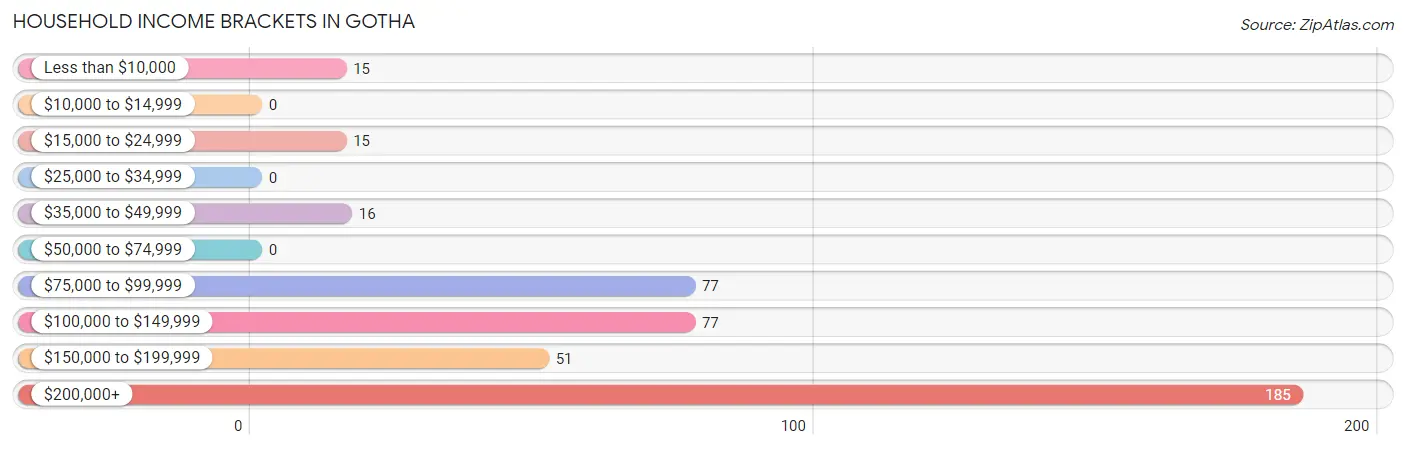
Household Income Brackets in Gotha
With 185 households falling in the category, the $200,000+ income range is the most frequent in Gotha, accounting for 42.4% of all households.
| Income Bracket | # Households | % Households |
| Less than $10,000 | 15 | 3.4% |
| $10,000 to $14,999 | 0 | 0.0% |
| $15,000 to $24,999 | 15 | 3.4% |
| $25,000 to $34,999 | 0 | 0.0% |
| $35,000 to $49,999 | 16 | 3.7% |
| $50,000 to $74,999 | 0 | 0.0% |
| $75,000 to $99,999 | 77 | 17.7% |
| $100,000 to $149,999 | 77 | 17.7% |
| $150,000 to $199,999 | 51 | 11.7% |
| $200,000+ | 185 | 42.4% |
Household Income by Householder Age in Gotha
The median household income in Gotha is $174,750, with the highest median household income of $175,000 found in the 25 to 44 years age bracket for the primary householder. A total of 174 households (39.9%) fall into this category.
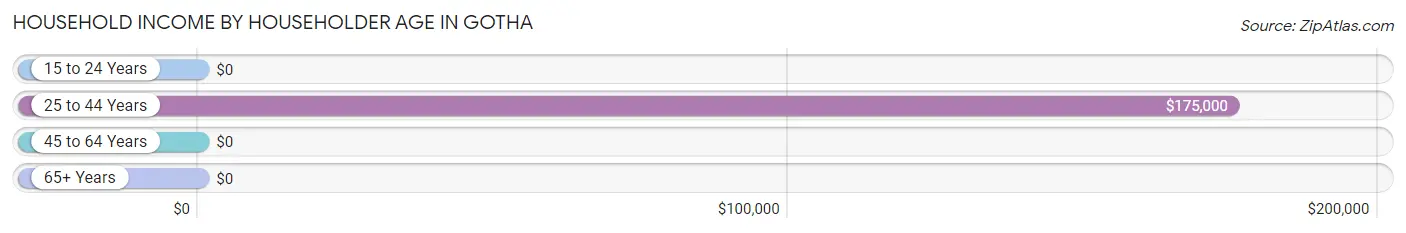
| Income Bracket | # Households | Median Income |
| 15 to 24 Years | 0 (0.0%) | $0 |
| 25 to 44 Years | 174 (39.9%) | $175,000 |
| 45 to 64 Years | 221 (50.7%) | $0 |
| 65+ Years | 41 (9.4%) | $0 |
| Total | 436 (100.0%) | $174,750 |
Poverty in Gotha
Income Below Poverty by Sex and Age in Gotha
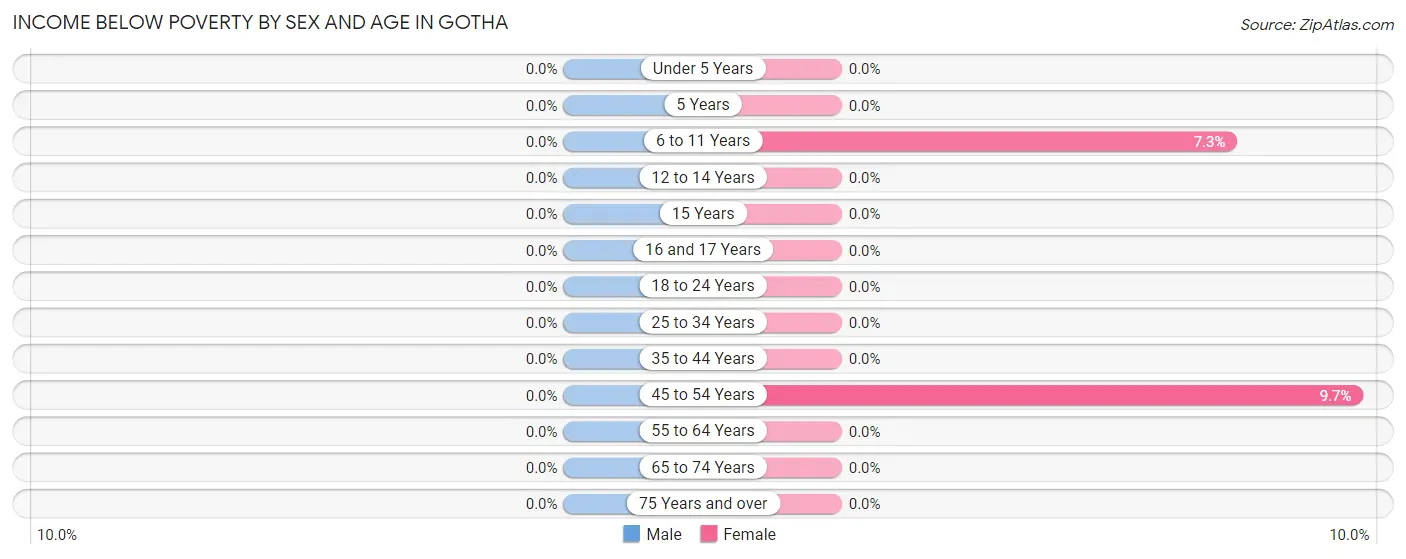
| Age Bracket | Male | Female |
| Under 5 Years | 0 (0.0%) | 0 (0.0%) |
| 5 Years | 0 (0.0%) | 0 (0.0%) |
| 6 to 11 Years | 0 (0.0%) | 16 (7.3%) |
| 12 to 14 Years | 0 (0.0%) | 0 (0.0%) |
| 15 Years | 0 (0.0%) | 0 (0.0%) |
| 16 and 17 Years | 0 (0.0%) | 0 (0.0%) |
| 18 to 24 Years | 0 (0.0%) | 0 (0.0%) |
| 25 to 34 Years | 0 (0.0%) | 0 (0.0%) |
| 35 to 44 Years | 0 (0.0%) | 0 (0.0%) |
| 45 to 54 Years | 0 (0.0%) | 15 (9.7%) |
| 55 to 64 Years | 0 (0.0%) | 0 (0.0%) |
| 65 to 74 Years | 0 (0.0%) | 0 (0.0%) |
| 75 Years and over | 0 (0.0%) | 0 (0.0%) |
| Total | 0 (0.0%) | 31 (3.7%) |
Income Above Poverty by Sex and Age in Gotha
According to the poverty statistics in Gotha, males aged under 5 years and females aged under 5 years are the age groups that are most secure financially, with 100.0% of males and 100.0% of females in these age groups living above the poverty line.
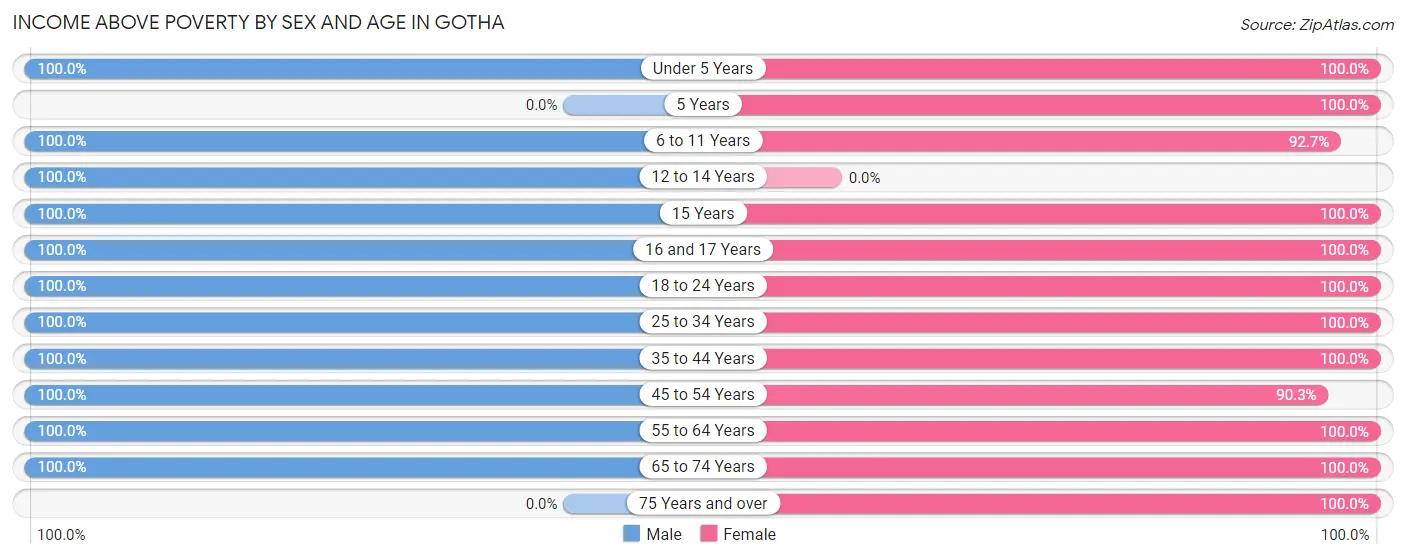
| Age Bracket | Male | Female |
| Under 5 Years | 88 (100.0%) | 70 (100.0%) |
| 5 Years | 0 (0.0%) | 21 (100.0%) |
| 6 to 11 Years | 81 (100.0%) | 202 (92.7%) |
| 12 to 14 Years | 68 (100.0%) | 0 (0.0%) |
| 15 Years | 25 (100.0%) | 13 (100.0%) |
| 16 and 17 Years | 51 (100.0%) | 49 (100.0%) |
| 18 to 24 Years | 15 (100.0%) | 76 (100.0%) |
| 25 to 34 Years | 68 (100.0%) | 8 (100.0%) |
| 35 to 44 Years | 146 (100.0%) | 143 (100.0%) |
| 45 to 54 Years | 123 (100.0%) | 140 (90.3%) |
| 55 to 64 Years | 84 (100.0%) | 46 (100.0%) |
| 65 to 74 Years | 41 (100.0%) | 37 (100.0%) |
| 75 Years and over | 0 (0.0%) | 9 (100.0%) |
| Total | 790 (100.0%) | 814 (96.3%) |
Income Below Poverty Among Married-Couple Families in Gotha
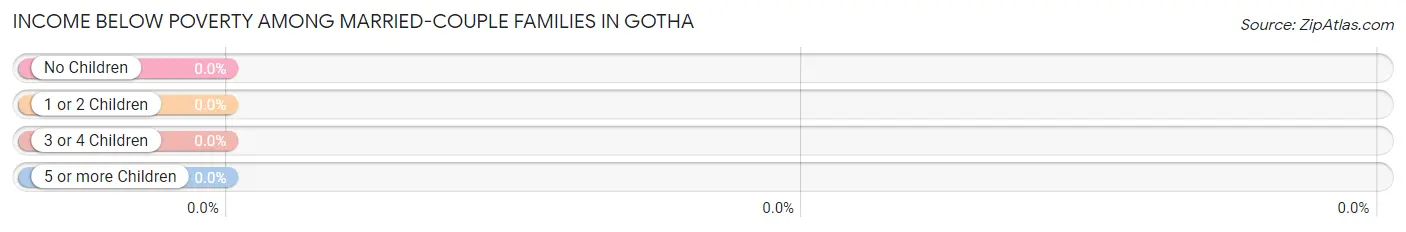
| Children | Above Poverty | Below Poverty |
| No Children | 111 (100.0%) | 0 (0.0%) |
| 1 or 2 Children | 139 (100.0%) | 0 (0.0%) |
| 3 or 4 Children | 130 (100.0%) | 0 (0.0%) |
| 5 or more Children | 0 (0.0%) | 0 (0.0%) |
| Total | 380 (100.0%) | 0 (0.0%) |
Income Below Poverty Among Single-Parent Households in Gotha
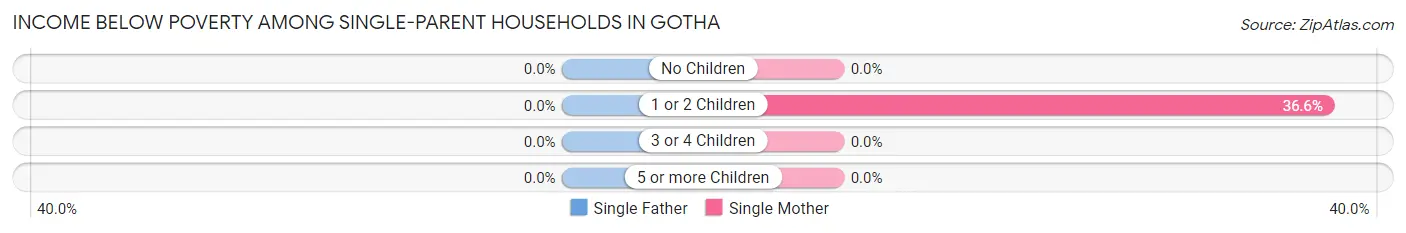
| Children | Single Father | Single Mother |
| No Children | 0 (0.0%) | 0 (0.0%) |
| 1 or 2 Children | 0 (0.0%) | 15 (36.6%) |
| 3 or 4 Children | 0 (0.0%) | 0 (0.0%) |
| 5 or more Children | 0 (0.0%) | 0 (0.0%) |
| Total | 0 (0.0%) | 15 (36.6%) |
Income Below Poverty Among Married-Couple vs Single-Parent Households in Gotha
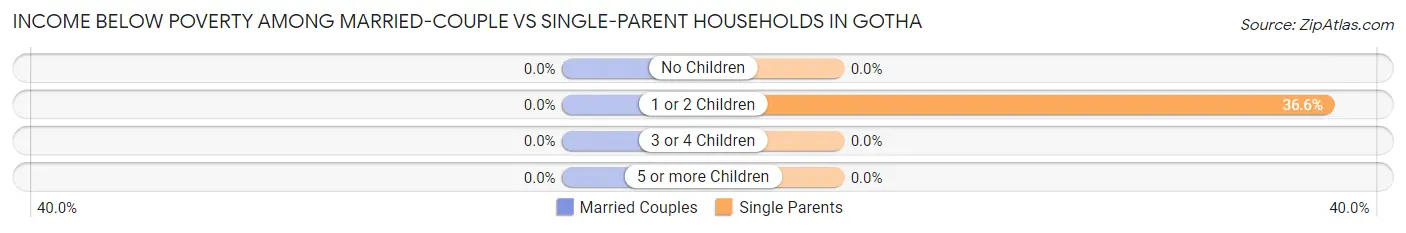
| Children | Married-Couple Families | Single-Parent Households |
| No Children | 0 (0.0%) | 0 (0.0%) |
| 1 or 2 Children | 0 (0.0%) | 15 (36.6%) |
| 3 or 4 Children | 0 (0.0%) | 0 (0.0%) |
| 5 or more Children | 0 (0.0%) | 0 (0.0%) |
| Total | 0 (0.0%) | 15 (36.6%) |
Race in Gotha
The most populous races in Gotha are White / Caucasian (813 | 49.6%), Black / African American (423 | 25.8%), and Asian (204 | 12.4%).
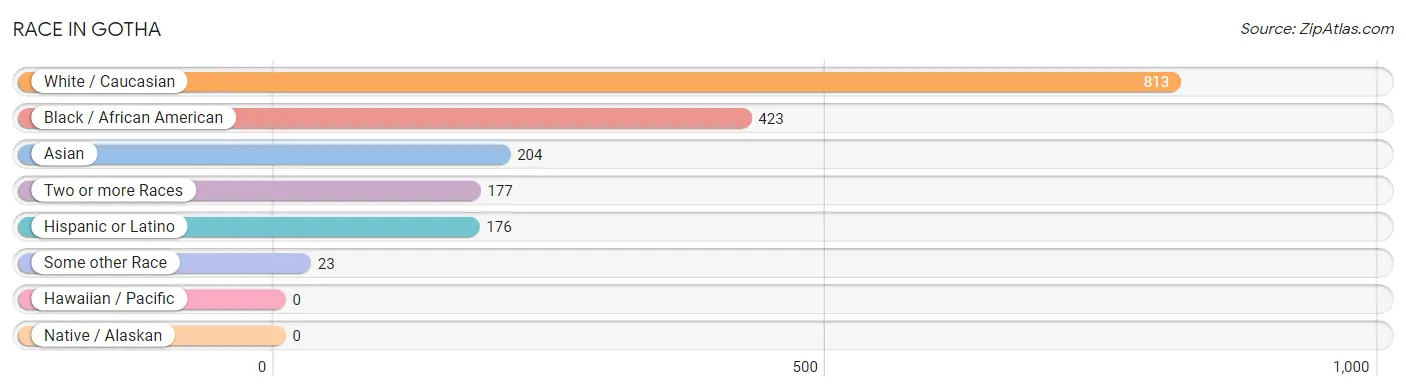
| Race | # Population | % Population |
| Asian | 204 | 12.4% |
| Black / African American | 423 | 25.8% |
| Hawaiian / Pacific | 0 | 0.0% |
| Hispanic or Latino | 176 | 10.7% |
| Native / Alaskan | 0 | 0.0% |
| White / Caucasian | 813 | 49.6% |
| Two or more Races | 177 | 10.8% |
| Some other Race | 23 | 1.4% |
| Total | 1,640 | 100.0% |
Ancestry in Gotha
The most populous ancestries reported in Gotha are English (314 | 19.2%), American (302 | 18.4%), Irish (267 | 16.3%), German (142 | 8.7%), and Thai (91 | 5.6%), together accounting for 68.0% of all Gotha residents.
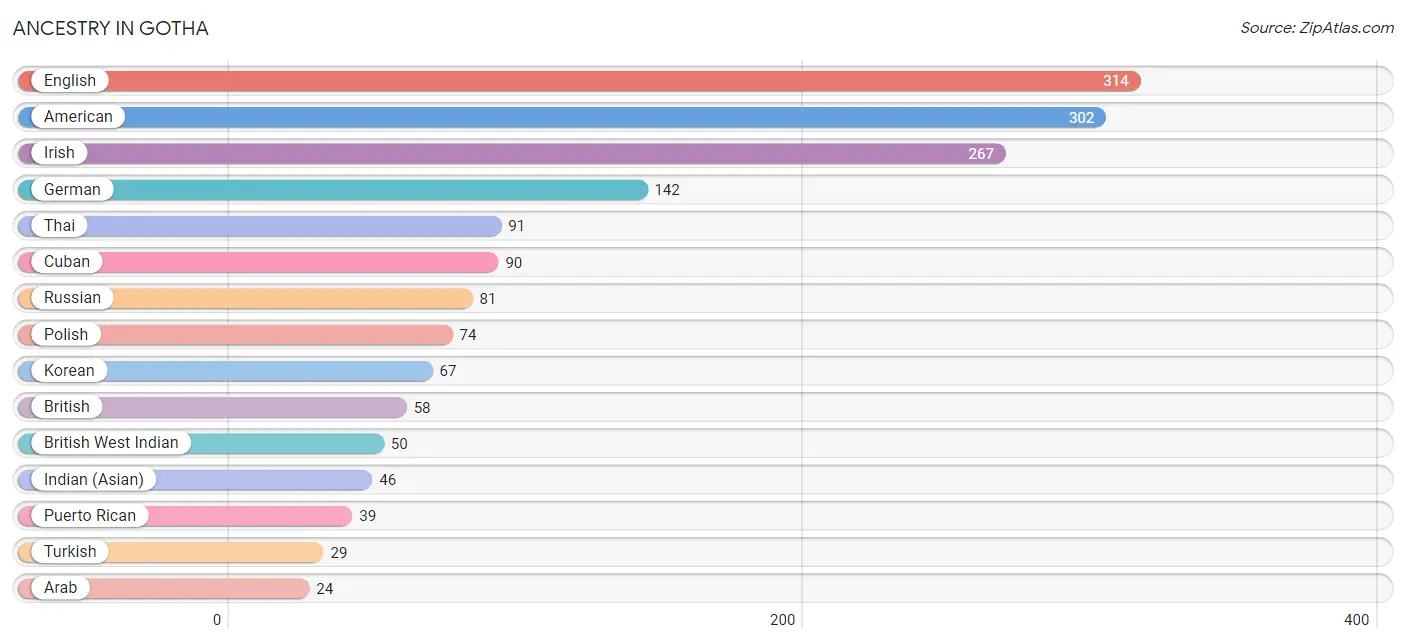
| Ancestry | # Population | % Population |
| American | 302 | 18.4% |
| Arab | 24 | 1.5% |
| British | 58 | 3.5% |
| British West Indian | 50 | 3.0% |
| Cambodian | 12 | 0.7% |
| Cuban | 90 | 5.5% |
| Dominican | 17 | 1.0% |
| English | 314 | 19.2% |
| French | 13 | 0.8% |
| German | 142 | 8.7% |
| Greek | 13 | 0.8% |
| Guyanese | 17 | 1.0% |
| Indian (Asian) | 46 | 2.8% |
| Irish | 267 | 16.3% |
| Italian | 20 | 1.2% |
| Korean | 67 | 4.1% |
| Lebanese | 24 | 1.5% |
| Peruvian | 23 | 1.4% |
| Polish | 74 | 4.5% |
| Portuguese | 8 | 0.5% |
| Puerto Rican | 39 | 2.4% |
| Russian | 81 | 4.9% |
| Scottish | 17 | 1.0% |
| South American | 23 | 1.4% |
| Spaniard | 7 | 0.4% |
| Thai | 91 | 5.6% |
| Turkish | 29 | 1.8% | View All 27 Rows |
Immigrants in Gotha
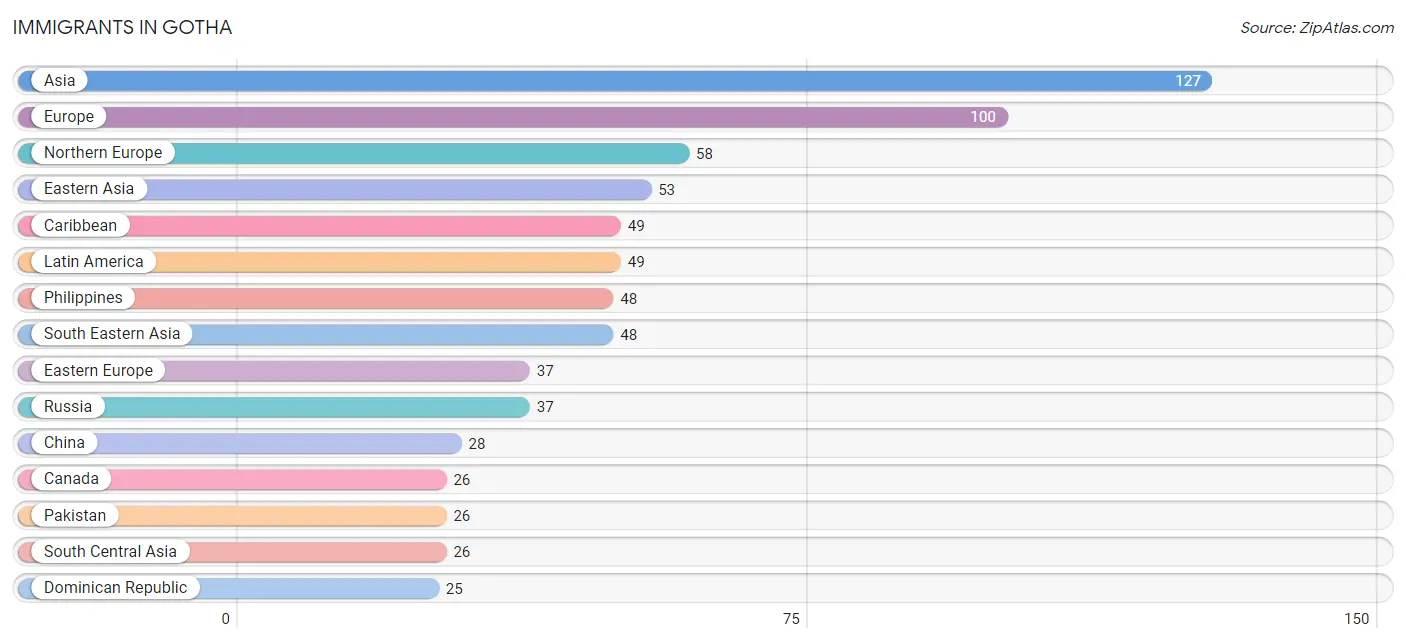
The most numerous immigrant groups reported in Gotha came from Asia (127 | 7.7%), Europe (100 | 6.1%), Northern Europe (58 | 3.5%), Eastern Asia (53 | 3.2%), and Caribbean (49 | 3.0%), together accounting for 23.6% of all Gotha residents.
| Immigration Origin | # Population | % Population |
| Asia | 127 | 7.7% |
| Canada | 26 | 1.6% |
| Caribbean | 49 | 3.0% |
| China | 28 | 1.7% |
| Dominican Republic | 25 | 1.5% |
| Eastern Asia | 53 | 3.2% |
| Eastern Europe | 37 | 2.3% |
| Europe | 100 | 6.1% |
| Hong Kong | 10 | 0.6% |
| Japan | 25 | 1.5% |
| Latin America | 49 | 3.0% |
| Northern Europe | 58 | 3.5% |
| Pakistan | 26 | 1.6% |
| Philippines | 48 | 2.9% |
| Russia | 37 | 2.3% |
| South Central Asia | 26 | 1.6% |
| South Eastern Asia | 48 | 2.9% |
| St. Vincent and the Grenadines | 24 | 1.5% | View All 18 Rows |
Sex and Age in Gotha
Sex and Age in Gotha
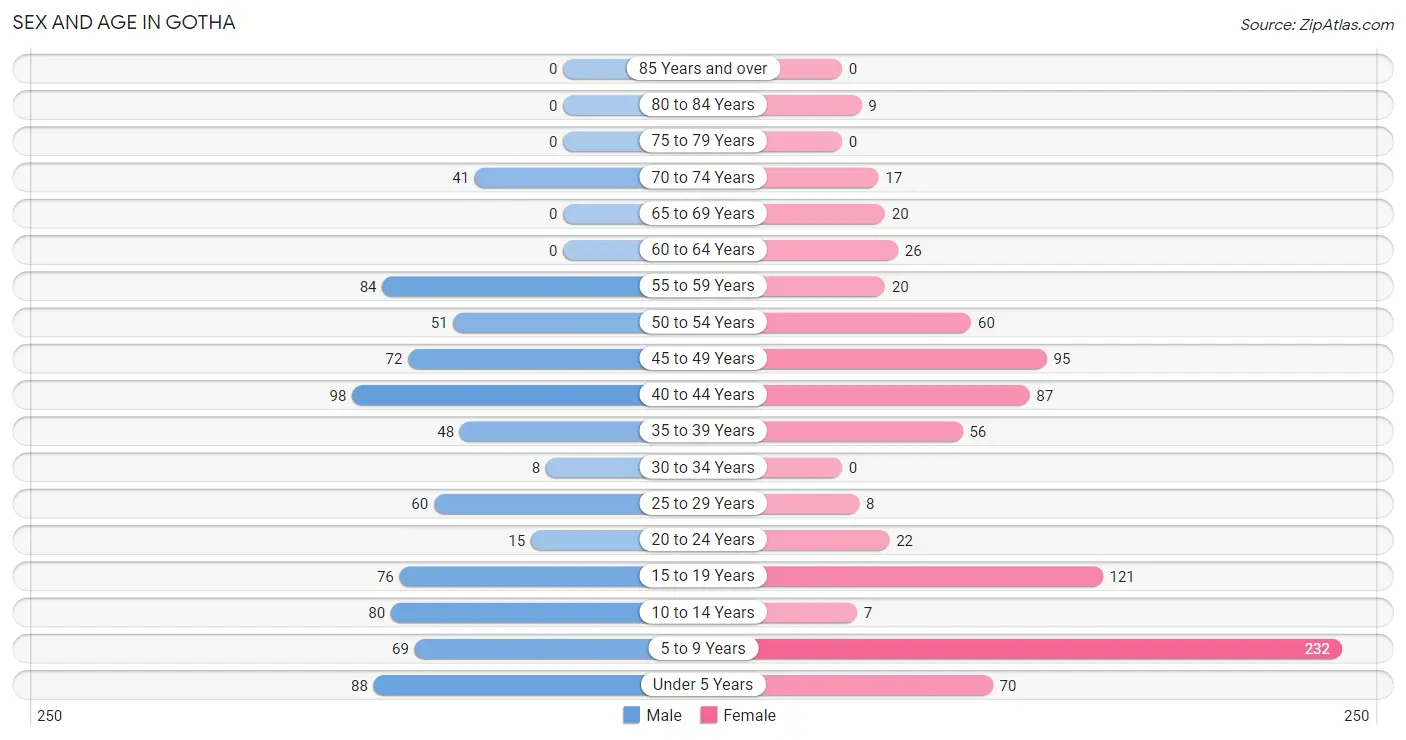
The most populous age groups in Gotha are 40 to 44 Years (98 | 12.4%) for men and 5 to 9 Years (232 | 27.3%) for women.
| Age Bracket | Male | Female |
| Under 5 Years | 88 (11.1%) | 70 (8.2%) |
| 5 to 9 Years | 69 (8.7%) | 232 (27.3%) |
| 10 to 14 Years | 80 (10.1%) | 7 (0.8%) |
| 15 to 19 Years | 76 (9.6%) | 121 (14.2%) |
| 20 to 24 Years | 15 (1.9%) | 22 (2.6%) |
| 25 to 29 Years | 60 (7.6%) | 8 (0.9%) |
| 30 to 34 Years | 8 (1.0%) | 0 (0.0%) |
| 35 to 39 Years | 48 (6.1%) | 56 (6.6%) |
| 40 to 44 Years | 98 (12.4%) | 87 (10.2%) |
| 45 to 49 Years | 72 (9.1%) | 95 (11.2%) |
| 50 to 54 Years | 51 (6.5%) | 60 (7.1%) |
| 55 to 59 Years | 84 (10.6%) | 20 (2.4%) |
| 60 to 64 Years | 0 (0.0%) | 26 (3.1%) |
| 65 to 69 Years | 0 (0.0%) | 20 (2.4%) |
| 70 to 74 Years | 41 (5.2%) | 17 (2.0%) |
| 75 to 79 Years | 0 (0.0%) | 0 (0.0%) |
| 80 to 84 Years | 0 (0.0%) | 9 (1.1%) |
| 85 Years and over | 0 (0.0%) | 0 (0.0%) |
| Total | 790 (100.0%) | 850 (100.0%) |
Families and Households in Gotha
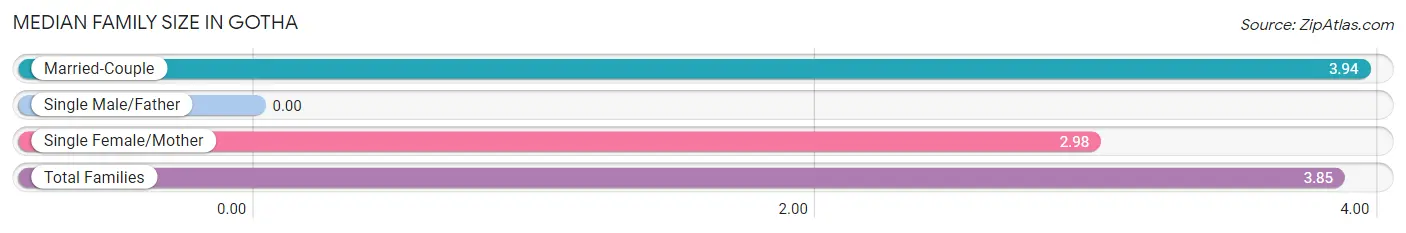
Median Family Size in Gotha
| Family Type | # Families | Family Size |
| Married-Couple | 380 (90.3%) | 3.94 |
| Single Male/Father | 0 (0.0%) | - |
| Single Female/Mother | 41 (9.7%) | 2.98 |
| Total Families | 421 (100.0%) | 3.85 |
Median Household Size in Gotha

| Household Type | # Households | Household Size |
| Married-Couple | 380 (87.2%) | 3.94 |
| Single Male/Father | 0 (0.0%) | - |
| Single Female/Mother | 41 (9.4%) | 2.98 |
| Non-family | 15 (3.4%) | - |
| Total Households | 436 (100.0%) | 3.75 |
Household Size by Marriage Status in Gotha
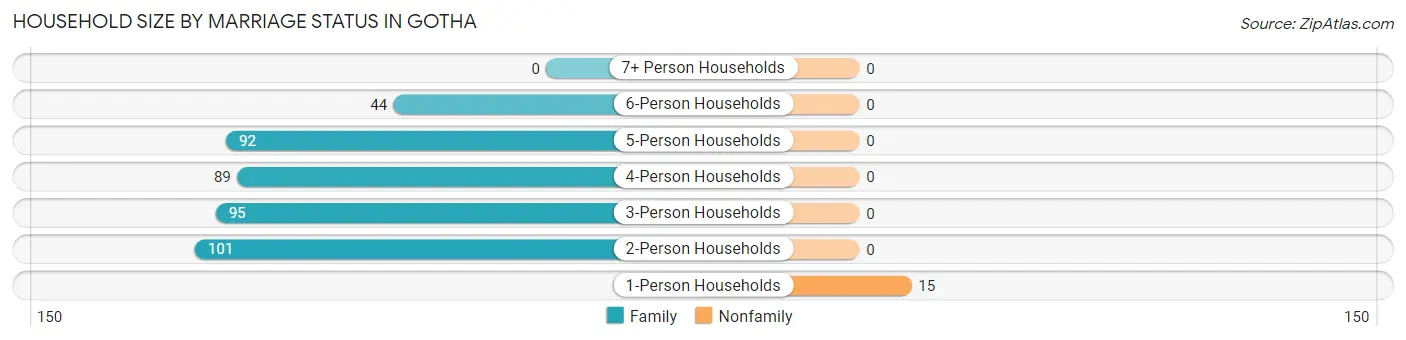
Out of a total of 436 households in Gotha, 421 (96.6%) are family households, while 15 (3.4%) are nonfamily households. The most numerous type of family households are 2-person households, comprising 101, and the most common type of nonfamily households are 1-person households, comprising 15.
| Household Size | Family Households | Nonfamily Households |
| 1-Person Households | - | 15 (3.4%) |
| 2-Person Households | 101 (23.2%) | 0 (0.0%) |
| 3-Person Households | 95 (21.8%) | 0 (0.0%) |
| 4-Person Households | 89 (20.4%) | 0 (0.0%) |
| 5-Person Households | 92 (21.1%) | 0 (0.0%) |
| 6-Person Households | 44 (10.1%) | 0 (0.0%) |
| 7+ Person Households | 0 (0.0%) | 0 (0.0%) |
| Total | 421 (96.6%) | 15 (3.4%) |
Female Fertility in Gotha
Fertility by Age in Gotha
Average fertility rate in Gotha is 30.0 births per 1,000 women. Women in the age bracket of 35 to 50 years have the highest fertility rate with 48.0 births per 1,000 women. Women in the age bracket of 35 to 50 years acount for 100.0% of all women with births.
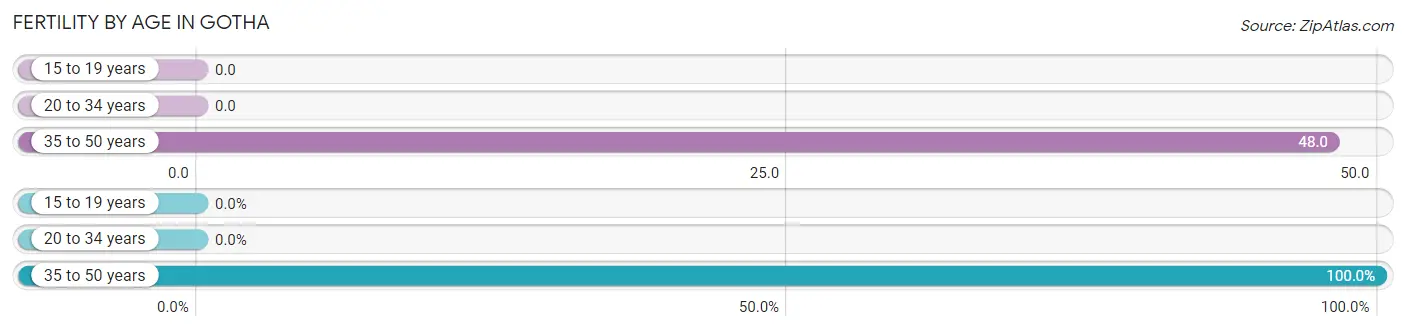
| Age Bracket | Women with Births | Births / 1,000 Women |
| 15 to 19 years | 0 (0.0%) | 0.0 |
| 20 to 34 years | 0 (0.0%) | 0.0 |
| 35 to 50 years | 12 (100.0%) | 48.0 |
| Total | 12 (100.0%) | 30.0 |
Fertility by Age by Marriage Status in Gotha
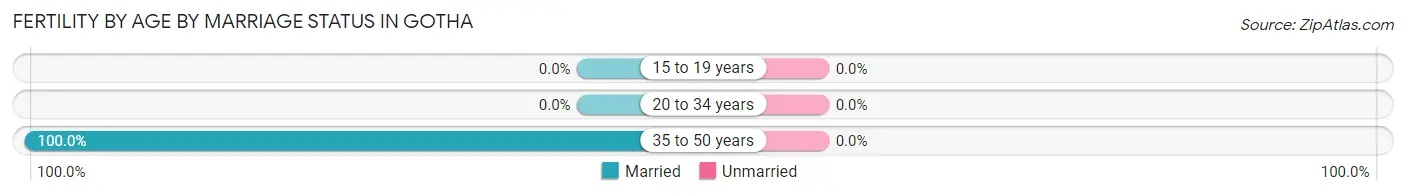
| Age Bracket | Married | Unmarried |
| 15 to 19 years | 0 (0.0%) | 0 (0.0%) |
| 20 to 34 years | 0 (0.0%) | 0 (0.0%) |
| 35 to 50 years | 12 (100.0%) | 0 (0.0%) |
| Total | 12 (100.0%) | 0 (0.0%) |
Fertility by Education in Gotha
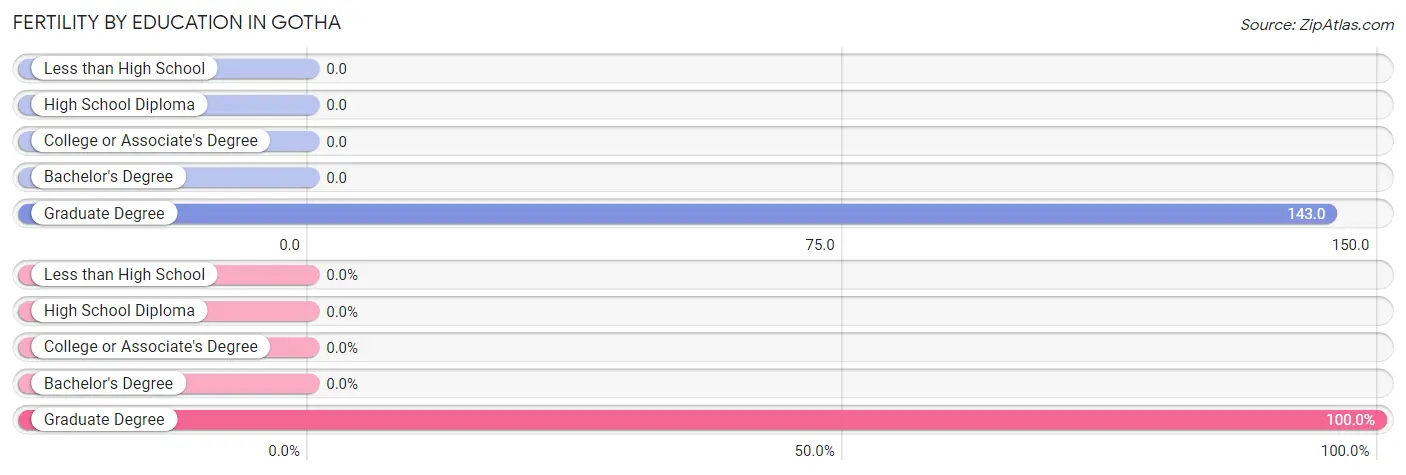
| Educational Attainment | Women with Births | Births / 1,000 Women |
| Less than High School | 0 (0.0%) | 0.0 |
| High School Diploma | 0 (0.0%) | 0.0 |
| College or Associate's Degree | 0 (0.0%) | 0.0 |
| Bachelor's Degree | 0 (0.0%) | 0.0 |
| Graduate Degree | 12 (100.0%) | 143.0 |
| Total | 12 (100.0%) | 30.0 |
Fertility by Education by Marriage Status in Gotha
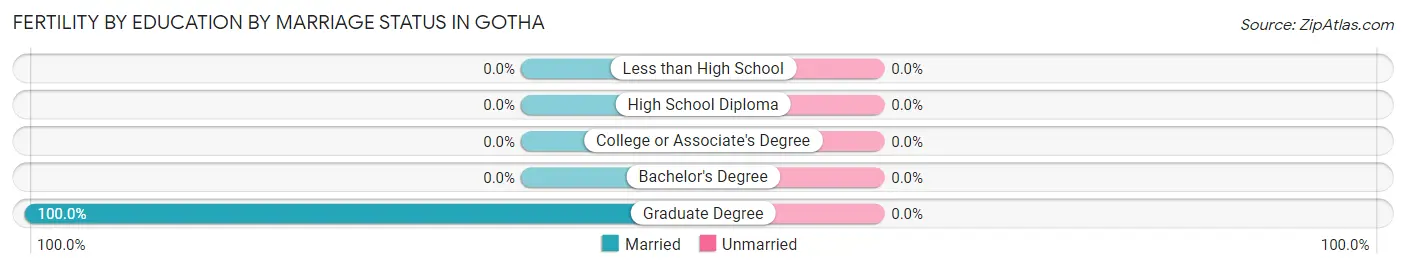
| Educational Attainment | Married | Unmarried |
| Less than High School | 0 (0.0%) | 0 (0.0%) |
| High School Diploma | 0 (0.0%) | 0 (0.0%) |
| College or Associate's Degree | 0 (0.0%) | 0 (0.0%) |
| Bachelor's Degree | 0 (0.0%) | 0 (0.0%) |
| Graduate Degree | 12 (100.0%) | 0 (0.0%) |
| Total | 12 (100.0%) | 0 (0.0%) |
Employment Characteristics in Gotha
Employment by Class of Employer in Gotha
Among the 693 employed individuals in Gotha, private company employees (431 | 62.2%), self-employed (incorporated) (249 | 35.9%), and self-employed (not incorporated) (13 | 1.9%) make up the most common classes of employment.
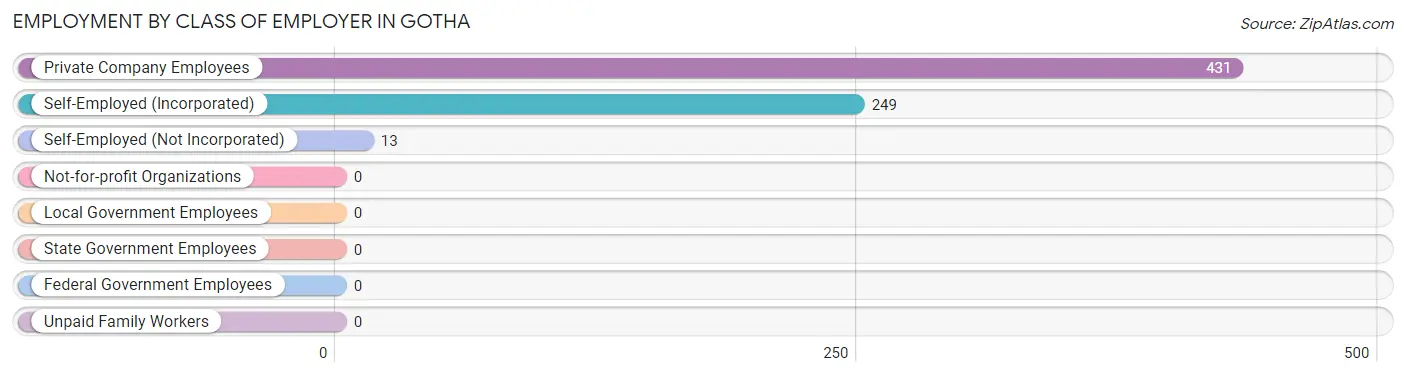
| Employer Class | # Employees | % Employees |
| Private Company Employees | 431 | 62.2% |
| Self-Employed (Incorporated) | 249 | 35.9% |
| Self-Employed (Not Incorporated) | 13 | 1.9% |
| Not-for-profit Organizations | 0 | 0.0% |
| Local Government Employees | 0 | 0.0% |
| State Government Employees | 0 | 0.0% |
| Federal Government Employees | 0 | 0.0% |
| Unpaid Family Workers | 0 | 0.0% |
| Total | 693 | 100.0% |
Employment Status by Age in Gotha
According to the labor force statistics for Gotha, out of the total population over 16 years of age (1,056), 67.8% or 716 individuals are in the labor force, with 2.1% or 15 of them unemployed. The age group with the highest labor force participation rate is 30 to 34 years, with 100.0% or 8 individuals in the labor force. Within the labor force, the 35 to 44 years age range has the highest percentage of unemployed individuals, with 5.6% or 15 of them being unemployed.
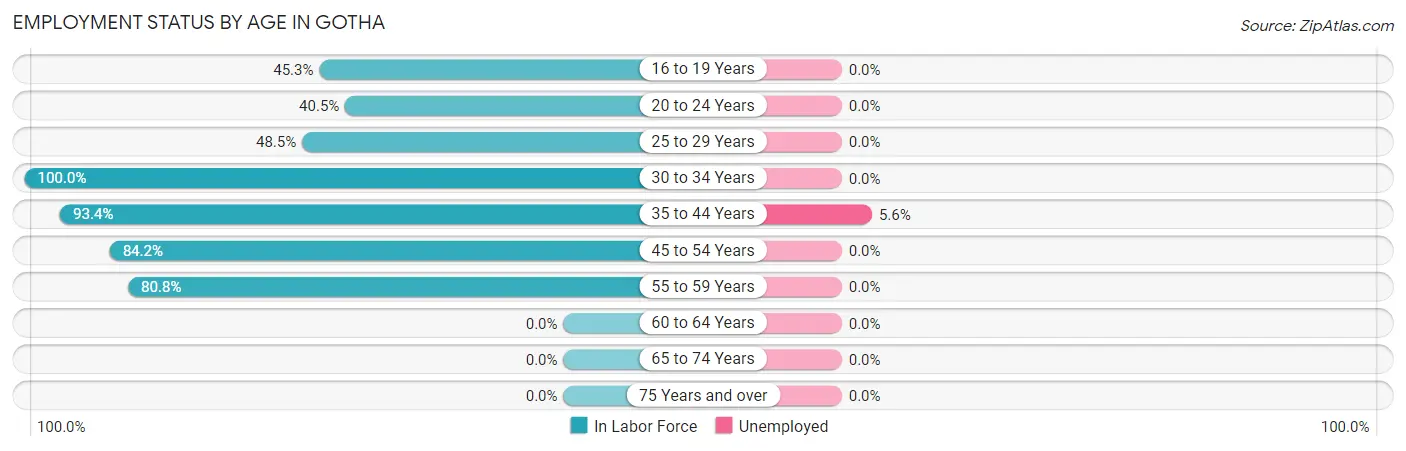
| Age Bracket | In Labor Force | Unemployed |
| 16 to 19 Years | 72 (45.3%) | 0 (0.0%) |
| 20 to 24 Years | 15 (40.5%) | 0 (0.0%) |
| 25 to 29 Years | 33 (48.5%) | 0 (0.0%) |
| 30 to 34 Years | 8 (100.0%) | 0 (0.0%) |
| 35 to 44 Years | 270 (93.4%) | 15 (5.6%) |
| 45 to 54 Years | 234 (84.2%) | 0 (0.0%) |
| 55 to 59 Years | 84 (80.8%) | 0 (0.0%) |
| 60 to 64 Years | 0 (0.0%) | 0 (0.0%) |
| 65 to 74 Years | 0 (0.0%) | 0 (0.0%) |
| 75 Years and over | 0 (0.0%) | 0 (0.0%) |
| Total | 716 (67.8%) | 15 (2.1%) |
Employment Status by Educational Attainment in Gotha
According to labor force statistics for Gotha, 81.4% of individuals (629) out of the total population between 25 and 64 years of age (773) are in the labor force, with 2.4% or 15 of them being unemployed. The group with the highest labor force participation rate are those with the educational attainment of high school diploma, with 100.0% or 77 individuals in the labor force. Within the labor force, individuals with bachelor's degree or higher education have the highest percentage of unemployment, with 3.5% or 15 of them being unemployed.
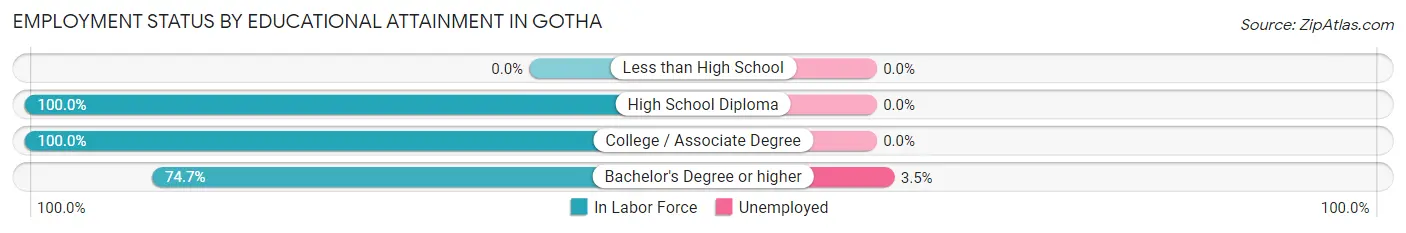
| Educational Attainment | In Labor Force | Unemployed |
| Less than High School | 0 (0.0%) | 0 (0.0%) |
| High School Diploma | 77 (100.0%) | 0 (0.0%) |
| College / Associate Degree | 127 (100.0%) | 0 (0.0%) |
| Bachelor's Degree or higher | 425 (74.7%) | 20 (3.5%) |
| Total | 629 (81.4%) | 19 (2.4%) |
Employment Occupations by Sex in Gotha
Management, Business, Science and Arts Occupations
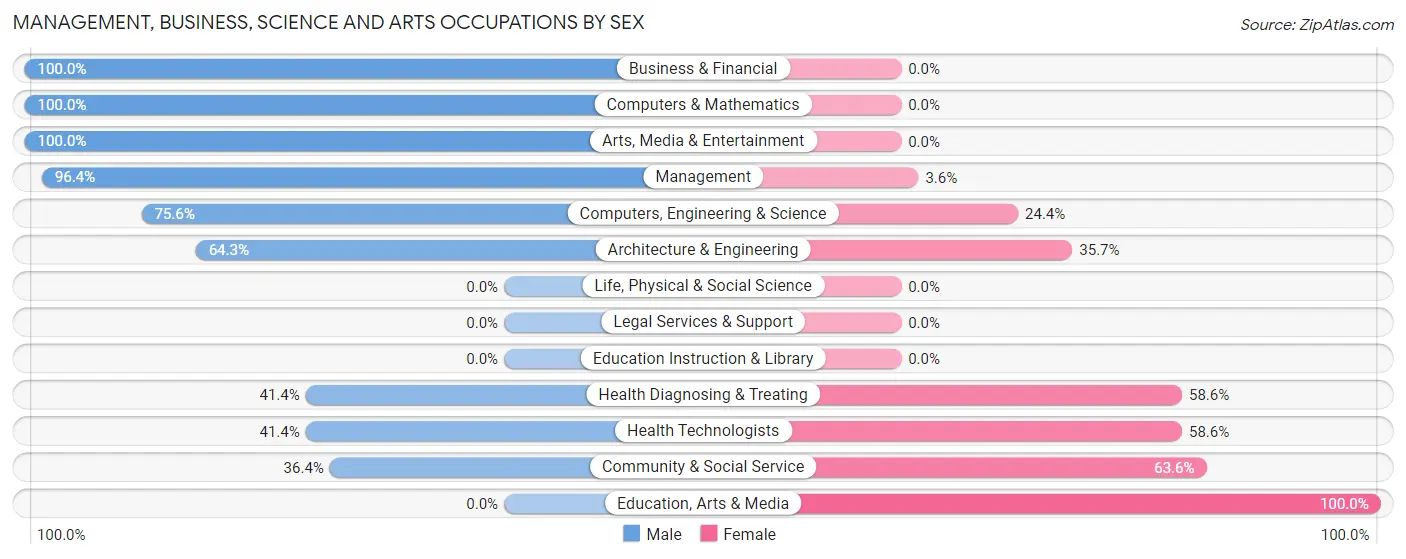
The most common Management, Business, Science and Arts occupations in Gotha are Management (166 | 23.7%), Health Diagnosing & Treating (157 | 22.4%), Health Technologists (157 | 22.4%), Computers, Engineering & Science (41 | 5.9%), and Community & Social Service (33 | 4.7%).
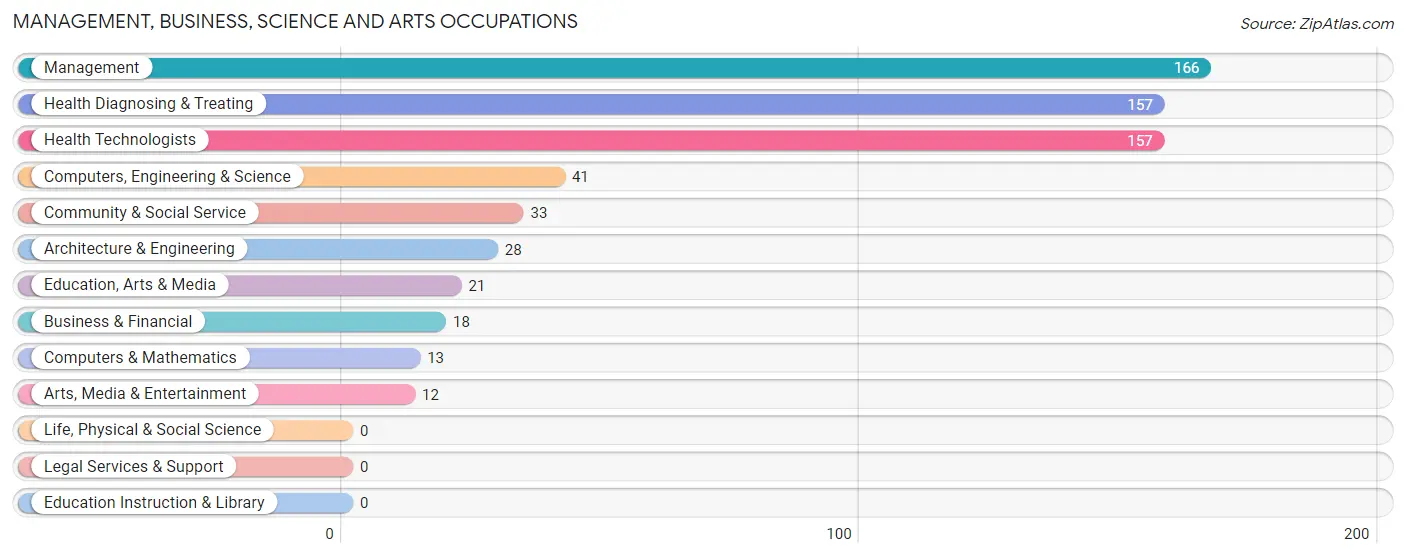
Management, Business, Science and Arts Occupations by Sex
Within the Management, Business, Science and Arts occupations in Gotha, the most male-oriented occupations are Business & Financial (100.0%), Computers & Mathematics (100.0%), and Arts, Media & Entertainment (100.0%), while the most female-oriented occupations are Education, Arts & Media (100.0%), Community & Social Service (63.6%), and Health Diagnosing & Treating (58.6%).
| Occupation | Male | Female |
| Management | 160 (96.4%) | 6 (3.6%) |
| Business & Financial | 18 (100.0%) | 0 (0.0%) |
| Computers, Engineering & Science | 31 (75.6%) | 10 (24.4%) |
| Computers & Mathematics | 13 (100.0%) | 0 (0.0%) |
| Architecture & Engineering | 18 (64.3%) | 10 (35.7%) |
| Life, Physical & Social Science | 0 (0.0%) | 0 (0.0%) |
| Community & Social Service | 12 (36.4%) | 21 (63.6%) |
| Education, Arts & Media | 0 (0.0%) | 21 (100.0%) |
| Legal Services & Support | 0 (0.0%) | 0 (0.0%) |
| Education Instruction & Library | 0 (0.0%) | 0 (0.0%) |
| Arts, Media & Entertainment | 12 (100.0%) | 0 (0.0%) |
| Health Diagnosing & Treating | 65 (41.4%) | 92 (58.6%) |
| Health Technologists | 65 (41.4%) | 92 (58.6%) |
| Total (Category) | 286 (68.9%) | 129 (31.1%) |
| Total (Overall) | 402 (57.4%) | 299 (42.6%) |
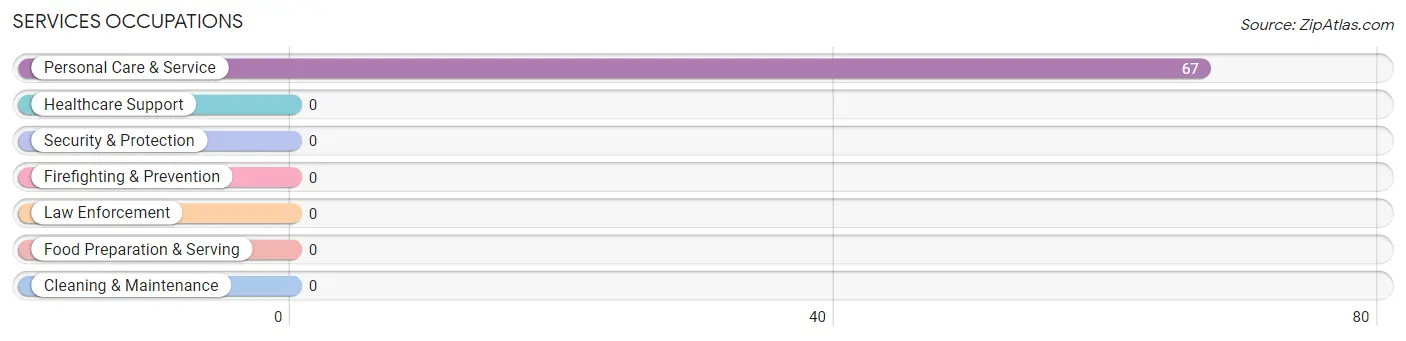
Services Occupations
The most common Services occupations in Gotha are , and Personal Care & Service (67 | 9.6%).
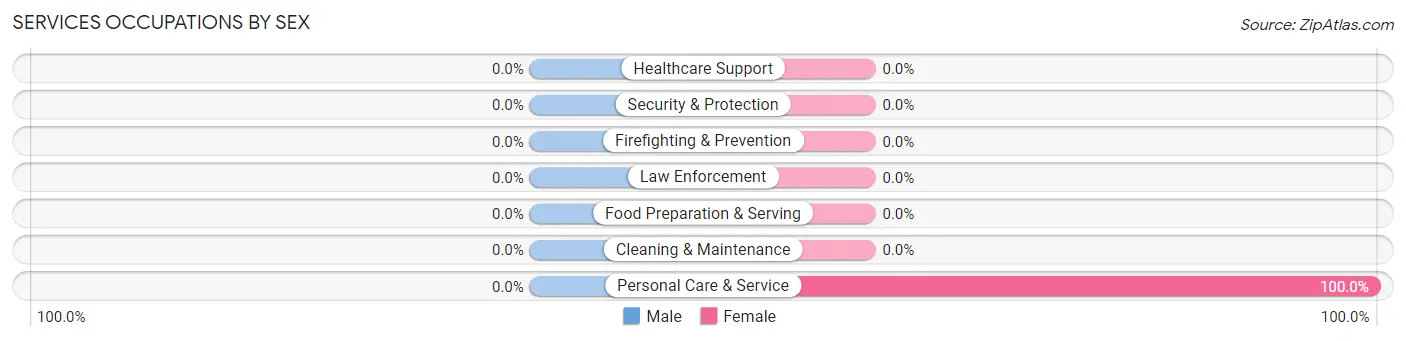
Services Occupations by Sex
| Occupation | Male | Female |
| Healthcare Support | 0 (0.0%) | 0 (0.0%) |
| Security & Protection | 0 (0.0%) | 0 (0.0%) |
| Firefighting & Prevention | 0 (0.0%) | 0 (0.0%) |
| Law Enforcement | 0 (0.0%) | 0 (0.0%) |
| Food Preparation & Serving | 0 (0.0%) | 0 (0.0%) |
| Cleaning & Maintenance | 0 (0.0%) | 0 (0.0%) |
| Personal Care & Service | 0 (0.0%) | 67 (100.0%) |
| Total (Category) | 0 (0.0%) | 67 (100.0%) |
| Total (Overall) | 402 (57.4%) | 299 (42.6%) |
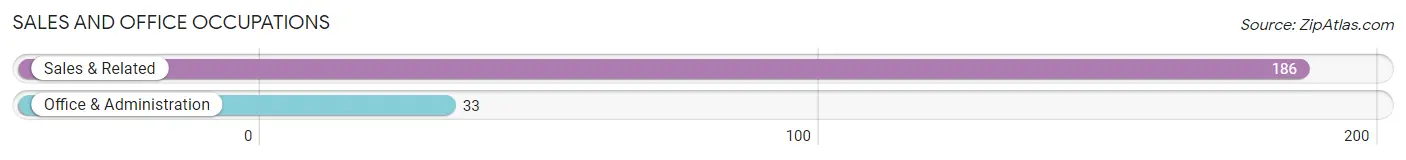
Sales and Office Occupations
The most common Sales and Office occupations in Gotha are Sales & Related (186 | 26.5%), and Office & Administration (33 | 4.7%).
Sales and Office Occupations by Sex
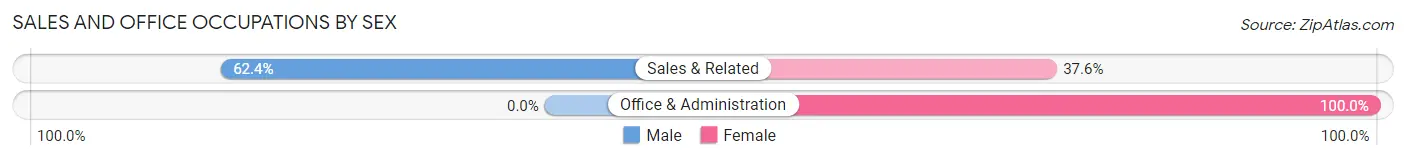
| Occupation | Male | Female |
| Sales & Related | 116 (62.4%) | 70 (37.6%) |
| Office & Administration | 0 (0.0%) | 33 (100.0%) |
| Total (Category) | 116 (53.0%) | 103 (47.0%) |
| Total (Overall) | 402 (57.4%) | 299 (42.6%) |
Natural Resources, Construction and Maintenance Occupations
Natural Resources, Construction and Maintenance Occupations by Sex
| Occupation | Male | Female |
| Farming, Fishing & Forestry | 0 (0.0%) | 0 (0.0%) |
| Construction & Extraction | 0 (0.0%) | 0 (0.0%) |
| Installation, Maintenance & Repair | 0 (0.0%) | 0 (0.0%) |
| Total (Category) | 0 (0.0%) | 0 (0.0%) |
| Total (Overall) | 402 (57.4%) | 299 (42.6%) |
Production, Transportation and Moving Occupations
Production, Transportation and Moving Occupations by Sex
| Occupation | Male | Female |
| Production | 0 (0.0%) | 0 (0.0%) |
| Transportation | 0 (0.0%) | 0 (0.0%) |
| Material Moving | 0 (0.0%) | 0 (0.0%) |
| Total (Category) | 0 (0.0%) | 0 (0.0%) |
| Total (Overall) | 402 (57.4%) | 299 (42.6%) |
Employment Industries by Sex in Gotha
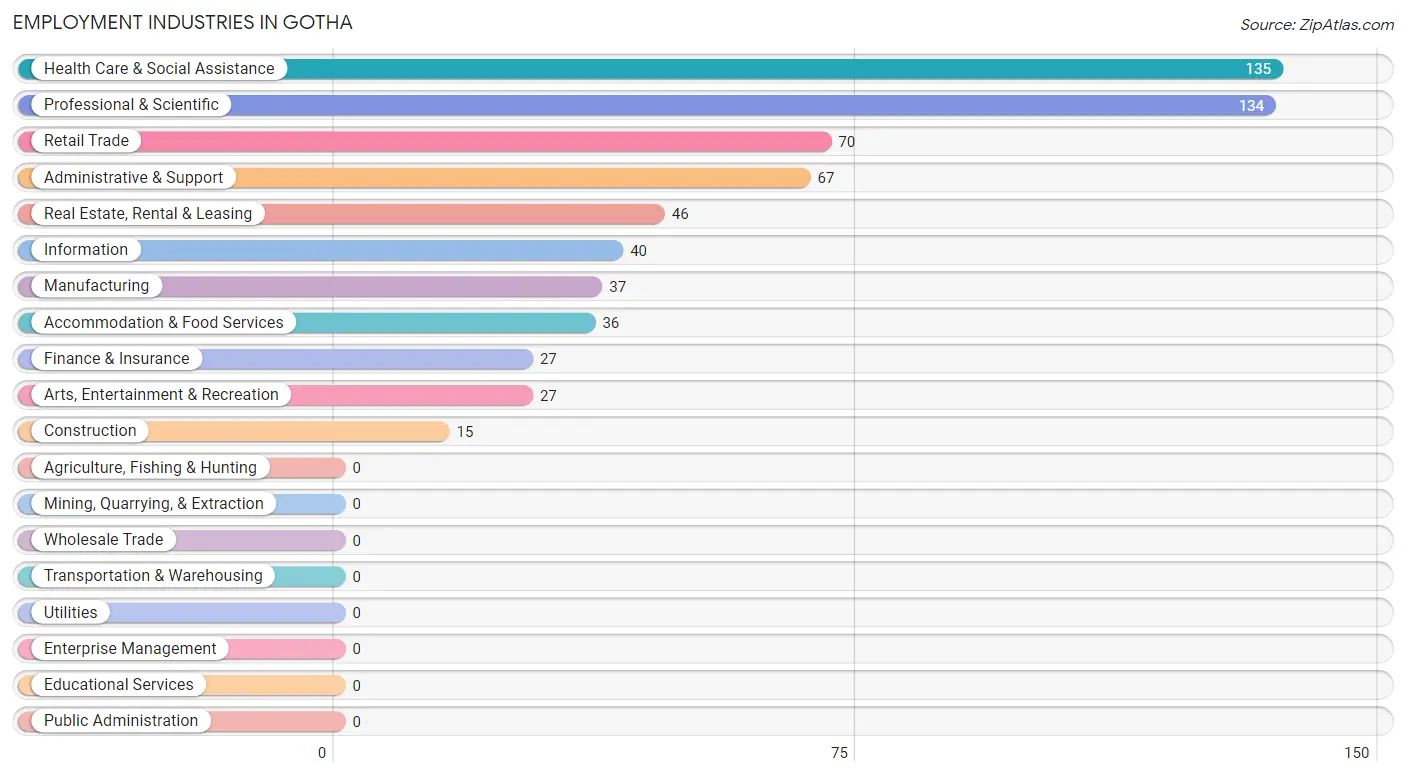
Employment Industries in Gotha
The major employment industries in Gotha include Health Care & Social Assistance (135 | 19.3%), Professional & Scientific (134 | 19.1%), Retail Trade (70 | 10.0%), Administrative & Support (67 | 9.6%), and Real Estate, Rental & Leasing (46 | 6.6%).
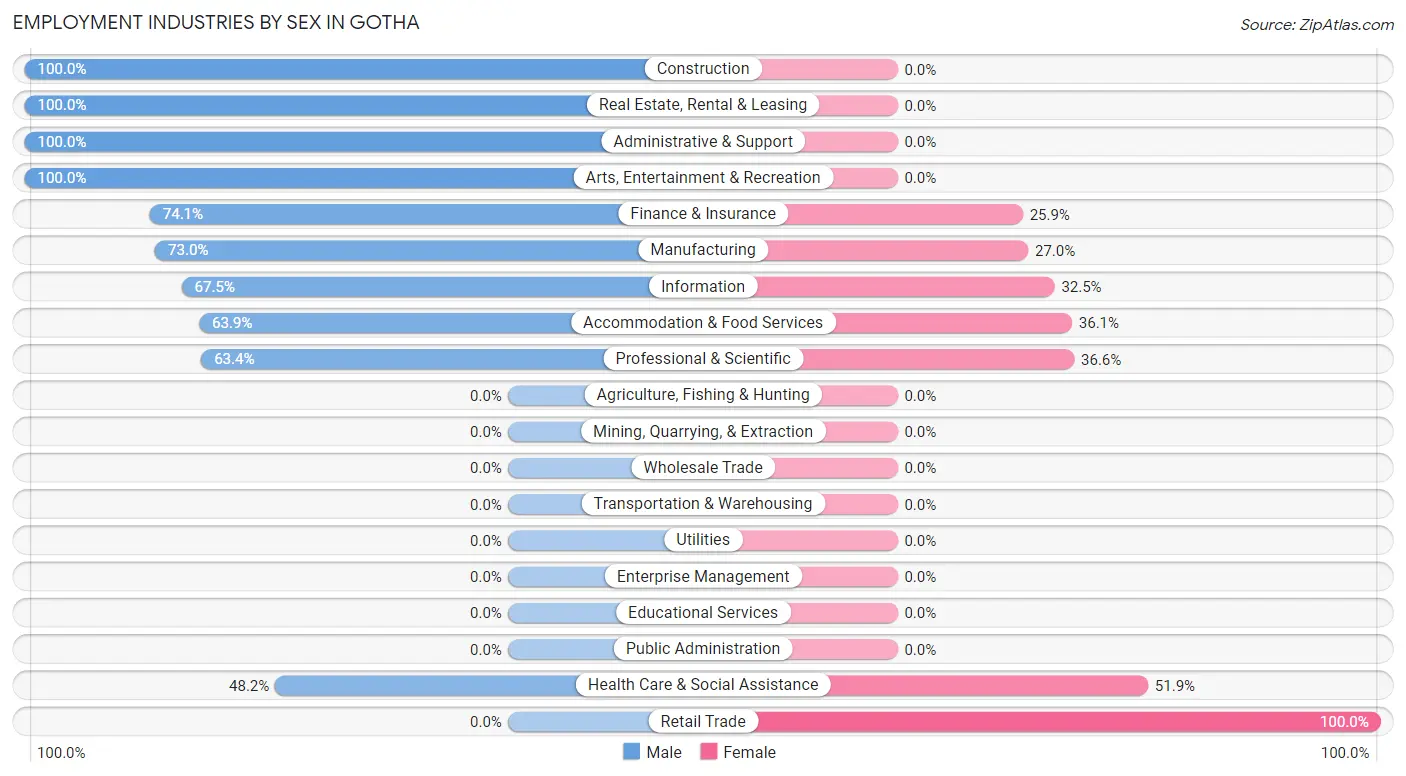
Employment Industries by Sex in Gotha
The Gotha industries that see more men than women are Construction (100.0%), Real Estate, Rental & Leasing (100.0%), and Administrative & Support (100.0%), whereas the industries that tend to have a higher number of women are Retail Trade (100.0%), Health Care & Social Assistance (51.8%), and Professional & Scientific (36.6%).
| Industry | Male | Female |
| Agriculture, Fishing & Hunting | 0 (0.0%) | 0 (0.0%) |
| Mining, Quarrying, & Extraction | 0 (0.0%) | 0 (0.0%) |
| Construction | 15 (100.0%) | 0 (0.0%) |
| Manufacturing | 27 (73.0%) | 10 (27.0%) |
| Wholesale Trade | 0 (0.0%) | 0 (0.0%) |
| Retail Trade | 0 (0.0%) | 70 (100.0%) |
| Transportation & Warehousing | 0 (0.0%) | 0 (0.0%) |
| Utilities | 0 (0.0%) | 0 (0.0%) |
| Information | 27 (67.5%) | 13 (32.5%) |
| Finance & Insurance | 20 (74.1%) | 7 (25.9%) |
| Real Estate, Rental & Leasing | 46 (100.0%) | 0 (0.0%) |
| Professional & Scientific | 85 (63.4%) | 49 (36.6%) |
| Enterprise Management | 0 (0.0%) | 0 (0.0%) |
| Administrative & Support | 67 (100.0%) | 0 (0.0%) |
| Educational Services | 0 (0.0%) | 0 (0.0%) |
| Health Care & Social Assistance | 65 (48.1%) | 70 (51.8%) |
| Arts, Entertainment & Recreation | 27 (100.0%) | 0 (0.0%) |
| Accommodation & Food Services | 23 (63.9%) | 13 (36.1%) |
| Public Administration | 0 (0.0%) | 0 (0.0%) |
| Total | 402 (57.4%) | 299 (42.6%) |
Education in Gotha
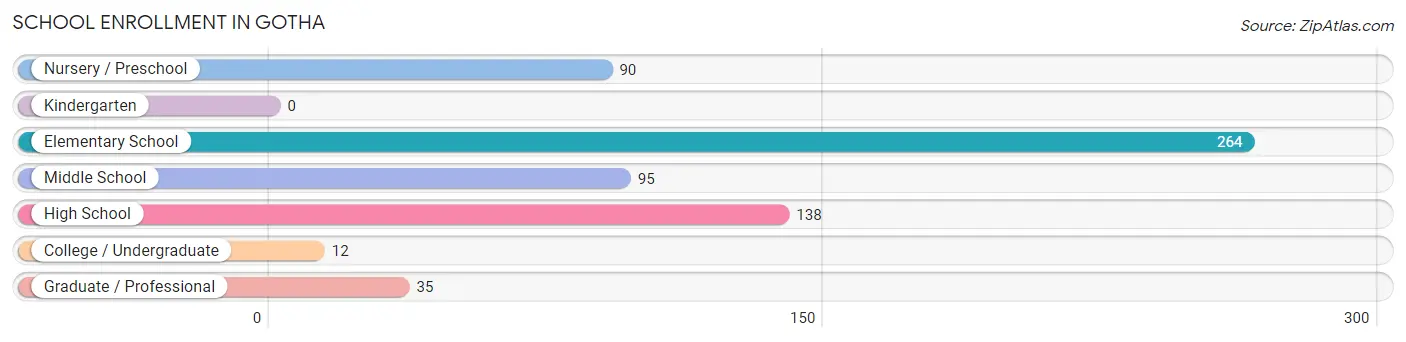
School Enrollment in Gotha
The most common levels of schooling among the 634 students in Gotha are elementary school (264 | 41.6%), high school (138 | 21.8%), and middle school (95 | 15.0%).
| School Level | # Students | % Students |
| Nursery / Preschool | 90 | 14.2% |
| Kindergarten | 0 | 0.0% |
| Elementary School | 264 | 41.6% |
| Middle School | 95 | 15.0% |
| High School | 138 | 21.8% |
| College / Undergraduate | 12 | 1.9% |
| Graduate / Professional | 35 | 5.5% |
| Total | 634 | 100.0% |
School Enrollment by Age by Funding Source in Gotha
Out of a total of 634 students who are enrolled in schools in Gotha, 350 (55.2%) attend a private institution, while the remaining 284 (44.8%) are enrolled in public schools. The age group of 20 to 24 year olds has the highest likelihood of being enrolled in private schools, with 5 (100.0% in the age bracket) enrolled. Conversely, the age group of 25 to 34 year olds has the lowest likelihood of being enrolled in a private school, with 35 (100.0% in the age bracket) attending a public institution.
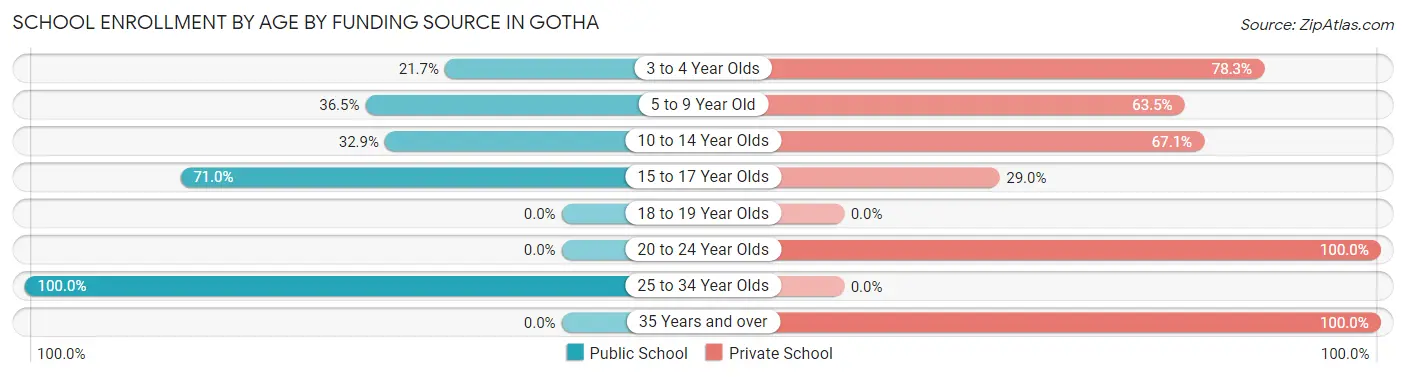
| Age Bracket | Public School | Private School |
| 3 to 4 Year Olds | 15 (21.7%) | 54 (78.3%) |
| 5 to 9 Year Old | 110 (36.5%) | 191 (63.5%) |
| 10 to 14 Year Olds | 26 (32.9%) | 53 (67.1%) |
| 15 to 17 Year Olds | 98 (71.0%) | 40 (29.0%) |
| 18 to 19 Year Olds | 0 (0.0%) | 0 (0.0%) |
| 20 to 24 Year Olds | 0 (0.0%) | 5 (100.0%) |
| 25 to 34 Year Olds | 35 (100.0%) | 0 (0.0%) |
| 35 Years and over | 0 (0.0%) | 7 (100.0%) |
| Total | 284 (44.8%) | 350 (55.2%) |
Educational Attainment by Field of Study in Gotha
Science & technology (155 | 25.8%), business (107 | 17.8%), communications (90 | 15.0%), bio, nature & agricultural (83 | 13.8%), and social sciences (32 | 5.3%) are the most common fields of study among 601 individuals in Gotha who have obtained a bachelor's degree or higher.
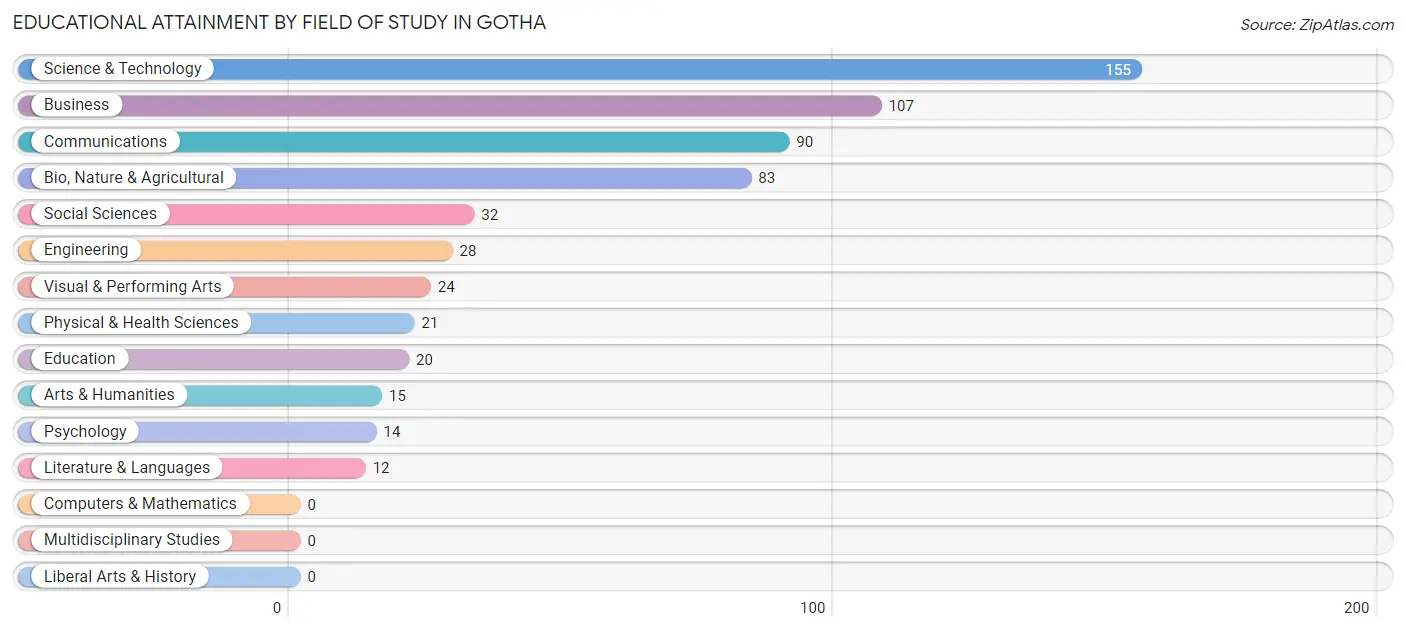
| Field of Study | # Graduates | % Graduates |
| Computers & Mathematics | 0 | 0.0% |
| Bio, Nature & Agricultural | 83 | 13.8% |
| Physical & Health Sciences | 21 | 3.5% |
| Psychology | 14 | 2.3% |
| Social Sciences | 32 | 5.3% |
| Engineering | 28 | 4.7% |
| Multidisciplinary Studies | 0 | 0.0% |
| Science & Technology | 155 | 25.8% |
| Business | 107 | 17.8% |
| Education | 20 | 3.3% |
| Literature & Languages | 12 | 2.0% |
| Liberal Arts & History | 0 | 0.0% |
| Visual & Performing Arts | 24 | 4.0% |
| Communications | 90 | 15.0% |
| Arts & Humanities | 15 | 2.5% |
| Total | 601 | 100.0% |
Transportation & Commute in Gotha
Vehicle Availability by Sex in Gotha
The most prevalent vehicle ownership categories in Gotha are males with 2 vehicles (213, accounting for 53.0%) and females with 2 vehicles (158, making up 73.2%).
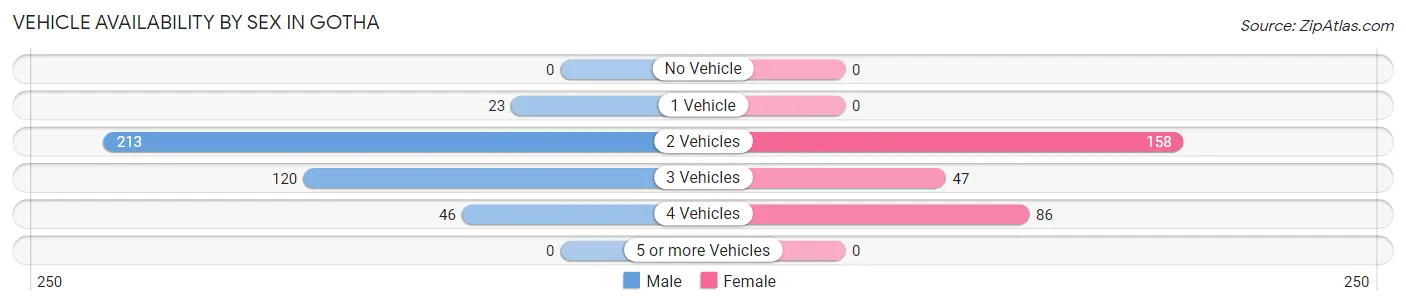
| Vehicles Available | Male | Female |
| No Vehicle | 0 (0.0%) | 0 (0.0%) |
| 1 Vehicle | 23 (5.7%) | 0 (0.0%) |
| 2 Vehicles | 213 (53.0%) | 158 (54.3%) |
| 3 Vehicles | 120 (29.8%) | 47 (16.2%) |
| 4 Vehicles | 46 (11.4%) | 86 (29.5%) |
| 5 or more Vehicles | 0 (0.0%) | 0 (0.0%) |
| Total | 402 (100.0%) | 291 (100.0%) |
Commute Time in Gotha
The most frequently occuring commute durations in Gotha are 30 to 34 minutes (295 commuters, 45.2%), 35 to 39 minutes (105 commuters, 16.1%), and 20 to 24 minutes (92 commuters, 14.1%).
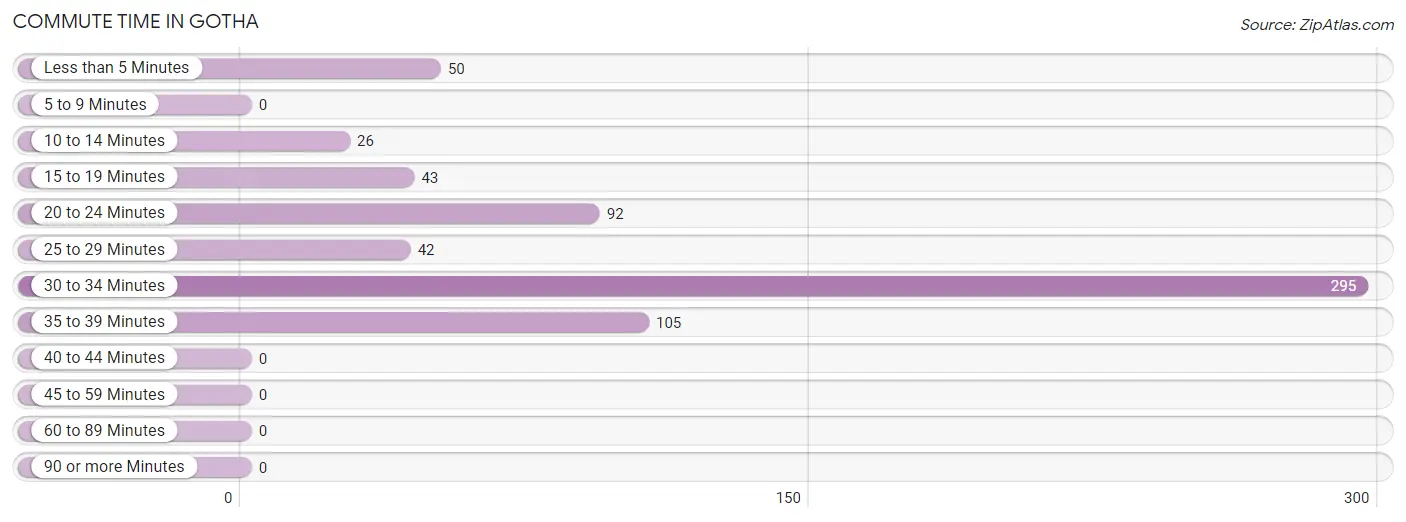
| Commute Time | # Commuters | % Commuters |
| Less than 5 Minutes | 50 | 7.7% |
| 5 to 9 Minutes | 0 | 0.0% |
| 10 to 14 Minutes | 26 | 4.0% |
| 15 to 19 Minutes | 43 | 6.6% |
| 20 to 24 Minutes | 92 | 14.1% |
| 25 to 29 Minutes | 42 | 6.4% |
| 30 to 34 Minutes | 295 | 45.2% |
| 35 to 39 Minutes | 105 | 16.1% |
| 40 to 44 Minutes | 0 | 0.0% |
| 45 to 59 Minutes | 0 | 0.0% |
| 60 to 89 Minutes | 0 | 0.0% |
| 90 or more Minutes | 0 | 0.0% |
Commute Time by Sex in Gotha
The most common commute times in Gotha are 30 to 34 minutes (197 commuters, 51.7%) for males and 30 to 34 minutes (98 commuters, 36.0%) for females.
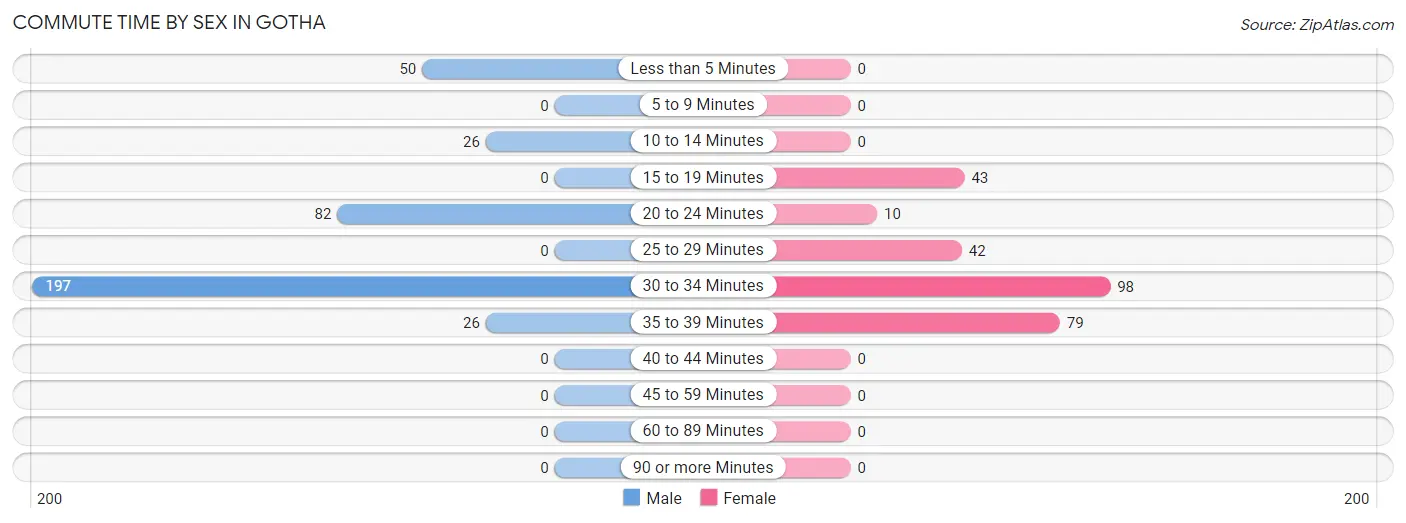
| Commute Time | Male | Female |
| Less than 5 Minutes | 50 (13.1%) | 0 (0.0%) |
| 5 to 9 Minutes | 0 (0.0%) | 0 (0.0%) |
| 10 to 14 Minutes | 26 (6.8%) | 0 (0.0%) |
| 15 to 19 Minutes | 0 (0.0%) | 43 (15.8%) |
| 20 to 24 Minutes | 82 (21.5%) | 10 (3.7%) |
| 25 to 29 Minutes | 0 (0.0%) | 42 (15.4%) |
| 30 to 34 Minutes | 197 (51.7%) | 98 (36.0%) |
| 35 to 39 Minutes | 26 (6.8%) | 79 (29.0%) |
| 40 to 44 Minutes | 0 (0.0%) | 0 (0.0%) |
| 45 to 59 Minutes | 0 (0.0%) | 0 (0.0%) |
| 60 to 89 Minutes | 0 (0.0%) | 0 (0.0%) |
| 90 or more Minutes | 0 (0.0%) | 0 (0.0%) |
Time of Departure to Work by Sex in Gotha
The most frequent times of departure to work in Gotha are 8:00 AM to 8:29 AM (130, 34.1%) for males and 7:30 AM to 7:59 AM (67, 24.6%) for females.
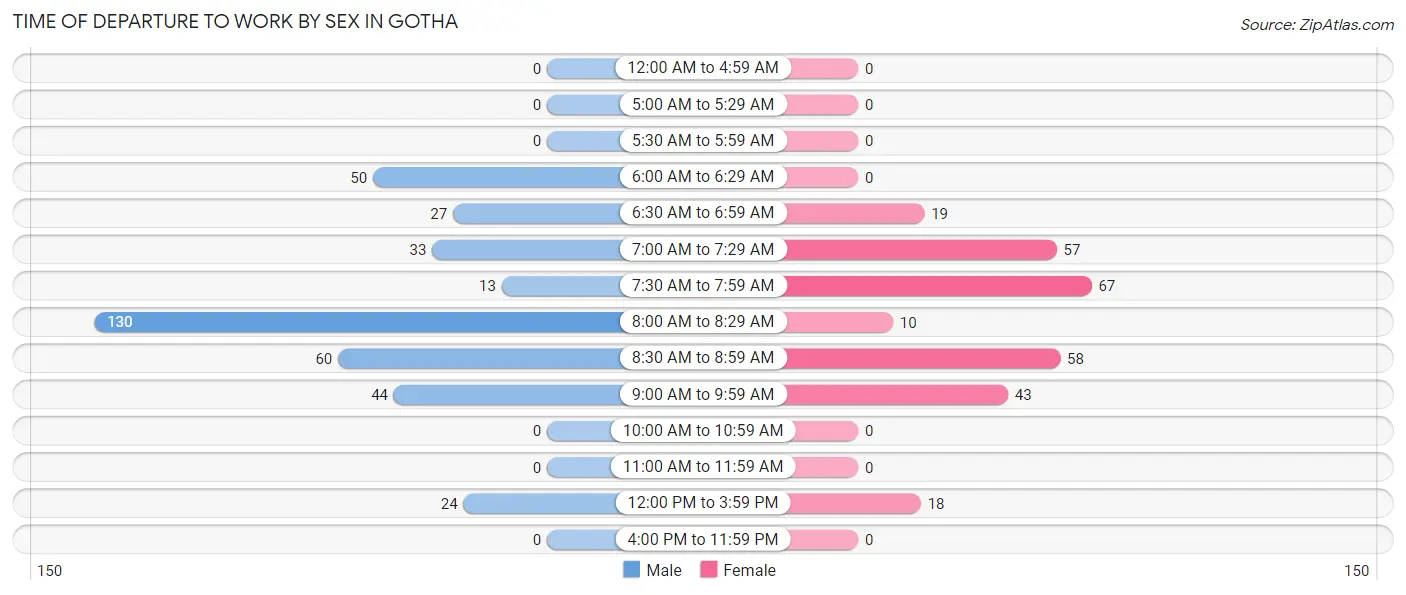
| Time of Departure | Male | Female |
| 12:00 AM to 4:59 AM | 0 (0.0%) | 0 (0.0%) |
| 5:00 AM to 5:29 AM | 0 (0.0%) | 0 (0.0%) |
| 5:30 AM to 5:59 AM | 0 (0.0%) | 0 (0.0%) |
| 6:00 AM to 6:29 AM | 50 (13.1%) | 0 (0.0%) |
| 6:30 AM to 6:59 AM | 27 (7.1%) | 19 (7.0%) |
| 7:00 AM to 7:29 AM | 33 (8.7%) | 57 (21.0%) |
| 7:30 AM to 7:59 AM | 13 (3.4%) | 67 (24.6%) |
| 8:00 AM to 8:29 AM | 130 (34.1%) | 10 (3.7%) |
| 8:30 AM to 8:59 AM | 60 (15.8%) | 58 (21.3%) |
| 9:00 AM to 9:59 AM | 44 (11.6%) | 43 (15.8%) |
| 10:00 AM to 10:59 AM | 0 (0.0%) | 0 (0.0%) |
| 11:00 AM to 11:59 AM | 0 (0.0%) | 0 (0.0%) |
| 12:00 PM to 3:59 PM | 24 (6.3%) | 18 (6.6%) |
| 4:00 PM to 11:59 PM | 0 (0.0%) | 0 (0.0%) |
| Total | 381 (100.0%) | 272 (100.0%) |
Housing Occupancy in Gotha
Occupancy by Ownership in Gotha
Of the total 436 dwellings in Gotha, owner-occupied units account for 382 (87.6%), while renter-occupied units make up 54 (12.4%).
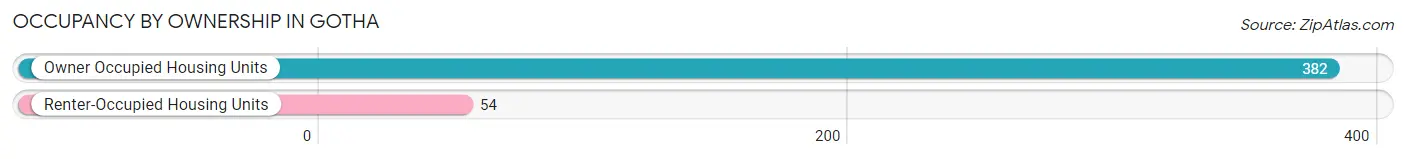
| Occupancy | # Housing Units | % Housing Units |
| Owner Occupied Housing Units | 382 | 87.6% |
| Renter-Occupied Housing Units | 54 | 12.4% |
| Total Occupied Housing Units | 436 | 100.0% |
Occupancy by Household Size in Gotha
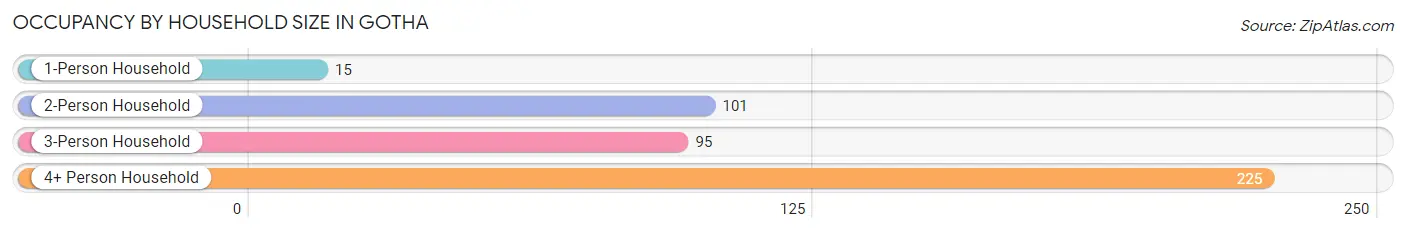
| Household Size | # Housing Units | % Housing Units |
| 1-Person Household | 15 | 3.4% |
| 2-Person Household | 101 | 23.2% |
| 3-Person Household | 95 | 21.8% |
| 4+ Person Household | 225 | 51.6% |
| Total Housing Units | 436 | 100.0% |
Occupancy by Ownership by Household Size in Gotha
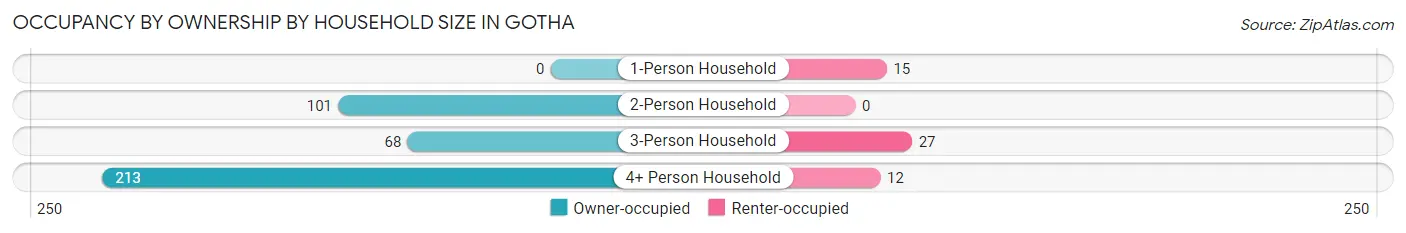
| Household Size | Owner-occupied | Renter-occupied |
| 1-Person Household | 0 (0.0%) | 15 (100.0%) |
| 2-Person Household | 101 (100.0%) | 0 (0.0%) |
| 3-Person Household | 68 (71.6%) | 27 (28.4%) |
| 4+ Person Household | 213 (94.7%) | 12 (5.3%) |
| Total Housing Units | 382 (87.6%) | 54 (12.4%) |
Occupancy by Educational Attainment in Gotha
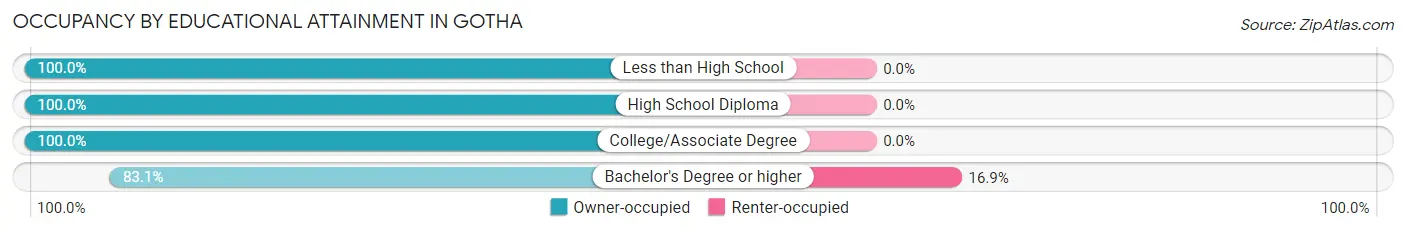
| Household Size | Owner-occupied | Renter-occupied |
| Less than High School | 25 (100.0%) | 0 (0.0%) |
| High School Diploma | 68 (100.0%) | 0 (0.0%) |
| College/Associate Degree | 24 (100.0%) | 0 (0.0%) |
| Bachelor's Degree or higher | 265 (83.1%) | 54 (16.9%) |
Occupancy by Age of Householder in Gotha
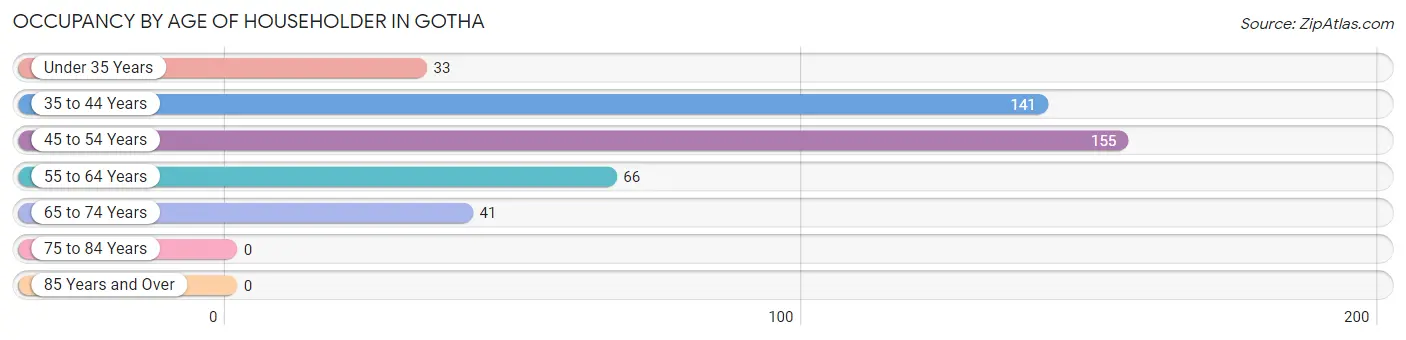
| Age Bracket | # Households | % Households |
| Under 35 Years | 33 | 7.6% |
| 35 to 44 Years | 141 | 32.3% |
| 45 to 54 Years | 155 | 35.5% |
| 55 to 64 Years | 66 | 15.1% |
| 65 to 74 Years | 41 | 9.4% |
| 75 to 84 Years | 0 | 0.0% |
| 85 Years and Over | 0 | 0.0% |
| Total | 436 | 100.0% |
Housing Finances in Gotha
Median Income by Occupancy in Gotha
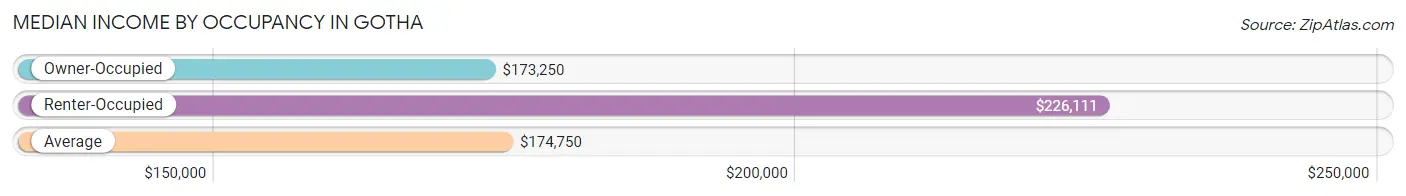
| Occupancy Type | # Households | Median Income |
| Owner-Occupied | 382 (87.6%) | $173,250 |
| Renter-Occupied | 54 (12.4%) | $226,111 |
| Average | 436 (100.0%) | $174,750 |
Occupancy by Householder Income Bracket in Gotha
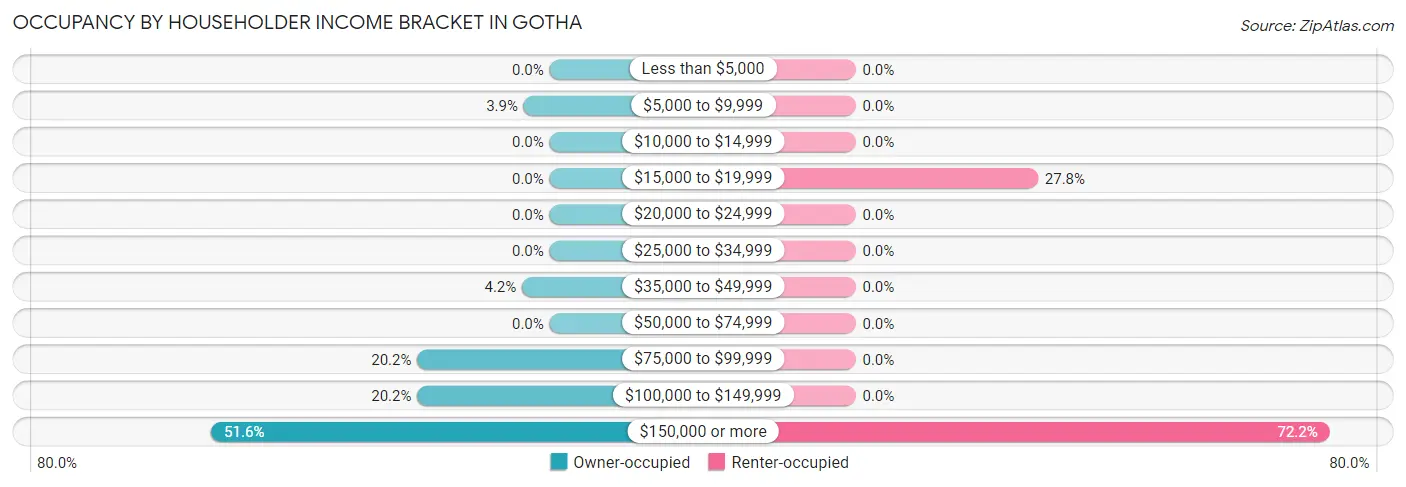
| Income Bracket | Owner-occupied | Renter-occupied |
| Less than $5,000 | 0 (0.0%) | 0 (0.0%) |
| $5,000 to $9,999 | 15 (3.9%) | 0 (0.0%) |
| $10,000 to $14,999 | 0 (0.0%) | 0 (0.0%) |
| $15,000 to $19,999 | 0 (0.0%) | 15 (27.8%) |
| $20,000 to $24,999 | 0 (0.0%) | 0 (0.0%) |
| $25,000 to $34,999 | 0 (0.0%) | 0 (0.0%) |
| $35,000 to $49,999 | 16 (4.2%) | 0 (0.0%) |
| $50,000 to $74,999 | 0 (0.0%) | 0 (0.0%) |
| $75,000 to $99,999 | 77 (20.2%) | 0 (0.0%) |
| $100,000 to $149,999 | 77 (20.2%) | 0 (0.0%) |
| $150,000 or more | 197 (51.6%) | 39 (72.2%) |
| Total | 382 (100.0%) | 54 (100.0%) |
Monthly Housing Cost Tiers in Gotha
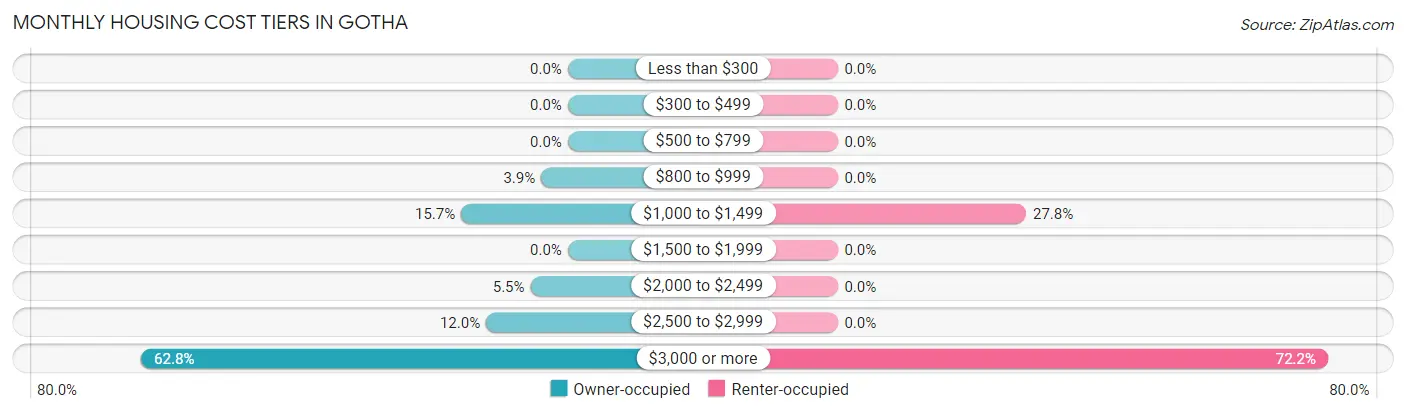
| Monthly Cost | Owner-occupied | Renter-occupied |
| Less than $300 | 0 (0.0%) | 0 (0.0%) |
| $300 to $499 | 0 (0.0%) | 0 (0.0%) |
| $500 to $799 | 0 (0.0%) | 0 (0.0%) |
| $800 to $999 | 15 (3.9%) | 0 (0.0%) |
| $1,000 to $1,499 | 60 (15.7%) | 15 (27.8%) |
| $1,500 to $1,999 | 0 (0.0%) | 0 (0.0%) |
| $2,000 to $2,499 | 21 (5.5%) | 0 (0.0%) |
| $2,500 to $2,999 | 46 (12.0%) | 0 (0.0%) |
| $3,000 or more | 240 (62.8%) | 39 (72.2%) |
| Total | 382 (100.0%) | 54 (100.0%) |
Physical Housing Characteristics in Gotha
Housing Structures in Gotha
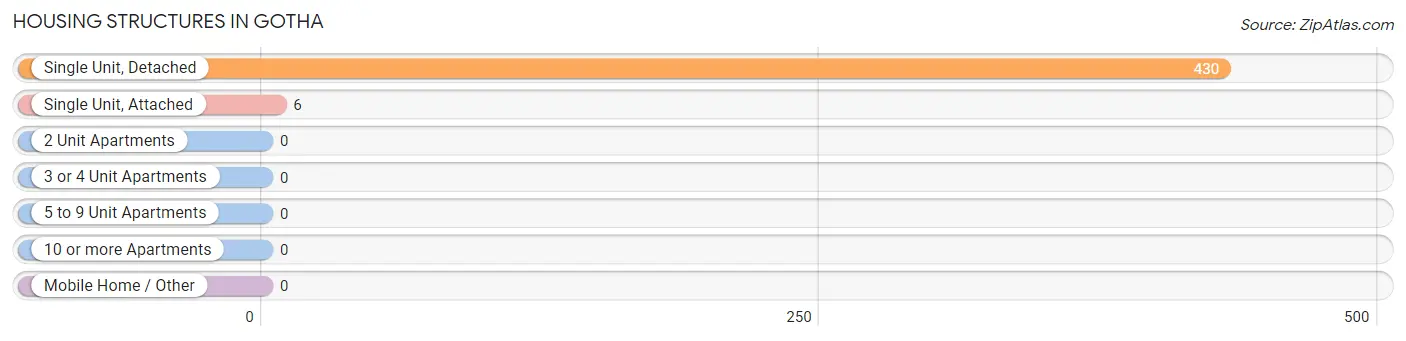
| Structure Type | # Housing Units | % Housing Units |
| Single Unit, Detached | 430 | 98.6% |
| Single Unit, Attached | 6 | 1.4% |
| 2 Unit Apartments | 0 | 0.0% |
| 3 or 4 Unit Apartments | 0 | 0.0% |
| 5 to 9 Unit Apartments | 0 | 0.0% |
| 10 or more Apartments | 0 | 0.0% |
| Mobile Home / Other | 0 | 0.0% |
| Total | 436 | 100.0% |
Housing Structures by Occupancy in Gotha
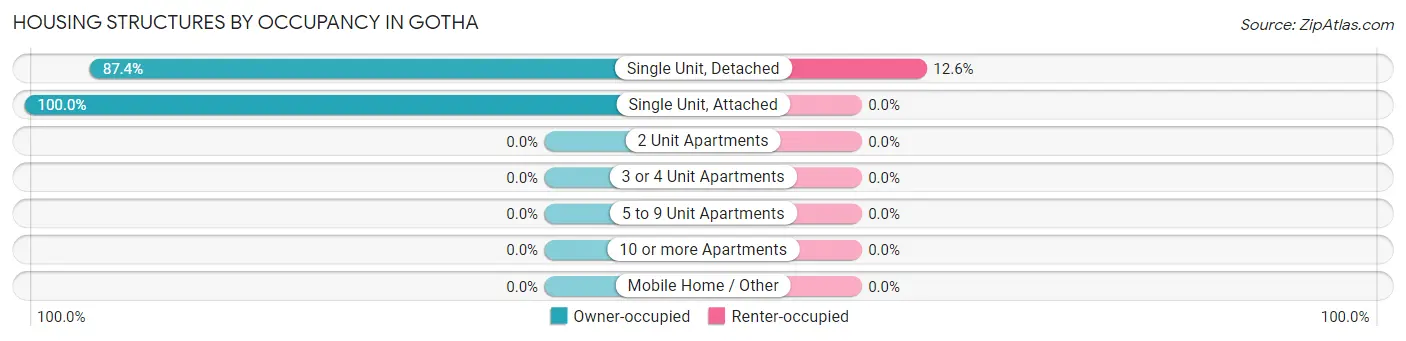
| Structure Type | Owner-occupied | Renter-occupied |
| Single Unit, Detached | 376 (87.4%) | 54 (12.6%) |
| Single Unit, Attached | 6 (100.0%) | 0 (0.0%) |
| 2 Unit Apartments | 0 (0.0%) | 0 (0.0%) |
| 3 or 4 Unit Apartments | 0 (0.0%) | 0 (0.0%) |
| 5 to 9 Unit Apartments | 0 (0.0%) | 0 (0.0%) |
| 10 or more Apartments | 0 (0.0%) | 0 (0.0%) |
| Mobile Home / Other | 0 (0.0%) | 0 (0.0%) |
| Total | 382 (87.6%) | 54 (12.4%) |
Housing Structures by Number of Rooms in Gotha
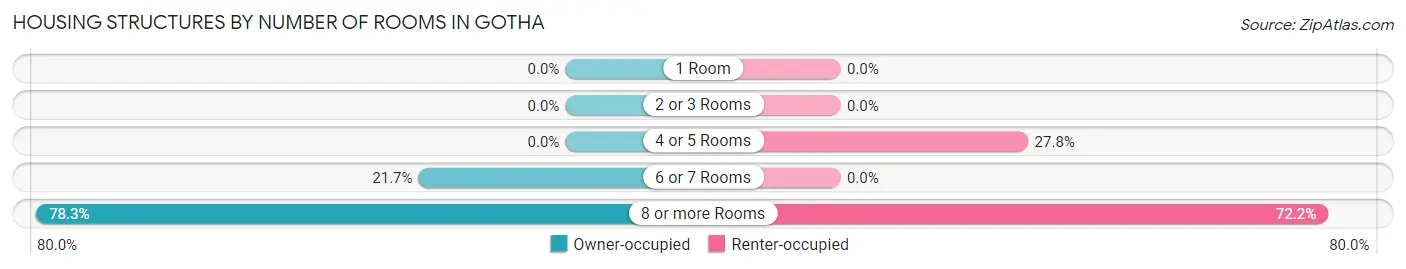
| Number of Rooms | Owner-occupied | Renter-occupied |
| 1 Room | 0 (0.0%) | 0 (0.0%) |
| 2 or 3 Rooms | 0 (0.0%) | 0 (0.0%) |
| 4 or 5 Rooms | 0 (0.0%) | 15 (27.8%) |
| 6 or 7 Rooms | 83 (21.7%) | 0 (0.0%) |
| 8 or more Rooms | 299 (78.3%) | 39 (72.2%) |
| Total | 382 (100.0%) | 54 (100.0%) |
Housing Structure by Heating Type in Gotha
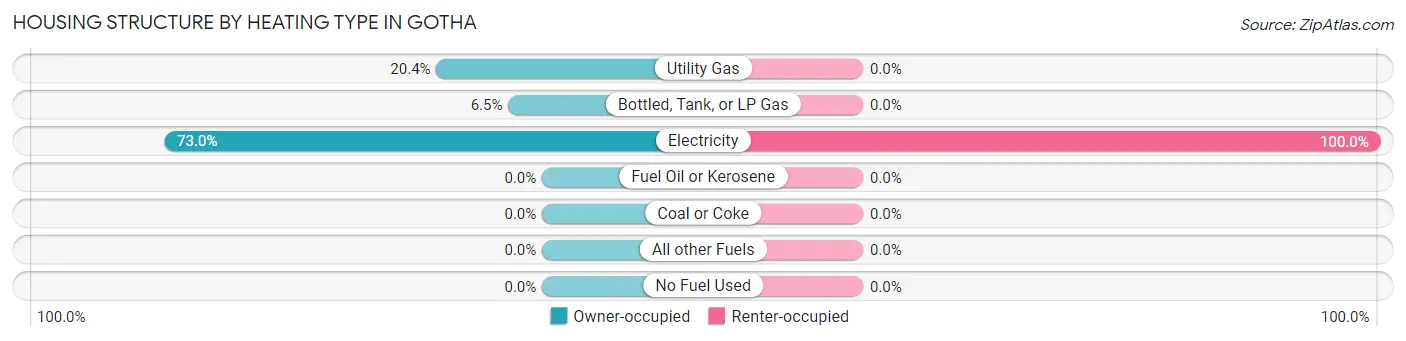
| Heating Type | Owner-occupied | Renter-occupied |
| Utility Gas | 78 (20.4%) | 0 (0.0%) |
| Bottled, Tank, or LP Gas | 25 (6.5%) | 0 (0.0%) |
| Electricity | 279 (73.0%) | 54 (100.0%) |
| Fuel Oil or Kerosene | 0 (0.0%) | 0 (0.0%) |
| Coal or Coke | 0 (0.0%) | 0 (0.0%) |
| All other Fuels | 0 (0.0%) | 0 (0.0%) |
| No Fuel Used | 0 (0.0%) | 0 (0.0%) |
| Total | 382 (100.0%) | 54 (100.0%) |
Household Vehicle Usage in Gotha
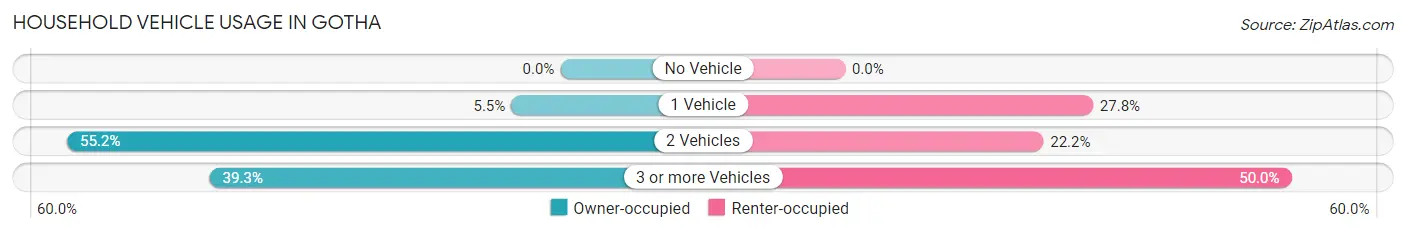
| Vehicles per Household | Owner-occupied | Renter-occupied |
| No Vehicle | 0 (0.0%) | 0 (0.0%) |
| 1 Vehicle | 21 (5.5%) | 15 (27.8%) |
| 2 Vehicles | 211 (55.2%) | 12 (22.2%) |
| 3 or more Vehicles | 150 (39.3%) | 27 (50.0%) |
| Total | 382 (100.0%) | 54 (100.0%) |
Real Estate & Mortgages in Gotha
Real Estate and Mortgage Overview in Gotha
| Characteristic | Without Mortgage | With Mortgage |
| Housing Units | 59 | 323 |
| Median Property Value | - | - |
| Median Household Income | - | - |
| Monthly Housing Costs | - | - |
| Real Estate Taxes | - | - |
Property Value by Mortgage Status in Gotha
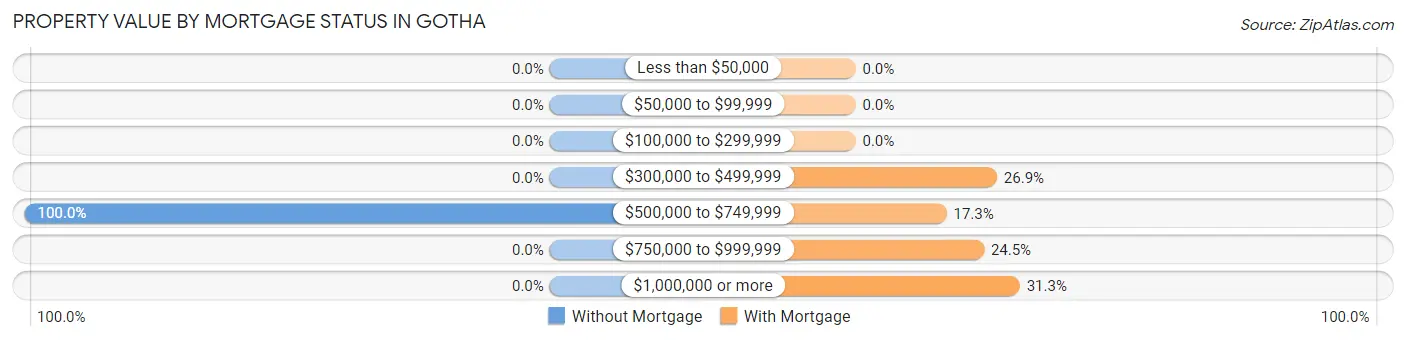
| Property Value | Without Mortgage | With Mortgage |
| Less than $50,000 | 0 (0.0%) | 0 (0.0%) |
| $50,000 to $99,999 | 0 (0.0%) | 0 (0.0%) |
| $100,000 to $299,999 | 0 (0.0%) | 0 (0.0%) |
| $300,000 to $499,999 | 0 (0.0%) | 87 (26.9%) |
| $500,000 to $749,999 | 59 (100.0%) | 56 (17.3%) |
| $750,000 to $999,999 | 0 (0.0%) | 79 (24.5%) |
| $1,000,000 or more | 0 (0.0%) | 101 (31.3%) |
| Total | 59 (100.0%) | 323 (100.0%) |
Household Income by Mortgage Status in Gotha
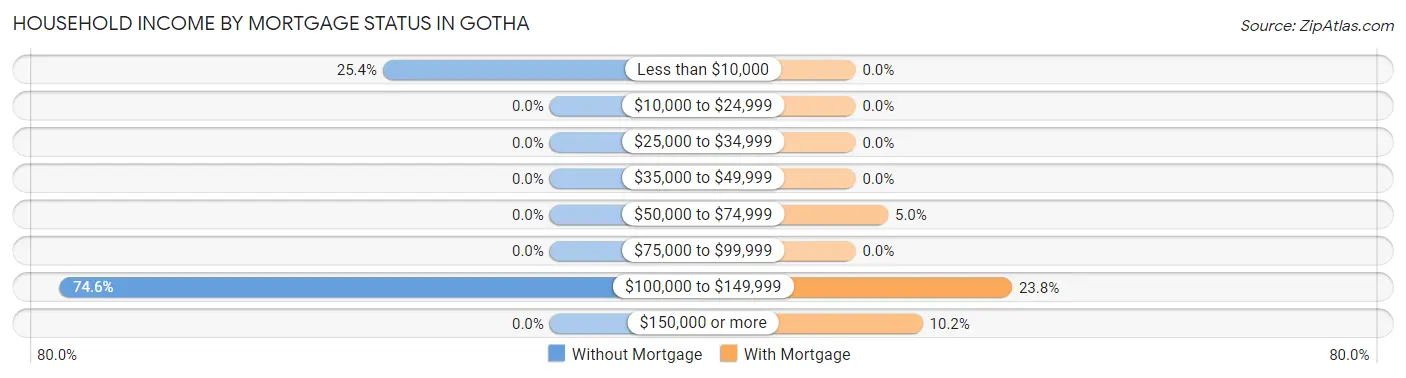
| Household Income | Without Mortgage | With Mortgage |
| Less than $10,000 | 15 (25.4%) | 0 (0.0%) |
| $10,000 to $24,999 | 0 (0.0%) | 0 (0.0%) |
| $25,000 to $34,999 | 0 (0.0%) | 0 (0.0%) |
| $35,000 to $49,999 | 0 (0.0%) | 0 (0.0%) |
| $50,000 to $74,999 | 0 (0.0%) | 16 (5.0%) |
| $75,000 to $99,999 | 0 (0.0%) | 0 (0.0%) |
| $100,000 to $149,999 | 44 (74.6%) | 77 (23.8%) |
| $150,000 or more | 0 (0.0%) | 33 (10.2%) |
| Total | 59 (100.0%) | 323 (100.0%) |
Property Value to Household Income Ratio in Gotha
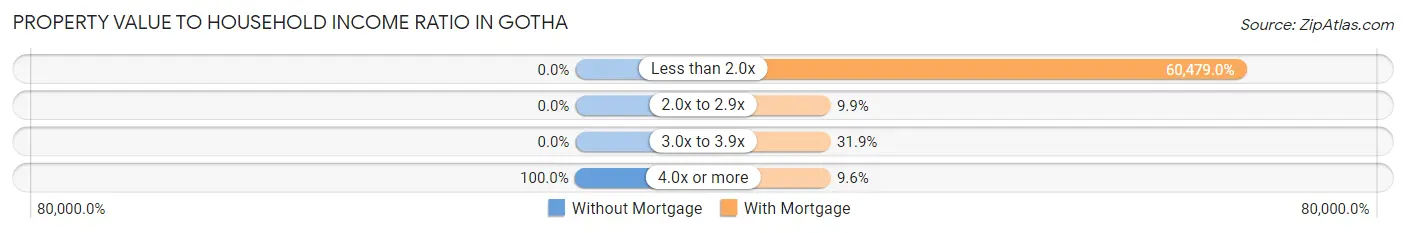
| Value-to-Income Ratio | Without Mortgage | With Mortgage |
| Less than 2.0x | 0 (0.0%) | 195,347 (60,478.9%) |
| 2.0x to 2.9x | 0 (0.0%) | 32 (9.9%) |
| 3.0x to 3.9x | 0 (0.0%) | 103 (31.9%) |
| 4.0x or more | 59 (100.0%) | 31 (9.6%) |
| Total | 59 (100.0%) | 323 (100.0%) |
Real Estate Taxes by Mortgage Status in Gotha
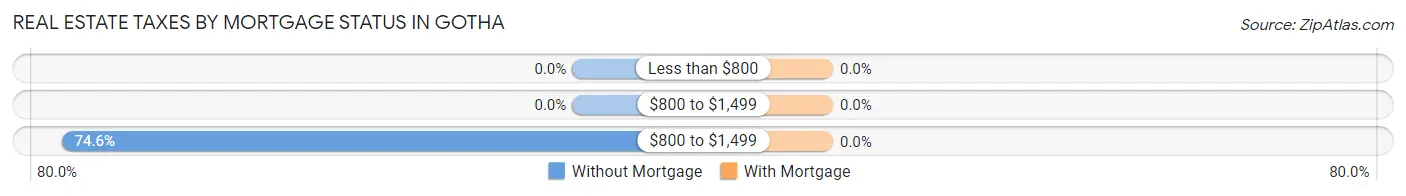
| Property Taxes | Without Mortgage | With Mortgage |
| Less than $800 | 0 (0.0%) | 0 (0.0%) |
| $800 to $1,499 | 0 (0.0%) | 0 (0.0%) |
| $800 to $1,499 | 44 (74.6%) | 0 (0.0%) |
| Total | 59 (100.0%) | 323 (100.0%) |
Health & Disability in Gotha
Health Insurance Coverage by Age in Gotha
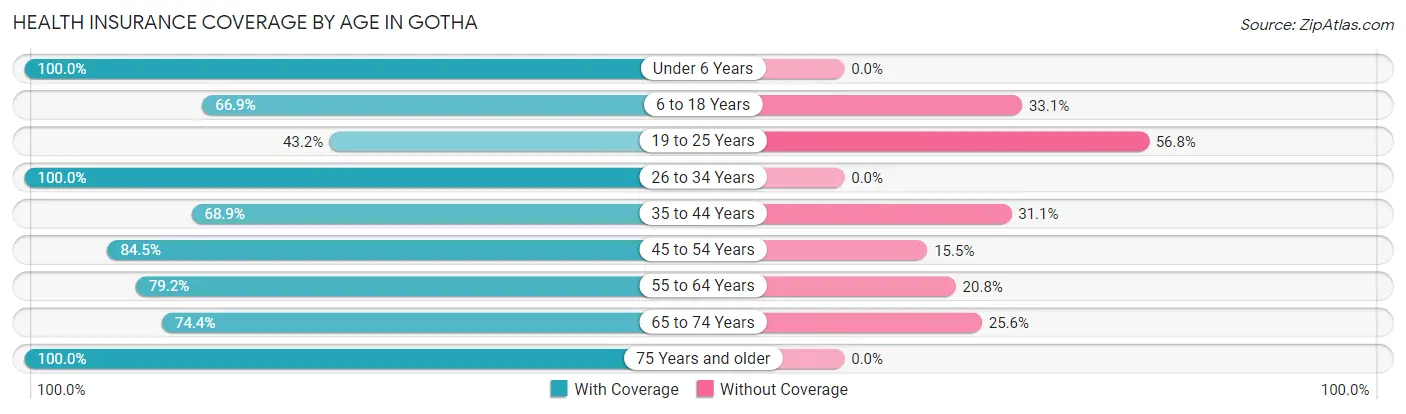
| Age Bracket | With Coverage | Without Coverage |
| Under 6 Years | 179 (100.0%) | 0 (0.0%) |
| 6 to 18 Years | 349 (66.9%) | 173 (33.1%) |
| 19 to 25 Years | 32 (43.2%) | 42 (56.8%) |
| 26 to 34 Years | 76 (100.0%) | 0 (0.0%) |
| 35 to 44 Years | 199 (68.9%) | 90 (31.1%) |
| 45 to 54 Years | 235 (84.5%) | 43 (15.5%) |
| 55 to 64 Years | 103 (79.2%) | 27 (20.8%) |
| 65 to 74 Years | 58 (74.4%) | 20 (25.6%) |
| 75 Years and older | 9 (100.0%) | 0 (0.0%) |
| Total | 1,240 (75.8%) | 395 (24.2%) |
Health Insurance Coverage by Citizenship Status in Gotha
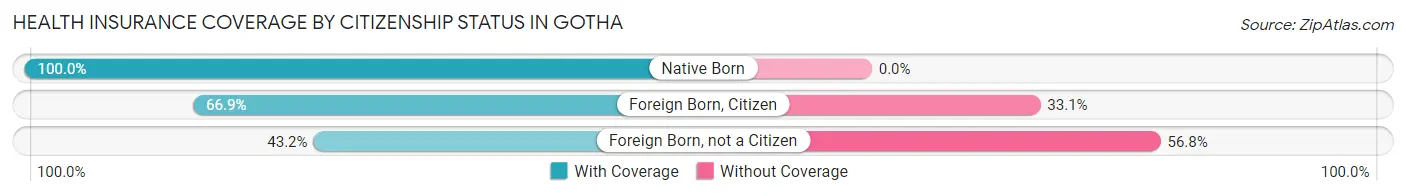
| Citizenship Status | With Coverage | Without Coverage |
| Native Born | 179 (100.0%) | 0 (0.0%) |
| Foreign Born, Citizen | 349 (66.9%) | 173 (33.1%) |
| Foreign Born, not a Citizen | 32 (43.2%) | 42 (56.8%) |
Health Insurance Coverage by Household Income in Gotha
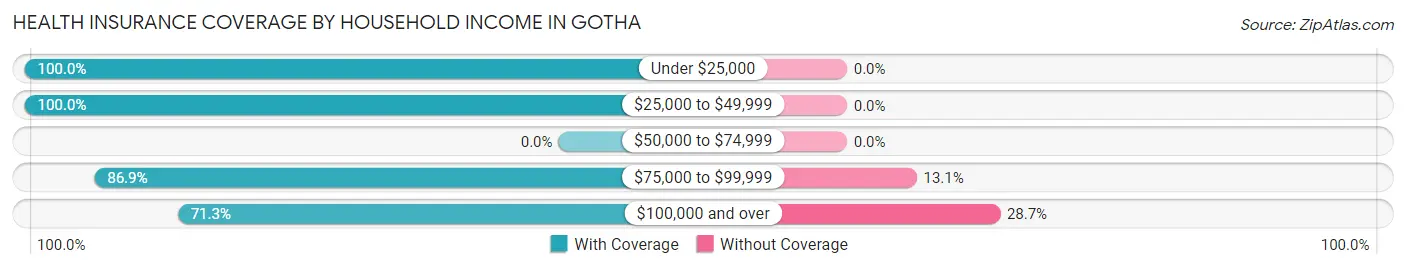
| Household Income | With Coverage | Without Coverage |
| Under $25,000 | 46 (100.0%) | 0 (0.0%) |
| $25,000 to $49,999 | 33 (100.0%) | 0 (0.0%) |
| $50,000 to $74,999 | 0 (0.0%) | 0 (0.0%) |
| $75,000 to $99,999 | 286 (86.9%) | 43 (13.1%) |
| $100,000 and over | 875 (71.3%) | 352 (28.7%) |
Public vs Private Health Insurance Coverage by Age in Gotha
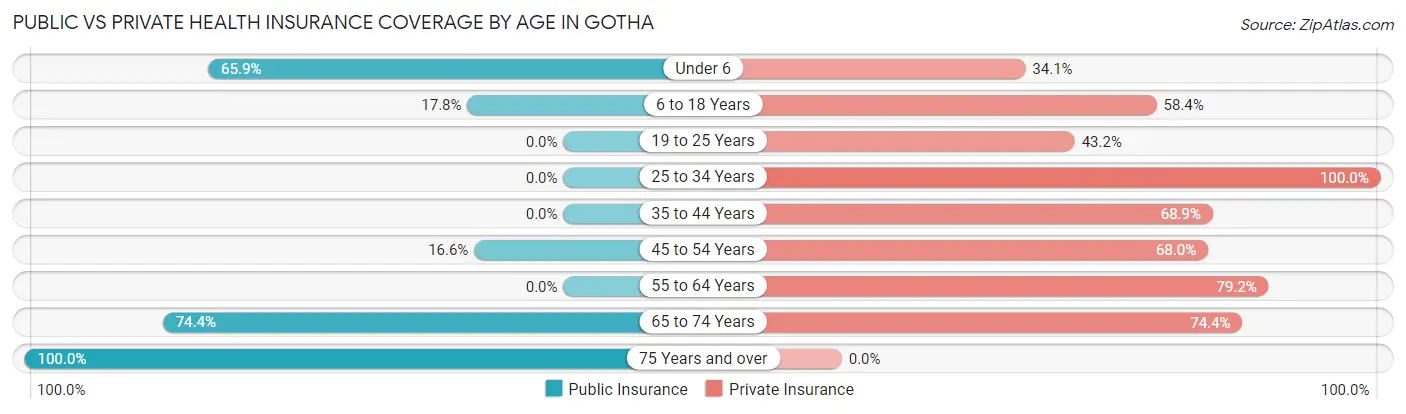
| Age Bracket | Public Insurance | Private Insurance |
| Under 6 | 118 (65.9%) | 61 (34.1%) |
| 6 to 18 Years | 93 (17.8%) | 305 (58.4%) |
| 19 to 25 Years | 0 (0.0%) | 32 (43.2%) |
| 25 to 34 Years | 0 (0.0%) | 76 (100.0%) |
| 35 to 44 Years | 0 (0.0%) | 199 (68.9%) |
| 45 to 54 Years | 46 (16.6%) | 189 (68.0%) |
| 55 to 64 Years | 0 (0.0%) | 103 (79.2%) |
| 65 to 74 Years | 58 (74.4%) | 58 (74.4%) |
| 75 Years and over | 9 (100.0%) | 0 (0.0%) |
| Total | 324 (19.8%) | 1,023 (62.6%) |
Disability Status by Sex by Age in Gotha
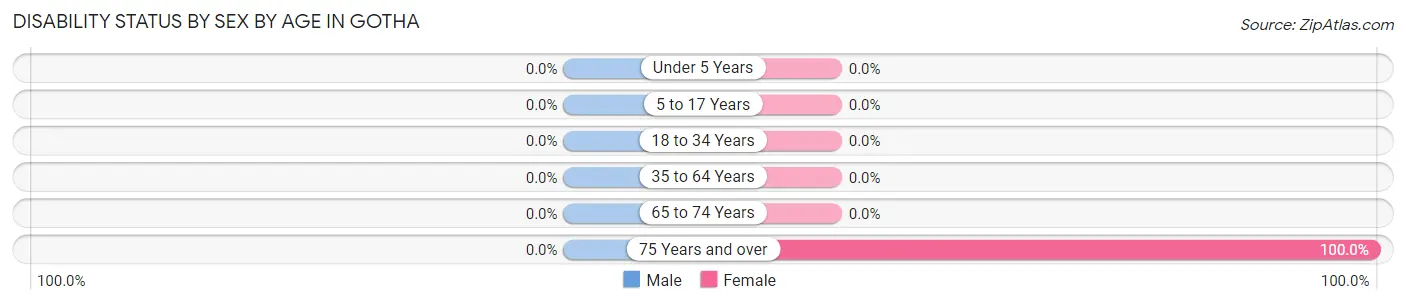
| Age Bracket | Male | Female |
| Under 5 Years | 0 (0.0%) | 0 (0.0%) |
| 5 to 17 Years | 0 (0.0%) | 0 (0.0%) |
| 18 to 34 Years | 0 (0.0%) | 0 (0.0%) |
| 35 to 64 Years | 0 (0.0%) | 0 (0.0%) |
| 65 to 74 Years | 0 (0.0%) | 0 (0.0%) |
| 75 Years and over | 0 (0.0%) | 9 (100.0%) |
Disability Class by Sex by Age in Gotha
Disability Class: Hearing Difficulty
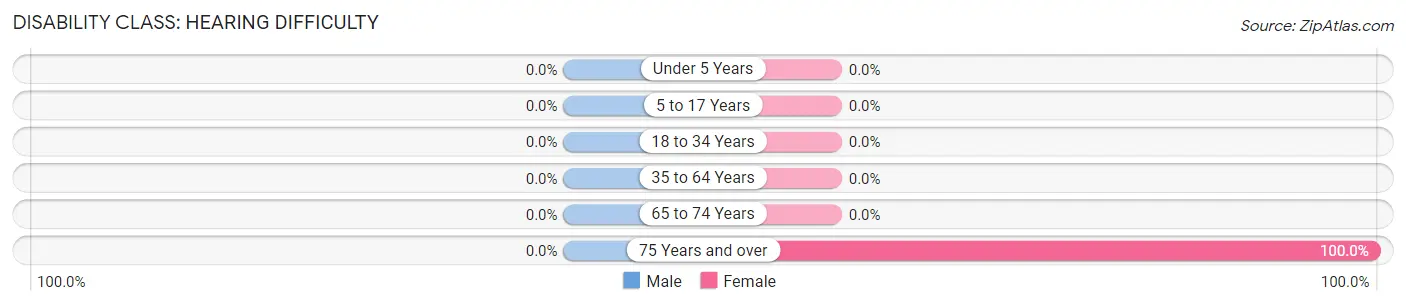
| Age Bracket | Male | Female |
| Under 5 Years | 0 (0.0%) | 0 (0.0%) |
| 5 to 17 Years | 0 (0.0%) | 0 (0.0%) |
| 18 to 34 Years | 0 (0.0%) | 0 (0.0%) |
| 35 to 64 Years | 0 (0.0%) | 0 (0.0%) |
| 65 to 74 Years | 0 (0.0%) | 0 (0.0%) |
| 75 Years and over | 0 (0.0%) | 9 (100.0%) |
Disability Class: Vision Difficulty
| Age Bracket | Male | Female |
| Under 5 Years | 0 (0.0%) | 0 (0.0%) |
| 5 to 17 Years | 0 (0.0%) | 0 (0.0%) |
| 18 to 34 Years | 0 (0.0%) | 0 (0.0%) |
| 35 to 64 Years | 0 (0.0%) | 0 (0.0%) |
| 65 to 74 Years | 0 (0.0%) | 0 (0.0%) |
| 75 Years and over | 0 (0.0%) | 0 (0.0%) |
Disability Class: Cognitive Difficulty
| Age Bracket | Male | Female |
| 5 to 17 Years | 0 (0.0%) | 0 (0.0%) |
| 18 to 34 Years | 0 (0.0%) | 0 (0.0%) |
| 35 to 64 Years | 0 (0.0%) | 0 (0.0%) |
| 65 to 74 Years | 0 (0.0%) | 0 (0.0%) |
| 75 Years and over | 0 (0.0%) | 0 (0.0%) |
Disability Class: Ambulatory Difficulty
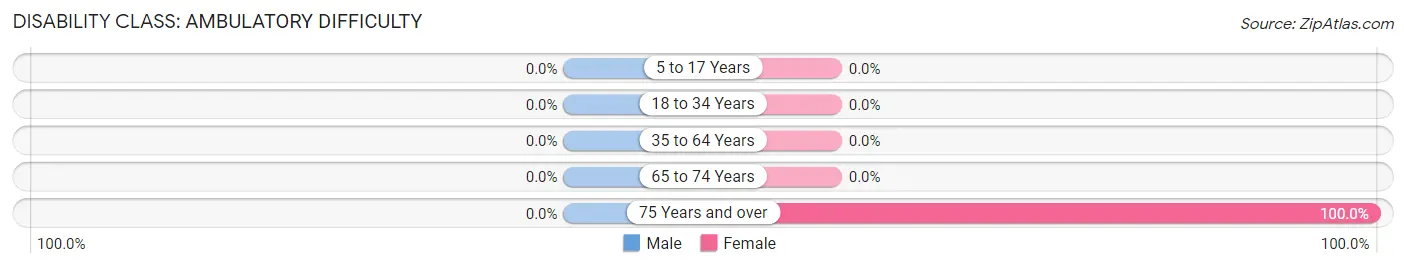
| Age Bracket | Male | Female |
| 5 to 17 Years | 0 (0.0%) | 0 (0.0%) |
| 18 to 34 Years | 0 (0.0%) | 0 (0.0%) |
| 35 to 64 Years | 0 (0.0%) | 0 (0.0%) |
| 65 to 74 Years | 0 (0.0%) | 0 (0.0%) |
| 75 Years and over | 0 (0.0%) | 9 (100.0%) |
Disability Class: Self-Care Difficulty
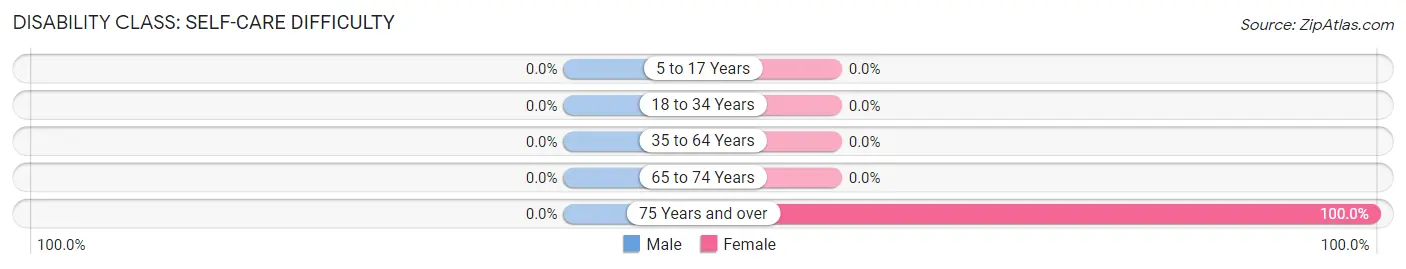
| Age Bracket | Male | Female |
| 5 to 17 Years | 0 (0.0%) | 0 (0.0%) |
| 18 to 34 Years | 0 (0.0%) | 0 (0.0%) |
| 35 to 64 Years | 0 (0.0%) | 0 (0.0%) |
| 65 to 74 Years | 0 (0.0%) | 0 (0.0%) |
| 75 Years and over | 0 (0.0%) | 9 (100.0%) |
Technology Access in Gotha
Computing Device Access in Gotha
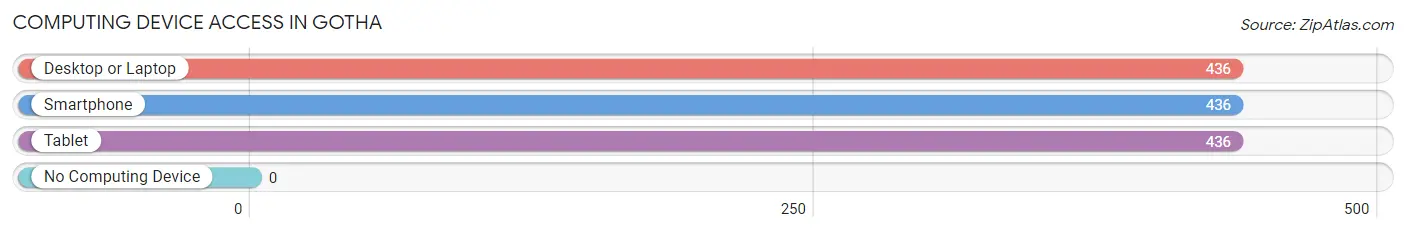
| Device Type | # Households | % Households |
| Desktop or Laptop | 436 | 100.0% |
| Smartphone | 436 | 100.0% |
| Tablet | 436 | 100.0% |
| No Computing Device | 0 | 0.0% |
| Total | 436 | 100.0% |
Internet Access in Gotha
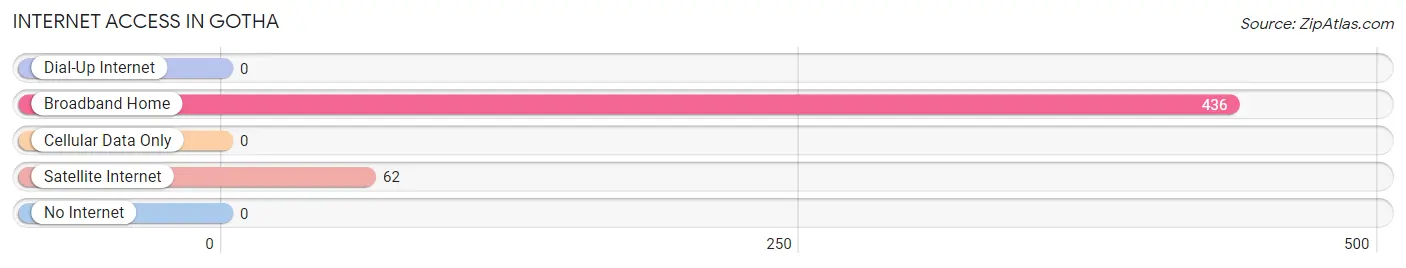
| Internet Type | # Households | % Households |
| Dial-Up Internet | 0 | 0.0% |
| Broadband Home | 436 | 100.0% |
| Cellular Data Only | 0 | 0.0% |
| Satellite Internet | 62 | 14.2% |
| No Internet | 0 | 0.0% |
| Total | 436 | 100.0% |
Gotha Summary
Gotha is an unincorporated community located in Orange County, Florida, United States. It is situated in the northwest corner of the county, approximately 15 miles west of downtown Orlando. The population of Gotha was 2,115 at the 2010 census.
History
Gotha was founded in 1885 by German immigrant Henry Hempel. He named the town after his hometown of Gotha, Germany. The town was originally a farming community, but it soon became a popular tourist destination due to its proximity to Orlando. In the early 1900s, the town was home to a number of resorts, including the Gotha Hotel, which was built in 1906.
Geography
Gotha is located at 28°30'N 81°30'W (28.50, -81.50). According to the United States Census Bureau, the town has a total area of 1.2 square miles (3.2 km2), all land.
Economy
Gotha is primarily a residential community, but it does have a few businesses. The town is home to a number of small retail stores, restaurants, and professional services. The town is also home to a number of small manufacturing companies.
Demographics
As of the 2010 census, there were 2,115 people, 817 households, and 590 families residing in the town. The population density was 1,746.7 people per square mile (675.3/km2). There were 881 housing units at an average density of 730.8 per square mile (282.3/km2). The racial makeup of the town was 87.2% White, 5.2% African American, 0.2% Native American, 2.2% Asian, 0.1% Pacific Islander, 3.2% from other races, and 2.1% from two or more races. Hispanic or Latino of any race were 8.7% of the population.
There were 817 households, out of which 28.2% had children under the age of 18 living with them, 54.2% were married couples living together, 11.2% had a female householder with no husband present, and 29.2% were non-families. 22.7% of all households were made up of individuals, and 8.2% had someone living alone who was 65 years of age or older. The average household size was 2.58 and the average family size was 3.03.
In the town, the population was spread out, with 23.2% under the age of 18, 6.7% from 18 to 24, 28.2% from 25 to 44, 28.2% from 45 to 64, and 13.7% who were 65 years of age or older. The median age was 40 years. For every 100 females, there were 97.2 males. For every 100 females age 18 and over, there were 94.2 males.
The median income for a household in the town was $50,000, and the median income for a family was $54,375. Males had a median income of $37,500 versus $30,000 for females. The per capita income for the town was $22,917. About 4.2% of families and 5.7% of the population were below the poverty line, including 6.3% of those under age 18 and 5.3% of those age 65 or over.
Common Questions
What is Per Capita Income in Gotha?
Per Capita income in Gotha is $72,747.
What is the Median Family Income in Gotha?
Median Family Income in Gotha is $176,058.
What is the Median Household income in Gotha?
Median Household Income in Gotha is $174,750.
What is Income or Wage Gap in Gotha?
Income or Wage Gap in Gotha is 42.7%.
Women in Gotha earn 57.3 cents for every dollar earned by a man.
What is Inequality or Gini Index in Gotha?
Inequality or Gini Index in Gotha is 0.50.
What is the Total Population of Gotha?
Total Population of Gotha is 1,640.
What is the Total Male Population of Gotha?
Total Male Population of Gotha is 790.
What is the Total Female Population of Gotha?
Total Female Population of Gotha is 850.
What is the Ratio of Males per 100 Females in Gotha?
There are 92.94 Males per 100 Females in Gotha.
What is the Ratio of Females per 100 Males in Gotha?
There are 107.59 Females per 100 Males in Gotha.
What is the Median Population Age in Gotha?
Median Population Age in Gotha is 28.9 Years.
What is the Average Family Size in Gotha
Average Family Size in Gotha is 3.9 People.
What is the Average Household Size in Gotha
Average Household Size in Gotha is 3.8 People.
How Large is the Labor Force in Gotha?
There are 716 People in the Labor Forcein in Gotha.
What is the Percentage of People in the Labor Force in Gotha?
67.8% of People are in the Labor Force in Gotha.
What is the Unemployment Rate in Gotha?
Unemployment Rate in Gotha is 2.1%.