Anderson Island, WA Map & Demographics
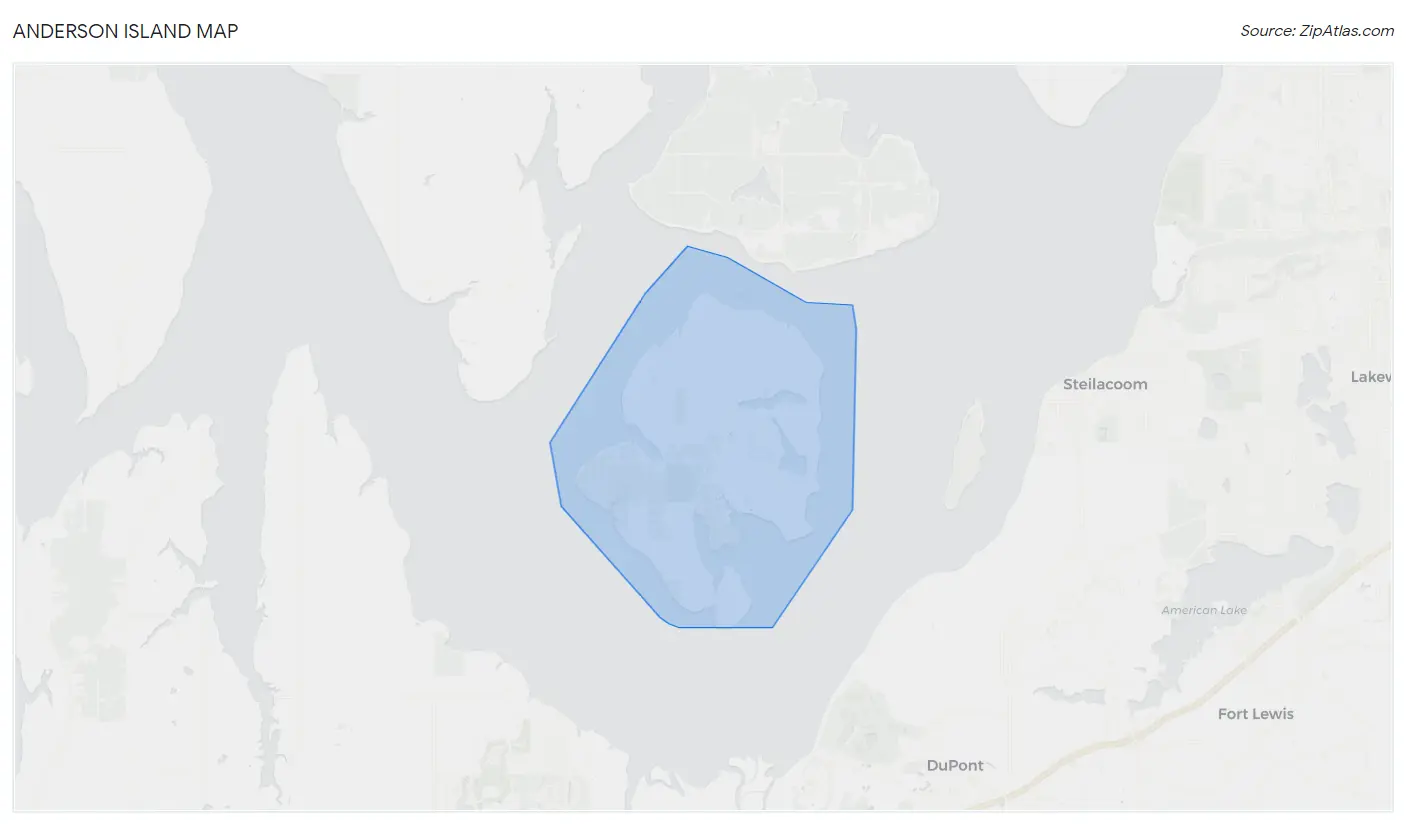
Anderson Island Map
Anderson Island Overview
$73,851
PER CAPITA INCOME
$94,920
AVG FAMILY INCOME
$92,933
AVG HOUSEHOLD INCOME
0.63
INEQUALITY / GINI INDEX
1,621
TOTAL POPULATION
887
MALE POPULATION
734
FEMALE POPULATION
120.84
MALES / 100 FEMALES
82.75
FEMALES / 100 MALES
60.2
MEDIAN AGE
2.4
AVG FAMILY SIZE
2.0
AVG HOUSEHOLD SIZE
576
LABOR FORCE [ PEOPLE ]
38.0%
PERCENT IN LABOR FORCE
Anderson Island Zip Codes
Income in Anderson Island
Income Overview in Anderson Island
Per Capita Income in Anderson Island is $73,851, while median incomes of families and households are $94,920 and $92,933 respectively.
| Characteristic | Number | Measure |
| Per Capita Income | 1,621 | $73,851 |
| Median Family Income | 575 | $94,920 |
| Mean Family Income | 575 | $179,577 |
| Median Household Income | 825 | $92,933 |
| Mean Household Income | 825 | $144,698 |
| Income Deficit | 575 | $0 |
| Wage / Income Gap (%) | 1,621 | 0.00% |
| Wage / Income Gap ($) | 1,621 | 100.00¢ per $1 |
| Gini / Inequality Index | 1,621 | 0.63 |
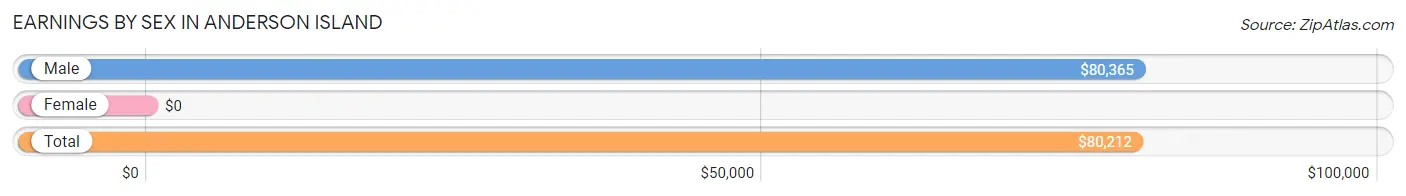
Earnings by Sex in Anderson Island
| Sex | Number | Average Earnings |
| Male | 569 (80.0%) | $80,365 |
| Female | 142 (20.0%) | $0 |
| Total | 711 (100.0%) | $80,212 |
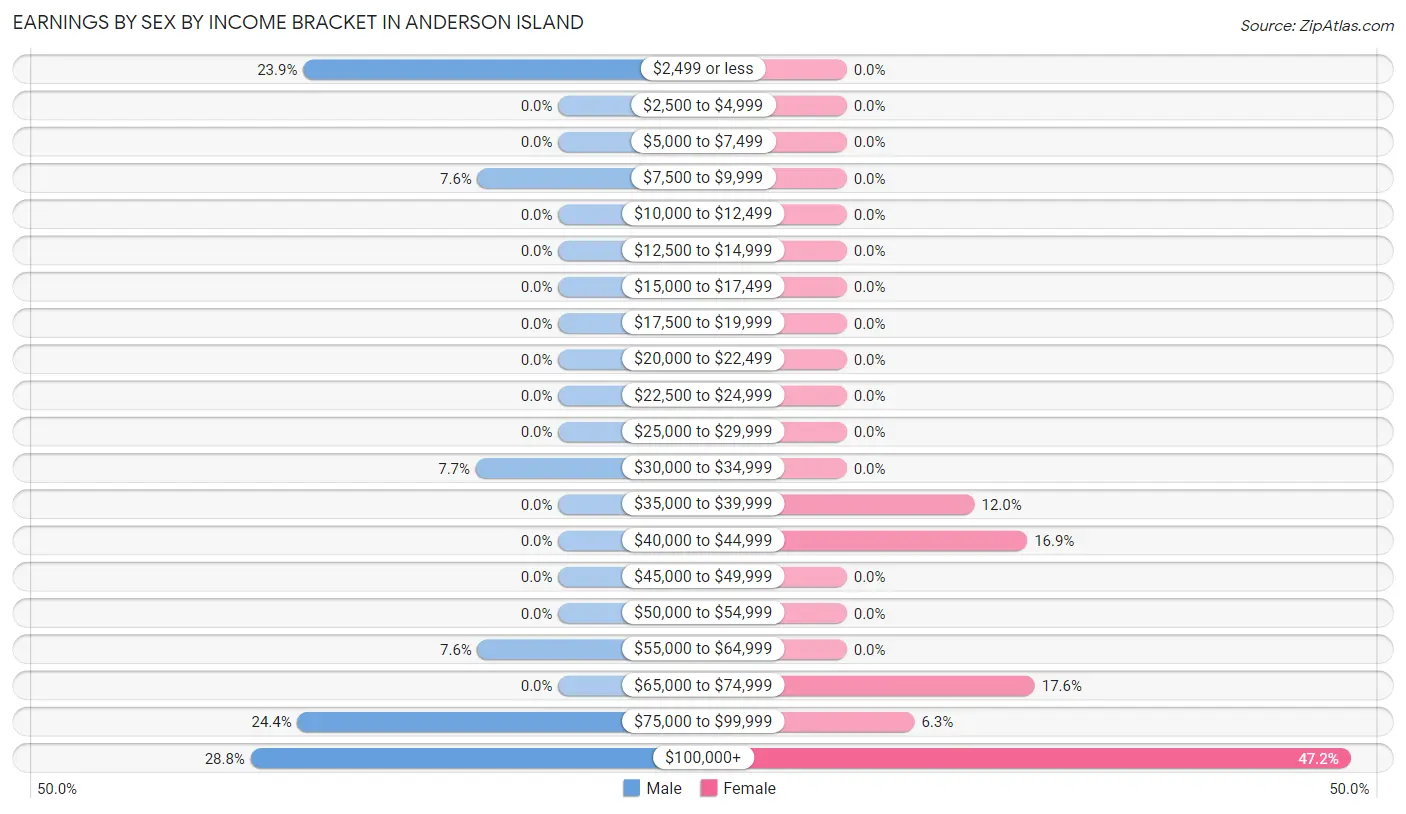
Earnings by Sex by Income Bracket in Anderson Island
The most common earnings brackets in Anderson Island are $100,000+ for men (164 | 28.8%) and $100,000+ for women (67 | 47.2%).
| Income | Male | Female |
| $2,499 or less | 136 (23.9%) | 0 (0.0%) |
| $2,500 to $4,999 | 0 (0.0%) | 0 (0.0%) |
| $5,000 to $7,499 | 0 (0.0%) | 0 (0.0%) |
| $7,500 to $9,999 | 43 (7.6%) | 0 (0.0%) |
| $10,000 to $12,499 | 0 (0.0%) | 0 (0.0%) |
| $12,500 to $14,999 | 0 (0.0%) | 0 (0.0%) |
| $15,000 to $17,499 | 0 (0.0%) | 0 (0.0%) |
| $17,500 to $19,999 | 0 (0.0%) | 0 (0.0%) |
| $20,000 to $22,499 | 0 (0.0%) | 0 (0.0%) |
| $22,500 to $24,999 | 0 (0.0%) | 0 (0.0%) |
| $25,000 to $29,999 | 0 (0.0%) | 0 (0.0%) |
| $30,000 to $34,999 | 44 (7.7%) | 0 (0.0%) |
| $35,000 to $39,999 | 0 (0.0%) | 17 (12.0%) |
| $40,000 to $44,999 | 0 (0.0%) | 24 (16.9%) |
| $45,000 to $49,999 | 0 (0.0%) | 0 (0.0%) |
| $50,000 to $54,999 | 0 (0.0%) | 0 (0.0%) |
| $55,000 to $64,999 | 43 (7.6%) | 0 (0.0%) |
| $65,000 to $74,999 | 0 (0.0%) | 25 (17.6%) |
| $75,000 to $99,999 | 139 (24.4%) | 9 (6.3%) |
| $100,000+ | 164 (28.8%) | 67 (47.2%) |
| Total | 569 (100.0%) | 142 (100.0%) |
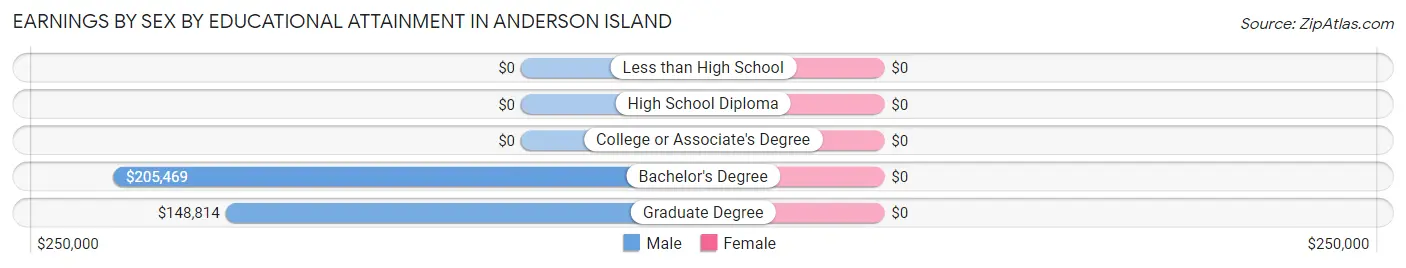
Earnings by Sex by Educational Attainment in Anderson Island
| Educational Attainment | Male Income | Female Income |
| Less than High School | - | - |
| High School Diploma | - | - |
| College or Associate's Degree | - | - |
| Bachelor's Degree | $205,469 | $0 |
| Graduate Degree | $148,814 | $0 |
| Total | $80,365 | $0 |
Family Income in Anderson Island
Family Income Brackets in Anderson Island
According to the Anderson Island family income data, there are 136 families falling into the $100,000 to $149,999 income range, which is the most common income bracket and makes up 23.6% of all families.
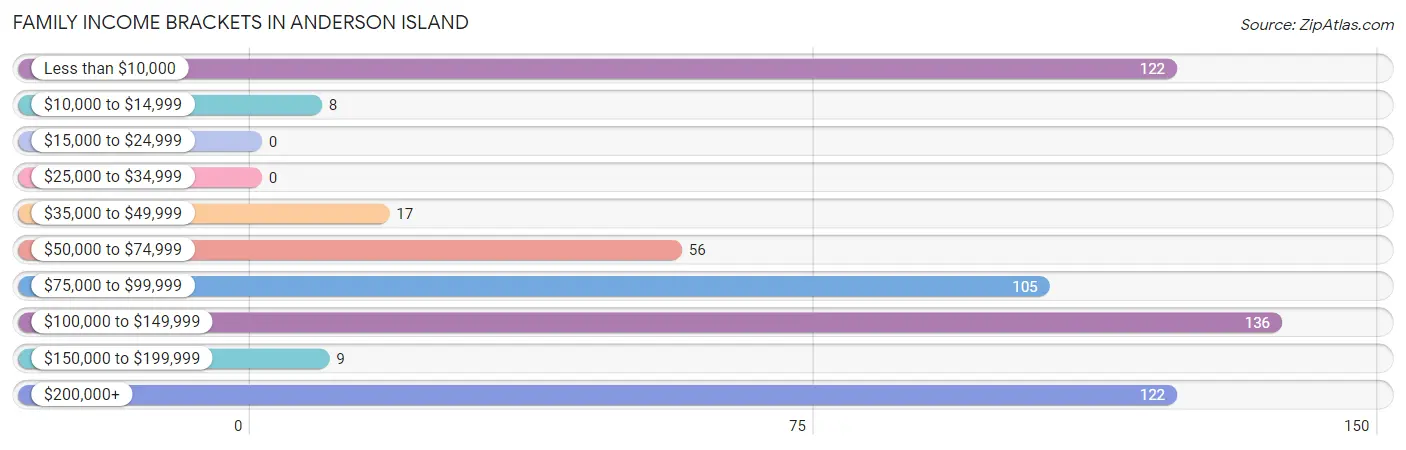
| Income Bracket | # Families | % Families |
| Less than $10,000 | 122 | 21.2% |
| $10,000 to $14,999 | 8 | 1.4% |
| $15,000 to $24,999 | 0 | 0.0% |
| $25,000 to $34,999 | 0 | 0.0% |
| $35,000 to $49,999 | 17 | 3.0% |
| $50,000 to $74,999 | 56 | 9.7% |
| $75,000 to $99,999 | 105 | 18.3% |
| $100,000 to $149,999 | 136 | 23.7% |
| $150,000 to $199,999 | 9 | 1.6% |
| $200,000+ | 122 | 21.2% |
Family Income by Famaliy Size in Anderson Island
2-person families (488 | 84.9%) account for the highest median family income in Anderson Island with $94,455 per family, while 2-person families (488 | 84.9%) have the highest median income of $47,228 per family member.
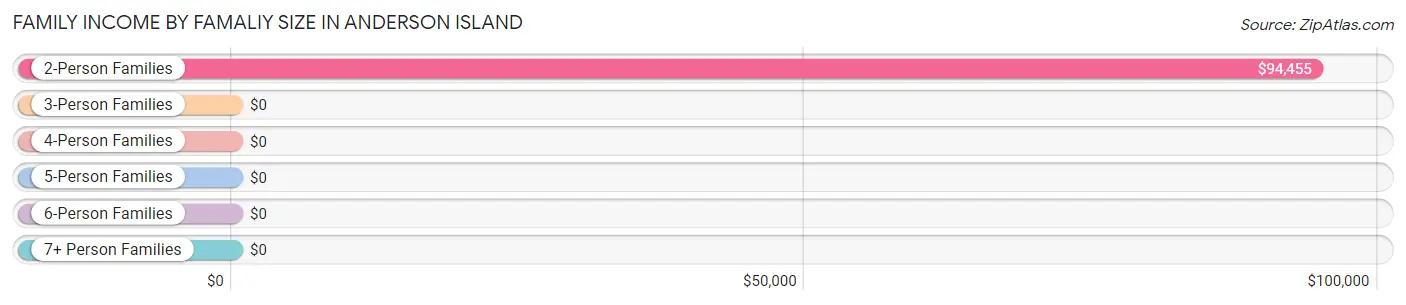
| Income Bracket | # Families | Median Income |
| 2-Person Families | 488 (84.9%) | $94,455 |
| 3-Person Families | 58 (10.1%) | $0 |
| 4-Person Families | 0 (0.0%) | $0 |
| 5-Person Families | 0 (0.0%) | $0 |
| 6-Person Families | 29 (5.0%) | $0 |
| 7+ Person Families | 0 (0.0%) | $0 |
| Total | 575 (100.0%) | $94,920 |
Family Income by Number of Earners in Anderson Island
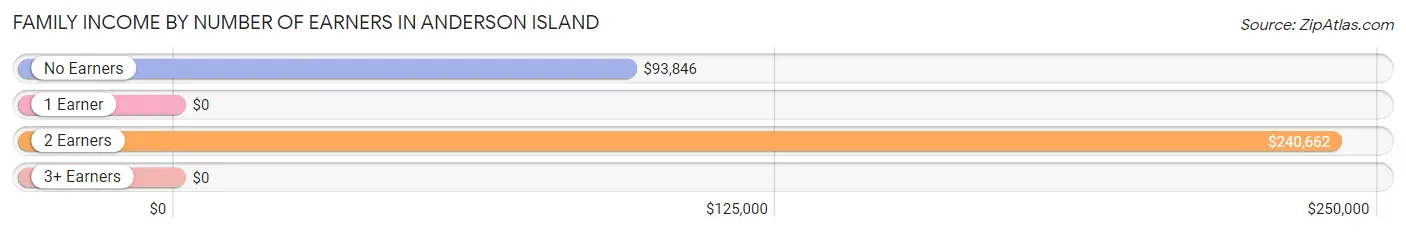
| Number of Earners | # Families | Median Income |
| No Earners | 102 (17.7%) | $93,846 |
| 1 Earner | 346 (60.2%) | $0 |
| 2 Earners | 127 (22.1%) | $240,662 |
| 3+ Earners | 0 (0.0%) | $0 |
| Total | 575 (100.0%) | $94,920 |
Household Income in Anderson Island
Household Income Brackets in Anderson Island
With 160 households falling in the category, the $100,000 to $149,999 income range is the most frequent in Anderson Island, accounting for 19.4% of all households. In contrast, only 8 households (1.0%) fall into the $10,000 to $14,999 income bracket, making it the least populous group.
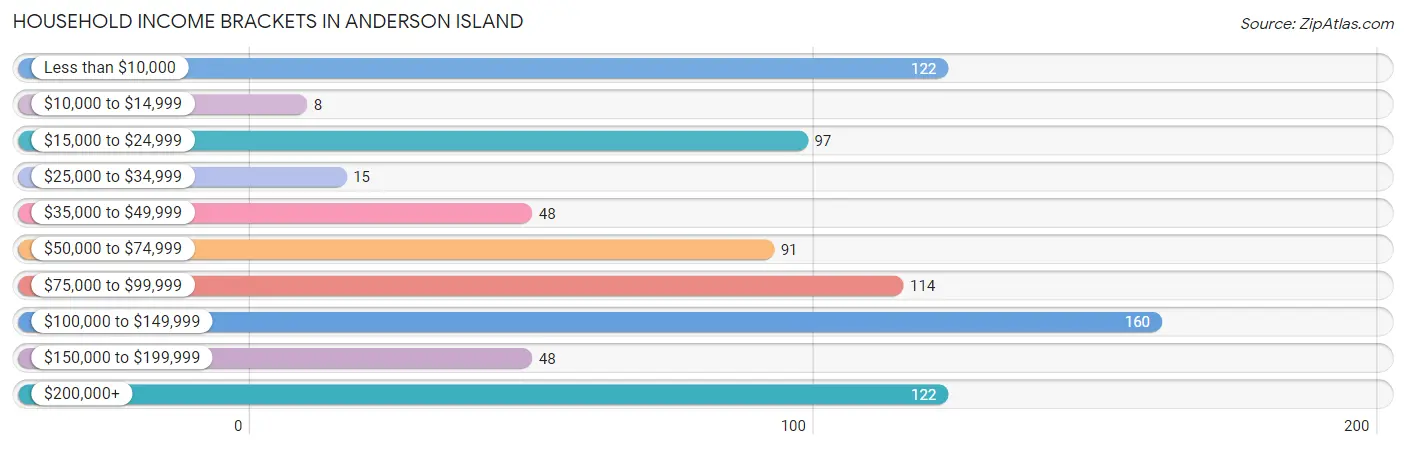
| Income Bracket | # Households | % Households |
| Less than $10,000 | 122 | 14.8% |
| $10,000 to $14,999 | 8 | 1.0% |
| $15,000 to $24,999 | 97 | 11.8% |
| $25,000 to $34,999 | 15 | 1.8% |
| $35,000 to $49,999 | 48 | 5.8% |
| $50,000 to $74,999 | 91 | 11.0% |
| $75,000 to $99,999 | 114 | 13.8% |
| $100,000 to $149,999 | 160 | 19.4% |
| $150,000 to $199,999 | 48 | 5.8% |
| $200,000+ | 122 | 14.8% |
Household Income by Householder Age in Anderson Island
The median household income in Anderson Island is $92,933, with the highest median household income of $94,327 found in the 45 to 64 years age bracket for the primary householder. A total of 459 households (55.6%) fall into this category.
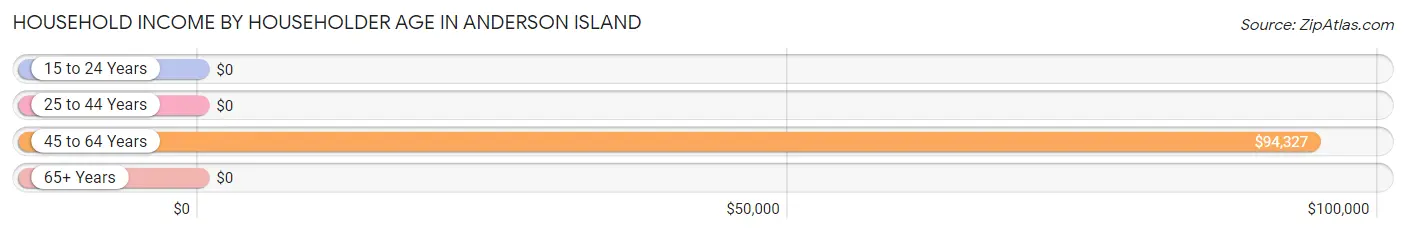
| Income Bracket | # Households | Median Income |
| 15 to 24 Years | 0 (0.0%) | $0 |
| 25 to 44 Years | 38 (4.6%) | $0 |
| 45 to 64 Years | 459 (55.6%) | $94,327 |
| 65+ Years | 328 (39.8%) | $0 |
| Total | 825 (100.0%) | $92,933 |
Poverty in Anderson Island
Income Below Poverty by Sex and Age in Anderson Island
With 14.7% poverty level for males and 24.0% for females among the residents of Anderson Island, 55 to 64 year old males and 45 to 54 year old females are the most vulnerable to poverty, with 122 males (30.6%) and 168 females (57.0%) in their respective age groups living below the poverty level.
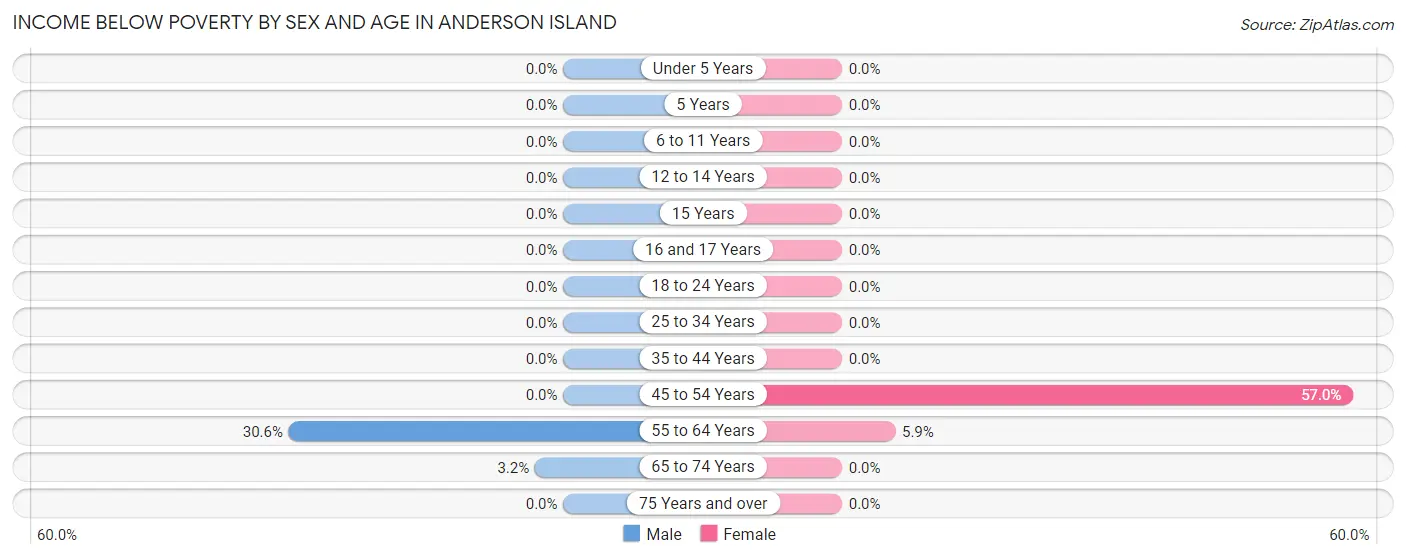
| Age Bracket | Male | Female |
| Under 5 Years | 0 (0.0%) | 0 (0.0%) |
| 5 Years | 0 (0.0%) | 0 (0.0%) |
| 6 to 11 Years | 0 (0.0%) | 0 (0.0%) |
| 12 to 14 Years | 0 (0.0%) | 0 (0.0%) |
| 15 Years | 0 (0.0%) | 0 (0.0%) |
| 16 and 17 Years | 0 (0.0%) | 0 (0.0%) |
| 18 to 24 Years | 0 (0.0%) | 0 (0.0%) |
| 25 to 34 Years | 0 (0.0%) | 0 (0.0%) |
| 35 to 44 Years | 0 (0.0%) | 0 (0.0%) |
| 45 to 54 Years | 0 (0.0%) | 168 (57.0%) |
| 55 to 64 Years | 122 (30.6%) | 8 (5.9%) |
| 65 to 74 Years | 8 (3.2%) | 0 (0.0%) |
| 75 Years and over | 0 (0.0%) | 0 (0.0%) |
| Total | 130 (14.7%) | 176 (24.0%) |
Income Above Poverty by Sex and Age in Anderson Island
According to the poverty statistics in Anderson Island, males aged 6 to 11 years and females aged 5 years are the age groups that are most secure financially, with 100.0% of males and 100.0% of females in these age groups living above the poverty line.
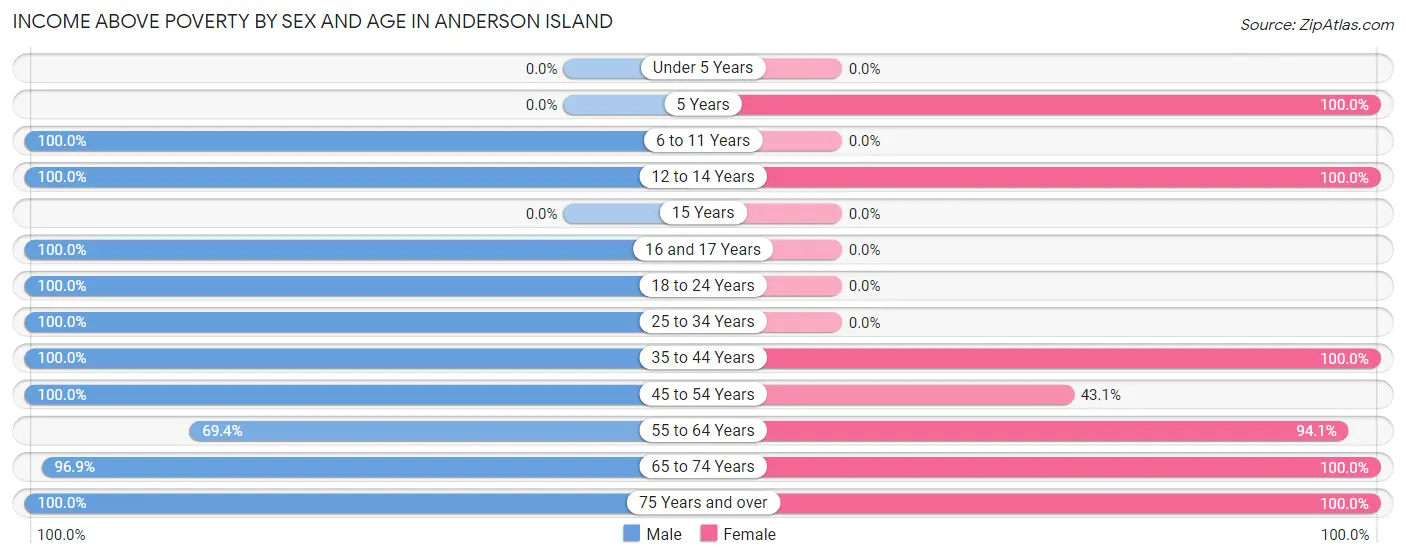
| Age Bracket | Male | Female |
| Under 5 Years | 0 (0.0%) | 0 (0.0%) |
| 5 Years | 0 (0.0%) | 30 (100.0%) |
| 6 to 11 Years | 30 (100.0%) | 0 (0.0%) |
| 12 to 14 Years | 30 (100.0%) | 16 (100.0%) |
| 15 Years | 0 (0.0%) | 0 (0.0%) |
| 16 and 17 Years | 29 (100.0%) | 0 (0.0%) |
| 18 to 24 Years | 25 (100.0%) | 0 (0.0%) |
| 25 to 34 Years | 27 (100.0%) | 0 (0.0%) |
| 35 to 44 Years | 38 (100.0%) | 29 (100.0%) |
| 45 to 54 Years | 32 (100.0%) | 127 (43.0%) |
| 55 to 64 Years | 277 (69.4%) | 127 (94.1%) |
| 65 to 74 Years | 246 (96.9%) | 171 (100.0%) |
| 75 Years and over | 23 (100.0%) | 58 (100.0%) |
| Total | 757 (85.3%) | 558 (76.0%) |
Income Below Poverty Among Married-Couple Families in Anderson Island
The poverty statistics for married-couple families in Anderson Island show that 23.0% or 130 of the total 566 families live below the poverty line. Families with no children have the highest poverty rate of 25.0%, comprising of 130 families. On the other hand, families with 1 or 2 children have the lowest poverty rate of 0.0%, which includes 0 families.
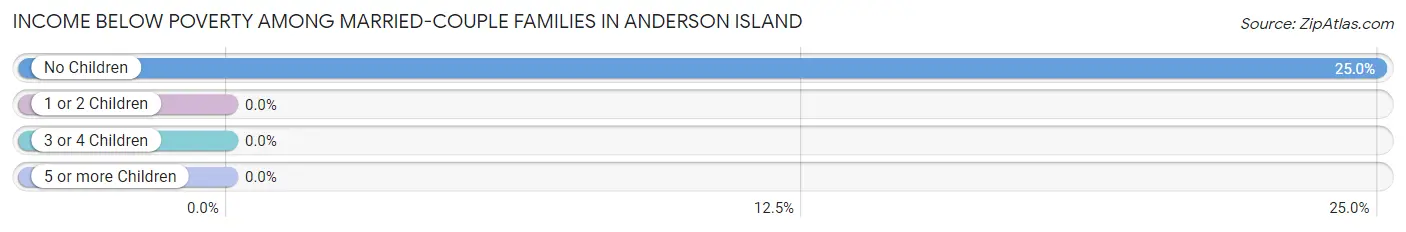
| Children | Above Poverty | Below Poverty |
| No Children | 390 (75.0%) | 130 (25.0%) |
| 1 or 2 Children | 17 (100.0%) | 0 (0.0%) |
| 3 or 4 Children | 29 (100.0%) | 0 (0.0%) |
| 5 or more Children | 0 (0.0%) | 0 (0.0%) |
| Total | 436 (77.0%) | 130 (23.0%) |
Income Below Poverty Among Single-Parent Households in Anderson Island
| Children | Single Father | Single Mother |
| No Children | 0 (0.0%) | 0 (0.0%) |
| 1 or 2 Children | 0 (0.0%) | 0 (0.0%) |
| 3 or 4 Children | 0 (0.0%) | 0 (0.0%) |
| 5 or more Children | 0 (0.0%) | 0 (0.0%) |
| Total | 0 (0.0%) | 0 (0.0%) |
Income Below Poverty Among Married-Couple vs Single-Parent Households in Anderson Island
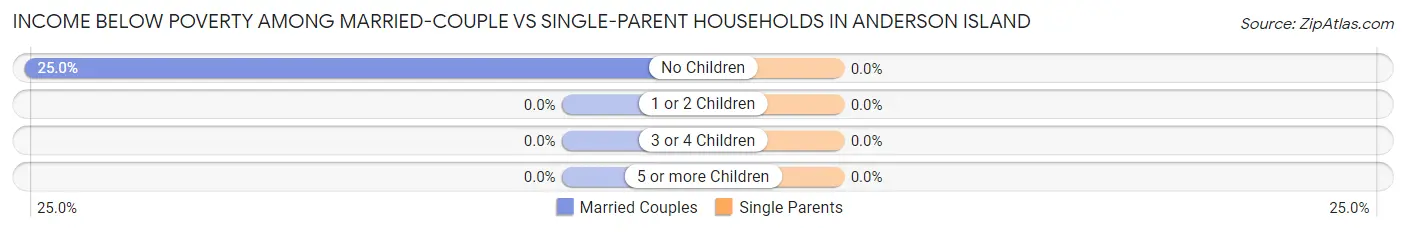
| Children | Married-Couple Families | Single-Parent Households |
| No Children | 130 (25.0%) | 0 (0.0%) |
| 1 or 2 Children | 0 (0.0%) | 0 (0.0%) |
| 3 or 4 Children | 0 (0.0%) | 0 (0.0%) |
| 5 or more Children | 0 (0.0%) | 0 (0.0%) |
| Total | 130 (23.0%) | 0 (0.0%) |
Race in Anderson Island
The most populous races in Anderson Island are White / Caucasian (1,375 | 84.8%), Two or more Races (167 | 10.3%), and Hispanic or Latino (60 | 3.7%).
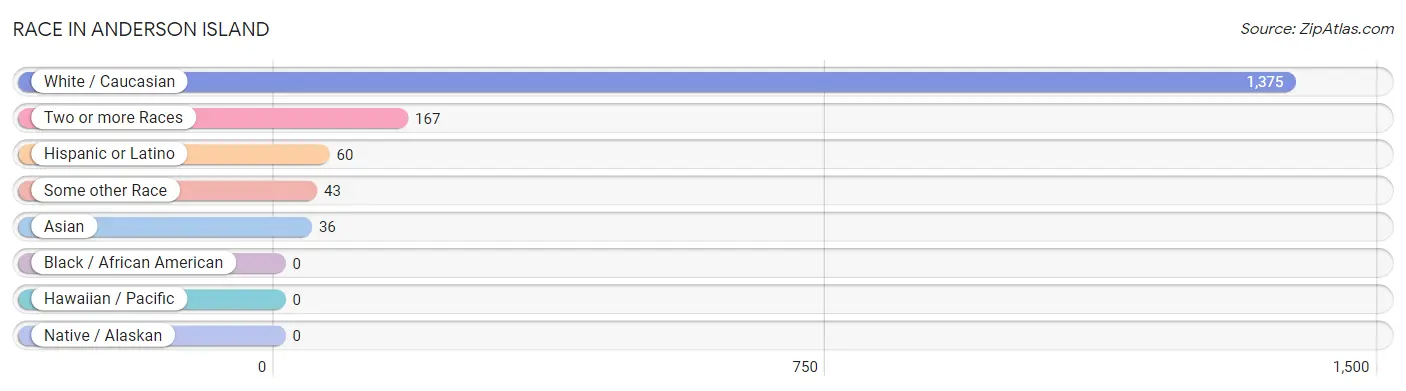
| Race | # Population | % Population |
| Asian | 36 | 2.2% |
| Black / African American | 0 | 0.0% |
| Hawaiian / Pacific | 0 | 0.0% |
| Hispanic or Latino | 60 | 3.7% |
| Native / Alaskan | 0 | 0.0% |
| White / Caucasian | 1,375 | 84.8% |
| Two or more Races | 167 | 10.3% |
| Some other Race | 43 | 2.6% |
| Total | 1,621 | 100.0% |
Ancestry in Anderson Island
The most populous ancestries reported in Anderson Island are German (344 | 21.2%), Irish (224 | 13.8%), French (193 | 11.9%), Bhutanese (138 | 8.5%), and Norwegian (96 | 5.9%), together accounting for 61.4% of all Anderson Island residents.
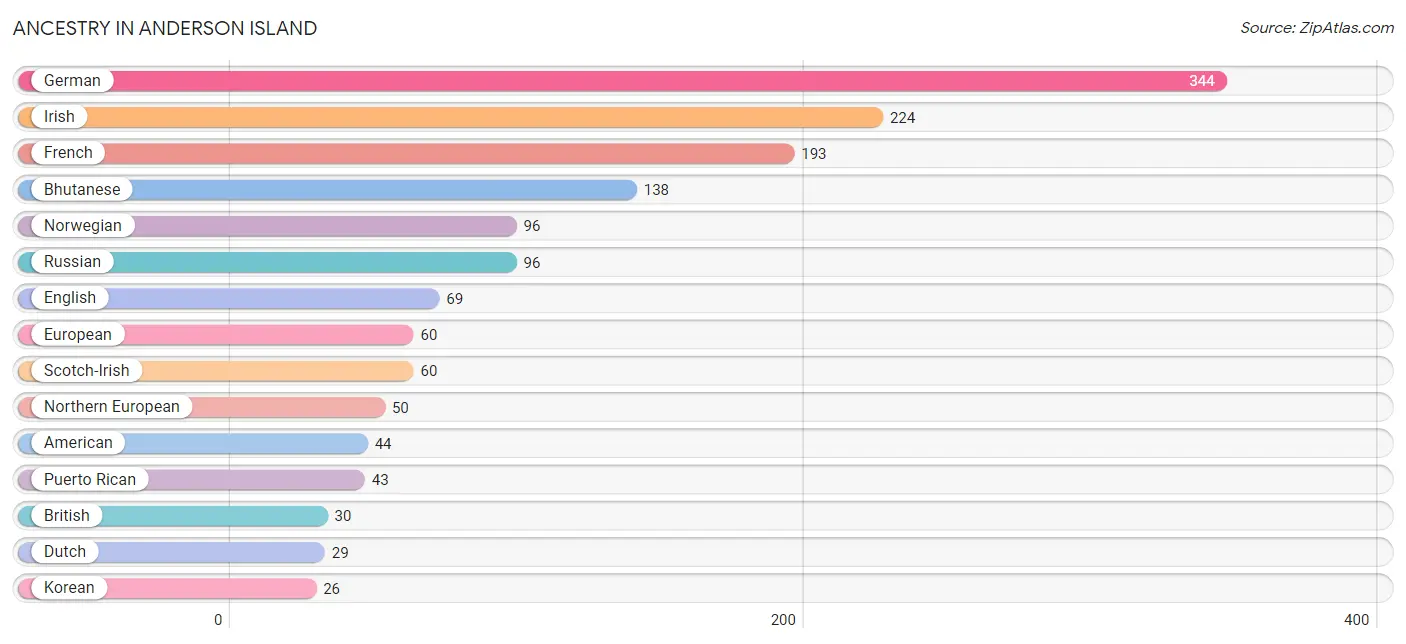
| Ancestry | # Population | % Population |
| African | 17 | 1.1% |
| American | 44 | 2.7% |
| Belgian | 23 | 1.4% |
| Bhutanese | 138 | 8.5% |
| British | 30 | 1.8% |
| Canadian | 14 | 0.9% |
| Cherokee | 17 | 1.1% |
| Croatian | 15 | 0.9% |
| Danish | 25 | 1.5% |
| Dutch | 29 | 1.8% |
| English | 69 | 4.3% |
| European | 60 | 3.7% |
| French | 193 | 11.9% |
| German | 344 | 21.2% |
| Irish | 224 | 13.8% |
| Italian | 16 | 1.0% |
| Korean | 26 | 1.6% |
| Native Hawaiian | 16 | 1.0% |
| Northern European | 50 | 3.1% |
| Norwegian | 96 | 5.9% |
| Peruvian | 17 | 1.1% |
| Puerto Rican | 43 | 2.6% |
| Russian | 96 | 5.9% |
| Scotch-Irish | 60 | 3.7% |
| Scottish | 11 | 0.7% |
| South American | 17 | 1.1% |
| Subsaharan African | 17 | 1.1% |
| Swedish | 8 | 0.5% |
| Thai | 22 | 1.4% |
| Welsh | 13 | 0.8% | View All 30 Rows |
Immigrants in Anderson Island
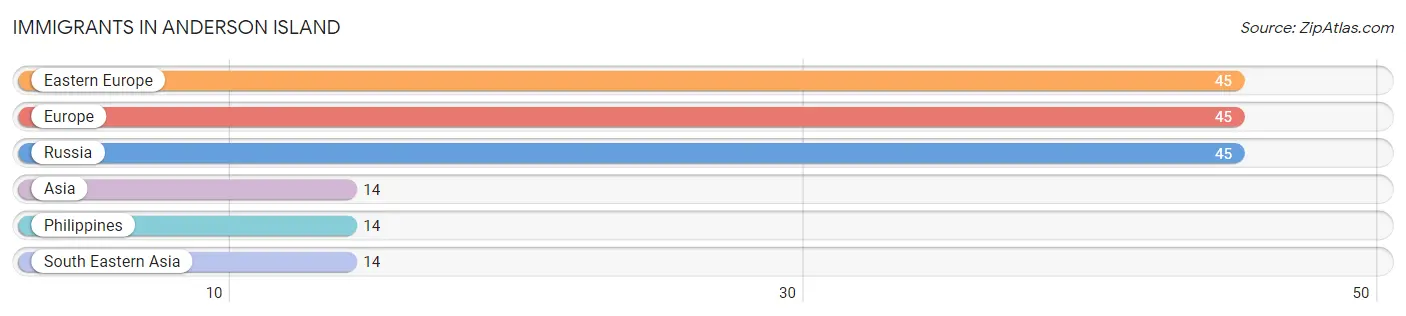
The most numerous immigrant groups reported in Anderson Island came from Eastern Europe (45 | 2.8%), Europe (45 | 2.8%), Russia (45 | 2.8%), Asia (14 | 0.9%), and Philippines (14 | 0.9%), together accounting for 10.1% of all Anderson Island residents.
| Immigration Origin | # Population | % Population |
| Asia | 14 | 0.9% |
| Eastern Europe | 45 | 2.8% |
| Europe | 45 | 2.8% |
| Philippines | 14 | 0.9% |
| Russia | 45 | 2.8% |
| South Eastern Asia | 14 | 0.9% | View All 6 Rows |
Sex and Age in Anderson Island
Sex and Age in Anderson Island
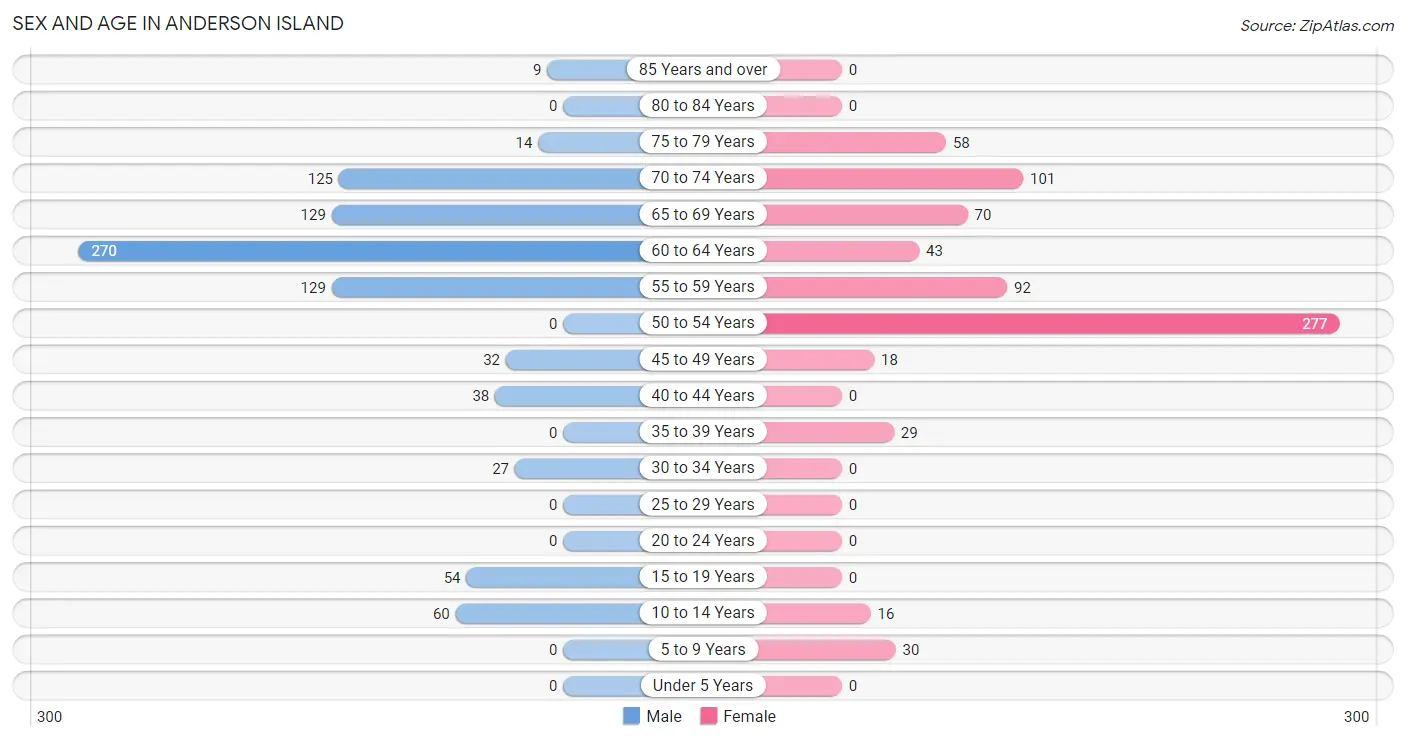
The most populous age groups in Anderson Island are 60 to 64 Years (270 | 30.4%) for men and 50 to 54 Years (277 | 37.7%) for women.
| Age Bracket | Male | Female |
| Under 5 Years | 0 (0.0%) | 0 (0.0%) |
| 5 to 9 Years | 0 (0.0%) | 30 (4.1%) |
| 10 to 14 Years | 60 (6.8%) | 16 (2.2%) |
| 15 to 19 Years | 54 (6.1%) | 0 (0.0%) |
| 20 to 24 Years | 0 (0.0%) | 0 (0.0%) |
| 25 to 29 Years | 0 (0.0%) | 0 (0.0%) |
| 30 to 34 Years | 27 (3.0%) | 0 (0.0%) |
| 35 to 39 Years | 0 (0.0%) | 29 (4.0%) |
| 40 to 44 Years | 38 (4.3%) | 0 (0.0%) |
| 45 to 49 Years | 32 (3.6%) | 18 (2.5%) |
| 50 to 54 Years | 0 (0.0%) | 277 (37.7%) |
| 55 to 59 Years | 129 (14.5%) | 92 (12.5%) |
| 60 to 64 Years | 270 (30.4%) | 43 (5.9%) |
| 65 to 69 Years | 129 (14.5%) | 70 (9.5%) |
| 70 to 74 Years | 125 (14.1%) | 101 (13.8%) |
| 75 to 79 Years | 14 (1.6%) | 58 (7.9%) |
| 80 to 84 Years | 0 (0.0%) | 0 (0.0%) |
| 85 Years and over | 9 (1.0%) | 0 (0.0%) |
| Total | 887 (100.0%) | 734 (100.0%) |
Families and Households in Anderson Island
Median Family Size in Anderson Island
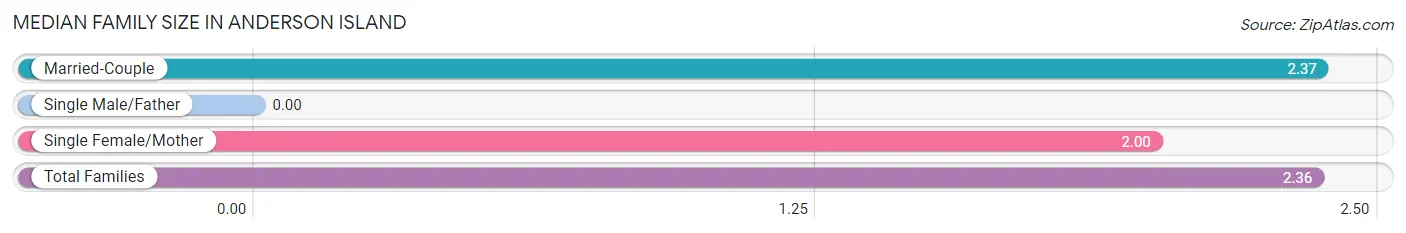
| Family Type | # Families | Family Size |
| Married-Couple | 566 (98.4%) | 2.37 |
| Single Male/Father | 0 (0.0%) | - |
| Single Female/Mother | 9 (1.6%) | 2.00 |
| Total Families | 575 (100.0%) | 2.36 |
Median Household Size in Anderson Island
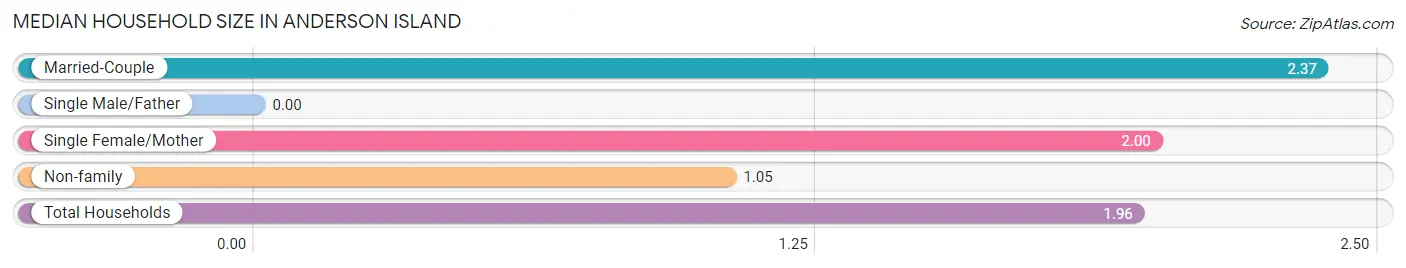
| Household Type | # Households | Household Size |
| Married-Couple | 566 (68.6%) | 2.37 |
| Single Male/Father | 0 (0.0%) | - |
| Single Female/Mother | 9 (1.1%) | 2.00 |
| Non-family | 250 (30.3%) | 1.05 |
| Total Households | 825 (100.0%) | 1.96 |
Household Size by Marriage Status in Anderson Island
Out of a total of 825 households in Anderson Island, 575 (69.7%) are family households, while 250 (30.3%) are nonfamily households. The most numerous type of family households are 2-person households, comprising 488, and the most common type of nonfamily households are 1-person households, comprising 237.
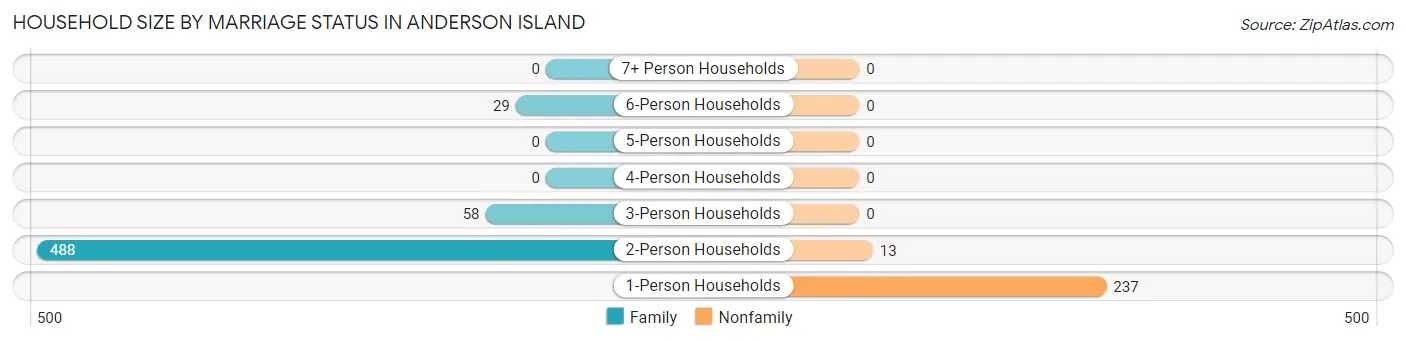
| Household Size | Family Households | Nonfamily Households |
| 1-Person Households | - | 237 (28.7%) |
| 2-Person Households | 488 (59.2%) | 13 (1.6%) |
| 3-Person Households | 58 (7.0%) | 0 (0.0%) |
| 4-Person Households | 0 (0.0%) | 0 (0.0%) |
| 5-Person Households | 0 (0.0%) | 0 (0.0%) |
| 6-Person Households | 29 (3.5%) | 0 (0.0%) |
| 7+ Person Households | 0 (0.0%) | 0 (0.0%) |
| Total | 575 (69.7%) | 250 (30.3%) |
Female Fertility in Anderson Island
Fertility by Age in Anderson Island
| Age Bracket | Women with Births | Births / 1,000 Women |
| 15 to 19 years | 0 (0.0%) | 0.0 |
| 20 to 34 years | 0 (0.0%) | 0.0 |
| 35 to 50 years | 0 (0.0%) | 0.0 |
| Total | 0 (0.0%) | 0.0 |
Fertility by Age by Marriage Status in Anderson Island
| Age Bracket | Married | Unmarried |
| 15 to 19 years | 0 (0.0%) | 0 (0.0%) |
| 20 to 34 years | 0 (0.0%) | 0 (0.0%) |
| 35 to 50 years | 0 (0.0%) | 0 (0.0%) |
| Total | 0 (0.0%) | 0 (0.0%) |
Fertility by Education in Anderson Island
| Educational Attainment | Women with Births | Births / 1,000 Women |
| Less than High School | 0 (0.0%) | 0.0 |
| High School Diploma | 0 (0.0%) | 0.0 |
| College or Associate's Degree | 0 (0.0%) | 0.0 |
| Bachelor's Degree | 0 (0.0%) | 0.0 |
| Graduate Degree | 0 (0.0%) | 0.0 |
| Total | 0 (0.0%) | 0.0 |
Fertility by Education by Marriage Status in Anderson Island
| Educational Attainment | Married | Unmarried |
| Less than High School | 0 (0.0%) | 0 (0.0%) |
| High School Diploma | 0 (0.0%) | 0 (0.0%) |
| College or Associate's Degree | 0 (0.0%) | 0 (0.0%) |
| Bachelor's Degree | 0 (0.0%) | 0 (0.0%) |
| Graduate Degree | 0 (0.0%) | 0 (0.0%) |
| Total | 0 (0.0%) | 0 (0.0%) |
Employment Characteristics in Anderson Island
Employment by Class of Employer in Anderson Island
Among the 575 employed individuals in Anderson Island, private company employees (294 | 51.1%), not-for-profit organizations (105 | 18.3%), and self-employed (not incorporated) (68 | 11.8%) make up the most common classes of employment.
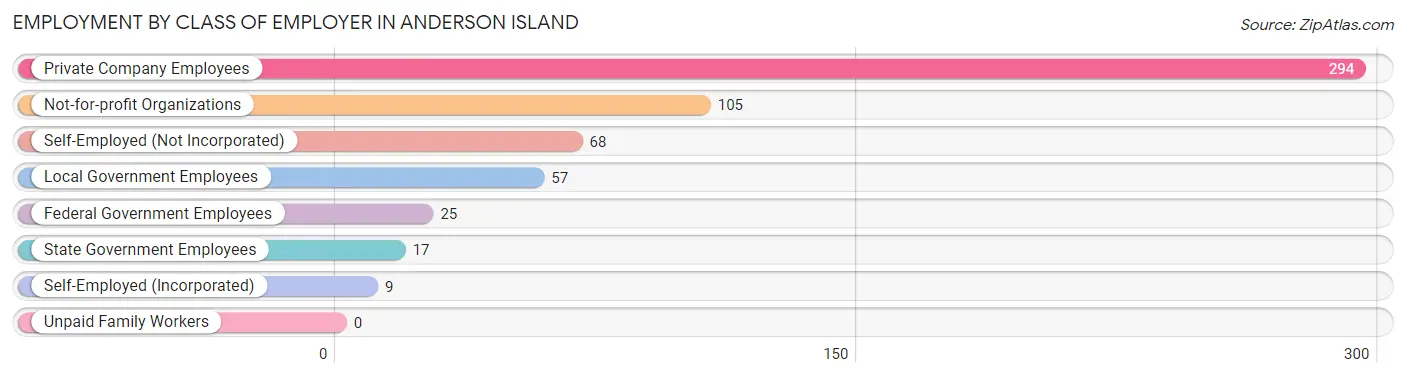
| Employer Class | # Employees | % Employees |
| Private Company Employees | 294 | 51.1% |
| Self-Employed (Incorporated) | 9 | 1.6% |
| Self-Employed (Not Incorporated) | 68 | 11.8% |
| Not-for-profit Organizations | 105 | 18.3% |
| Local Government Employees | 57 | 9.9% |
| State Government Employees | 17 | 3.0% |
| Federal Government Employees | 25 | 4.3% |
| Unpaid Family Workers | 0 | 0.0% |
| Total | 575 | 100.0% |
Employment Status by Age in Anderson Island
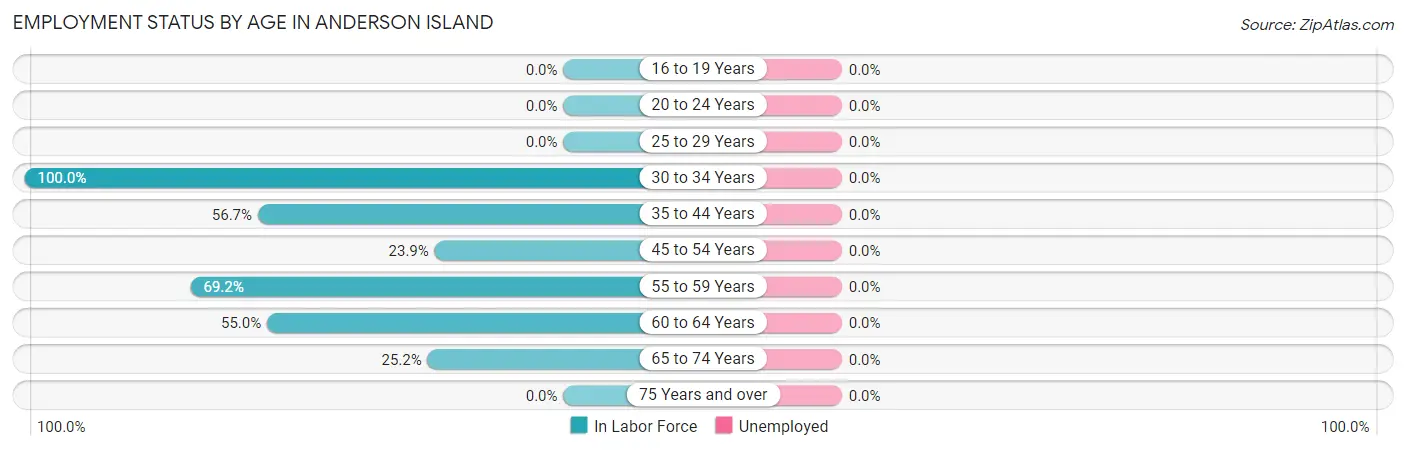
| Age Bracket | In Labor Force | Unemployed |
| 16 to 19 Years | 0 (0.0%) | 0 (0.0%) |
| 20 to 24 Years | 0 (0.0%) | 0 (0.0%) |
| 25 to 29 Years | 0 (0.0%) | 0 (0.0%) |
| 30 to 34 Years | 27 (100.0%) | 0 (0.0%) |
| 35 to 44 Years | 38 (56.7%) | 0 (0.0%) |
| 45 to 54 Years | 78 (23.9%) | 0 (0.0%) |
| 55 to 59 Years | 153 (69.2%) | 0 (0.0%) |
| 60 to 64 Years | 172 (55.0%) | 0 (0.0%) |
| 65 to 74 Years | 107 (25.2%) | 0 (0.0%) |
| 75 Years and over | 0 (0.0%) | 0 (0.0%) |
| Total | 576 (38.0%) | 0 (0.0%) |
Employment Status by Educational Attainment in Anderson Island
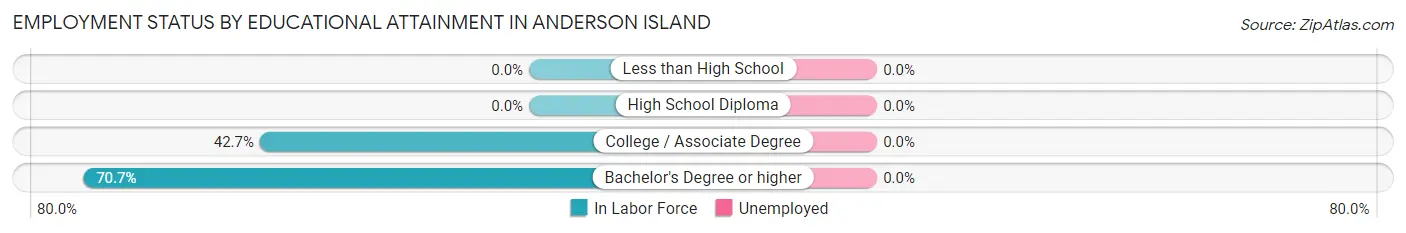
| Educational Attainment | In Labor Force | Unemployed |
| Less than High School | 0 (0.0%) | 0 (0.0%) |
| High School Diploma | 0 (0.0%) | 0 (0.0%) |
| College / Associate Degree | 270 (42.7%) | 0 (0.0%) |
| Bachelor's Degree or higher | 198 (70.7%) | 0 (0.0%) |
| Total | 468 (49.0%) | 0 (0.0%) |
Employment Occupations by Sex in Anderson Island
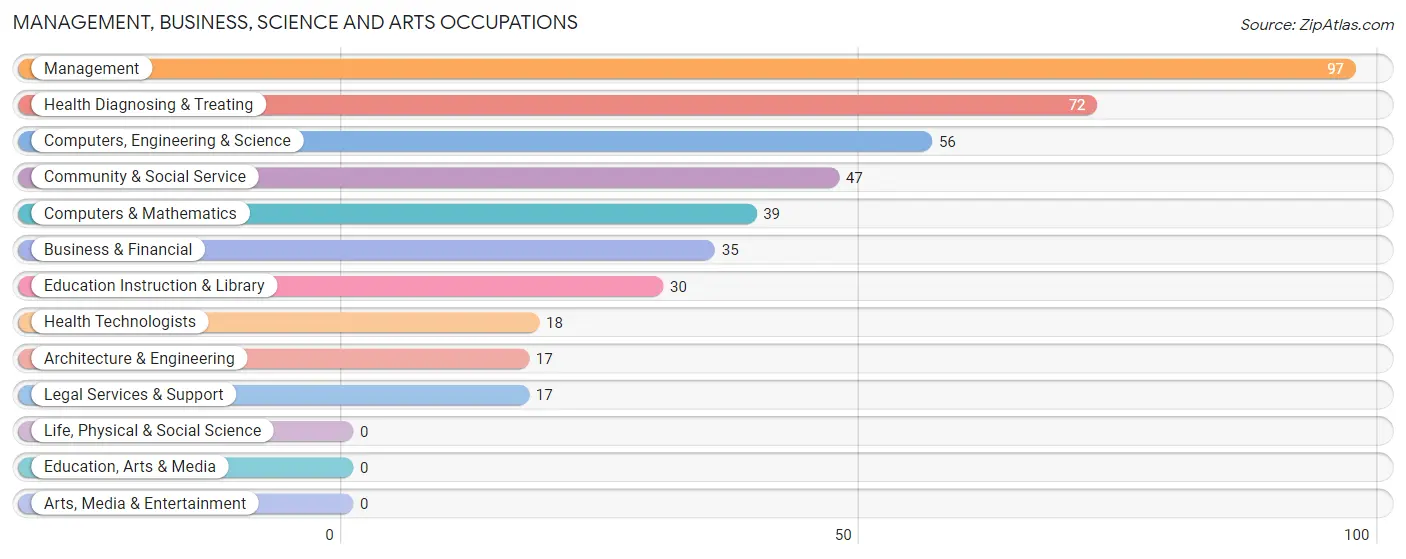
Management, Business, Science and Arts Occupations
The most common Management, Business, Science and Arts occupations in Anderson Island are Management (97 | 16.9%), Health Diagnosing & Treating (72 | 12.5%), Computers, Engineering & Science (56 | 9.7%), Community & Social Service (47 | 8.2%), and Computers & Mathematics (39 | 6.8%).
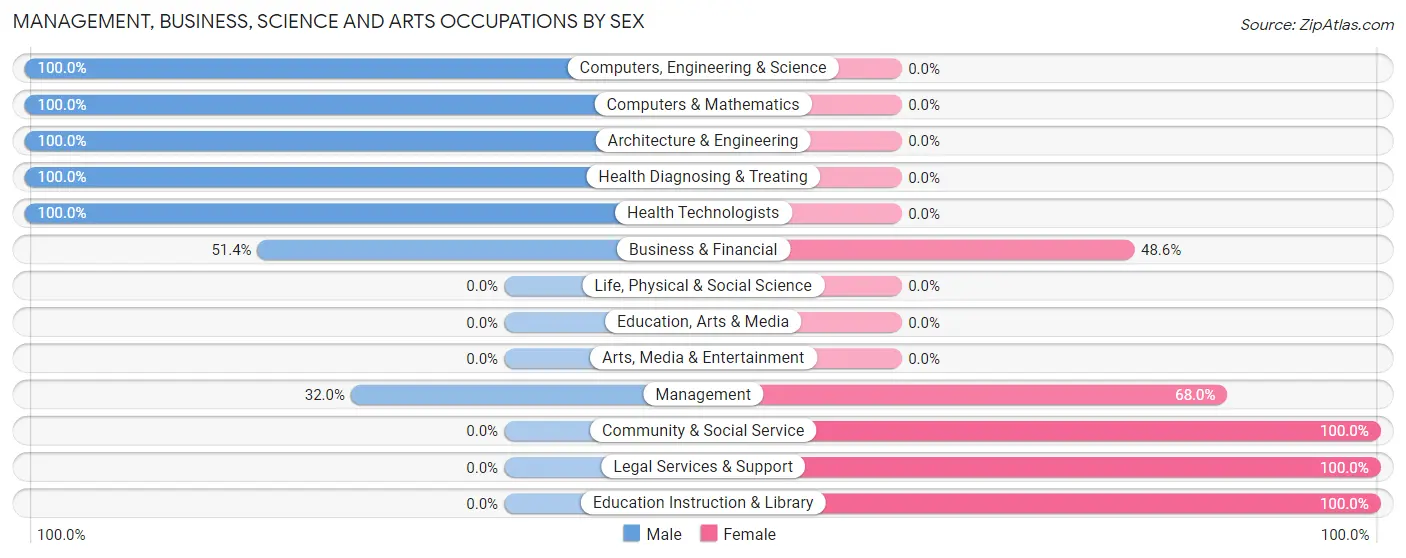
Management, Business, Science and Arts Occupations by Sex
Within the Management, Business, Science and Arts occupations in Anderson Island, the most male-oriented occupations are Computers, Engineering & Science (100.0%), Computers & Mathematics (100.0%), and Architecture & Engineering (100.0%), while the most female-oriented occupations are Community & Social Service (100.0%), Legal Services & Support (100.0%), and Education Instruction & Library (100.0%).
| Occupation | Male | Female |
| Management | 31 (32.0%) | 66 (68.0%) |
| Business & Financial | 18 (51.4%) | 17 (48.6%) |
| Computers, Engineering & Science | 56 (100.0%) | 0 (0.0%) |
| Computers & Mathematics | 39 (100.0%) | 0 (0.0%) |
| Architecture & Engineering | 17 (100.0%) | 0 (0.0%) |
| Life, Physical & Social Science | 0 (0.0%) | 0 (0.0%) |
| Community & Social Service | 0 (0.0%) | 47 (100.0%) |
| Education, Arts & Media | 0 (0.0%) | 0 (0.0%) |
| Legal Services & Support | 0 (0.0%) | 17 (100.0%) |
| Education Instruction & Library | 0 (0.0%) | 30 (100.0%) |
| Arts, Media & Entertainment | 0 (0.0%) | 0 (0.0%) |
| Health Diagnosing & Treating | 72 (100.0%) | 0 (0.0%) |
| Health Technologists | 18 (100.0%) | 0 (0.0%) |
| Total (Category) | 177 (57.7%) | 130 (42.3%) |
| Total (Overall) | 433 (75.3%) | 142 (24.7%) |
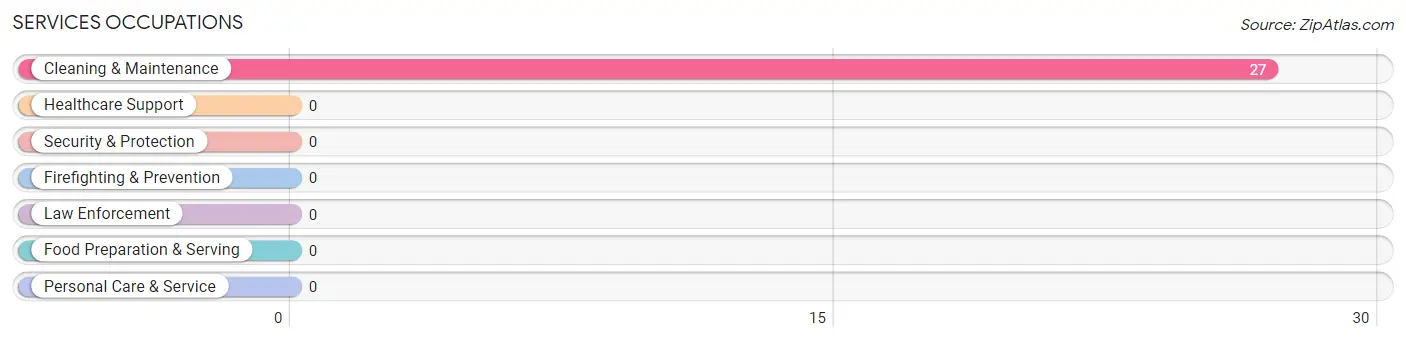
Services Occupations
The most common Services occupations in Anderson Island are , and Cleaning & Maintenance (27 | 4.7%).
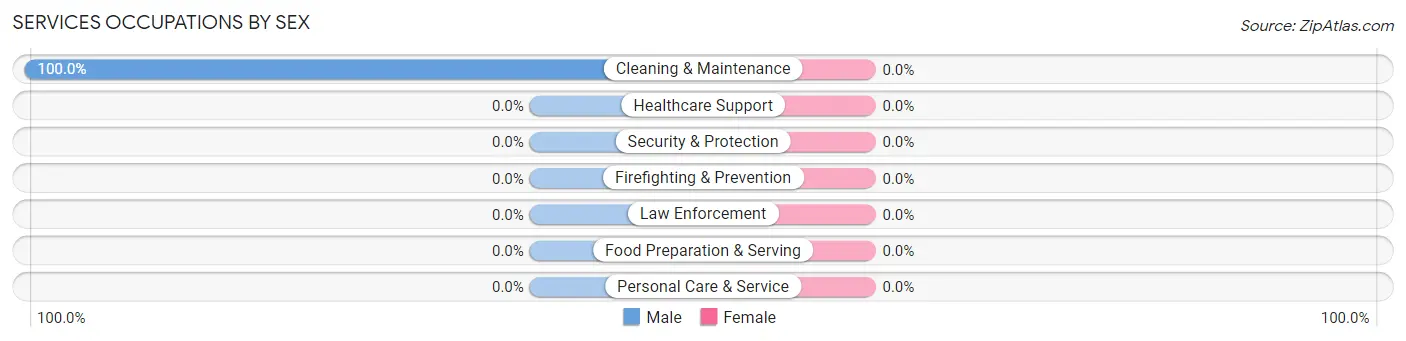
Services Occupations by Sex
| Occupation | Male | Female |
| Healthcare Support | 0 (0.0%) | 0 (0.0%) |
| Security & Protection | 0 (0.0%) | 0 (0.0%) |
| Firefighting & Prevention | 0 (0.0%) | 0 (0.0%) |
| Law Enforcement | 0 (0.0%) | 0 (0.0%) |
| Food Preparation & Serving | 0 (0.0%) | 0 (0.0%) |
| Cleaning & Maintenance | 27 (100.0%) | 0 (0.0%) |
| Personal Care & Service | 0 (0.0%) | 0 (0.0%) |
| Total (Category) | 27 (100.0%) | 0 (0.0%) |
| Total (Overall) | 433 (75.3%) | 142 (24.7%) |
Sales and Office Occupations
The most common Sales and Office occupations in Anderson Island are Sales & Related (113 | 19.7%), and Office & Administration (22 | 3.8%).
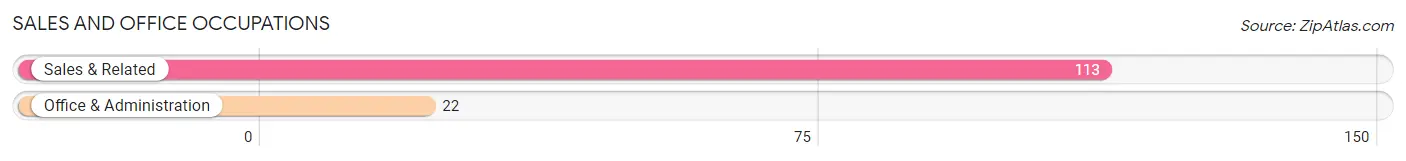
Sales and Office Occupations by Sex
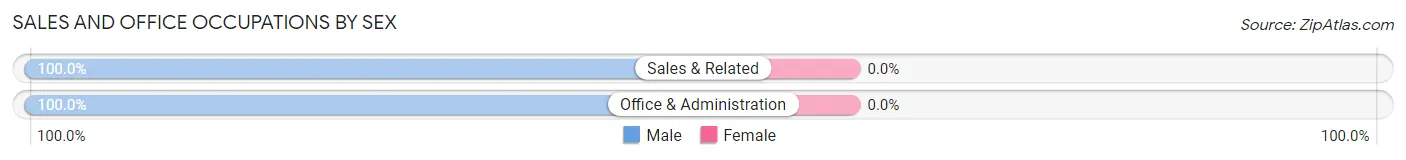
| Occupation | Male | Female |
| Sales & Related | 113 (100.0%) | 0 (0.0%) |
| Office & Administration | 22 (100.0%) | 0 (0.0%) |
| Total (Category) | 135 (100.0%) | 0 (0.0%) |
| Total (Overall) | 433 (75.3%) | 142 (24.7%) |
Natural Resources, Construction and Maintenance Occupations
The most common Natural Resources, Construction and Maintenance occupations in Anderson Island are , and Construction & Extraction (18 | 3.1%).
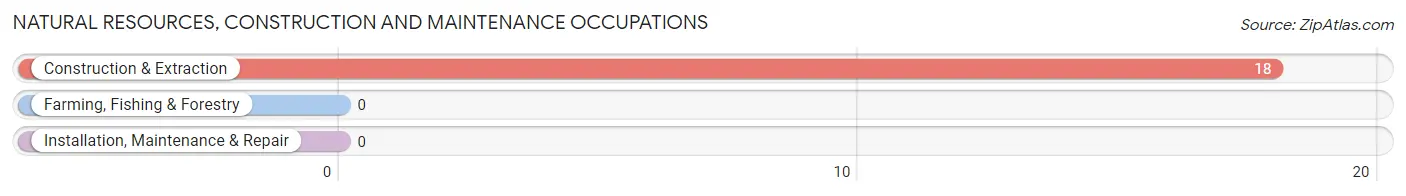
Natural Resources, Construction and Maintenance Occupations by Sex
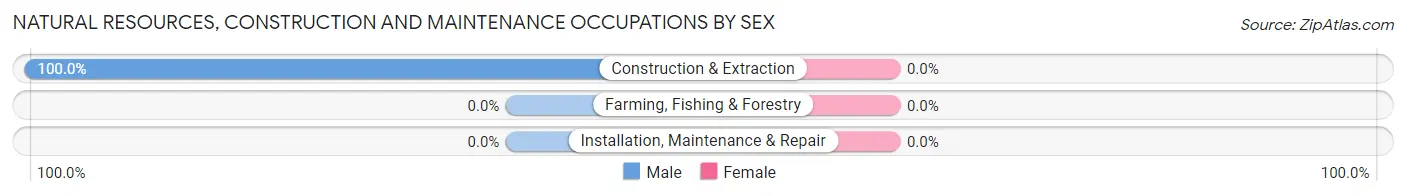
| Occupation | Male | Female |
| Farming, Fishing & Forestry | 0 (0.0%) | 0 (0.0%) |
| Construction & Extraction | 18 (100.0%) | 0 (0.0%) |
| Installation, Maintenance & Repair | 0 (0.0%) | 0 (0.0%) |
| Total (Category) | 18 (100.0%) | 0 (0.0%) |
| Total (Overall) | 433 (75.3%) | 142 (24.7%) |
Production, Transportation and Moving Occupations
The most common Production, Transportation and Moving occupations in Anderson Island are , and Transportation (88 | 15.3%).
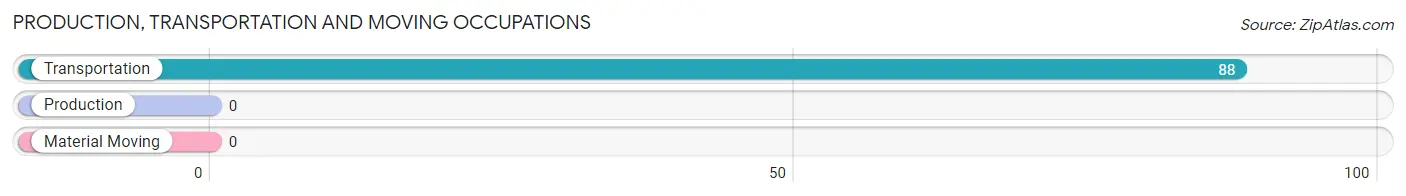
Production, Transportation and Moving Occupations by Sex
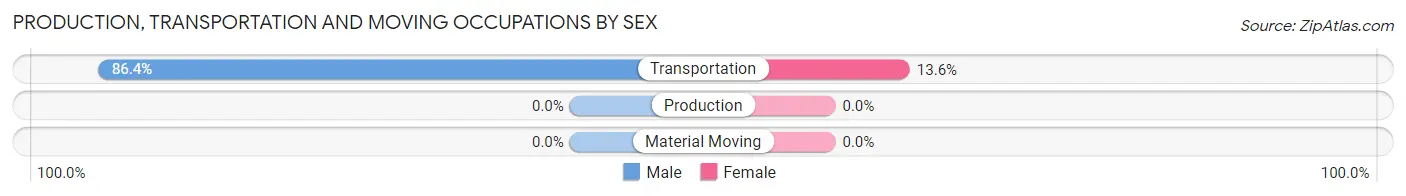
| Occupation | Male | Female |
| Production | 0 (0.0%) | 0 (0.0%) |
| Transportation | 76 (86.4%) | 12 (13.6%) |
| Material Moving | 0 (0.0%) | 0 (0.0%) |
| Total (Category) | 76 (86.4%) | 12 (13.6%) |
| Total (Overall) | 433 (75.3%) | 142 (24.7%) |
Employment Industries by Sex in Anderson Island
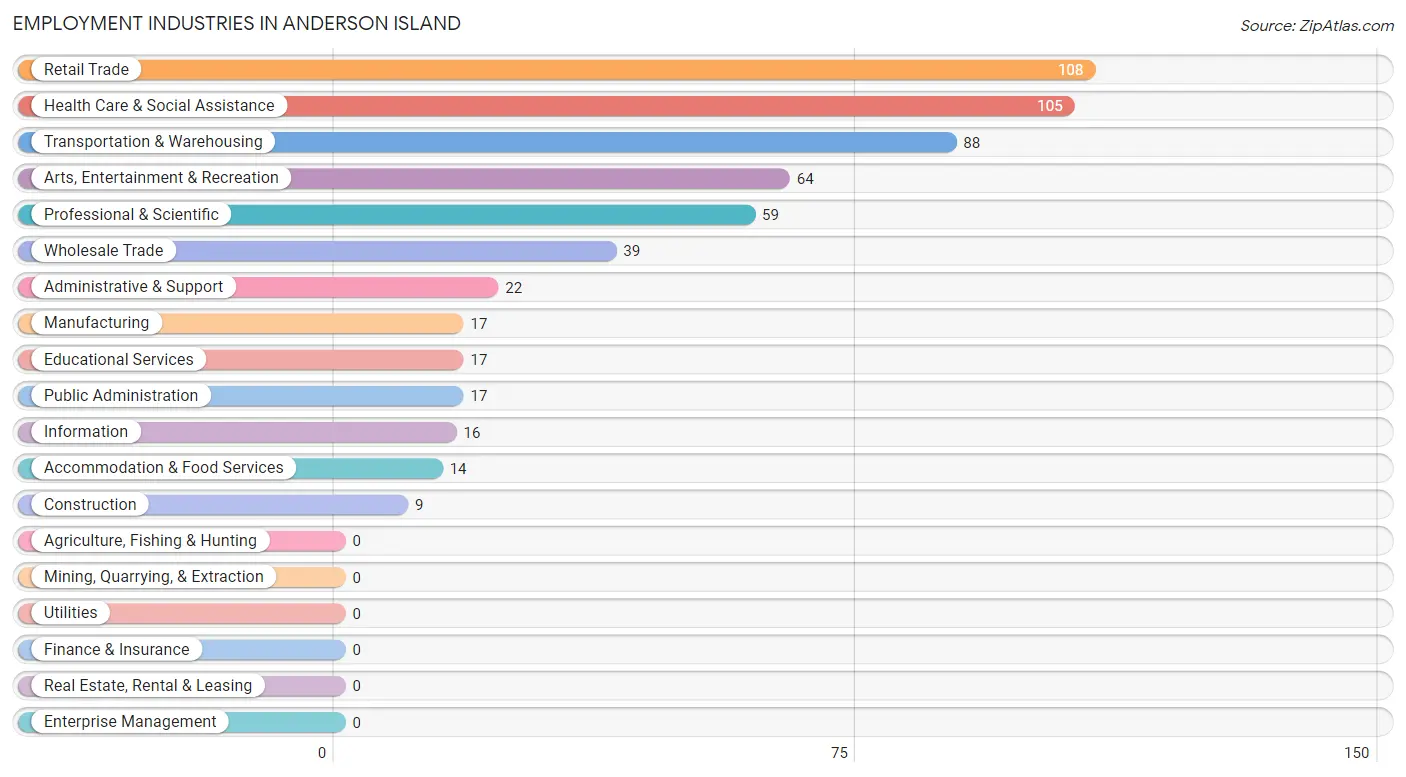
Employment Industries in Anderson Island
The major employment industries in Anderson Island include Retail Trade (108 | 18.8%), Health Care & Social Assistance (105 | 18.3%), Transportation & Warehousing (88 | 15.3%), Arts, Entertainment & Recreation (64 | 11.1%), and Professional & Scientific (59 | 10.3%).
Employment Industries by Sex in Anderson Island
The Anderson Island industries that see more men than women are Manufacturing (100.0%), Wholesale Trade (100.0%), and Information (100.0%), whereas the industries that tend to have a higher number of women are Construction (100.0%), Educational Services (100.0%), and Public Administration (100.0%).
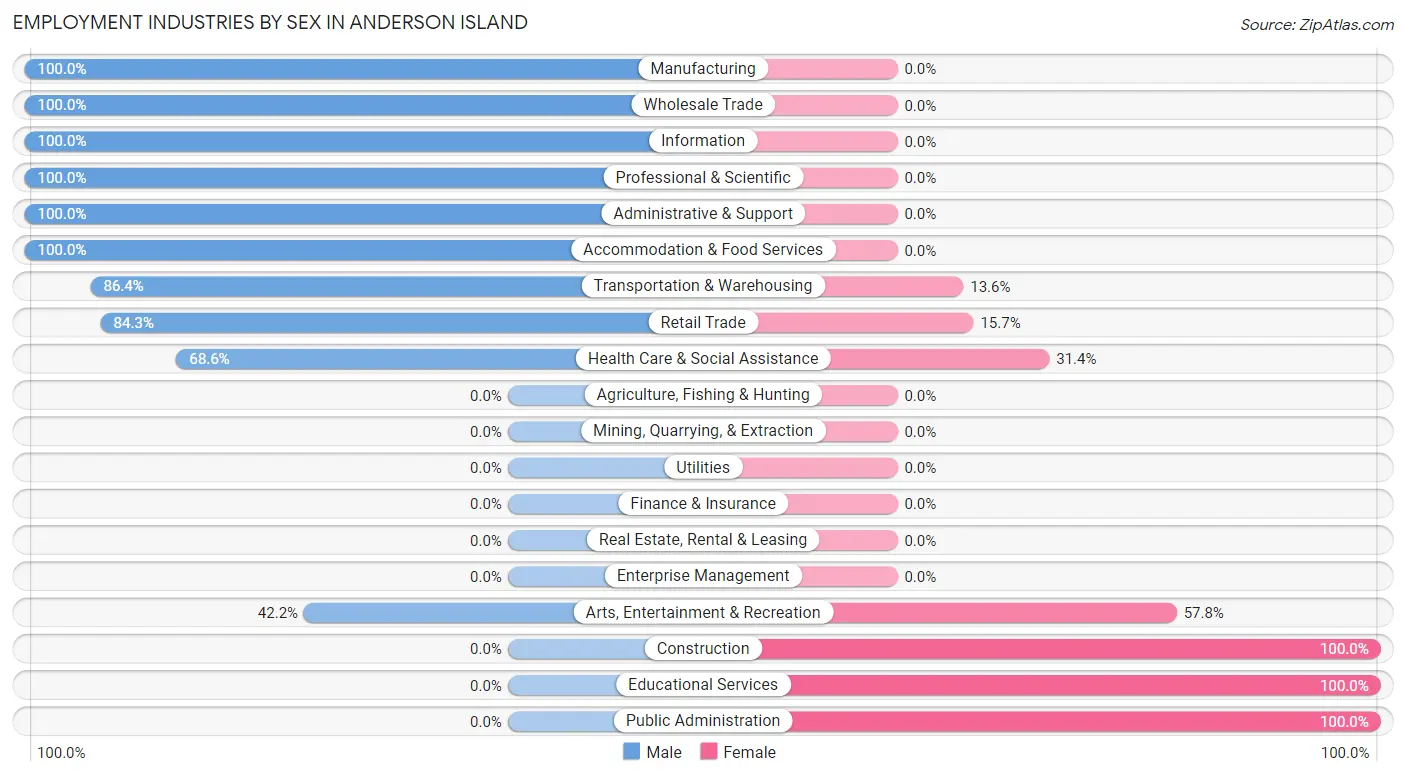
| Industry | Male | Female |
| Agriculture, Fishing & Hunting | 0 (0.0%) | 0 (0.0%) |
| Mining, Quarrying, & Extraction | 0 (0.0%) | 0 (0.0%) |
| Construction | 0 (0.0%) | 9 (100.0%) |
| Manufacturing | 17 (100.0%) | 0 (0.0%) |
| Wholesale Trade | 39 (100.0%) | 0 (0.0%) |
| Retail Trade | 91 (84.3%) | 17 (15.7%) |
| Transportation & Warehousing | 76 (86.4%) | 12 (13.6%) |
| Utilities | 0 (0.0%) | 0 (0.0%) |
| Information | 16 (100.0%) | 0 (0.0%) |
| Finance & Insurance | 0 (0.0%) | 0 (0.0%) |
| Real Estate, Rental & Leasing | 0 (0.0%) | 0 (0.0%) |
| Professional & Scientific | 59 (100.0%) | 0 (0.0%) |
| Enterprise Management | 0 (0.0%) | 0 (0.0%) |
| Administrative & Support | 22 (100.0%) | 0 (0.0%) |
| Educational Services | 0 (0.0%) | 17 (100.0%) |
| Health Care & Social Assistance | 72 (68.6%) | 33 (31.4%) |
| Arts, Entertainment & Recreation | 27 (42.2%) | 37 (57.8%) |
| Accommodation & Food Services | 14 (100.0%) | 0 (0.0%) |
| Public Administration | 0 (0.0%) | 17 (100.0%) |
| Total | 433 (75.3%) | 142 (24.7%) |
Education in Anderson Island
School Enrollment in Anderson Island
The most common levels of schooling among the 160 students in Anderson Island are high school (100 | 62.5%), kindergarten (30 | 18.8%), and elementary school (30 | 18.8%).
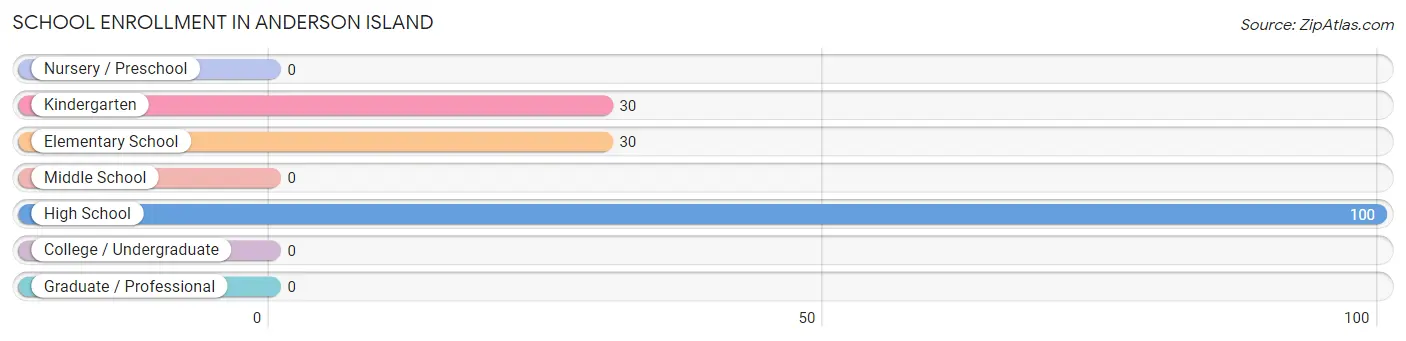
| School Level | # Students | % Students |
| Nursery / Preschool | 0 | 0.0% |
| Kindergarten | 30 | 18.8% |
| Elementary School | 30 | 18.8% |
| Middle School | 0 | 0.0% |
| High School | 100 | 62.5% |
| College / Undergraduate | 0 | 0.0% |
| Graduate / Professional | 0 | 0.0% |
| Total | 160 | 100.0% |
School Enrollment by Age by Funding Source in Anderson Island
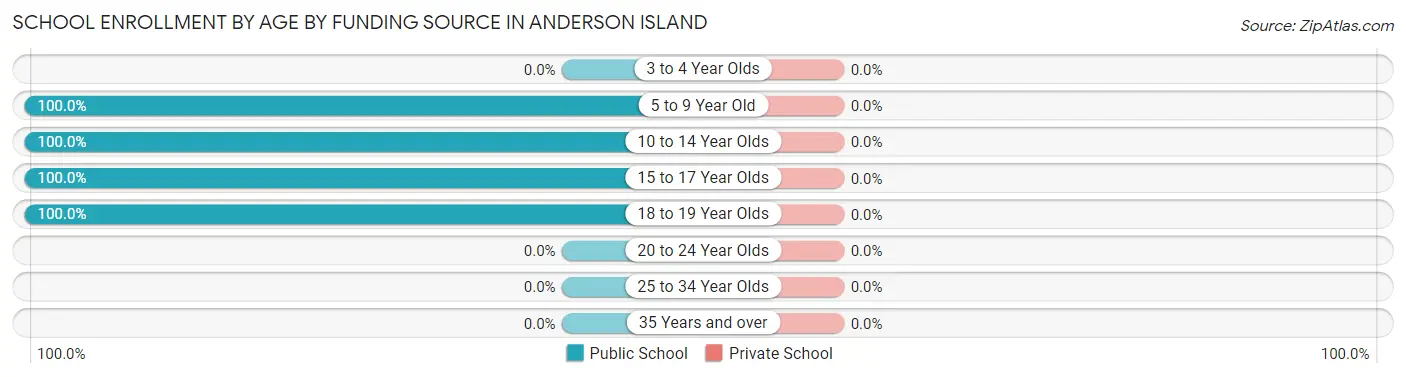
| Age Bracket | Public School | Private School |
| 3 to 4 Year Olds | 0 (0.0%) | 0 (0.0%) |
| 5 to 9 Year Old | 30 (100.0%) | 0 (0.0%) |
| 10 to 14 Year Olds | 76 (100.0%) | 0 (0.0%) |
| 15 to 17 Year Olds | 29 (100.0%) | 0 (0.0%) |
| 18 to 19 Year Olds | 25 (100.0%) | 0 (0.0%) |
| 20 to 24 Year Olds | 0 (0.0%) | 0 (0.0%) |
| 25 to 34 Year Olds | 0 (0.0%) | 0 (0.0%) |
| 35 Years and over | 0 (0.0%) | 0 (0.0%) |
| Total | 160 (100.0%) | 0 (0.0%) |
Educational Attainment by Field of Study in Anderson Island
Social sciences (89 | 16.4%), business (78 | 14.3%), engineering (76 | 14.0%), bio, nature & agricultural (70 | 12.9%), and science & technology (48 | 8.8%) are the most common fields of study among 544 individuals in Anderson Island who have obtained a bachelor's degree or higher.
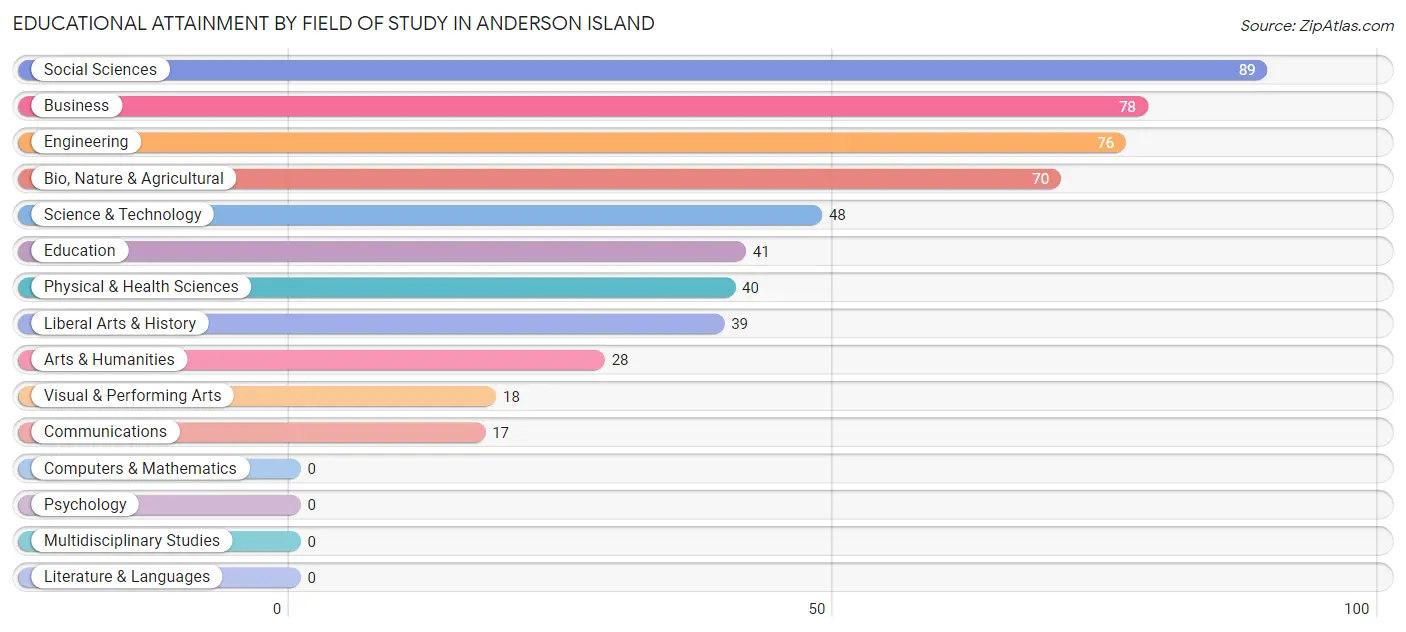
| Field of Study | # Graduates | % Graduates |
| Computers & Mathematics | 0 | 0.0% |
| Bio, Nature & Agricultural | 70 | 12.9% |
| Physical & Health Sciences | 40 | 7.3% |
| Psychology | 0 | 0.0% |
| Social Sciences | 89 | 16.4% |
| Engineering | 76 | 14.0% |
| Multidisciplinary Studies | 0 | 0.0% |
| Science & Technology | 48 | 8.8% |
| Business | 78 | 14.3% |
| Education | 41 | 7.5% |
| Literature & Languages | 0 | 0.0% |
| Liberal Arts & History | 39 | 7.2% |
| Visual & Performing Arts | 18 | 3.3% |
| Communications | 17 | 3.1% |
| Arts & Humanities | 28 | 5.1% |
| Total | 544 | 100.0% |
Transportation & Commute in Anderson Island
Vehicle Availability by Sex in Anderson Island
The most prevalent vehicle ownership categories in Anderson Island are males with 3 vehicles (207, accounting for 47.8%) and females with 3 vehicles (16, making up 145.8%).
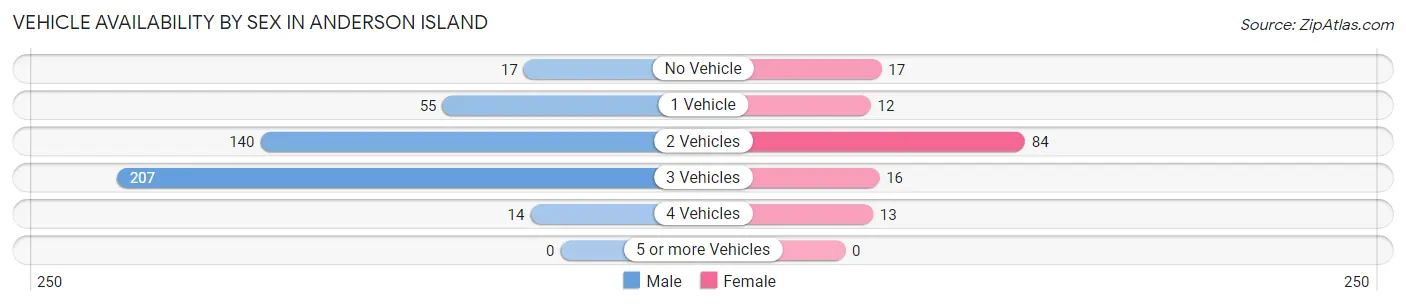
| Vehicles Available | Male | Female |
| No Vehicle | 17 (3.9%) | 17 (12.0%) |
| 1 Vehicle | 55 (12.7%) | 12 (8.5%) |
| 2 Vehicles | 140 (32.3%) | 84 (59.2%) |
| 3 Vehicles | 207 (47.8%) | 16 (11.3%) |
| 4 Vehicles | 14 (3.2%) | 13 (9.1%) |
| 5 or more Vehicles | 0 (0.0%) | 0 (0.0%) |
| Total | 433 (100.0%) | 142 (100.0%) |
Commute Time in Anderson Island
The most frequently occuring commute durations in Anderson Island are 30 to 34 minutes (87 commuters, 17.6%), 45 to 59 minutes (65 commuters, 13.2%), and 15 to 19 minutes (60 commuters, 12.2%).
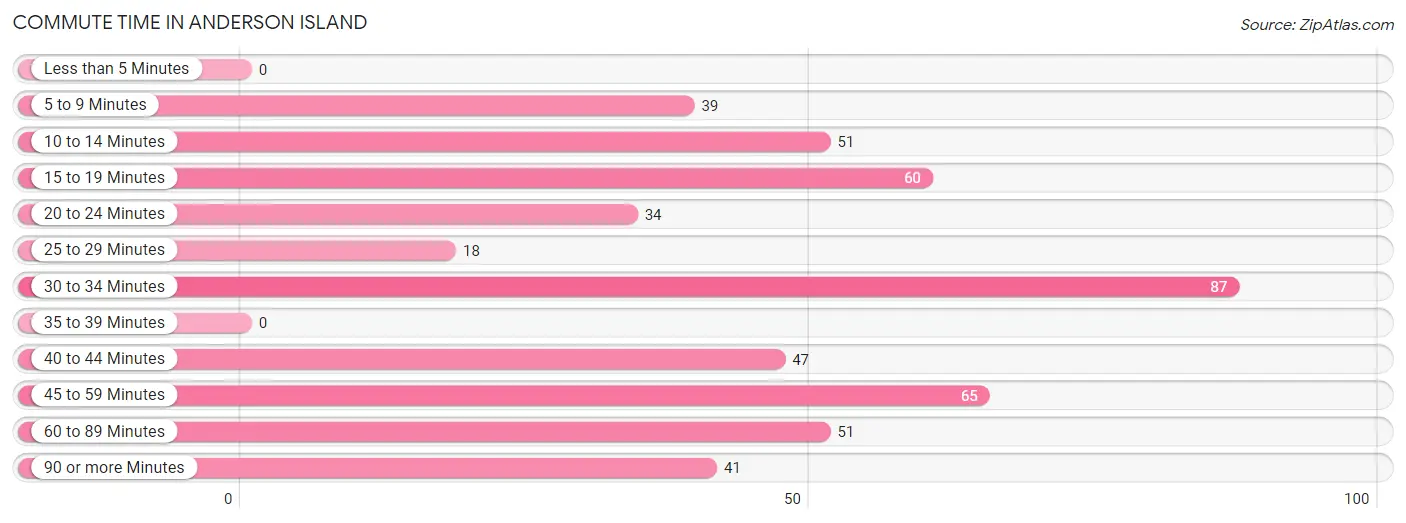
| Commute Time | # Commuters | % Commuters |
| Less than 5 Minutes | 0 | 0.0% |
| 5 to 9 Minutes | 39 | 7.9% |
| 10 to 14 Minutes | 51 | 10.3% |
| 15 to 19 Minutes | 60 | 12.2% |
| 20 to 24 Minutes | 34 | 6.9% |
| 25 to 29 Minutes | 18 | 3.6% |
| 30 to 34 Minutes | 87 | 17.6% |
| 35 to 39 Minutes | 0 | 0.0% |
| 40 to 44 Minutes | 47 | 9.5% |
| 45 to 59 Minutes | 65 | 13.2% |
| 60 to 89 Minutes | 51 | 10.3% |
| 90 or more Minutes | 41 | 8.3% |
Commute Time by Sex in Anderson Island
The most common commute times in Anderson Island are 30 to 34 minutes (70 commuters, 18.6%) for males and 60 to 89 minutes (25 commuters, 21.4%) for females.
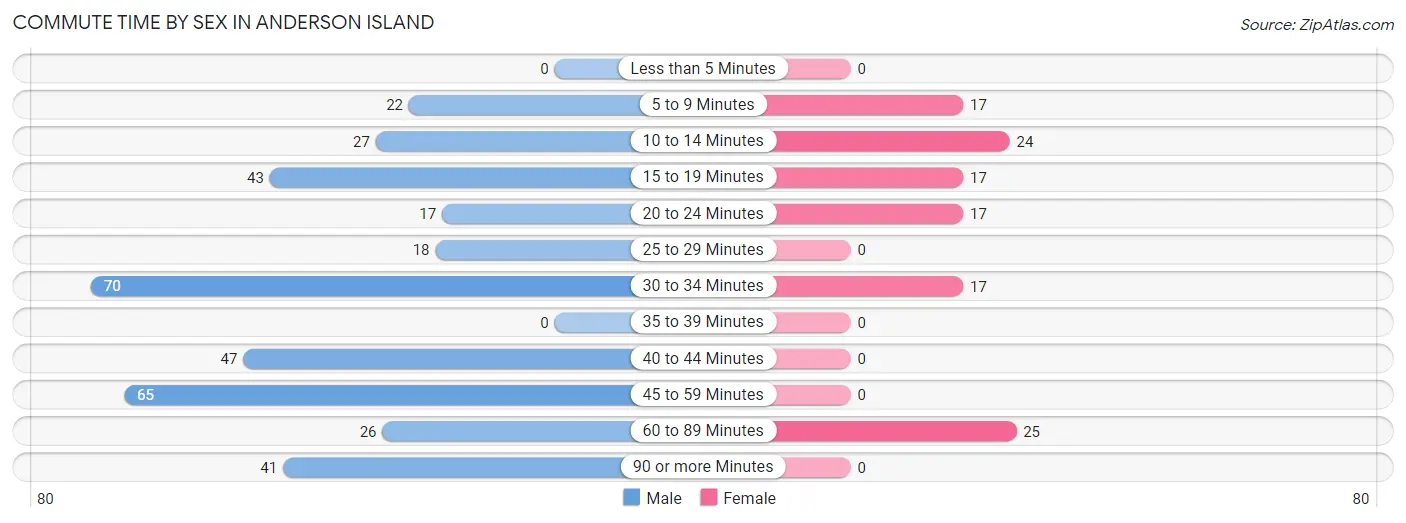
| Commute Time | Male | Female |
| Less than 5 Minutes | 0 (0.0%) | 0 (0.0%) |
| 5 to 9 Minutes | 22 (5.9%) | 17 (14.5%) |
| 10 to 14 Minutes | 27 (7.2%) | 24 (20.5%) |
| 15 to 19 Minutes | 43 (11.4%) | 17 (14.5%) |
| 20 to 24 Minutes | 17 (4.5%) | 17 (14.5%) |
| 25 to 29 Minutes | 18 (4.8%) | 0 (0.0%) |
| 30 to 34 Minutes | 70 (18.6%) | 17 (14.5%) |
| 35 to 39 Minutes | 0 (0.0%) | 0 (0.0%) |
| 40 to 44 Minutes | 47 (12.5%) | 0 (0.0%) |
| 45 to 59 Minutes | 65 (17.3%) | 0 (0.0%) |
| 60 to 89 Minutes | 26 (6.9%) | 25 (21.4%) |
| 90 or more Minutes | 41 (10.9%) | 0 (0.0%) |
Time of Departure to Work by Sex in Anderson Island
The most frequent times of departure to work in Anderson Island are 6:00 AM to 6:29 AM (136, 36.2%) for males and 7:00 AM to 7:29 AM (34, 29.1%) for females.
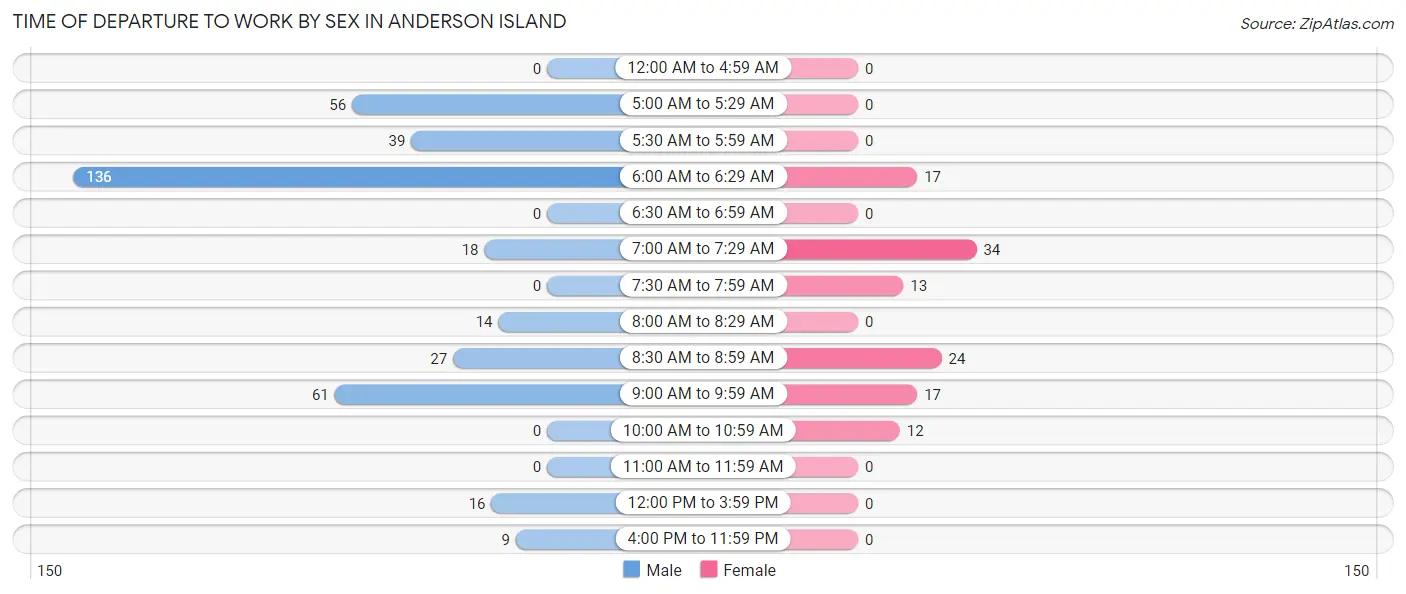
| Time of Departure | Male | Female |
| 12:00 AM to 4:59 AM | 0 (0.0%) | 0 (0.0%) |
| 5:00 AM to 5:29 AM | 56 (14.9%) | 0 (0.0%) |
| 5:30 AM to 5:59 AM | 39 (10.4%) | 0 (0.0%) |
| 6:00 AM to 6:29 AM | 136 (36.2%) | 17 (14.5%) |
| 6:30 AM to 6:59 AM | 0 (0.0%) | 0 (0.0%) |
| 7:00 AM to 7:29 AM | 18 (4.8%) | 34 (29.1%) |
| 7:30 AM to 7:59 AM | 0 (0.0%) | 13 (11.1%) |
| 8:00 AM to 8:29 AM | 14 (3.7%) | 0 (0.0%) |
| 8:30 AM to 8:59 AM | 27 (7.2%) | 24 (20.5%) |
| 9:00 AM to 9:59 AM | 61 (16.2%) | 17 (14.5%) |
| 10:00 AM to 10:59 AM | 0 (0.0%) | 12 (10.3%) |
| 11:00 AM to 11:59 AM | 0 (0.0%) | 0 (0.0%) |
| 12:00 PM to 3:59 PM | 16 (4.3%) | 0 (0.0%) |
| 4:00 PM to 11:59 PM | 9 (2.4%) | 0 (0.0%) |
| Total | 376 (100.0%) | 117 (100.0%) |
Housing Occupancy in Anderson Island
Occupancy by Ownership in Anderson Island
Of the total 825 dwellings in Anderson Island, owner-occupied units account for 825 (100.0%), while renter-occupied units make up 0 (0.0%).
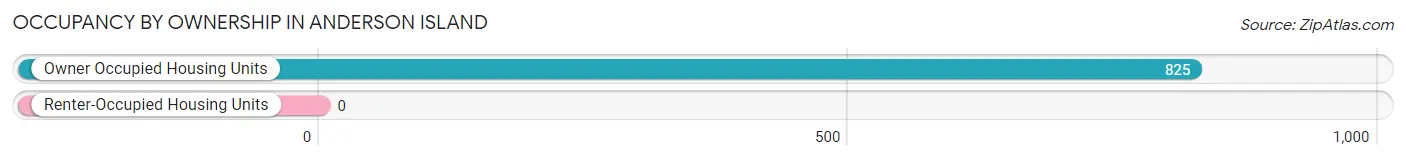
| Occupancy | # Housing Units | % Housing Units |
| Owner Occupied Housing Units | 825 | 100.0% |
| Renter-Occupied Housing Units | 0 | 0.0% |
| Total Occupied Housing Units | 825 | 100.0% |
Occupancy by Household Size in Anderson Island
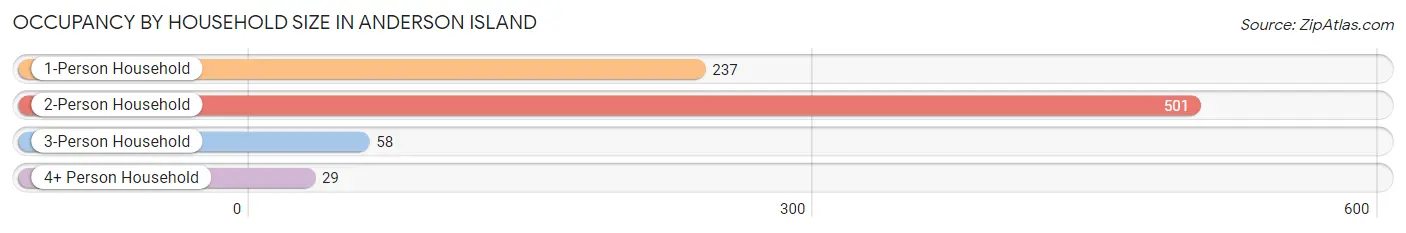
| Household Size | # Housing Units | % Housing Units |
| 1-Person Household | 237 | 28.7% |
| 2-Person Household | 501 | 60.7% |
| 3-Person Household | 58 | 7.0% |
| 4+ Person Household | 29 | 3.5% |
| Total Housing Units | 825 | 100.0% |
Occupancy by Ownership by Household Size in Anderson Island
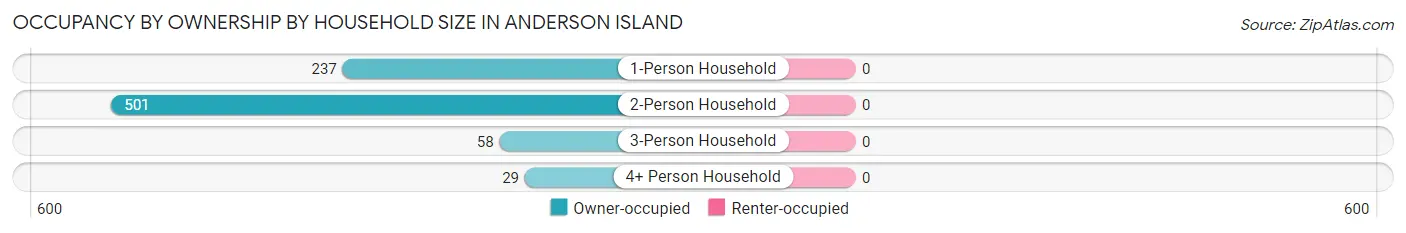
| Household Size | Owner-occupied | Renter-occupied |
| 1-Person Household | 237 (100.0%) | 0 (0.0%) |
| 2-Person Household | 501 (100.0%) | 0 (0.0%) |
| 3-Person Household | 58 (100.0%) | 0 (0.0%) |
| 4+ Person Household | 29 (100.0%) | 0 (0.0%) |
| Total Housing Units | 825 (100.0%) | 0 (0.0%) |
Occupancy by Educational Attainment in Anderson Island
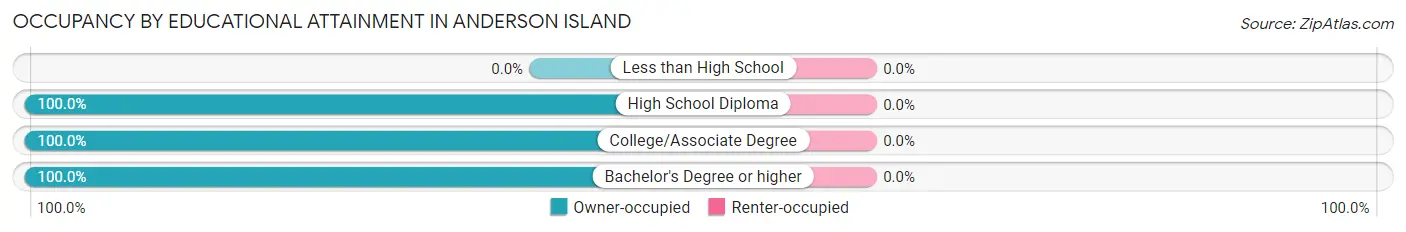
| Household Size | Owner-occupied | Renter-occupied |
| Less than High School | 0 (0.0%) | 0 (0.0%) |
| High School Diploma | 13 (100.0%) | 0 (0.0%) |
| College/Associate Degree | 484 (100.0%) | 0 (0.0%) |
| Bachelor's Degree or higher | 328 (100.0%) | 0 (0.0%) |
Occupancy by Age of Householder in Anderson Island
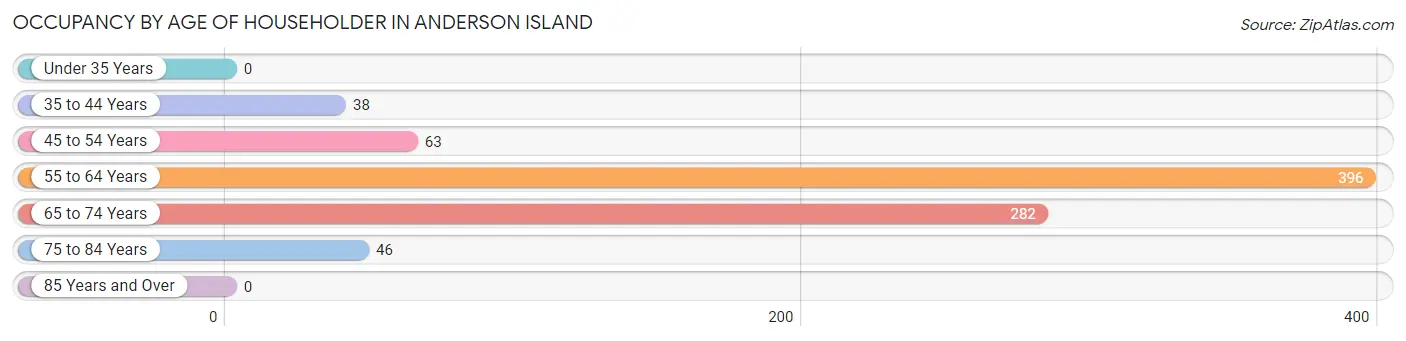
| Age Bracket | # Households | % Households |
| Under 35 Years | 0 | 0.0% |
| 35 to 44 Years | 38 | 4.6% |
| 45 to 54 Years | 63 | 7.6% |
| 55 to 64 Years | 396 | 48.0% |
| 65 to 74 Years | 282 | 34.2% |
| 75 to 84 Years | 46 | 5.6% |
| 85 Years and Over | 0 | 0.0% |
| Total | 825 | 100.0% |
Housing Finances in Anderson Island
Median Income by Occupancy in Anderson Island
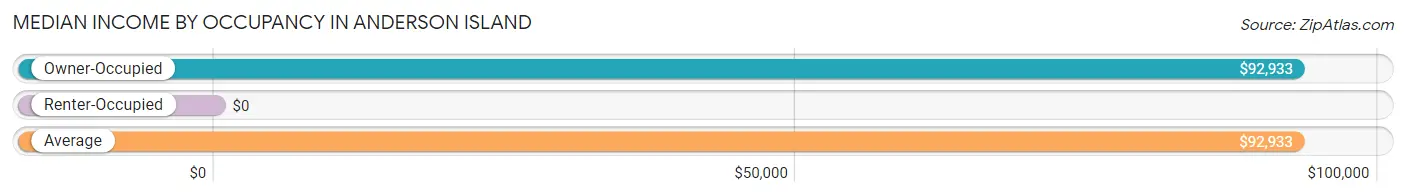
| Occupancy Type | # Households | Median Income |
| Owner-Occupied | 825 (100.0%) | $92,933 |
| Renter-Occupied | 0 (0.0%) | $0 |
| Average | 825 (100.0%) | $92,933 |
Occupancy by Householder Income Bracket in Anderson Island
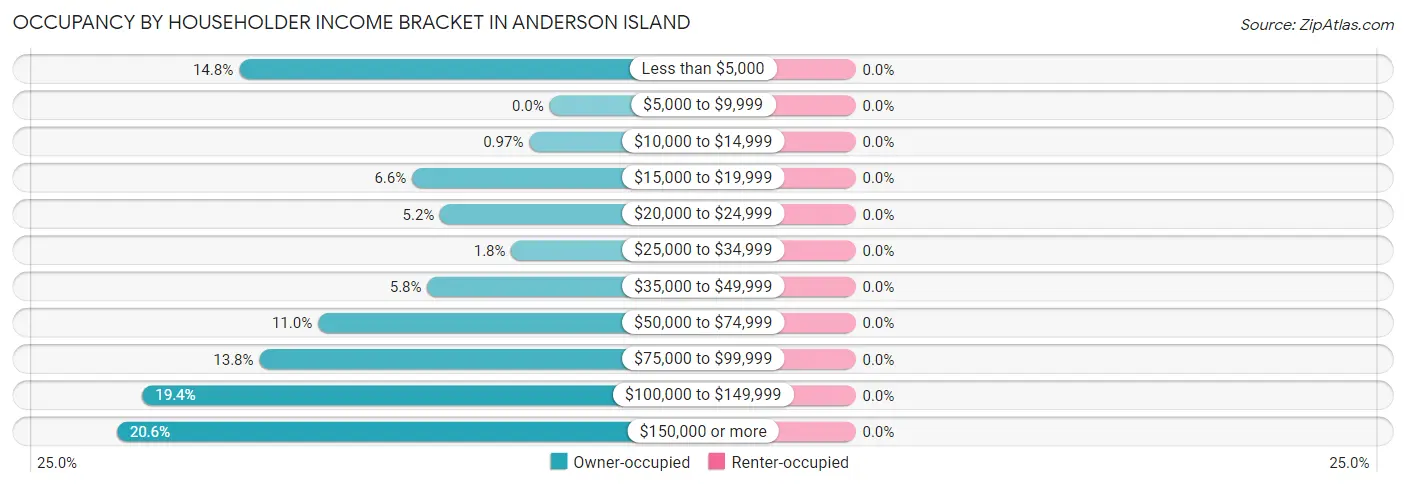
| Income Bracket | Owner-occupied | Renter-occupied |
| Less than $5,000 | 122 (14.8%) | 0 (0.0%) |
| $5,000 to $9,999 | 0 (0.0%) | 0 (0.0%) |
| $10,000 to $14,999 | 8 (1.0%) | 0 (0.0%) |
| $15,000 to $19,999 | 54 (6.6%) | 0 (0.0%) |
| $20,000 to $24,999 | 43 (5.2%) | 0 (0.0%) |
| $25,000 to $34,999 | 15 (1.8%) | 0 (0.0%) |
| $35,000 to $49,999 | 48 (5.8%) | 0 (0.0%) |
| $50,000 to $74,999 | 91 (11.0%) | 0 (0.0%) |
| $75,000 to $99,999 | 114 (13.8%) | 0 (0.0%) |
| $100,000 to $149,999 | 160 (19.4%) | 0 (0.0%) |
| $150,000 or more | 170 (20.6%) | 0 (0.0%) |
| Total | 825 (100.0%) | 0 (0.0%) |
Monthly Housing Cost Tiers in Anderson Island
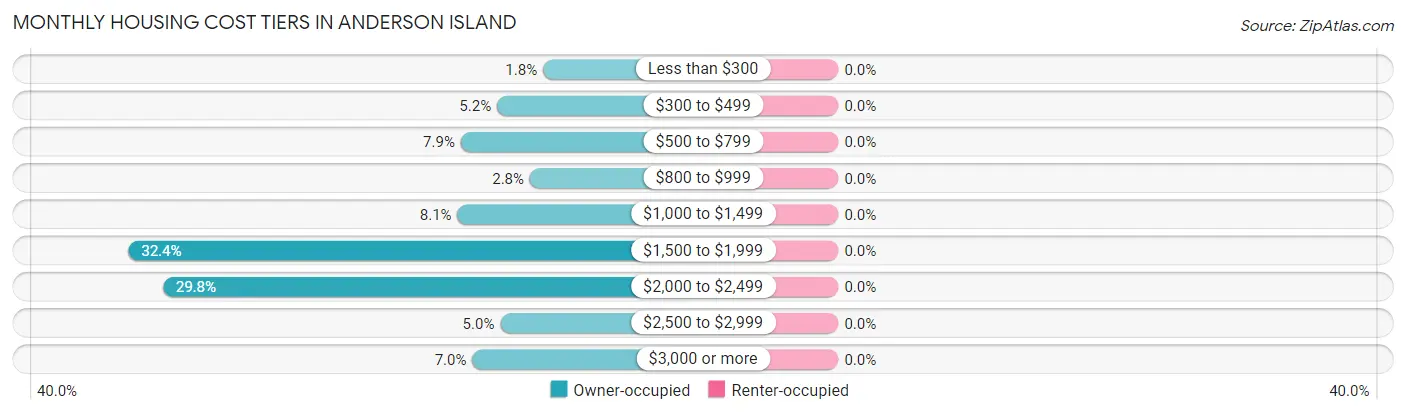
| Monthly Cost | Owner-occupied | Renter-occupied |
| Less than $300 | 15 (1.8%) | 0 (0.0%) |
| $300 to $499 | 43 (5.2%) | 0 (0.0%) |
| $500 to $799 | 65 (7.9%) | 0 (0.0%) |
| $800 to $999 | 23 (2.8%) | 0 (0.0%) |
| $1,000 to $1,499 | 67 (8.1%) | 0 (0.0%) |
| $1,500 to $1,999 | 267 (32.4%) | 0 (0.0%) |
| $2,000 to $2,499 | 246 (29.8%) | 0 (0.0%) |
| $2,500 to $2,999 | 41 (5.0%) | 0 (0.0%) |
| $3,000 or more | 58 (7.0%) | 0 (0.0%) |
| Total | 825 (100.0%) | 0 (0.0%) |
Physical Housing Characteristics in Anderson Island
Housing Structures in Anderson Island
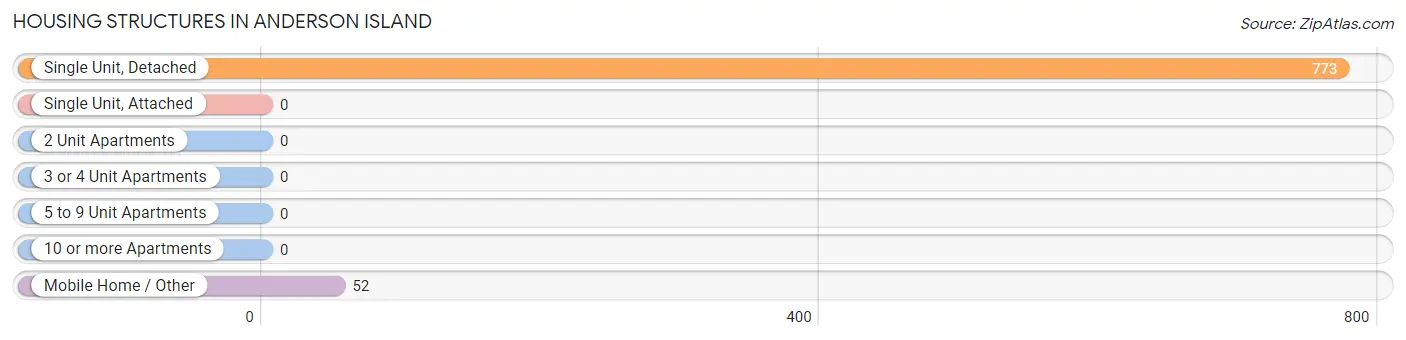
| Structure Type | # Housing Units | % Housing Units |
| Single Unit, Detached | 773 | 93.7% |
| Single Unit, Attached | 0 | 0.0% |
| 2 Unit Apartments | 0 | 0.0% |
| 3 or 4 Unit Apartments | 0 | 0.0% |
| 5 to 9 Unit Apartments | 0 | 0.0% |
| 10 or more Apartments | 0 | 0.0% |
| Mobile Home / Other | 52 | 6.3% |
| Total | 825 | 100.0% |
Housing Structures by Occupancy in Anderson Island
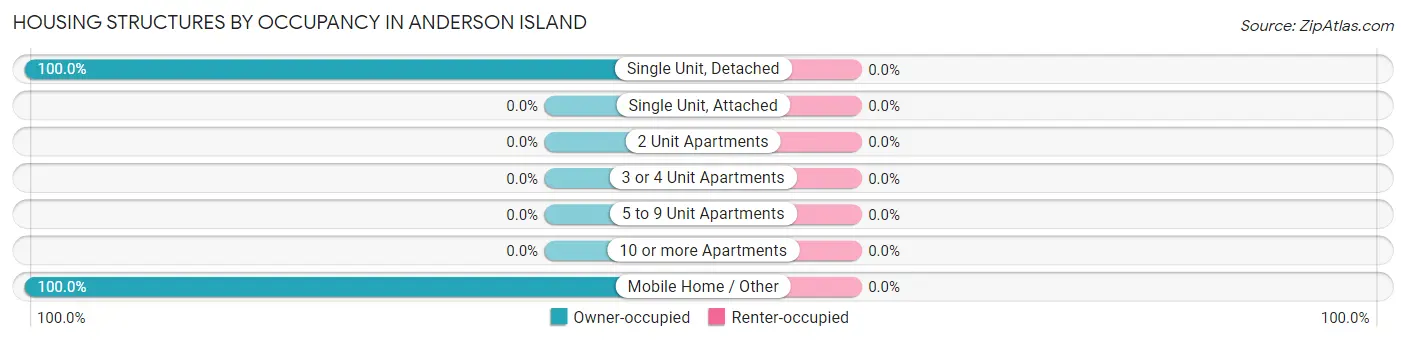
| Structure Type | Owner-occupied | Renter-occupied |
| Single Unit, Detached | 773 (100.0%) | 0 (0.0%) |
| Single Unit, Attached | 0 (0.0%) | 0 (0.0%) |
| 2 Unit Apartments | 0 (0.0%) | 0 (0.0%) |
| 3 or 4 Unit Apartments | 0 (0.0%) | 0 (0.0%) |
| 5 to 9 Unit Apartments | 0 (0.0%) | 0 (0.0%) |
| 10 or more Apartments | 0 (0.0%) | 0 (0.0%) |
| Mobile Home / Other | 52 (100.0%) | 0 (0.0%) |
| Total | 825 (100.0%) | 0 (0.0%) |
Housing Structures by Number of Rooms in Anderson Island
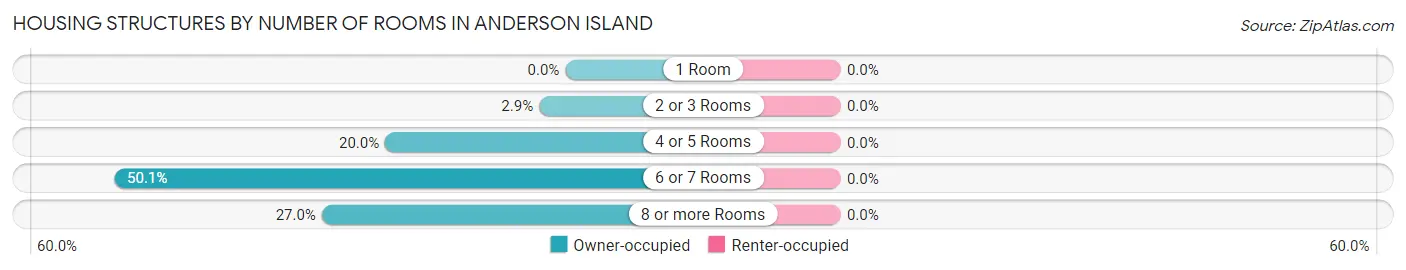
| Number of Rooms | Owner-occupied | Renter-occupied |
| 1 Room | 0 (0.0%) | 0 (0.0%) |
| 2 or 3 Rooms | 24 (2.9%) | 0 (0.0%) |
| 4 or 5 Rooms | 165 (20.0%) | 0 (0.0%) |
| 6 or 7 Rooms | 413 (50.1%) | 0 (0.0%) |
| 8 or more Rooms | 223 (27.0%) | 0 (0.0%) |
| Total | 825 (100.0%) | 0 (0.0%) |
Housing Structure by Heating Type in Anderson Island
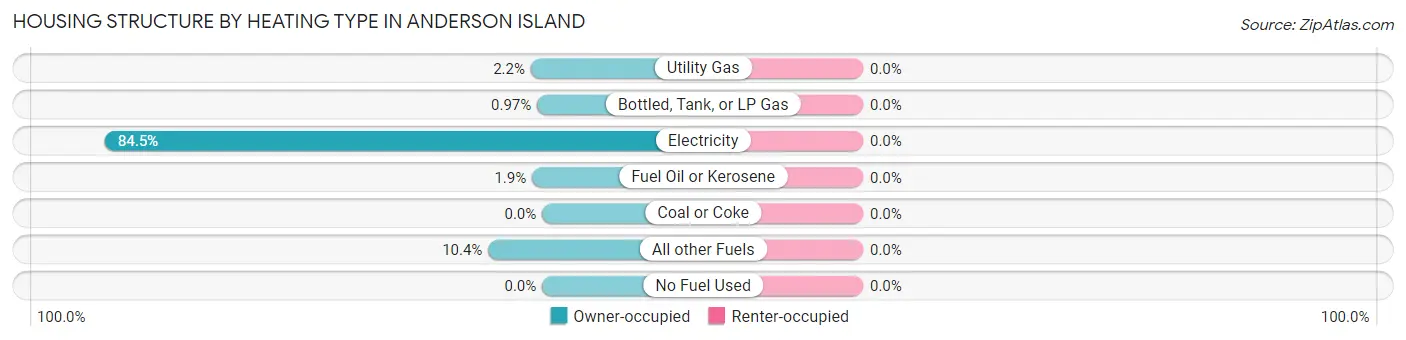
| Heating Type | Owner-occupied | Renter-occupied |
| Utility Gas | 18 (2.2%) | 0 (0.0%) |
| Bottled, Tank, or LP Gas | 8 (1.0%) | 0 (0.0%) |
| Electricity | 697 (84.5%) | 0 (0.0%) |
| Fuel Oil or Kerosene | 16 (1.9%) | 0 (0.0%) |
| Coal or Coke | 0 (0.0%) | 0 (0.0%) |
| All other Fuels | 86 (10.4%) | 0 (0.0%) |
| No Fuel Used | 0 (0.0%) | 0 (0.0%) |
| Total | 825 (100.0%) | 0 (0.0%) |
Household Vehicle Usage in Anderson Island
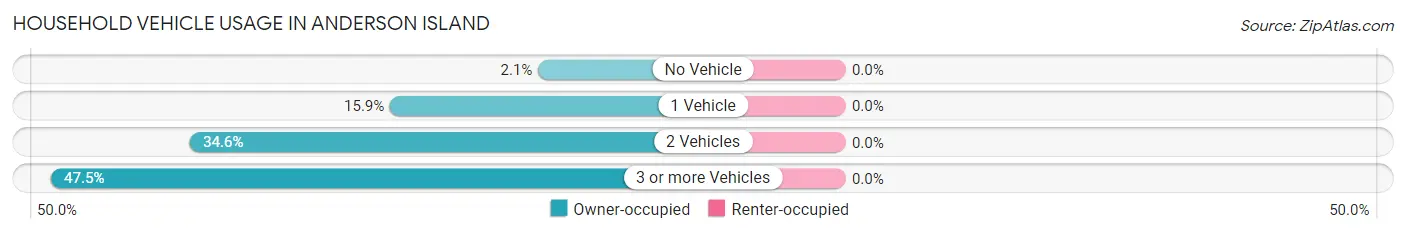
| Vehicles per Household | Owner-occupied | Renter-occupied |
| No Vehicle | 17 (2.1%) | 0 (0.0%) |
| 1 Vehicle | 131 (15.9%) | 0 (0.0%) |
| 2 Vehicles | 285 (34.5%) | 0 (0.0%) |
| 3 or more Vehicles | 392 (47.5%) | 0 (0.0%) |
| Total | 825 (100.0%) | 0 (0.0%) |
Real Estate & Mortgages in Anderson Island
Real Estate and Mortgage Overview in Anderson Island
| Characteristic | Without Mortgage | With Mortgage |
| Housing Units | 180 | 645 |
| Median Property Value | $410,800 | $462,200 |
| Median Household Income | - | - |
| Monthly Housing Costs | $643 | $58 |
| Real Estate Taxes | $3,765 | $0 |
Property Value by Mortgage Status in Anderson Island
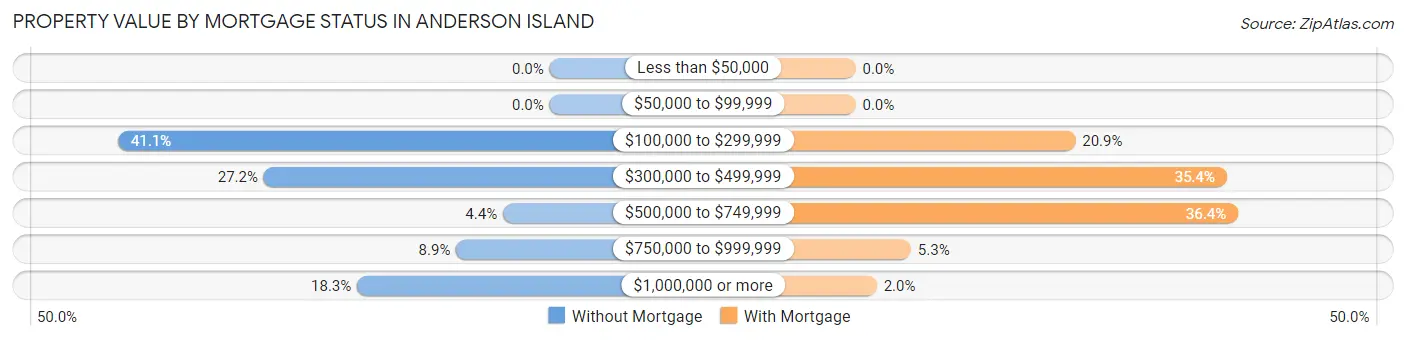
| Property Value | Without Mortgage | With Mortgage |
| Less than $50,000 | 0 (0.0%) | 0 (0.0%) |
| $50,000 to $99,999 | 0 (0.0%) | 0 (0.0%) |
| $100,000 to $299,999 | 74 (41.1%) | 135 (20.9%) |
| $300,000 to $499,999 | 49 (27.2%) | 228 (35.3%) |
| $500,000 to $749,999 | 8 (4.4%) | 235 (36.4%) |
| $750,000 to $999,999 | 16 (8.9%) | 34 (5.3%) |
| $1,000,000 or more | 33 (18.3%) | 13 (2.0%) |
| Total | 180 (100.0%) | 645 (100.0%) |
Household Income by Mortgage Status in Anderson Island
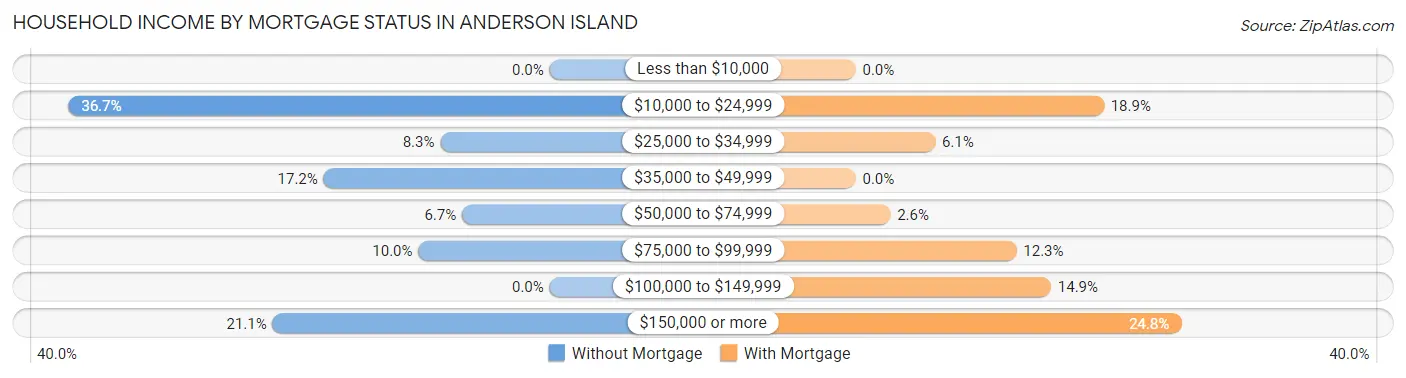
| Household Income | Without Mortgage | With Mortgage |
| Less than $10,000 | 0 (0.0%) | 0 (0.0%) |
| $10,000 to $24,999 | 66 (36.7%) | 122 (18.9%) |
| $25,000 to $34,999 | 15 (8.3%) | 39 (6.0%) |
| $35,000 to $49,999 | 31 (17.2%) | 0 (0.0%) |
| $50,000 to $74,999 | 12 (6.7%) | 17 (2.6%) |
| $75,000 to $99,999 | 18 (10.0%) | 79 (12.2%) |
| $100,000 to $149,999 | 0 (0.0%) | 96 (14.9%) |
| $150,000 or more | 38 (21.1%) | 160 (24.8%) |
| Total | 180 (100.0%) | 645 (100.0%) |
Property Value to Household Income Ratio in Anderson Island
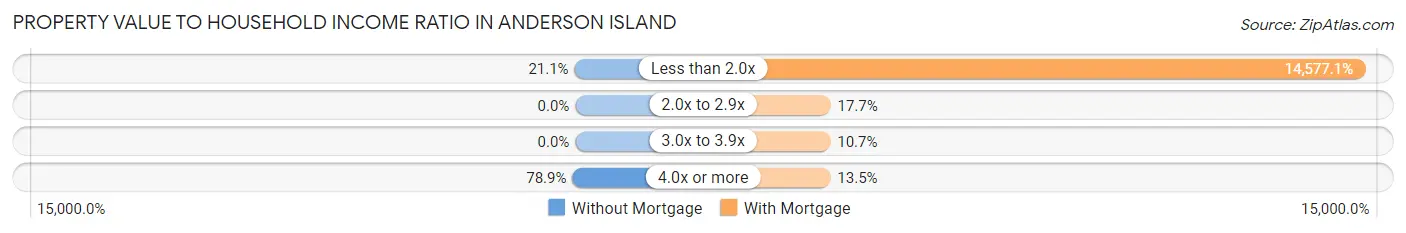
| Value-to-Income Ratio | Without Mortgage | With Mortgage |
| Less than 2.0x | 38 (21.1%) | 94,022 (14,577.0%) |
| 2.0x to 2.9x | 0 (0.0%) | 114 (17.7%) |
| 3.0x to 3.9x | 0 (0.0%) | 69 (10.7%) |
| 4.0x or more | 142 (78.9%) | 87 (13.5%) |
| Total | 180 (100.0%) | 645 (100.0%) |
Real Estate Taxes by Mortgage Status in Anderson Island
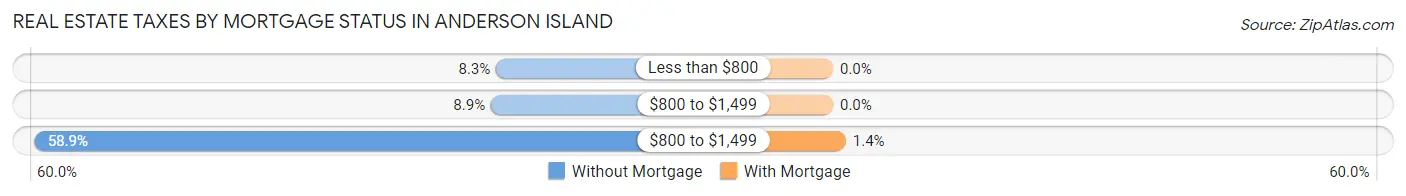
| Property Taxes | Without Mortgage | With Mortgage |
| Less than $800 | 15 (8.3%) | 0 (0.0%) |
| $800 to $1,499 | 16 (8.9%) | 0 (0.0%) |
| $800 to $1,499 | 106 (58.9%) | 9 (1.4%) |
| Total | 180 (100.0%) | 645 (100.0%) |
Health & Disability in Anderson Island
Health Insurance Coverage by Age in Anderson Island
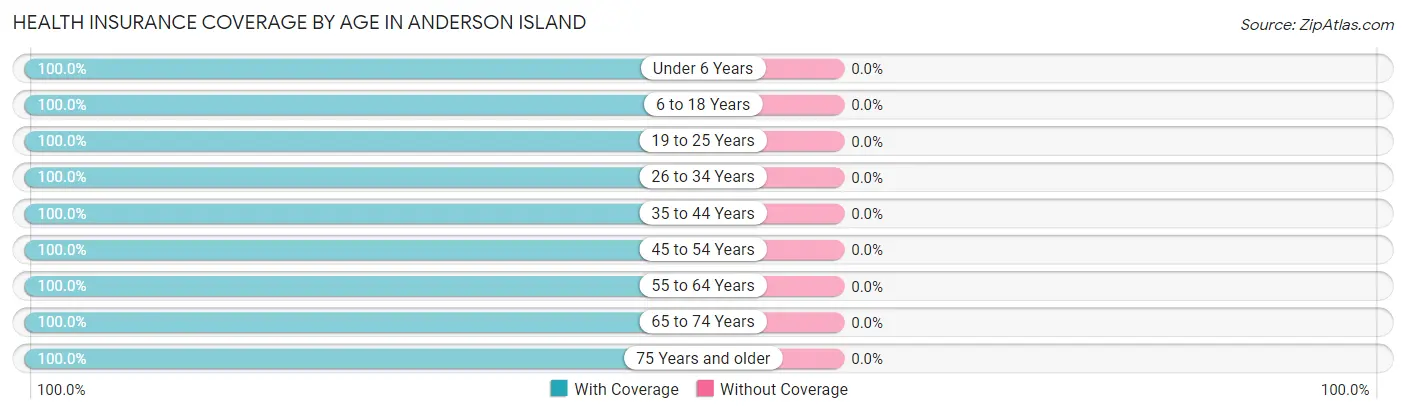
| Age Bracket | With Coverage | Without Coverage |
| Under 6 Years | 30 (100.0%) | 0 (0.0%) |
| 6 to 18 Years | 105 (100.0%) | 0 (0.0%) |
| 19 to 25 Years | 25 (100.0%) | 0 (0.0%) |
| 26 to 34 Years | 27 (100.0%) | 0 (0.0%) |
| 35 to 44 Years | 67 (100.0%) | 0 (0.0%) |
| 45 to 54 Years | 327 (100.0%) | 0 (0.0%) |
| 55 to 64 Years | 534 (100.0%) | 0 (0.0%) |
| 65 to 74 Years | 425 (100.0%) | 0 (0.0%) |
| 75 Years and older | 81 (100.0%) | 0 (0.0%) |
| Total | 1,621 (100.0%) | 0 (0.0%) |
Health Insurance Coverage by Citizenship Status in Anderson Island
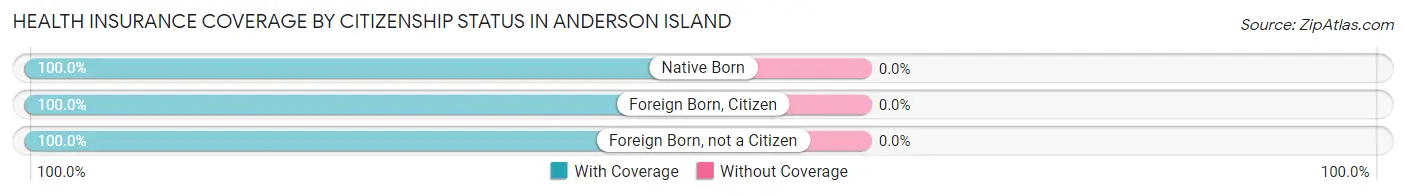
| Citizenship Status | With Coverage | Without Coverage |
| Native Born | 30 (100.0%) | 0 (0.0%) |
| Foreign Born, Citizen | 105 (100.0%) | 0 (0.0%) |
| Foreign Born, not a Citizen | 25 (100.0%) | 0 (0.0%) |
Health Insurance Coverage by Household Income in Anderson Island
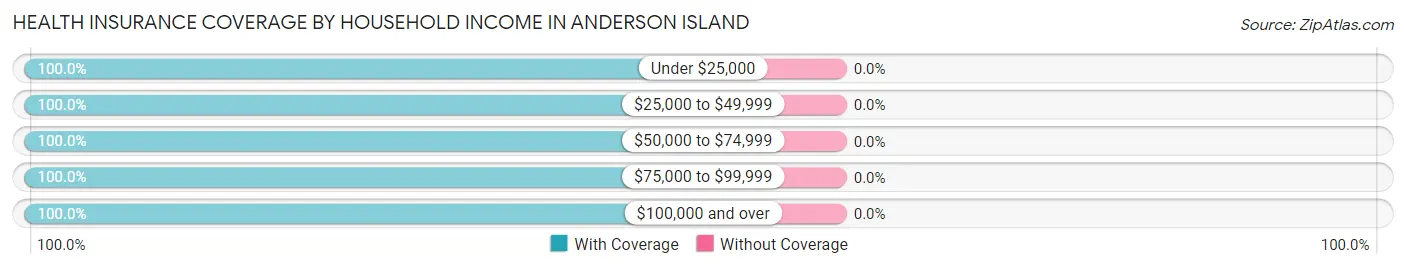
| Household Income | With Coverage | Without Coverage |
| Under $25,000 | 403 (100.0%) | 0 (0.0%) |
| $25,000 to $49,999 | 78 (100.0%) | 0 (0.0%) |
| $50,000 to $74,999 | 263 (100.0%) | 0 (0.0%) |
| $75,000 to $99,999 | 228 (100.0%) | 0 (0.0%) |
| $100,000 and over | 649 (100.0%) | 0 (0.0%) |
Public vs Private Health Insurance Coverage by Age in Anderson Island
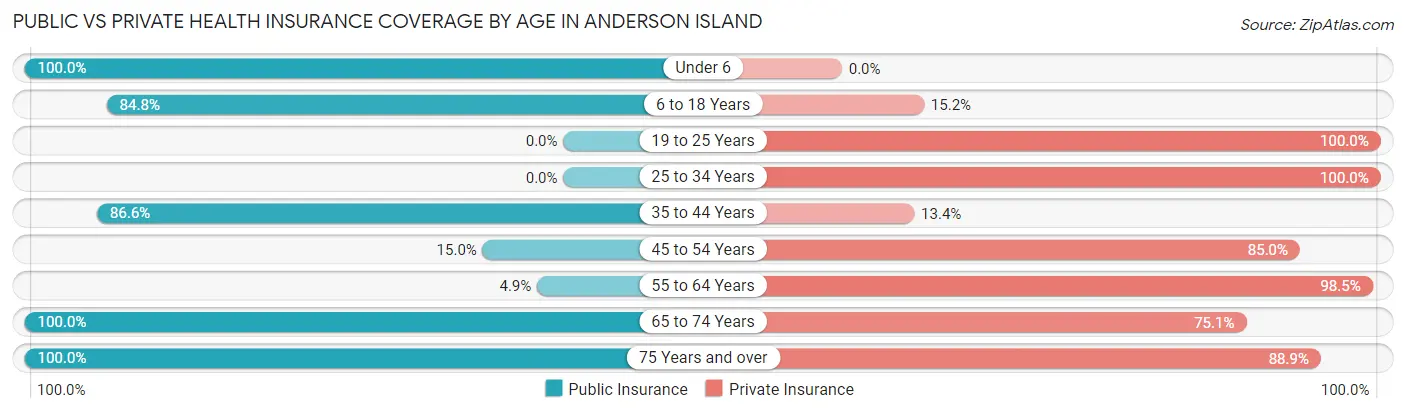
| Age Bracket | Public Insurance | Private Insurance |
| Under 6 | 30 (100.0%) | 0 (0.0%) |
| 6 to 18 Years | 89 (84.8%) | 16 (15.2%) |
| 19 to 25 Years | 0 (0.0%) | 25 (100.0%) |
| 25 to 34 Years | 0 (0.0%) | 27 (100.0%) |
| 35 to 44 Years | 58 (86.6%) | 9 (13.4%) |
| 45 to 54 Years | 49 (15.0%) | 278 (85.0%) |
| 55 to 64 Years | 26 (4.9%) | 526 (98.5%) |
| 65 to 74 Years | 425 (100.0%) | 319 (75.1%) |
| 75 Years and over | 81 (100.0%) | 72 (88.9%) |
| Total | 758 (46.8%) | 1,272 (78.5%) |
Disability Status by Sex by Age in Anderson Island
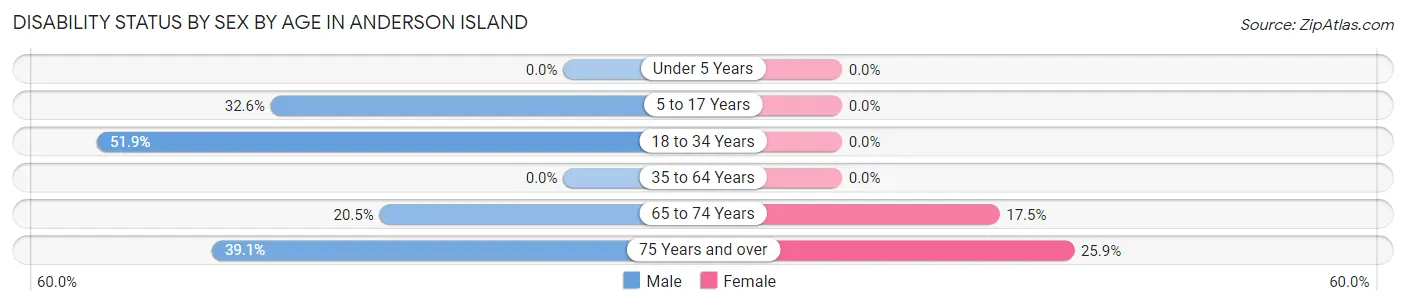
| Age Bracket | Male | Female |
| Under 5 Years | 0 (0.0%) | 0 (0.0%) |
| 5 to 17 Years | 29 (32.6%) | 0 (0.0%) |
| 18 to 34 Years | 27 (51.9%) | 0 (0.0%) |
| 35 to 64 Years | 0 (0.0%) | 0 (0.0%) |
| 65 to 74 Years | 52 (20.5%) | 30 (17.5%) |
| 75 Years and over | 9 (39.1%) | 15 (25.9%) |
Disability Class by Sex by Age in Anderson Island
Disability Class: Hearing Difficulty
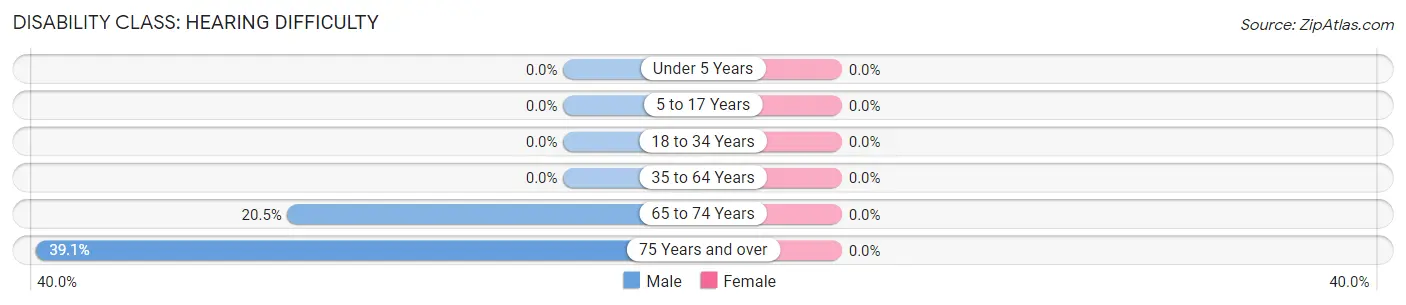
| Age Bracket | Male | Female |
| Under 5 Years | 0 (0.0%) | 0 (0.0%) |
| 5 to 17 Years | 0 (0.0%) | 0 (0.0%) |
| 18 to 34 Years | 0 (0.0%) | 0 (0.0%) |
| 35 to 64 Years | 0 (0.0%) | 0 (0.0%) |
| 65 to 74 Years | 52 (20.5%) | 0 (0.0%) |
| 75 Years and over | 9 (39.1%) | 0 (0.0%) |
Disability Class: Vision Difficulty
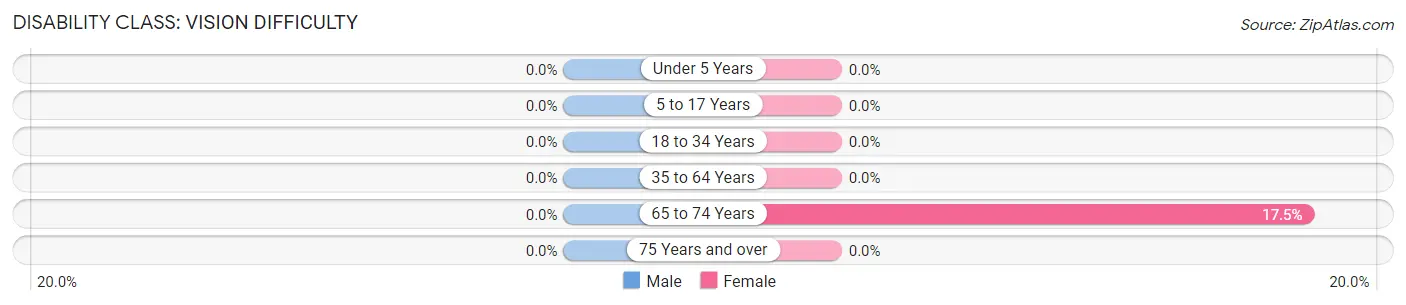
| Age Bracket | Male | Female |
| Under 5 Years | 0 (0.0%) | 0 (0.0%) |
| 5 to 17 Years | 0 (0.0%) | 0 (0.0%) |
| 18 to 34 Years | 0 (0.0%) | 0 (0.0%) |
| 35 to 64 Years | 0 (0.0%) | 0 (0.0%) |
| 65 to 74 Years | 0 (0.0%) | 30 (17.5%) |
| 75 Years and over | 0 (0.0%) | 0 (0.0%) |
Disability Class: Cognitive Difficulty
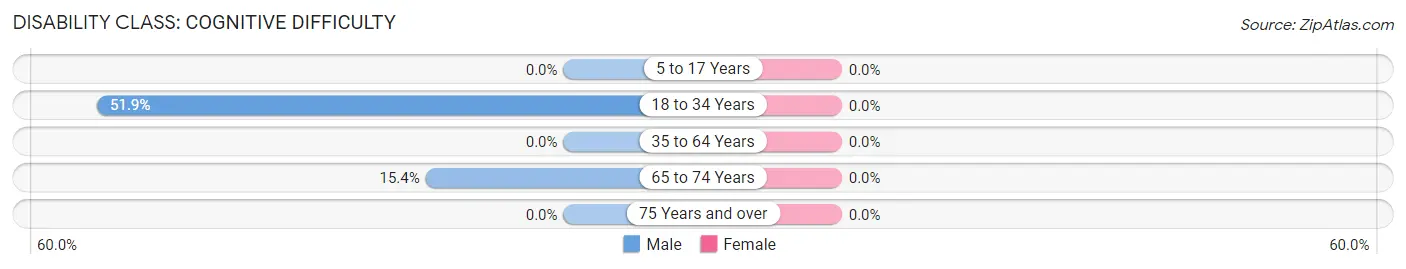
| Age Bracket | Male | Female |
| 5 to 17 Years | 0 (0.0%) | 0 (0.0%) |
| 18 to 34 Years | 27 (51.9%) | 0 (0.0%) |
| 35 to 64 Years | 0 (0.0%) | 0 (0.0%) |
| 65 to 74 Years | 39 (15.3%) | 0 (0.0%) |
| 75 Years and over | 0 (0.0%) | 0 (0.0%) |
Disability Class: Ambulatory Difficulty
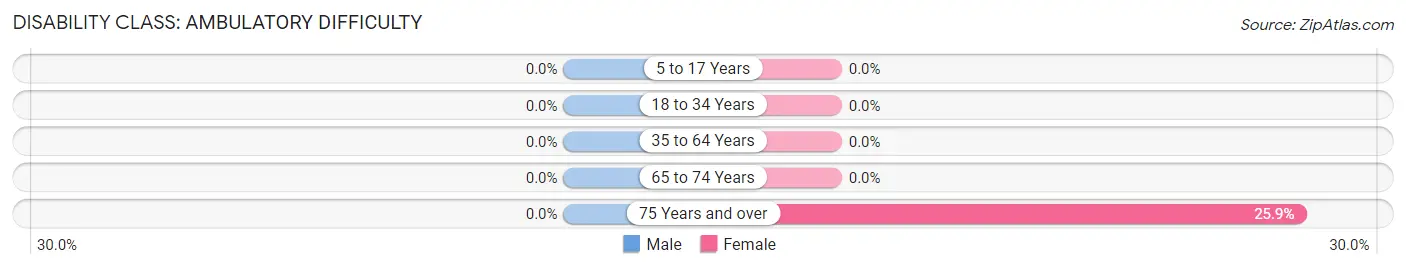
| Age Bracket | Male | Female |
| 5 to 17 Years | 0 (0.0%) | 0 (0.0%) |
| 18 to 34 Years | 0 (0.0%) | 0 (0.0%) |
| 35 to 64 Years | 0 (0.0%) | 0 (0.0%) |
| 65 to 74 Years | 0 (0.0%) | 0 (0.0%) |
| 75 Years and over | 0 (0.0%) | 15 (25.9%) |
Disability Class: Self-Care Difficulty
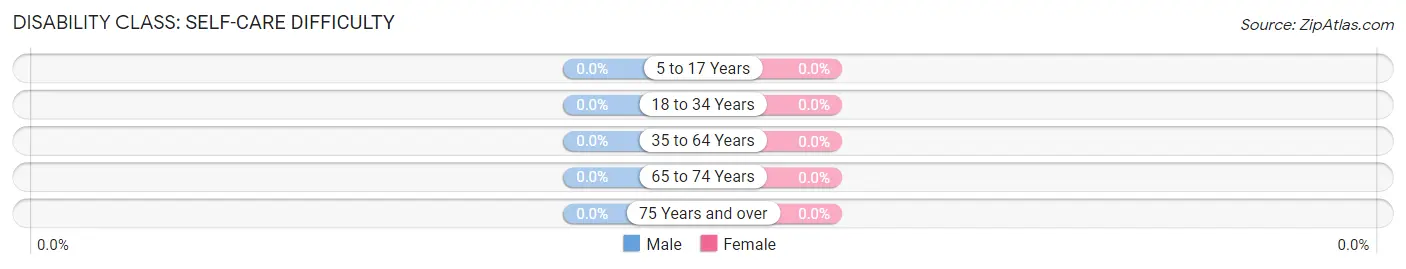
| Age Bracket | Male | Female |
| 5 to 17 Years | 0 (0.0%) | 0 (0.0%) |
| 18 to 34 Years | 0 (0.0%) | 0 (0.0%) |
| 35 to 64 Years | 0 (0.0%) | 0 (0.0%) |
| 65 to 74 Years | 0 (0.0%) | 0 (0.0%) |
| 75 Years and over | 0 (0.0%) | 0 (0.0%) |
Technology Access in Anderson Island
Computing Device Access in Anderson Island
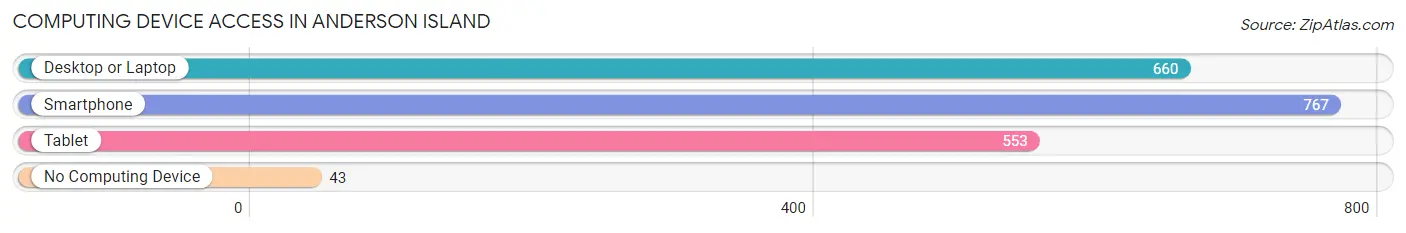
| Device Type | # Households | % Households |
| Desktop or Laptop | 660 | 80.0% |
| Smartphone | 767 | 93.0% |
| Tablet | 553 | 67.0% |
| No Computing Device | 43 | 5.2% |
| Total | 825 | 100.0% |
Internet Access in Anderson Island
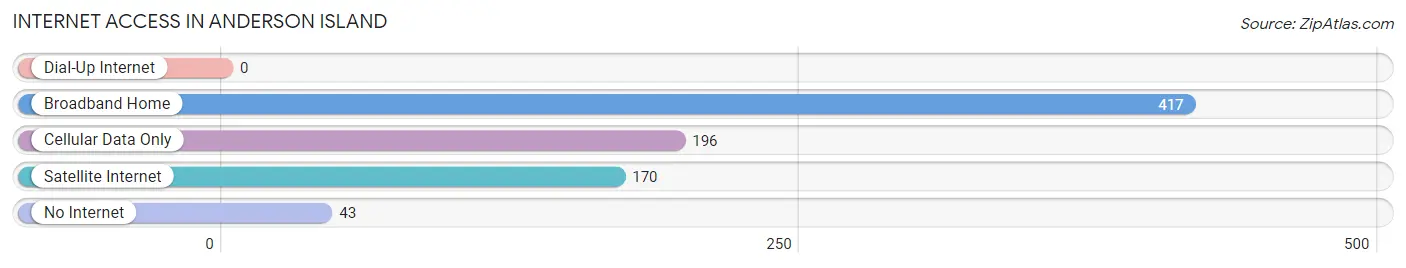
| Internet Type | # Households | % Households |
| Dial-Up Internet | 0 | 0.0% |
| Broadband Home | 417 | 50.5% |
| Cellular Data Only | 196 | 23.8% |
| Satellite Internet | 170 | 20.6% |
| No Internet | 43 | 5.2% |
| Total | 825 | 100.0% |
Anderson Island Summary
Introduction
Anderson Island is a small island located in the southern part of Puget Sound in Washington State. It is the southernmost island in the Puget Sound and is part of Pierce County. The island is approximately 8.5 square miles in size and is home to approximately 1,500 people. It is a popular destination for tourists and locals alike, offering a variety of activities and attractions.
History
The first known inhabitants of Anderson Island were the Nisqually people, who lived on the island for thousands of years before the arrival of European settlers. The island was named after Captain George Anderson, who was the first European to explore the island in 1841. In 1853, the island was officially claimed by the United States government and was later incorporated into Pierce County in 1854.
In the late 19th century, the island was home to a number of logging and fishing operations. The island was also home to a number of resorts and vacation homes, which attracted tourists from around the region. In the early 20th century, the island was home to a number of small farms and orchards.
Geography
Anderson Island is located in the southern part of Puget Sound, approximately 8.5 square miles in size. The island is surrounded by the waters of the Puget Sound and is connected to the mainland by a bridge. The island is mostly flat, with a few hills and valleys. The highest point on the island is approximately 200 feet above sea level.
The island is home to a variety of wildlife, including deer, rabbits, raccoons, and a variety of birds. The island is also home to a number of freshwater lakes, including Lake Florence, Lake Josephine, and Lake Louise.
Economy
The economy of Anderson Island is largely based on tourism and recreation. The island is home to a number of resorts and vacation homes, which attract tourists from around the region. The island is also home to a number of small businesses, including restaurants, shops, and marinas.
The island is also home to a number of small farms and orchards, which produce a variety of fruits and vegetables. Fishing is also an important part of the island’s economy, with a number of commercial fishing operations located on the island.
Demographics
As of the 2010 census, the population of Anderson Island was 1,500. The population is largely white (94.7%), with a small percentage of African Americans (2.3%) and Native Americans (1.3%). The median household income is $50,000, and the median age is 44.
Conclusion
Anderson Island is a small island located in the southern part of Puget Sound in Washington State. It is the southernmost island in the Puget Sound and is part of Pierce County. The island is approximately 8.5 square miles in size and is home to approximately 1,500 people. The economy of Anderson Island is largely based on tourism and recreation, with a number of resorts and vacation homes located on the island. The population is largely white, with a median household income of $50,000 and a median age of 44.
Common Questions
What is Per Capita Income in Anderson Island?
Per Capita income in Anderson Island is $73,851.
What is the Median Family Income in Anderson Island?
Median Family Income in Anderson Island is $94,920.
What is the Median Household income in Anderson Island?
Median Household Income in Anderson Island is $92,933.
What is Inequality or Gini Index in Anderson Island?
Inequality or Gini Index in Anderson Island is 0.63.
What is the Total Population of Anderson Island?
Total Population of Anderson Island is 1,621.
What is the Total Male Population of Anderson Island?
Total Male Population of Anderson Island is 887.
What is the Total Female Population of Anderson Island?
Total Female Population of Anderson Island is 734.
What is the Ratio of Males per 100 Females in Anderson Island?
There are 120.84 Males per 100 Females in Anderson Island.
What is the Ratio of Females per 100 Males in Anderson Island?
There are 82.75 Females per 100 Males in Anderson Island.
What is the Median Population Age in Anderson Island?
Median Population Age in Anderson Island is 60.2 Years.
What is the Average Family Size in Anderson Island
Average Family Size in Anderson Island is 2.4 People.
What is the Average Household Size in Anderson Island
Average Household Size in Anderson Island is 2.0 People.
How Large is the Labor Force in Anderson Island?
There are 576 People in the Labor Forcein in Anderson Island.
What is the Percentage of People in the Labor Force in Anderson Island?
38.0% of People are in the Labor Force in Anderson Island.