San Geronimo, CA Map & Demographics
San Geronimo Map
San Geronimo Overview
$115,881
PER CAPITA INCOME
$250,001
AVG FAMILY INCOME
$217,375
AVG HOUSEHOLD INCOME
0.43
INEQUALITY / GINI INDEX
427
TOTAL POPULATION
252
MALE POPULATION
175
FEMALE POPULATION
144.00
MALES / 100 FEMALES
69.44
FEMALES / 100 MALES
46.1
MEDIAN AGE
3.9
AVG FAMILY SIZE
3.0
AVG HOUSEHOLD SIZE
226
LABOR FORCE [ PEOPLE ]
59.6%
PERCENT IN LABOR FORCE
San Geronimo Zip Codes
Income in San Geronimo
Income Overview in San Geronimo
Per Capita Income in San Geronimo is $115,881, while median incomes of families and households are $250,001 and $217,375 respectively.
| Characteristic | Number | Measure |
| Per Capita Income | 427 | $115,881 |
| Median Family Income | 100 | $250,001 |
| Mean Family Income | 100 | $437,354 |
| Median Household Income | 141 | $217,375 |
| Mean Household Income | 141 | $347,862 |
| Income Deficit | 100 | $0 |
| Wage / Income Gap (%) | 427 | 0.00% |
| Wage / Income Gap ($) | 427 | 100.00¢ per $1 |
| Gini / Inequality Index | 427 | 0.43 |
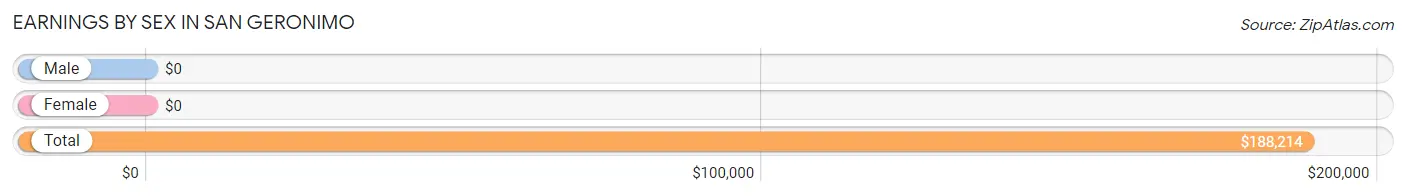
Earnings by Sex in San Geronimo
| Sex | Number | Average Earnings |
| Male | 131 (58.0%) | $0 |
| Female | 95 (42.0%) | $0 |
| Total | 226 (100.0%) | $188,214 |
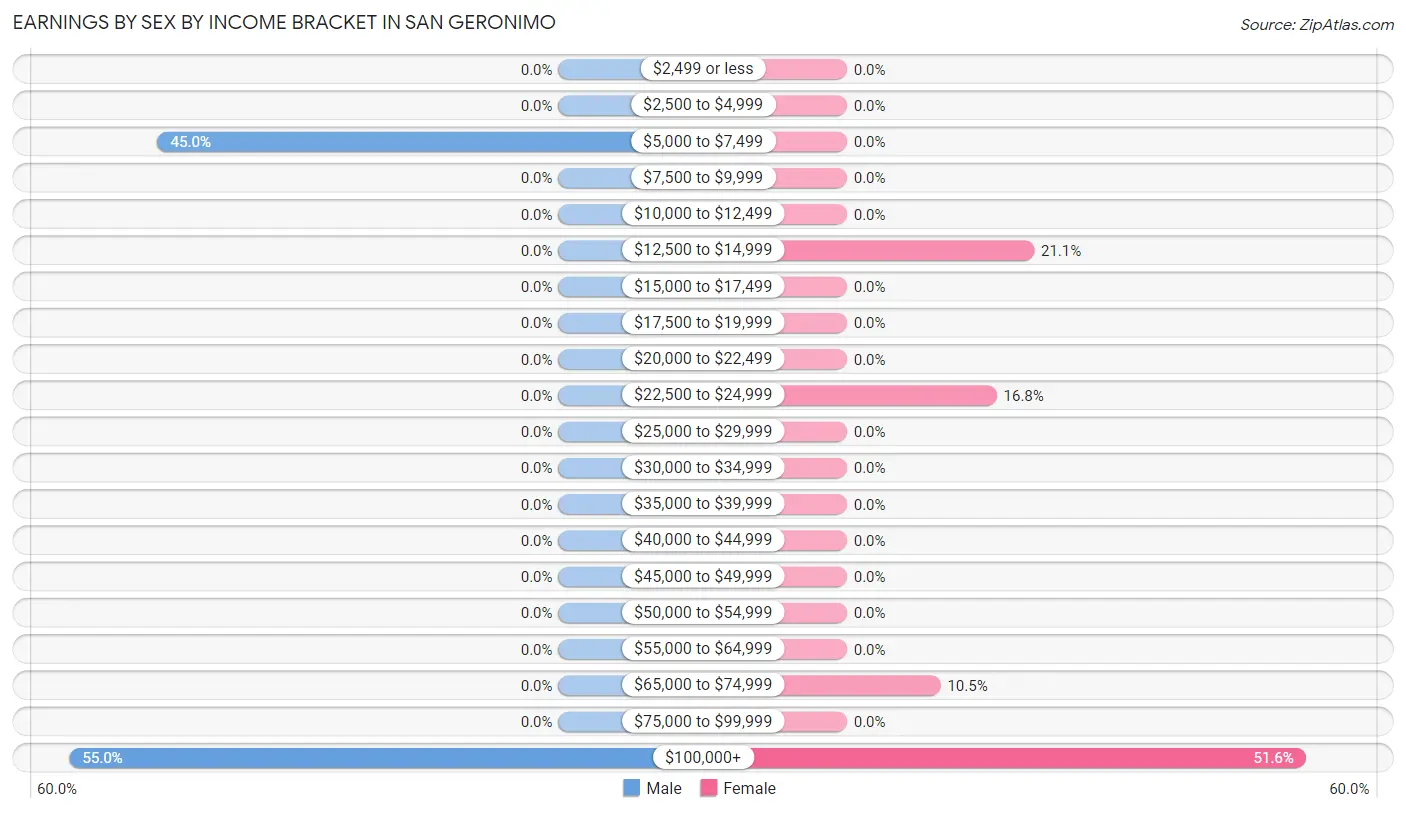
Earnings by Sex by Income Bracket in San Geronimo
The most common earnings brackets in San Geronimo are $100,000+ for men (72 | 55.0%) and $100,000+ for women (49 | 51.6%).
| Income | Male | Female |
| $2,499 or less | 0 (0.0%) | 0 (0.0%) |
| $2,500 to $4,999 | 0 (0.0%) | 0 (0.0%) |
| $5,000 to $7,499 | 59 (45.0%) | 0 (0.0%) |
| $7,500 to $9,999 | 0 (0.0%) | 0 (0.0%) |
| $10,000 to $12,499 | 0 (0.0%) | 0 (0.0%) |
| $12,500 to $14,999 | 0 (0.0%) | 20 (21.0%) |
| $15,000 to $17,499 | 0 (0.0%) | 0 (0.0%) |
| $17,500 to $19,999 | 0 (0.0%) | 0 (0.0%) |
| $20,000 to $22,499 | 0 (0.0%) | 0 (0.0%) |
| $22,500 to $24,999 | 0 (0.0%) | 16 (16.8%) |
| $25,000 to $29,999 | 0 (0.0%) | 0 (0.0%) |
| $30,000 to $34,999 | 0 (0.0%) | 0 (0.0%) |
| $35,000 to $39,999 | 0 (0.0%) | 0 (0.0%) |
| $40,000 to $44,999 | 0 (0.0%) | 0 (0.0%) |
| $45,000 to $49,999 | 0 (0.0%) | 0 (0.0%) |
| $50,000 to $54,999 | 0 (0.0%) | 0 (0.0%) |
| $55,000 to $64,999 | 0 (0.0%) | 0 (0.0%) |
| $65,000 to $74,999 | 0 (0.0%) | 10 (10.5%) |
| $75,000 to $99,999 | 0 (0.0%) | 0 (0.0%) |
| $100,000+ | 72 (55.0%) | 49 (51.6%) |
| Total | 131 (100.0%) | 95 (100.0%) |
Earnings by Sex by Educational Attainment in San Geronimo
| Educational Attainment | Male Income | Female Income |
| Less than High School | - | - |
| High School Diploma | - | - |
| College or Associate's Degree | - | - |
| Bachelor's Degree | - | - |
| Graduate Degree | - | - |
| Total | $250,001 | $0 |
Family Income in San Geronimo
Family Income Brackets in San Geronimo
According to the San Geronimo family income data, there are 80 families falling into the $200,000+ income range, which is the most common income bracket and makes up 80.0% of all families.
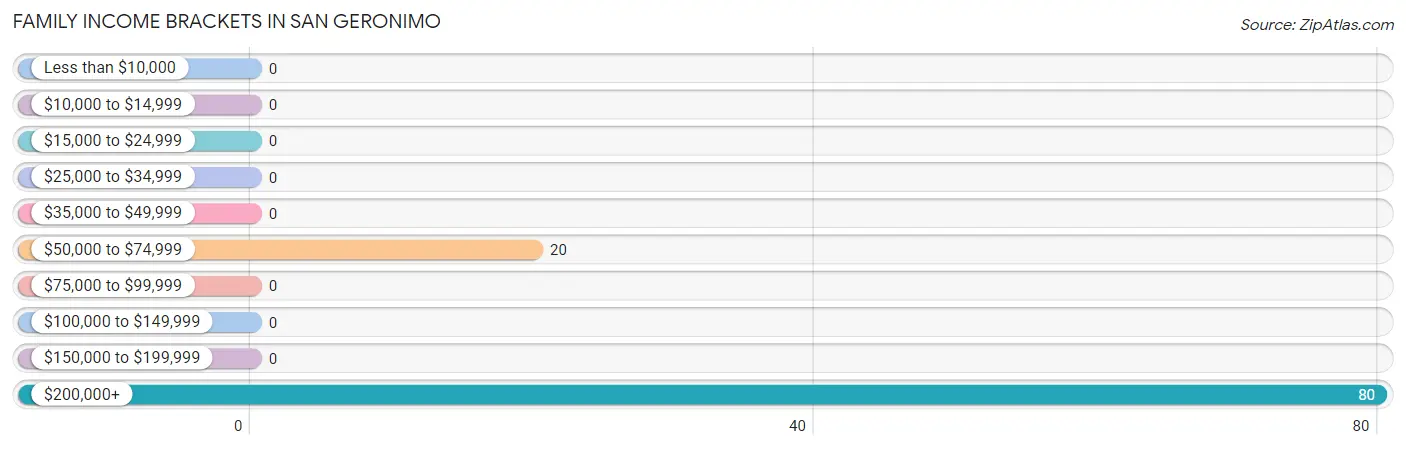
| Income Bracket | # Families | % Families |
| Less than $10,000 | 0 | 0.0% |
| $10,000 to $14,999 | 0 | 0.0% |
| $15,000 to $24,999 | 0 | 0.0% |
| $25,000 to $34,999 | 0 | 0.0% |
| $35,000 to $49,999 | 0 | 0.0% |
| $50,000 to $74,999 | 20 | 20.0% |
| $75,000 to $99,999 | 0 | 0.0% |
| $100,000 to $149,999 | 0 | 0.0% |
| $150,000 to $199,999 | 0 | 0.0% |
| $200,000+ | 80 | 80.0% |
Family Income by Famaliy Size in San Geronimo
4-person families (70 | 70.0%) account for the highest median family income in San Geronimo with $250,001 per family, while 4-person families (70 | 70.0%) have the highest median income of $62,500 per family member.
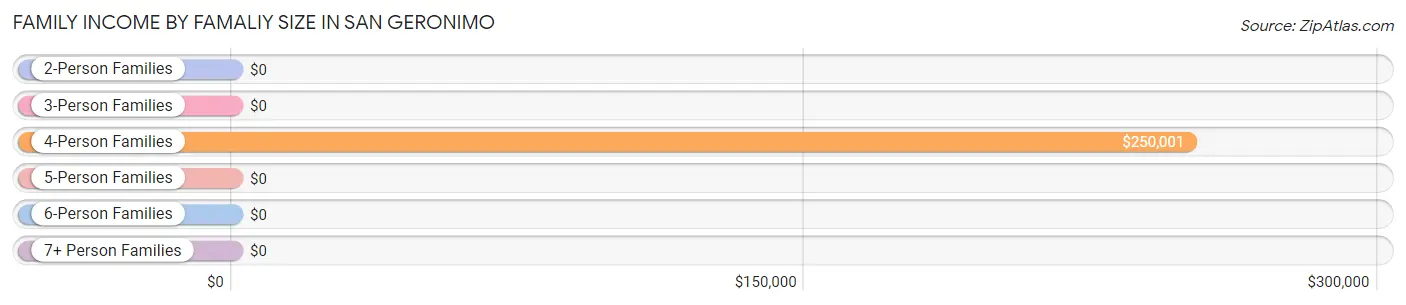
| Income Bracket | # Families | Median Income |
| 2-Person Families | 30 (30.0%) | $0 |
| 3-Person Families | 0 (0.0%) | $0 |
| 4-Person Families | 70 (70.0%) | $250,001 |
| 5-Person Families | 0 (0.0%) | $0 |
| 6-Person Families | 0 (0.0%) | $0 |
| 7+ Person Families | 0 (0.0%) | $0 |
| Total | 100 (100.0%) | $250,001 |
Family Income by Number of Earners in San Geronimo
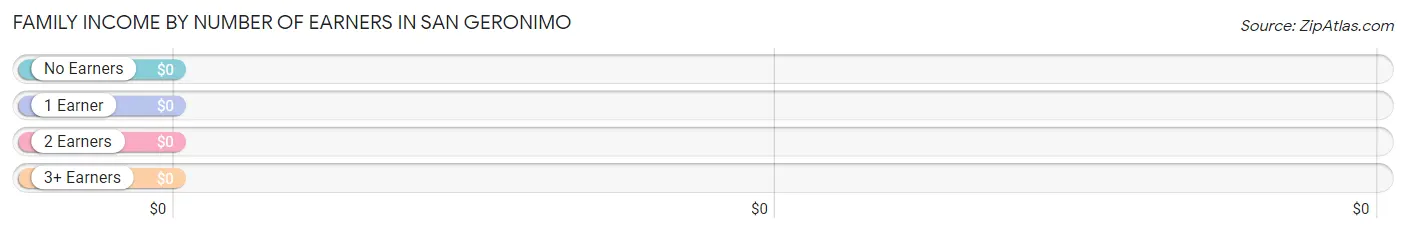
| Number of Earners | # Families | Median Income |
| No Earners | 20 (20.0%) | $0 |
| 1 Earner | 10 (10.0%) | $0 |
| 2 Earners | 43 (43.0%) | $0 |
| 3+ Earners | 27 (27.0%) | $0 |
| Total | 100 (100.0%) | $250,001 |
Household Income in San Geronimo
Household Income Brackets in San Geronimo
With 80 households falling in the category, the $200,000+ income range is the most frequent in San Geronimo, accounting for 56.7% of all households.
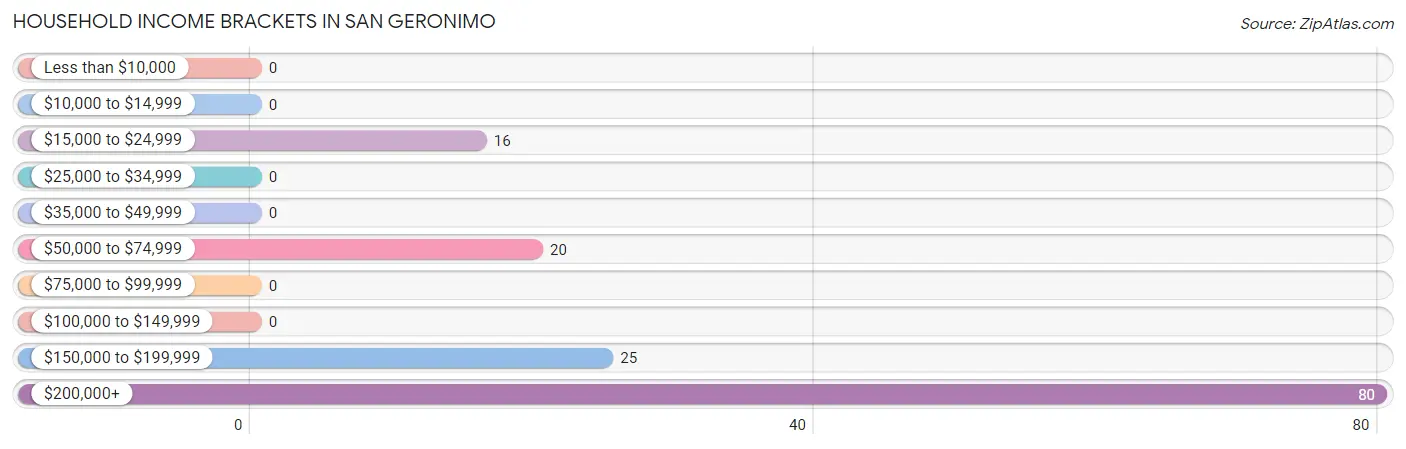
| Income Bracket | # Households | % Households |
| Less than $10,000 | 0 | 0.0% |
| $10,000 to $14,999 | 0 | 0.0% |
| $15,000 to $24,999 | 16 | 11.3% |
| $25,000 to $34,999 | 0 | 0.0% |
| $35,000 to $49,999 | 0 | 0.0% |
| $50,000 to $74,999 | 20 | 14.2% |
| $75,000 to $99,999 | 0 | 0.0% |
| $100,000 to $149,999 | 0 | 0.0% |
| $150,000 to $199,999 | 25 | 17.7% |
| $200,000+ | 80 | 56.7% |
Household Income by Householder Age in San Geronimo
The median household income in San Geronimo is $217,375, with the highest median household income of $250,001 found in the 45 to 64 years age bracket for the primary householder. A total of 70 households (49.6%) fall into this category.
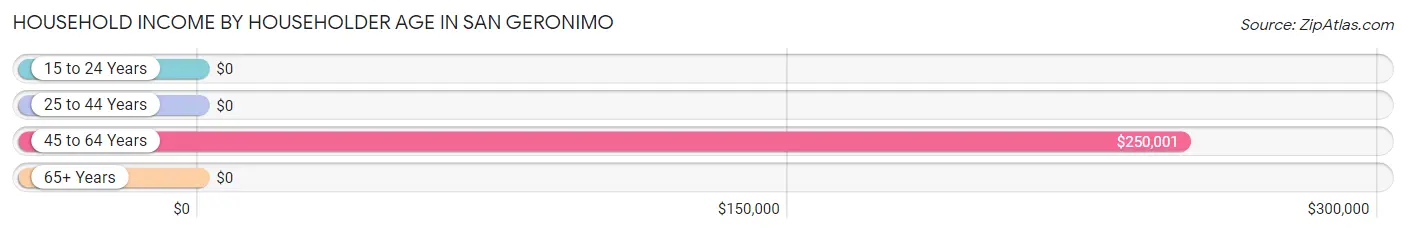
| Income Bracket | # Households | Median Income |
| 15 to 24 Years | 0 (0.0%) | $0 |
| 25 to 44 Years | 16 (11.4%) | $0 |
| 45 to 64 Years | 70 (49.6%) | $250,001 |
| 65+ Years | 55 (39.0%) | $0 |
| Total | 141 (100.0%) | $217,375 |
Poverty in San Geronimo
Income Below Poverty by Sex and Age in San Geronimo
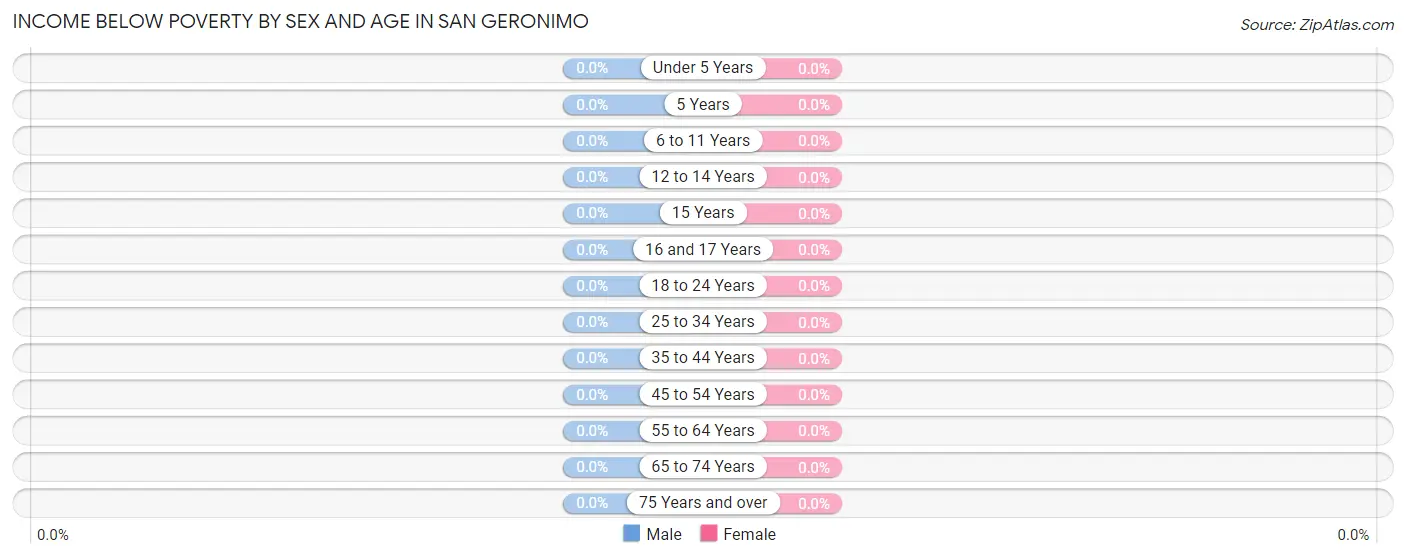
| Age Bracket | Male | Female |
| Under 5 Years | 0 (0.0%) | 0 (0.0%) |
| 5 Years | 0 (0.0%) | 0 (0.0%) |
| 6 to 11 Years | 0 (0.0%) | 0 (0.0%) |
| 12 to 14 Years | 0 (0.0%) | 0 (0.0%) |
| 15 Years | 0 (0.0%) | 0 (0.0%) |
| 16 and 17 Years | 0 (0.0%) | 0 (0.0%) |
| 18 to 24 Years | 0 (0.0%) | 0 (0.0%) |
| 25 to 34 Years | 0 (0.0%) | 0 (0.0%) |
| 35 to 44 Years | 0 (0.0%) | 0 (0.0%) |
| 45 to 54 Years | 0 (0.0%) | 0 (0.0%) |
| 55 to 64 Years | 0 (0.0%) | 0 (0.0%) |
| 65 to 74 Years | 0 (0.0%) | 0 (0.0%) |
| 75 Years and over | 0 (0.0%) | 0 (0.0%) |
| Total | 0 (0.0%) | 0 (0.0%) |
Income Above Poverty by Sex and Age in San Geronimo
According to the poverty statistics in San Geronimo, males aged 12 to 14 years and females aged 15 years are the age groups that are most secure financially, with 100.0% of males and 100.0% of females in these age groups living above the poverty line.
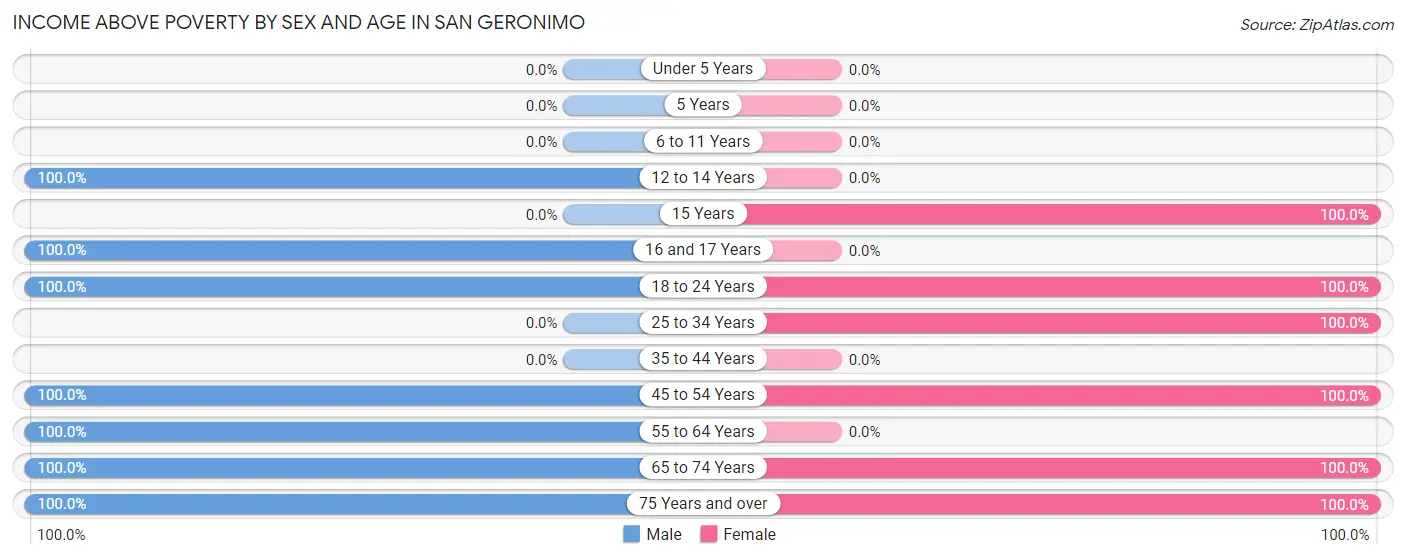
| Age Bracket | Male | Female |
| Under 5 Years | 0 (0.0%) | 0 (0.0%) |
| 5 Years | 0 (0.0%) | 0 (0.0%) |
| 6 to 11 Years | 0 (0.0%) | 0 (0.0%) |
| 12 to 14 Years | 22 (100.0%) | 0 (0.0%) |
| 15 Years | 0 (0.0%) | 25 (100.0%) |
| 16 and 17 Years | 45 (100.0%) | 0 (0.0%) |
| 18 to 24 Years | 59 (100.0%) | 34 (100.0%) |
| 25 to 34 Years | 0 (0.0%) | 16 (100.0%) |
| 35 to 44 Years | 0 (0.0%) | 0 (0.0%) |
| 45 to 54 Years | 51 (100.0%) | 69 (100.0%) |
| 55 to 64 Years | 21 (100.0%) | 0 (0.0%) |
| 65 to 74 Years | 35 (100.0%) | 10 (100.0%) |
| 75 Years and over | 19 (100.0%) | 20 (100.0%) |
| Total | 252 (100.0%) | 174 (100.0%) |
Income Below Poverty Among Married-Couple Families in San Geronimo
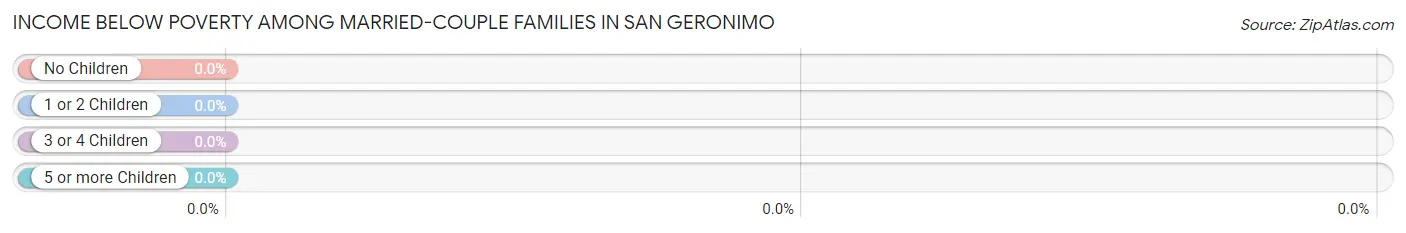
| Children | Above Poverty | Below Poverty |
| No Children | 30 (100.0%) | 0 (0.0%) |
| 1 or 2 Children | 70 (100.0%) | 0 (0.0%) |
| 3 or 4 Children | 0 (0.0%) | 0 (0.0%) |
| 5 or more Children | 0 (0.0%) | 0 (0.0%) |
| Total | 100 (100.0%) | 0 (0.0%) |
Income Below Poverty Among Single-Parent Households in San Geronimo
| Children | Single Father | Single Mother |
| No Children | 0 (0.0%) | 0 (0.0%) |
| 1 or 2 Children | 0 (0.0%) | 0 (0.0%) |
| 3 or 4 Children | 0 (0.0%) | 0 (0.0%) |
| 5 or more Children | 0 (0.0%) | 0 (0.0%) |
| Total | 0 (0.0%) | 0 (0.0%) |
Income Below Poverty Among Married-Couple vs Single-Parent Households in San Geronimo
| Children | Married-Couple Families | Single-Parent Households |
| No Children | 0 (0.0%) | 0 (0.0%) |
| 1 or 2 Children | 0 (0.0%) | 0 (0.0%) |
| 3 or 4 Children | 0 (0.0%) | 0 (0.0%) |
| 5 or more Children | 0 (0.0%) | 0 (0.0%) |
| Total | 0 (0.0%) | 0 (0.0%) |
Race in San Geronimo
The most populous races in San Geronimo are White / Caucasian (427 | 100.0%), and Hispanic or Latino (16 | 3.7%).
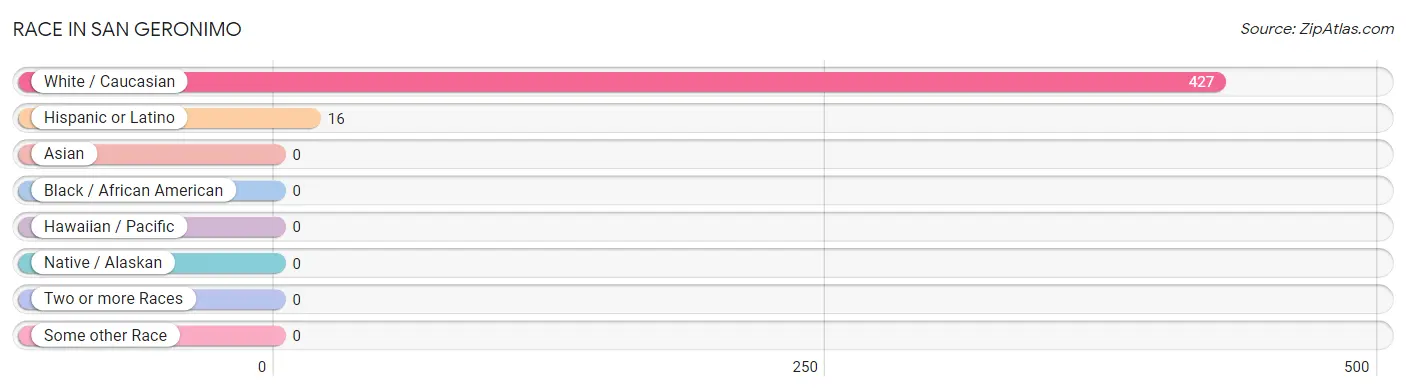
| Race | # Population | % Population |
| Asian | 0 | 0.0% |
| Black / African American | 0 | 0.0% |
| Hawaiian / Pacific | 0 | 0.0% |
| Hispanic or Latino | 16 | 3.7% |
| Native / Alaskan | 0 | 0.0% |
| White / Caucasian | 427 | 100.0% |
| Two or more Races | 0 | 0.0% |
| Some other Race | 0 | 0.0% |
| Total | 427 | 100.0% |
Ancestry in San Geronimo
The most populous ancestries reported in San Geronimo are Russian (140 | 32.8%), English (69 | 16.2%), German (62 | 14.5%), Irish (23 | 5.4%), and French Canadian (20 | 4.7%), together accounting for 73.5% of all San Geronimo residents.
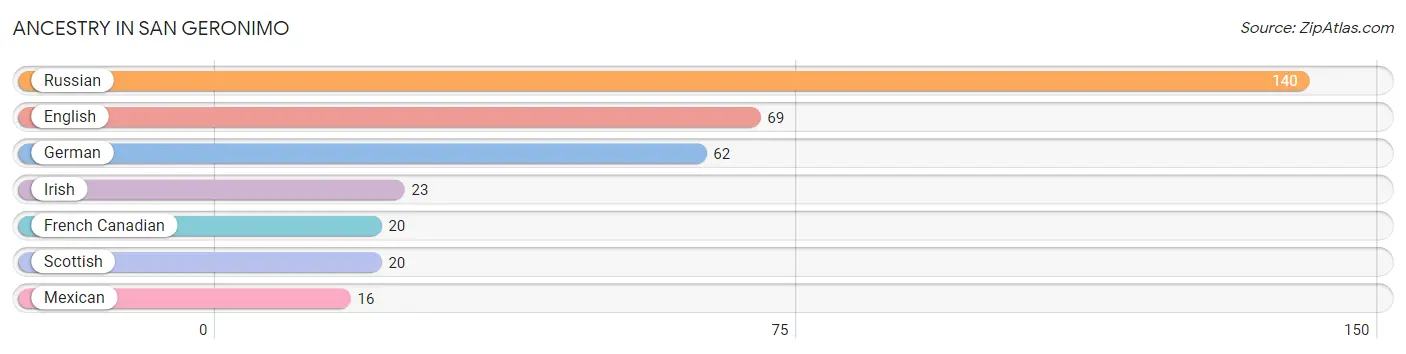
| Ancestry | # Population | % Population |
| English | 69 | 16.2% |
| French Canadian | 20 | 4.7% |
| German | 62 | 14.5% |
| Irish | 23 | 5.4% |
| Mexican | 16 | 3.7% |
| Russian | 140 | 32.8% |
| Scottish | 20 | 4.7% | View All 7 Rows |
Immigrants in San Geronimo
The most numerous immigrant groups reported in San Geronimo came from Europe (74 | 17.3%), Eastern Europe (55 | 12.9%), Russia (55 | 12.9%), Germany (19 | 4.4%), and Western Europe (19 | 4.4%), together accounting for 52.0% of all San Geronimo residents.
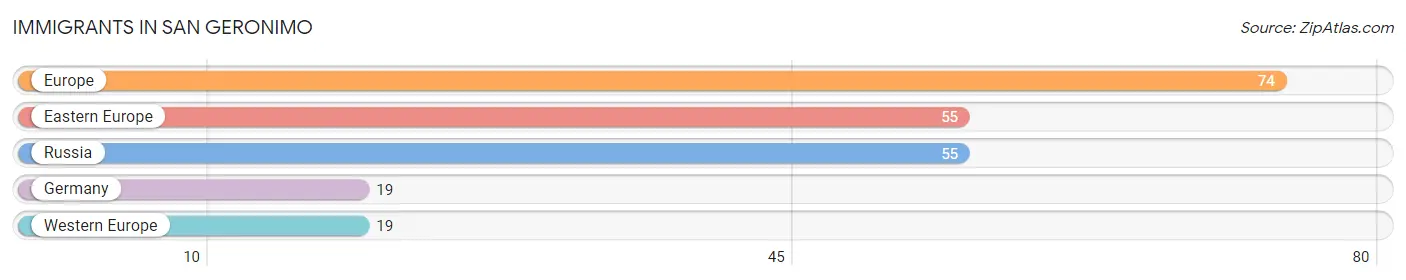
| Immigration Origin | # Population | % Population |
| Eastern Europe | 55 | 12.9% |
| Europe | 74 | 17.3% |
| Germany | 19 | 4.4% |
| Russia | 55 | 12.9% |
| Western Europe | 19 | 4.4% | View All 5 Rows |
Sex and Age in San Geronimo
Sex and Age in San Geronimo
The most populous age groups in San Geronimo are 20 to 24 Years (59 | 23.4%) for men and 15 to 19 Years (59 | 33.7%) for women.
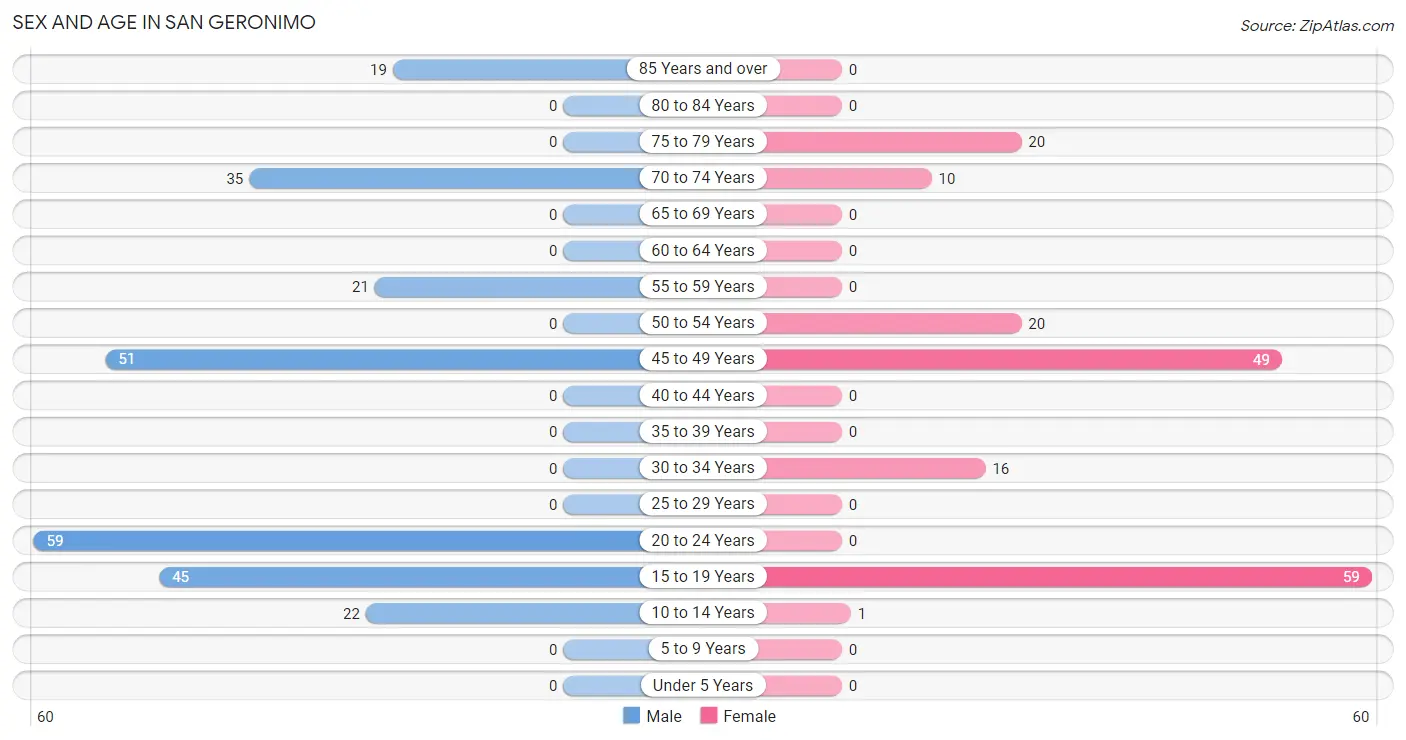
| Age Bracket | Male | Female |
| Under 5 Years | 0 (0.0%) | 0 (0.0%) |
| 5 to 9 Years | 0 (0.0%) | 0 (0.0%) |
| 10 to 14 Years | 22 (8.7%) | 1 (0.6%) |
| 15 to 19 Years | 45 (17.9%) | 59 (33.7%) |
| 20 to 24 Years | 59 (23.4%) | 0 (0.0%) |
| 25 to 29 Years | 0 (0.0%) | 0 (0.0%) |
| 30 to 34 Years | 0 (0.0%) | 16 (9.1%) |
| 35 to 39 Years | 0 (0.0%) | 0 (0.0%) |
| 40 to 44 Years | 0 (0.0%) | 0 (0.0%) |
| 45 to 49 Years | 51 (20.2%) | 49 (28.0%) |
| 50 to 54 Years | 0 (0.0%) | 20 (11.4%) |
| 55 to 59 Years | 21 (8.3%) | 0 (0.0%) |
| 60 to 64 Years | 0 (0.0%) | 0 (0.0%) |
| 65 to 69 Years | 0 (0.0%) | 0 (0.0%) |
| 70 to 74 Years | 35 (13.9%) | 10 (5.7%) |
| 75 to 79 Years | 0 (0.0%) | 20 (11.4%) |
| 80 to 84 Years | 0 (0.0%) | 0 (0.0%) |
| 85 Years and over | 19 (7.5%) | 0 (0.0%) |
| Total | 252 (100.0%) | 175 (100.0%) |
Families and Households in San Geronimo
Median Family Size in San Geronimo
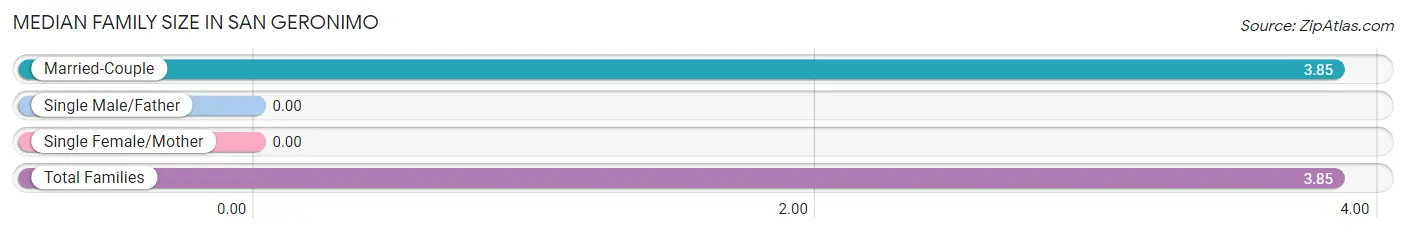
| Family Type | # Families | Family Size |
| Married-Couple | 100 (100.0%) | 3.85 |
| Single Male/Father | 0 (0.0%) | - |
| Single Female/Mother | 0 (0.0%) | - |
| Total Families | 100 (100.0%) | 3.85 |
Median Household Size in San Geronimo
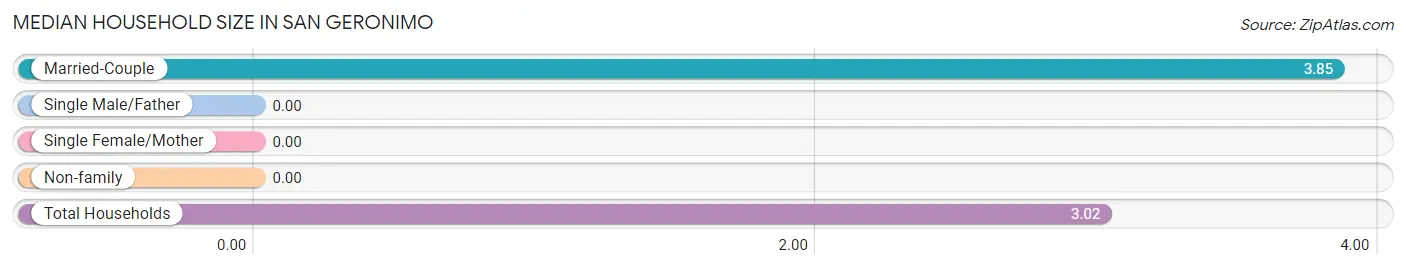
| Household Type | # Households | Household Size |
| Married-Couple | 100 (70.9%) | 3.85 |
| Single Male/Father | 0 (0.0%) | - |
| Single Female/Mother | 0 (0.0%) | - |
| Non-family | 41 (29.1%) | - |
| Total Households | 141 (100.0%) | 3.02 |
Household Size by Marriage Status in San Geronimo
Out of a total of 141 households in San Geronimo, 100 (70.9%) are family households, while 41 (29.1%) are nonfamily households. The most numerous type of family households are 4-person households, comprising 70, and the most common type of nonfamily households are 1-person households, comprising 41.
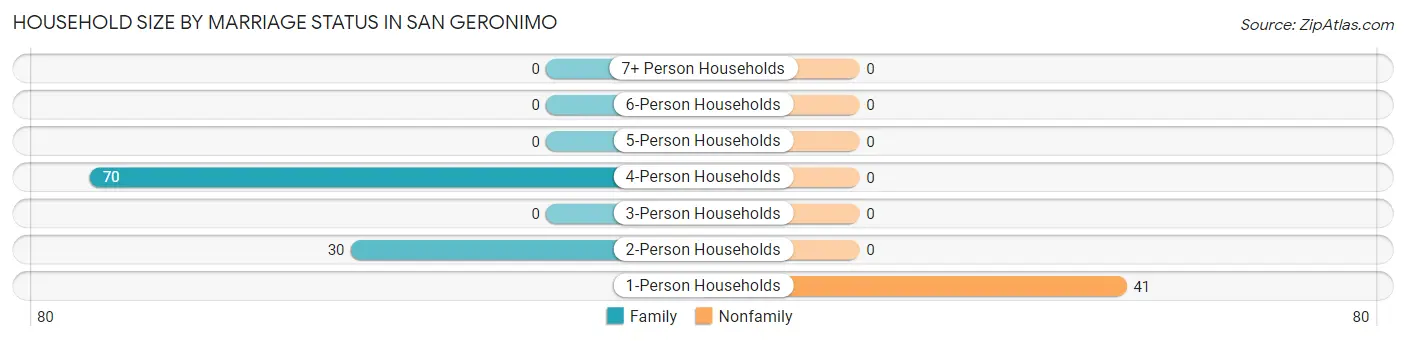
| Household Size | Family Households | Nonfamily Households |
| 1-Person Households | - | 41 (29.1%) |
| 2-Person Households | 30 (21.3%) | 0 (0.0%) |
| 3-Person Households | 0 (0.0%) | 0 (0.0%) |
| 4-Person Households | 70 (49.6%) | 0 (0.0%) |
| 5-Person Households | 0 (0.0%) | 0 (0.0%) |
| 6-Person Households | 0 (0.0%) | 0 (0.0%) |
| 7+ Person Households | 0 (0.0%) | 0 (0.0%) |
| Total | 100 (70.9%) | 41 (29.1%) |
Female Fertility in San Geronimo
Fertility by Age in San Geronimo
| Age Bracket | Women with Births | Births / 1,000 Women |
| 15 to 19 years | 0 (0.0%) | 0.0 |
| 20 to 34 years | 0 (0.0%) | 0.0 |
| 35 to 50 years | 0 (0.0%) | 0.0 |
| Total | 0 (0.0%) | 0.0 |
Fertility by Age by Marriage Status in San Geronimo
| Age Bracket | Married | Unmarried |
| 15 to 19 years | 0 (0.0%) | 0 (0.0%) |
| 20 to 34 years | 0 (0.0%) | 0 (0.0%) |
| 35 to 50 years | 0 (0.0%) | 0 (0.0%) |
| Total | 0 (0.0%) | 0 (0.0%) |
Fertility by Education in San Geronimo
| Educational Attainment | Women with Births | Births / 1,000 Women |
| Less than High School | 0 (0.0%) | 0.0 |
| High School Diploma | 0 (0.0%) | 0.0 |
| College or Associate's Degree | 0 (0.0%) | 0.0 |
| Bachelor's Degree | 0 (0.0%) | 0.0 |
| Graduate Degree | 0 (0.0%) | 0.0 |
| Total | 0 (0.0%) | 0.0 |
Fertility by Education by Marriage Status in San Geronimo
| Educational Attainment | Married | Unmarried |
| Less than High School | 0 (0.0%) | 0 (0.0%) |
| High School Diploma | 0 (0.0%) | 0 (0.0%) |
| College or Associate's Degree | 0 (0.0%) | 0 (0.0%) |
| Bachelor's Degree | 0 (0.0%) | 0 (0.0%) |
| Graduate Degree | 0 (0.0%) | 0 (0.0%) |
| Total | 0 (0.0%) | 0 (0.0%) |
Employment Characteristics in San Geronimo
Employment by Class of Employer in San Geronimo
Among the 226 employed individuals in San Geronimo, private company employees (114 | 50.4%), self-employed (incorporated) (45 | 19.9%), and not-for-profit organizations (37 | 16.4%) make up the most common classes of employment.
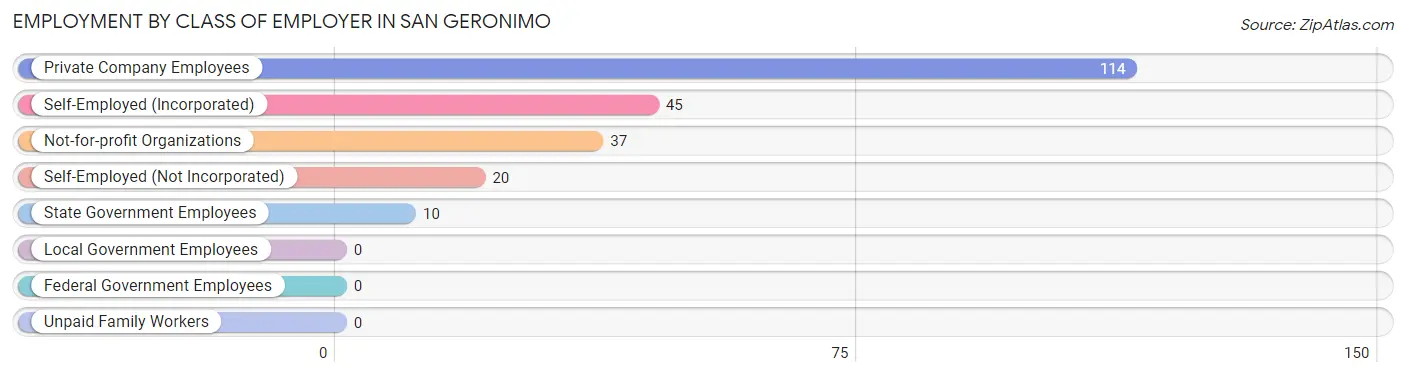
| Employer Class | # Employees | % Employees |
| Private Company Employees | 114 | 50.4% |
| Self-Employed (Incorporated) | 45 | 19.9% |
| Self-Employed (Not Incorporated) | 20 | 8.8% |
| Not-for-profit Organizations | 37 | 16.4% |
| Local Government Employees | 0 | 0.0% |
| State Government Employees | 10 | 4.4% |
| Federal Government Employees | 0 | 0.0% |
| Unpaid Family Workers | 0 | 0.0% |
| Total | 226 | 100.0% |
Employment Status by Age in San Geronimo
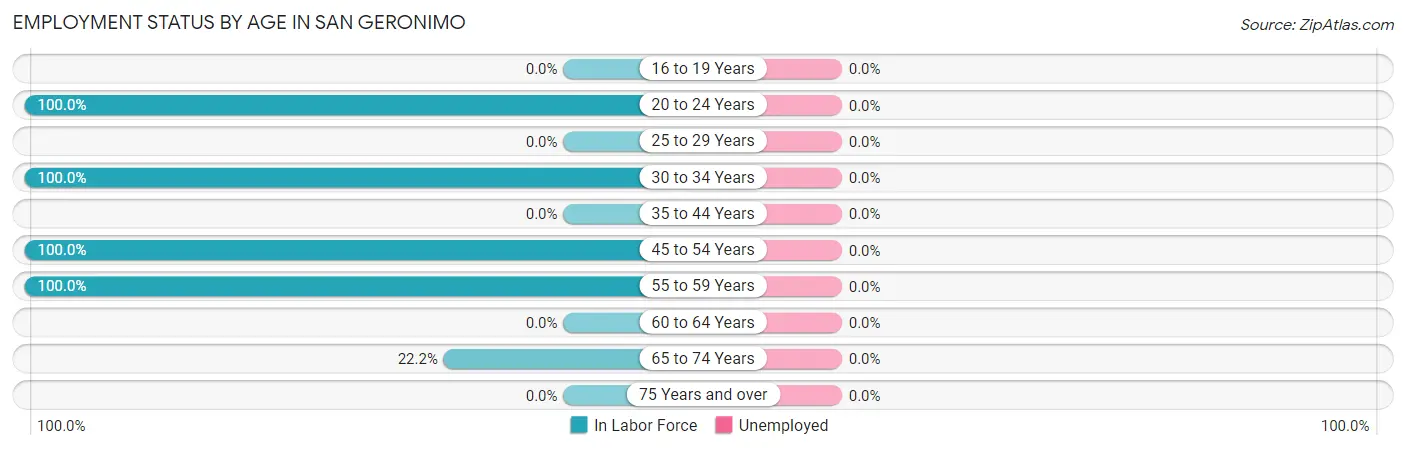
| Age Bracket | In Labor Force | Unemployed |
| 16 to 19 Years | 0 (0.0%) | 0 (0.0%) |
| 20 to 24 Years | 59 (100.0%) | 0 (0.0%) |
| 25 to 29 Years | 0 (0.0%) | 0 (0.0%) |
| 30 to 34 Years | 16 (100.0%) | 0 (0.0%) |
| 35 to 44 Years | 0 (0.0%) | 0 (0.0%) |
| 45 to 54 Years | 120 (100.0%) | 0 (0.0%) |
| 55 to 59 Years | 21 (100.0%) | 0 (0.0%) |
| 60 to 64 Years | 0 (0.0%) | 0 (0.0%) |
| 65 to 74 Years | 10 (22.2%) | 0 (0.0%) |
| 75 Years and over | 0 (0.0%) | 0 (0.0%) |
| Total | 226 (59.6%) | 0 (0.0%) |
Employment Status by Educational Attainment in San Geronimo
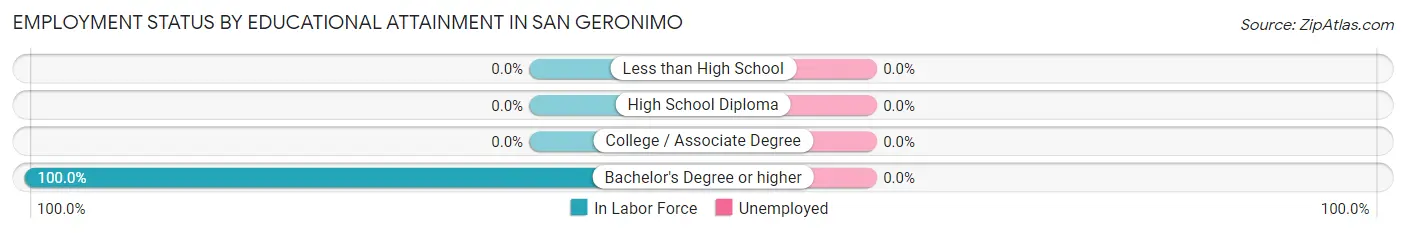
| Educational Attainment | In Labor Force | Unemployed |
| Less than High School | 0 (0.0%) | 0 (0.0%) |
| High School Diploma | 0 (0.0%) | 0 (0.0%) |
| College / Associate Degree | 0 (0.0%) | 0 (0.0%) |
| Bachelor's Degree or higher | 157 (100.0%) | 0 (0.0%) |
| Total | 157 (100.0%) | 0 (0.0%) |
Employment Occupations by Sex in San Geronimo
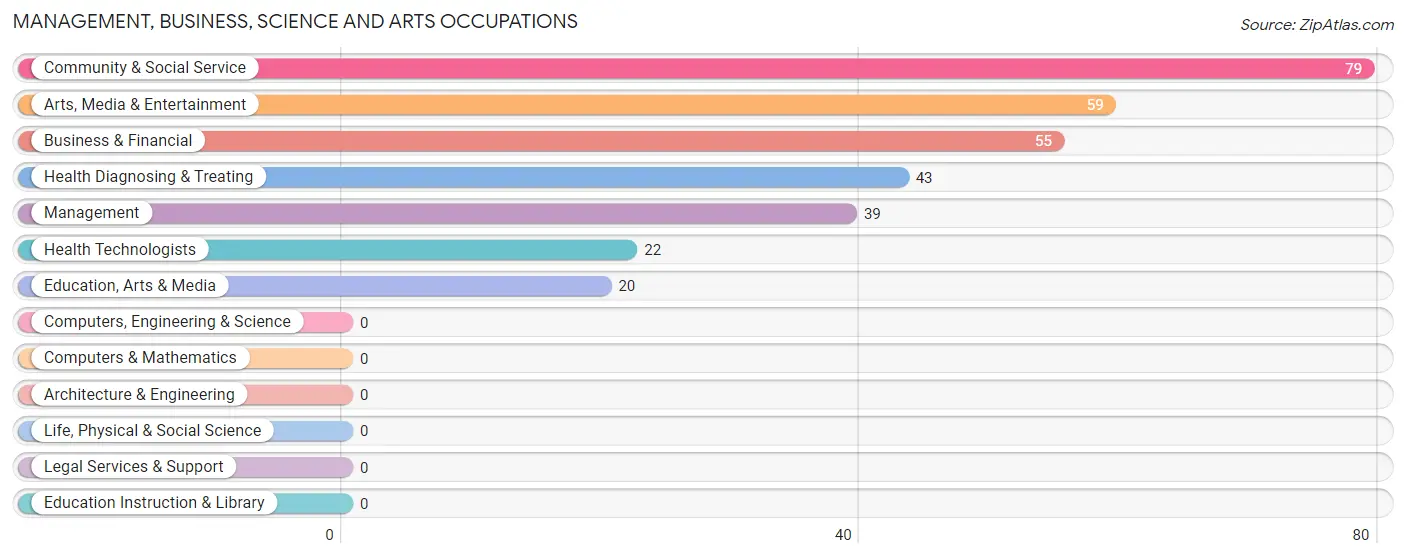
Management, Business, Science and Arts Occupations
The most common Management, Business, Science and Arts occupations in San Geronimo are Community & Social Service (79 | 35.0%), Arts, Media & Entertainment (59 | 26.1%), Business & Financial (55 | 24.3%), Health Diagnosing & Treating (43 | 19.0%), and Management (39 | 17.3%).
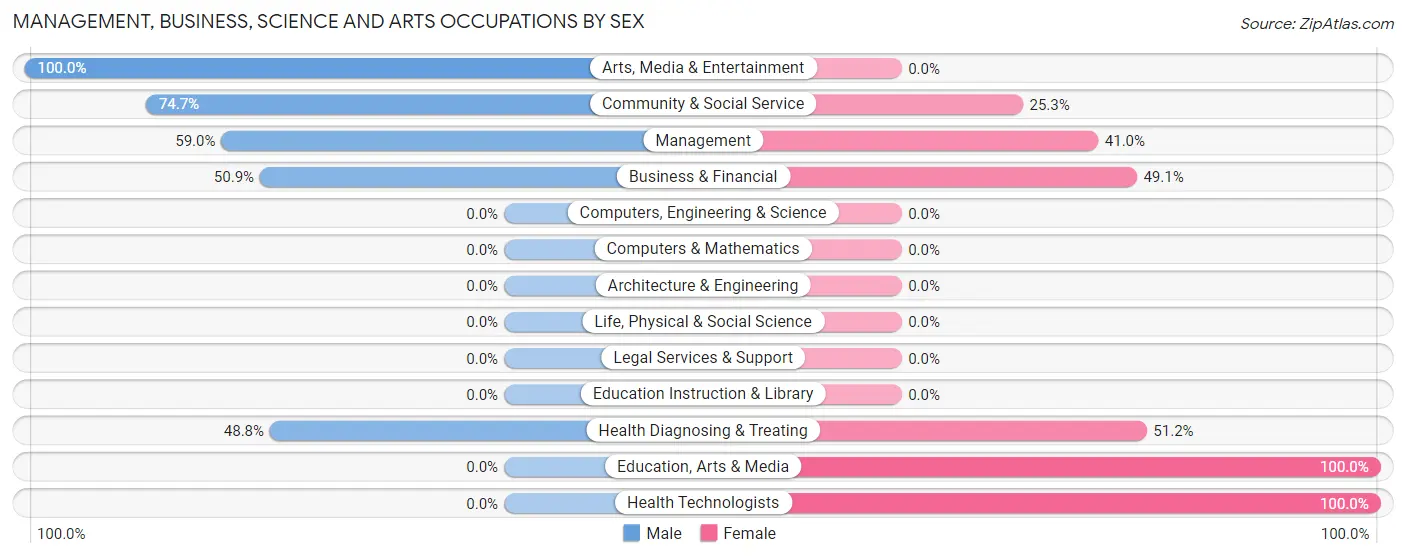
Management, Business, Science and Arts Occupations by Sex
Within the Management, Business, Science and Arts occupations in San Geronimo, the most male-oriented occupations are Arts, Media & Entertainment (100.0%), Community & Social Service (74.7%), and Management (59.0%), while the most female-oriented occupations are Education, Arts & Media (100.0%), Health Technologists (100.0%), and Health Diagnosing & Treating (51.2%).
| Occupation | Male | Female |
| Management | 23 (59.0%) | 16 (41.0%) |
| Business & Financial | 28 (50.9%) | 27 (49.1%) |
| Computers, Engineering & Science | 0 (0.0%) | 0 (0.0%) |
| Computers & Mathematics | 0 (0.0%) | 0 (0.0%) |
| Architecture & Engineering | 0 (0.0%) | 0 (0.0%) |
| Life, Physical & Social Science | 0 (0.0%) | 0 (0.0%) |
| Community & Social Service | 59 (74.7%) | 20 (25.3%) |
| Education, Arts & Media | 0 (0.0%) | 20 (100.0%) |
| Legal Services & Support | 0 (0.0%) | 0 (0.0%) |
| Education Instruction & Library | 0 (0.0%) | 0 (0.0%) |
| Arts, Media & Entertainment | 59 (100.0%) | 0 (0.0%) |
| Health Diagnosing & Treating | 21 (48.8%) | 22 (51.2%) |
| Health Technologists | 0 (0.0%) | 22 (100.0%) |
| Total (Category) | 131 (60.7%) | 85 (39.4%) |
| Total (Overall) | 131 (58.0%) | 95 (42.0%) |
Services Occupations
Services Occupations by Sex
| Occupation | Male | Female |
| Healthcare Support | 0 (0.0%) | 0 (0.0%) |
| Security & Protection | 0 (0.0%) | 0 (0.0%) |
| Firefighting & Prevention | 0 (0.0%) | 0 (0.0%) |
| Law Enforcement | 0 (0.0%) | 0 (0.0%) |
| Food Preparation & Serving | 0 (0.0%) | 0 (0.0%) |
| Cleaning & Maintenance | 0 (0.0%) | 0 (0.0%) |
| Personal Care & Service | 0 (0.0%) | 0 (0.0%) |
| Total (Category) | 0 (0.0%) | 0 (0.0%) |
| Total (Overall) | 131 (58.0%) | 95 (42.0%) |
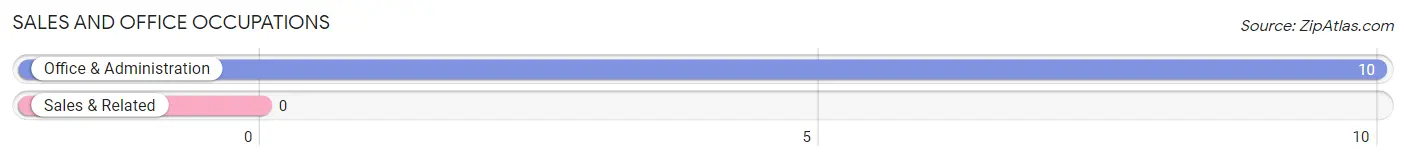
Sales and Office Occupations
The most common Sales and Office occupations in San Geronimo are , and Office & Administration (10 | 4.4%).
Sales and Office Occupations by Sex

| Occupation | Male | Female |
| Sales & Related | 0 (0.0%) | 0 (0.0%) |
| Office & Administration | 0 (0.0%) | 10 (100.0%) |
| Total (Category) | 0 (0.0%) | 10 (100.0%) |
| Total (Overall) | 131 (58.0%) | 95 (42.0%) |
Natural Resources, Construction and Maintenance Occupations
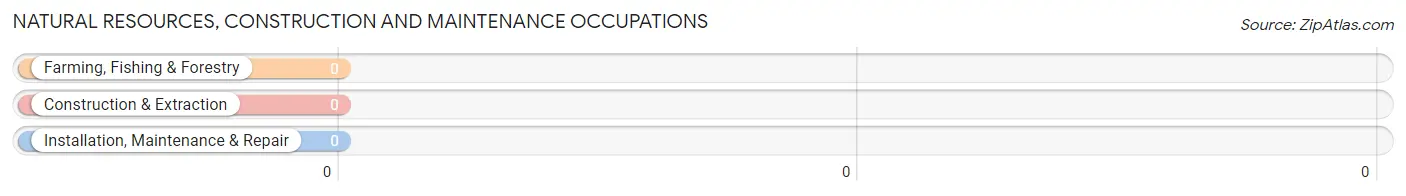
Natural Resources, Construction and Maintenance Occupations by Sex
| Occupation | Male | Female |
| Farming, Fishing & Forestry | 0 (0.0%) | 0 (0.0%) |
| Construction & Extraction | 0 (0.0%) | 0 (0.0%) |
| Installation, Maintenance & Repair | 0 (0.0%) | 0 (0.0%) |
| Total (Category) | 0 (0.0%) | 0 (0.0%) |
| Total (Overall) | 131 (58.0%) | 95 (42.0%) |
Production, Transportation and Moving Occupations
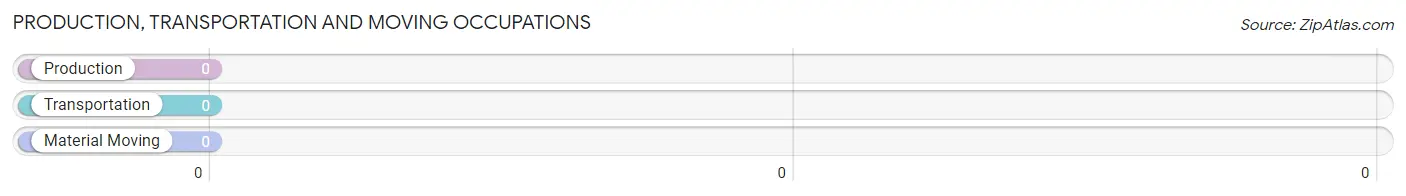
Production, Transportation and Moving Occupations by Sex
| Occupation | Male | Female |
| Production | 0 (0.0%) | 0 (0.0%) |
| Transportation | 0 (0.0%) | 0 (0.0%) |
| Material Moving | 0 (0.0%) | 0 (0.0%) |
| Total (Category) | 0 (0.0%) | 0 (0.0%) |
| Total (Overall) | 131 (58.0%) | 95 (42.0%) |
Employment Industries by Sex in San Geronimo
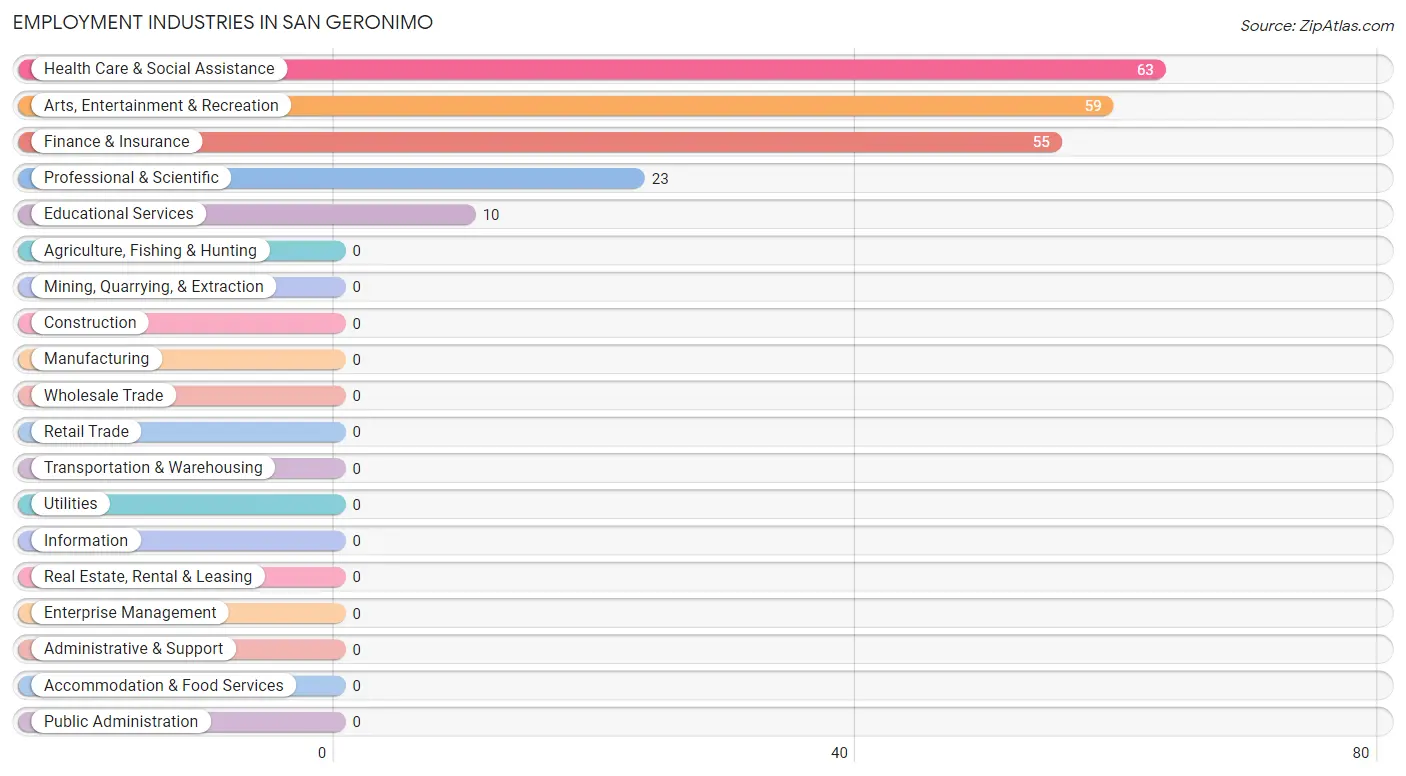
Employment Industries in San Geronimo
The major employment industries in San Geronimo include Health Care & Social Assistance (63 | 27.9%), Arts, Entertainment & Recreation (59 | 26.1%), Finance & Insurance (55 | 24.3%), Professional & Scientific (23 | 10.2%), and Educational Services (10 | 4.4%).
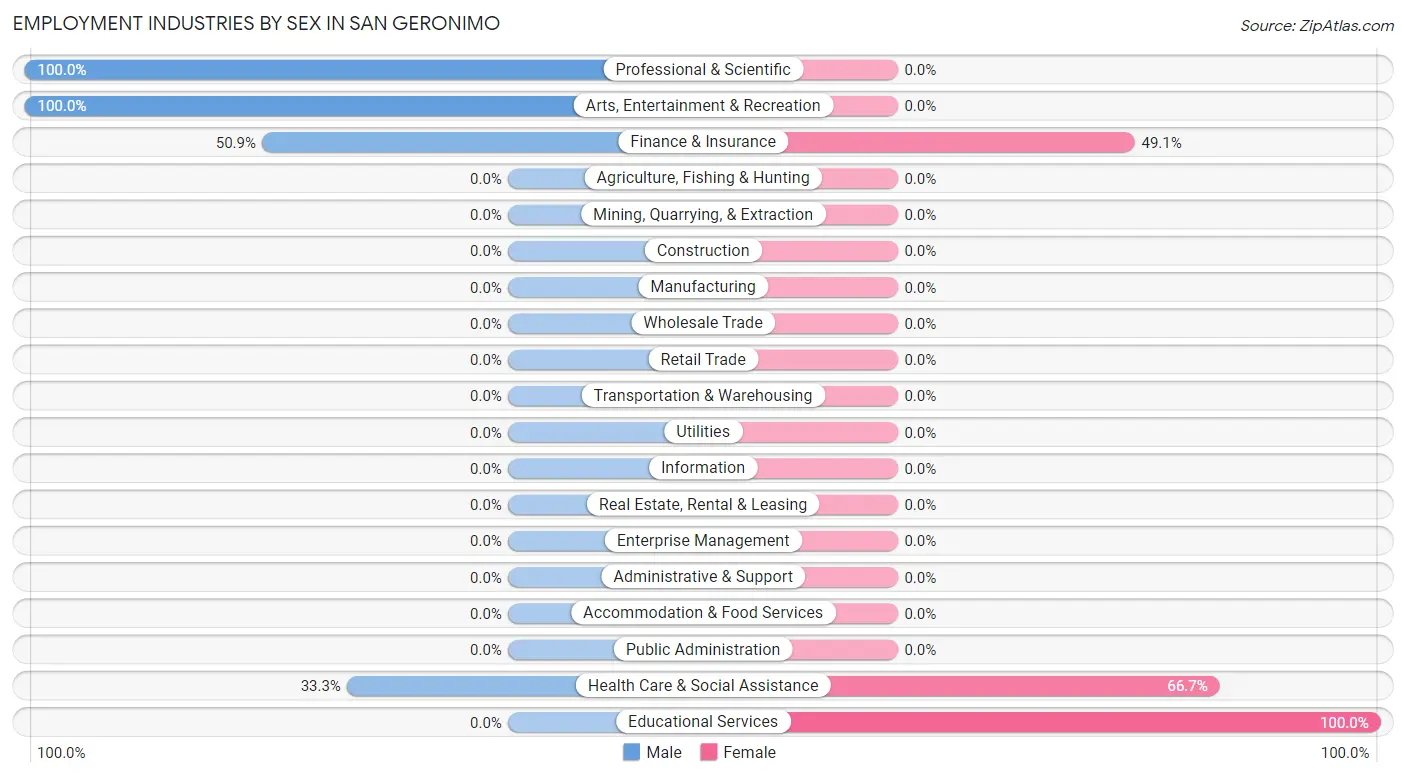
Employment Industries by Sex in San Geronimo
The San Geronimo industries that see more men than women are Professional & Scientific (100.0%), Arts, Entertainment & Recreation (100.0%), and Finance & Insurance (50.9%), whereas the industries that tend to have a higher number of women are Educational Services (100.0%), Health Care & Social Assistance (66.7%), and Finance & Insurance (49.1%).
| Industry | Male | Female |
| Agriculture, Fishing & Hunting | 0 (0.0%) | 0 (0.0%) |
| Mining, Quarrying, & Extraction | 0 (0.0%) | 0 (0.0%) |
| Construction | 0 (0.0%) | 0 (0.0%) |
| Manufacturing | 0 (0.0%) | 0 (0.0%) |
| Wholesale Trade | 0 (0.0%) | 0 (0.0%) |
| Retail Trade | 0 (0.0%) | 0 (0.0%) |
| Transportation & Warehousing | 0 (0.0%) | 0 (0.0%) |
| Utilities | 0 (0.0%) | 0 (0.0%) |
| Information | 0 (0.0%) | 0 (0.0%) |
| Finance & Insurance | 28 (50.9%) | 27 (49.1%) |
| Real Estate, Rental & Leasing | 0 (0.0%) | 0 (0.0%) |
| Professional & Scientific | 23 (100.0%) | 0 (0.0%) |
| Enterprise Management | 0 (0.0%) | 0 (0.0%) |
| Administrative & Support | 0 (0.0%) | 0 (0.0%) |
| Educational Services | 0 (0.0%) | 10 (100.0%) |
| Health Care & Social Assistance | 21 (33.3%) | 42 (66.7%) |
| Arts, Entertainment & Recreation | 59 (100.0%) | 0 (0.0%) |
| Accommodation & Food Services | 0 (0.0%) | 0 (0.0%) |
| Public Administration | 0 (0.0%) | 0 (0.0%) |
| Total | 131 (58.0%) | 95 (42.0%) |
Education in San Geronimo
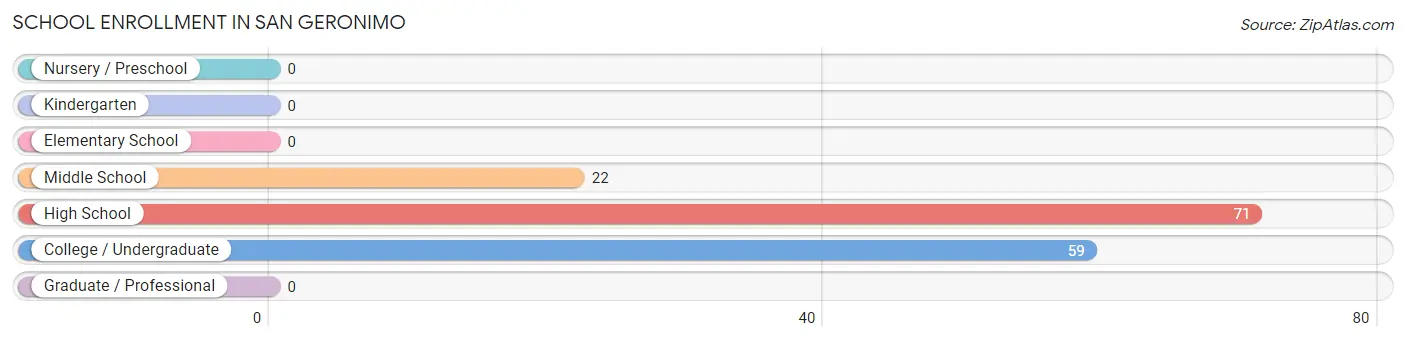
School Enrollment in San Geronimo
The most common levels of schooling among the 152 students in San Geronimo are high school (71 | 46.7%), college / undergraduate (59 | 38.8%), and middle school (22 | 14.5%).
| School Level | # Students | % Students |
| Nursery / Preschool | 0 | 0.0% |
| Kindergarten | 0 | 0.0% |
| Elementary School | 0 | 0.0% |
| Middle School | 22 | 14.5% |
| High School | 71 | 46.7% |
| College / Undergraduate | 59 | 38.8% |
| Graduate / Professional | 0 | 0.0% |
| Total | 152 | 100.0% |
School Enrollment by Age by Funding Source in San Geronimo
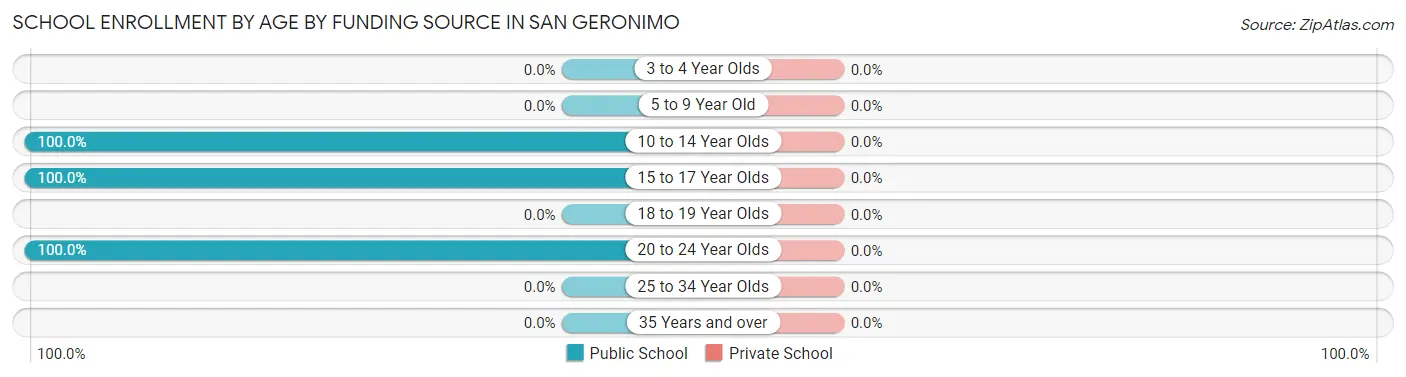
| Age Bracket | Public School | Private School |
| 3 to 4 Year Olds | 0 (0.0%) | 0 (0.0%) |
| 5 to 9 Year Old | 0 (0.0%) | 0 (0.0%) |
| 10 to 14 Year Olds | 23 (100.0%) | 0 (0.0%) |
| 15 to 17 Year Olds | 70 (100.0%) | 0 (0.0%) |
| 18 to 19 Year Olds | 0 (0.0%) | 0 (0.0%) |
| 20 to 24 Year Olds | 59 (100.0%) | 0 (0.0%) |
| 25 to 34 Year Olds | 0 (0.0%) | 0 (0.0%) |
| 35 Years and over | 0 (0.0%) | 0 (0.0%) |
| Total | 152 (100.0%) | 0 (0.0%) |
Educational Attainment by Field of Study in San Geronimo
Business (99 | 40.7%), social sciences (26 | 10.7%), science & technology (25 | 10.3%), bio, nature & agricultural (22 | 9.0%), and physical & health sciences (22 | 9.0%) are the most common fields of study among 243 individuals in San Geronimo who have obtained a bachelor's degree or higher.
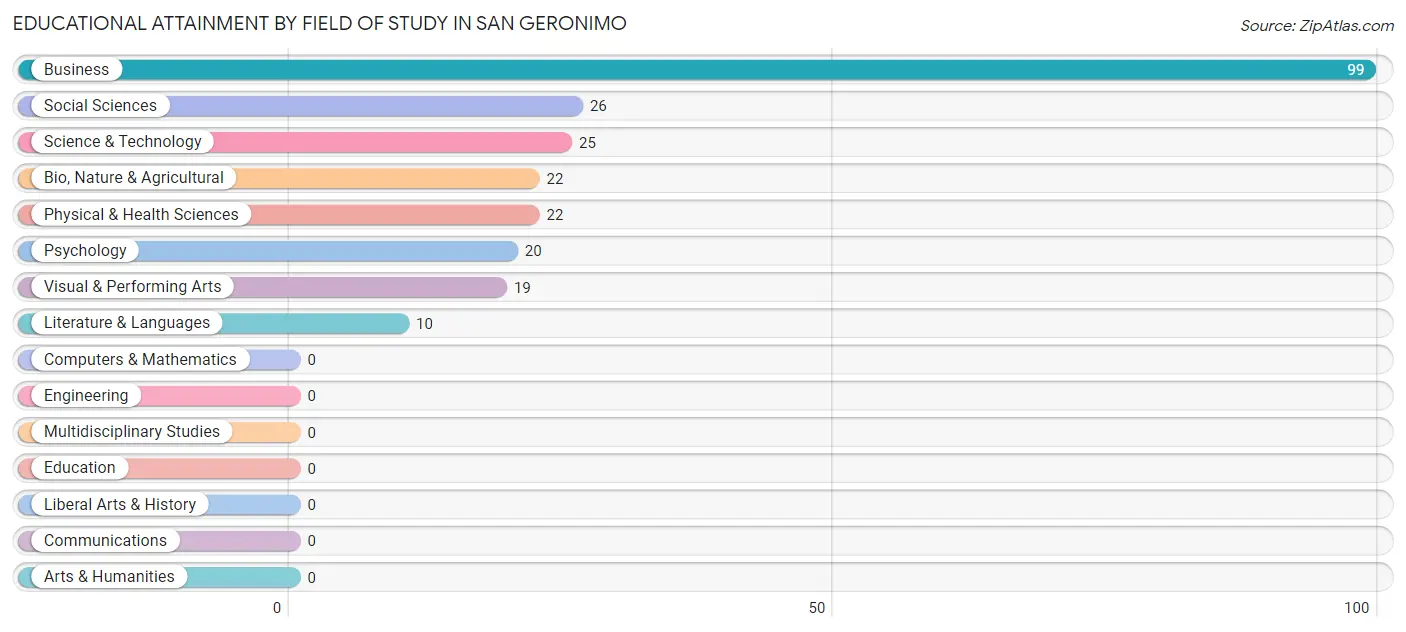
| Field of Study | # Graduates | % Graduates |
| Computers & Mathematics | 0 | 0.0% |
| Bio, Nature & Agricultural | 22 | 9.0% |
| Physical & Health Sciences | 22 | 9.0% |
| Psychology | 20 | 8.2% |
| Social Sciences | 26 | 10.7% |
| Engineering | 0 | 0.0% |
| Multidisciplinary Studies | 0 | 0.0% |
| Science & Technology | 25 | 10.3% |
| Business | 99 | 40.7% |
| Education | 0 | 0.0% |
| Literature & Languages | 10 | 4.1% |
| Liberal Arts & History | 0 | 0.0% |
| Visual & Performing Arts | 19 | 7.8% |
| Communications | 0 | 0.0% |
| Arts & Humanities | 0 | 0.0% |
| Total | 243 | 100.0% |
Transportation & Commute in San Geronimo
Vehicle Availability by Sex in San Geronimo
The most prevalent vehicle ownership categories in San Geronimo are males with 3 vehicles (110, accounting for 84.0%) and females with 3 vehicles (59, making up 115.8%).
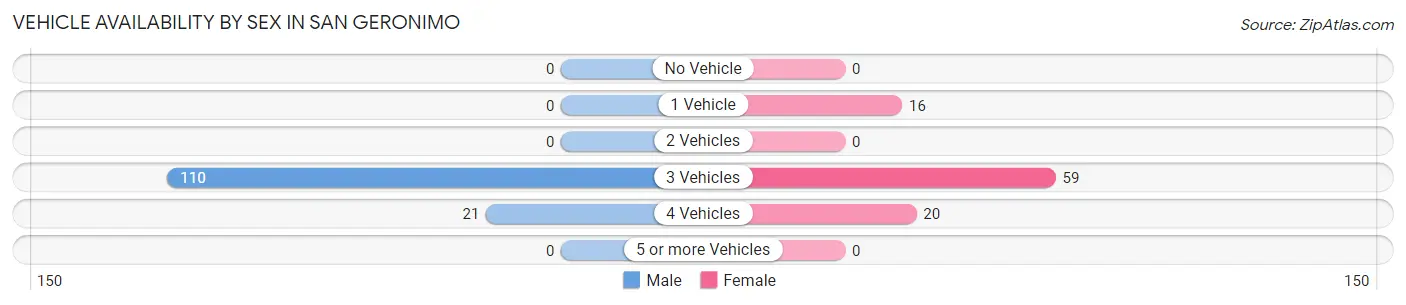
| Vehicles Available | Male | Female |
| No Vehicle | 0 (0.0%) | 0 (0.0%) |
| 1 Vehicle | 0 (0.0%) | 16 (16.8%) |
| 2 Vehicles | 0 (0.0%) | 0 (0.0%) |
| 3 Vehicles | 110 (84.0%) | 59 (62.1%) |
| 4 Vehicles | 21 (16.0%) | 20 (21.0%) |
| 5 or more Vehicles | 0 (0.0%) | 0 (0.0%) |
| Total | 131 (100.0%) | 95 (100.0%) |
Commute Time in San Geronimo
The most frequently occuring commute durations in San Geronimo are 10 to 14 minutes (97 commuters, 55.1%), 25 to 29 minutes (49 commuters, 27.8%), and 35 to 39 minutes (20 commuters, 11.4%).
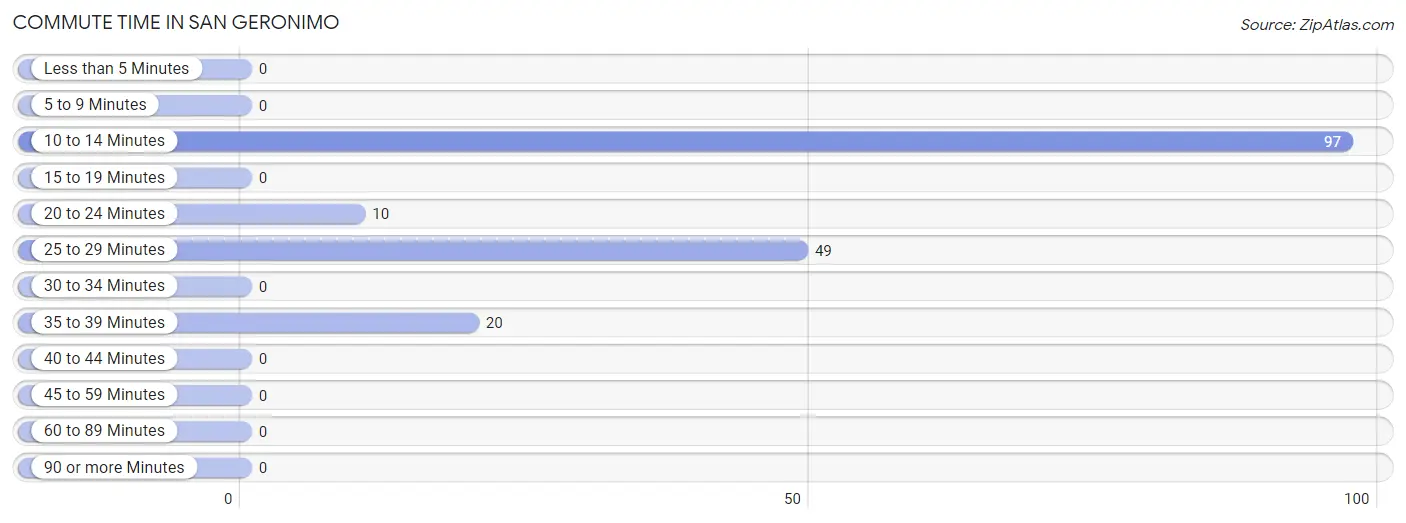
| Commute Time | # Commuters | % Commuters |
| Less than 5 Minutes | 0 | 0.0% |
| 5 to 9 Minutes | 0 | 0.0% |
| 10 to 14 Minutes | 97 | 55.1% |
| 15 to 19 Minutes | 0 | 0.0% |
| 20 to 24 Minutes | 10 | 5.7% |
| 25 to 29 Minutes | 49 | 27.8% |
| 30 to 34 Minutes | 0 | 0.0% |
| 35 to 39 Minutes | 20 | 11.4% |
| 40 to 44 Minutes | 0 | 0.0% |
| 45 to 59 Minutes | 0 | 0.0% |
| 60 to 89 Minutes | 0 | 0.0% |
| 90 or more Minutes | 0 | 0.0% |
Commute Time by Sex in San Geronimo
The most common commute times in San Geronimo are 10 to 14 minutes (59 commuters, 54.6%) for males and 10 to 14 minutes (38 commuters, 55.9%) for females.
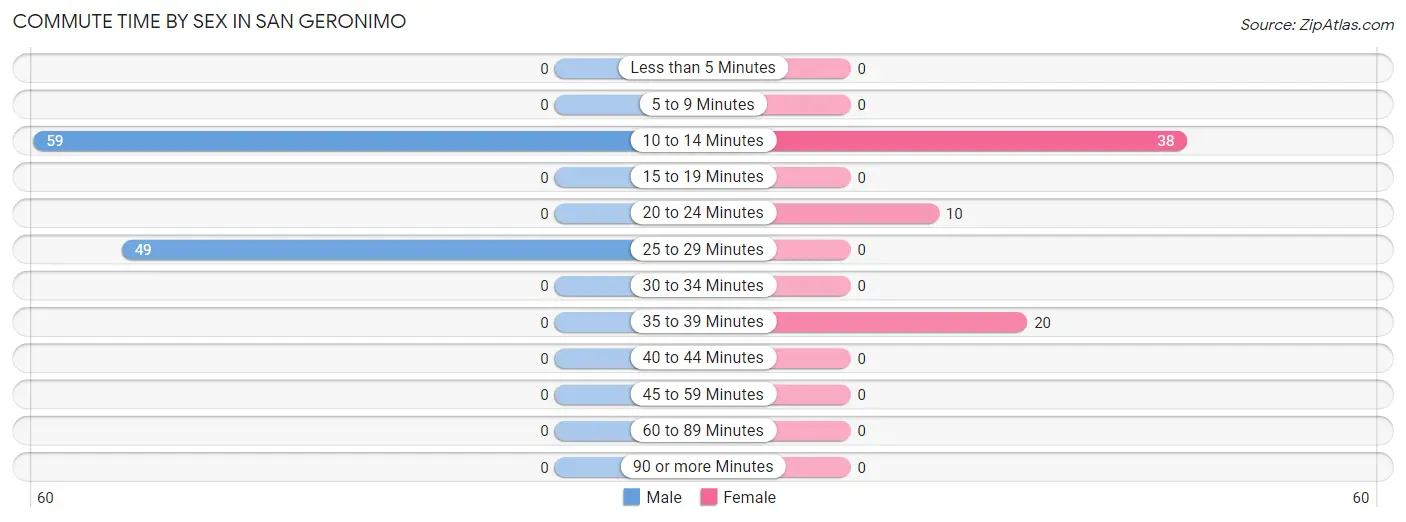
| Commute Time | Male | Female |
| Less than 5 Minutes | 0 (0.0%) | 0 (0.0%) |
| 5 to 9 Minutes | 0 (0.0%) | 0 (0.0%) |
| 10 to 14 Minutes | 59 (54.6%) | 38 (55.9%) |
| 15 to 19 Minutes | 0 (0.0%) | 0 (0.0%) |
| 20 to 24 Minutes | 0 (0.0%) | 10 (14.7%) |
| 25 to 29 Minutes | 49 (45.4%) | 0 (0.0%) |
| 30 to 34 Minutes | 0 (0.0%) | 0 (0.0%) |
| 35 to 39 Minutes | 0 (0.0%) | 20 (29.4%) |
| 40 to 44 Minutes | 0 (0.0%) | 0 (0.0%) |
| 45 to 59 Minutes | 0 (0.0%) | 0 (0.0%) |
| 60 to 89 Minutes | 0 (0.0%) | 0 (0.0%) |
| 90 or more Minutes | 0 (0.0%) | 0 (0.0%) |
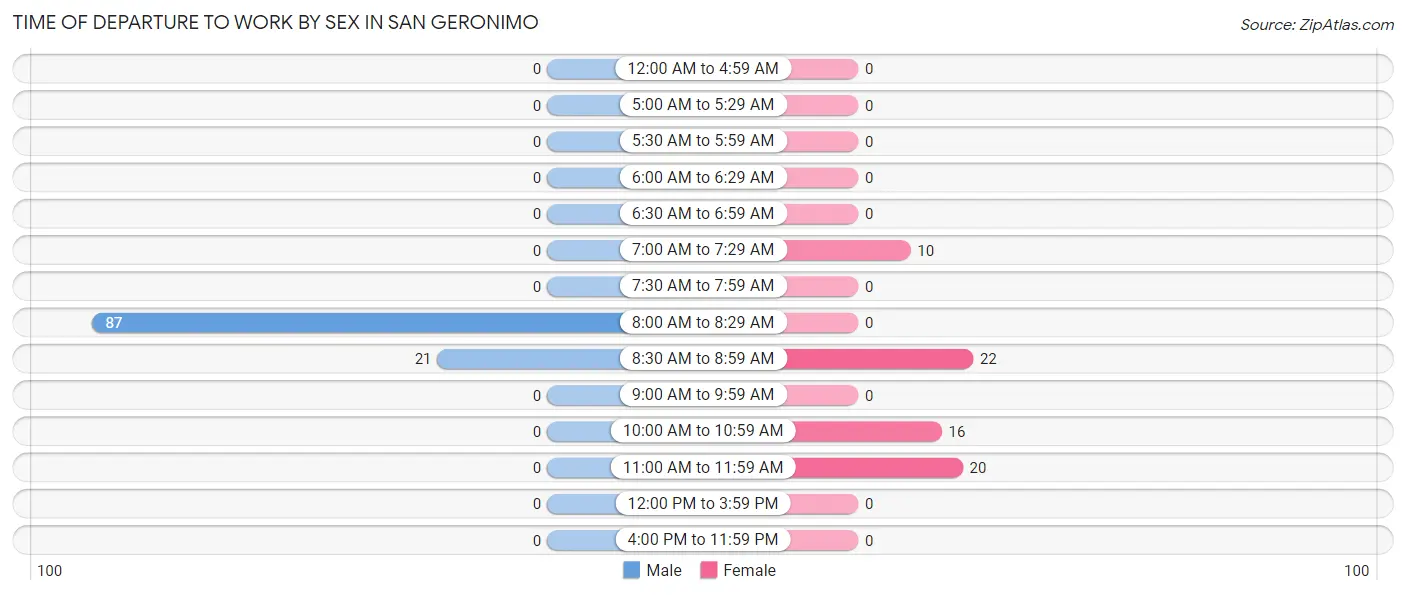
Time of Departure to Work by Sex in San Geronimo
The most frequent times of departure to work in San Geronimo are 8:00 AM to 8:29 AM (87, 80.6%) for males and 8:30 AM to 8:59 AM (22, 32.4%) for females.
| Time of Departure | Male | Female |
| 12:00 AM to 4:59 AM | 0 (0.0%) | 0 (0.0%) |
| 5:00 AM to 5:29 AM | 0 (0.0%) | 0 (0.0%) |
| 5:30 AM to 5:59 AM | 0 (0.0%) | 0 (0.0%) |
| 6:00 AM to 6:29 AM | 0 (0.0%) | 0 (0.0%) |
| 6:30 AM to 6:59 AM | 0 (0.0%) | 0 (0.0%) |
| 7:00 AM to 7:29 AM | 0 (0.0%) | 10 (14.7%) |
| 7:30 AM to 7:59 AM | 0 (0.0%) | 0 (0.0%) |
| 8:00 AM to 8:29 AM | 87 (80.6%) | 0 (0.0%) |
| 8:30 AM to 8:59 AM | 21 (19.4%) | 22 (32.4%) |
| 9:00 AM to 9:59 AM | 0 (0.0%) | 0 (0.0%) |
| 10:00 AM to 10:59 AM | 0 (0.0%) | 16 (23.5%) |
| 11:00 AM to 11:59 AM | 0 (0.0%) | 20 (29.4%) |
| 12:00 PM to 3:59 PM | 0 (0.0%) | 0 (0.0%) |
| 4:00 PM to 11:59 PM | 0 (0.0%) | 0 (0.0%) |
| Total | 108 (100.0%) | 68 (100.0%) |
Housing Occupancy in San Geronimo
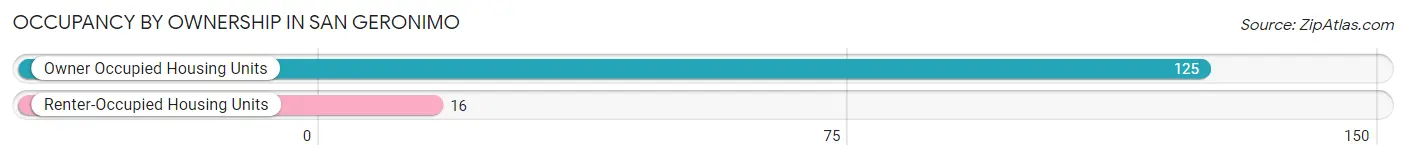
Occupancy by Ownership in San Geronimo
Of the total 141 dwellings in San Geronimo, owner-occupied units account for 125 (88.6%), while renter-occupied units make up 16 (11.4%).
| Occupancy | # Housing Units | % Housing Units |
| Owner Occupied Housing Units | 125 | 88.6% |
| Renter-Occupied Housing Units | 16 | 11.4% |
| Total Occupied Housing Units | 141 | 100.0% |
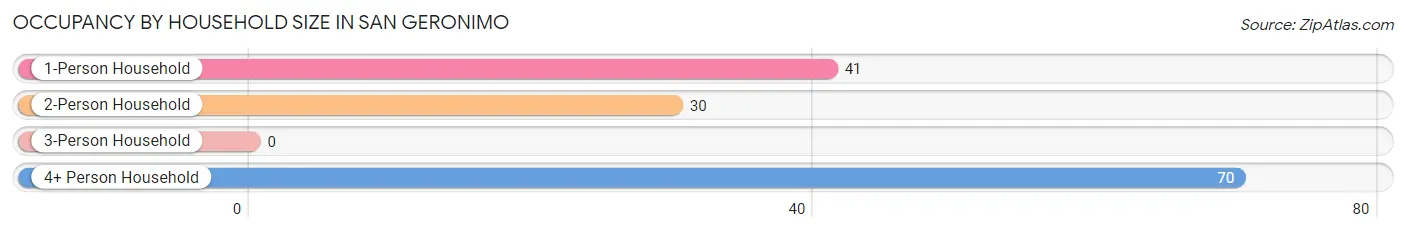
Occupancy by Household Size in San Geronimo
| Household Size | # Housing Units | % Housing Units |
| 1-Person Household | 41 | 29.1% |
| 2-Person Household | 30 | 21.3% |
| 3-Person Household | 0 | 0.0% |
| 4+ Person Household | 70 | 49.6% |
| Total Housing Units | 141 | 100.0% |
Occupancy by Ownership by Household Size in San Geronimo
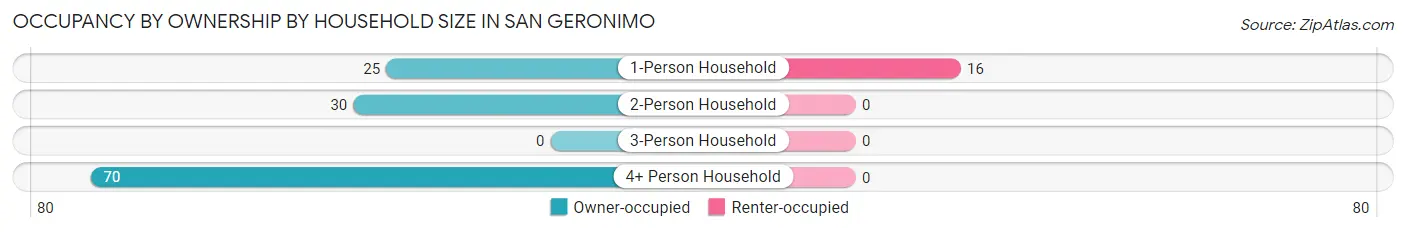
| Household Size | Owner-occupied | Renter-occupied |
| 1-Person Household | 25 (61.0%) | 16 (39.0%) |
| 2-Person Household | 30 (100.0%) | 0 (0.0%) |
| 3-Person Household | 0 (0.0%) | 0 (0.0%) |
| 4+ Person Household | 70 (100.0%) | 0 (0.0%) |
| Total Housing Units | 125 (88.6%) | 16 (11.4%) |
Occupancy by Educational Attainment in San Geronimo
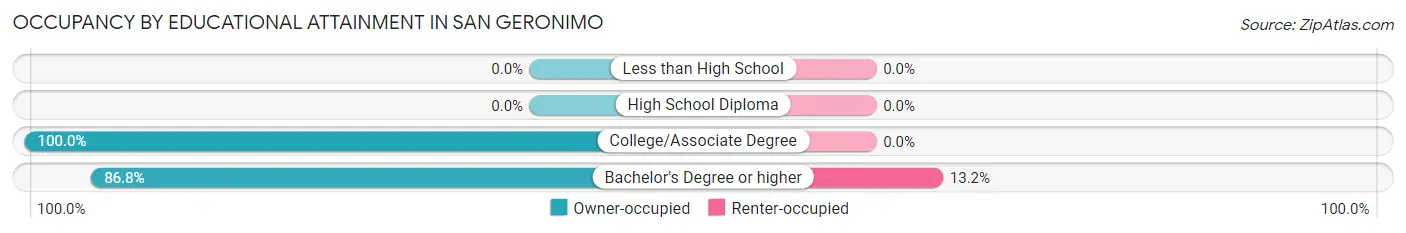
| Household Size | Owner-occupied | Renter-occupied |
| Less than High School | 0 (0.0%) | 0 (0.0%) |
| High School Diploma | 0 (0.0%) | 0 (0.0%) |
| College/Associate Degree | 20 (100.0%) | 0 (0.0%) |
| Bachelor's Degree or higher | 105 (86.8%) | 16 (13.2%) |
Occupancy by Age of Householder in San Geronimo
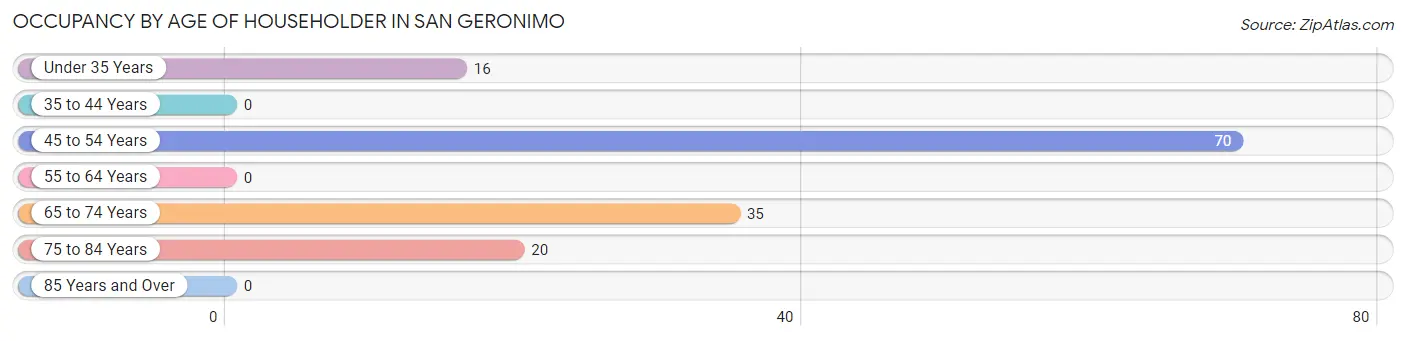
| Age Bracket | # Households | % Households |
| Under 35 Years | 16 | 11.4% |
| 35 to 44 Years | 0 | 0.0% |
| 45 to 54 Years | 70 | 49.6% |
| 55 to 64 Years | 0 | 0.0% |
| 65 to 74 Years | 35 | 24.8% |
| 75 to 84 Years | 20 | 14.2% |
| 85 Years and Over | 0 | 0.0% |
| Total | 141 | 100.0% |
Housing Finances in San Geronimo
Median Income by Occupancy in San Geronimo
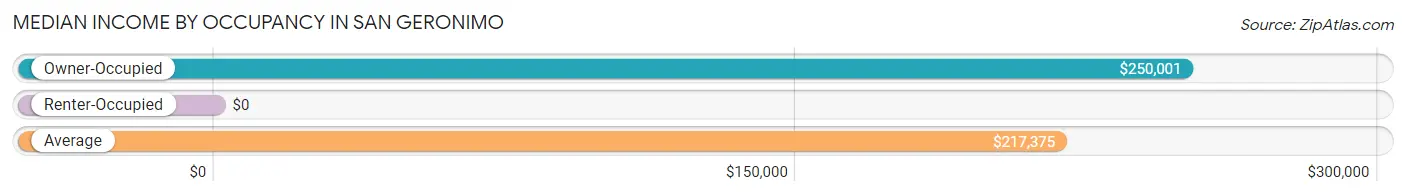
| Occupancy Type | # Households | Median Income |
| Owner-Occupied | 125 (88.6%) | $250,001 |
| Renter-Occupied | 16 (11.4%) | $0 |
| Average | 141 (100.0%) | $217,375 |
Occupancy by Householder Income Bracket in San Geronimo
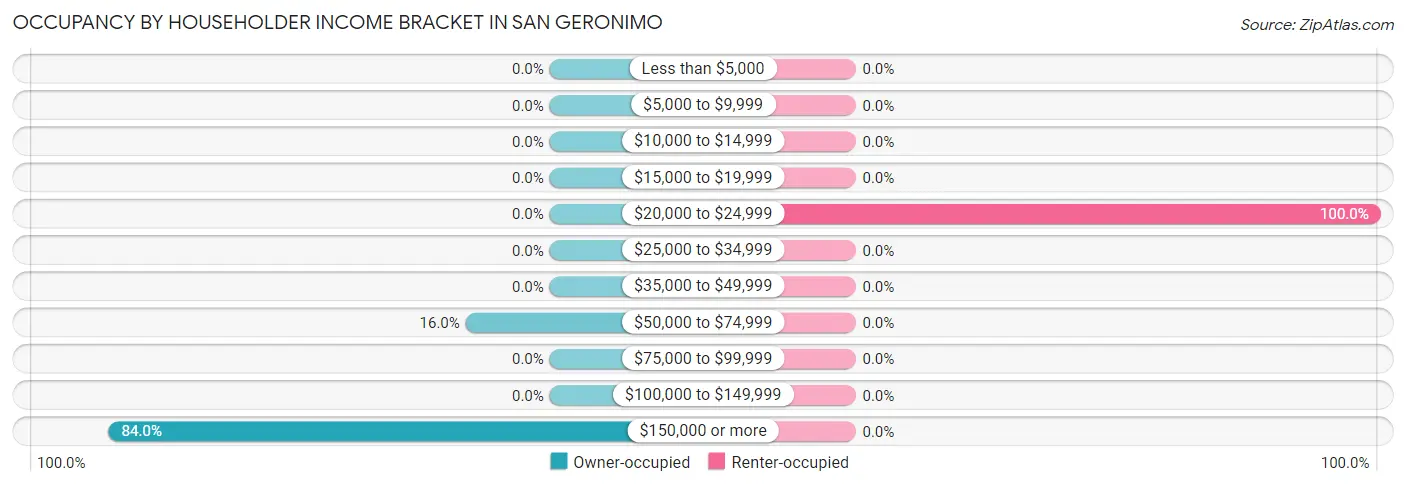
| Income Bracket | Owner-occupied | Renter-occupied |
| Less than $5,000 | 0 (0.0%) | 0 (0.0%) |
| $5,000 to $9,999 | 0 (0.0%) | 0 (0.0%) |
| $10,000 to $14,999 | 0 (0.0%) | 0 (0.0%) |
| $15,000 to $19,999 | 0 (0.0%) | 0 (0.0%) |
| $20,000 to $24,999 | 0 (0.0%) | 16 (100.0%) |
| $25,000 to $34,999 | 0 (0.0%) | 0 (0.0%) |
| $35,000 to $49,999 | 0 (0.0%) | 0 (0.0%) |
| $50,000 to $74,999 | 20 (16.0%) | 0 (0.0%) |
| $75,000 to $99,999 | 0 (0.0%) | 0 (0.0%) |
| $100,000 to $149,999 | 0 (0.0%) | 0 (0.0%) |
| $150,000 or more | 105 (84.0%) | 0 (0.0%) |
| Total | 125 (100.0%) | 16 (100.0%) |
Monthly Housing Cost Tiers in San Geronimo
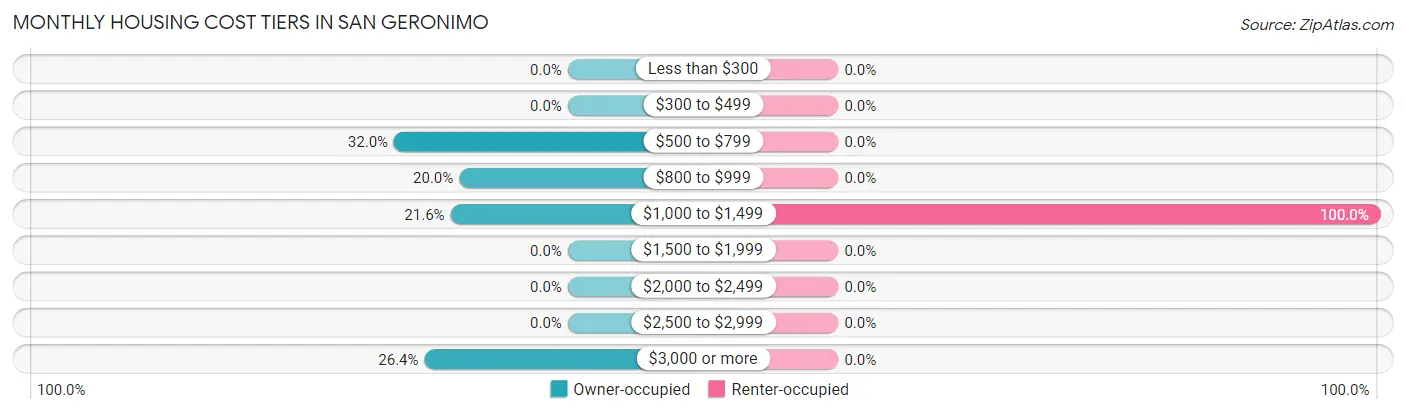
| Monthly Cost | Owner-occupied | Renter-occupied |
| Less than $300 | 0 (0.0%) | 0 (0.0%) |
| $300 to $499 | 0 (0.0%) | 0 (0.0%) |
| $500 to $799 | 40 (32.0%) | 0 (0.0%) |
| $800 to $999 | 25 (20.0%) | 0 (0.0%) |
| $1,000 to $1,499 | 27 (21.6%) | 16 (100.0%) |
| $1,500 to $1,999 | 0 (0.0%) | 0 (0.0%) |
| $2,000 to $2,499 | 0 (0.0%) | 0 (0.0%) |
| $2,500 to $2,999 | 0 (0.0%) | 0 (0.0%) |
| $3,000 or more | 33 (26.4%) | 0 (0.0%) |
| Total | 125 (100.0%) | 16 (100.0%) |
Physical Housing Characteristics in San Geronimo
Housing Structures in San Geronimo
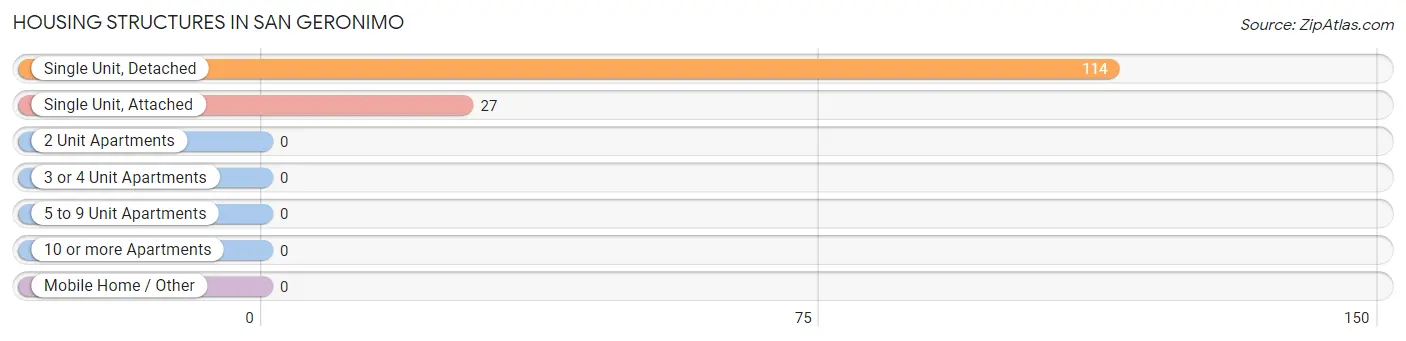
| Structure Type | # Housing Units | % Housing Units |
| Single Unit, Detached | 114 | 80.8% |
| Single Unit, Attached | 27 | 19.2% |
| 2 Unit Apartments | 0 | 0.0% |
| 3 or 4 Unit Apartments | 0 | 0.0% |
| 5 to 9 Unit Apartments | 0 | 0.0% |
| 10 or more Apartments | 0 | 0.0% |
| Mobile Home / Other | 0 | 0.0% |
| Total | 141 | 100.0% |
Housing Structures by Occupancy in San Geronimo
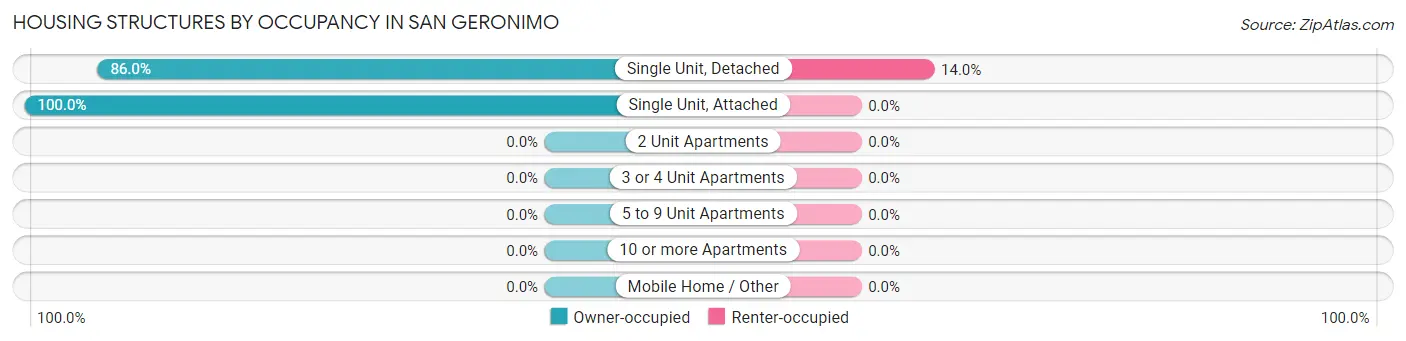
| Structure Type | Owner-occupied | Renter-occupied |
| Single Unit, Detached | 98 (86.0%) | 16 (14.0%) |
| Single Unit, Attached | 27 (100.0%) | 0 (0.0%) |
| 2 Unit Apartments | 0 (0.0%) | 0 (0.0%) |
| 3 or 4 Unit Apartments | 0 (0.0%) | 0 (0.0%) |
| 5 to 9 Unit Apartments | 0 (0.0%) | 0 (0.0%) |
| 10 or more Apartments | 0 (0.0%) | 0 (0.0%) |
| Mobile Home / Other | 0 (0.0%) | 0 (0.0%) |
| Total | 125 (88.6%) | 16 (11.4%) |
Housing Structures by Number of Rooms in San Geronimo
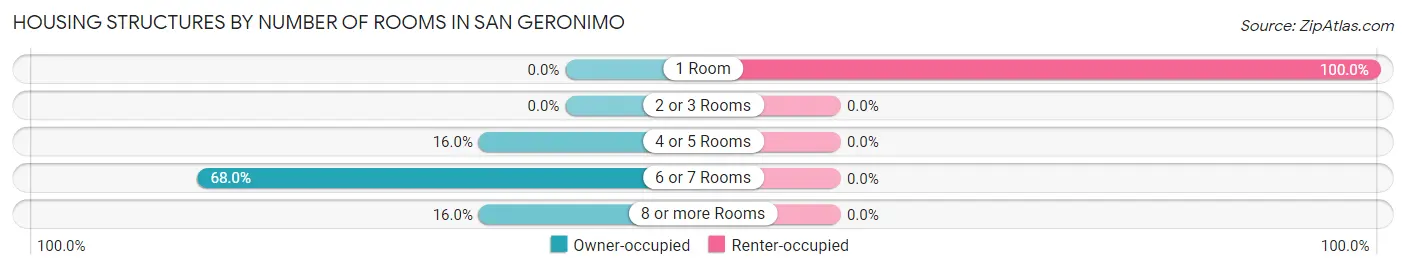
| Number of Rooms | Owner-occupied | Renter-occupied |
| 1 Room | 0 (0.0%) | 16 (100.0%) |
| 2 or 3 Rooms | 0 (0.0%) | 0 (0.0%) |
| 4 or 5 Rooms | 20 (16.0%) | 0 (0.0%) |
| 6 or 7 Rooms | 85 (68.0%) | 0 (0.0%) |
| 8 or more Rooms | 20 (16.0%) | 0 (0.0%) |
| Total | 125 (100.0%) | 16 (100.0%) |
Housing Structure by Heating Type in San Geronimo
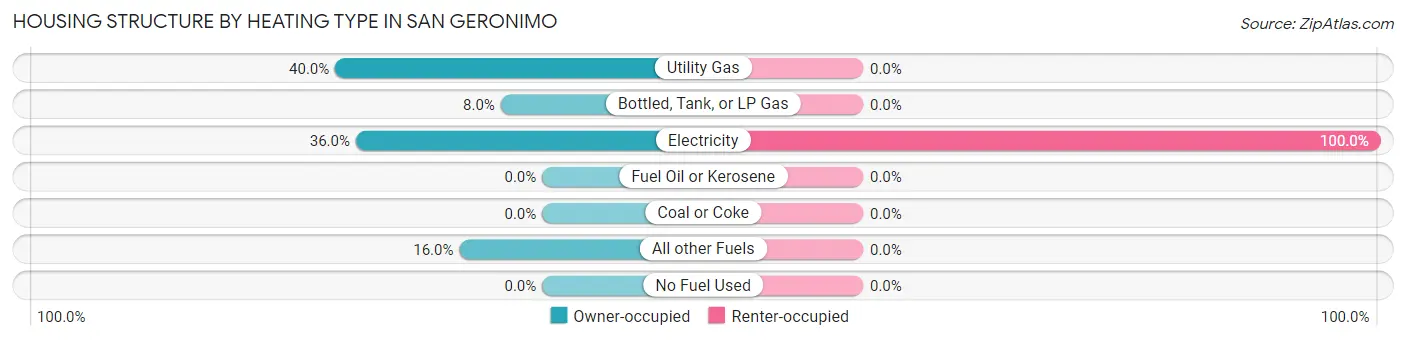
| Heating Type | Owner-occupied | Renter-occupied |
| Utility Gas | 50 (40.0%) | 0 (0.0%) |
| Bottled, Tank, or LP Gas | 10 (8.0%) | 0 (0.0%) |
| Electricity | 45 (36.0%) | 16 (100.0%) |
| Fuel Oil or Kerosene | 0 (0.0%) | 0 (0.0%) |
| Coal or Coke | 0 (0.0%) | 0 (0.0%) |
| All other Fuels | 20 (16.0%) | 0 (0.0%) |
| No Fuel Used | 0 (0.0%) | 0 (0.0%) |
| Total | 125 (100.0%) | 16 (100.0%) |
Household Vehicle Usage in San Geronimo
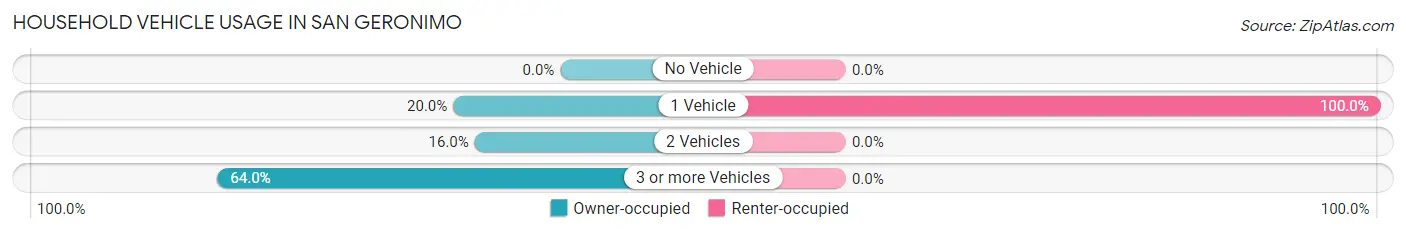
| Vehicles per Household | Owner-occupied | Renter-occupied |
| No Vehicle | 0 (0.0%) | 0 (0.0%) |
| 1 Vehicle | 25 (20.0%) | 16 (100.0%) |
| 2 Vehicles | 20 (16.0%) | 0 (0.0%) |
| 3 or more Vehicles | 80 (64.0%) | 0 (0.0%) |
| Total | 125 (100.0%) | 16 (100.0%) |
Real Estate & Mortgages in San Geronimo
Real Estate and Mortgage Overview in San Geronimo
| Characteristic | Without Mortgage | With Mortgage |
| Housing Units | 72 | 53 |
| Median Property Value | $1,160,000 | $0 |
| Median Household Income | $199,100 | $53 |
| Monthly Housing Costs | $964 | $33 |
| Real Estate Taxes | $8,269 | $0 |
Property Value by Mortgage Status in San Geronimo
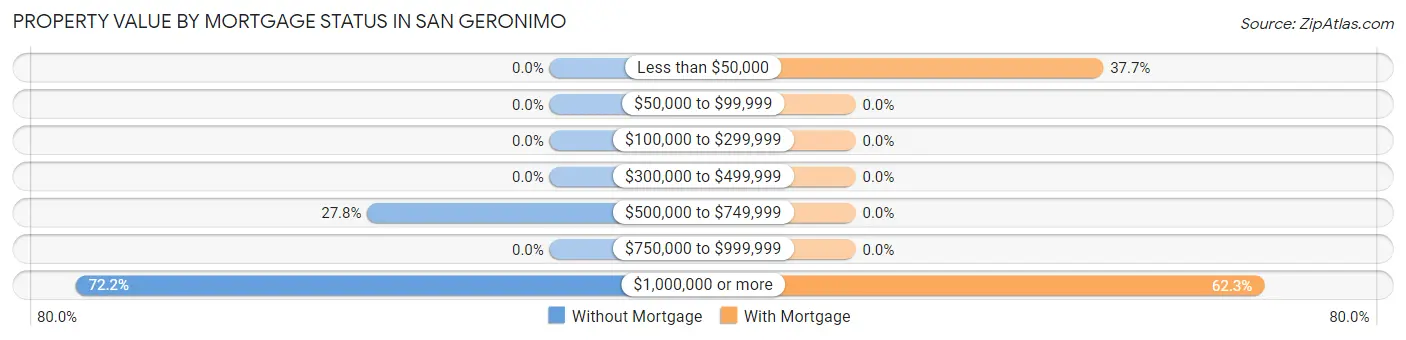
| Property Value | Without Mortgage | With Mortgage |
| Less than $50,000 | 0 (0.0%) | 20 (37.7%) |
| $50,000 to $99,999 | 0 (0.0%) | 0 (0.0%) |
| $100,000 to $299,999 | 0 (0.0%) | 0 (0.0%) |
| $300,000 to $499,999 | 0 (0.0%) | 0 (0.0%) |
| $500,000 to $749,999 | 20 (27.8%) | 0 (0.0%) |
| $750,000 to $999,999 | 0 (0.0%) | 0 (0.0%) |
| $1,000,000 or more | 52 (72.2%) | 33 (62.3%) |
| Total | 72 (100.0%) | 53 (100.0%) |
Household Income by Mortgage Status in San Geronimo
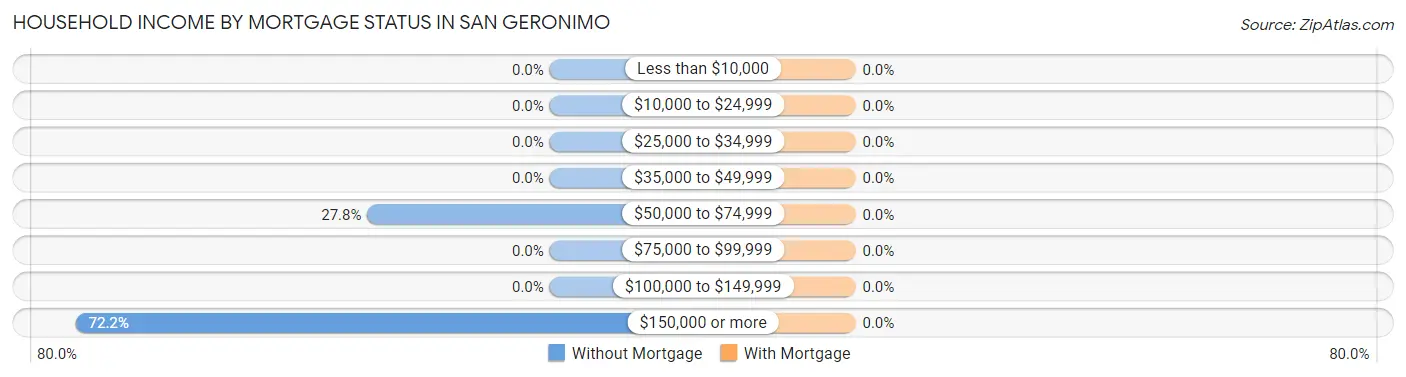
| Household Income | Without Mortgage | With Mortgage |
| Less than $10,000 | 0 (0.0%) | 0 (0.0%) |
| $10,000 to $24,999 | 0 (0.0%) | 0 (0.0%) |
| $25,000 to $34,999 | 0 (0.0%) | 0 (0.0%) |
| $35,000 to $49,999 | 0 (0.0%) | 0 (0.0%) |
| $50,000 to $74,999 | 20 (27.8%) | 0 (0.0%) |
| $75,000 to $99,999 | 0 (0.0%) | 0 (0.0%) |
| $100,000 to $149,999 | 0 (0.0%) | 0 (0.0%) |
| $150,000 or more | 52 (72.2%) | 0 (0.0%) |
| Total | 72 (100.0%) | 53 (100.0%) |
Property Value to Household Income Ratio in San Geronimo
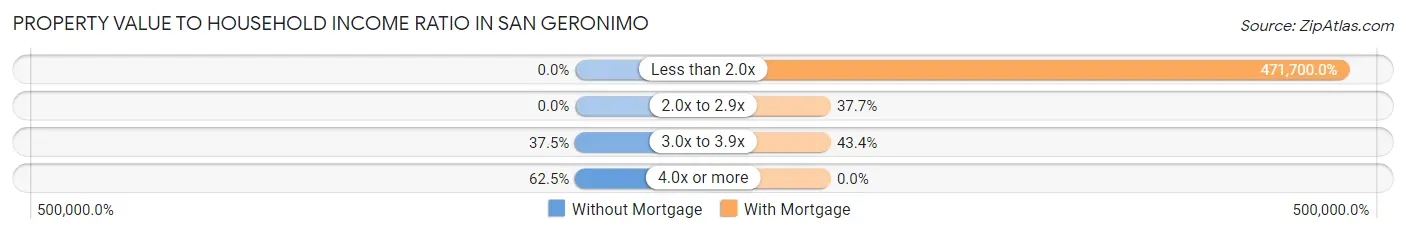
| Value-to-Income Ratio | Without Mortgage | With Mortgage |
| Less than 2.0x | 0 (0.0%) | 250,001 (471,700.0%) |
| 2.0x to 2.9x | 0 (0.0%) | 20 (37.7%) |
| 3.0x to 3.9x | 27 (37.5%) | 23 (43.4%) |
| 4.0x or more | 45 (62.5%) | 0 (0.0%) |
| Total | 72 (100.0%) | 53 (100.0%) |
Real Estate Taxes by Mortgage Status in San Geronimo
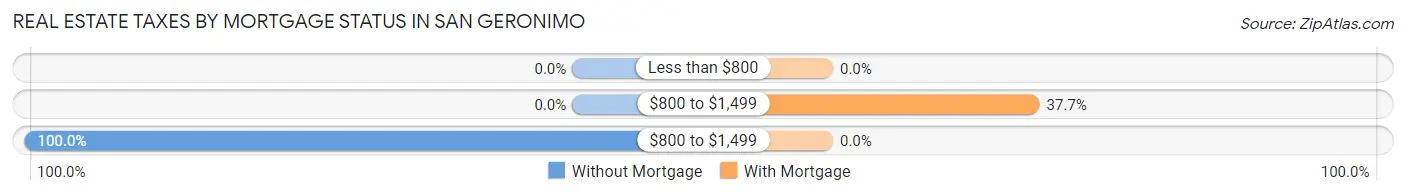
| Property Taxes | Without Mortgage | With Mortgage |
| Less than $800 | 0 (0.0%) | 0 (0.0%) |
| $800 to $1,499 | 0 (0.0%) | 20 (37.7%) |
| $800 to $1,499 | 72 (100.0%) | 0 (0.0%) |
| Total | 72 (100.0%) | 53 (100.0%) |
Health & Disability in San Geronimo
Health Insurance Coverage by Age in San Geronimo
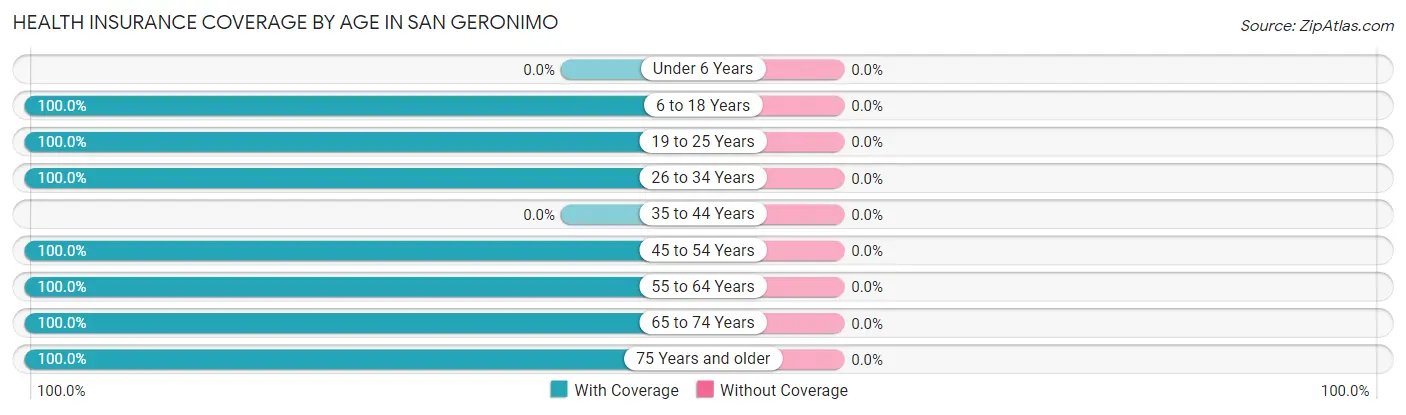
| Age Bracket | With Coverage | Without Coverage |
| Under 6 Years | 0 (0.0%) | 0 (0.0%) |
| 6 to 18 Years | 92 (100.0%) | 0 (0.0%) |
| 19 to 25 Years | 93 (100.0%) | 0 (0.0%) |
| 26 to 34 Years | 16 (100.0%) | 0 (0.0%) |
| 35 to 44 Years | 0 (0.0%) | 0 (0.0%) |
| 45 to 54 Years | 120 (100.0%) | 0 (0.0%) |
| 55 to 64 Years | 21 (100.0%) | 0 (0.0%) |
| 65 to 74 Years | 45 (100.0%) | 0 (0.0%) |
| 75 Years and older | 39 (100.0%) | 0 (0.0%) |
| Total | 426 (100.0%) | 0 (0.0%) |
Health Insurance Coverage by Citizenship Status in San Geronimo
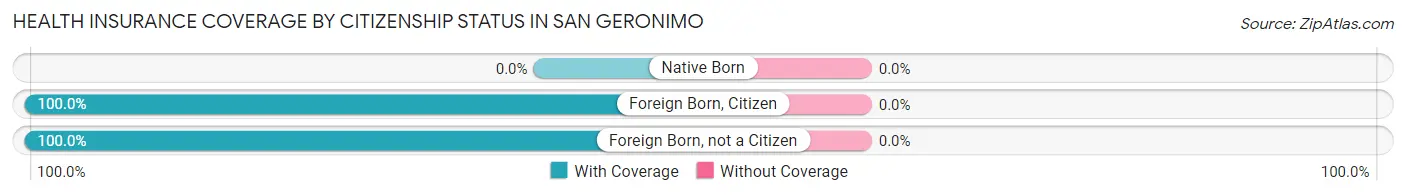
| Citizenship Status | With Coverage | Without Coverage |
| Native Born | 0 (0.0%) | 0 (0.0%) |
| Foreign Born, Citizen | 92 (100.0%) | 0 (0.0%) |
| Foreign Born, not a Citizen | 93 (100.0%) | 0 (0.0%) |
Health Insurance Coverage by Household Income in San Geronimo
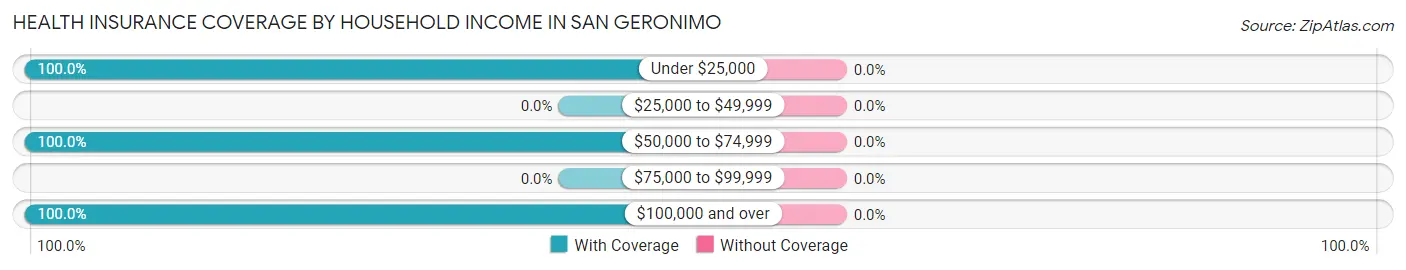
| Household Income | With Coverage | Without Coverage |
| Under $25,000 | 16 (100.0%) | 0 (0.0%) |
| $25,000 to $49,999 | 0 (0.0%) | 0 (0.0%) |
| $50,000 to $74,999 | 39 (100.0%) | 0 (0.0%) |
| $75,000 to $99,999 | 0 (0.0%) | 0 (0.0%) |
| $100,000 and over | 371 (100.0%) | 0 (0.0%) |
Public vs Private Health Insurance Coverage by Age in San Geronimo
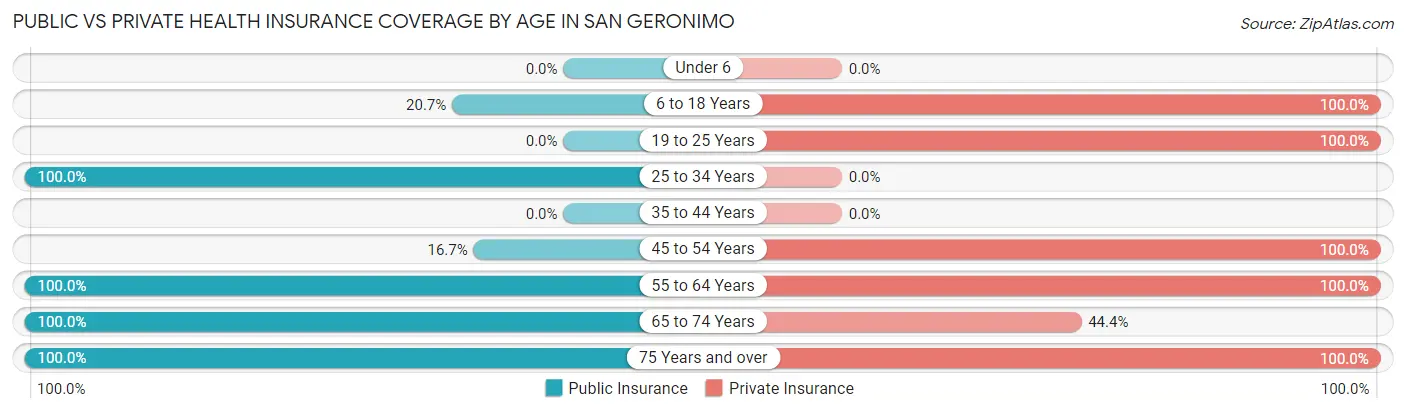
| Age Bracket | Public Insurance | Private Insurance |
| Under 6 | 0 (0.0%) | 0 (0.0%) |
| 6 to 18 Years | 19 (20.6%) | 92 (100.0%) |
| 19 to 25 Years | 0 (0.0%) | 93 (100.0%) |
| 25 to 34 Years | 16 (100.0%) | 0 (0.0%) |
| 35 to 44 Years | 0 (0.0%) | 0 (0.0%) |
| 45 to 54 Years | 20 (16.7%) | 120 (100.0%) |
| 55 to 64 Years | 21 (100.0%) | 21 (100.0%) |
| 65 to 74 Years | 45 (100.0%) | 20 (44.4%) |
| 75 Years and over | 39 (100.0%) | 39 (100.0%) |
| Total | 160 (37.6%) | 385 (90.4%) |
Disability Status by Sex by Age in San Geronimo
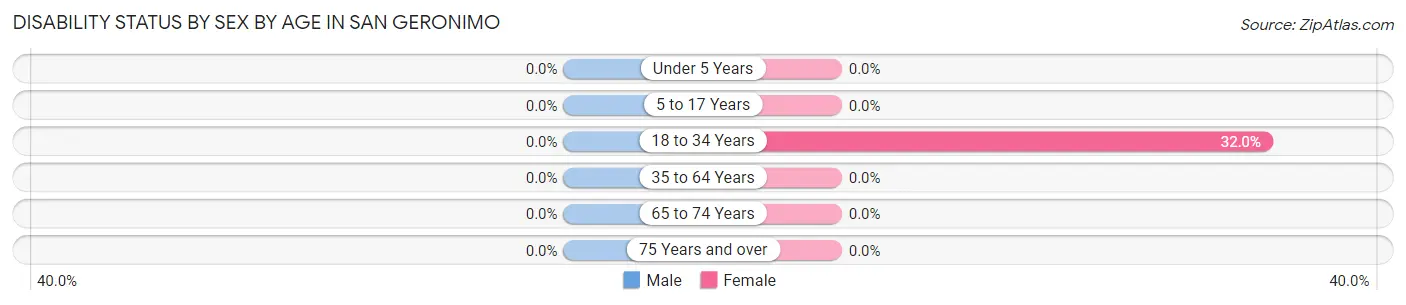
| Age Bracket | Male | Female |
| Under 5 Years | 0 (0.0%) | 0 (0.0%) |
| 5 to 17 Years | 0 (0.0%) | 0 (0.0%) |
| 18 to 34 Years | 0 (0.0%) | 16 (32.0%) |
| 35 to 64 Years | 0 (0.0%) | 0 (0.0%) |
| 65 to 74 Years | 0 (0.0%) | 0 (0.0%) |
| 75 Years and over | 0 (0.0%) | 0 (0.0%) |
Disability Class by Sex by Age in San Geronimo
Disability Class: Hearing Difficulty
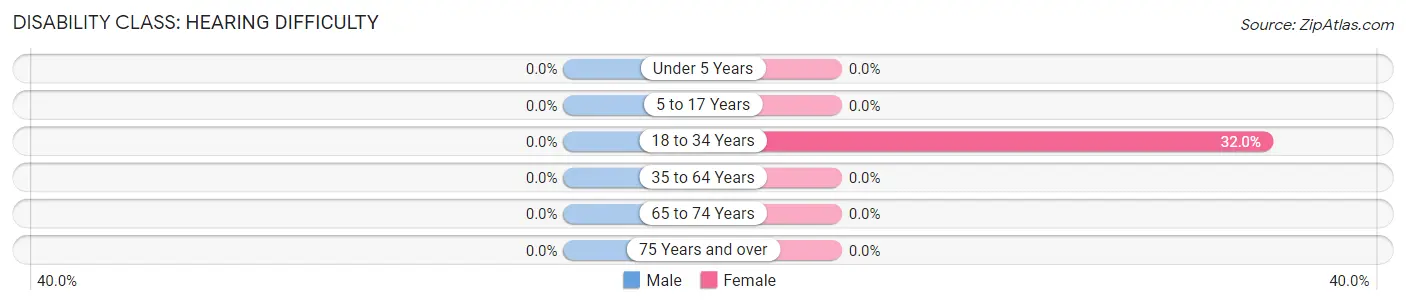
| Age Bracket | Male | Female |
| Under 5 Years | 0 (0.0%) | 0 (0.0%) |
| 5 to 17 Years | 0 (0.0%) | 0 (0.0%) |
| 18 to 34 Years | 0 (0.0%) | 16 (32.0%) |
| 35 to 64 Years | 0 (0.0%) | 0 (0.0%) |
| 65 to 74 Years | 0 (0.0%) | 0 (0.0%) |
| 75 Years and over | 0 (0.0%) | 0 (0.0%) |
Disability Class: Vision Difficulty
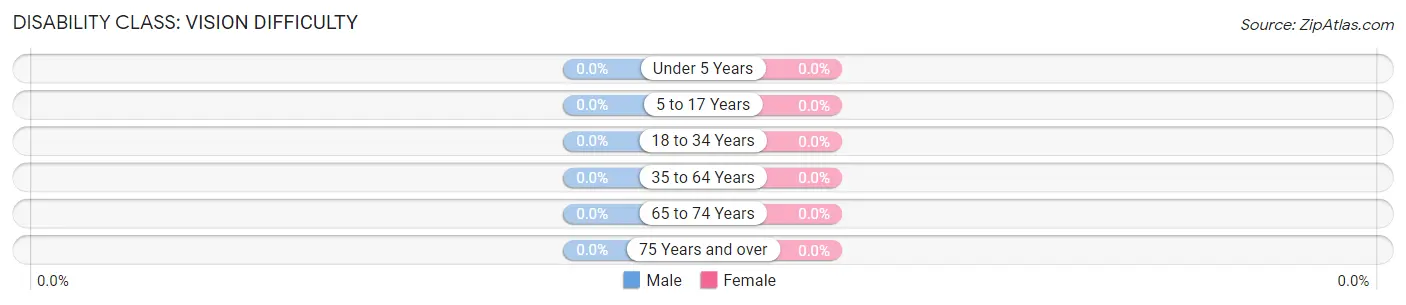
| Age Bracket | Male | Female |
| Under 5 Years | 0 (0.0%) | 0 (0.0%) |
| 5 to 17 Years | 0 (0.0%) | 0 (0.0%) |
| 18 to 34 Years | 0 (0.0%) | 0 (0.0%) |
| 35 to 64 Years | 0 (0.0%) | 0 (0.0%) |
| 65 to 74 Years | 0 (0.0%) | 0 (0.0%) |
| 75 Years and over | 0 (0.0%) | 0 (0.0%) |
Disability Class: Cognitive Difficulty
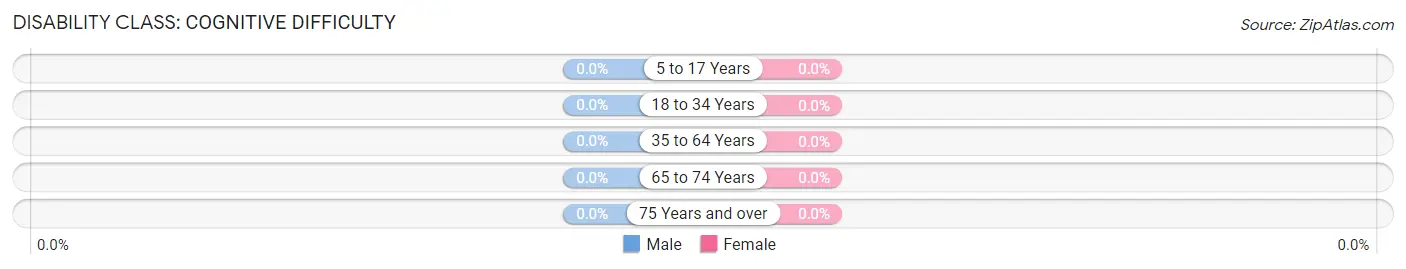
| Age Bracket | Male | Female |
| 5 to 17 Years | 0 (0.0%) | 0 (0.0%) |
| 18 to 34 Years | 0 (0.0%) | 0 (0.0%) |
| 35 to 64 Years | 0 (0.0%) | 0 (0.0%) |
| 65 to 74 Years | 0 (0.0%) | 0 (0.0%) |
| 75 Years and over | 0 (0.0%) | 0 (0.0%) |
Disability Class: Ambulatory Difficulty
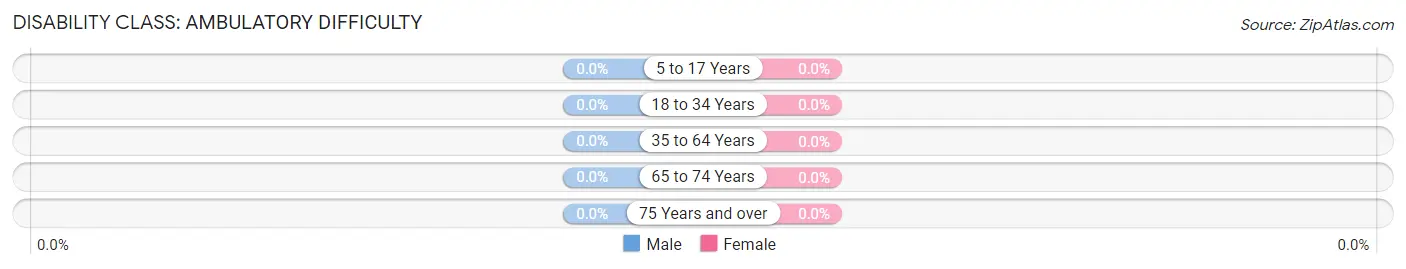
| Age Bracket | Male | Female |
| 5 to 17 Years | 0 (0.0%) | 0 (0.0%) |
| 18 to 34 Years | 0 (0.0%) | 0 (0.0%) |
| 35 to 64 Years | 0 (0.0%) | 0 (0.0%) |
| 65 to 74 Years | 0 (0.0%) | 0 (0.0%) |
| 75 Years and over | 0 (0.0%) | 0 (0.0%) |
Disability Class: Self-Care Difficulty
| Age Bracket | Male | Female |
| 5 to 17 Years | 0 (0.0%) | 0 (0.0%) |
| 18 to 34 Years | 0 (0.0%) | 0 (0.0%) |
| 35 to 64 Years | 0 (0.0%) | 0 (0.0%) |
| 65 to 74 Years | 0 (0.0%) | 0 (0.0%) |
| 75 Years and over | 0 (0.0%) | 0 (0.0%) |
Technology Access in San Geronimo
Computing Device Access in San Geronimo
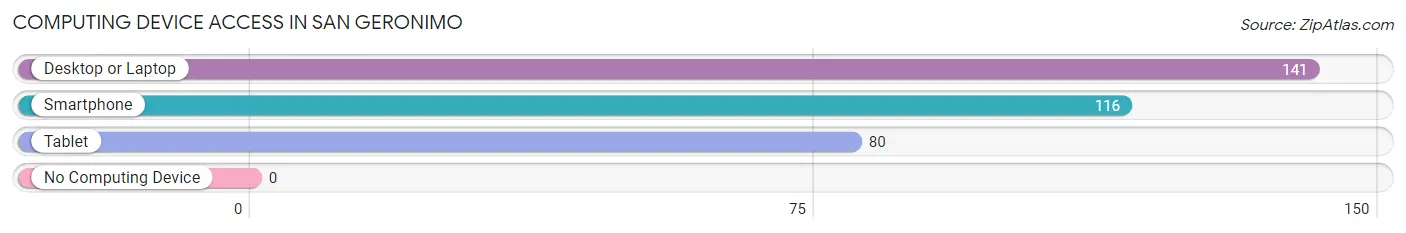
| Device Type | # Households | % Households |
| Desktop or Laptop | 141 | 100.0% |
| Smartphone | 116 | 82.3% |
| Tablet | 80 | 56.7% |
| No Computing Device | 0 | 0.0% |
| Total | 141 | 100.0% |
Internet Access in San Geronimo
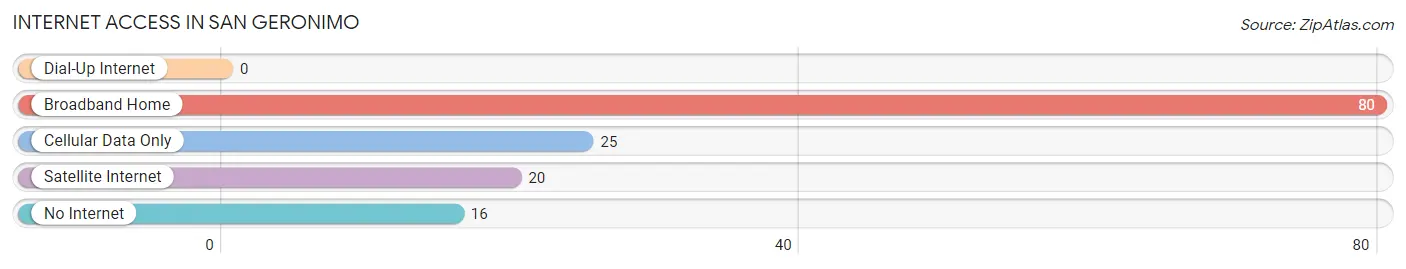
| Internet Type | # Households | % Households |
| Dial-Up Internet | 0 | 0.0% |
| Broadband Home | 80 | 56.7% |
| Cellular Data Only | 25 | 17.7% |
| Satellite Internet | 20 | 14.2% |
| No Internet | 16 | 11.4% |
| Total | 141 | 100.0% |
San Geronimo Summary
San Geronimo is a small unincorporated community located in Marin County, California. It is situated in the San Geronimo Valley, which is part of the larger Marin County Valley. The community is located approximately 25 miles north of San Francisco and is bordered by the towns of Woodacre, Forest Knolls, and Lagunitas.
History
The San Geronimo Valley has a long and rich history. The area was originally inhabited by the Coast Miwok Native Americans, who lived in the area for thousands of years before the arrival of Europeans. The first Europeans to settle in the area were Spanish missionaries, who established the Mission San Rafael Arcangel in 1817. The mission was located in what is now San Rafael, California, and was the first of the 21 missions established in California.
The San Geronimo Valley was part of the Rancho San Geronimo, which was granted to the Pacheco family in 1844. The Pacheco family used the land for cattle ranching and farming. In the late 19th century, the area began to be developed for residential use. The first post office in the area was established in 1891, and the community was officially named San Geronimo in 1895.
Geography
San Geronimo is located in the San Geronimo Valley, which is part of the larger Marin County Valley. The valley is surrounded by hills and mountains, including the San Geronimo Ridge to the east and the San Geronimo Mountains to the west. The valley is drained by the San Geronimo Creek, which flows into the Lagunitas Creek.
The climate in San Geronimo is mild and temperate, with warm summers and cool winters. The average annual temperature is around 60°F (15°C). The area receives an average of 28 inches (71 cm) of precipitation per year.
Economy
The economy of San Geronimo is largely based on tourism and agriculture. The area is home to several wineries, including the San Geronimo Winery and the San Geronimo Valley Vineyards. The area is also home to several farms, which produce a variety of fruits and vegetables.
The area is also home to several businesses, including restaurants, shops, and galleries. The San Geronimo Valley Golf Course is a popular destination for golfers.
Demographics
As of the 2010 census, the population of San Geronimo was 1,817. The racial makeup of the town was 79.3% White, 0.7% African American, 0.3% Native American, 8.2% Asian, 0.1% Pacific Islander, 8.2% from other races, and 3.4% from two or more races. Hispanic or Latino of any race were 18.2% of the population.
The median household income in San Geronimo was $90,917, and the median family income was $103,917. The per capita income was $45,917. About 8.2% of families and 10.2% of the population were below the poverty line.
San Geronimo is served by the Marin County Office of Education and the Marin County Library. The town is also home to several churches, including the San Geronimo Valley Presbyterian Church and the San Geronimo Valley Community Church.
Common Questions
What is Per Capita Income in San Geronimo?
Per Capita income in San Geronimo is $115,881.
What is the Median Family Income in San Geronimo?
Median Family Income in San Geronimo is $250,001.
What is the Median Household income in San Geronimo?
Median Household Income in San Geronimo is $217,375.
What is Inequality or Gini Index in San Geronimo?
Inequality or Gini Index in San Geronimo is 0.43.
What is the Total Population of San Geronimo?
Total Population of San Geronimo is 427.
What is the Total Male Population of San Geronimo?
Total Male Population of San Geronimo is 252.
What is the Total Female Population of San Geronimo?
Total Female Population of San Geronimo is 175.
What is the Ratio of Males per 100 Females in San Geronimo?
There are 144.00 Males per 100 Females in San Geronimo.
What is the Ratio of Females per 100 Males in San Geronimo?
There are 69.44 Females per 100 Males in San Geronimo.
What is the Median Population Age in San Geronimo?
Median Population Age in San Geronimo is 46.1 Years.
What is the Average Family Size in San Geronimo
Average Family Size in San Geronimo is 3.9 People.
What is the Average Household Size in San Geronimo
Average Household Size in San Geronimo is 3.0 People.
How Large is the Labor Force in San Geronimo?
There are 226 People in the Labor Forcein in San Geronimo.
What is the Percentage of People in the Labor Force in San Geronimo?
59.6% of People are in the Labor Force in San Geronimo.