Chinchilla, PA Map & Demographics
Chinchilla Map
Chinchilla Overview
$48,747
PER CAPITA INCOME
$158,603
AVG FAMILY INCOME
$109,231
AVG HOUSEHOLD INCOME
1.7%
WAGE / INCOME GAP [ % ]
98.3¢/ $1
WAGE / INCOME GAP [ $ ]
0.37
INEQUALITY / GINI INDEX
2,186
TOTAL POPULATION
1,003
MALE POPULATION
1,183
FEMALE POPULATION
84.78
MALES / 100 FEMALES
117.95
FEMALES / 100 MALES
33.1
MEDIAN AGE
3.6
AVG FAMILY SIZE
2.8
AVG HOUSEHOLD SIZE
1,124
LABOR FORCE [ PEOPLE ]
69.4%
PERCENT IN LABOR FORCE
7.7%
UNEMPLOYMENT RATE
Chinchilla Area Codes
Income in Chinchilla
Income Overview in Chinchilla
Per Capita Income in Chinchilla is $48,747, while median incomes of families and households are $158,603 and $109,231 respectively.
| Characteristic | Number | Measure |
| Per Capita Income | 2,186 | $48,747 |
| Median Family Income | 493 | $158,603 |
| Mean Family Income | 493 | $152,844 |
| Median Household Income | 780 | $109,231 |
| Mean Household Income | 780 | $134,165 |
| Income Deficit | 493 | $0 |
| Wage / Income Gap (%) | 2,186 | 1.67% |
| Wage / Income Gap ($) | 2,186 | 98.33¢ per $1 |
| Gini / Inequality Index | 2,186 | 0.37 |
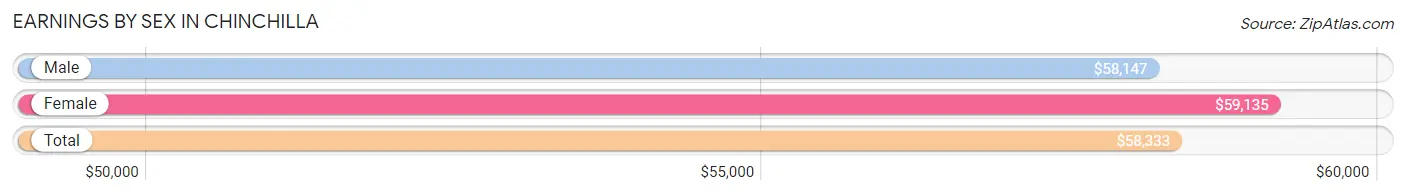
Earnings by Sex in Chinchilla
Average Earnings in Chinchilla are $58,333, $58,147 for men and $59,135 for women, a difference of 1.7%.
| Sex | Number | Average Earnings |
| Male | 585 (50.3%) | $58,147 |
| Female | 577 (49.7%) | $59,135 |
| Total | 1,162 (100.0%) | $58,333 |
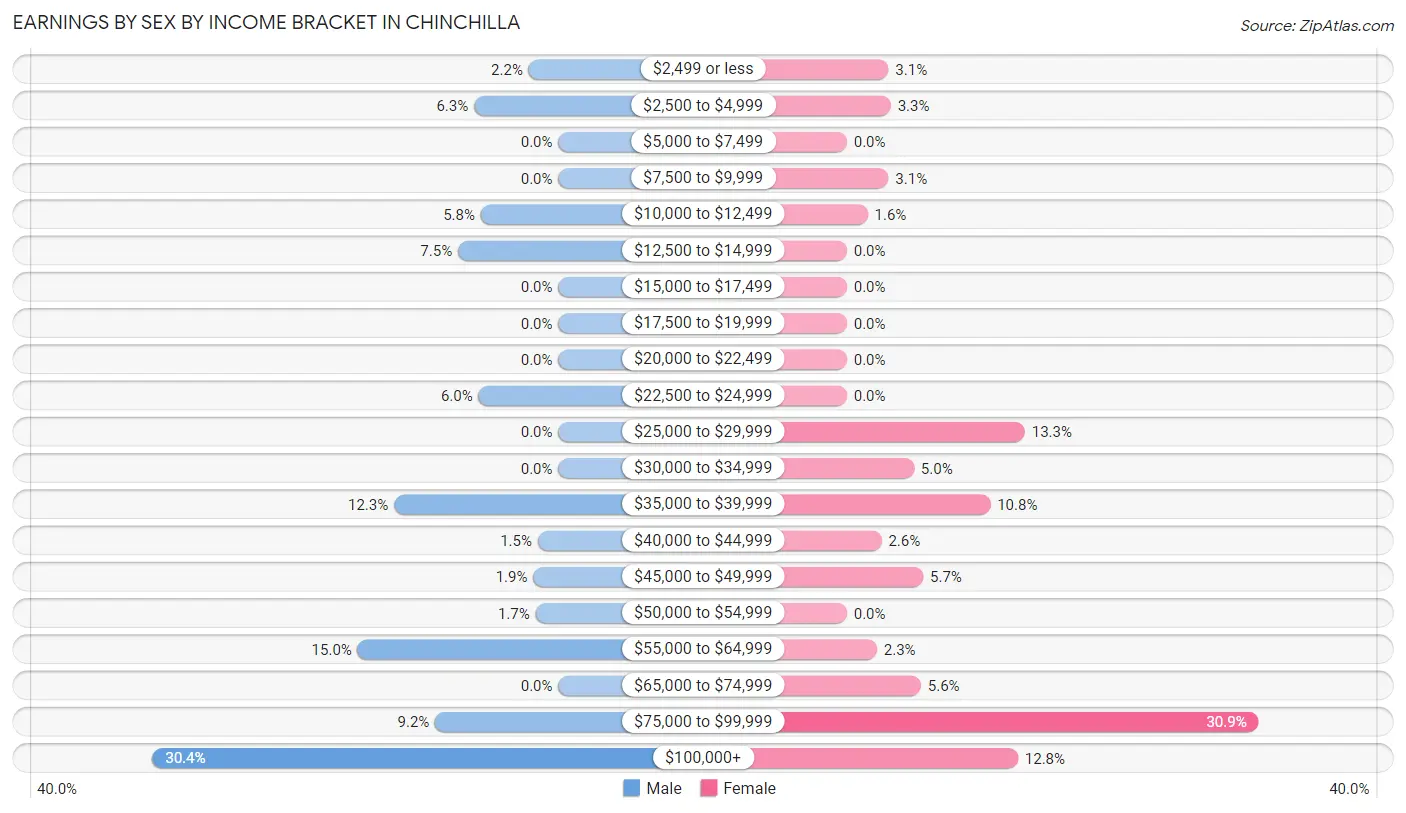
Earnings by Sex by Income Bracket in Chinchilla
The most common earnings brackets in Chinchilla are $100,000+ for men (178 | 30.4%) and $75,000 to $99,999 for women (178 | 30.8%).
| Income | Male | Female |
| $2,499 or less | 13 (2.2%) | 18 (3.1%) |
| $2,500 to $4,999 | 37 (6.3%) | 19 (3.3%) |
| $5,000 to $7,499 | 0 (0.0%) | 0 (0.0%) |
| $7,500 to $9,999 | 0 (0.0%) | 18 (3.1%) |
| $10,000 to $12,499 | 34 (5.8%) | 9 (1.6%) |
| $12,500 to $14,999 | 44 (7.5%) | 0 (0.0%) |
| $15,000 to $17,499 | 0 (0.0%) | 0 (0.0%) |
| $17,500 to $19,999 | 0 (0.0%) | 0 (0.0%) |
| $20,000 to $22,499 | 0 (0.0%) | 0 (0.0%) |
| $22,500 to $24,999 | 35 (6.0%) | 0 (0.0%) |
| $25,000 to $29,999 | 0 (0.0%) | 77 (13.3%) |
| $30,000 to $34,999 | 0 (0.0%) | 29 (5.0%) |
| $35,000 to $39,999 | 72 (12.3%) | 62 (10.7%) |
| $40,000 to $44,999 | 9 (1.5%) | 15 (2.6%) |
| $45,000 to $49,999 | 11 (1.9%) | 33 (5.7%) |
| $50,000 to $54,999 | 10 (1.7%) | 0 (0.0%) |
| $55,000 to $64,999 | 88 (15.0%) | 13 (2.2%) |
| $65,000 to $74,999 | 0 (0.0%) | 32 (5.6%) |
| $75,000 to $99,999 | 54 (9.2%) | 178 (30.8%) |
| $100,000+ | 178 (30.4%) | 74 (12.8%) |
| Total | 585 (100.0%) | 577 (100.0%) |
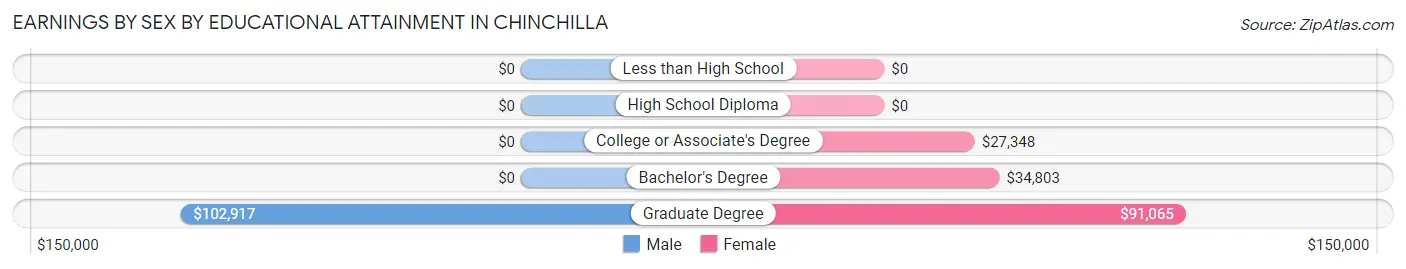
Earnings by Sex by Educational Attainment in Chinchilla
Average earnings in Chinchilla are $59,754 for men and $79,125 for women, a difference of 24.5%. Men with an educational attainment of graduate degree enjoy the highest average annual earnings of $102,917, while those with graduate degree education earn the least with $102,917. Women with an educational attainment of graduate degree earn the most with the average annual earnings of $91,065, while those with college or associate's degree education have the smallest earnings of $27,348.
| Educational Attainment | Male Income | Female Income |
| Less than High School | - | - |
| High School Diploma | - | - |
| College or Associate's Degree | - | - |
| Bachelor's Degree | - | - |
| Graduate Degree | $102,917 | $91,065 |
| Total | $59,754 | $79,125 |
Family Income in Chinchilla
Family Income Brackets in Chinchilla
According to the Chinchilla family income data, there are 160 families falling into the $150,000 to $199,999 income range, which is the most common income bracket and makes up 32.5% of all families.
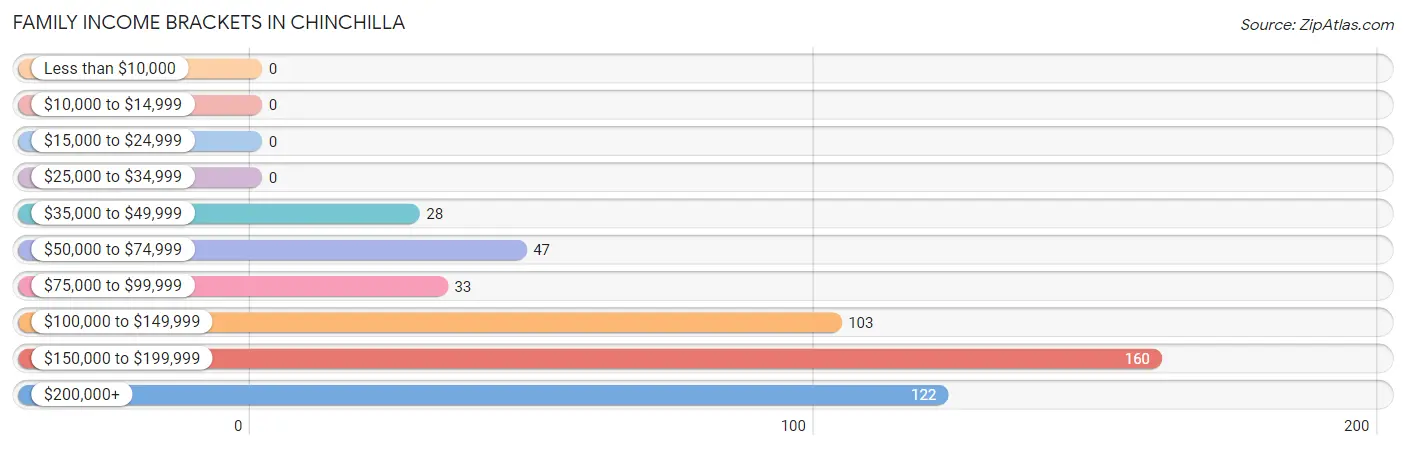
| Income Bracket | # Families | % Families |
| Less than $10,000 | 0 | 0.0% |
| $10,000 to $14,999 | 0 | 0.0% |
| $15,000 to $24,999 | 0 | 0.0% |
| $25,000 to $34,999 | 0 | 0.0% |
| $35,000 to $49,999 | 28 | 5.7% |
| $50,000 to $74,999 | 47 | 9.5% |
| $75,000 to $99,999 | 33 | 6.7% |
| $100,000 to $149,999 | 103 | 20.9% |
| $150,000 to $199,999 | 160 | 32.5% |
| $200,000+ | 122 | 24.7% |
Family Income by Famaliy Size in Chinchilla
5-person families (42 | 8.5%) account for the highest median family income in Chinchilla with $236,154 per family, while 2-person families (211 | 42.8%) have the highest median income of $65,404 per family member.
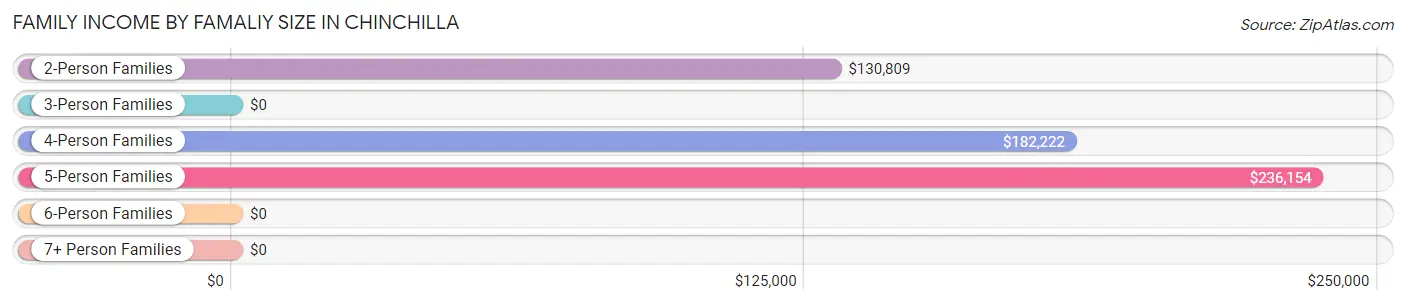
| Income Bracket | # Families | Median Income |
| 2-Person Families | 211 (42.8%) | $130,809 |
| 3-Person Families | 75 (15.2%) | $0 |
| 4-Person Families | 100 (20.3%) | $182,222 |
| 5-Person Families | 42 (8.5%) | $236,154 |
| 6-Person Families | 29 (5.9%) | $0 |
| 7+ Person Families | 36 (7.3%) | $0 |
| Total | 493 (100.0%) | $158,603 |
Family Income by Number of Earners in Chinchilla
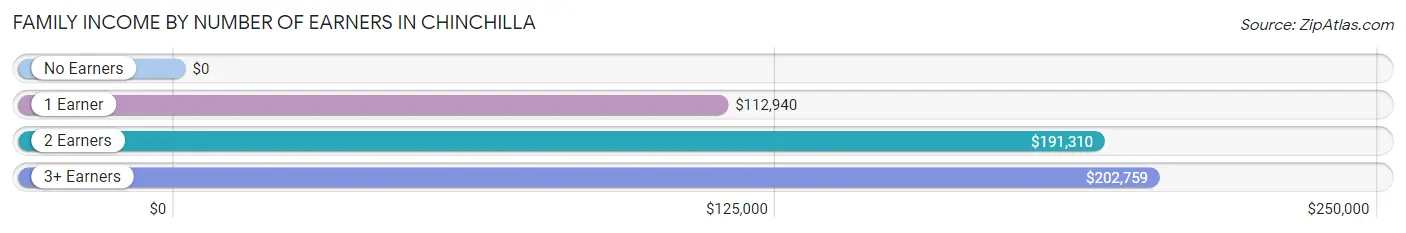
| Number of Earners | # Families | Median Income |
| No Earners | 24 (4.9%) | $0 |
| 1 Earner | 175 (35.5%) | $112,940 |
| 2 Earners | 216 (43.8%) | $191,310 |
| 3+ Earners | 78 (15.8%) | $202,759 |
| Total | 493 (100.0%) | $158,603 |
Household Income in Chinchilla
Household Income Brackets in Chinchilla
With 193 households falling in the category, the $75,000 to $99,999 income range is the most frequent in Chinchilla, accounting for 24.7% of all households.
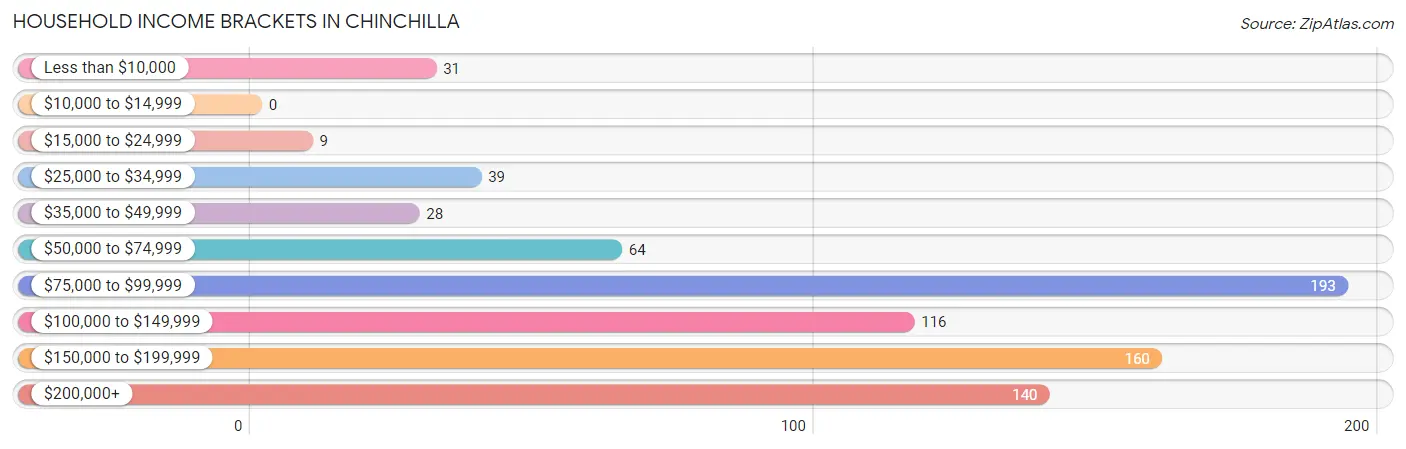
| Income Bracket | # Households | % Households |
| Less than $10,000 | 31 | 4.0% |
| $10,000 to $14,999 | 0 | 0.0% |
| $15,000 to $24,999 | 9 | 1.2% |
| $25,000 to $34,999 | 39 | 5.0% |
| $35,000 to $49,999 | 28 | 3.6% |
| $50,000 to $74,999 | 64 | 8.2% |
| $75,000 to $99,999 | 193 | 24.7% |
| $100,000 to $149,999 | 116 | 14.9% |
| $150,000 to $199,999 | 160 | 20.5% |
| $200,000+ | 140 | 17.9% |
Household Income by Householder Age in Chinchilla
The median household income in Chinchilla is $109,231, with the highest median household income of $200,590 found in the 45 to 64 years age bracket for the primary householder. A total of 233 households (29.9%) fall into this category.
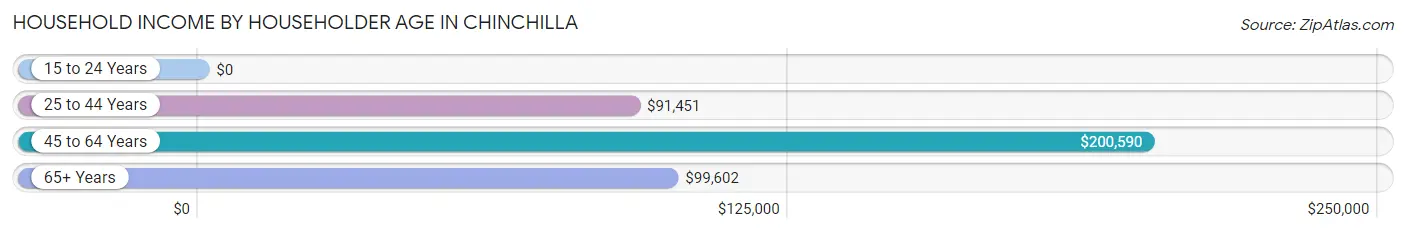
| Income Bracket | # Households | Median Income |
| 15 to 24 Years | 0 (0.0%) | $0 |
| 25 to 44 Years | 238 (30.5%) | $91,451 |
| 45 to 64 Years | 233 (29.9%) | $200,590 |
| 65+ Years | 309 (39.6%) | $99,602 |
| Total | 780 (100.0%) | $109,231 |
Poverty in Chinchilla
Income Below Poverty by Sex and Age in Chinchilla
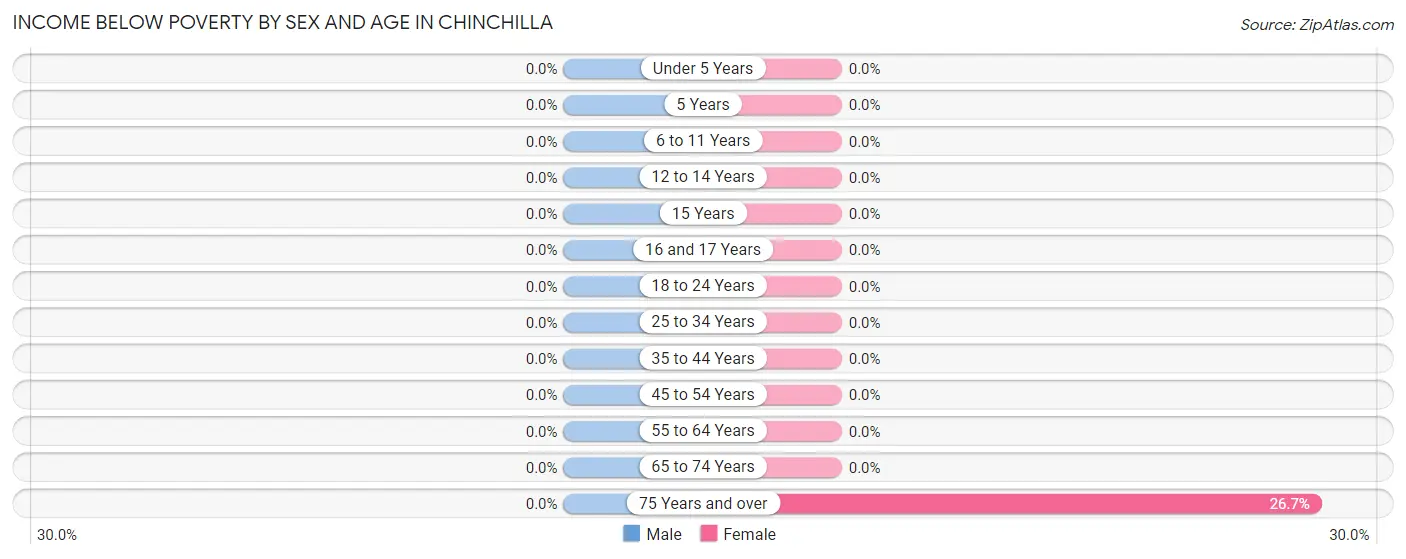
| Age Bracket | Male | Female |
| Under 5 Years | 0 (0.0%) | 0 (0.0%) |
| 5 Years | 0 (0.0%) | 0 (0.0%) |
| 6 to 11 Years | 0 (0.0%) | 0 (0.0%) |
| 12 to 14 Years | 0 (0.0%) | 0 (0.0%) |
| 15 Years | 0 (0.0%) | 0 (0.0%) |
| 16 and 17 Years | 0 (0.0%) | 0 (0.0%) |
| 18 to 24 Years | 0 (0.0%) | 0 (0.0%) |
| 25 to 34 Years | 0 (0.0%) | 0 (0.0%) |
| 35 to 44 Years | 0 (0.0%) | 0 (0.0%) |
| 45 to 54 Years | 0 (0.0%) | 0 (0.0%) |
| 55 to 64 Years | 0 (0.0%) | 0 (0.0%) |
| 65 to 74 Years | 0 (0.0%) | 0 (0.0%) |
| 75 Years and over | 0 (0.0%) | 31 (26.7%) |
| Total | 0 (0.0%) | 31 (2.6%) |
Income Above Poverty by Sex and Age in Chinchilla
According to the poverty statistics in Chinchilla, males aged under 5 years and females aged under 5 years are the age groups that are most secure financially, with 100.0% of males and 100.0% of females in these age groups living above the poverty line.
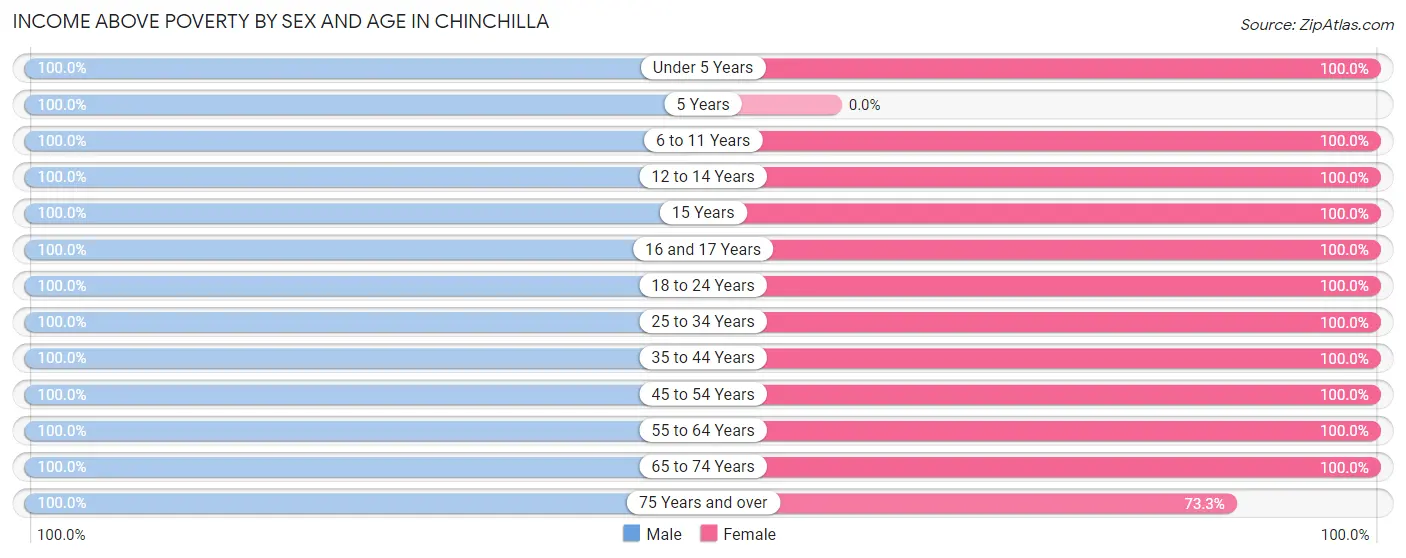
| Age Bracket | Male | Female |
| Under 5 Years | 36 (100.0%) | 28 (100.0%) |
| 5 Years | 37 (100.0%) | 0 (0.0%) |
| 6 to 11 Years | 132 (100.0%) | 186 (100.0%) |
| 12 to 14 Years | 54 (100.0%) | 37 (100.0%) |
| 15 Years | 13 (100.0%) | 44 (100.0%) |
| 16 and 17 Years | 30 (100.0%) | 18 (100.0%) |
| 18 to 24 Years | 42 (100.0%) | 81 (100.0%) |
| 25 to 34 Years | 186 (100.0%) | 258 (100.0%) |
| 35 to 44 Years | 34 (100.0%) | 66 (100.0%) |
| 45 to 54 Years | 133 (100.0%) | 84 (100.0%) |
| 55 to 64 Years | 92 (100.0%) | 114 (100.0%) |
| 65 to 74 Years | 149 (100.0%) | 151 (100.0%) |
| 75 Years and over | 65 (100.0%) | 85 (73.3%) |
| Total | 1,003 (100.0%) | 1,152 (97.4%) |
Income Below Poverty Among Married-Couple Families in Chinchilla
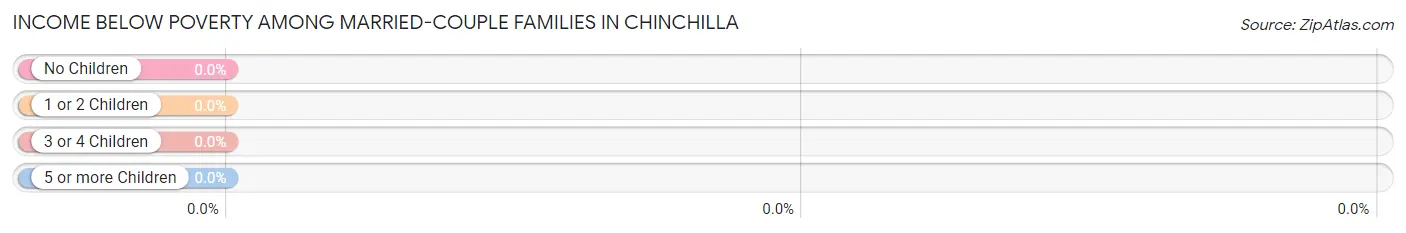
| Children | Above Poverty | Below Poverty |
| No Children | 223 (100.0%) | 0 (0.0%) |
| 1 or 2 Children | 110 (100.0%) | 0 (0.0%) |
| 3 or 4 Children | 27 (100.0%) | 0 (0.0%) |
| 5 or more Children | 36 (100.0%) | 0 (0.0%) |
| Total | 396 (100.0%) | 0 (0.0%) |
Income Below Poverty Among Single-Parent Households in Chinchilla
| Children | Single Father | Single Mother |
| No Children | 0 (0.0%) | 0 (0.0%) |
| 1 or 2 Children | 0 (0.0%) | 0 (0.0%) |
| 3 or 4 Children | 0 (0.0%) | 0 (0.0%) |
| 5 or more Children | 0 (0.0%) | 0 (0.0%) |
| Total | 0 (0.0%) | 0 (0.0%) |
Income Below Poverty Among Married-Couple vs Single-Parent Households in Chinchilla
| Children | Married-Couple Families | Single-Parent Households |
| No Children | 0 (0.0%) | 0 (0.0%) |
| 1 or 2 Children | 0 (0.0%) | 0 (0.0%) |
| 3 or 4 Children | 0 (0.0%) | 0 (0.0%) |
| 5 or more Children | 0 (0.0%) | 0 (0.0%) |
| Total | 0 (0.0%) | 0 (0.0%) |
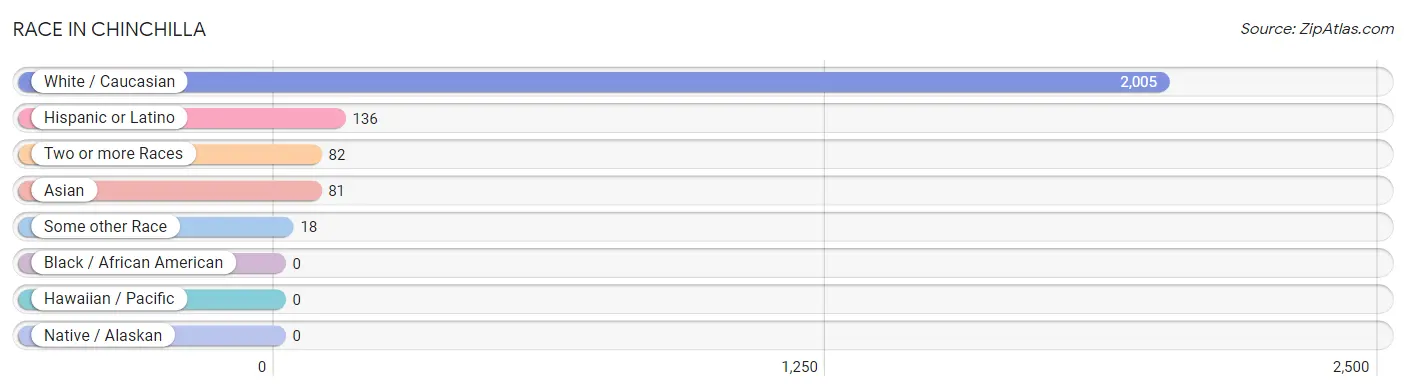
Race in Chinchilla
The most populous races in Chinchilla are White / Caucasian (2,005 | 91.7%), Hispanic or Latino (136 | 6.2%), and Two or more Races (82 | 3.7%).
| Race | # Population | % Population |
| Asian | 81 | 3.7% |
| Black / African American | 0 | 0.0% |
| Hawaiian / Pacific | 0 | 0.0% |
| Hispanic or Latino | 136 | 6.2% |
| Native / Alaskan | 0 | 0.0% |
| White / Caucasian | 2,005 | 91.7% |
| Two or more Races | 82 | 3.7% |
| Some other Race | 18 | 0.8% |
| Total | 2,186 | 100.0% |
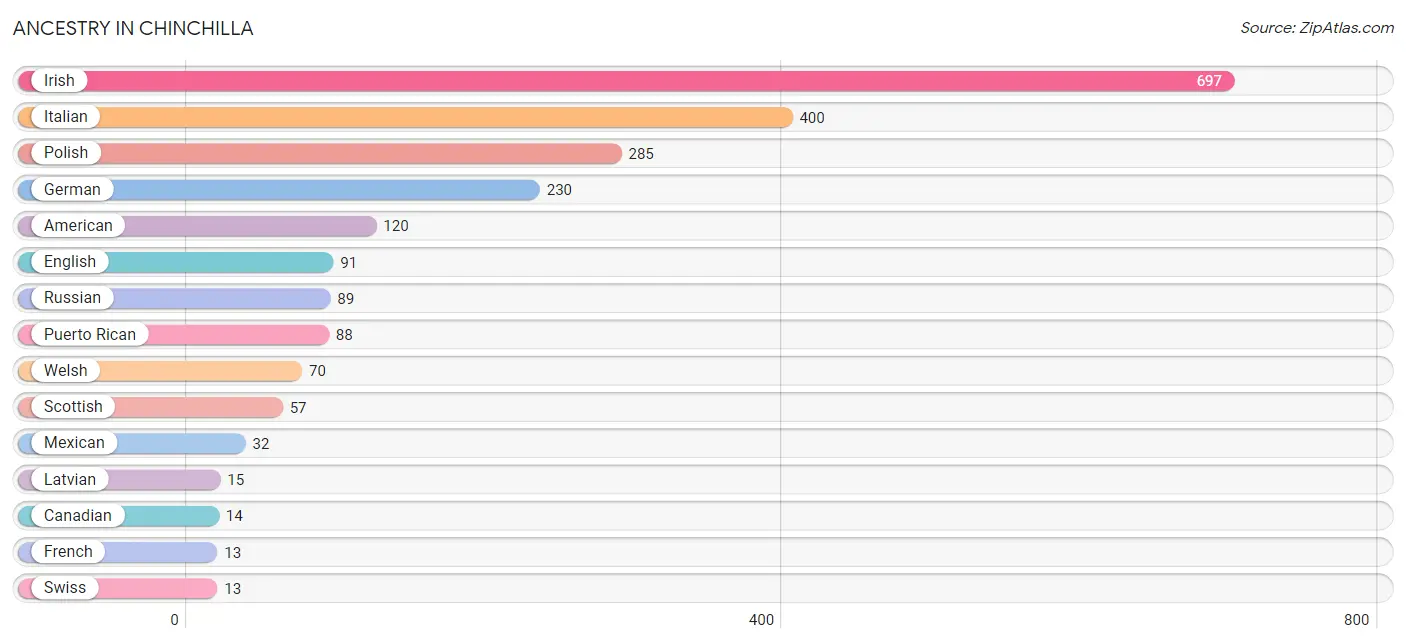
Ancestry in Chinchilla
The most populous ancestries reported in Chinchilla are Irish (697 | 31.9%), Italian (400 | 18.3%), Polish (285 | 13.0%), German (230 | 10.5%), and American (120 | 5.5%), together accounting for 79.2% of all Chinchilla residents.
| Ancestry | # Population | % Population |
| American | 120 | 5.5% |
| Canadian | 14 | 0.6% |
| Dutch | 7 | 0.3% |
| English | 91 | 4.2% |
| French | 13 | 0.6% |
| German | 230 | 10.5% |
| Irish | 697 | 31.9% |
| Italian | 400 | 18.3% |
| Latvian | 15 | 0.7% |
| Mexican | 32 | 1.5% |
| Polish | 285 | 13.0% |
| Puerto Rican | 88 | 4.0% |
| Russian | 89 | 4.1% |
| Scottish | 57 | 2.6% |
| Swiss | 13 | 0.6% |
| Welsh | 70 | 3.2% | View All 16 Rows |
Immigrants in Chinchilla
The most numerous immigrant groups reported in Chinchilla came from Asia (81 | 3.7%), Pakistan (81 | 3.7%), South Central Asia (81 | 3.7%), Eastern Europe (57 | 2.6%), and Europe (57 | 2.6%), together accounting for 16.4% of all Chinchilla residents.
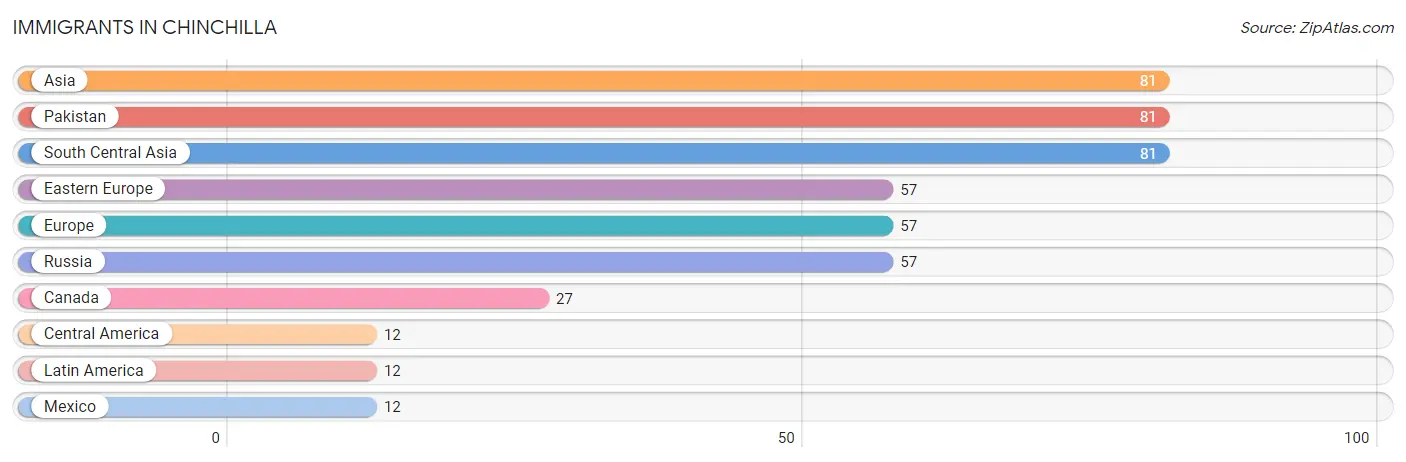
| Immigration Origin | # Population | % Population |
| Asia | 81 | 3.7% |
| Canada | 27 | 1.2% |
| Central America | 12 | 0.5% |
| Eastern Europe | 57 | 2.6% |
| Europe | 57 | 2.6% |
| Latin America | 12 | 0.5% |
| Mexico | 12 | 0.5% |
| Pakistan | 81 | 3.7% |
| Russia | 57 | 2.6% |
| South Central Asia | 81 | 3.7% | View All 10 Rows |
Sex and Age in Chinchilla
Sex and Age in Chinchilla
The most populous age groups in Chinchilla are 10 to 14 Years (134 | 13.4%) for men and 25 to 29 Years (133 | 11.2%) for women.
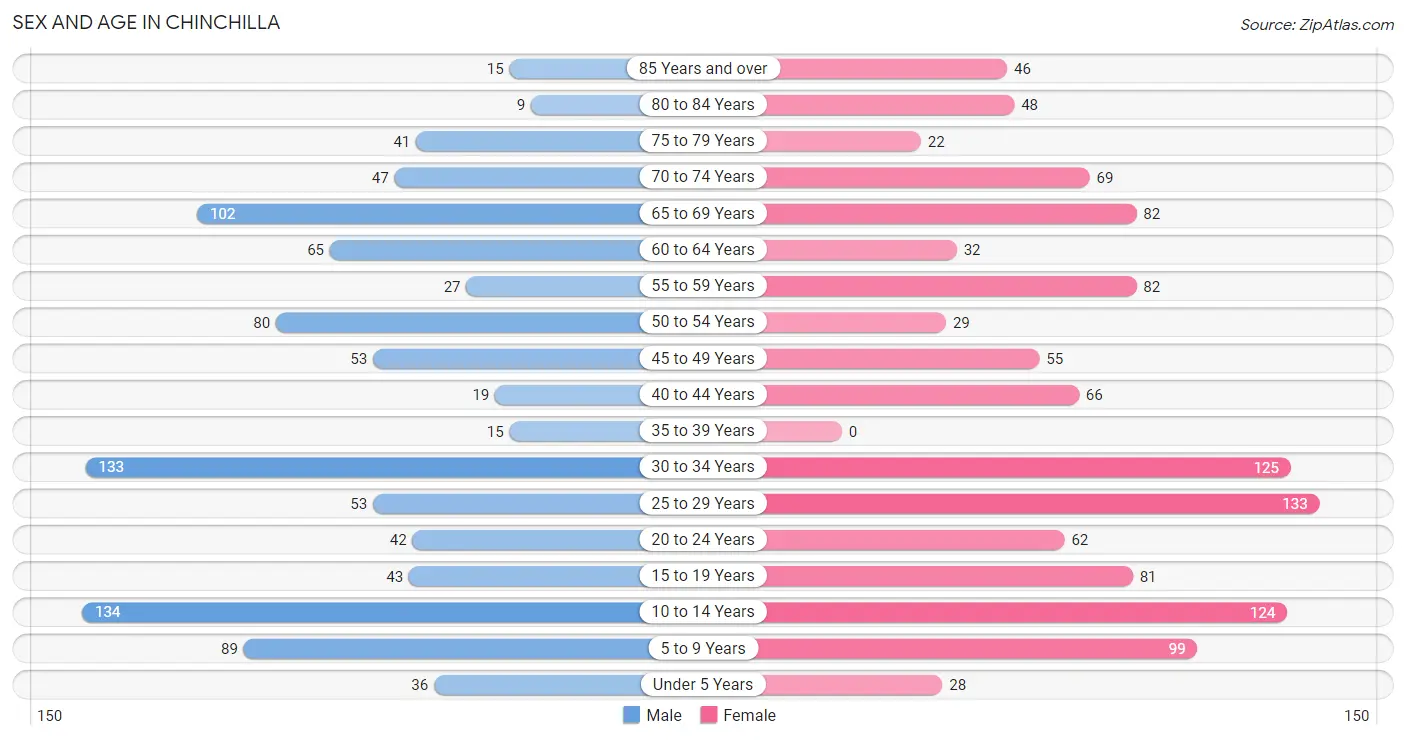
| Age Bracket | Male | Female |
| Under 5 Years | 36 (3.6%) | 28 (2.4%) |
| 5 to 9 Years | 89 (8.9%) | 99 (8.4%) |
| 10 to 14 Years | 134 (13.4%) | 124 (10.5%) |
| 15 to 19 Years | 43 (4.3%) | 81 (6.9%) |
| 20 to 24 Years | 42 (4.2%) | 62 (5.2%) |
| 25 to 29 Years | 53 (5.3%) | 133 (11.2%) |
| 30 to 34 Years | 133 (13.3%) | 125 (10.6%) |
| 35 to 39 Years | 15 (1.5%) | 0 (0.0%) |
| 40 to 44 Years | 19 (1.9%) | 66 (5.6%) |
| 45 to 49 Years | 53 (5.3%) | 55 (4.6%) |
| 50 to 54 Years | 80 (8.0%) | 29 (2.5%) |
| 55 to 59 Years | 27 (2.7%) | 82 (6.9%) |
| 60 to 64 Years | 65 (6.5%) | 32 (2.7%) |
| 65 to 69 Years | 102 (10.2%) | 82 (6.9%) |
| 70 to 74 Years | 47 (4.7%) | 69 (5.8%) |
| 75 to 79 Years | 41 (4.1%) | 22 (1.9%) |
| 80 to 84 Years | 9 (0.9%) | 48 (4.1%) |
| 85 Years and over | 15 (1.5%) | 46 (3.9%) |
| Total | 1,003 (100.0%) | 1,183 (100.0%) |
Families and Households in Chinchilla
Median Family Size in Chinchilla
The median family size in Chinchilla is 3.65 persons per family, with single female/mother families (77 | 15.6%) accounting for the largest median family size of 5.53 persons per family. On the other hand, single male/father families (20 | 4.1%) represent the smallest median family size with 2.85 persons per family.
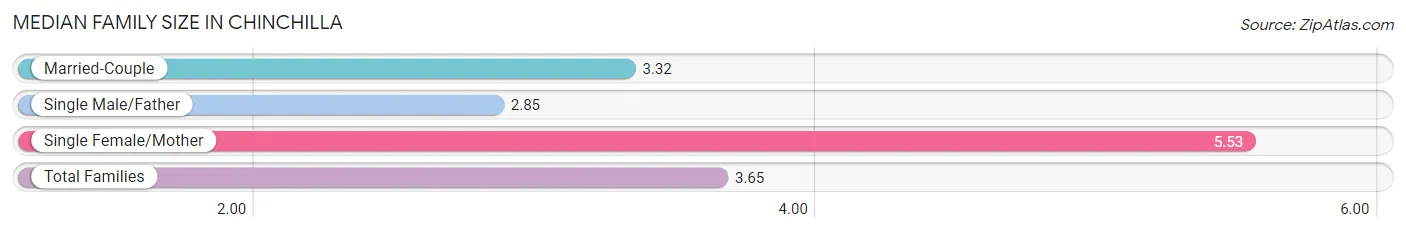
| Family Type | # Families | Family Size |
| Married-Couple | 396 (80.3%) | 3.32 |
| Single Male/Father | 20 (4.1%) | 2.85 |
| Single Female/Mother | 77 (15.6%) | 5.53 |
| Total Families | 493 (100.0%) | 3.65 |
Median Household Size in Chinchilla
The median household size in Chinchilla is 2.80 persons per household, with single female/mother households (77 | 9.9%) accounting for the largest median household size of 5.53 persons per household. non-family households (287 | 36.8%) represent the smallest median household size with 1.35 persons per household.
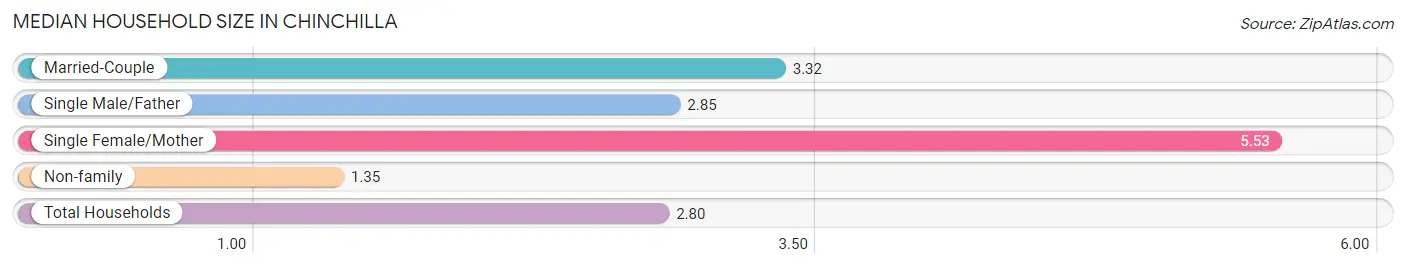
| Household Type | # Households | Household Size |
| Married-Couple | 396 (50.8%) | 3.32 |
| Single Male/Father | 20 (2.6%) | 2.85 |
| Single Female/Mother | 77 (9.9%) | 5.53 |
| Non-family | 287 (36.8%) | 1.35 |
| Total Households | 780 (100.0%) | 2.80 |
Household Size by Marriage Status in Chinchilla
Out of a total of 780 households in Chinchilla, 493 (63.2%) are family households, while 287 (36.8%) are nonfamily households. The most numerous type of family households are 2-person households, comprising 211, and the most common type of nonfamily households are 1-person households, comprising 195.
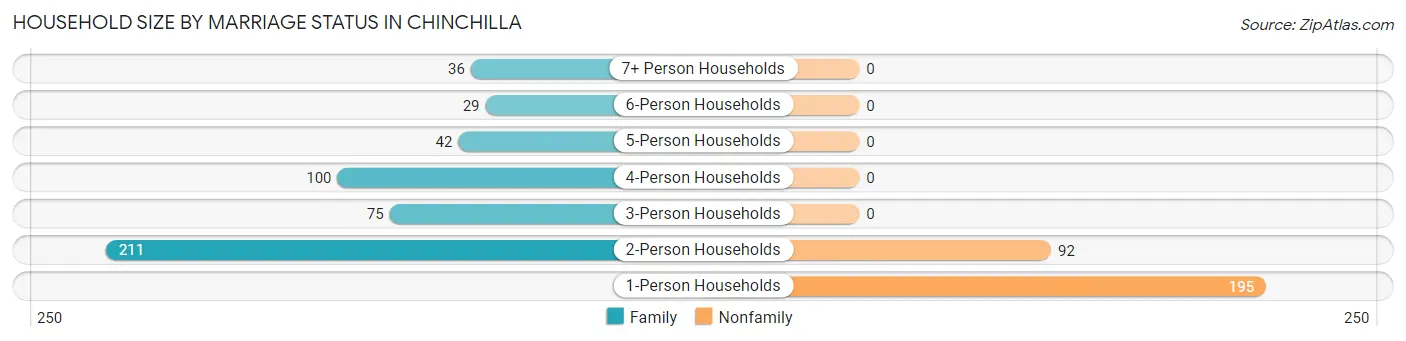
| Household Size | Family Households | Nonfamily Households |
| 1-Person Households | - | 195 (25.0%) |
| 2-Person Households | 211 (27.1%) | 92 (11.8%) |
| 3-Person Households | 75 (9.6%) | 0 (0.0%) |
| 4-Person Households | 100 (12.8%) | 0 (0.0%) |
| 5-Person Households | 42 (5.4%) | 0 (0.0%) |
| 6-Person Households | 29 (3.7%) | 0 (0.0%) |
| 7+ Person Households | 36 (4.6%) | 0 (0.0%) |
| Total | 493 (63.2%) | 287 (36.8%) |
Female Fertility in Chinchilla
Fertility by Age in Chinchilla
| Age Bracket | Women with Births | Births / 1,000 Women |
| 15 to 19 years | 0 (0.0%) | 0.0 |
| 20 to 34 years | 0 (0.0%) | 0.0 |
| 35 to 50 years | 0 (0.0%) | 0.0 |
| Total | 0 (0.0%) | 0.0 |
Fertility by Age by Marriage Status in Chinchilla
| Age Bracket | Married | Unmarried |
| 15 to 19 years | 0 (0.0%) | 0 (0.0%) |
| 20 to 34 years | 0 (0.0%) | 0 (0.0%) |
| 35 to 50 years | 0 (0.0%) | 0 (0.0%) |
| Total | 0 (0.0%) | 0 (0.0%) |
Fertility by Education in Chinchilla
| Educational Attainment | Women with Births | Births / 1,000 Women |
| Less than High School | 0 (0.0%) | 0.0 |
| High School Diploma | 0 (0.0%) | 0.0 |
| College or Associate's Degree | 0 (0.0%) | 0.0 |
| Bachelor's Degree | 0 (0.0%) | 0.0 |
| Graduate Degree | 0 (0.0%) | 0.0 |
| Total | 0 (0.0%) | 0.0 |
Fertility by Education by Marriage Status in Chinchilla
| Educational Attainment | Married | Unmarried |
| Less than High School | 0 (0.0%) | 0 (0.0%) |
| High School Diploma | 0 (0.0%) | 0 (0.0%) |
| College or Associate's Degree | 0 (0.0%) | 0 (0.0%) |
| Bachelor's Degree | 0 (0.0%) | 0 (0.0%) |
| Graduate Degree | 0 (0.0%) | 0 (0.0%) |
| Total | 0 (0.0%) | 0 (0.0%) |
Employment Characteristics in Chinchilla
Employment by Class of Employer in Chinchilla
Among the 1,006 employed individuals in Chinchilla, private company employees (659 | 65.5%), local government employees (199 | 19.8%), and not-for-profit organizations (103 | 10.2%) make up the most common classes of employment.
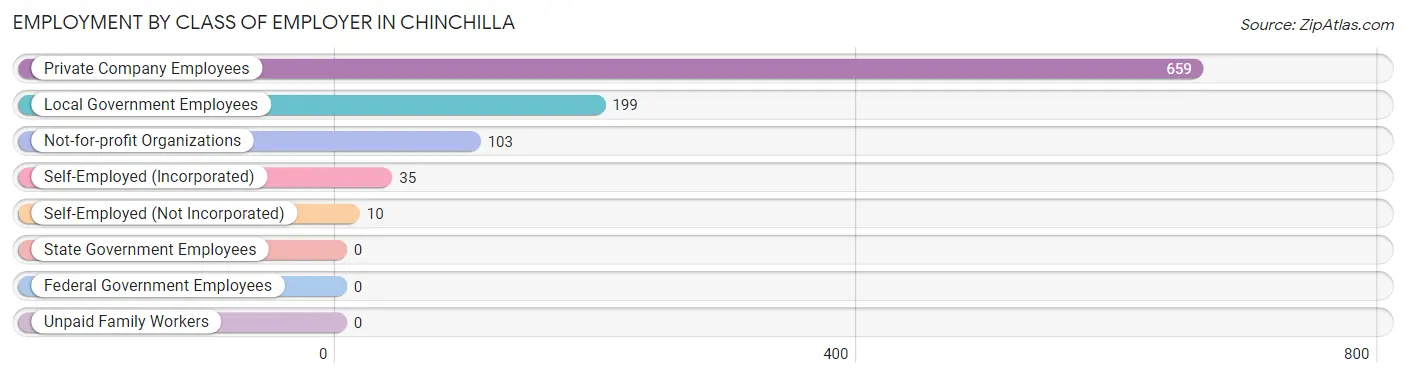
| Employer Class | # Employees | % Employees |
| Private Company Employees | 659 | 65.5% |
| Self-Employed (Incorporated) | 35 | 3.5% |
| Self-Employed (Not Incorporated) | 10 | 1.0% |
| Not-for-profit Organizations | 103 | 10.2% |
| Local Government Employees | 199 | 19.8% |
| State Government Employees | 0 | 0.0% |
| Federal Government Employees | 0 | 0.0% |
| Unpaid Family Workers | 0 | 0.0% |
| Total | 1,006 | 100.0% |
Employment Status by Age in Chinchilla
According to the labor force statistics for Chinchilla, out of the total population over 16 years of age (1,619), 69.4% or 1,124 individuals are in the labor force, with 7.7% or 87 of them unemployed. The age group with the highest labor force participation rate is 20 to 24 years, with 100.0% or 104 individuals in the labor force. Within the labor force, the 30 to 34 years age range has the highest percentage of unemployed individuals, with 20.9% or 41 of them being unemployed.
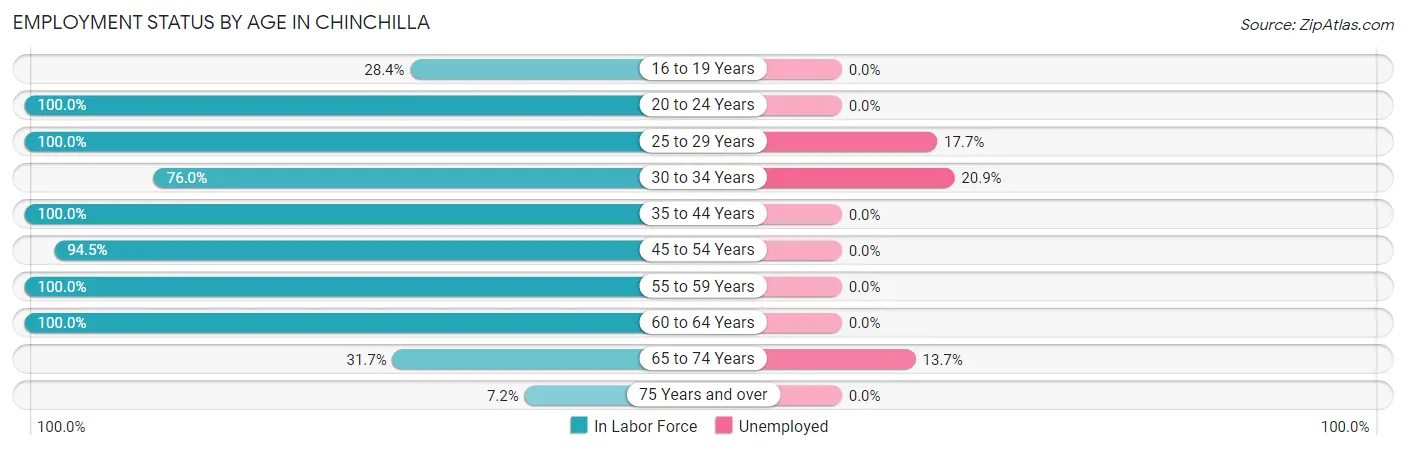
| Age Bracket | In Labor Force | Unemployed |
| 16 to 19 Years | 19 (28.4%) | 0 (0.0%) |
| 20 to 24 Years | 104 (100.0%) | 0 (0.0%) |
| 25 to 29 Years | 186 (100.0%) | 33 (17.7%) |
| 30 to 34 Years | 196 (76.0%) | 41 (20.9%) |
| 35 to 44 Years | 100 (100.0%) | 0 (0.0%) |
| 45 to 54 Years | 205 (94.5%) | 0 (0.0%) |
| 55 to 59 Years | 109 (100.0%) | 0 (0.0%) |
| 60 to 64 Years | 97 (100.0%) | 0 (0.0%) |
| 65 to 74 Years | 95 (31.7%) | 13 (13.7%) |
| 75 Years and over | 13 (7.2%) | 0 (0.0%) |
| Total | 1,124 (69.4%) | 87 (7.7%) |
Employment Status by Educational Attainment in Chinchilla
According to labor force statistics for Chinchilla, 92.3% of individuals (893) out of the total population between 25 and 64 years of age (967) are in the labor force, with 8.3% or 74 of them being unemployed. The group with the highest labor force participation rate are those with the educational attainment of less than high school, with 100.0% or 30 individuals in the labor force. Within the labor force, individuals with college / associate degree education have the highest percentage of unemployment, with 55.7% or 59 of them being unemployed.
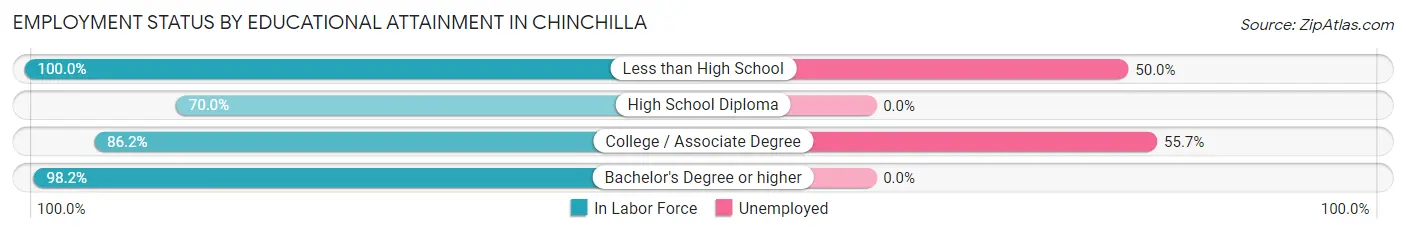
| Educational Attainment | In Labor Force | Unemployed |
| Less than High School | 30 (100.0%) | 15 (50.0%) |
| High School Diploma | 105 (70.0%) | 0 (0.0%) |
| College / Associate Degree | 106 (86.2%) | 69 (55.7%) |
| Bachelor's Degree or higher | 652 (98.2%) | 0 (0.0%) |
| Total | 893 (92.3%) | 80 (8.3%) |
Employment Occupations by Sex in Chinchilla
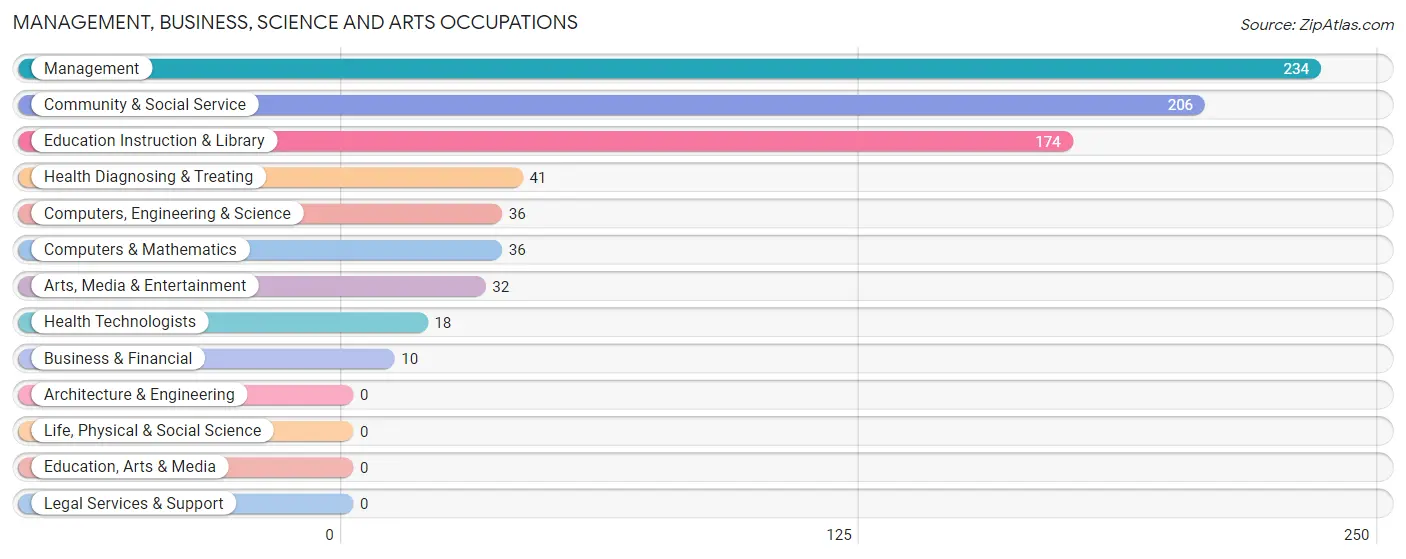
Management, Business, Science and Arts Occupations
The most common Management, Business, Science and Arts occupations in Chinchilla are Management (234 | 22.6%), Community & Social Service (206 | 19.9%), Education Instruction & Library (174 | 16.8%), Health Diagnosing & Treating (41 | 4.0%), and Computers, Engineering & Science (36 | 3.5%).
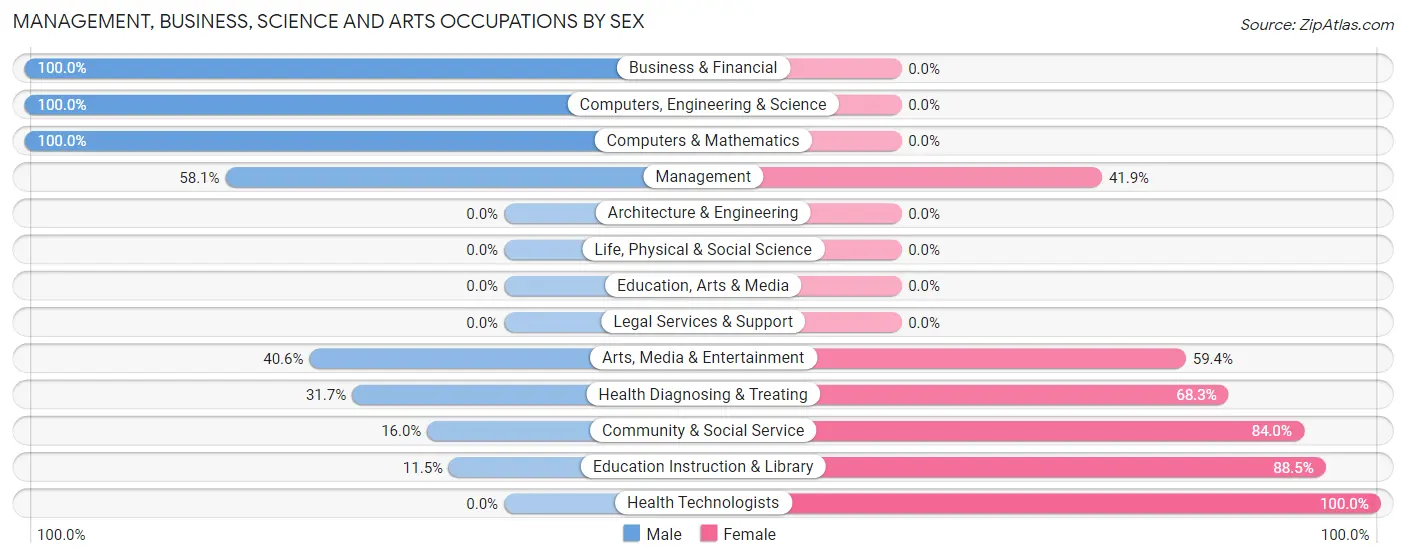
Management, Business, Science and Arts Occupations by Sex
Within the Management, Business, Science and Arts occupations in Chinchilla, the most male-oriented occupations are Business & Financial (100.0%), Computers, Engineering & Science (100.0%), and Computers & Mathematics (100.0%), while the most female-oriented occupations are Health Technologists (100.0%), Education Instruction & Library (88.5%), and Community & Social Service (84.0%).
| Occupation | Male | Female |
| Management | 136 (58.1%) | 98 (41.9%) |
| Business & Financial | 10 (100.0%) | 0 (0.0%) |
| Computers, Engineering & Science | 36 (100.0%) | 0 (0.0%) |
| Computers & Mathematics | 36 (100.0%) | 0 (0.0%) |
| Architecture & Engineering | 0 (0.0%) | 0 (0.0%) |
| Life, Physical & Social Science | 0 (0.0%) | 0 (0.0%) |
| Community & Social Service | 33 (16.0%) | 173 (84.0%) |
| Education, Arts & Media | 0 (0.0%) | 0 (0.0%) |
| Legal Services & Support | 0 (0.0%) | 0 (0.0%) |
| Education Instruction & Library | 20 (11.5%) | 154 (88.5%) |
| Arts, Media & Entertainment | 13 (40.6%) | 19 (59.4%) |
| Health Diagnosing & Treating | 13 (31.7%) | 28 (68.3%) |
| Health Technologists | 0 (0.0%) | 18 (100.0%) |
| Total (Category) | 228 (43.3%) | 299 (56.7%) |
| Total (Overall) | 519 (50.0%) | 518 (49.9%) |
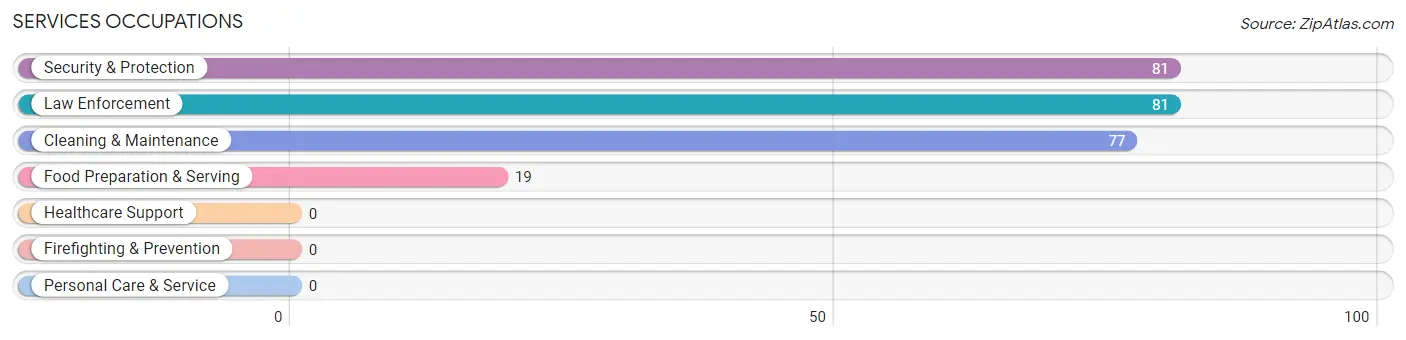
Services Occupations
The most common Services occupations in Chinchilla are Security & Protection (81 | 7.8%), Law Enforcement (81 | 7.8%), Cleaning & Maintenance (77 | 7.4%), and Food Preparation & Serving (19 | 1.8%).
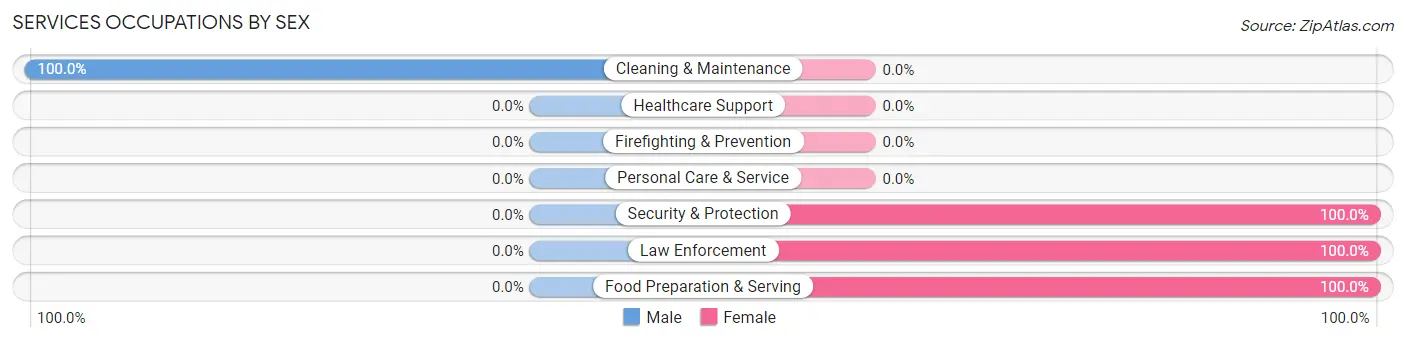
Services Occupations by Sex
| Occupation | Male | Female |
| Healthcare Support | 0 (0.0%) | 0 (0.0%) |
| Security & Protection | 0 (0.0%) | 81 (100.0%) |
| Firefighting & Prevention | 0 (0.0%) | 0 (0.0%) |
| Law Enforcement | 0 (0.0%) | 81 (100.0%) |
| Food Preparation & Serving | 0 (0.0%) | 19 (100.0%) |
| Cleaning & Maintenance | 77 (100.0%) | 0 (0.0%) |
| Personal Care & Service | 0 (0.0%) | 0 (0.0%) |
| Total (Category) | 77 (43.5%) | 100 (56.5%) |
| Total (Overall) | 519 (50.0%) | 518 (49.9%) |
Sales and Office Occupations
The most common Sales and Office occupations in Chinchilla are Office & Administration (167 | 16.1%), and Sales & Related (101 | 9.7%).

Sales and Office Occupations by Sex

| Occupation | Male | Female |
| Sales & Related | 92 (91.1%) | 9 (8.9%) |
| Office & Administration | 72 (43.1%) | 95 (56.9%) |
| Total (Category) | 164 (61.2%) | 104 (38.8%) |
| Total (Overall) | 519 (50.0%) | 518 (49.9%) |
Natural Resources, Construction and Maintenance Occupations
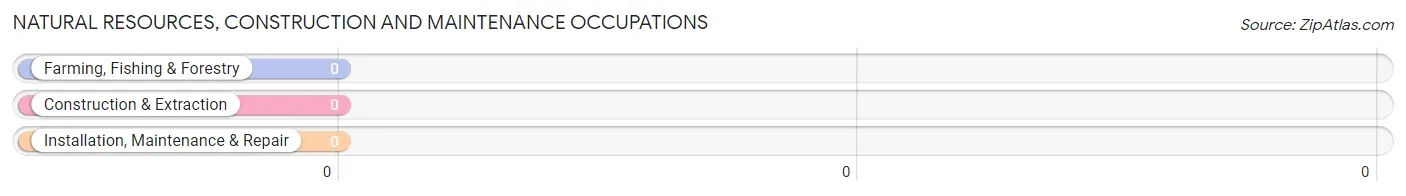
Natural Resources, Construction and Maintenance Occupations by Sex
| Occupation | Male | Female |
| Farming, Fishing & Forestry | 0 (0.0%) | 0 (0.0%) |
| Construction & Extraction | 0 (0.0%) | 0 (0.0%) |
| Installation, Maintenance & Repair | 0 (0.0%) | 0 (0.0%) |
| Total (Category) | 0 (0.0%) | 0 (0.0%) |
| Total (Overall) | 519 (50.0%) | 518 (49.9%) |
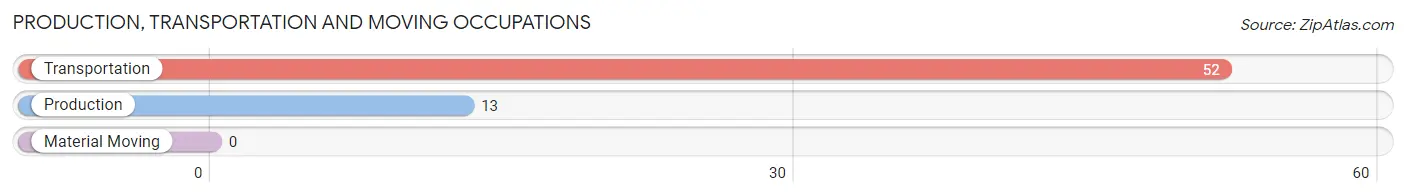
Production, Transportation and Moving Occupations
The most common Production, Transportation and Moving occupations in Chinchilla are Transportation (52 | 5.0%), and Production (13 | 1.3%).
Production, Transportation and Moving Occupations by Sex
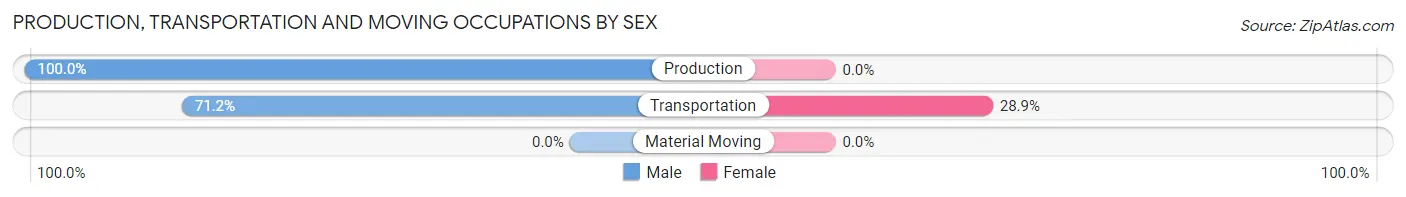
| Occupation | Male | Female |
| Production | 13 (100.0%) | 0 (0.0%) |
| Transportation | 37 (71.2%) | 15 (28.8%) |
| Material Moving | 0 (0.0%) | 0 (0.0%) |
| Total (Category) | 50 (76.9%) | 15 (23.1%) |
| Total (Overall) | 519 (50.0%) | 518 (49.9%) |
Employment Industries by Sex in Chinchilla
Employment Industries in Chinchilla
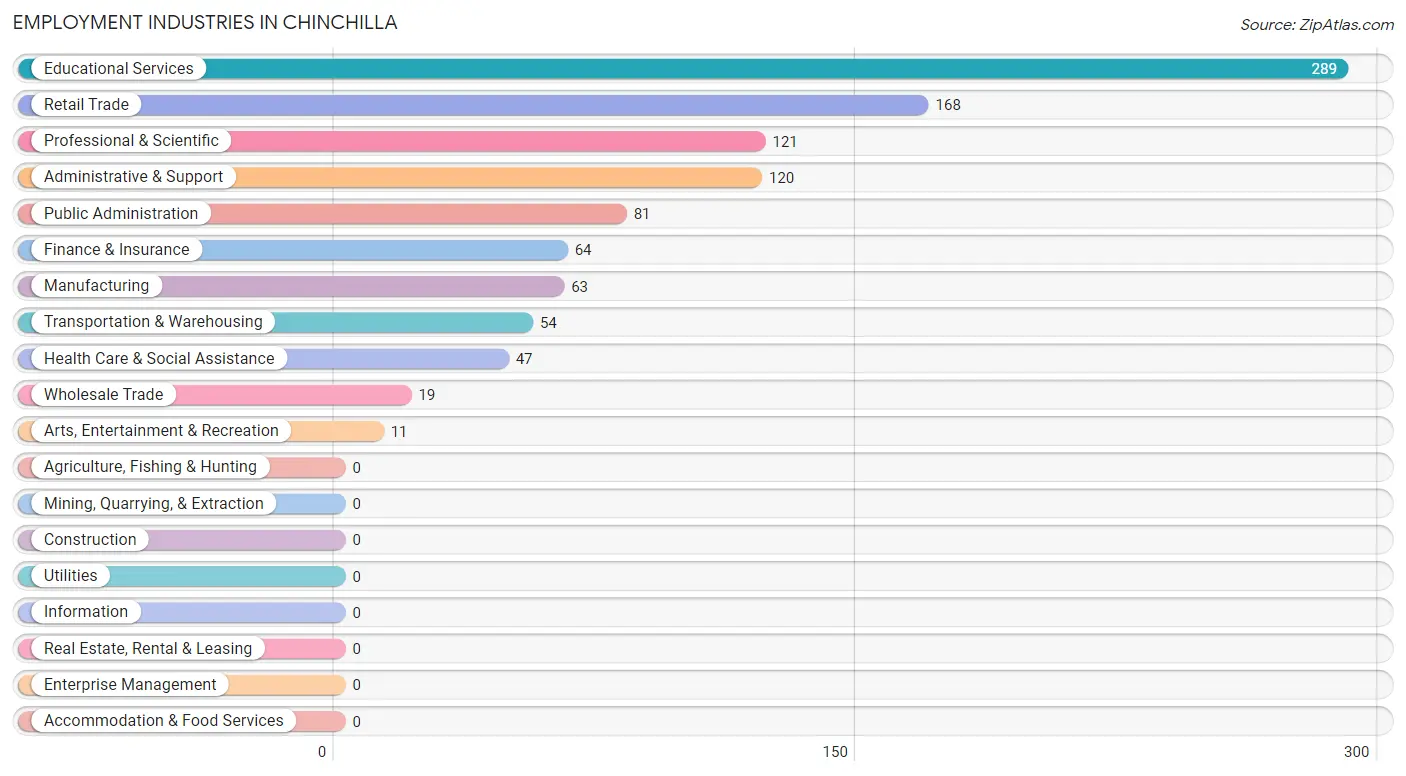
The major employment industries in Chinchilla include Educational Services (289 | 27.9%), Retail Trade (168 | 16.2%), Professional & Scientific (121 | 11.7%), Administrative & Support (120 | 11.6%), and Public Administration (81 | 7.8%).
Employment Industries by Sex in Chinchilla
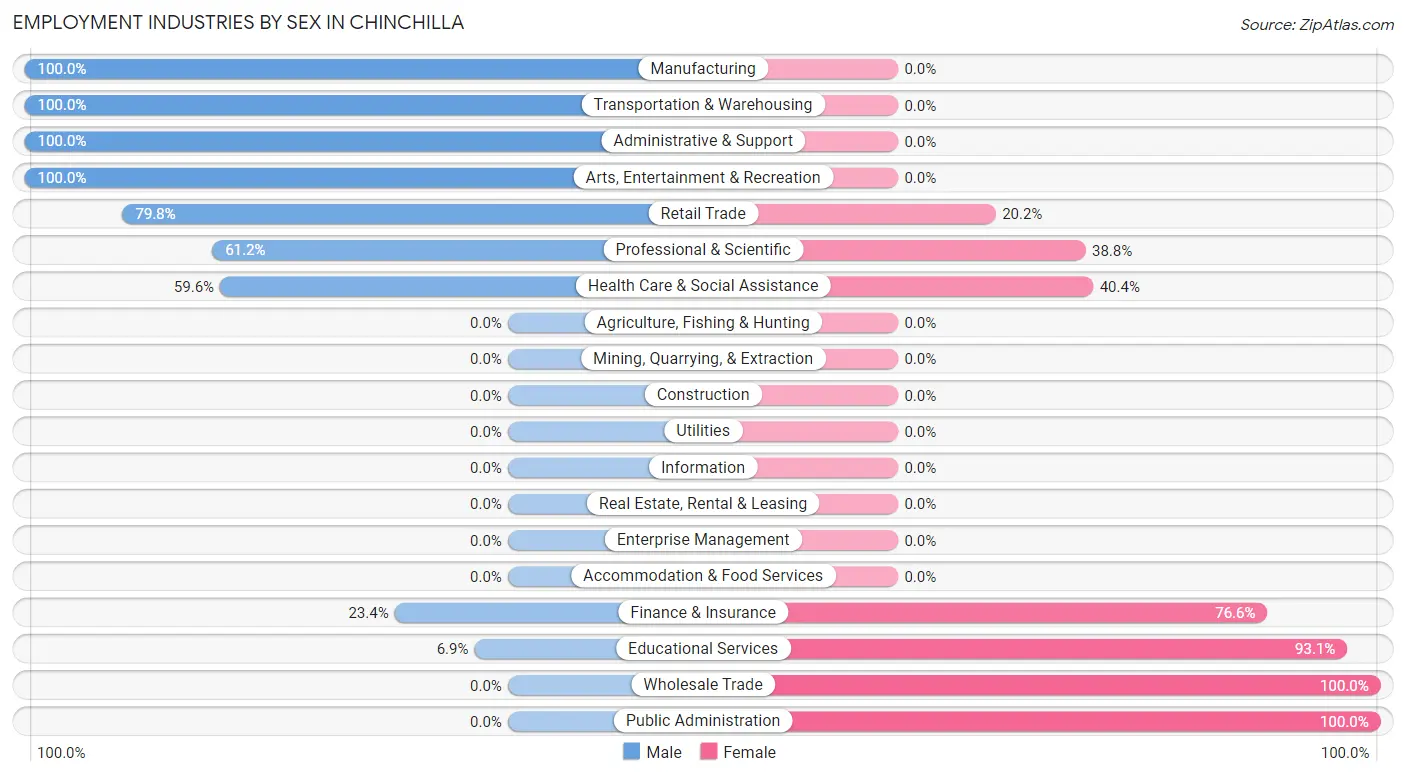
The Chinchilla industries that see more men than women are Manufacturing (100.0%), Transportation & Warehousing (100.0%), and Administrative & Support (100.0%), whereas the industries that tend to have a higher number of women are Wholesale Trade (100.0%), Public Administration (100.0%), and Educational Services (93.1%).
| Industry | Male | Female |
| Agriculture, Fishing & Hunting | 0 (0.0%) | 0 (0.0%) |
| Mining, Quarrying, & Extraction | 0 (0.0%) | 0 (0.0%) |
| Construction | 0 (0.0%) | 0 (0.0%) |
| Manufacturing | 63 (100.0%) | 0 (0.0%) |
| Wholesale Trade | 0 (0.0%) | 19 (100.0%) |
| Retail Trade | 134 (79.8%) | 34 (20.2%) |
| Transportation & Warehousing | 54 (100.0%) | 0 (0.0%) |
| Utilities | 0 (0.0%) | 0 (0.0%) |
| Information | 0 (0.0%) | 0 (0.0%) |
| Finance & Insurance | 15 (23.4%) | 49 (76.6%) |
| Real Estate, Rental & Leasing | 0 (0.0%) | 0 (0.0%) |
| Professional & Scientific | 74 (61.2%) | 47 (38.8%) |
| Enterprise Management | 0 (0.0%) | 0 (0.0%) |
| Administrative & Support | 120 (100.0%) | 0 (0.0%) |
| Educational Services | 20 (6.9%) | 269 (93.1%) |
| Health Care & Social Assistance | 28 (59.6%) | 19 (40.4%) |
| Arts, Entertainment & Recreation | 11 (100.0%) | 0 (0.0%) |
| Accommodation & Food Services | 0 (0.0%) | 0 (0.0%) |
| Public Administration | 0 (0.0%) | 81 (100.0%) |
| Total | 519 (50.0%) | 518 (49.9%) |
Education in Chinchilla
School Enrollment in Chinchilla
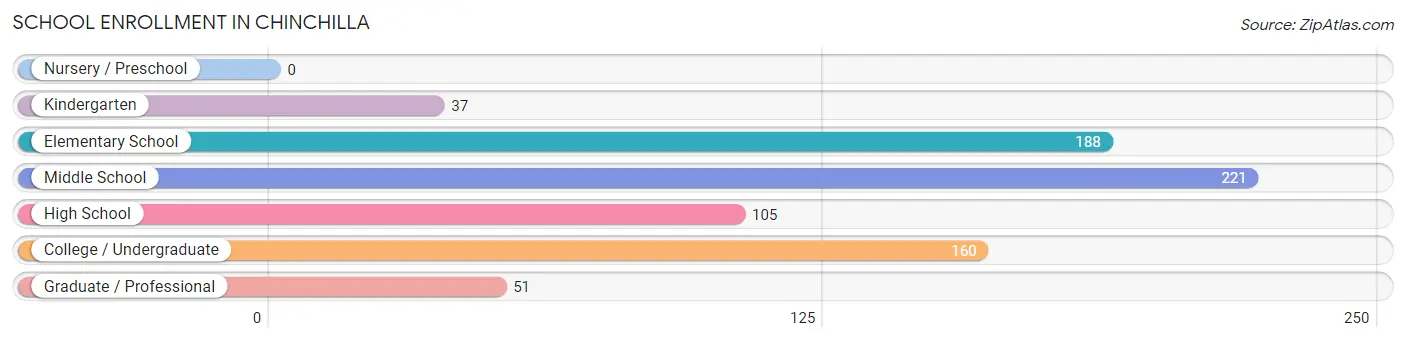
The most common levels of schooling among the 762 students in Chinchilla are middle school (221 | 29.0%), elementary school (188 | 24.7%), and college / undergraduate (160 | 21.0%).
| School Level | # Students | % Students |
| Nursery / Preschool | 0 | 0.0% |
| Kindergarten | 37 | 4.9% |
| Elementary School | 188 | 24.7% |
| Middle School | 221 | 29.0% |
| High School | 105 | 13.8% |
| College / Undergraduate | 160 | 21.0% |
| Graduate / Professional | 51 | 6.7% |
| Total | 762 | 100.0% |
School Enrollment by Age by Funding Source in Chinchilla
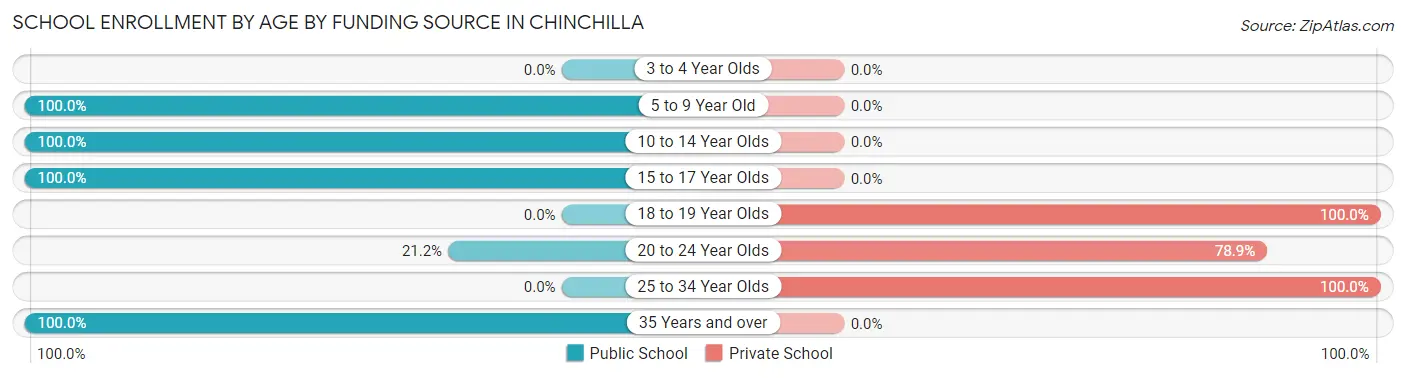
Out of a total of 762 students who are enrolled in schools in Chinchilla, 175 (23.0%) attend a private institution, while the remaining 587 (77.0%) are enrolled in public schools. The age group of 18 to 19 year olds has the highest likelihood of being enrolled in private schools, with 19 (100.0% in the age bracket) enrolled. Conversely, the age group of 5 to 9 year old has the lowest likelihood of being enrolled in a private school, with 188 (100.0% in the age bracket) attending a public institution.
| Age Bracket | Public School | Private School |
| 3 to 4 Year Olds | 0 (0.0%) | 0 (0.0%) |
| 5 to 9 Year Old | 188 (100.0%) | 0 (0.0%) |
| 10 to 14 Year Olds | 258 (100.0%) | 0 (0.0%) |
| 15 to 17 Year Olds | 105 (100.0%) | 0 (0.0%) |
| 18 to 19 Year Olds | 0 (0.0%) | 19 (100.0%) |
| 20 to 24 Year Olds | 22 (21.1%) | 82 (78.8%) |
| 25 to 34 Year Olds | 0 (0.0%) | 74 (100.0%) |
| 35 Years and over | 14 (100.0%) | 0 (0.0%) |
| Total | 587 (77.0%) | 175 (23.0%) |
Educational Attainment by Field of Study in Chinchilla
Education (270 | 31.0%), business (192 | 22.0%), science & technology (111 | 12.7%), computers & mathematics (49 | 5.6%), and literature & languages (47 | 5.4%) are the most common fields of study among 872 individuals in Chinchilla who have obtained a bachelor's degree or higher.
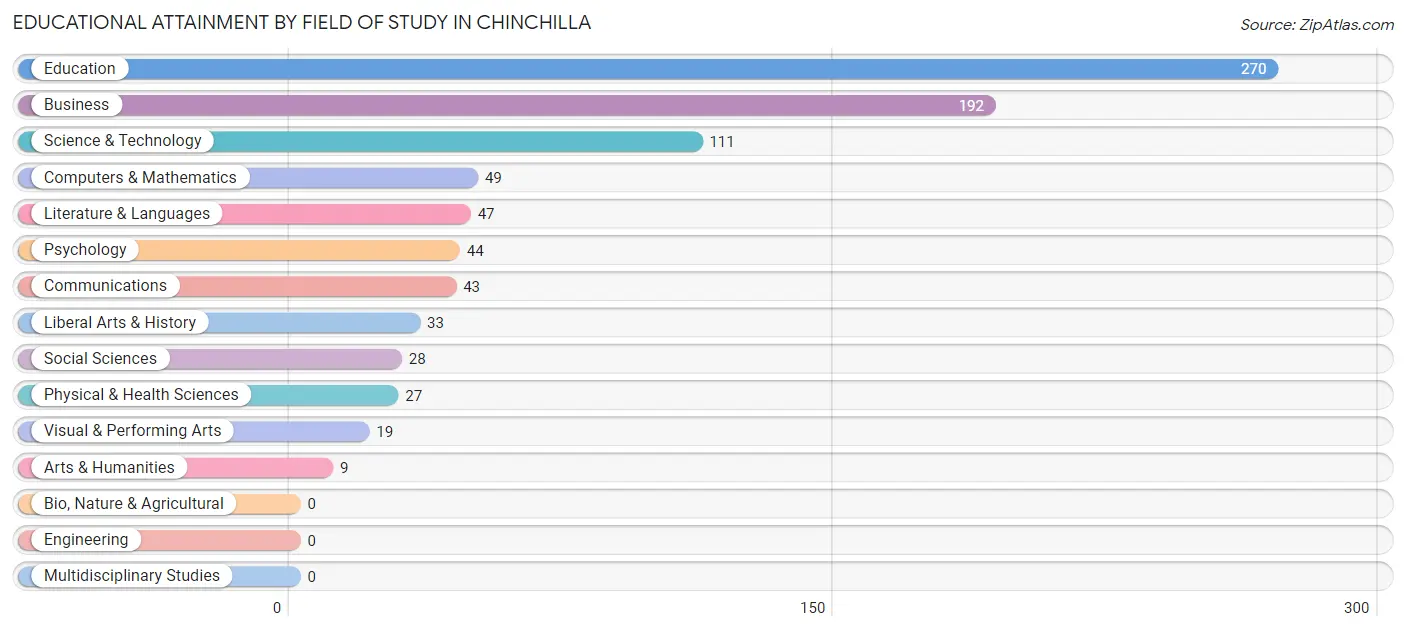
| Field of Study | # Graduates | % Graduates |
| Computers & Mathematics | 49 | 5.6% |
| Bio, Nature & Agricultural | 0 | 0.0% |
| Physical & Health Sciences | 27 | 3.1% |
| Psychology | 44 | 5.1% |
| Social Sciences | 28 | 3.2% |
| Engineering | 0 | 0.0% |
| Multidisciplinary Studies | 0 | 0.0% |
| Science & Technology | 111 | 12.7% |
| Business | 192 | 22.0% |
| Education | 270 | 31.0% |
| Literature & Languages | 47 | 5.4% |
| Liberal Arts & History | 33 | 3.8% |
| Visual & Performing Arts | 19 | 2.2% |
| Communications | 43 | 4.9% |
| Arts & Humanities | 9 | 1.0% |
| Total | 872 | 100.0% |
Transportation & Commute in Chinchilla
Vehicle Availability by Sex in Chinchilla
The most prevalent vehicle ownership categories in Chinchilla are males with 2 vehicles (345, accounting for 70.7%) and females with 2 vehicles (276, making up 66.6%).
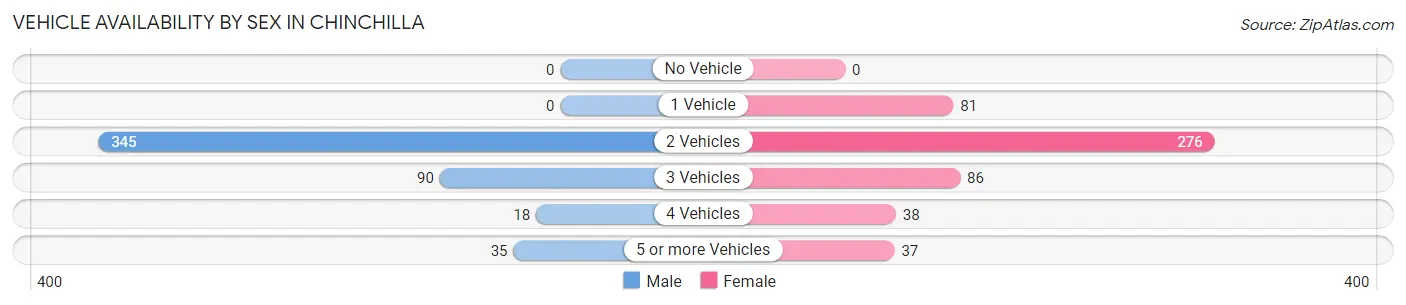
| Vehicles Available | Male | Female |
| No Vehicle | 0 (0.0%) | 0 (0.0%) |
| 1 Vehicle | 0 (0.0%) | 81 (15.6%) |
| 2 Vehicles | 345 (70.7%) | 276 (53.3%) |
| 3 Vehicles | 90 (18.4%) | 86 (16.6%) |
| 4 Vehicles | 18 (3.7%) | 38 (7.3%) |
| 5 or more Vehicles | 35 (7.2%) | 37 (7.1%) |
| Total | 488 (100.0%) | 518 (100.0%) |
Commute Time in Chinchilla
The most frequently occuring commute durations in Chinchilla are 10 to 14 minutes (302 commuters, 32.2%), 20 to 24 minutes (151 commuters, 16.1%), and 15 to 19 minutes (143 commuters, 15.3%).
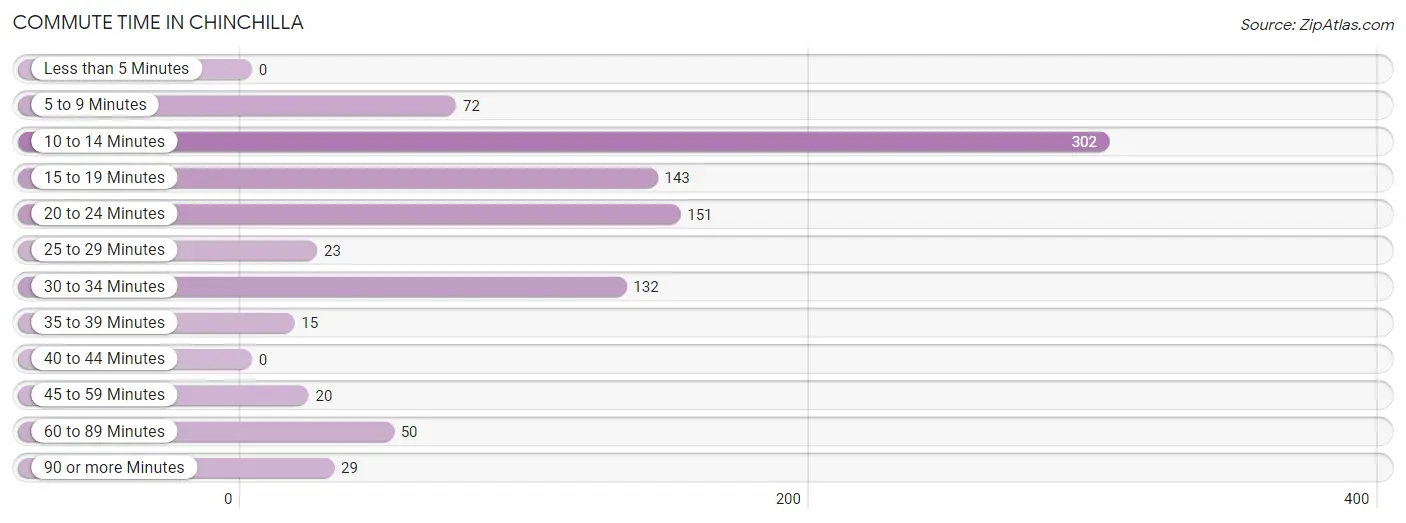
| Commute Time | # Commuters | % Commuters |
| Less than 5 Minutes | 0 | 0.0% |
| 5 to 9 Minutes | 72 | 7.7% |
| 10 to 14 Minutes | 302 | 32.2% |
| 15 to 19 Minutes | 143 | 15.3% |
| 20 to 24 Minutes | 151 | 16.1% |
| 25 to 29 Minutes | 23 | 2.5% |
| 30 to 34 Minutes | 132 | 14.1% |
| 35 to 39 Minutes | 15 | 1.6% |
| 40 to 44 Minutes | 0 | 0.0% |
| 45 to 59 Minutes | 20 | 2.1% |
| 60 to 89 Minutes | 50 | 5.3% |
| 90 or more Minutes | 29 | 3.1% |
Commute Time by Sex in Chinchilla
The most common commute times in Chinchilla are 20 to 24 minutes (120 commuters, 26.6%) for males and 10 to 14 minutes (248 commuters, 51.1%) for females.
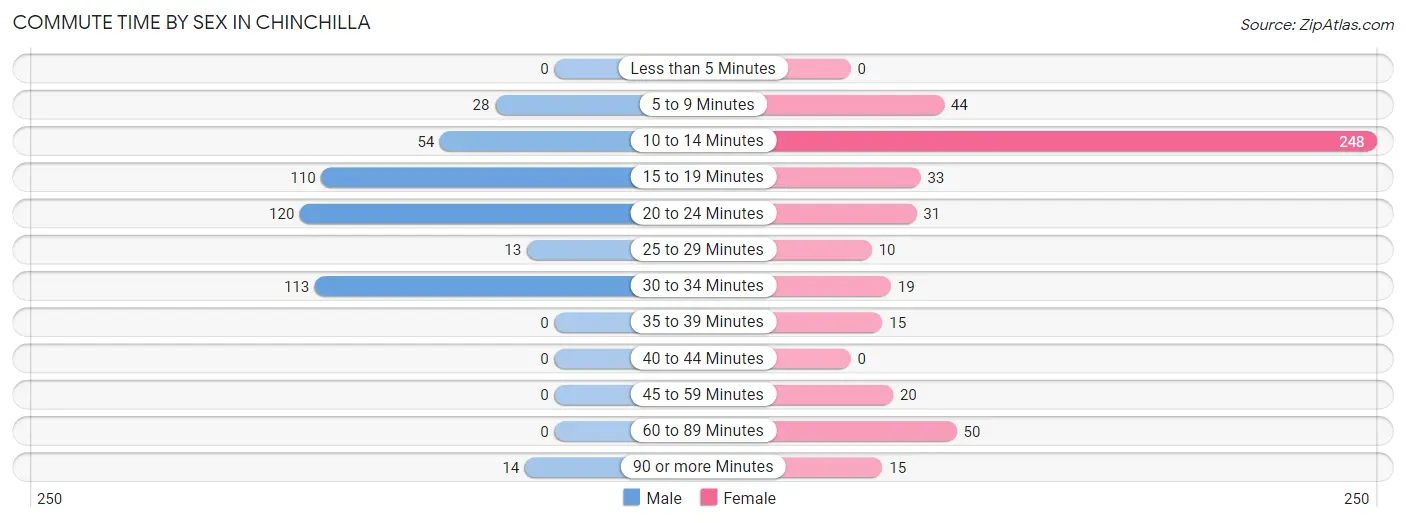
| Commute Time | Male | Female |
| Less than 5 Minutes | 0 (0.0%) | 0 (0.0%) |
| 5 to 9 Minutes | 28 (6.2%) | 44 (9.1%) |
| 10 to 14 Minutes | 54 (11.9%) | 248 (51.1%) |
| 15 to 19 Minutes | 110 (24.3%) | 33 (6.8%) |
| 20 to 24 Minutes | 120 (26.6%) | 31 (6.4%) |
| 25 to 29 Minutes | 13 (2.9%) | 10 (2.1%) |
| 30 to 34 Minutes | 113 (25.0%) | 19 (3.9%) |
| 35 to 39 Minutes | 0 (0.0%) | 15 (3.1%) |
| 40 to 44 Minutes | 0 (0.0%) | 0 (0.0%) |
| 45 to 59 Minutes | 0 (0.0%) | 20 (4.1%) |
| 60 to 89 Minutes | 0 (0.0%) | 50 (10.3%) |
| 90 or more Minutes | 14 (3.1%) | 15 (3.1%) |
Time of Departure to Work by Sex in Chinchilla
The most frequent times of departure to work in Chinchilla are 6:30 AM to 6:59 AM (96, 21.2%) for males and 7:00 AM to 7:29 AM (164, 33.8%) for females.
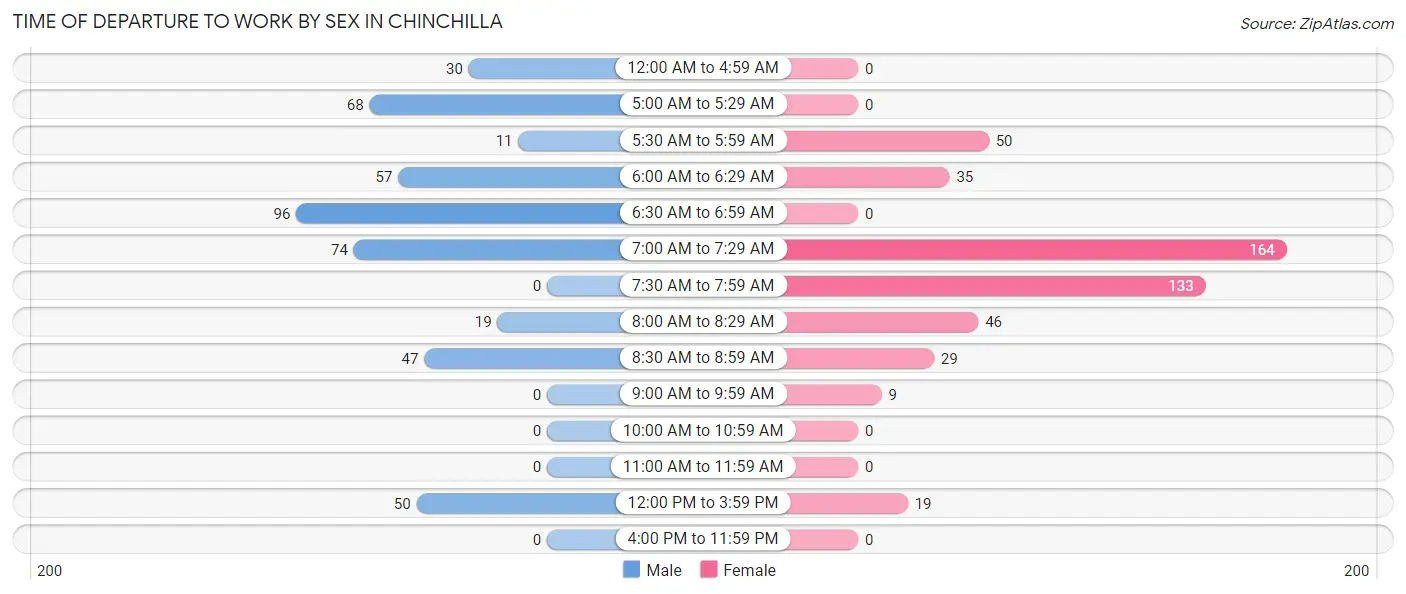
| Time of Departure | Male | Female |
| 12:00 AM to 4:59 AM | 30 (6.6%) | 0 (0.0%) |
| 5:00 AM to 5:29 AM | 68 (15.0%) | 0 (0.0%) |
| 5:30 AM to 5:59 AM | 11 (2.4%) | 50 (10.3%) |
| 6:00 AM to 6:29 AM | 57 (12.6%) | 35 (7.2%) |
| 6:30 AM to 6:59 AM | 96 (21.2%) | 0 (0.0%) |
| 7:00 AM to 7:29 AM | 74 (16.4%) | 164 (33.8%) |
| 7:30 AM to 7:59 AM | 0 (0.0%) | 133 (27.4%) |
| 8:00 AM to 8:29 AM | 19 (4.2%) | 46 (9.5%) |
| 8:30 AM to 8:59 AM | 47 (10.4%) | 29 (6.0%) |
| 9:00 AM to 9:59 AM | 0 (0.0%) | 9 (1.9%) |
| 10:00 AM to 10:59 AM | 0 (0.0%) | 0 (0.0%) |
| 11:00 AM to 11:59 AM | 0 (0.0%) | 0 (0.0%) |
| 12:00 PM to 3:59 PM | 50 (11.1%) | 19 (3.9%) |
| 4:00 PM to 11:59 PM | 0 (0.0%) | 0 (0.0%) |
| Total | 452 (100.0%) | 485 (100.0%) |
Housing Occupancy in Chinchilla
Occupancy by Ownership in Chinchilla
Of the total 780 dwellings in Chinchilla, owner-occupied units account for 630 (80.8%), while renter-occupied units make up 150 (19.2%).
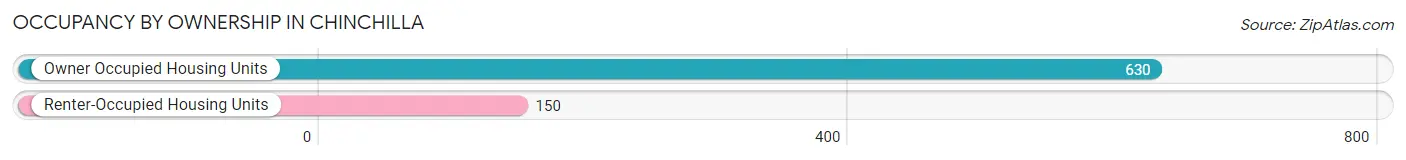
| Occupancy | # Housing Units | % Housing Units |
| Owner Occupied Housing Units | 630 | 80.8% |
| Renter-Occupied Housing Units | 150 | 19.2% |
| Total Occupied Housing Units | 780 | 100.0% |
Occupancy by Household Size in Chinchilla
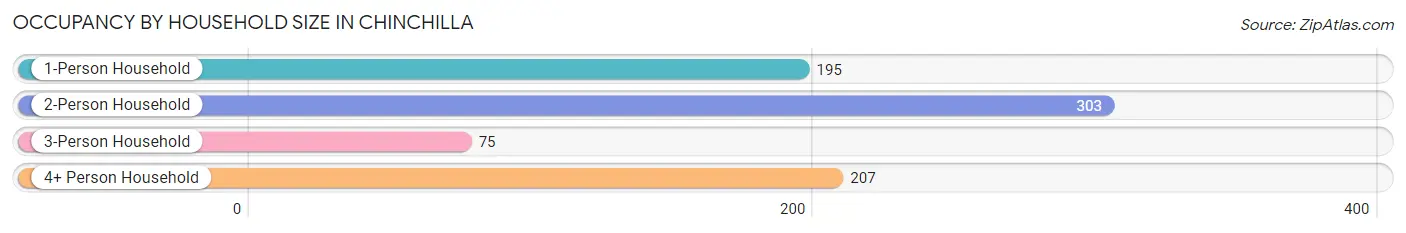
| Household Size | # Housing Units | % Housing Units |
| 1-Person Household | 195 | 25.0% |
| 2-Person Household | 303 | 38.9% |
| 3-Person Household | 75 | 9.6% |
| 4+ Person Household | 207 | 26.5% |
| Total Housing Units | 780 | 100.0% |
Occupancy by Ownership by Household Size in Chinchilla
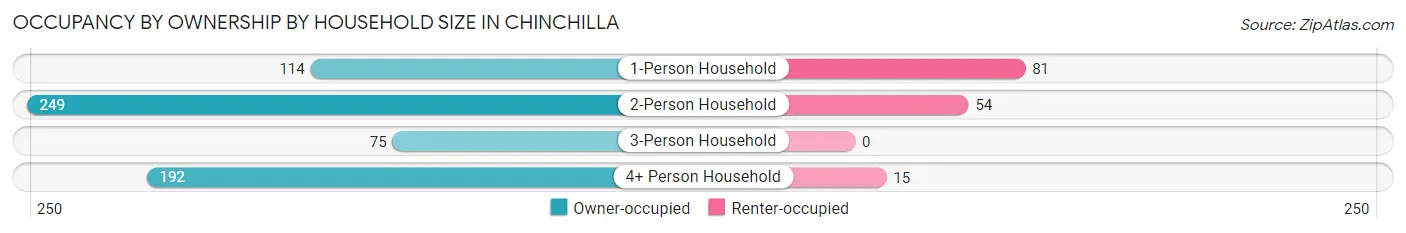
| Household Size | Owner-occupied | Renter-occupied |
| 1-Person Household | 114 (58.5%) | 81 (41.5%) |
| 2-Person Household | 249 (82.2%) | 54 (17.8%) |
| 3-Person Household | 75 (100.0%) | 0 (0.0%) |
| 4+ Person Household | 192 (92.7%) | 15 (7.2%) |
| Total Housing Units | 630 (80.8%) | 150 (19.2%) |
Occupancy by Educational Attainment in Chinchilla
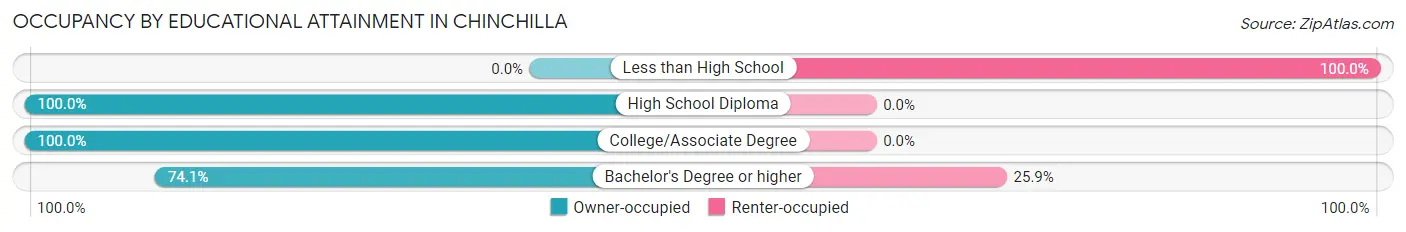
| Household Size | Owner-occupied | Renter-occupied |
| Less than High School | 0 (0.0%) | 15 (100.0%) |
| High School Diploma | 130 (100.0%) | 0 (0.0%) |
| College/Associate Degree | 113 (100.0%) | 0 (0.0%) |
| Bachelor's Degree or higher | 387 (74.1%) | 135 (25.9%) |
Occupancy by Age of Householder in Chinchilla
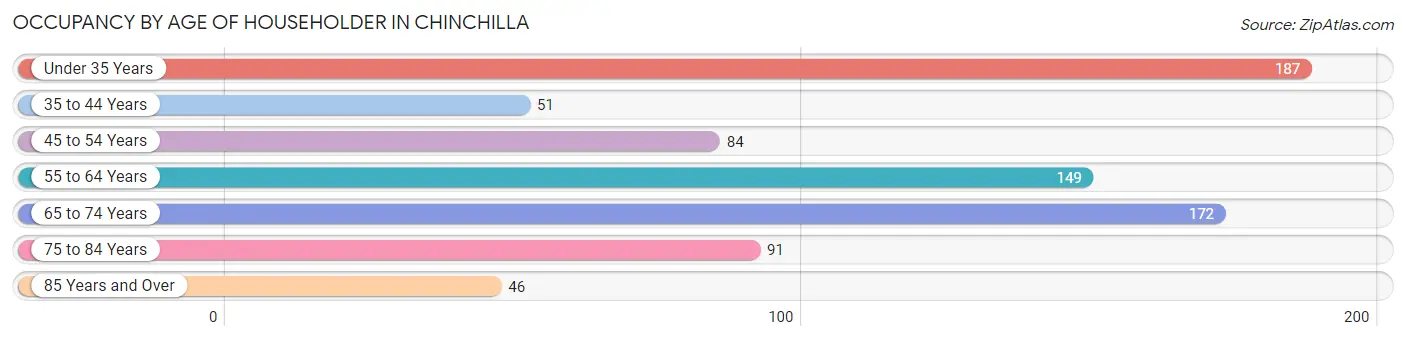
| Age Bracket | # Households | % Households |
| Under 35 Years | 187 | 24.0% |
| 35 to 44 Years | 51 | 6.5% |
| 45 to 54 Years | 84 | 10.8% |
| 55 to 64 Years | 149 | 19.1% |
| 65 to 74 Years | 172 | 22.1% |
| 75 to 84 Years | 91 | 11.7% |
| 85 Years and Over | 46 | 5.9% |
| Total | 780 | 100.0% |
Housing Finances in Chinchilla
Median Income by Occupancy in Chinchilla
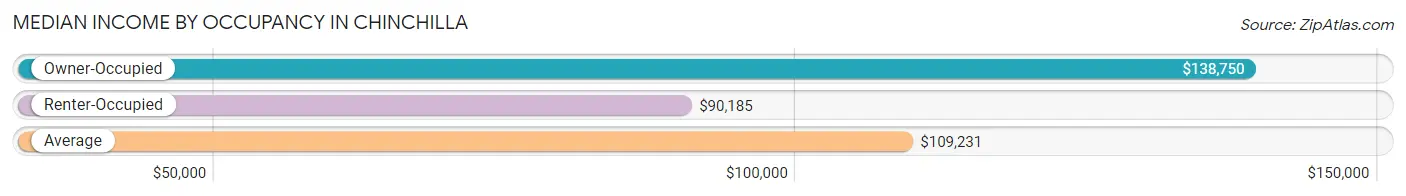
| Occupancy Type | # Households | Median Income |
| Owner-Occupied | 630 (80.8%) | $138,750 |
| Renter-Occupied | 150 (19.2%) | $90,185 |
| Average | 780 (100.0%) | $109,231 |
Occupancy by Householder Income Bracket in Chinchilla
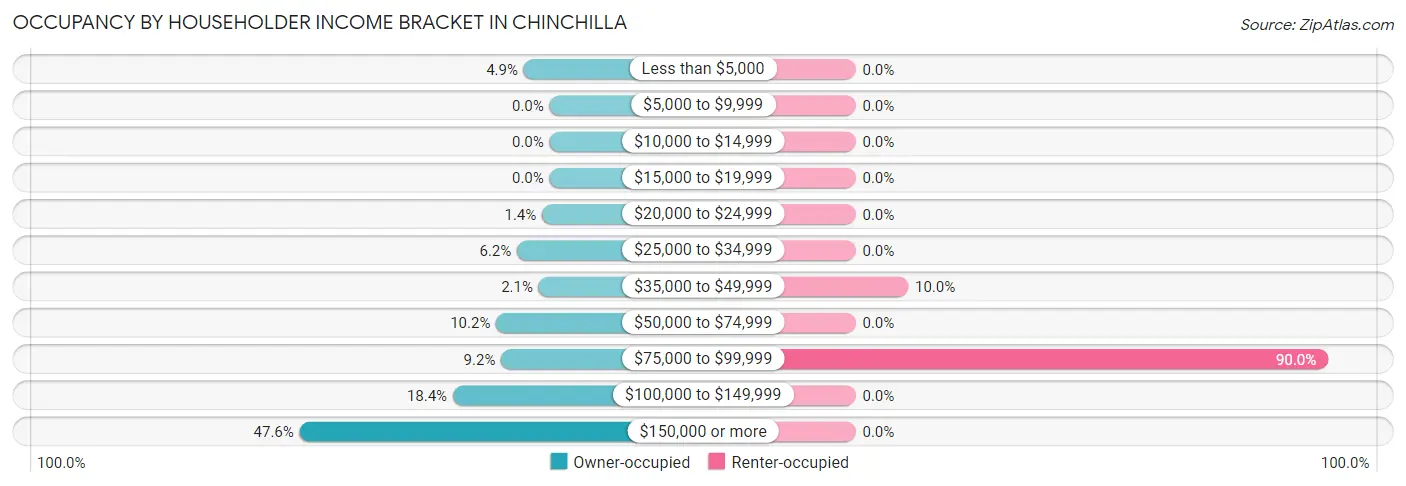
| Income Bracket | Owner-occupied | Renter-occupied |
| Less than $5,000 | 31 (4.9%) | 0 (0.0%) |
| $5,000 to $9,999 | 0 (0.0%) | 0 (0.0%) |
| $10,000 to $14,999 | 0 (0.0%) | 0 (0.0%) |
| $15,000 to $19,999 | 0 (0.0%) | 0 (0.0%) |
| $20,000 to $24,999 | 9 (1.4%) | 0 (0.0%) |
| $25,000 to $34,999 | 39 (6.2%) | 0 (0.0%) |
| $35,000 to $49,999 | 13 (2.1%) | 15 (10.0%) |
| $50,000 to $74,999 | 64 (10.2%) | 0 (0.0%) |
| $75,000 to $99,999 | 58 (9.2%) | 135 (90.0%) |
| $100,000 to $149,999 | 116 (18.4%) | 0 (0.0%) |
| $150,000 or more | 300 (47.6%) | 0 (0.0%) |
| Total | 630 (100.0%) | 150 (100.0%) |
Monthly Housing Cost Tiers in Chinchilla
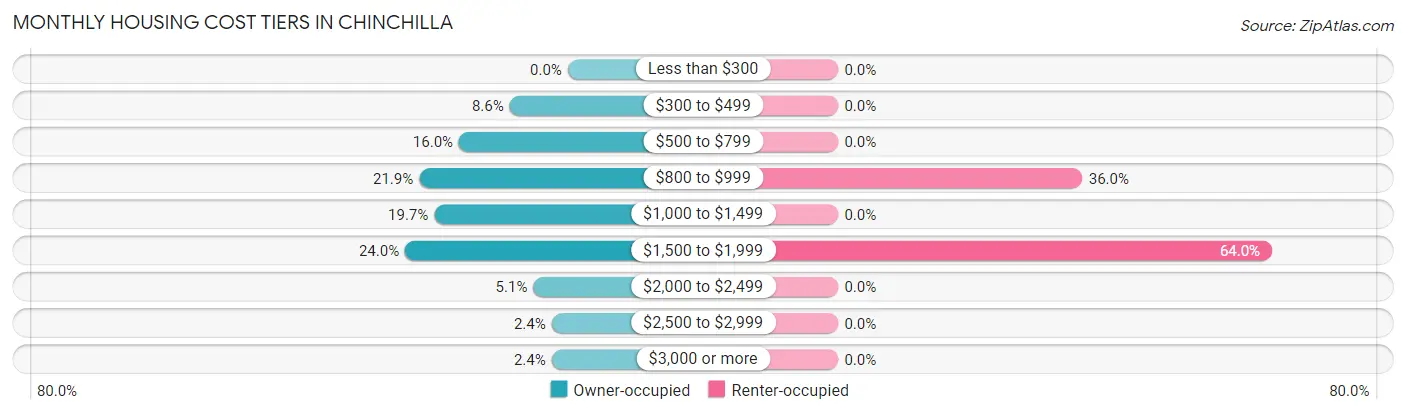
| Monthly Cost | Owner-occupied | Renter-occupied |
| Less than $300 | 0 (0.0%) | 0 (0.0%) |
| $300 to $499 | 54 (8.6%) | 0 (0.0%) |
| $500 to $799 | 101 (16.0%) | 0 (0.0%) |
| $800 to $999 | 138 (21.9%) | 54 (36.0%) |
| $1,000 to $1,499 | 124 (19.7%) | 0 (0.0%) |
| $1,500 to $1,999 | 151 (24.0%) | 96 (64.0%) |
| $2,000 to $2,499 | 32 (5.1%) | 0 (0.0%) |
| $2,500 to $2,999 | 15 (2.4%) | 0 (0.0%) |
| $3,000 or more | 15 (2.4%) | 0 (0.0%) |
| Total | 630 (100.0%) | 150 (100.0%) |
Physical Housing Characteristics in Chinchilla
Housing Structures in Chinchilla
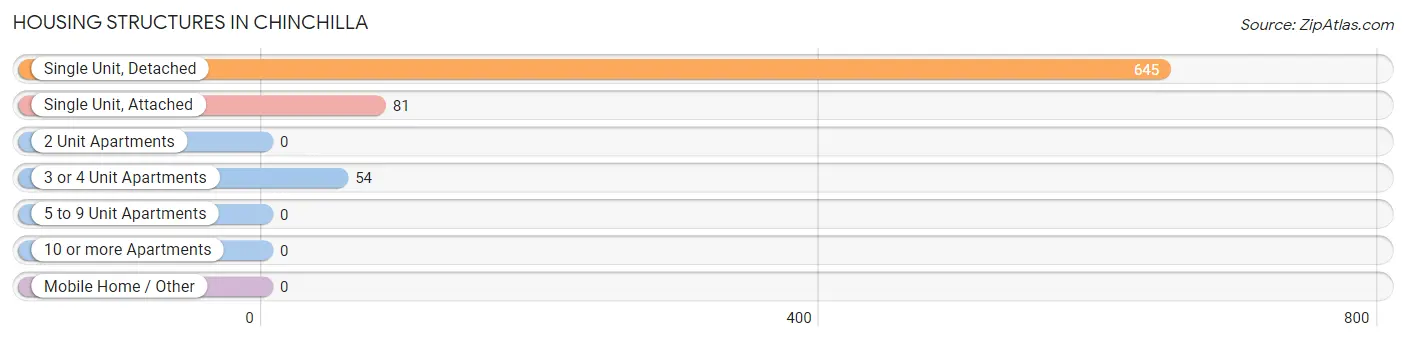
| Structure Type | # Housing Units | % Housing Units |
| Single Unit, Detached | 645 | 82.7% |
| Single Unit, Attached | 81 | 10.4% |
| 2 Unit Apartments | 0 | 0.0% |
| 3 or 4 Unit Apartments | 54 | 6.9% |
| 5 to 9 Unit Apartments | 0 | 0.0% |
| 10 or more Apartments | 0 | 0.0% |
| Mobile Home / Other | 0 | 0.0% |
| Total | 780 | 100.0% |
Housing Structures by Occupancy in Chinchilla
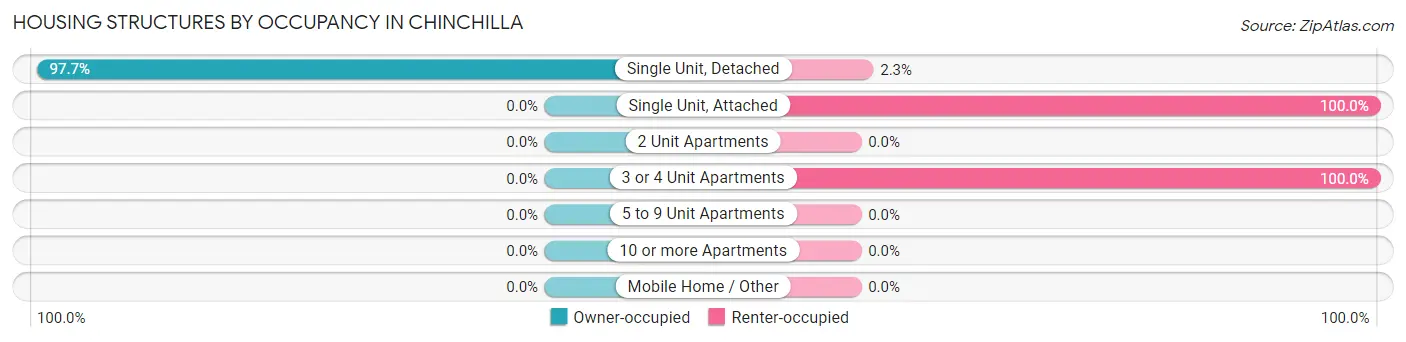
| Structure Type | Owner-occupied | Renter-occupied |
| Single Unit, Detached | 630 (97.7%) | 15 (2.3%) |
| Single Unit, Attached | 0 (0.0%) | 81 (100.0%) |
| 2 Unit Apartments | 0 (0.0%) | 0 (0.0%) |
| 3 or 4 Unit Apartments | 0 (0.0%) | 54 (100.0%) |
| 5 to 9 Unit Apartments | 0 (0.0%) | 0 (0.0%) |
| 10 or more Apartments | 0 (0.0%) | 0 (0.0%) |
| Mobile Home / Other | 0 (0.0%) | 0 (0.0%) |
| Total | 630 (80.8%) | 150 (19.2%) |
Housing Structures by Number of Rooms in Chinchilla
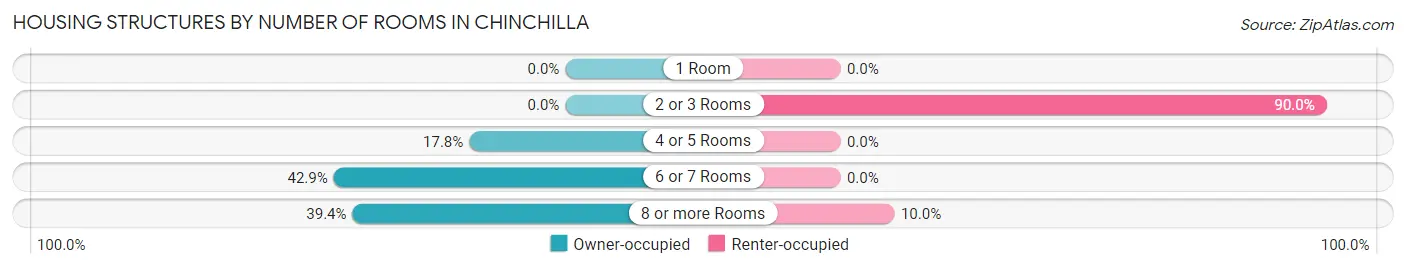
| Number of Rooms | Owner-occupied | Renter-occupied |
| 1 Room | 0 (0.0%) | 0 (0.0%) |
| 2 or 3 Rooms | 0 (0.0%) | 135 (90.0%) |
| 4 or 5 Rooms | 112 (17.8%) | 0 (0.0%) |
| 6 or 7 Rooms | 270 (42.9%) | 0 (0.0%) |
| 8 or more Rooms | 248 (39.4%) | 15 (10.0%) |
| Total | 630 (100.0%) | 150 (100.0%) |
Housing Structure by Heating Type in Chinchilla
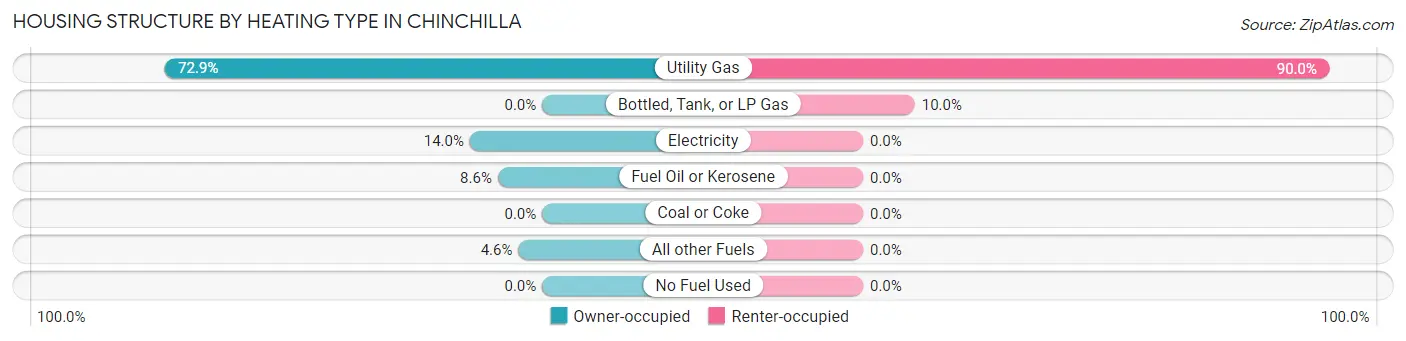
| Heating Type | Owner-occupied | Renter-occupied |
| Utility Gas | 459 (72.9%) | 135 (90.0%) |
| Bottled, Tank, or LP Gas | 0 (0.0%) | 15 (10.0%) |
| Electricity | 88 (14.0%) | 0 (0.0%) |
| Fuel Oil or Kerosene | 54 (8.6%) | 0 (0.0%) |
| Coal or Coke | 0 (0.0%) | 0 (0.0%) |
| All other Fuels | 29 (4.6%) | 0 (0.0%) |
| No Fuel Used | 0 (0.0%) | 0 (0.0%) |
| Total | 630 (100.0%) | 150 (100.0%) |
Household Vehicle Usage in Chinchilla
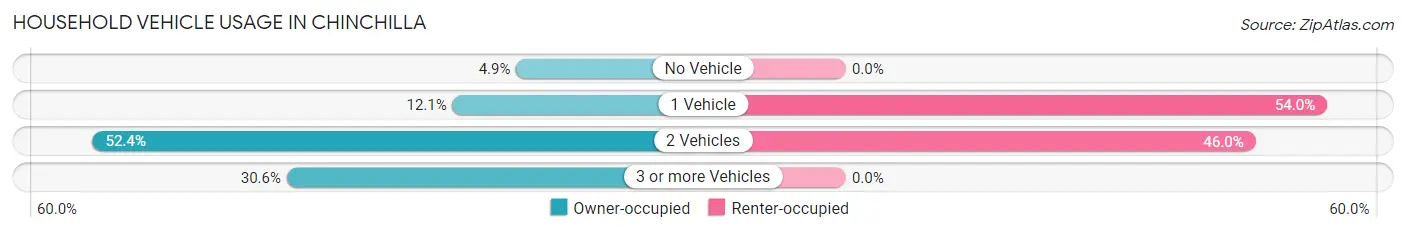
| Vehicles per Household | Owner-occupied | Renter-occupied |
| No Vehicle | 31 (4.9%) | 0 (0.0%) |
| 1 Vehicle | 76 (12.1%) | 81 (54.0%) |
| 2 Vehicles | 330 (52.4%) | 69 (46.0%) |
| 3 or more Vehicles | 193 (30.6%) | 0 (0.0%) |
| Total | 630 (100.0%) | 150 (100.0%) |
Real Estate & Mortgages in Chinchilla
Real Estate and Mortgage Overview in Chinchilla
| Characteristic | Without Mortgage | With Mortgage |
| Housing Units | 332 | 298 |
| Median Property Value | $255,600 | $235,300 |
| Median Household Income | $113,704 | $177 |
| Monthly Housing Costs | $824 | $15 |
| Real Estate Taxes | $3,840 | $0 |
Property Value by Mortgage Status in Chinchilla
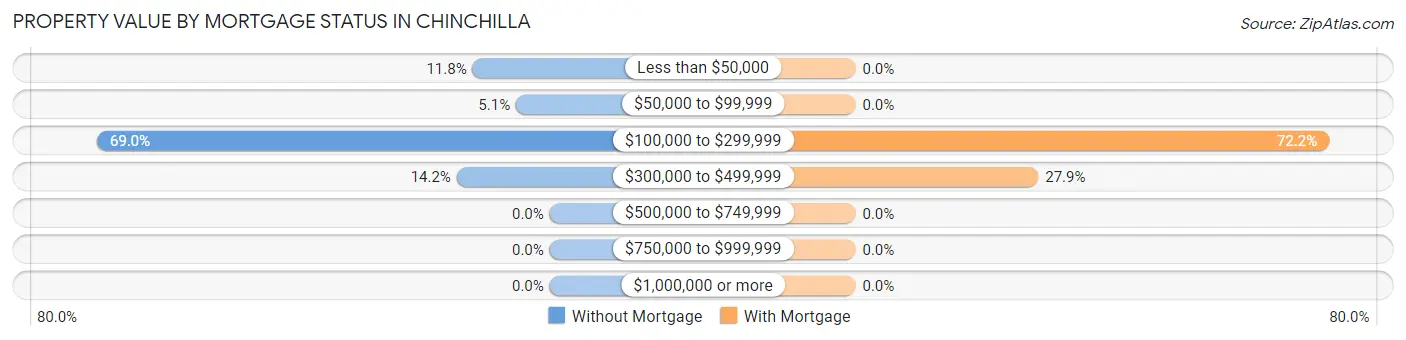
| Property Value | Without Mortgage | With Mortgage |
| Less than $50,000 | 39 (11.7%) | 0 (0.0%) |
| $50,000 to $99,999 | 17 (5.1%) | 0 (0.0%) |
| $100,000 to $299,999 | 229 (69.0%) | 215 (72.2%) |
| $300,000 to $499,999 | 47 (14.2%) | 83 (27.9%) |
| $500,000 to $749,999 | 0 (0.0%) | 0 (0.0%) |
| $750,000 to $999,999 | 0 (0.0%) | 0 (0.0%) |
| $1,000,000 or more | 0 (0.0%) | 0 (0.0%) |
| Total | 332 (100.0%) | 298 (100.0%) |
Household Income by Mortgage Status in Chinchilla
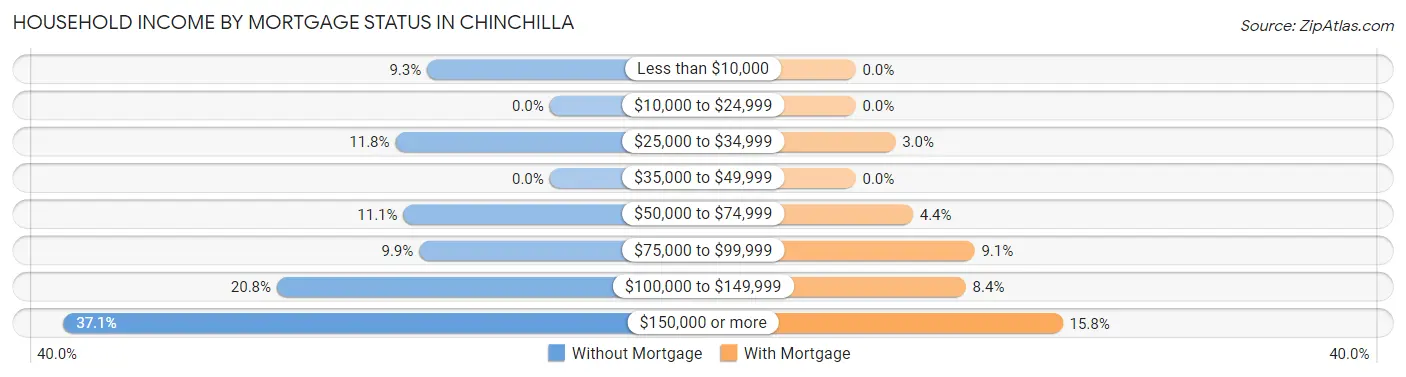
| Household Income | Without Mortgage | With Mortgage |
| Less than $10,000 | 31 (9.3%) | 0 (0.0%) |
| $10,000 to $24,999 | 0 (0.0%) | 0 (0.0%) |
| $25,000 to $34,999 | 39 (11.7%) | 9 (3.0%) |
| $35,000 to $49,999 | 0 (0.0%) | 0 (0.0%) |
| $50,000 to $74,999 | 37 (11.1%) | 13 (4.4%) |
| $75,000 to $99,999 | 33 (9.9%) | 27 (9.1%) |
| $100,000 to $149,999 | 69 (20.8%) | 25 (8.4%) |
| $150,000 or more | 123 (37.0%) | 47 (15.8%) |
| Total | 332 (100.0%) | 298 (100.0%) |
Property Value to Household Income Ratio in Chinchilla
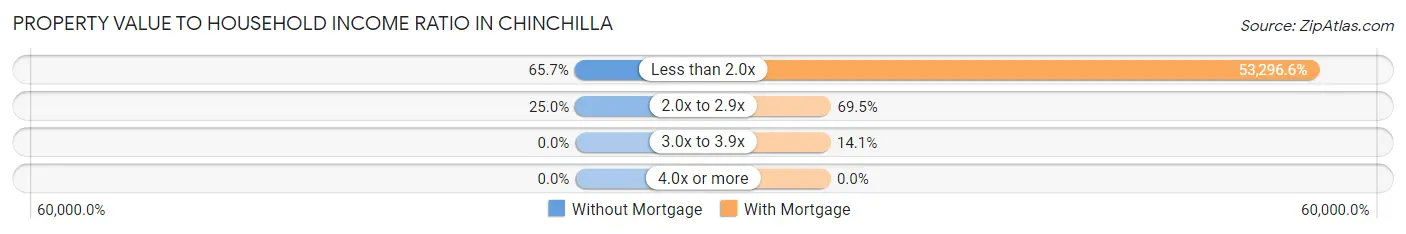
| Value-to-Income Ratio | Without Mortgage | With Mortgage |
| Less than 2.0x | 218 (65.7%) | 158,824 (53,296.6%) |
| 2.0x to 2.9x | 83 (25.0%) | 207 (69.5%) |
| 3.0x to 3.9x | 0 (0.0%) | 42 (14.1%) |
| 4.0x or more | 0 (0.0%) | 0 (0.0%) |
| Total | 332 (100.0%) | 298 (100.0%) |
Real Estate Taxes by Mortgage Status in Chinchilla
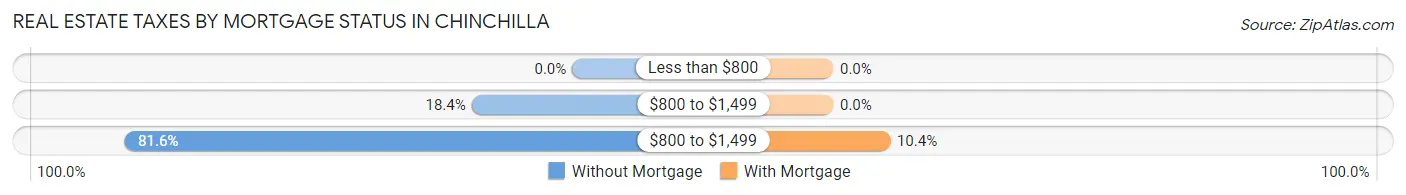
| Property Taxes | Without Mortgage | With Mortgage |
| Less than $800 | 0 (0.0%) | 0 (0.0%) |
| $800 to $1,499 | 61 (18.4%) | 0 (0.0%) |
| $800 to $1,499 | 271 (81.6%) | 31 (10.4%) |
| Total | 332 (100.0%) | 298 (100.0%) |
Health & Disability in Chinchilla
Health Insurance Coverage by Age in Chinchilla
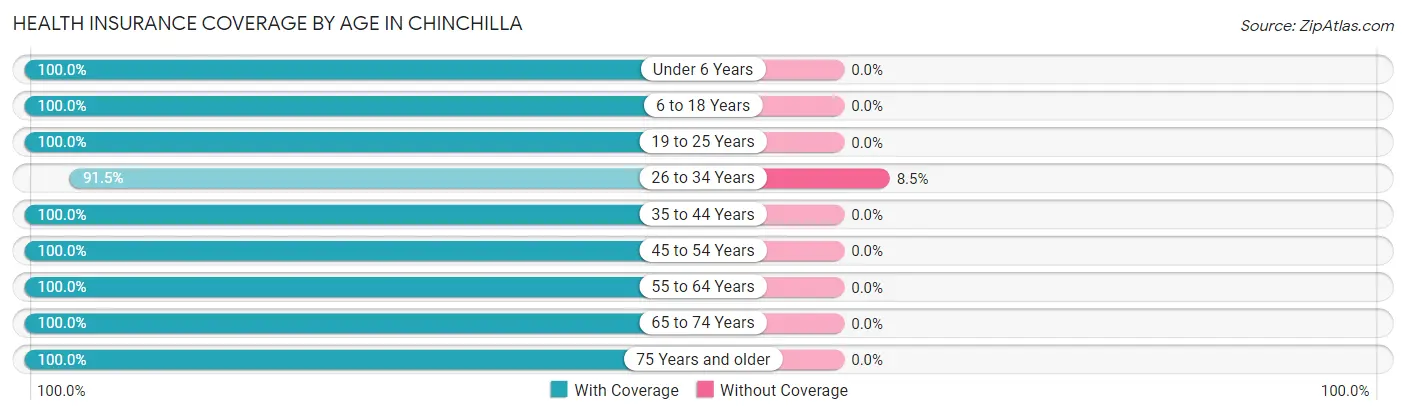
| Age Bracket | With Coverage | Without Coverage |
| Under 6 Years | 101 (100.0%) | 0 (0.0%) |
| 6 to 18 Years | 514 (100.0%) | 0 (0.0%) |
| 19 to 25 Years | 142 (100.0%) | 0 (0.0%) |
| 26 to 34 Years | 389 (91.5%) | 36 (8.5%) |
| 35 to 44 Years | 100 (100.0%) | 0 (0.0%) |
| 45 to 54 Years | 217 (100.0%) | 0 (0.0%) |
| 55 to 64 Years | 206 (100.0%) | 0 (0.0%) |
| 65 to 74 Years | 300 (100.0%) | 0 (0.0%) |
| 75 Years and older | 181 (100.0%) | 0 (0.0%) |
| Total | 2,150 (98.4%) | 36 (1.7%) |
Health Insurance Coverage by Citizenship Status in Chinchilla

| Citizenship Status | With Coverage | Without Coverage |
| Native Born | 101 (100.0%) | 0 (0.0%) |
| Foreign Born, Citizen | 514 (100.0%) | 0 (0.0%) |
| Foreign Born, not a Citizen | 142 (100.0%) | 0 (0.0%) |
Health Insurance Coverage by Household Income in Chinchilla
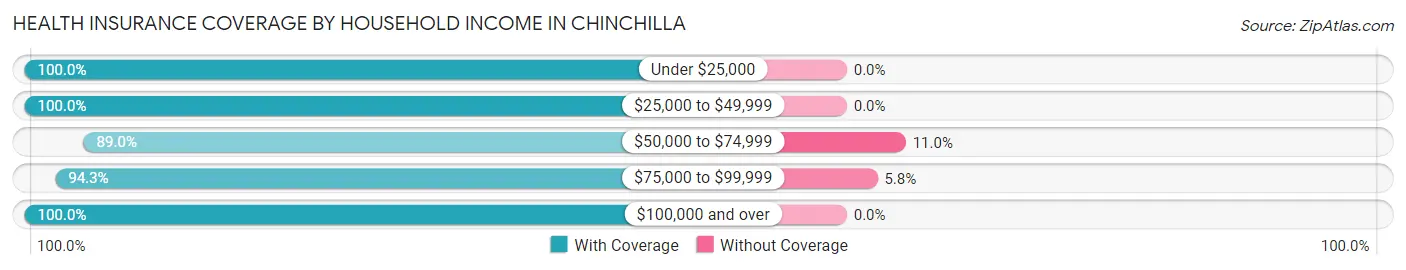
| Household Income | With Coverage | Without Coverage |
| Under $25,000 | 40 (100.0%) | 0 (0.0%) |
| $25,000 to $49,999 | 143 (100.0%) | 0 (0.0%) |
| $50,000 to $74,999 | 145 (89.0%) | 18 (11.0%) |
| $75,000 to $99,999 | 295 (94.3%) | 18 (5.8%) |
| $100,000 and over | 1,527 (100.0%) | 0 (0.0%) |
Public vs Private Health Insurance Coverage by Age in Chinchilla
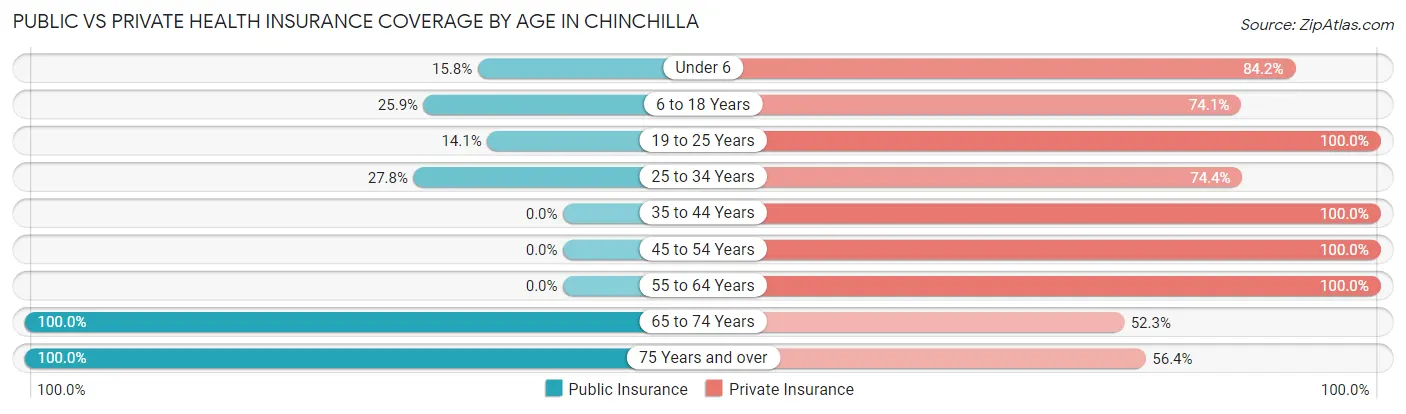
| Age Bracket | Public Insurance | Private Insurance |
| Under 6 | 16 (15.8%) | 85 (84.2%) |
| 6 to 18 Years | 133 (25.9%) | 381 (74.1%) |
| 19 to 25 Years | 20 (14.1%) | 142 (100.0%) |
| 25 to 34 Years | 118 (27.8%) | 316 (74.4%) |
| 35 to 44 Years | 0 (0.0%) | 100 (100.0%) |
| 45 to 54 Years | 0 (0.0%) | 217 (100.0%) |
| 55 to 64 Years | 0 (0.0%) | 206 (100.0%) |
| 65 to 74 Years | 300 (100.0%) | 157 (52.3%) |
| 75 Years and over | 181 (100.0%) | 102 (56.4%) |
| Total | 768 (35.1%) | 1,706 (78.0%) |
Disability Status by Sex by Age in Chinchilla
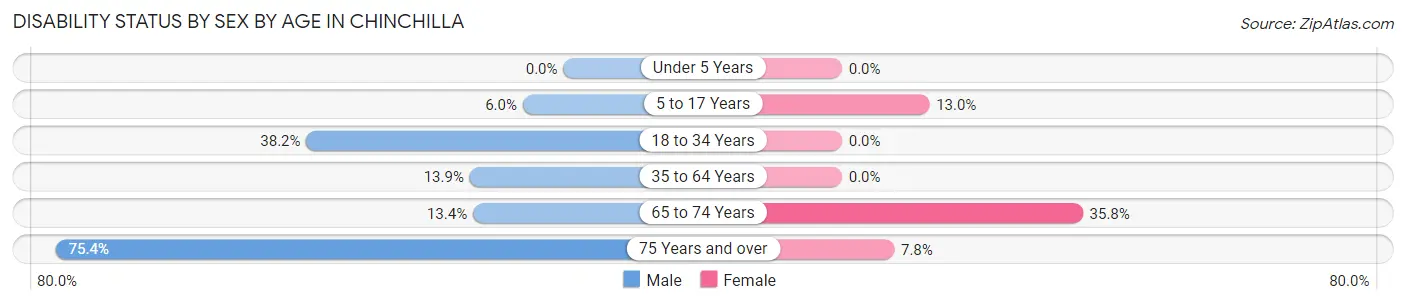
| Age Bracket | Male | Female |
| Under 5 Years | 0 (0.0%) | 0 (0.0%) |
| 5 to 17 Years | 16 (6.0%) | 37 (13.0%) |
| 18 to 34 Years | 87 (38.2%) | 0 (0.0%) |
| 35 to 64 Years | 36 (13.9%) | 0 (0.0%) |
| 65 to 74 Years | 20 (13.4%) | 54 (35.8%) |
| 75 Years and over | 49 (75.4%) | 9 (7.8%) |
Disability Class by Sex by Age in Chinchilla
Disability Class: Hearing Difficulty
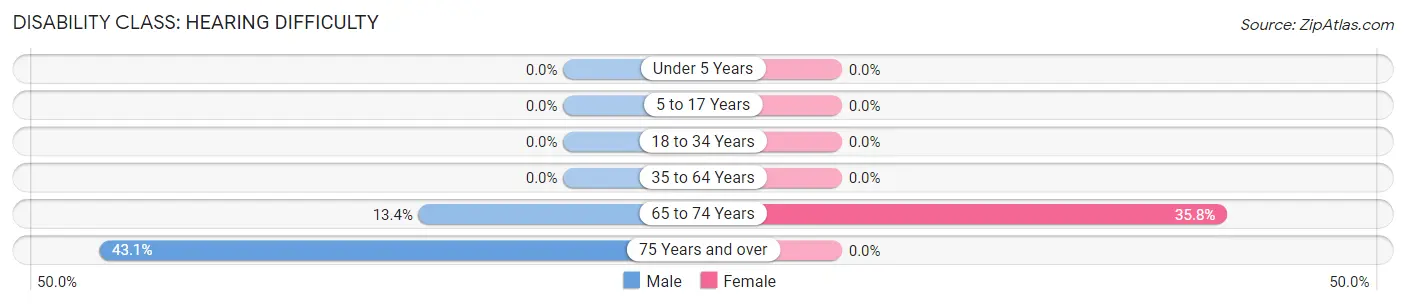
| Age Bracket | Male | Female |
| Under 5 Years | 0 (0.0%) | 0 (0.0%) |
| 5 to 17 Years | 0 (0.0%) | 0 (0.0%) |
| 18 to 34 Years | 0 (0.0%) | 0 (0.0%) |
| 35 to 64 Years | 0 (0.0%) | 0 (0.0%) |
| 65 to 74 Years | 20 (13.4%) | 54 (35.8%) |
| 75 Years and over | 28 (43.1%) | 0 (0.0%) |
Disability Class: Vision Difficulty
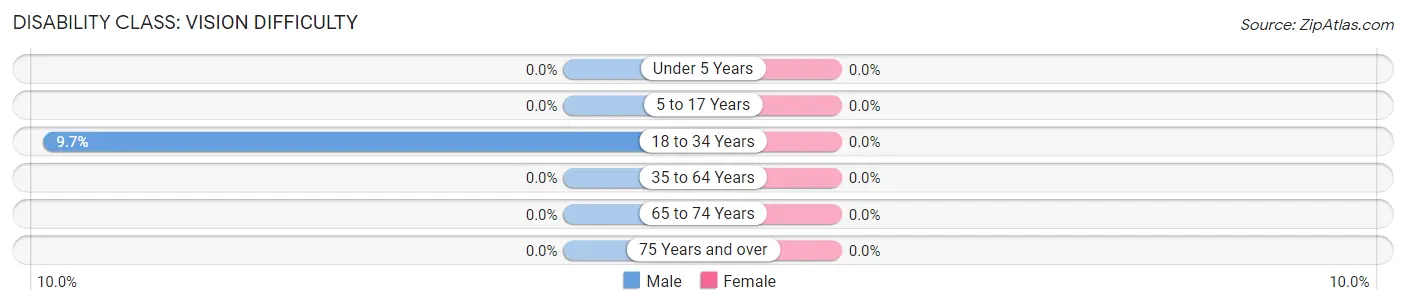
| Age Bracket | Male | Female |
| Under 5 Years | 0 (0.0%) | 0 (0.0%) |
| 5 to 17 Years | 0 (0.0%) | 0 (0.0%) |
| 18 to 34 Years | 22 (9.7%) | 0 (0.0%) |
| 35 to 64 Years | 0 (0.0%) | 0 (0.0%) |
| 65 to 74 Years | 0 (0.0%) | 0 (0.0%) |
| 75 Years and over | 0 (0.0%) | 0 (0.0%) |
Disability Class: Cognitive Difficulty
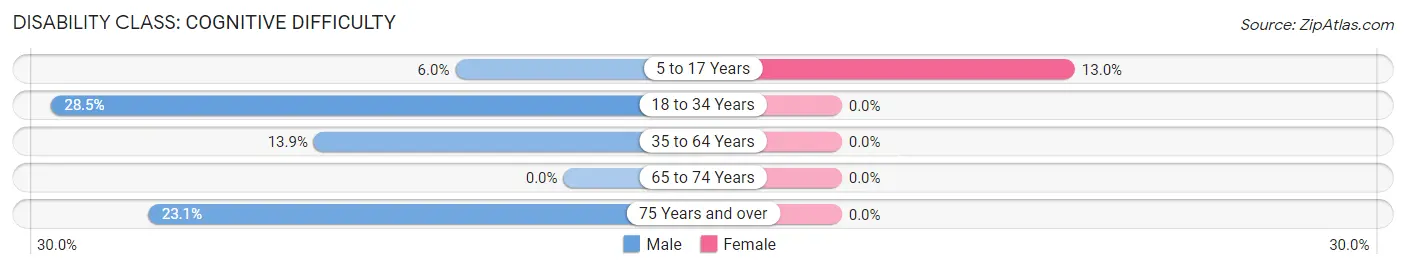
| Age Bracket | Male | Female |
| 5 to 17 Years | 16 (6.0%) | 37 (13.0%) |
| 18 to 34 Years | 65 (28.5%) | 0 (0.0%) |
| 35 to 64 Years | 36 (13.9%) | 0 (0.0%) |
| 65 to 74 Years | 0 (0.0%) | 0 (0.0%) |
| 75 Years and over | 15 (23.1%) | 0 (0.0%) |
Disability Class: Ambulatory Difficulty
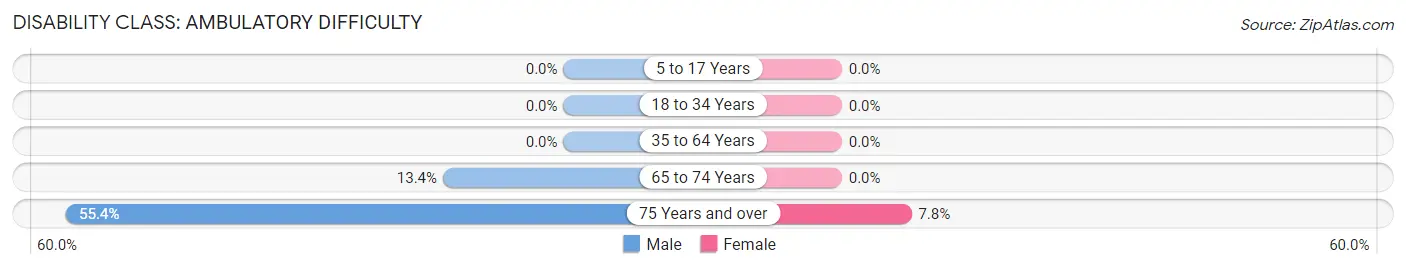
| Age Bracket | Male | Female |
| 5 to 17 Years | 0 (0.0%) | 0 (0.0%) |
| 18 to 34 Years | 0 (0.0%) | 0 (0.0%) |
| 35 to 64 Years | 0 (0.0%) | 0 (0.0%) |
| 65 to 74 Years | 20 (13.4%) | 0 (0.0%) |
| 75 Years and over | 36 (55.4%) | 9 (7.8%) |
Disability Class: Self-Care Difficulty
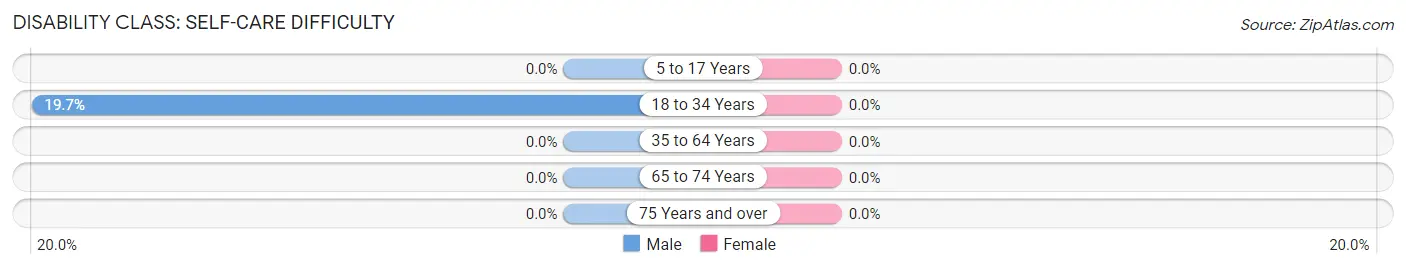
| Age Bracket | Male | Female |
| 5 to 17 Years | 0 (0.0%) | 0 (0.0%) |
| 18 to 34 Years | 45 (19.7%) | 0 (0.0%) |
| 35 to 64 Years | 0 (0.0%) | 0 (0.0%) |
| 65 to 74 Years | 0 (0.0%) | 0 (0.0%) |
| 75 Years and over | 0 (0.0%) | 0 (0.0%) |
Technology Access in Chinchilla
Computing Device Access in Chinchilla
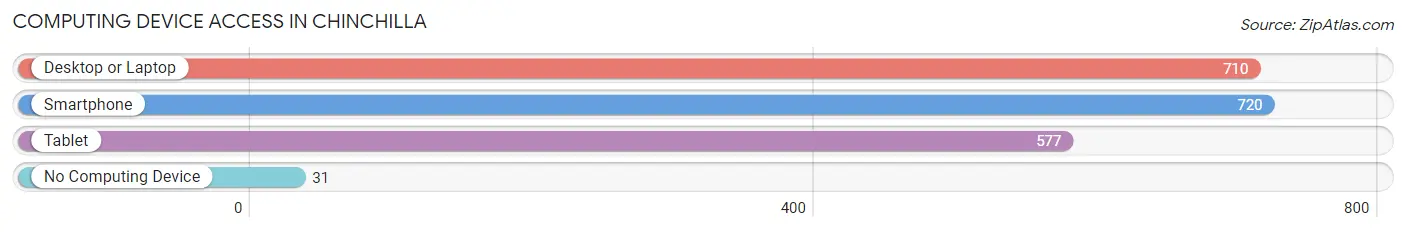
| Device Type | # Households | % Households |
| Desktop or Laptop | 710 | 91.0% |
| Smartphone | 720 | 92.3% |
| Tablet | 577 | 74.0% |
| No Computing Device | 31 | 4.0% |
| Total | 780 | 100.0% |
Internet Access in Chinchilla
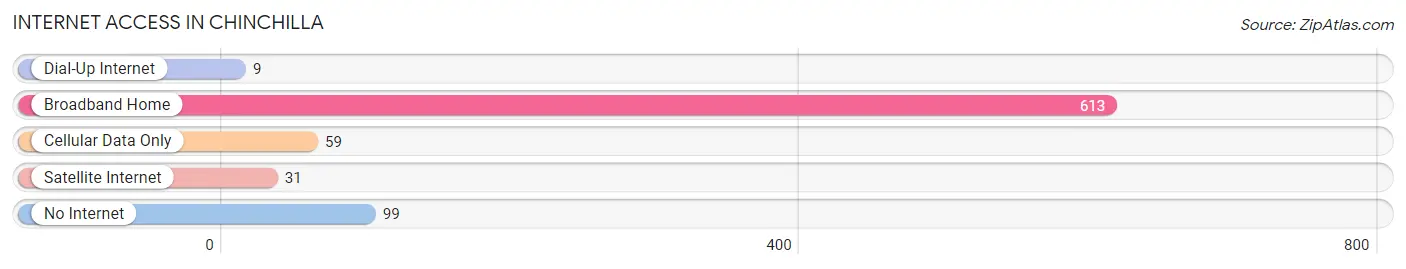
| Internet Type | # Households | % Households |
| Dial-Up Internet | 9 | 1.1% |
| Broadband Home | 613 | 78.6% |
| Cellular Data Only | 59 | 7.6% |
| Satellite Internet | 31 | 4.0% |
| No Internet | 99 | 12.7% |
| Total | 780 | 100.0% |
Chinchilla Summary
Chinchilla is a small borough located in Lackawanna County, Pennsylvania. It is situated in the foothills of the Pocono Mountains, approximately 10 miles south of Scranton. The population of Chinchilla was 1,845 as of the 2010 census.
History
Chinchilla was first settled in the early 1800s by a group of Welsh immigrants. The town was originally known as “Chinchilla Valley” and was named after the chinchilla, a small rodent native to South America. The town was officially incorporated in 1876.
In the late 1800s, Chinchilla was a thriving coal mining town. The coal industry was the main source of employment for the town’s residents. The coal mines were eventually closed in the early 1900s, and the town’s economy shifted to agriculture and light manufacturing.
Geography
Chinchilla is located in the foothills of the Pocono Mountains in northeastern Pennsylvania. The borough is situated in the Lackawanna River Valley, approximately 10 miles south of Scranton. The borough covers an area of 1.2 square miles and is bordered by the townships of Covington, Dalton, and Benton.
The terrain of Chinchilla is mostly hilly, with elevations ranging from 1,000 to 1,500 feet above sea level. The borough is located in a temperate climate zone, with average temperatures ranging from the mid-30s in the winter to the mid-70s in the summer.
Economy
The economy of Chinchilla is largely based on agriculture and light manufacturing. The borough is home to several small businesses, including a lumber mill, a furniture factory, and a dairy farm. The town also has a few retail stores, restaurants, and other small businesses.
The borough is also home to a number of small industrial parks, which provide employment for many of the town’s residents. The industrial parks are home to a variety of businesses, including a plastics manufacturer, a metal fabricator, and a printing company.
Demographics
As of the 2010 census, the population of Chinchilla was 1,845. The racial makeup of the borough was 97.3% White, 0.9% African American, 0.2% Native American, 0.3% Asian, and 1.3% from other races. The median household income was $45,938, and the median family income was $54,844.
The population of Chinchilla is largely Catholic, with the majority of the population belonging to the Roman Catholic Church. The borough is also home to a small number of Protestant churches.
Conclusion
Chinchilla is a small borough located in Lackawanna County, Pennsylvania. It is situated in the foothills of the Pocono Mountains, approximately 10 miles south of Scranton. The population of Chinchilla was 1,845 as of the 2010 census. The town was first settled in the early 1800s by a group of Welsh immigrants and was originally known as “Chinchilla Valley.” The economy of Chinchilla is largely based on agriculture and light manufacturing. The racial makeup of the borough was 97.3% White, 0.9% African American, 0.2% Native American, 0.3% Asian, and 1.3% from other races. The median household income was $45,938, and the median family income was $54,844. The population of Chinchilla is largely Catholic, with the majority of the population belonging to the Roman Catholic Church.
Common Questions
What is Per Capita Income in Chinchilla?
Per Capita income in Chinchilla is $48,747.
What is the Median Family Income in Chinchilla?
Median Family Income in Chinchilla is $158,603.
What is the Median Household income in Chinchilla?
Median Household Income in Chinchilla is $109,231.
What is Income or Wage Gap in Chinchilla?
Income or Wage Gap in Chinchilla is 1.7%.
Women in Chinchilla earn 98.3 cents for every dollar earned by a man.
What is Inequality or Gini Index in Chinchilla?
Inequality or Gini Index in Chinchilla is 0.37.
What is the Total Population of Chinchilla?
Total Population of Chinchilla is 2,186.
What is the Total Male Population of Chinchilla?
Total Male Population of Chinchilla is 1,003.
What is the Total Female Population of Chinchilla?
Total Female Population of Chinchilla is 1,183.
What is the Ratio of Males per 100 Females in Chinchilla?
There are 84.78 Males per 100 Females in Chinchilla.
What is the Ratio of Females per 100 Males in Chinchilla?
There are 117.95 Females per 100 Males in Chinchilla.
What is the Median Population Age in Chinchilla?
Median Population Age in Chinchilla is 33.1 Years.
What is the Average Family Size in Chinchilla
Average Family Size in Chinchilla is 3.6 People.
What is the Average Household Size in Chinchilla
Average Household Size in Chinchilla is 2.8 People.
How Large is the Labor Force in Chinchilla?
There are 1,124 People in the Labor Forcein in Chinchilla.
What is the Percentage of People in the Labor Force in Chinchilla?
69.4% of People are in the Labor Force in Chinchilla.
What is the Unemployment Rate in Chinchilla?
Unemployment Rate in Chinchilla is 7.7%.