Pineland, FL Map & Demographics
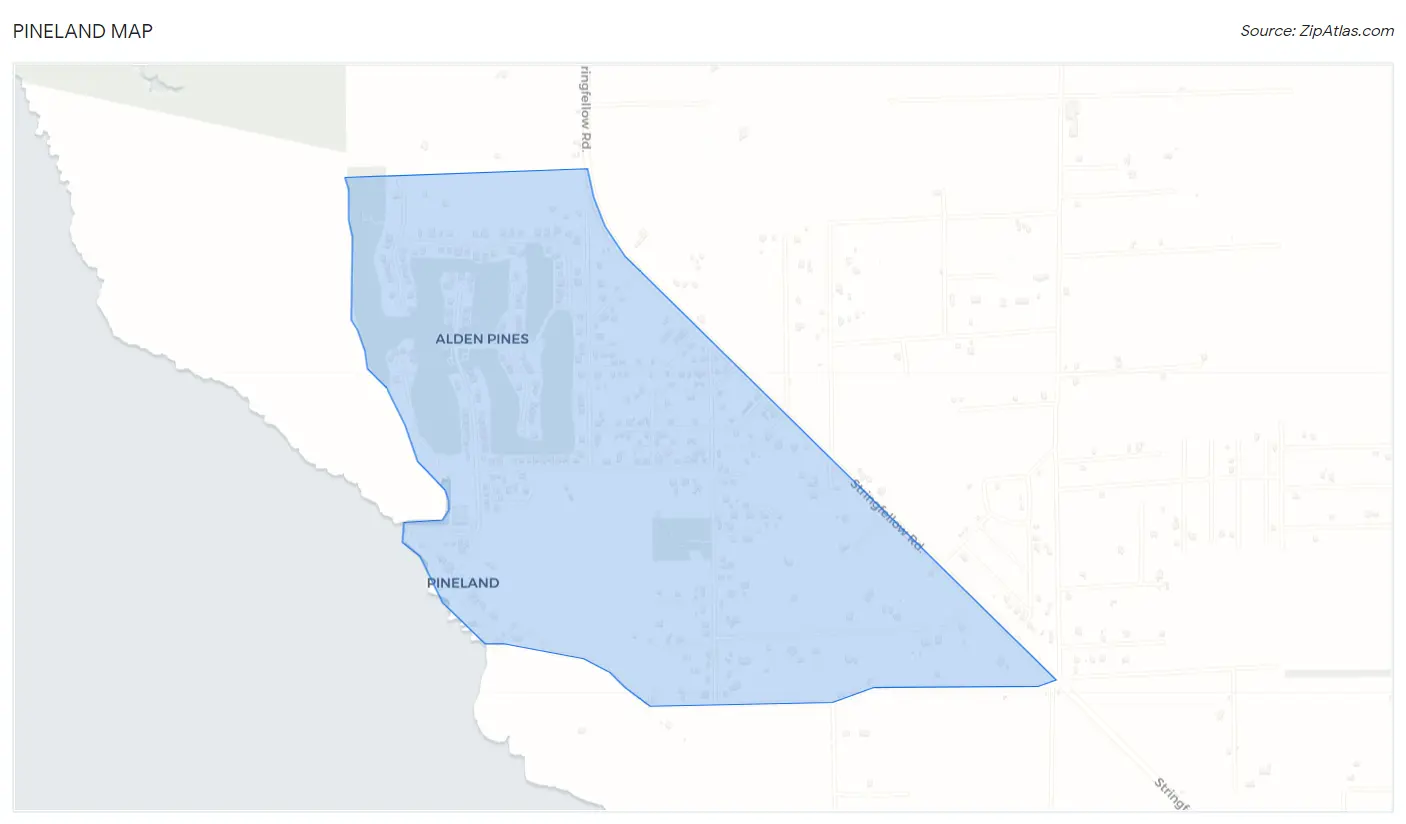
Pineland Map
Pineland Overview
$50,635
PER CAPITA INCOME
$111,354
AVG FAMILY INCOME
$93,594
AVG HOUSEHOLD INCOME
47.7%
WAGE / INCOME GAP [ % ]
52.3¢/ $1
WAGE / INCOME GAP [ $ ]
0.36
INEQUALITY / GINI INDEX
379
TOTAL POPULATION
198
MALE POPULATION
181
FEMALE POPULATION
109.39
MALES / 100 FEMALES
91.41
FEMALES / 100 MALES
61.1
MEDIAN AGE
2.4
AVG FAMILY SIZE
2.1
AVG HOUSEHOLD SIZE
175
LABOR FORCE [ PEOPLE ]
50.1%
PERCENT IN LABOR FORCE
Pineland Area Codes
Income in Pineland
Income Overview in Pineland
Per Capita Income in Pineland is $50,635, while median incomes of families and households are $111,354 and $93,594 respectively.
| Characteristic | Number | Measure |
| Per Capita Income | 379 | $50,635 |
| Median Family Income | 133 | $111,354 |
| Mean Family Income | 133 | $123,583 |
| Median Household Income | 177 | $93,594 |
| Mean Household Income | 177 | $109,773 |
| Income Deficit | 133 | $0 |
| Wage / Income Gap (%) | 379 | 47.67% |
| Wage / Income Gap ($) | 379 | 52.33¢ per $1 |
| Gini / Inequality Index | 379 | 0.36 |
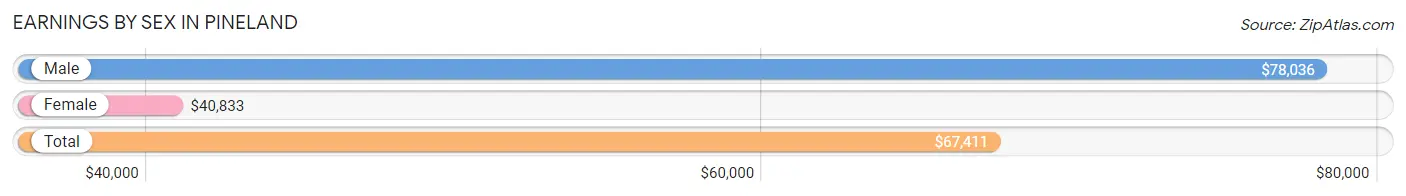
Earnings by Sex in Pineland
Average Earnings in Pineland are $67,411, $78,036 for men and $40,833 for women, a difference of 47.7%.
| Sex | Number | Average Earnings |
| Male | 99 (52.9%) | $78,036 |
| Female | 88 (47.1%) | $40,833 |
| Total | 187 (100.0%) | $67,411 |
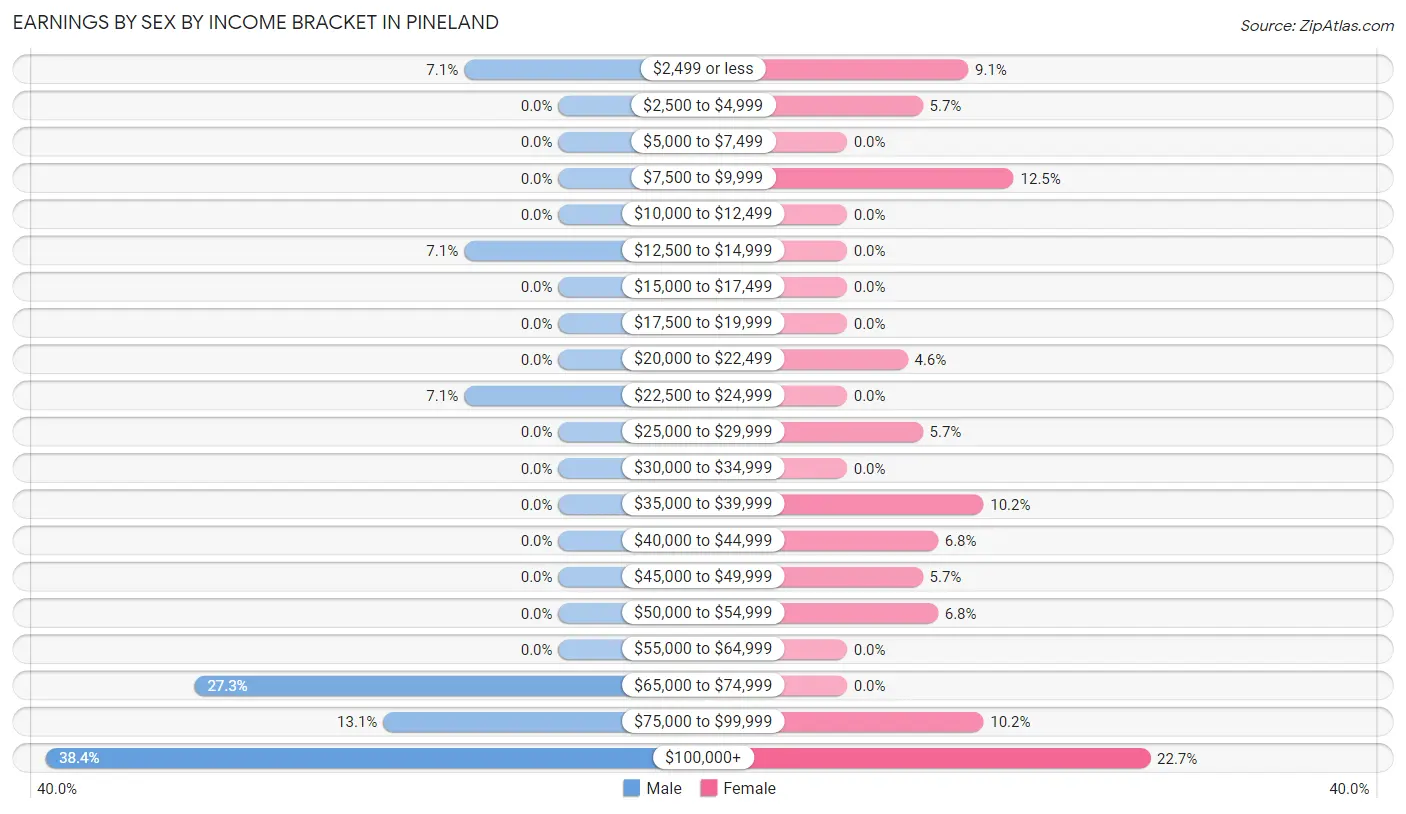
Earnings by Sex by Income Bracket in Pineland
The most common earnings brackets in Pineland are $100,000+ for men (38 | 38.4%) and $100,000+ for women (20 | 22.7%).
| Income | Male | Female |
| $2,499 or less | 7 (7.1%) | 8 (9.1%) |
| $2,500 to $4,999 | 0 (0.0%) | 5 (5.7%) |
| $5,000 to $7,499 | 0 (0.0%) | 0 (0.0%) |
| $7,500 to $9,999 | 0 (0.0%) | 11 (12.5%) |
| $10,000 to $12,499 | 0 (0.0%) | 0 (0.0%) |
| $12,500 to $14,999 | 7 (7.1%) | 0 (0.0%) |
| $15,000 to $17,499 | 0 (0.0%) | 0 (0.0%) |
| $17,500 to $19,999 | 0 (0.0%) | 0 (0.0%) |
| $20,000 to $22,499 | 0 (0.0%) | 4 (4.5%) |
| $22,500 to $24,999 | 7 (7.1%) | 0 (0.0%) |
| $25,000 to $29,999 | 0 (0.0%) | 5 (5.7%) |
| $30,000 to $34,999 | 0 (0.0%) | 0 (0.0%) |
| $35,000 to $39,999 | 0 (0.0%) | 9 (10.2%) |
| $40,000 to $44,999 | 0 (0.0%) | 6 (6.8%) |
| $45,000 to $49,999 | 0 (0.0%) | 5 (5.7%) |
| $50,000 to $54,999 | 0 (0.0%) | 6 (6.8%) |
| $55,000 to $64,999 | 0 (0.0%) | 0 (0.0%) |
| $65,000 to $74,999 | 27 (27.3%) | 0 (0.0%) |
| $75,000 to $99,999 | 13 (13.1%) | 9 (10.2%) |
| $100,000+ | 38 (38.4%) | 20 (22.7%) |
| Total | 99 (100.0%) | 88 (100.0%) |
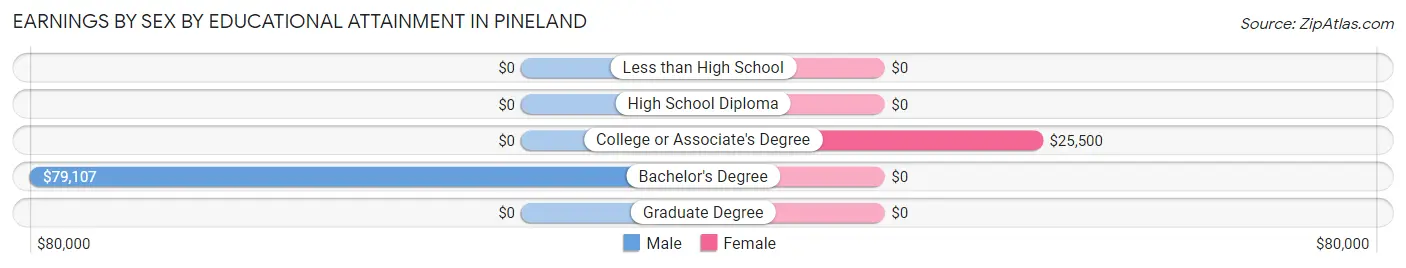
Earnings by Sex by Educational Attainment in Pineland
Average earnings in Pineland are $78,036 for men and $40,833 for women, a difference of 47.7%. Men with an educational attainment of bachelor's degree enjoy the highest average annual earnings of $79,107, while those with bachelor's degree education earn the least with $79,107. Women with an educational attainment of college or associate's degree earn the most with the average annual earnings of $25,500, while those with college or associate's degree education have the smallest earnings of $25,500.
| Educational Attainment | Male Income | Female Income |
| Less than High School | - | - |
| High School Diploma | - | - |
| College or Associate's Degree | - | - |
| Bachelor's Degree | $79,107 | $0 |
| Graduate Degree | - | - |
| Total | $78,036 | $40,833 |
Family Income in Pineland
Family Income Brackets in Pineland
According to the Pineland family income data, there are 31 families falling into the $100,000 to $149,999 income range, which is the most common income bracket and makes up 23.3% of all families.
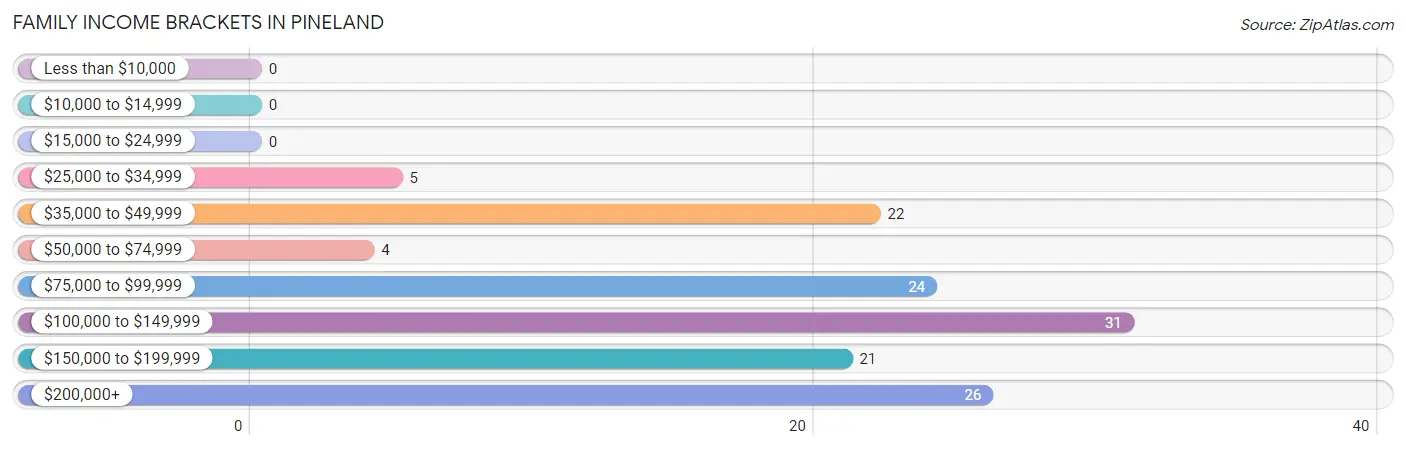
| Income Bracket | # Families | % Families |
| Less than $10,000 | 0 | 0.0% |
| $10,000 to $14,999 | 0 | 0.0% |
| $15,000 to $24,999 | 0 | 0.0% |
| $25,000 to $34,999 | 5 | 3.8% |
| $35,000 to $49,999 | 22 | 16.5% |
| $50,000 to $74,999 | 4 | 3.0% |
| $75,000 to $99,999 | 24 | 18.0% |
| $100,000 to $149,999 | 31 | 23.3% |
| $150,000 to $199,999 | 21 | 15.8% |
| $200,000+ | 26 | 19.5% |
Family Income by Famaliy Size in Pineland
2-person families (114 | 85.7%) account for the highest median family income in Pineland with $111,250 per family, while 2-person families (114 | 85.7%) have the highest median income of $55,625 per family member.
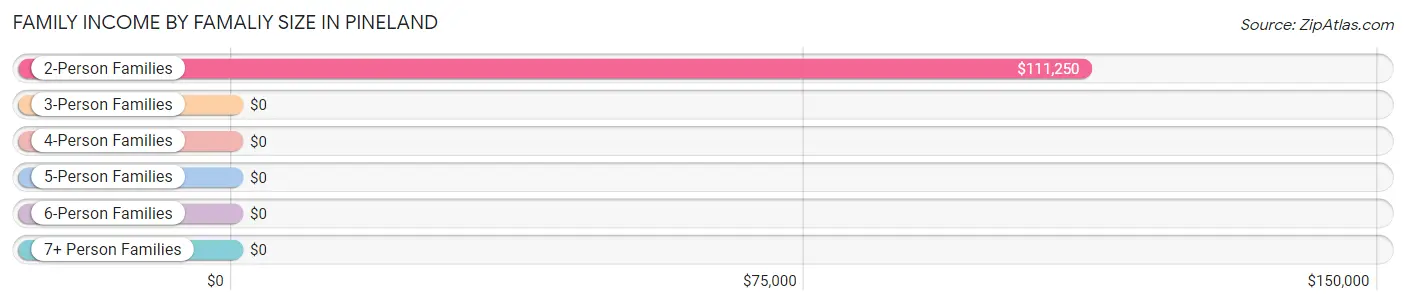
| Income Bracket | # Families | Median Income |
| 2-Person Families | 114 (85.7%) | $111,250 |
| 3-Person Families | 0 (0.0%) | $0 |
| 4-Person Families | 4 (3.0%) | $0 |
| 5-Person Families | 15 (11.3%) | $0 |
| 6-Person Families | 0 (0.0%) | $0 |
| 7+ Person Families | 0 (0.0%) | $0 |
| Total | 133 (100.0%) | $111,354 |
Family Income by Number of Earners in Pineland
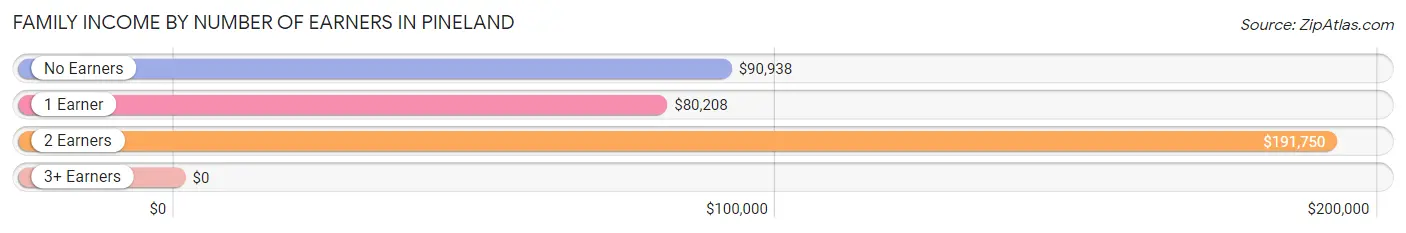
| Number of Earners | # Families | Median Income |
| No Earners | 31 (23.3%) | $90,938 |
| 1 Earner | 47 (35.3%) | $80,208 |
| 2 Earners | 55 (41.3%) | $191,750 |
| 3+ Earners | 0 (0.0%) | $0 |
| Total | 133 (100.0%) | $111,354 |
Household Income in Pineland
Household Income Brackets in Pineland
With 37 households falling in the category, the $75,000 to $99,999 income range is the most frequent in Pineland, accounting for 20.9% of all households.
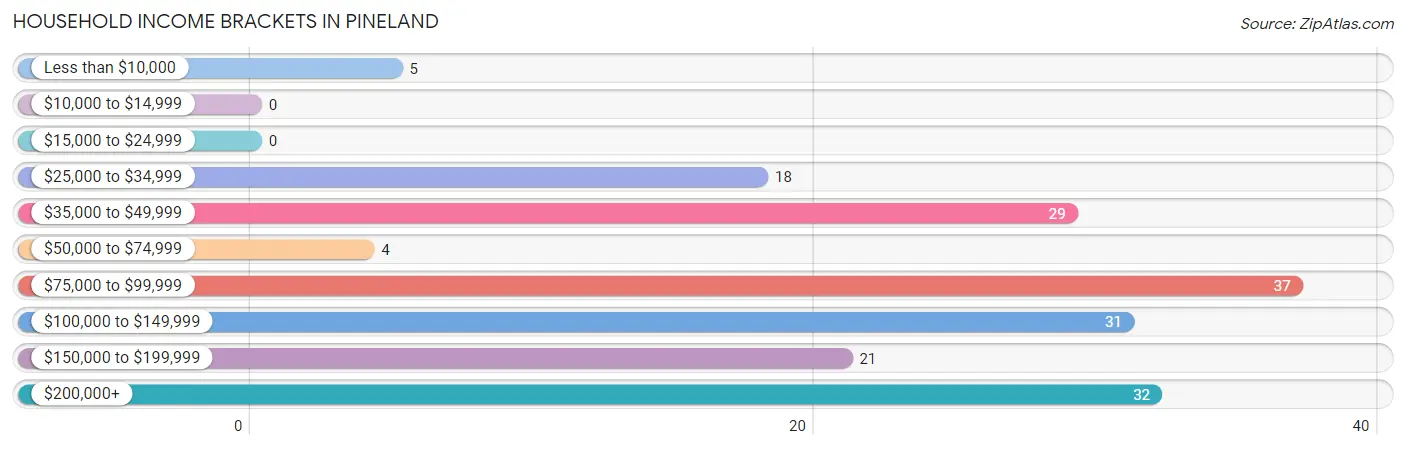
| Income Bracket | # Households | % Households |
| Less than $10,000 | 5 | 2.8% |
| $10,000 to $14,999 | 0 | 0.0% |
| $15,000 to $24,999 | 0 | 0.0% |
| $25,000 to $34,999 | 18 | 10.2% |
| $35,000 to $49,999 | 29 | 16.4% |
| $50,000 to $74,999 | 4 | 2.3% |
| $75,000 to $99,999 | 37 | 20.9% |
| $100,000 to $149,999 | 31 | 17.5% |
| $150,000 to $199,999 | 21 | 11.9% |
| $200,000+ | 32 | 18.1% |
Household Income by Householder Age in Pineland
The median household income in Pineland is $93,594, with the highest median household income of $212,750 found in the 45 to 64 years age bracket for the primary householder. A total of 63 households (35.6%) fall into this category.
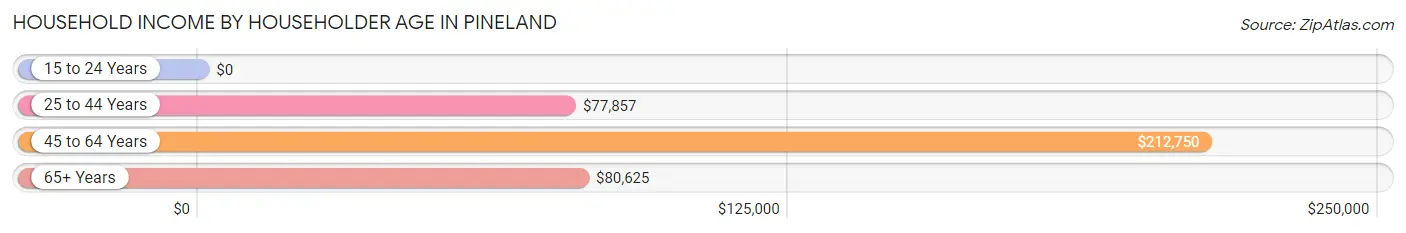
| Income Bracket | # Households | Median Income |
| 15 to 24 Years | 0 (0.0%) | $0 |
| 25 to 44 Years | 20 (11.3%) | $77,857 |
| 45 to 64 Years | 63 (35.6%) | $212,750 |
| 65+ Years | 94 (53.1%) | $80,625 |
| Total | 177 (100.0%) | $93,594 |
Poverty in Pineland
Income Below Poverty by Sex and Age in Pineland
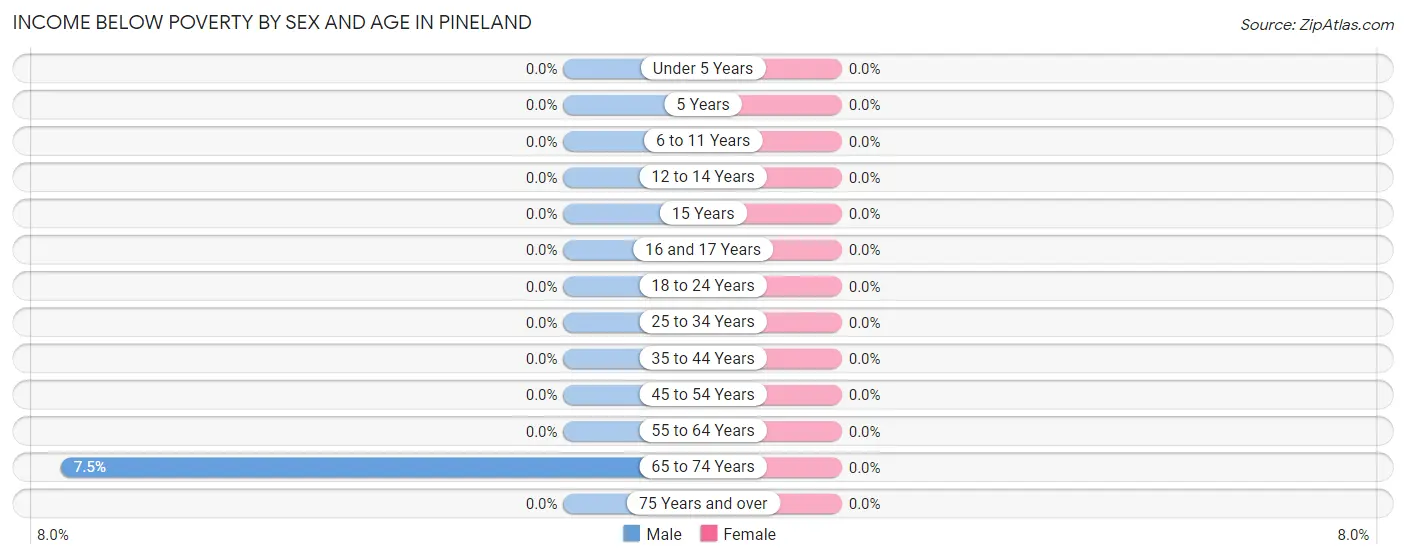
| Age Bracket | Male | Female |
| Under 5 Years | 0 (0.0%) | 0 (0.0%) |
| 5 Years | 0 (0.0%) | 0 (0.0%) |
| 6 to 11 Years | 0 (0.0%) | 0 (0.0%) |
| 12 to 14 Years | 0 (0.0%) | 0 (0.0%) |
| 15 Years | 0 (0.0%) | 0 (0.0%) |
| 16 and 17 Years | 0 (0.0%) | 0 (0.0%) |
| 18 to 24 Years | 0 (0.0%) | 0 (0.0%) |
| 25 to 34 Years | 0 (0.0%) | 0 (0.0%) |
| 35 to 44 Years | 0 (0.0%) | 0 (0.0%) |
| 45 to 54 Years | 0 (0.0%) | 0 (0.0%) |
| 55 to 64 Years | 0 (0.0%) | 0 (0.0%) |
| 65 to 74 Years | 5 (7.5%) | 0 (0.0%) |
| 75 Years and over | 0 (0.0%) | 0 (0.0%) |
| Total | 5 (2.5%) | 0 (0.0%) |
Income Above Poverty by Sex and Age in Pineland
According to the poverty statistics in Pineland, males aged 6 to 11 years and females aged under 5 years are the age groups that are most secure financially, with 100.0% of males and 100.0% of females in these age groups living above the poverty line.
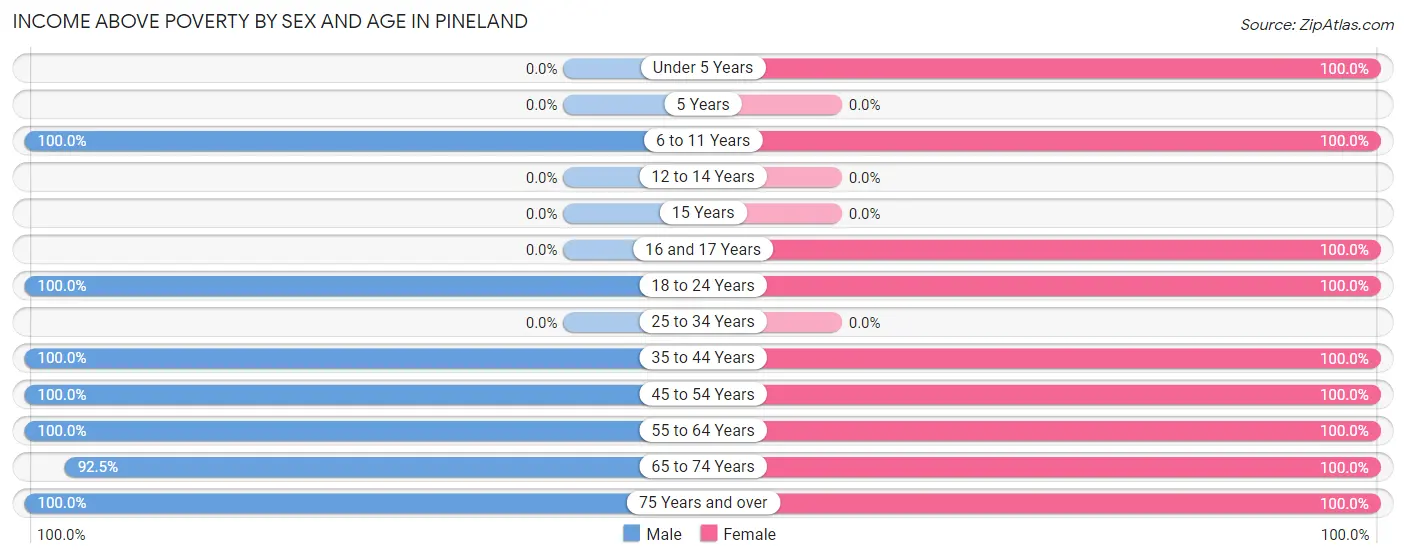
| Age Bracket | Male | Female |
| Under 5 Years | 0 (0.0%) | 12 (100.0%) |
| 5 Years | 0 (0.0%) | 0 (0.0%) |
| 6 to 11 Years | 13 (100.0%) | 5 (100.0%) |
| 12 to 14 Years | 0 (0.0%) | 0 (0.0%) |
| 15 Years | 0 (0.0%) | 0 (0.0%) |
| 16 and 17 Years | 0 (0.0%) | 10 (100.0%) |
| 18 to 24 Years | 8 (100.0%) | 12 (100.0%) |
| 25 to 34 Years | 0 (0.0%) | 0 (0.0%) |
| 35 to 44 Years | 11 (100.0%) | 18 (100.0%) |
| 45 to 54 Years | 29 (100.0%) | 12 (100.0%) |
| 55 to 64 Years | 39 (100.0%) | 55 (100.0%) |
| 65 to 74 Years | 62 (92.5%) | 33 (100.0%) |
| 75 Years and over | 31 (100.0%) | 24 (100.0%) |
| Total | 193 (97.5%) | 181 (100.0%) |
Income Below Poverty Among Married-Couple Families in Pineland
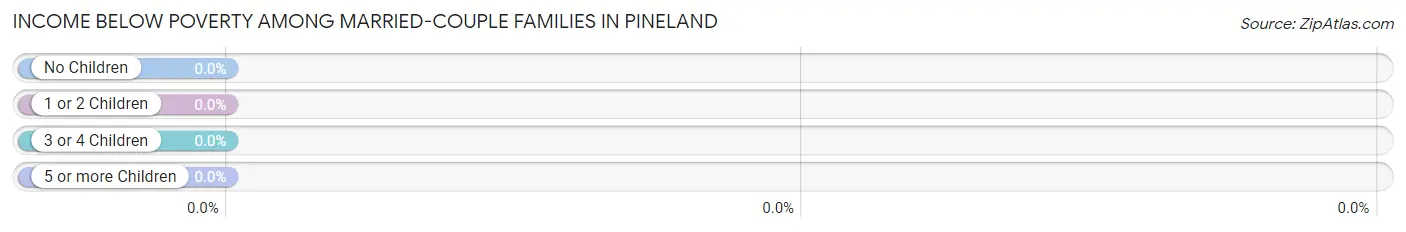
| Children | Above Poverty | Below Poverty |
| No Children | 120 (100.0%) | 0 (0.0%) |
| 1 or 2 Children | 4 (100.0%) | 0 (0.0%) |
| 3 or 4 Children | 9 (100.0%) | 0 (0.0%) |
| 5 or more Children | 0 (0.0%) | 0 (0.0%) |
| Total | 133 (100.0%) | 0 (0.0%) |
Income Below Poverty Among Single-Parent Households in Pineland
| Children | Single Father | Single Mother |
| No Children | 0 (0.0%) | 0 (0.0%) |
| 1 or 2 Children | 0 (0.0%) | 0 (0.0%) |
| 3 or 4 Children | 0 (0.0%) | 0 (0.0%) |
| 5 or more Children | 0 (0.0%) | 0 (0.0%) |
| Total | 0 (0.0%) | 0 (0.0%) |
Income Below Poverty Among Married-Couple vs Single-Parent Households in Pineland
| Children | Married-Couple Families | Single-Parent Households |
| No Children | 0 (0.0%) | 0 (0.0%) |
| 1 or 2 Children | 0 (0.0%) | 0 (0.0%) |
| 3 or 4 Children | 0 (0.0%) | 0 (0.0%) |
| 5 or more Children | 0 (0.0%) | 0 (0.0%) |
| Total | 0 (0.0%) | 0 (0.0%) |
Race in Pineland
The most populous races in Pineland are White / Caucasian (345 | 91.0%), Two or more Races (34 | 9.0%), and Hispanic or Latino (28 | 7.4%).
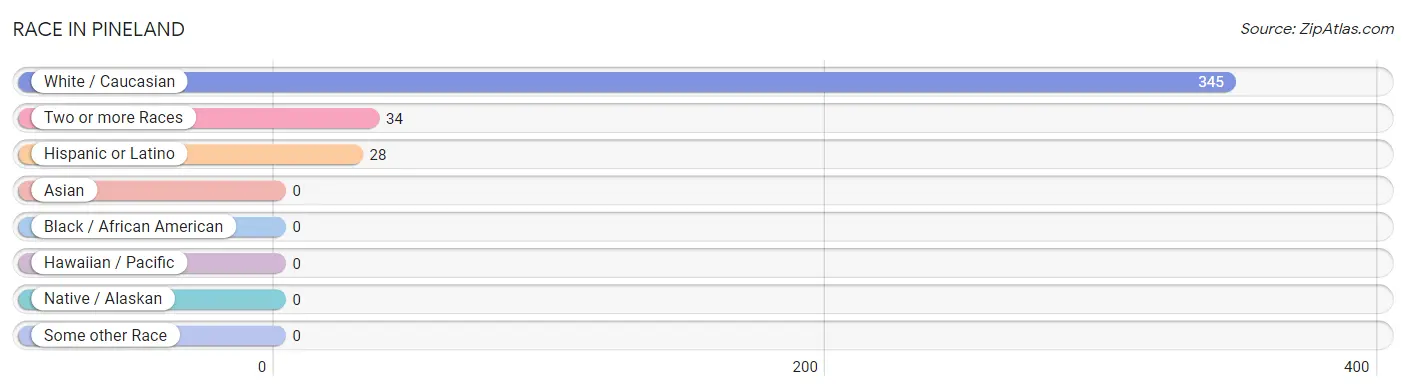
| Race | # Population | % Population |
| Asian | 0 | 0.0% |
| Black / African American | 0 | 0.0% |
| Hawaiian / Pacific | 0 | 0.0% |
| Hispanic or Latino | 28 | 7.4% |
| Native / Alaskan | 0 | 0.0% |
| White / Caucasian | 345 | 91.0% |
| Two or more Races | 34 | 9.0% |
| Some other Race | 0 | 0.0% |
| Total | 379 | 100.0% |
Ancestry in Pineland
The most populous ancestries reported in Pineland are English (105 | 27.7%), German (76 | 20.1%), Irish (70 | 18.5%), American (48 | 12.7%), and Norwegian (26 | 6.9%), together accounting for 85.7% of all Pineland residents.
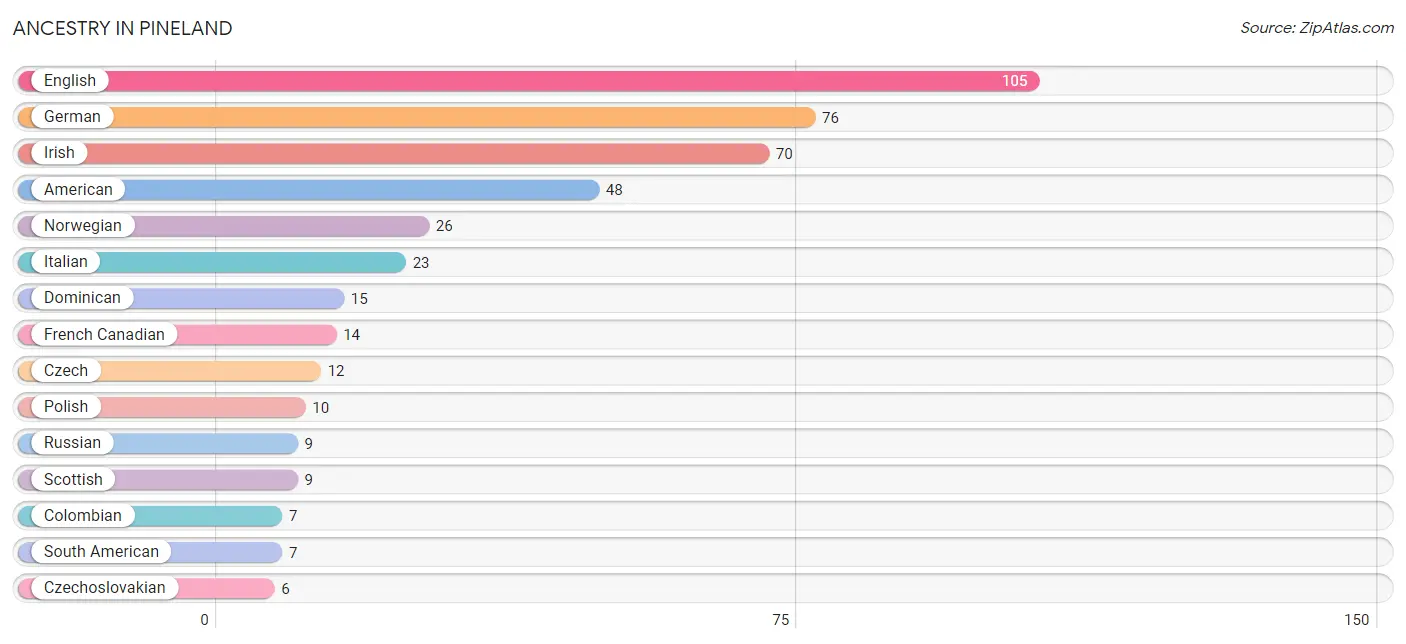
| Ancestry | # Population | % Population |
| American | 48 | 12.7% |
| Colombian | 7 | 1.8% |
| Czech | 12 | 3.2% |
| Czechoslovakian | 6 | 1.6% |
| Dominican | 15 | 4.0% |
| English | 105 | 27.7% |
| French | 6 | 1.6% |
| French Canadian | 14 | 3.7% |
| German | 76 | 20.1% |
| Irish | 70 | 18.5% |
| Italian | 23 | 6.1% |
| Norwegian | 26 | 6.9% |
| Polish | 10 | 2.6% |
| Puerto Rican | 6 | 1.6% |
| Russian | 9 | 2.4% |
| Scandinavian | 5 | 1.3% |
| Scottish | 9 | 2.4% |
| Slovak | 4 | 1.1% |
| South American | 7 | 1.8% | View All 19 Rows |
Immigrants in Pineland
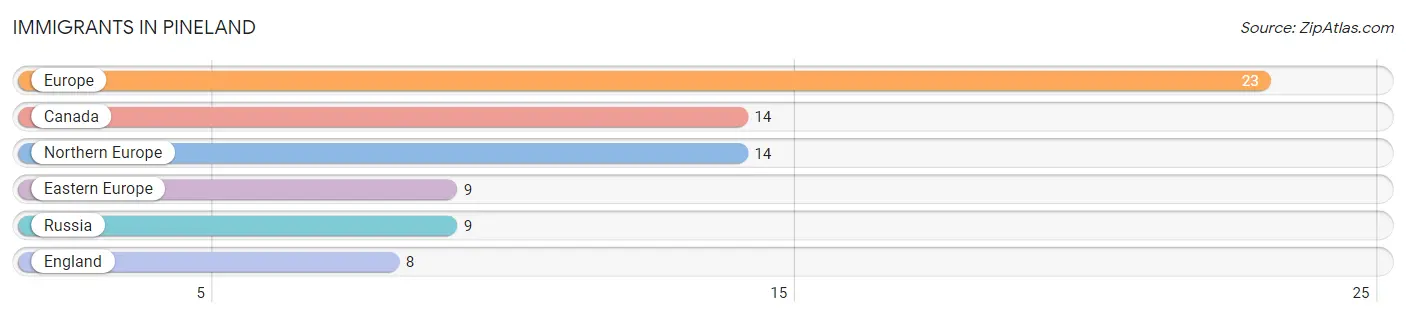
The most numerous immigrant groups reported in Pineland came from Europe (23 | 6.1%), Canada (14 | 3.7%), Northern Europe (14 | 3.7%), Eastern Europe (9 | 2.4%), and Russia (9 | 2.4%), together accounting for 18.2% of all Pineland residents.
| Immigration Origin | # Population | % Population |
| Canada | 14 | 3.7% |
| Eastern Europe | 9 | 2.4% |
| England | 8 | 2.1% |
| Europe | 23 | 6.1% |
| Northern Europe | 14 | 3.7% |
| Russia | 9 | 2.4% | View All 6 Rows |
Sex and Age in Pineland
Sex and Age in Pineland
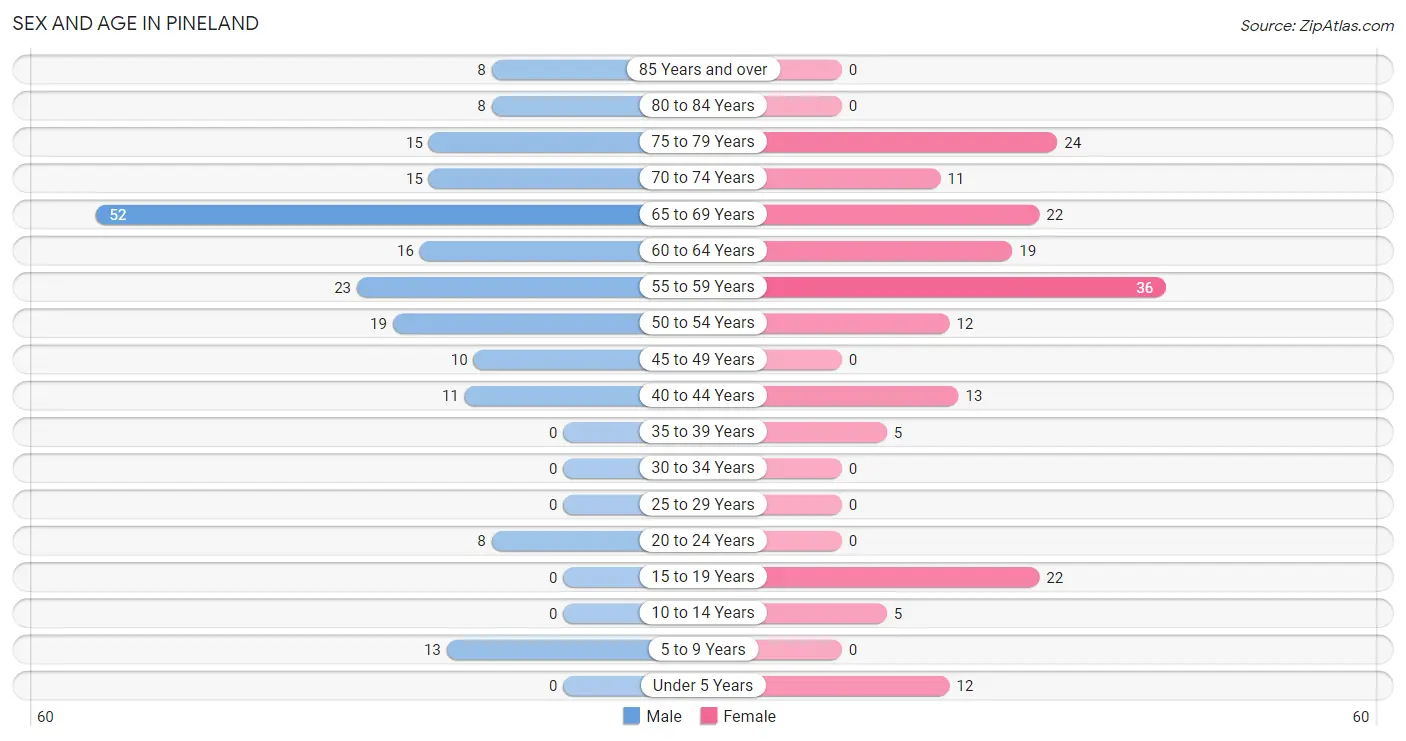
The most populous age groups in Pineland are 65 to 69 Years (52 | 26.3%) for men and 55 to 59 Years (36 | 19.9%) for women.
| Age Bracket | Male | Female |
| Under 5 Years | 0 (0.0%) | 12 (6.6%) |
| 5 to 9 Years | 13 (6.6%) | 0 (0.0%) |
| 10 to 14 Years | 0 (0.0%) | 5 (2.8%) |
| 15 to 19 Years | 0 (0.0%) | 22 (12.1%) |
| 20 to 24 Years | 8 (4.0%) | 0 (0.0%) |
| 25 to 29 Years | 0 (0.0%) | 0 (0.0%) |
| 30 to 34 Years | 0 (0.0%) | 0 (0.0%) |
| 35 to 39 Years | 0 (0.0%) | 5 (2.8%) |
| 40 to 44 Years | 11 (5.6%) | 13 (7.2%) |
| 45 to 49 Years | 10 (5.1%) | 0 (0.0%) |
| 50 to 54 Years | 19 (9.6%) | 12 (6.6%) |
| 55 to 59 Years | 23 (11.6%) | 36 (19.9%) |
| 60 to 64 Years | 16 (8.1%) | 19 (10.5%) |
| 65 to 69 Years | 52 (26.3%) | 22 (12.1%) |
| 70 to 74 Years | 15 (7.6%) | 11 (6.1%) |
| 75 to 79 Years | 15 (7.6%) | 24 (13.3%) |
| 80 to 84 Years | 8 (4.0%) | 0 (0.0%) |
| 85 Years and over | 8 (4.0%) | 0 (0.0%) |
| Total | 198 (100.0%) | 181 (100.0%) |
Families and Households in Pineland
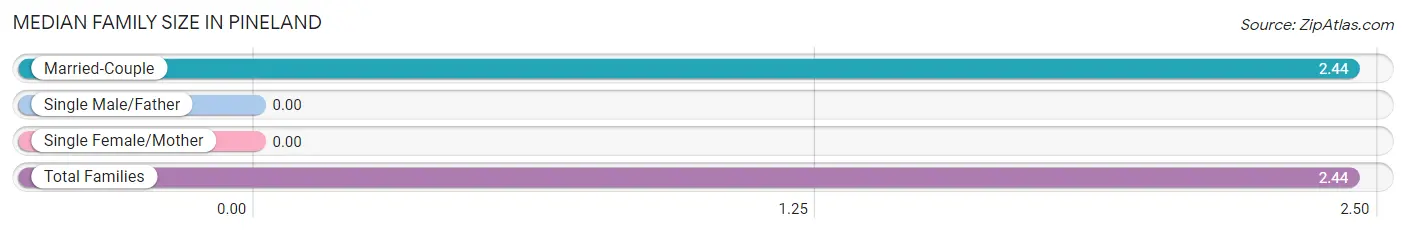
Median Family Size in Pineland
| Family Type | # Families | Family Size |
| Married-Couple | 133 (100.0%) | 2.44 |
| Single Male/Father | 0 (0.0%) | - |
| Single Female/Mother | 0 (0.0%) | - |
| Total Families | 133 (100.0%) | 2.44 |
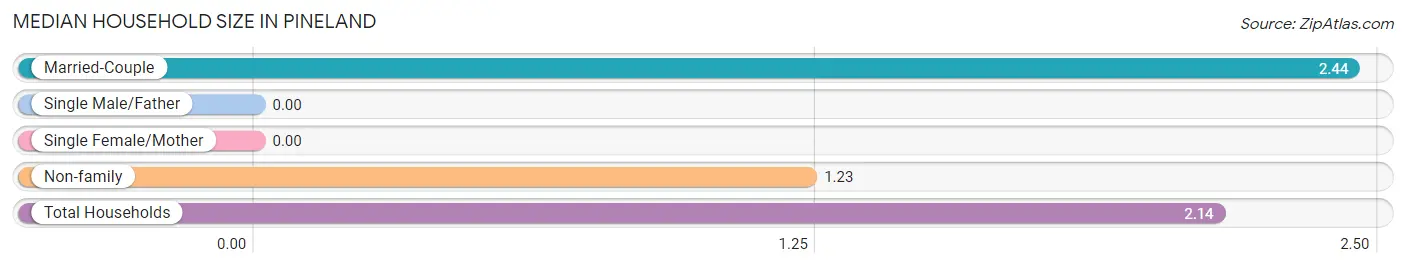
Median Household Size in Pineland
| Household Type | # Households | Household Size |
| Married-Couple | 133 (75.1%) | 2.44 |
| Single Male/Father | 0 (0.0%) | - |
| Single Female/Mother | 0 (0.0%) | - |
| Non-family | 44 (24.9%) | 1.23 |
| Total Households | 177 (100.0%) | 2.14 |
Household Size by Marriage Status in Pineland
Out of a total of 177 households in Pineland, 133 (75.1%) are family households, while 44 (24.9%) are nonfamily households. The most numerous type of family households are 2-person households, comprising 114, and the most common type of nonfamily households are 1-person households, comprising 32.
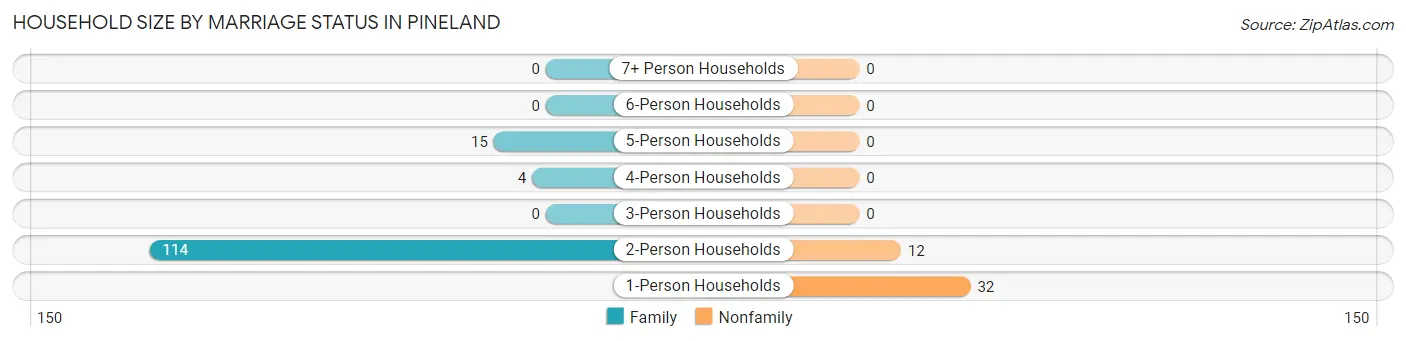
| Household Size | Family Households | Nonfamily Households |
| 1-Person Households | - | 32 (18.1%) |
| 2-Person Households | 114 (64.4%) | 12 (6.8%) |
| 3-Person Households | 0 (0.0%) | 0 (0.0%) |
| 4-Person Households | 4 (2.3%) | 0 (0.0%) |
| 5-Person Households | 15 (8.5%) | 0 (0.0%) |
| 6-Person Households | 0 (0.0%) | 0 (0.0%) |
| 7+ Person Households | 0 (0.0%) | 0 (0.0%) |
| Total | 133 (75.1%) | 44 (24.9%) |
Female Fertility in Pineland
Fertility by Age in Pineland
| Age Bracket | Women with Births | Births / 1,000 Women |
| 15 to 19 years | 0 (0.0%) | 0.0 |
| 20 to 34 years | 0 (0.0%) | 0.0 |
| 35 to 50 years | 0 (0.0%) | 0.0 |
| Total | 0 (0.0%) | 0.0 |
Fertility by Age by Marriage Status in Pineland
| Age Bracket | Married | Unmarried |
| 15 to 19 years | 0 (0.0%) | 0 (0.0%) |
| 20 to 34 years | 0 (0.0%) | 0 (0.0%) |
| 35 to 50 years | 0 (0.0%) | 0 (0.0%) |
| Total | 0 (0.0%) | 0 (0.0%) |
Fertility by Education in Pineland
| Educational Attainment | Women with Births | Births / 1,000 Women |
| Less than High School | 0 (0.0%) | 0.0 |
| High School Diploma | 0 (0.0%) | 0.0 |
| College or Associate's Degree | 0 (0.0%) | 0.0 |
| Bachelor's Degree | 0 (0.0%) | 0.0 |
| Graduate Degree | 0 (0.0%) | 0.0 |
| Total | 0 (0.0%) | 0.0 |
Fertility by Education by Marriage Status in Pineland
| Educational Attainment | Married | Unmarried |
| Less than High School | 0 (0.0%) | 0 (0.0%) |
| High School Diploma | 0 (0.0%) | 0 (0.0%) |
| College or Associate's Degree | 0 (0.0%) | 0 (0.0%) |
| Bachelor's Degree | 0 (0.0%) | 0 (0.0%) |
| Graduate Degree | 0 (0.0%) | 0 (0.0%) |
| Total | 0 (0.0%) | 0 (0.0%) |
Employment Characteristics in Pineland
Employment by Class of Employer in Pineland
Among the 175 employed individuals in Pineland, private company employees (105 | 60.0%), self-employed (incorporated) (36 | 20.6%), and local government employees (22 | 12.6%) make up the most common classes of employment.

| Employer Class | # Employees | % Employees |
| Private Company Employees | 105 | 60.0% |
| Self-Employed (Incorporated) | 36 | 20.6% |
| Self-Employed (Not Incorporated) | 12 | 6.9% |
| Not-for-profit Organizations | 0 | 0.0% |
| Local Government Employees | 22 | 12.6% |
| State Government Employees | 0 | 0.0% |
| Federal Government Employees | 0 | 0.0% |
| Unpaid Family Workers | 0 | 0.0% |
| Total | 175 | 100.0% |
Employment Status by Age in Pineland
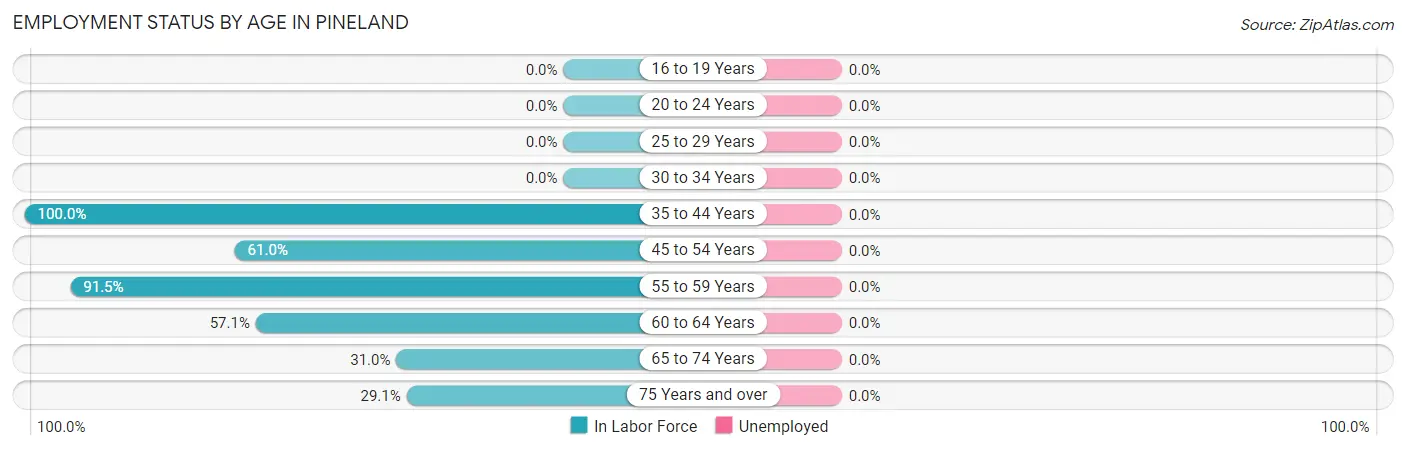
| Age Bracket | In Labor Force | Unemployed |
| 16 to 19 Years | 0 (0.0%) | 0 (0.0%) |
| 20 to 24 Years | 0 (0.0%) | 0 (0.0%) |
| 25 to 29 Years | 0 (0.0%) | 0 (0.0%) |
| 30 to 34 Years | 0 (0.0%) | 0 (0.0%) |
| 35 to 44 Years | 29 (100.0%) | 0 (0.0%) |
| 45 to 54 Years | 25 (61.0%) | 0 (0.0%) |
| 55 to 59 Years | 54 (91.5%) | 0 (0.0%) |
| 60 to 64 Years | 20 (57.1%) | 0 (0.0%) |
| 65 to 74 Years | 31 (31.0%) | 0 (0.0%) |
| 75 Years and over | 16 (29.1%) | 0 (0.0%) |
| Total | 175 (50.1%) | 0 (0.0%) |
Employment Status by Educational Attainment in Pineland
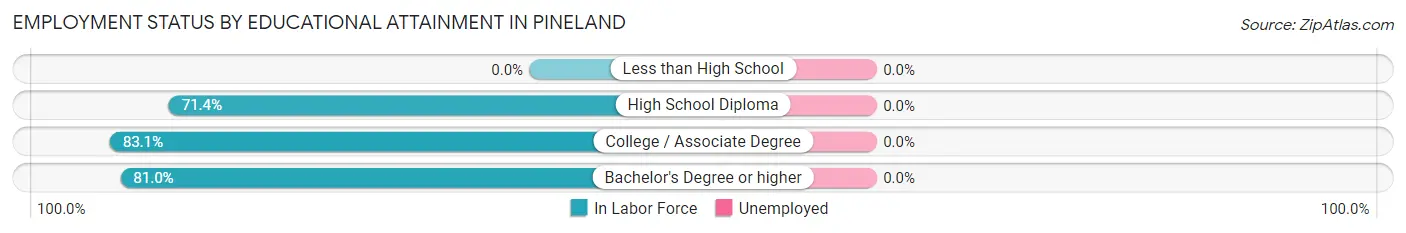
| Educational Attainment | In Labor Force | Unemployed |
| Less than High School | 0 (0.0%) | 0 (0.0%) |
| High School Diploma | 15 (71.4%) | 0 (0.0%) |
| College / Associate Degree | 49 (83.1%) | 0 (0.0%) |
| Bachelor's Degree or higher | 64 (81.0%) | 0 (0.0%) |
| Total | 128 (78.0%) | 0 (0.0%) |
Employment Occupations by Sex in Pineland
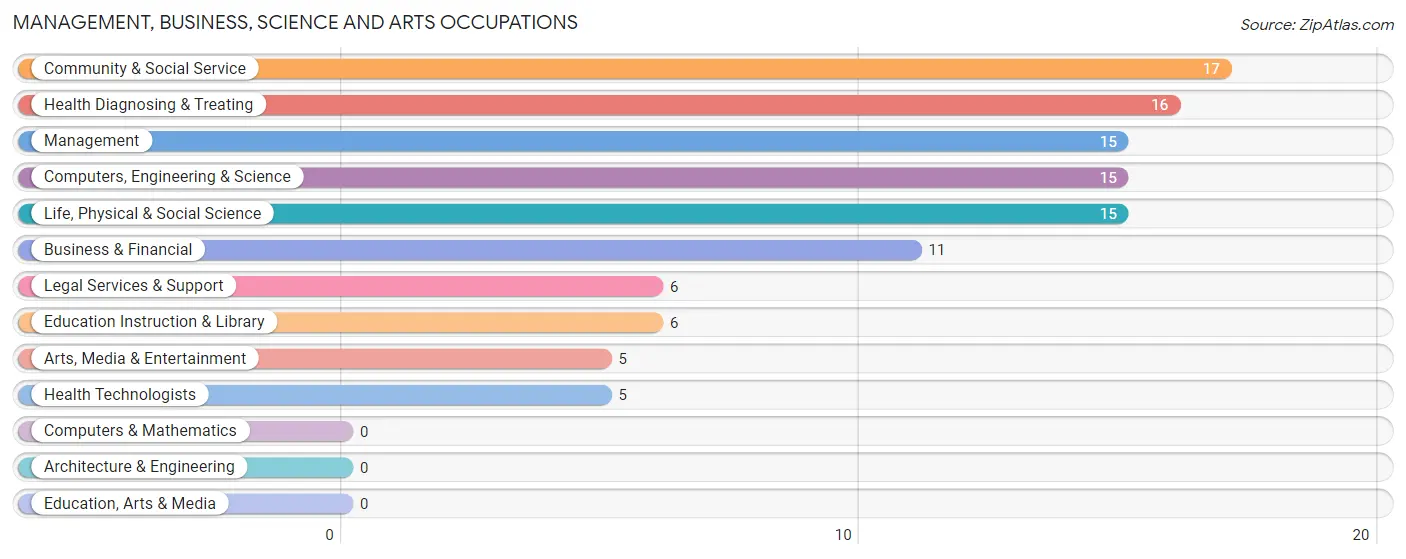
Management, Business, Science and Arts Occupations
The most common Management, Business, Science and Arts occupations in Pineland are Community & Social Service (17 | 9.7%), Health Diagnosing & Treating (16 | 9.1%), Management (15 | 8.6%), Computers, Engineering & Science (15 | 8.6%), and Life, Physical & Social Science (15 | 8.6%).
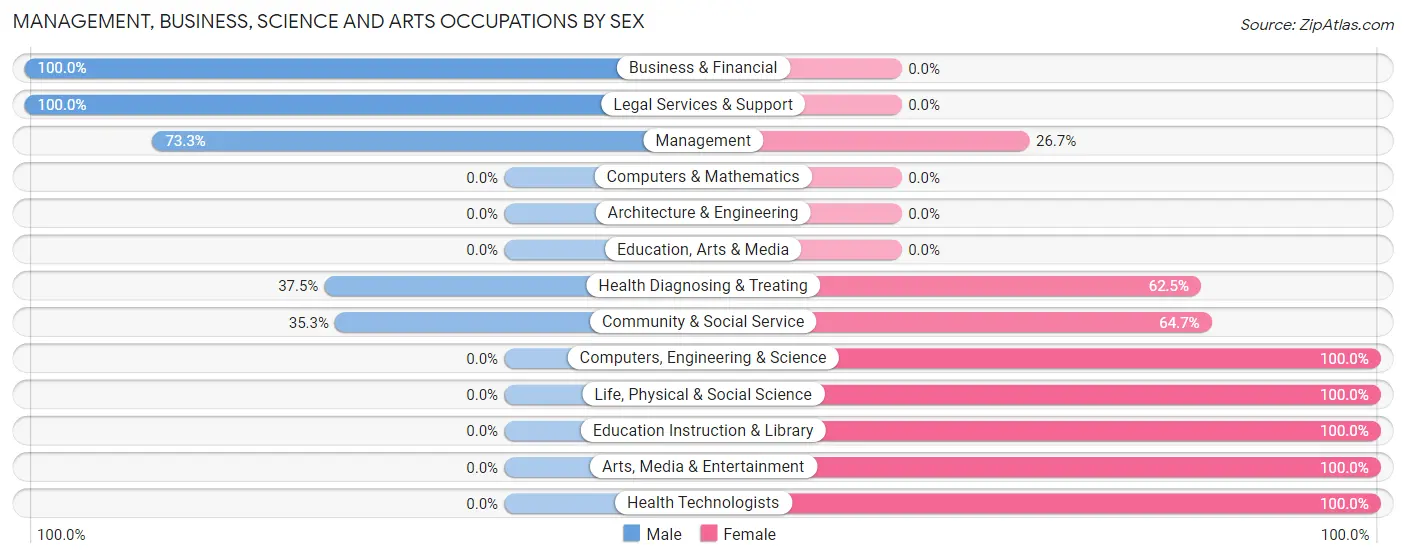
Management, Business, Science and Arts Occupations by Sex
Within the Management, Business, Science and Arts occupations in Pineland, the most male-oriented occupations are Business & Financial (100.0%), Legal Services & Support (100.0%), and Management (73.3%), while the most female-oriented occupations are Computers, Engineering & Science (100.0%), Life, Physical & Social Science (100.0%), and Education Instruction & Library (100.0%).
| Occupation | Male | Female |
| Management | 11 (73.3%) | 4 (26.7%) |
| Business & Financial | 11 (100.0%) | 0 (0.0%) |
| Computers, Engineering & Science | 0 (0.0%) | 15 (100.0%) |
| Computers & Mathematics | 0 (0.0%) | 0 (0.0%) |
| Architecture & Engineering | 0 (0.0%) | 0 (0.0%) |
| Life, Physical & Social Science | 0 (0.0%) | 15 (100.0%) |
| Community & Social Service | 6 (35.3%) | 11 (64.7%) |
| Education, Arts & Media | 0 (0.0%) | 0 (0.0%) |
| Legal Services & Support | 6 (100.0%) | 0 (0.0%) |
| Education Instruction & Library | 0 (0.0%) | 6 (100.0%) |
| Arts, Media & Entertainment | 0 (0.0%) | 5 (100.0%) |
| Health Diagnosing & Treating | 6 (37.5%) | 10 (62.5%) |
| Health Technologists | 0 (0.0%) | 5 (100.0%) |
| Total (Category) | 34 (46.0%) | 40 (54.0%) |
| Total (Overall) | 87 (49.7%) | 88 (50.3%) |
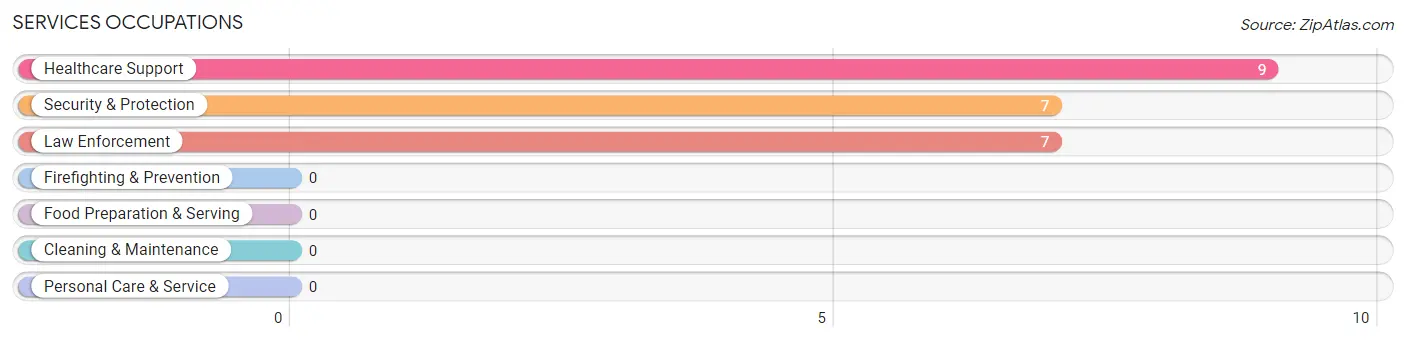
Services Occupations
The most common Services occupations in Pineland are Healthcare Support (9 | 5.1%), Security & Protection (7 | 4.0%), and Law Enforcement (7 | 4.0%).
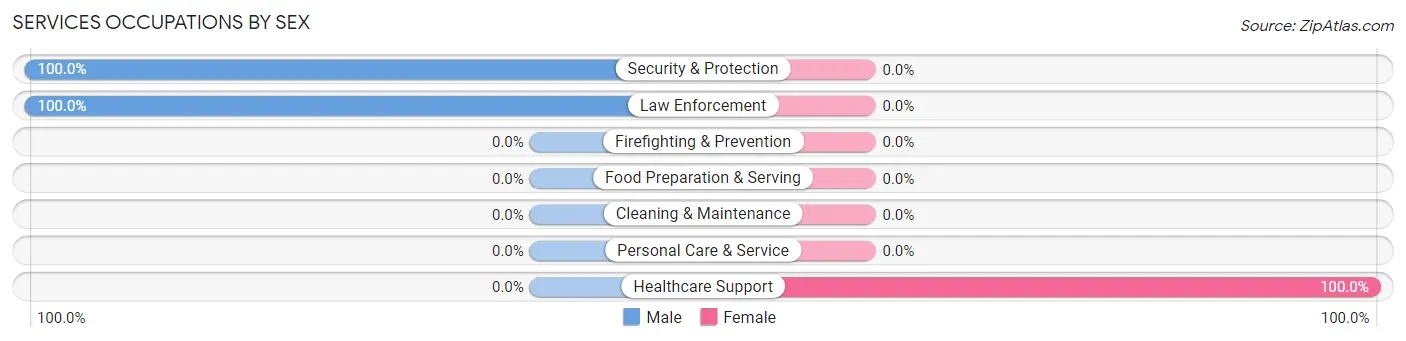
Services Occupations by Sex
| Occupation | Male | Female |
| Healthcare Support | 0 (0.0%) | 9 (100.0%) |
| Security & Protection | 7 (100.0%) | 0 (0.0%) |
| Firefighting & Prevention | 0 (0.0%) | 0 (0.0%) |
| Law Enforcement | 7 (100.0%) | 0 (0.0%) |
| Food Preparation & Serving | 0 (0.0%) | 0 (0.0%) |
| Cleaning & Maintenance | 0 (0.0%) | 0 (0.0%) |
| Personal Care & Service | 0 (0.0%) | 0 (0.0%) |
| Total (Category) | 7 (43.8%) | 9 (56.2%) |
| Total (Overall) | 87 (49.7%) | 88 (50.3%) |
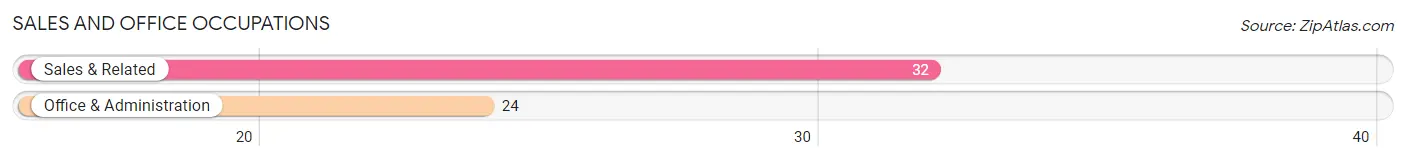
Sales and Office Occupations
The most common Sales and Office occupations in Pineland are Sales & Related (32 | 18.3%), and Office & Administration (24 | 13.7%).
Sales and Office Occupations by Sex
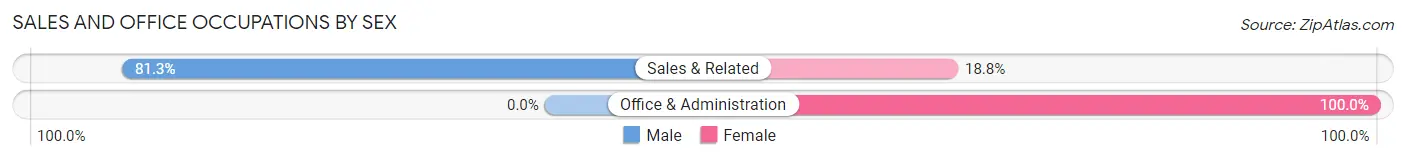
| Occupation | Male | Female |
| Sales & Related | 26 (81.2%) | 6 (18.8%) |
| Office & Administration | 0 (0.0%) | 24 (100.0%) |
| Total (Category) | 26 (46.4%) | 30 (53.6%) |
| Total (Overall) | 87 (49.7%) | 88 (50.3%) |
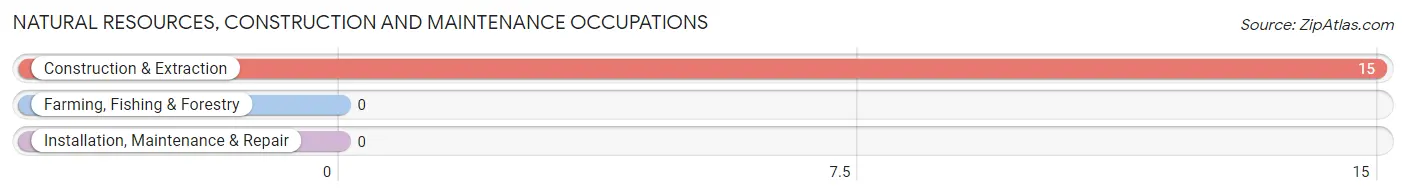
Natural Resources, Construction and Maintenance Occupations
The most common Natural Resources, Construction and Maintenance occupations in Pineland are , and Construction & Extraction (15 | 8.6%).
Natural Resources, Construction and Maintenance Occupations by Sex
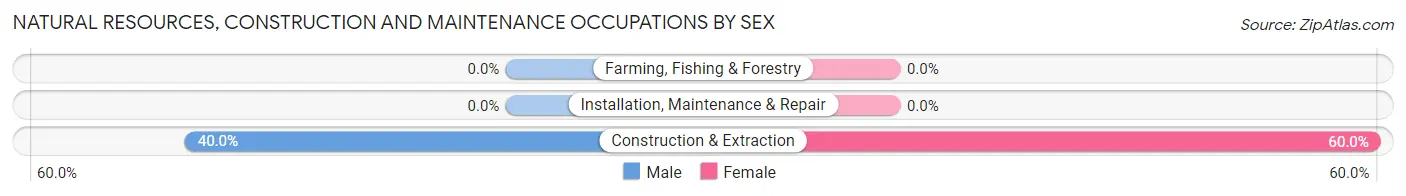
| Occupation | Male | Female |
| Farming, Fishing & Forestry | 0 (0.0%) | 0 (0.0%) |
| Construction & Extraction | 6 (40.0%) | 9 (60.0%) |
| Installation, Maintenance & Repair | 0 (0.0%) | 0 (0.0%) |
| Total (Category) | 6 (40.0%) | 9 (60.0%) |
| Total (Overall) | 87 (49.7%) | 88 (50.3%) |
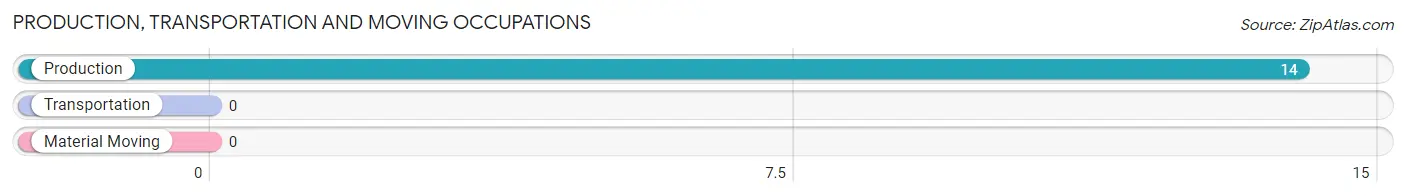
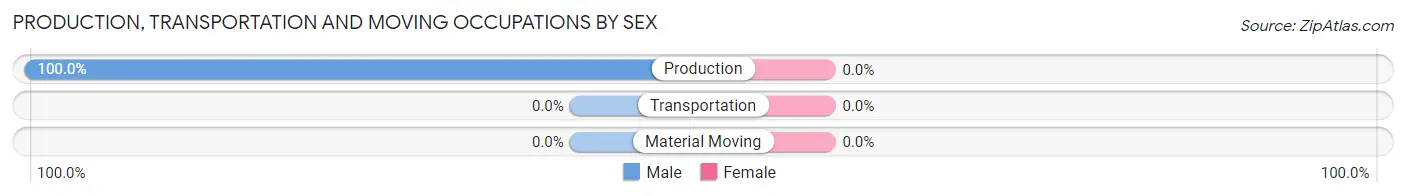
Production, Transportation and Moving Occupations
The most common Production, Transportation and Moving occupations in Pineland are , and Production (14 | 8.0%).
Production, Transportation and Moving Occupations by Sex
| Occupation | Male | Female |
| Production | 14 (100.0%) | 0 (0.0%) |
| Transportation | 0 (0.0%) | 0 (0.0%) |
| Material Moving | 0 (0.0%) | 0 (0.0%) |
| Total (Category) | 14 (100.0%) | 0 (0.0%) |
| Total (Overall) | 87 (49.7%) | 88 (50.3%) |
Employment Industries by Sex in Pineland
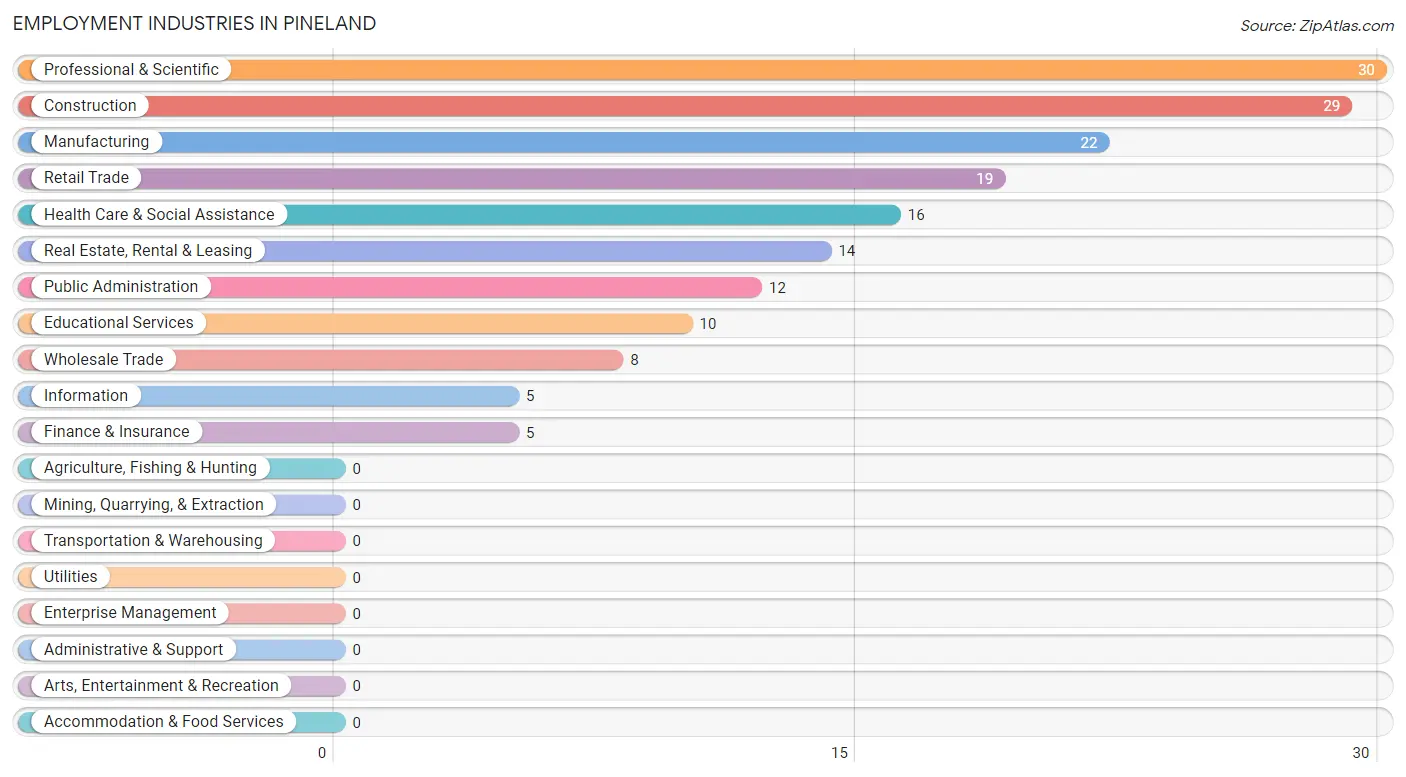
Employment Industries in Pineland
The major employment industries in Pineland include Professional & Scientific (30 | 17.1%), Construction (29 | 16.6%), Manufacturing (22 | 12.6%), Retail Trade (19 | 10.9%), and Health Care & Social Assistance (16 | 9.1%).
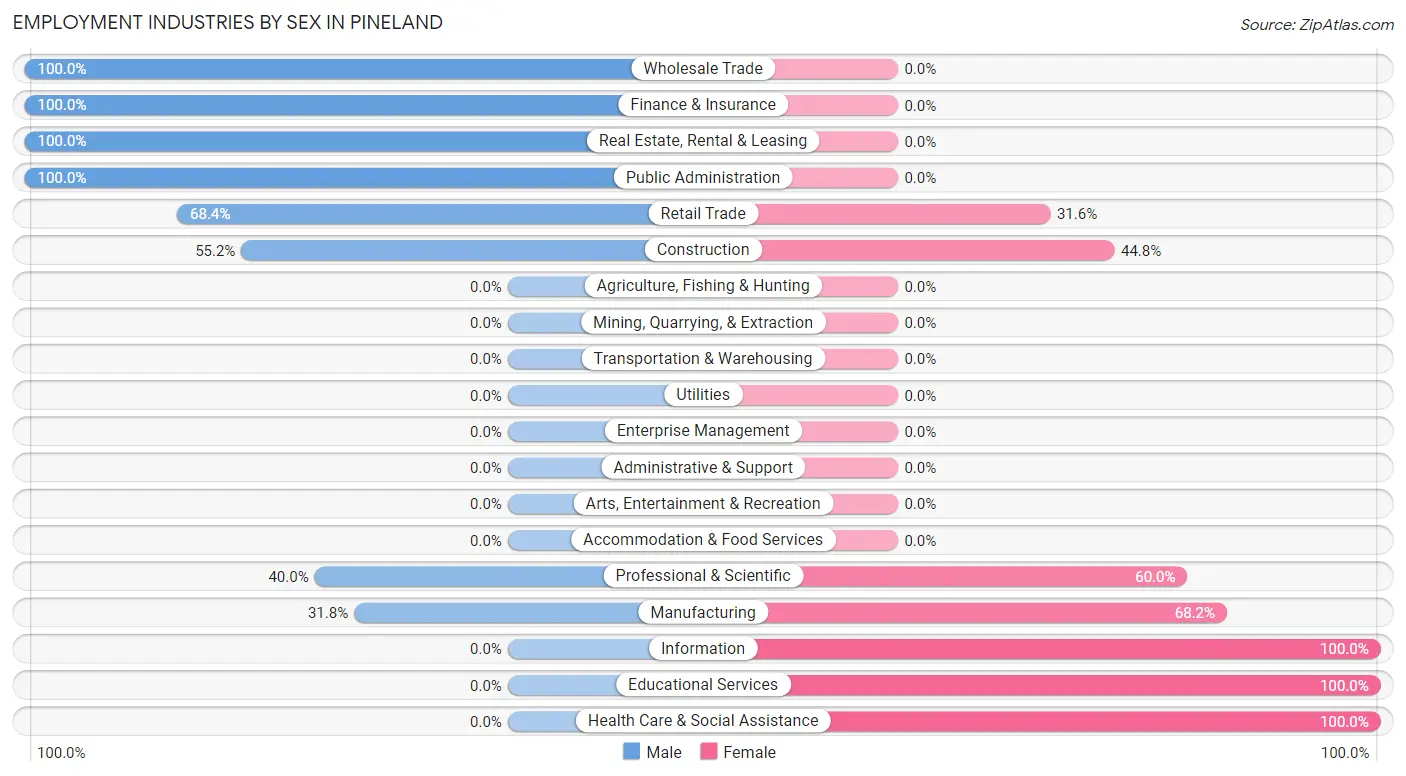
Employment Industries by Sex in Pineland
The Pineland industries that see more men than women are Wholesale Trade (100.0%), Finance & Insurance (100.0%), and Real Estate, Rental & Leasing (100.0%), whereas the industries that tend to have a higher number of women are Information (100.0%), Educational Services (100.0%), and Health Care & Social Assistance (100.0%).
| Industry | Male | Female |
| Agriculture, Fishing & Hunting | 0 (0.0%) | 0 (0.0%) |
| Mining, Quarrying, & Extraction | 0 (0.0%) | 0 (0.0%) |
| Construction | 16 (55.2%) | 13 (44.8%) |
| Manufacturing | 7 (31.8%) | 15 (68.2%) |
| Wholesale Trade | 8 (100.0%) | 0 (0.0%) |
| Retail Trade | 13 (68.4%) | 6 (31.6%) |
| Transportation & Warehousing | 0 (0.0%) | 0 (0.0%) |
| Utilities | 0 (0.0%) | 0 (0.0%) |
| Information | 0 (0.0%) | 5 (100.0%) |
| Finance & Insurance | 5 (100.0%) | 0 (0.0%) |
| Real Estate, Rental & Leasing | 14 (100.0%) | 0 (0.0%) |
| Professional & Scientific | 12 (40.0%) | 18 (60.0%) |
| Enterprise Management | 0 (0.0%) | 0 (0.0%) |
| Administrative & Support | 0 (0.0%) | 0 (0.0%) |
| Educational Services | 0 (0.0%) | 10 (100.0%) |
| Health Care & Social Assistance | 0 (0.0%) | 16 (100.0%) |
| Arts, Entertainment & Recreation | 0 (0.0%) | 0 (0.0%) |
| Accommodation & Food Services | 0 (0.0%) | 0 (0.0%) |
| Public Administration | 12 (100.0%) | 0 (0.0%) |
| Total | 87 (49.7%) | 88 (50.3%) |
Education in Pineland
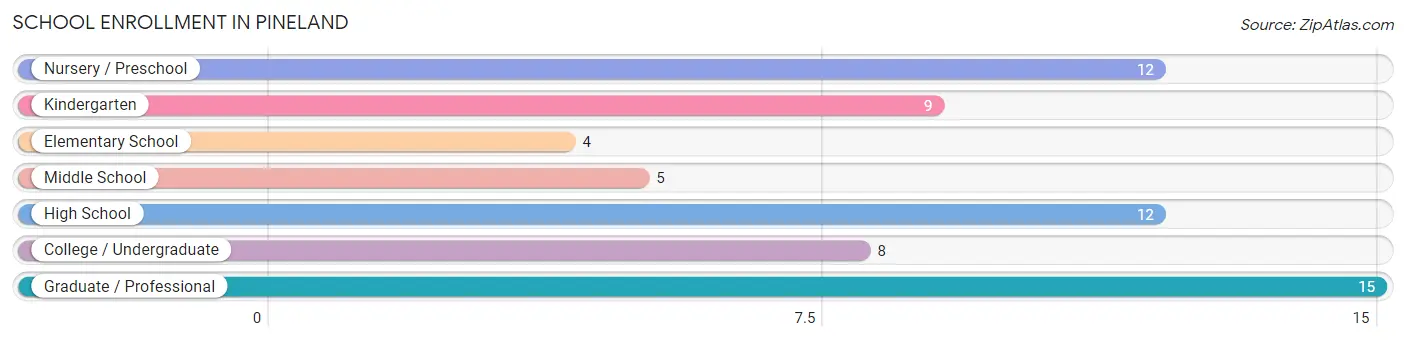
School Enrollment in Pineland
The most common levels of schooling among the 65 students in Pineland are graduate / professional (15 | 23.1%), nursery / preschool (12 | 18.5%), and high school (12 | 18.5%).
| School Level | # Students | % Students |
| Nursery / Preschool | 12 | 18.5% |
| Kindergarten | 9 | 13.9% |
| Elementary School | 4 | 6.1% |
| Middle School | 5 | 7.7% |
| High School | 12 | 18.5% |
| College / Undergraduate | 8 | 12.3% |
| Graduate / Professional | 15 | 23.1% |
| Total | 65 | 100.0% |
School Enrollment by Age by Funding Source in Pineland
Out of a total of 65 students who are enrolled in schools in Pineland, 15 (23.1%) attend a private institution, while the remaining 50 (76.9%) are enrolled in public schools. The age group of 35 years and over has the highest likelihood of being enrolled in private schools, with 15 (100.0% in the age bracket) enrolled. Conversely, the age group of 3 to 4 year olds has the lowest likelihood of being enrolled in a private school, with 12 (100.0% in the age bracket) attending a public institution.
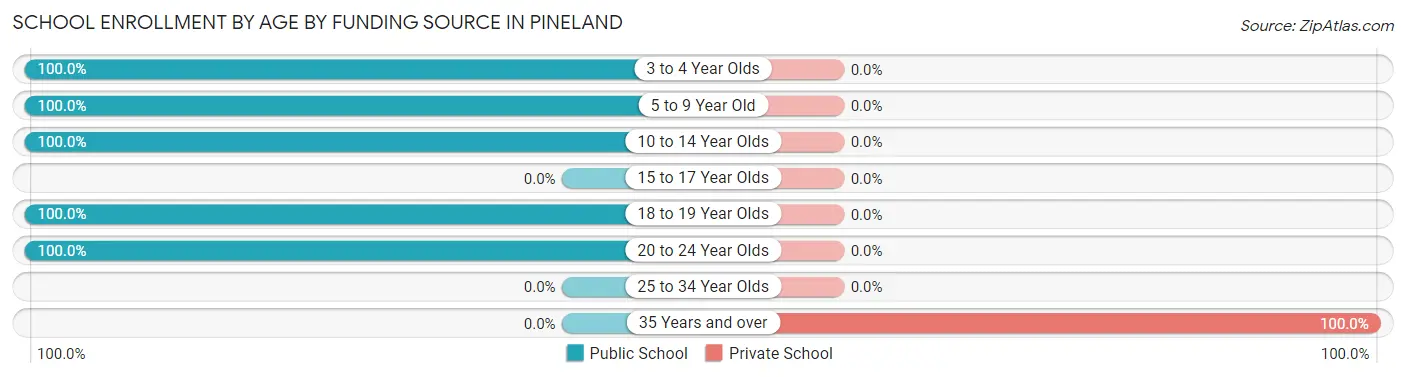
| Age Bracket | Public School | Private School |
| 3 to 4 Year Olds | 12 (100.0%) | 0 (0.0%) |
| 5 to 9 Year Old | 13 (100.0%) | 0 (0.0%) |
| 10 to 14 Year Olds | 5 (100.0%) | 0 (0.0%) |
| 15 to 17 Year Olds | 0 (0.0%) | 0 (0.0%) |
| 18 to 19 Year Olds | 12 (100.0%) | 0 (0.0%) |
| 20 to 24 Year Olds | 8 (100.0%) | 0 (0.0%) |
| 25 to 34 Year Olds | 0 (0.0%) | 0 (0.0%) |
| 35 Years and over | 0 (0.0%) | 15 (100.0%) |
| Total | 50 (76.9%) | 15 (23.1%) |
Educational Attainment by Field of Study in Pineland
Science & technology (37 | 21.4%), business (35 | 20.2%), education (22 | 12.7%), literature & languages (18 | 10.4%), and engineering (14 | 8.1%) are the most common fields of study among 173 individuals in Pineland who have obtained a bachelor's degree or higher.
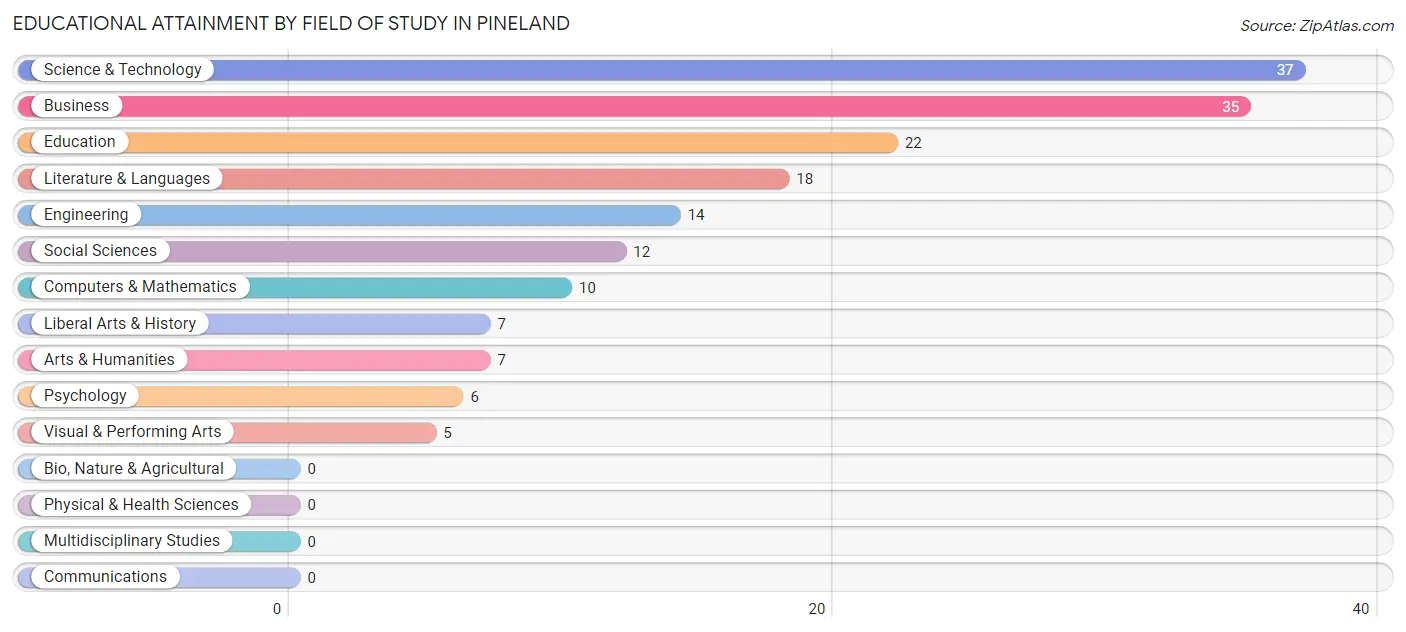
| Field of Study | # Graduates | % Graduates |
| Computers & Mathematics | 10 | 5.8% |
| Bio, Nature & Agricultural | 0 | 0.0% |
| Physical & Health Sciences | 0 | 0.0% |
| Psychology | 6 | 3.5% |
| Social Sciences | 12 | 6.9% |
| Engineering | 14 | 8.1% |
| Multidisciplinary Studies | 0 | 0.0% |
| Science & Technology | 37 | 21.4% |
| Business | 35 | 20.2% |
| Education | 22 | 12.7% |
| Literature & Languages | 18 | 10.4% |
| Liberal Arts & History | 7 | 4.1% |
| Visual & Performing Arts | 5 | 2.9% |
| Communications | 0 | 0.0% |
| Arts & Humanities | 7 | 4.1% |
| Total | 173 | 100.0% |
Transportation & Commute in Pineland
Vehicle Availability by Sex in Pineland
The most prevalent vehicle ownership categories in Pineland are males with 1 vehicle (35, accounting for 40.2%) and females with 1 vehicle (14, making up 39.8%).
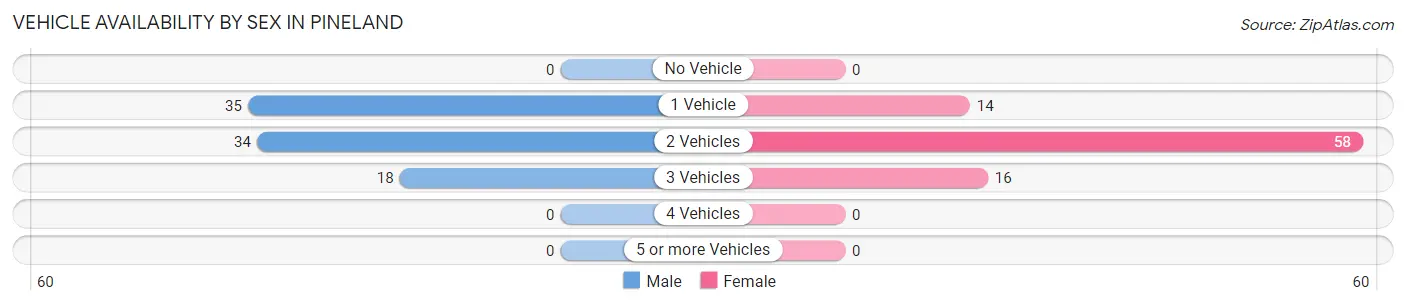
| Vehicles Available | Male | Female |
| No Vehicle | 0 (0.0%) | 0 (0.0%) |
| 1 Vehicle | 35 (40.2%) | 14 (15.9%) |
| 2 Vehicles | 34 (39.1%) | 58 (65.9%) |
| 3 Vehicles | 18 (20.7%) | 16 (18.2%) |
| 4 Vehicles | 0 (0.0%) | 0 (0.0%) |
| 5 or more Vehicles | 0 (0.0%) | 0 (0.0%) |
| Total | 87 (100.0%) | 88 (100.0%) |
Commute Time in Pineland
The most frequently occuring commute durations in Pineland are 45 to 59 minutes (28 commuters, 22.4%), 5 to 9 minutes (17 commuters, 13.6%), and 30 to 34 minutes (17 commuters, 13.6%).
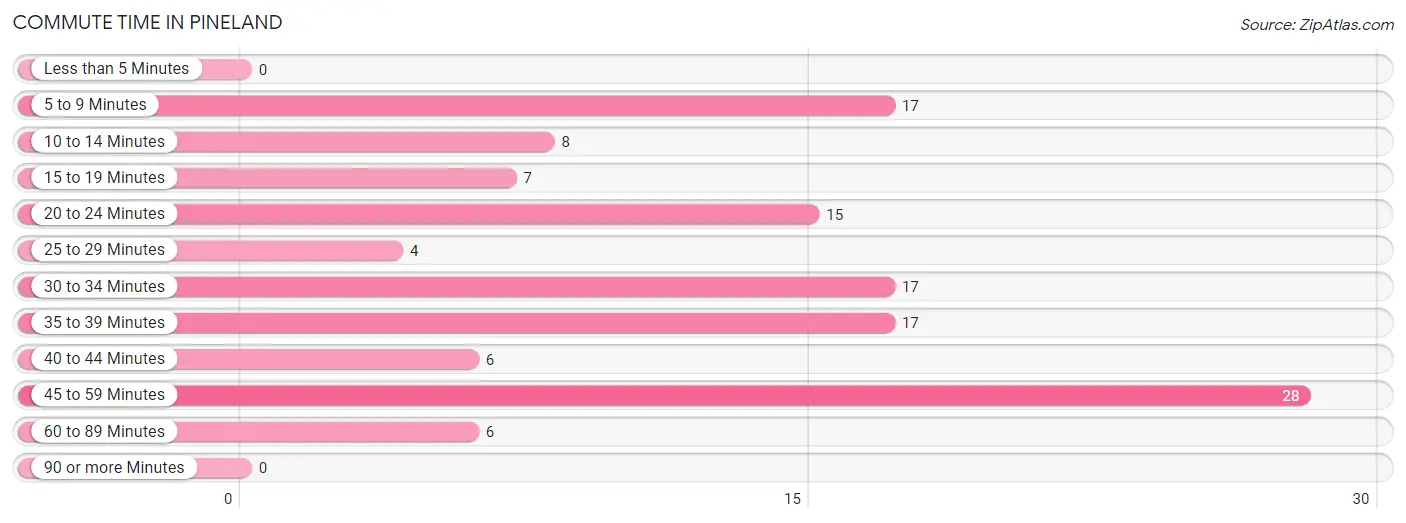
| Commute Time | # Commuters | % Commuters |
| Less than 5 Minutes | 0 | 0.0% |
| 5 to 9 Minutes | 17 | 13.6% |
| 10 to 14 Minutes | 8 | 6.4% |
| 15 to 19 Minutes | 7 | 5.6% |
| 20 to 24 Minutes | 15 | 12.0% |
| 25 to 29 Minutes | 4 | 3.2% |
| 30 to 34 Minutes | 17 | 13.6% |
| 35 to 39 Minutes | 17 | 13.6% |
| 40 to 44 Minutes | 6 | 4.8% |
| 45 to 59 Minutes | 28 | 22.4% |
| 60 to 89 Minutes | 6 | 4.8% |
| 90 or more Minutes | 0 | 0.0% |
Commute Time by Sex in Pineland
The most common commute times in Pineland are 30 to 34 minutes (17 commuters, 25.8%) for males and 45 to 59 minutes (24 commuters, 40.7%) for females.
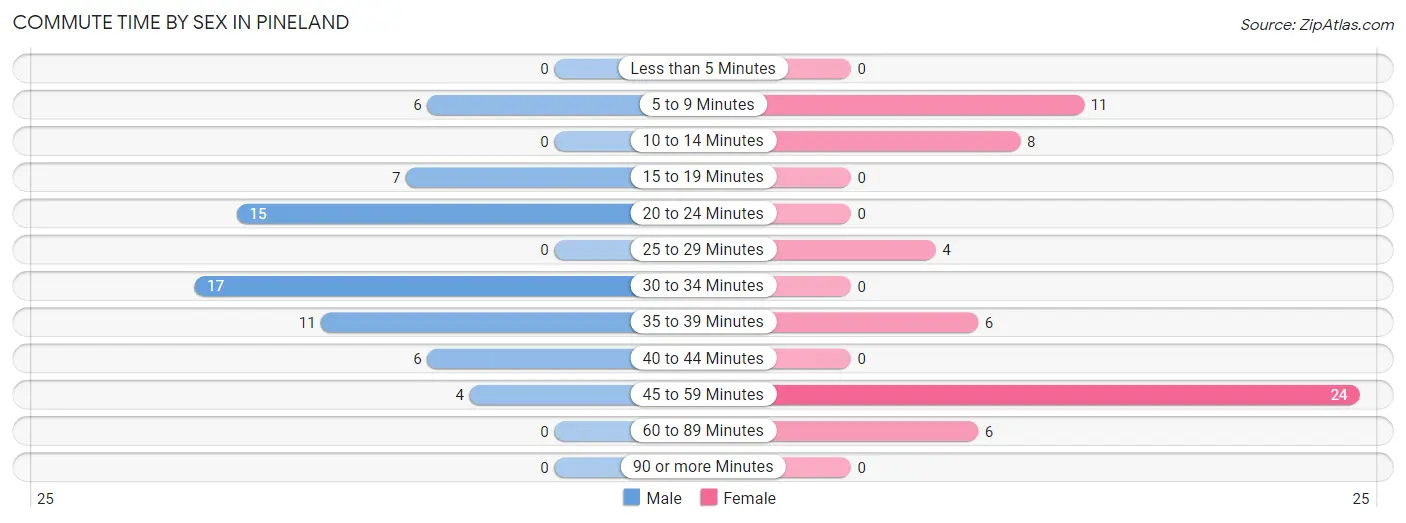
| Commute Time | Male | Female |
| Less than 5 Minutes | 0 (0.0%) | 0 (0.0%) |
| 5 to 9 Minutes | 6 (9.1%) | 11 (18.6%) |
| 10 to 14 Minutes | 0 (0.0%) | 8 (13.6%) |
| 15 to 19 Minutes | 7 (10.6%) | 0 (0.0%) |
| 20 to 24 Minutes | 15 (22.7%) | 0 (0.0%) |
| 25 to 29 Minutes | 0 (0.0%) | 4 (6.8%) |
| 30 to 34 Minutes | 17 (25.8%) | 0 (0.0%) |
| 35 to 39 Minutes | 11 (16.7%) | 6 (10.2%) |
| 40 to 44 Minutes | 6 (9.1%) | 0 (0.0%) |
| 45 to 59 Minutes | 4 (6.1%) | 24 (40.7%) |
| 60 to 89 Minutes | 0 (0.0%) | 6 (10.2%) |
| 90 or more Minutes | 0 (0.0%) | 0 (0.0%) |
Time of Departure to Work by Sex in Pineland
The most frequent times of departure to work in Pineland are 9:00 AM to 9:59 AM (38, 57.6%) for males and 7:30 AM to 7:59 AM (20, 33.9%) for females.
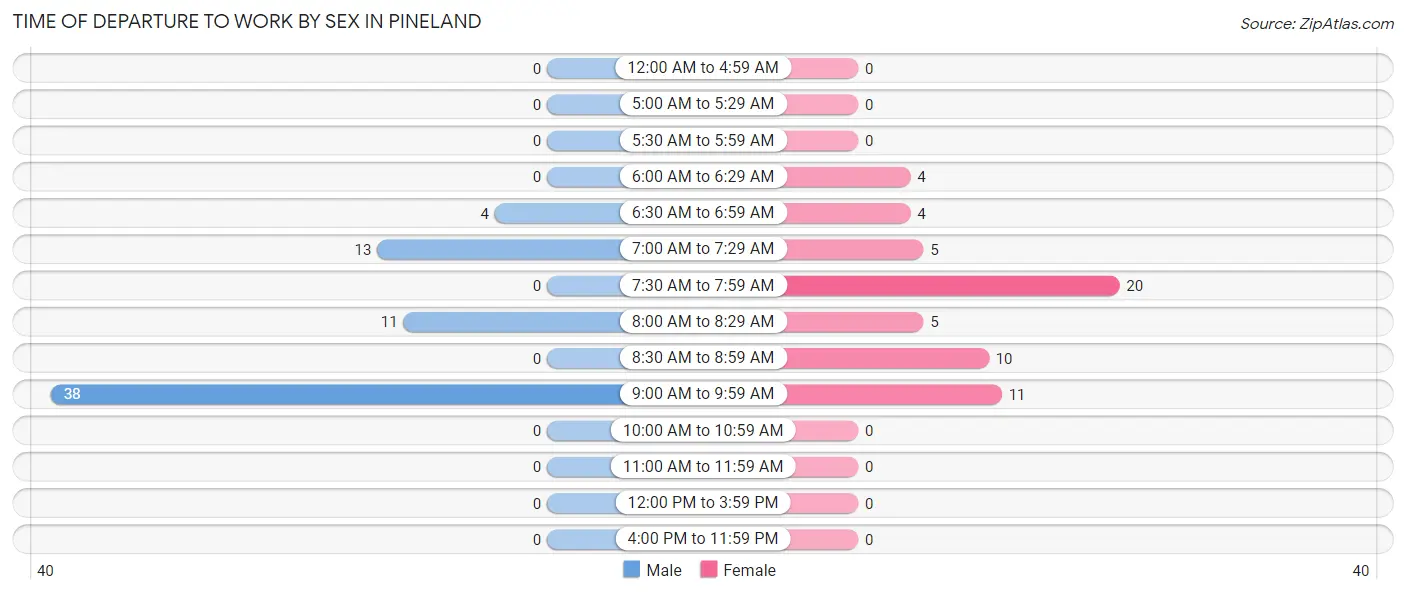
| Time of Departure | Male | Female |
| 12:00 AM to 4:59 AM | 0 (0.0%) | 0 (0.0%) |
| 5:00 AM to 5:29 AM | 0 (0.0%) | 0 (0.0%) |
| 5:30 AM to 5:59 AM | 0 (0.0%) | 0 (0.0%) |
| 6:00 AM to 6:29 AM | 0 (0.0%) | 4 (6.8%) |
| 6:30 AM to 6:59 AM | 4 (6.1%) | 4 (6.8%) |
| 7:00 AM to 7:29 AM | 13 (19.7%) | 5 (8.5%) |
| 7:30 AM to 7:59 AM | 0 (0.0%) | 20 (33.9%) |
| 8:00 AM to 8:29 AM | 11 (16.7%) | 5 (8.5%) |
| 8:30 AM to 8:59 AM | 0 (0.0%) | 10 (17.0%) |
| 9:00 AM to 9:59 AM | 38 (57.6%) | 11 (18.6%) |
| 10:00 AM to 10:59 AM | 0 (0.0%) | 0 (0.0%) |
| 11:00 AM to 11:59 AM | 0 (0.0%) | 0 (0.0%) |
| 12:00 PM to 3:59 PM | 0 (0.0%) | 0 (0.0%) |
| 4:00 PM to 11:59 PM | 0 (0.0%) | 0 (0.0%) |
| Total | 66 (100.0%) | 59 (100.0%) |
Housing Occupancy in Pineland
Occupancy by Ownership in Pineland
Of the total 177 dwellings in Pineland, owner-occupied units account for 177 (100.0%), while renter-occupied units make up 0 (0.0%).
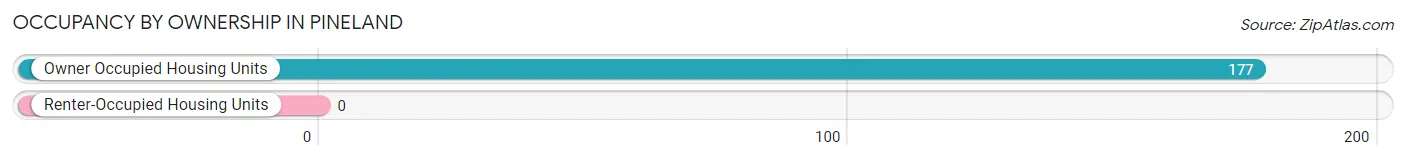
| Occupancy | # Housing Units | % Housing Units |
| Owner Occupied Housing Units | 177 | 100.0% |
| Renter-Occupied Housing Units | 0 | 0.0% |
| Total Occupied Housing Units | 177 | 100.0% |
Occupancy by Household Size in Pineland
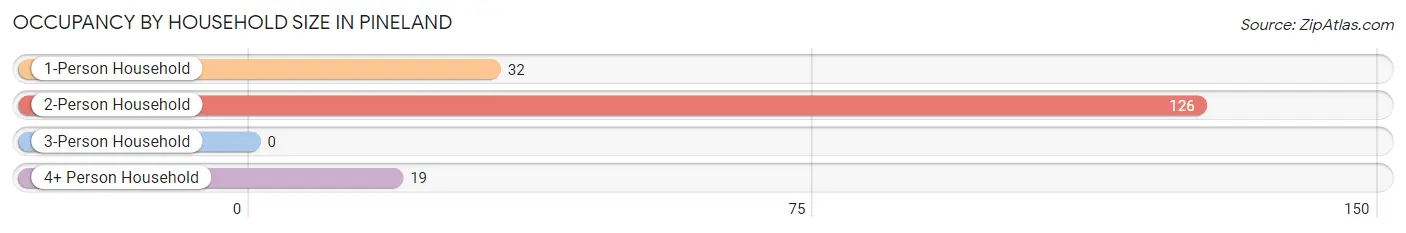
| Household Size | # Housing Units | % Housing Units |
| 1-Person Household | 32 | 18.1% |
| 2-Person Household | 126 | 71.2% |
| 3-Person Household | 0 | 0.0% |
| 4+ Person Household | 19 | 10.7% |
| Total Housing Units | 177 | 100.0% |
Occupancy by Ownership by Household Size in Pineland
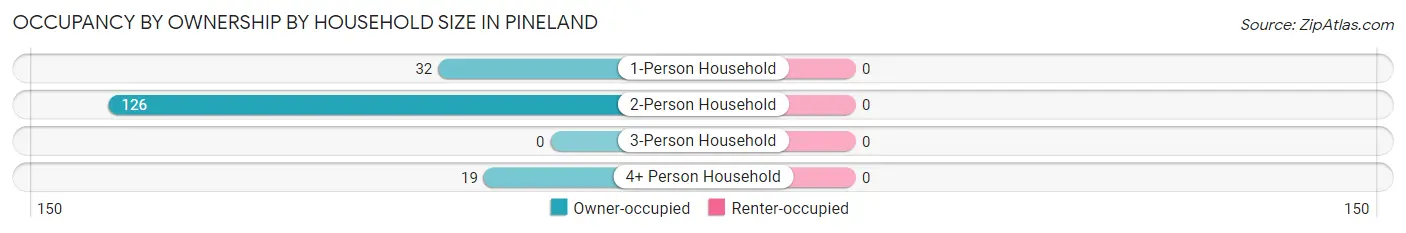
| Household Size | Owner-occupied | Renter-occupied |
| 1-Person Household | 32 (100.0%) | 0 (0.0%) |
| 2-Person Household | 126 (100.0%) | 0 (0.0%) |
| 3-Person Household | 0 (0.0%) | 0 (0.0%) |
| 4+ Person Household | 19 (100.0%) | 0 (0.0%) |
| Total Housing Units | 177 (100.0%) | 0 (0.0%) |
Occupancy by Educational Attainment in Pineland
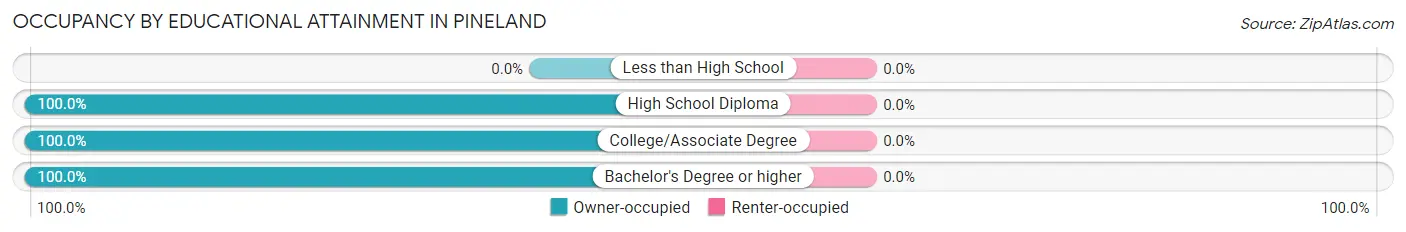
| Household Size | Owner-occupied | Renter-occupied |
| Less than High School | 0 (0.0%) | 0 (0.0%) |
| High School Diploma | 29 (100.0%) | 0 (0.0%) |
| College/Associate Degree | 46 (100.0%) | 0 (0.0%) |
| Bachelor's Degree or higher | 102 (100.0%) | 0 (0.0%) |
Occupancy by Age of Householder in Pineland
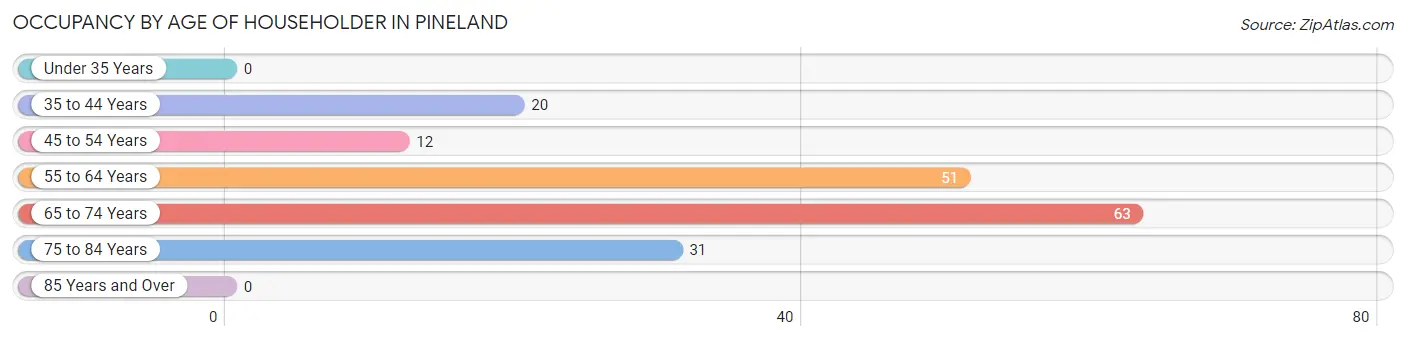
| Age Bracket | # Households | % Households |
| Under 35 Years | 0 | 0.0% |
| 35 to 44 Years | 20 | 11.3% |
| 45 to 54 Years | 12 | 6.8% |
| 55 to 64 Years | 51 | 28.8% |
| 65 to 74 Years | 63 | 35.6% |
| 75 to 84 Years | 31 | 17.5% |
| 85 Years and Over | 0 | 0.0% |
| Total | 177 | 100.0% |
Housing Finances in Pineland
Median Income by Occupancy in Pineland
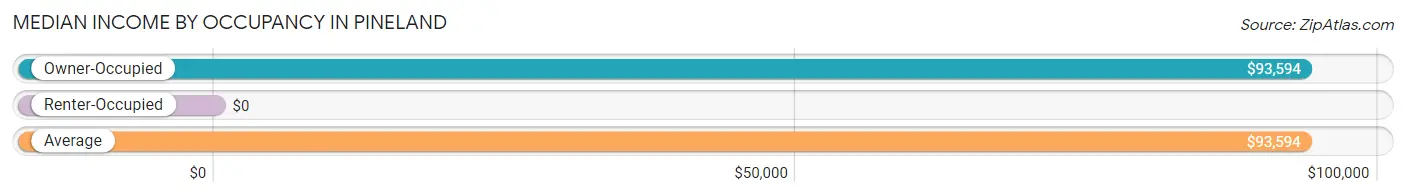
| Occupancy Type | # Households | Median Income |
| Owner-Occupied | 177 (100.0%) | $93,594 |
| Renter-Occupied | 0 (0.0%) | $0 |
| Average | 177 (100.0%) | $93,594 |
Occupancy by Householder Income Bracket in Pineland
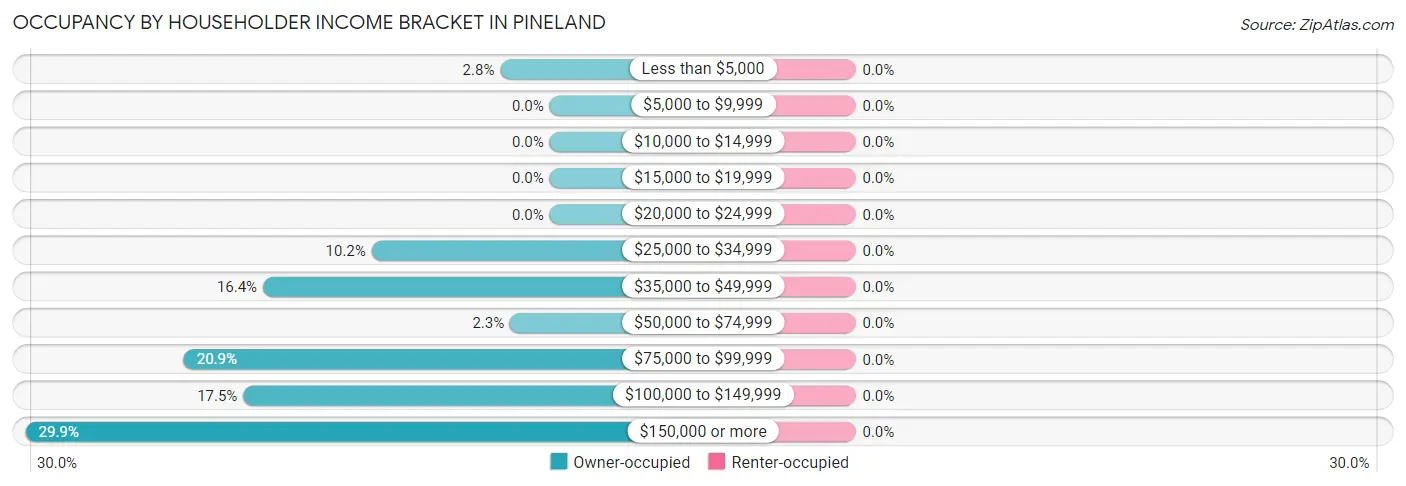
| Income Bracket | Owner-occupied | Renter-occupied |
| Less than $5,000 | 5 (2.8%) | 0 (0.0%) |
| $5,000 to $9,999 | 0 (0.0%) | 0 (0.0%) |
| $10,000 to $14,999 | 0 (0.0%) | 0 (0.0%) |
| $15,000 to $19,999 | 0 (0.0%) | 0 (0.0%) |
| $20,000 to $24,999 | 0 (0.0%) | 0 (0.0%) |
| $25,000 to $34,999 | 18 (10.2%) | 0 (0.0%) |
| $35,000 to $49,999 | 29 (16.4%) | 0 (0.0%) |
| $50,000 to $74,999 | 4 (2.3%) | 0 (0.0%) |
| $75,000 to $99,999 | 37 (20.9%) | 0 (0.0%) |
| $100,000 to $149,999 | 31 (17.5%) | 0 (0.0%) |
| $150,000 or more | 53 (29.9%) | 0 (0.0%) |
| Total | 177 (100.0%) | 0 (0.0%) |
Monthly Housing Cost Tiers in Pineland
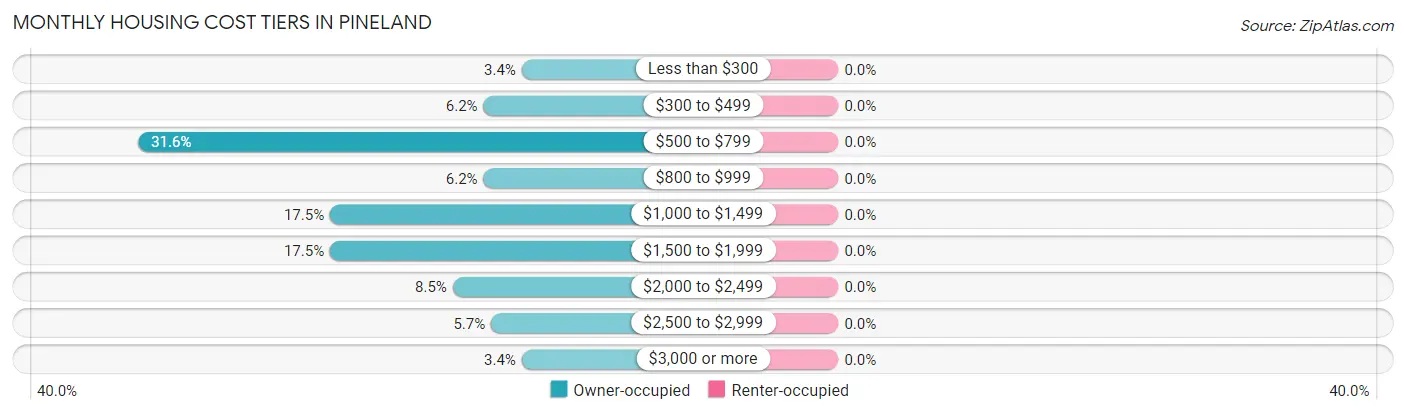
| Monthly Cost | Owner-occupied | Renter-occupied |
| Less than $300 | 6 (3.4%) | 0 (0.0%) |
| $300 to $499 | 11 (6.2%) | 0 (0.0%) |
| $500 to $799 | 56 (31.6%) | 0 (0.0%) |
| $800 to $999 | 11 (6.2%) | 0 (0.0%) |
| $1,000 to $1,499 | 31 (17.5%) | 0 (0.0%) |
| $1,500 to $1,999 | 31 (17.5%) | 0 (0.0%) |
| $2,000 to $2,499 | 15 (8.5%) | 0 (0.0%) |
| $2,500 to $2,999 | 10 (5.7%) | 0 (0.0%) |
| $3,000 or more | 6 (3.4%) | 0 (0.0%) |
| Total | 177 (100.0%) | 0 (0.0%) |
Physical Housing Characteristics in Pineland
Housing Structures in Pineland
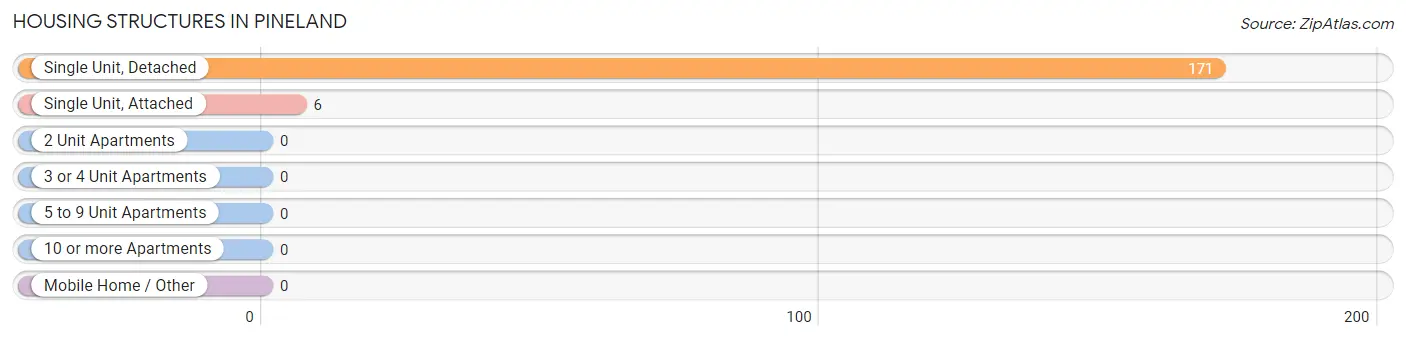
| Structure Type | # Housing Units | % Housing Units |
| Single Unit, Detached | 171 | 96.6% |
| Single Unit, Attached | 6 | 3.4% |
| 2 Unit Apartments | 0 | 0.0% |
| 3 or 4 Unit Apartments | 0 | 0.0% |
| 5 to 9 Unit Apartments | 0 | 0.0% |
| 10 or more Apartments | 0 | 0.0% |
| Mobile Home / Other | 0 | 0.0% |
| Total | 177 | 100.0% |
Housing Structures by Occupancy in Pineland
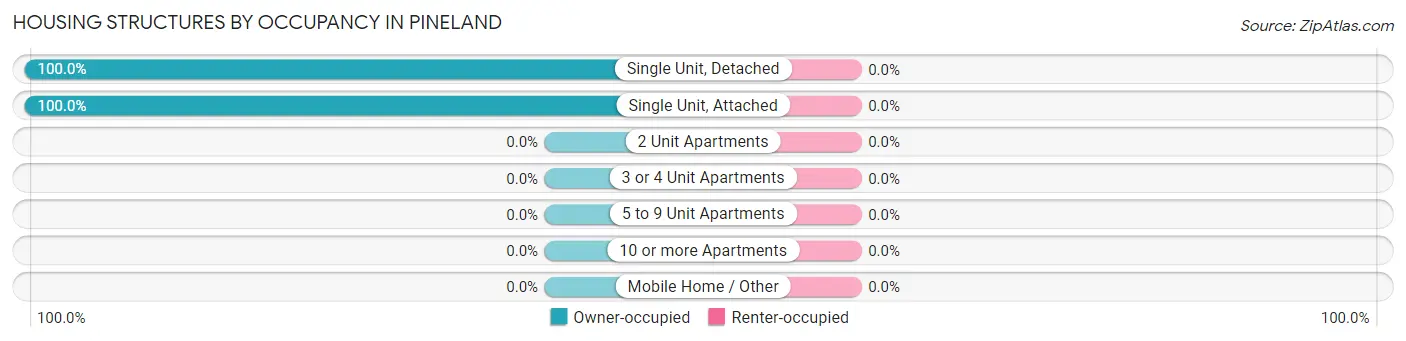
| Structure Type | Owner-occupied | Renter-occupied |
| Single Unit, Detached | 171 (100.0%) | 0 (0.0%) |
| Single Unit, Attached | 6 (100.0%) | 0 (0.0%) |
| 2 Unit Apartments | 0 (0.0%) | 0 (0.0%) |
| 3 or 4 Unit Apartments | 0 (0.0%) | 0 (0.0%) |
| 5 to 9 Unit Apartments | 0 (0.0%) | 0 (0.0%) |
| 10 or more Apartments | 0 (0.0%) | 0 (0.0%) |
| Mobile Home / Other | 0 (0.0%) | 0 (0.0%) |
| Total | 177 (100.0%) | 0 (0.0%) |
Housing Structures by Number of Rooms in Pineland
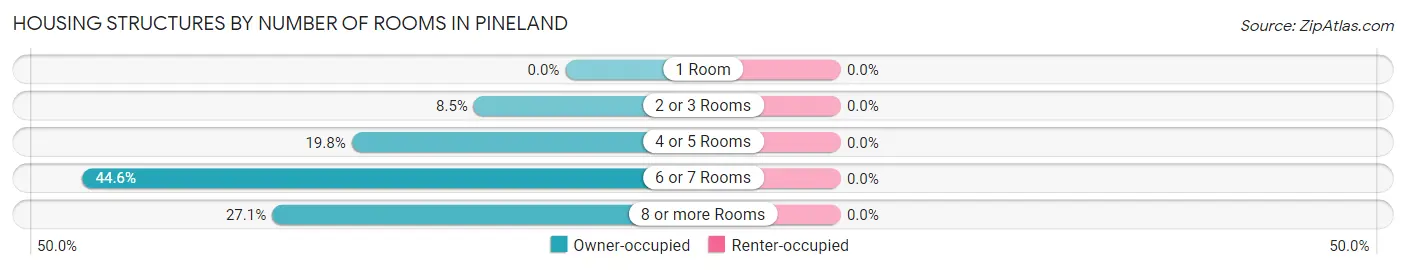
| Number of Rooms | Owner-occupied | Renter-occupied |
| 1 Room | 0 (0.0%) | 0 (0.0%) |
| 2 or 3 Rooms | 15 (8.5%) | 0 (0.0%) |
| 4 or 5 Rooms | 35 (19.8%) | 0 (0.0%) |
| 6 or 7 Rooms | 79 (44.6%) | 0 (0.0%) |
| 8 or more Rooms | 48 (27.1%) | 0 (0.0%) |
| Total | 177 (100.0%) | 0 (0.0%) |
Housing Structure by Heating Type in Pineland
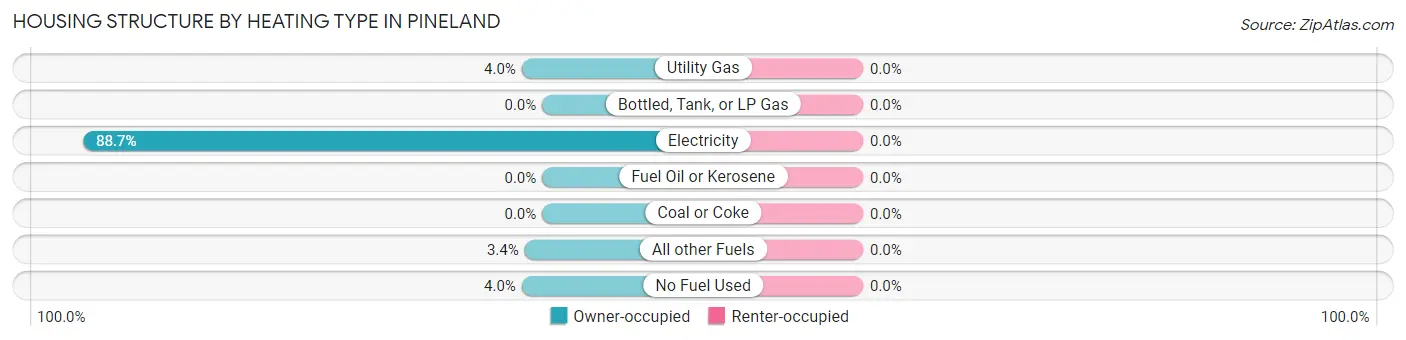
| Heating Type | Owner-occupied | Renter-occupied |
| Utility Gas | 7 (4.0%) | 0 (0.0%) |
| Bottled, Tank, or LP Gas | 0 (0.0%) | 0 (0.0%) |
| Electricity | 157 (88.7%) | 0 (0.0%) |
| Fuel Oil or Kerosene | 0 (0.0%) | 0 (0.0%) |
| Coal or Coke | 0 (0.0%) | 0 (0.0%) |
| All other Fuels | 6 (3.4%) | 0 (0.0%) |
| No Fuel Used | 7 (4.0%) | 0 (0.0%) |
| Total | 177 (100.0%) | 0 (0.0%) |
Household Vehicle Usage in Pineland
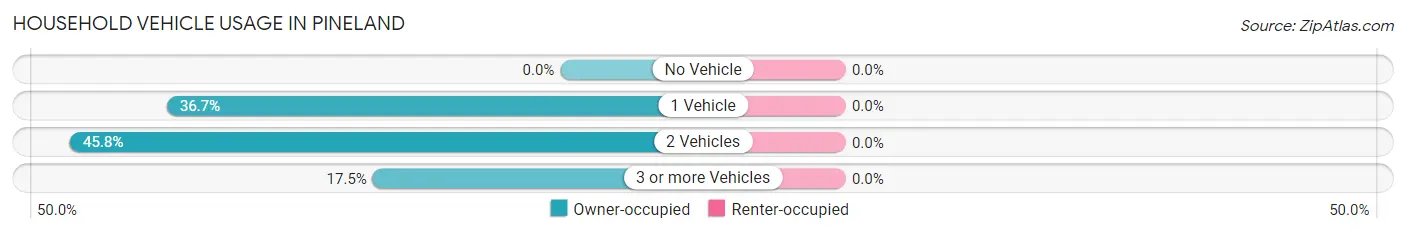
| Vehicles per Household | Owner-occupied | Renter-occupied |
| No Vehicle | 0 (0.0%) | 0 (0.0%) |
| 1 Vehicle | 65 (36.7%) | 0 (0.0%) |
| 2 Vehicles | 81 (45.8%) | 0 (0.0%) |
| 3 or more Vehicles | 31 (17.5%) | 0 (0.0%) |
| Total | 177 (100.0%) | 0 (0.0%) |
Real Estate & Mortgages in Pineland
Real Estate and Mortgage Overview in Pineland
| Characteristic | Without Mortgage | With Mortgage |
| Housing Units | 102 | 75 |
| Median Property Value | $416,700 | $398,500 |
| Median Household Income | $102,500 | $15 |
| Monthly Housing Costs | $721 | $6 |
| Real Estate Taxes | $4,133 | $0 |
Property Value by Mortgage Status in Pineland
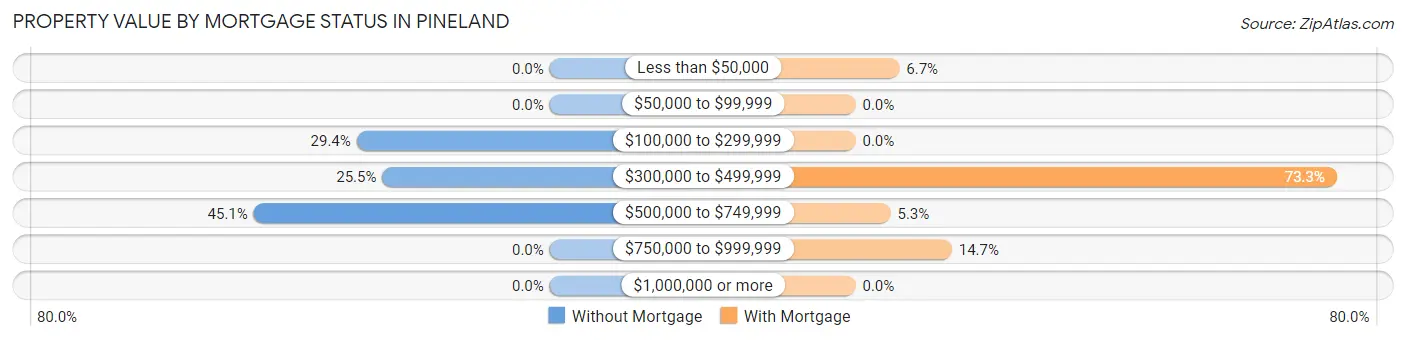
| Property Value | Without Mortgage | With Mortgage |
| Less than $50,000 | 0 (0.0%) | 5 (6.7%) |
| $50,000 to $99,999 | 0 (0.0%) | 0 (0.0%) |
| $100,000 to $299,999 | 30 (29.4%) | 0 (0.0%) |
| $300,000 to $499,999 | 26 (25.5%) | 55 (73.3%) |
| $500,000 to $749,999 | 46 (45.1%) | 4 (5.3%) |
| $750,000 to $999,999 | 0 (0.0%) | 11 (14.7%) |
| $1,000,000 or more | 0 (0.0%) | 0 (0.0%) |
| Total | 102 (100.0%) | 75 (100.0%) |
Household Income by Mortgage Status in Pineland
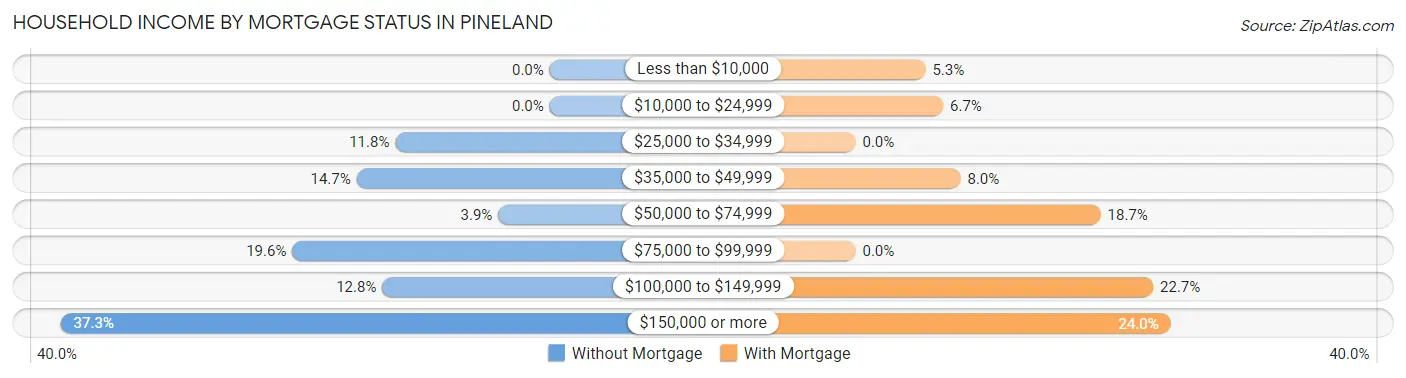
| Household Income | Without Mortgage | With Mortgage |
| Less than $10,000 | 0 (0.0%) | 4 (5.3%) |
| $10,000 to $24,999 | 0 (0.0%) | 5 (6.7%) |
| $25,000 to $34,999 | 12 (11.8%) | 0 (0.0%) |
| $35,000 to $49,999 | 15 (14.7%) | 6 (8.0%) |
| $50,000 to $74,999 | 4 (3.9%) | 14 (18.7%) |
| $75,000 to $99,999 | 20 (19.6%) | 0 (0.0%) |
| $100,000 to $149,999 | 13 (12.8%) | 17 (22.7%) |
| $150,000 or more | 38 (37.2%) | 18 (24.0%) |
| Total | 102 (100.0%) | 75 (100.0%) |
Property Value to Household Income Ratio in Pineland
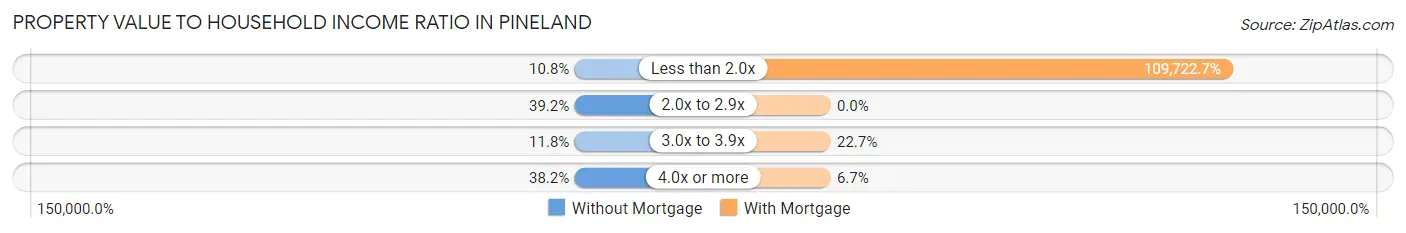
| Value-to-Income Ratio | Without Mortgage | With Mortgage |
| Less than 2.0x | 11 (10.8%) | 82,292 (109,722.7%) |
| 2.0x to 2.9x | 40 (39.2%) | 0 (0.0%) |
| 3.0x to 3.9x | 12 (11.8%) | 17 (22.7%) |
| 4.0x or more | 39 (38.2%) | 5 (6.7%) |
| Total | 102 (100.0%) | 75 (100.0%) |
Real Estate Taxes by Mortgage Status in Pineland
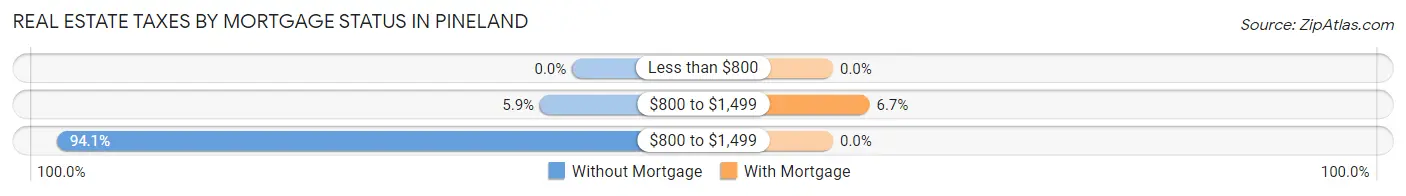
| Property Taxes | Without Mortgage | With Mortgage |
| Less than $800 | 0 (0.0%) | 0 (0.0%) |
| $800 to $1,499 | 6 (5.9%) | 5 (6.7%) |
| $800 to $1,499 | 96 (94.1%) | 0 (0.0%) |
| Total | 102 (100.0%) | 75 (100.0%) |
Health & Disability in Pineland
Health Insurance Coverage by Age in Pineland
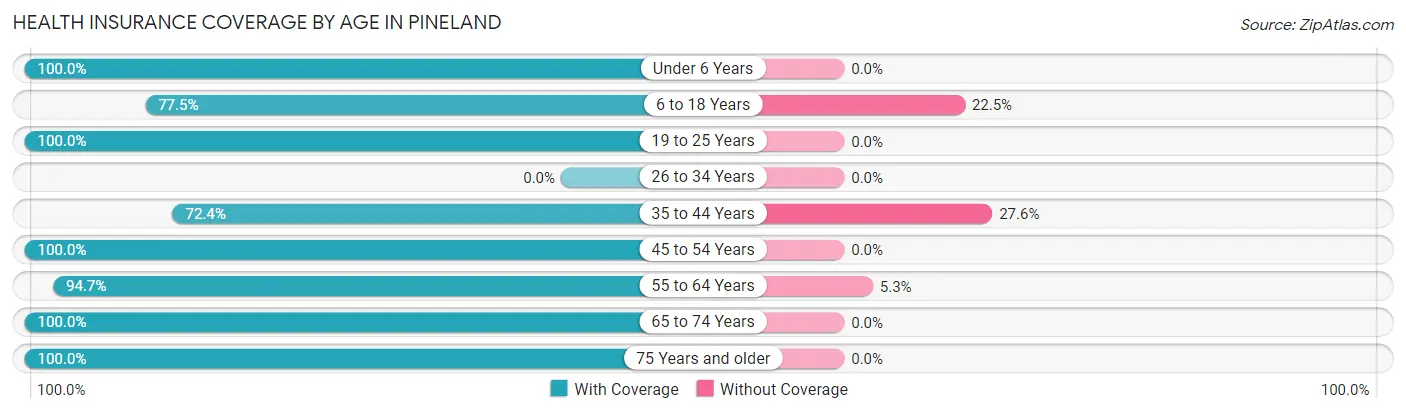
| Age Bracket | With Coverage | Without Coverage |
| Under 6 Years | 12 (100.0%) | 0 (0.0%) |
| 6 to 18 Years | 31 (77.5%) | 9 (22.5%) |
| 19 to 25 Years | 8 (100.0%) | 0 (0.0%) |
| 26 to 34 Years | 0 (0.0%) | 0 (0.0%) |
| 35 to 44 Years | 21 (72.4%) | 8 (27.6%) |
| 45 to 54 Years | 41 (100.0%) | 0 (0.0%) |
| 55 to 64 Years | 89 (94.7%) | 5 (5.3%) |
| 65 to 74 Years | 100 (100.0%) | 0 (0.0%) |
| 75 Years and older | 55 (100.0%) | 0 (0.0%) |
| Total | 357 (94.2%) | 22 (5.8%) |
Health Insurance Coverage by Citizenship Status in Pineland
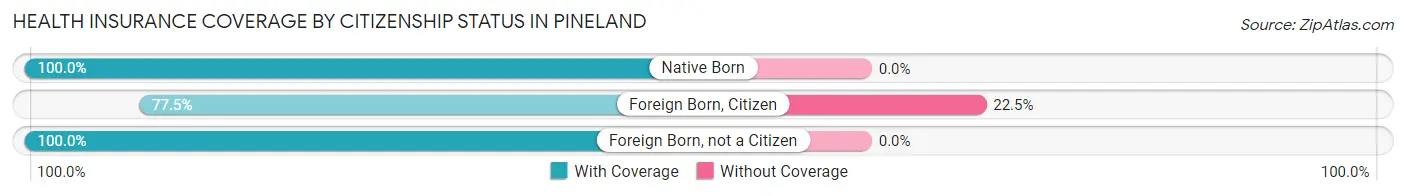
| Citizenship Status | With Coverage | Without Coverage |
| Native Born | 12 (100.0%) | 0 (0.0%) |
| Foreign Born, Citizen | 31 (77.5%) | 9 (22.5%) |
| Foreign Born, not a Citizen | 8 (100.0%) | 0 (0.0%) |
Health Insurance Coverage by Household Income in Pineland
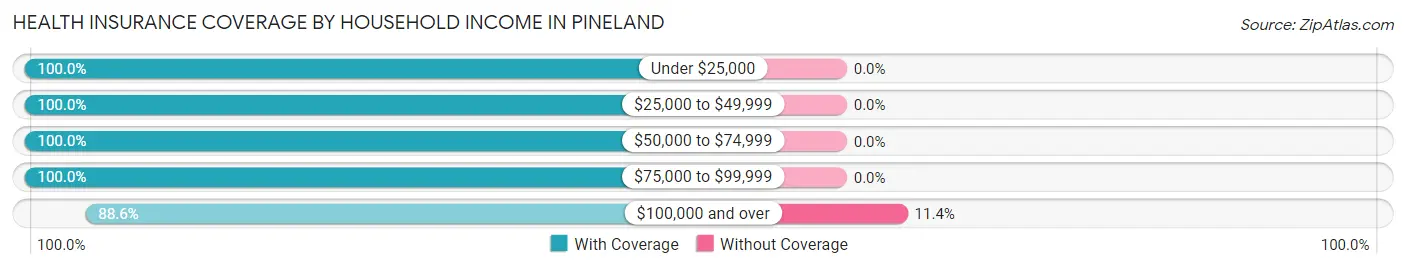
| Household Income | With Coverage | Without Coverage |
| Under $25,000 | 5 (100.0%) | 0 (0.0%) |
| $25,000 to $49,999 | 106 (100.0%) | 0 (0.0%) |
| $50,000 to $74,999 | 8 (100.0%) | 0 (0.0%) |
| $75,000 to $99,999 | 67 (100.0%) | 0 (0.0%) |
| $100,000 and over | 171 (88.6%) | 22 (11.4%) |
Public vs Private Health Insurance Coverage by Age in Pineland

| Age Bracket | Public Insurance | Private Insurance |
| Under 6 | 0 (0.0%) | 12 (100.0%) |
| 6 to 18 Years | 0 (0.0%) | 31 (77.5%) |
| 19 to 25 Years | 0 (0.0%) | 8 (100.0%) |
| 25 to 34 Years | 0 (0.0%) | 0 (0.0%) |
| 35 to 44 Years | 0 (0.0%) | 21 (72.4%) |
| 45 to 54 Years | 0 (0.0%) | 41 (100.0%) |
| 55 to 64 Years | 0 (0.0%) | 89 (94.7%) |
| 65 to 74 Years | 100 (100.0%) | 58 (58.0%) |
| 75 Years and over | 55 (100.0%) | 31 (56.4%) |
| Total | 155 (40.9%) | 291 (76.8%) |
Disability Status by Sex by Age in Pineland
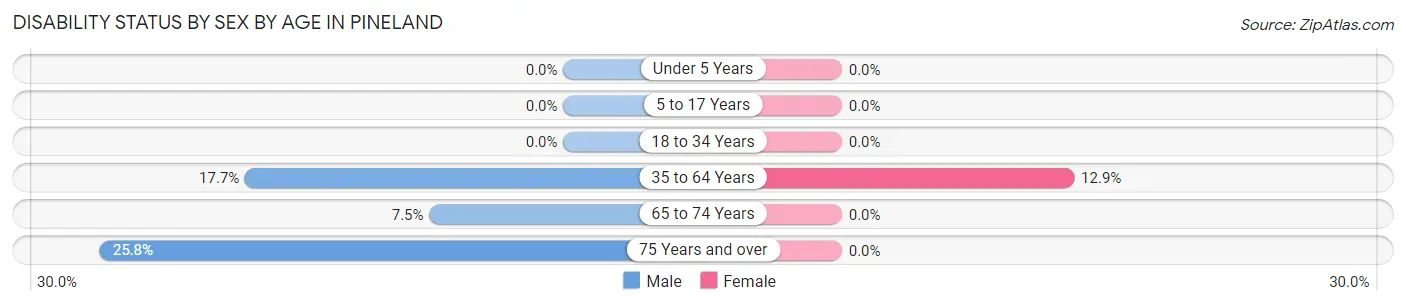
| Age Bracket | Male | Female |
| Under 5 Years | 0 (0.0%) | 0 (0.0%) |
| 5 to 17 Years | 0 (0.0%) | 0 (0.0%) |
| 18 to 34 Years | 0 (0.0%) | 0 (0.0%) |
| 35 to 64 Years | 14 (17.7%) | 11 (12.9%) |
| 65 to 74 Years | 5 (7.5%) | 0 (0.0%) |
| 75 Years and over | 8 (25.8%) | 0 (0.0%) |
Disability Class by Sex by Age in Pineland
Disability Class: Hearing Difficulty
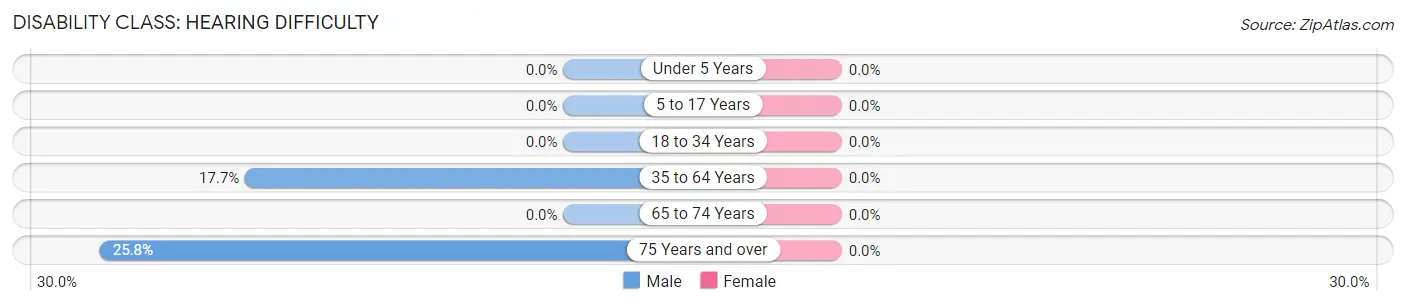
| Age Bracket | Male | Female |
| Under 5 Years | 0 (0.0%) | 0 (0.0%) |
| 5 to 17 Years | 0 (0.0%) | 0 (0.0%) |
| 18 to 34 Years | 0 (0.0%) | 0 (0.0%) |
| 35 to 64 Years | 14 (17.7%) | 0 (0.0%) |
| 65 to 74 Years | 0 (0.0%) | 0 (0.0%) |
| 75 Years and over | 8 (25.8%) | 0 (0.0%) |
Disability Class: Vision Difficulty
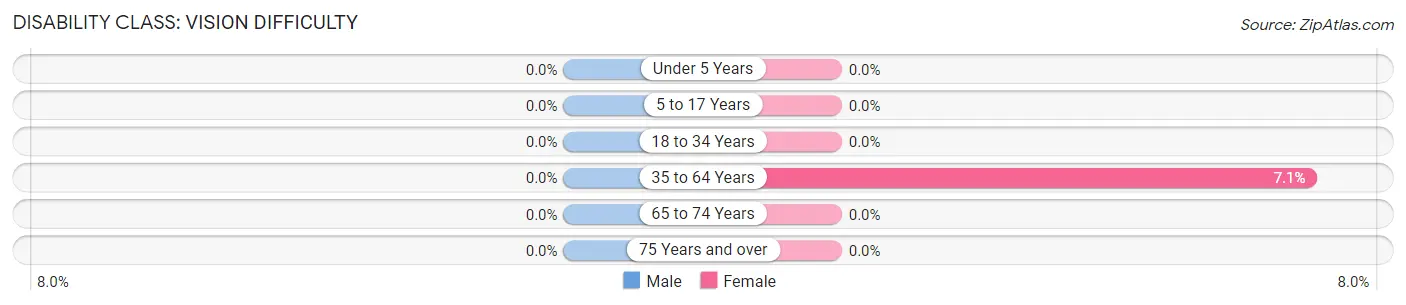
| Age Bracket | Male | Female |
| Under 5 Years | 0 (0.0%) | 0 (0.0%) |
| 5 to 17 Years | 0 (0.0%) | 0 (0.0%) |
| 18 to 34 Years | 0 (0.0%) | 0 (0.0%) |
| 35 to 64 Years | 0 (0.0%) | 6 (7.1%) |
| 65 to 74 Years | 0 (0.0%) | 0 (0.0%) |
| 75 Years and over | 0 (0.0%) | 0 (0.0%) |
Disability Class: Cognitive Difficulty
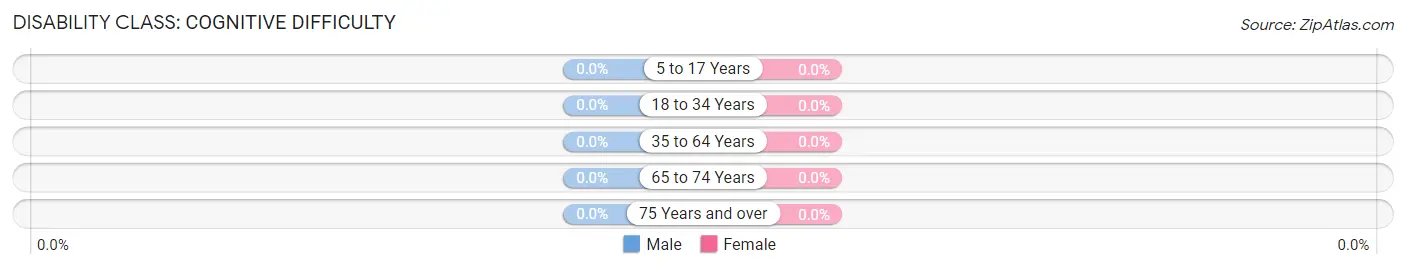
| Age Bracket | Male | Female |
| 5 to 17 Years | 0 (0.0%) | 0 (0.0%) |
| 18 to 34 Years | 0 (0.0%) | 0 (0.0%) |
| 35 to 64 Years | 0 (0.0%) | 0 (0.0%) |
| 65 to 74 Years | 0 (0.0%) | 0 (0.0%) |
| 75 Years and over | 0 (0.0%) | 0 (0.0%) |
Disability Class: Ambulatory Difficulty
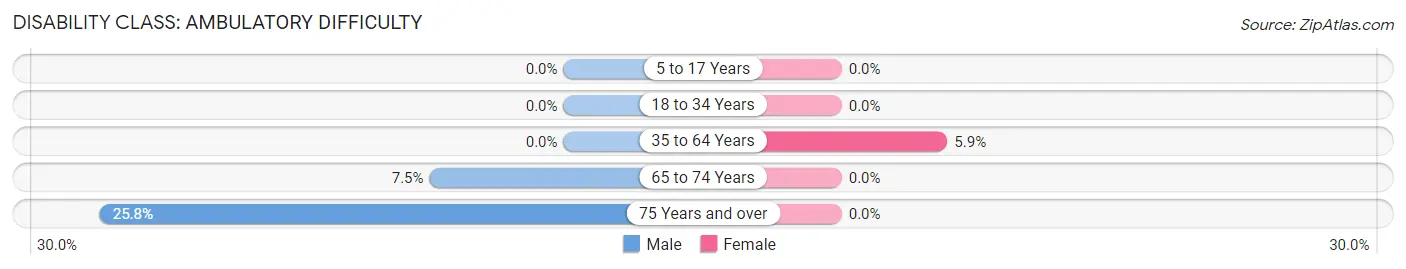
| Age Bracket | Male | Female |
| 5 to 17 Years | 0 (0.0%) | 0 (0.0%) |
| 18 to 34 Years | 0 (0.0%) | 0 (0.0%) |
| 35 to 64 Years | 0 (0.0%) | 5 (5.9%) |
| 65 to 74 Years | 5 (7.5%) | 0 (0.0%) |
| 75 Years and over | 8 (25.8%) | 0 (0.0%) |
Disability Class: Self-Care Difficulty
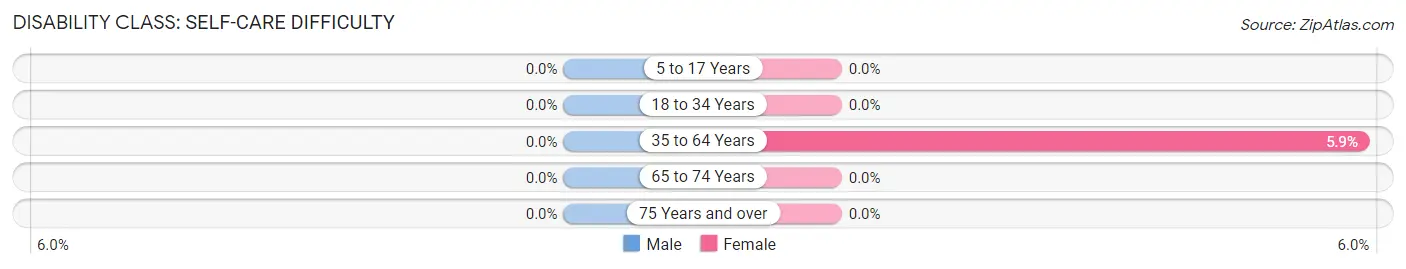
| Age Bracket | Male | Female |
| 5 to 17 Years | 0 (0.0%) | 0 (0.0%) |
| 18 to 34 Years | 0 (0.0%) | 0 (0.0%) |
| 35 to 64 Years | 0 (0.0%) | 5 (5.9%) |
| 65 to 74 Years | 0 (0.0%) | 0 (0.0%) |
| 75 Years and over | 0 (0.0%) | 0 (0.0%) |
Technology Access in Pineland
Computing Device Access in Pineland
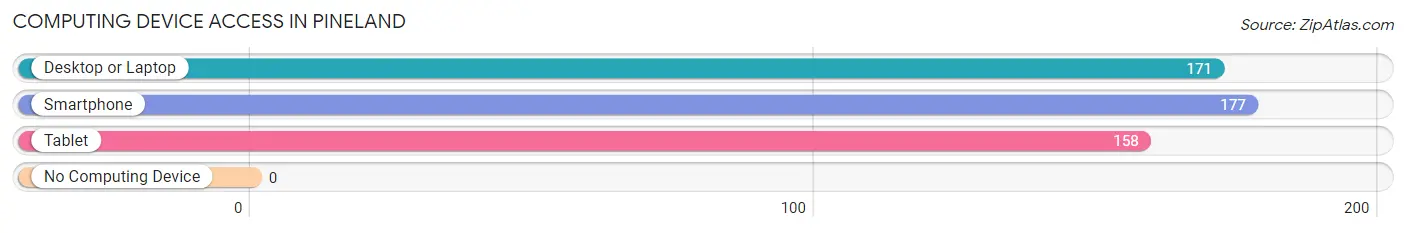
| Device Type | # Households | % Households |
| Desktop or Laptop | 171 | 96.6% |
| Smartphone | 177 | 100.0% |
| Tablet | 158 | 89.3% |
| No Computing Device | 0 | 0.0% |
| Total | 177 | 100.0% |
Internet Access in Pineland
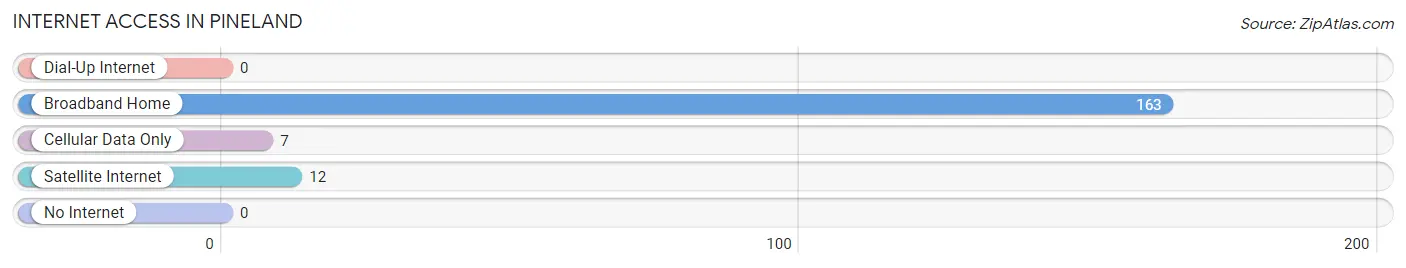
| Internet Type | # Households | % Households |
| Dial-Up Internet | 0 | 0.0% |
| Broadband Home | 163 | 92.1% |
| Cellular Data Only | 7 | 4.0% |
| Satellite Internet | 12 | 6.8% |
| No Internet | 0 | 0.0% |
| Total | 177 | 100.0% |
Pineland Summary
History
The history of Pineland, Florida dates back to the early 1800s when the area was inhabited by the Calusa Indians. The Calusa were a Native American tribe that lived in the area for centuries before the arrival of Europeans. The Calusa were known for their fishing and shellfish gathering, and they were also skilled hunters and traders. The Calusa were eventually displaced by the Seminole Indians, who moved into the area in the early 1800s.
The first European settlers arrived in Pineland in the late 1800s. The settlers were mostly farmers and fishermen, and they established a small community in the area. The town was officially incorporated in 1891 and was named after the pine trees that grew in the area.
In the early 1900s, the town began to grow and develop. The first school was built in 1906, and the first post office was established in 1907. The town also had a general store, a hotel, and a few other businesses.
In the 1920s, the town began to experience a boom in tourism. The area was known for its beautiful beaches and fishing, and it became a popular destination for vacationers. The town also had a thriving citrus industry, and it was home to several packing houses.
In the 1950s, the town began to experience a decline in population. Many of the businesses closed, and the town began to struggle economically. In the 1970s, the town was revitalized with the opening of a new marina and the development of a golf course.
Geography
Pineland is located in Lee County, Florida, on the Gulf Coast. The town is situated on Pine Island, which is a barrier island located between Sanibel Island and Captiva Island. The town is bordered by the Caloosahatchee River to the north and the Gulf of Mexico to the south.
The town has a total area of 4.2 square miles, of which 0.2 square miles is water. The terrain is mostly flat, with some areas of marshland. The town is located in a humid subtropical climate zone, with hot, humid summers and mild winters.
Economy
The economy of Pineland is largely based on tourism and fishing. The town is home to several marinas, which attract visitors from all over the world. The town also has a thriving fishing industry, with many local businesses specializing in fishing charters and boat rentals.
The town is also home to several restaurants, bars, and shops. The town is also home to a few small businesses, such as a grocery store and a hardware store.
Demographics
As of the 2010 census, the population of Pineland was 1,719. The population is mostly white (90.2%), with a small percentage of African Americans (4.2%) and Hispanics (3.3%). The median household income is $45,000, and the median age is 44.
Conclusion
Pineland, Florida is a small town located on Pine Island in Lee County. The town has a rich history, dating back to the early 1800s when it was inhabited by the Calusa Indians. The town has a thriving tourism and fishing industry, and it is home to several marinas, restaurants, bars, and shops. The population of Pineland is mostly white, with a small percentage of African Americans and Hispanics. The median household income is $45,000, and the median age is 44.
Common Questions
What is Per Capita Income in Pineland?
Per Capita income in Pineland is $50,635.
What is the Median Family Income in Pineland?
Median Family Income in Pineland is $111,354.
What is the Median Household income in Pineland?
Median Household Income in Pineland is $93,594.
What is Income or Wage Gap in Pineland?
Income or Wage Gap in Pineland is 47.7%.
Women in Pineland earn 52.3 cents for every dollar earned by a man.
What is Inequality or Gini Index in Pineland?
Inequality or Gini Index in Pineland is 0.36.
What is the Total Population of Pineland?
Total Population of Pineland is 379.
What is the Total Male Population of Pineland?
Total Male Population of Pineland is 198.
What is the Total Female Population of Pineland?
Total Female Population of Pineland is 181.
What is the Ratio of Males per 100 Females in Pineland?
There are 109.39 Males per 100 Females in Pineland.
What is the Ratio of Females per 100 Males in Pineland?
There are 91.41 Females per 100 Males in Pineland.
What is the Median Population Age in Pineland?
Median Population Age in Pineland is 61.1 Years.
What is the Average Family Size in Pineland
Average Family Size in Pineland is 2.4 People.
What is the Average Household Size in Pineland
Average Household Size in Pineland is 2.1 People.
How Large is the Labor Force in Pineland?
There are 175 People in the Labor Forcein in Pineland.
What is the Percentage of People in the Labor Force in Pineland?
50.1% of People are in the Labor Force in Pineland.