Cities with the Highest Percentage of Immigrants from Europe in Massachusetts
RELATED REPORTS & OPTIONS
Europe
Massachusetts
Compare Cities
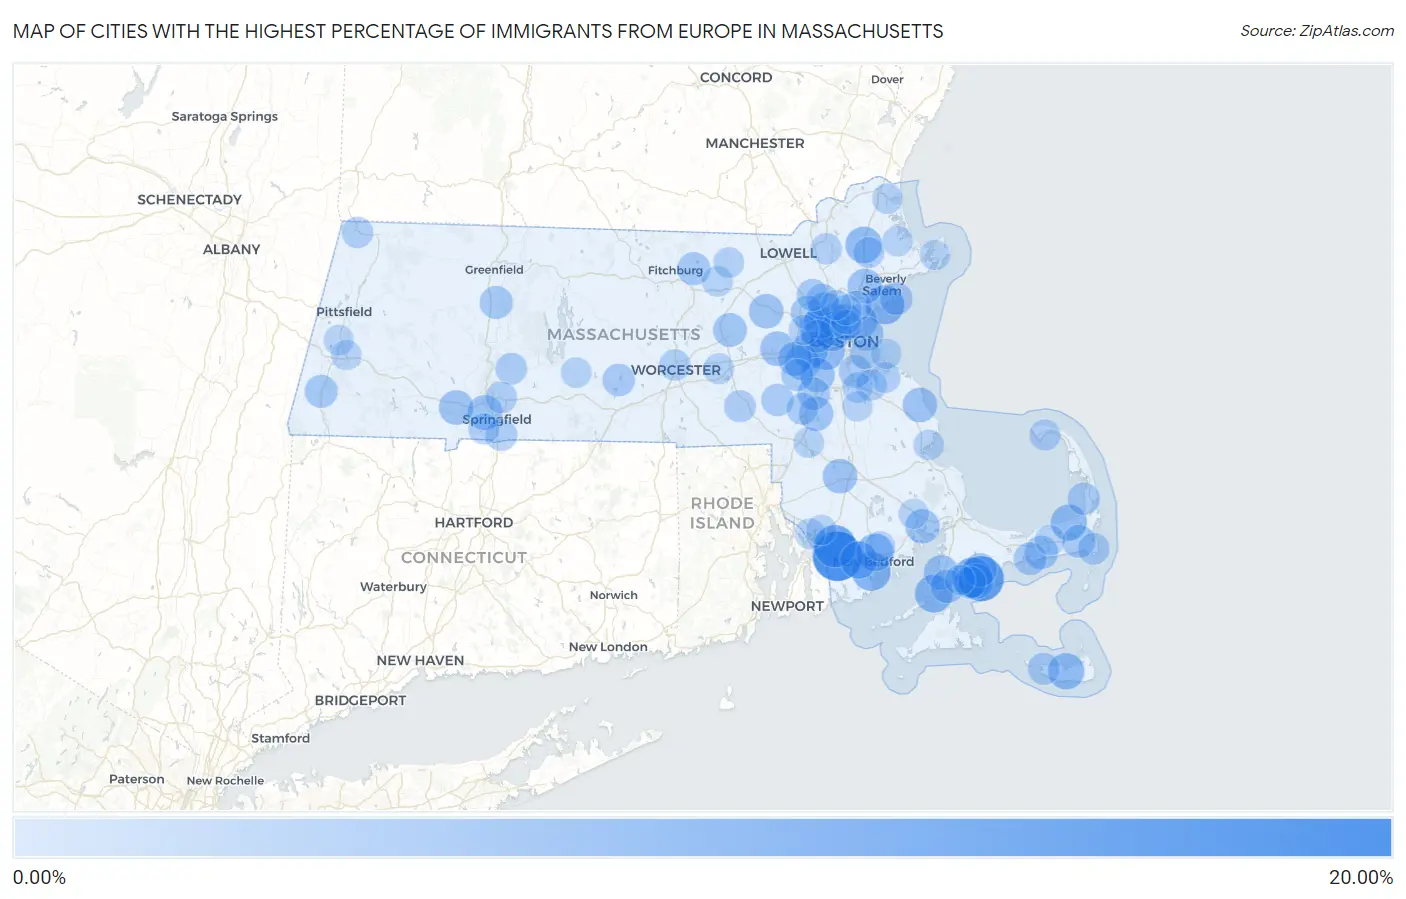
Map of Cities with the Highest Percentage of Immigrants from Europe in Massachusetts
0.00%
20.00%
Cities with the Highest Percentage of Immigrants from Europe in Massachusetts
| City | Europe | vs State | vs National | |
| 1. | North Westport | 16.95% | 3.30%(+13.7)#1 | 1.46%(+15.5)#65 |
| 2. | Popponesset | 13.66% | 3.30%(+10.4)#2 | 1.46%(+12.2)#107 |
| 3. | Fall River | 11.61% | 3.30%(+8.31)#3 | 1.46%(+10.2)#150 |
| 4. | Seabrook | 9.92% | 3.30%(+6.62)#4 | 1.46%(+8.46)#218 |
| 5. | Bliss Corner | 9.18% | 3.30%(+5.88)#5 | 1.46%(+7.72)#263 |
| 6. | Swampscott | 8.93% | 3.30%(+5.64)#6 | 1.46%(+7.48)#277 |
| 7. | Woods Hole | 8.27% | 3.30%(+4.97)#7 | 1.46%(+6.81)#327 |
| 8. | New Bedford | 8.05% | 3.30%(+4.76)#8 | 1.46%(+6.60)#350 |
| 9. | Brookline | 8.00% | 3.30%(+4.70)#9 | 1.46%(+6.54)#357 |
| 10. | Smith Mills | 7.92% | 3.30%(+4.63)#10 | 1.46%(+6.47)#366 |
| 11. | Boxford | 7.44% | 3.30%(+4.15)#11 | 1.46%(+5.99)#422 |
| 12. | Newton | 7.26% | 3.30%(+3.96)#12 | 1.46%(+5.80)#437 |
| 13. | Nantucket | 7.22% | 3.30%(+3.93)#13 | 1.46%(+5.77)#445 |
| 14. | Brewster | 7.02% | 3.30%(+3.72)#14 | 1.46%(+5.56)#468 |
| 15. | Belmont | 6.97% | 3.30%(+3.68)#15 | 1.46%(+5.52)#478 |
| 16. | Needham | 6.49% | 3.30%(+3.19)#16 | 1.46%(+5.03)#567 |
| 17. | New Seabury | 6.37% | 3.30%(+3.07)#17 | 1.46%(+4.91)#599 |
| 18. | Cambridge | 6.34% | 3.30%(+3.04)#18 | 1.46%(+4.88)#605 |
| 19. | West Warren | 6.30% | 3.30%(+3.00)#19 | 1.46%(+4.84)#609 |
| 20. | Peabody | 6.19% | 3.30%(+2.90)#20 | 1.46%(+4.74)#625 |
| 21. | West Springfield Town | 6.15% | 3.30%(+2.86)#21 | 1.46%(+4.70)#633 |
| 22. | Winchester | 6.14% | 3.30%(+2.85)#22 | 1.46%(+4.69)#636 |
| 23. | West Falmouth | 6.08% | 3.30%(+2.78)#23 | 1.46%(+4.62)#653 |
| 24. | Cochituate | 6.00% | 3.30%(+2.70)#24 | 1.46%(+4.54)#676 |
| 25. | Westfield | 5.92% | 3.30%(+2.63)#25 | 1.46%(+4.47)#696 |
| 26. | Dedham | 5.90% | 3.30%(+2.60)#26 | 1.46%(+4.44)#702 |
| 27. | Marshfield Hills | 5.86% | 3.30%(+2.56)#27 | 1.46%(+4.40)#709 |
| 28. | Taunton | 5.86% | 3.30%(+2.56)#28 | 1.46%(+4.40)#710 |
| 29. | Revere | 5.86% | 3.30%(+2.56)#29 | 1.46%(+4.40)#711 |
| 30. | West Concord | 5.81% | 3.30%(+2.52)#30 | 1.46%(+4.36)#724 |
| 31. | Winthrop Town | 5.79% | 3.30%(+2.49)#31 | 1.46%(+4.33)#731 |
| 32. | Wareham Center | 5.76% | 3.30%(+2.47)#32 | 1.46%(+4.31)#736 |
| 33. | Sharon | 5.67% | 3.30%(+2.37)#33 | 1.46%(+4.21)#761 |
| 34. | Wellesley | 5.66% | 3.30%(+2.37)#34 | 1.46%(+4.21)#762 |
| 35. | Somerville | 5.41% | 3.30%(+2.11)#35 | 1.46%(+3.95)#844 |
| 36. | Hudson | 5.32% | 3.30%(+2.03)#36 | 1.46%(+3.87)#870 |
| 37. | Medford | 5.28% | 3.30%(+1.99)#37 | 1.46%(+3.83)#883 |
| 38. | Falmouth | 5.28% | 3.30%(+1.98)#38 | 1.46%(+3.82)#884 |
| 39. | South Yarmouth | 5.23% | 3.30%(+1.93)#39 | 1.46%(+3.77)#902 |
| 40. | Mashpee Neck | 5.20% | 3.30%(+1.90)#40 | 1.46%(+3.74)#914 |
| 41. | Lexington | 5.08% | 3.30%(+1.78)#41 | 1.46%(+3.62)#944 |
| 42. | Lunenburg | 4.89% | 3.30%(+1.59)#42 | 1.46%(+3.43)#1,007 |
| 43. | South Deerfield | 4.76% | 3.30%(+1.47)#43 | 1.46%(+3.31)#1,055 |
| 44. | Great Barrington | 4.76% | 3.30%(+1.47)#44 | 1.46%(+3.31)#1,056 |
| 45. | East Harwich | 4.73% | 3.30%(+1.43)#45 | 1.46%(+3.27)#1,075 |
| 46. | Arlington | 4.66% | 3.30%(+1.37)#46 | 1.46%(+3.21)#1,106 |
| 47. | Norwood | 4.64% | 3.30%(+1.34)#47 | 1.46%(+3.18)#1,118 |
| 48. | Quincy | 4.63% | 3.30%(+1.34)#48 | 1.46%(+3.18)#1,120 |
| 49. | West Yarmouth | 4.62% | 3.30%(+1.33)#49 | 1.46%(+3.17)#1,126 |
| 50. | Marblehead | 4.60% | 3.30%(+1.30)#50 | 1.46%(+3.14)#1,139 |
| 51. | Watertown Town | 4.47% | 3.30%(+1.17)#51 | 1.46%(+3.01)#1,198 |
| 52. | East Brookfield | 4.39% | 3.30%(+1.09)#52 | 1.46%(+2.93)#1,231 |
| 53. | Seconsett Island | 4.38% | 3.30%(+1.08)#53 | 1.46%(+2.92)#1,236 |
| 54. | Millis Clicquot | 4.37% | 3.30%(+1.07)#54 | 1.46%(+2.91)#1,248 |
| 55. | North Eastham | 4.26% | 3.30%(+0.967)#55 | 1.46%(+2.81)#1,293 |
| 56. | Woburn | 4.18% | 3.30%(+0.886)#56 | 1.46%(+2.73)#1,316 |
| 57. | Burlington | 4.14% | 3.30%(+0.847)#57 | 1.46%(+2.69)#1,331 |
| 58. | Dover | 4.10% | 3.30%(+0.805)#58 | 1.46%(+2.64)#1,360 |
| 59. | Madaket | 4.09% | 3.30%(+0.793)#59 | 1.46%(+2.63)#1,364 |
| 60. | Milford | 4.03% | 3.30%(+0.735)#60 | 1.46%(+2.57)#1,396 |
| 61. | Longmeadow | 3.95% | 3.30%(+0.651)#61 | 1.46%(+2.49)#1,447 |
| 62. | Walpole | 3.91% | 3.30%(+0.612)#62 | 1.46%(+2.45)#1,466 |
| 63. | Chatham | 3.85% | 3.30%(+0.553)#63 | 1.46%(+2.39)#1,513 |
| 64. | Granby | 3.83% | 3.30%(+0.531)#64 | 1.46%(+2.37)#1,523 |
| 65. | Chicopee | 3.72% | 3.30%(+0.428)#65 | 1.46%(+2.27)#1,581 |
| 66. | Williamstown | 3.62% | 3.30%(+0.329)#66 | 1.46%(+2.17)#1,653 |
| 67. | Worcester | 3.59% | 3.30%(+0.295)#67 | 1.46%(+2.13)#1,682 |
| 68. | Topsfield | 3.47% | 3.30%(+0.170)#68 | 1.46%(+2.01)#1,776 |
| 69. | Andover | 3.46% | 3.30%(+0.166)#69 | 1.46%(+2.01)#1,780 |
| 70. | Weymouth Town | 3.39% | 3.30%(+0.096)#70 | 1.46%(+1.94)#1,836 |
| 71. | Provincetown | 3.38% | 3.30%(+0.084)#71 | 1.46%(+1.92)#1,850 |
| 72. | Agawam Town | 3.38% | 3.30%(+0.082)#72 | 1.46%(+1.92)#1,854 |
| 73. | Saugus | 3.34% | 3.30%(+0.045)#73 | 1.46%(+1.88)#1,890 |
| 74. | Hingham | 3.28% | 3.30%(-0.013)#74 | 1.46%(+1.83)#1,920 |
| 75. | Malden | 3.26% | 3.30%(-0.032)#75 | 1.46%(+1.81)#1,945 |
| 76. | Westborough | 3.24% | 3.30%(-0.054)#76 | 1.46%(+1.79)#1,966 |
| 77. | Devens | 3.18% | 3.30%(-0.119)#77 | 1.46%(+1.72)#2,022 |
| 78. | Boston | 3.12% | 3.30%(-0.173)#78 | 1.46%(+1.67)#2,075 |
| 79. | Everett | 3.11% | 3.30%(-0.181)#79 | 1.46%(+1.66)#2,081 |
| 80. | Ware | 3.10% | 3.30%(-0.193)#80 | 1.46%(+1.65)#2,092 |
| 81. | Melrose | 3.09% | 3.30%(-0.201)#81 | 1.46%(+1.64)#2,100 |
| 82. | Ocean Grove | 3.08% | 3.30%(-0.211)#82 | 1.46%(+1.63)#2,110 |
| 83. | Groton | 3.06% | 3.30%(-0.238)#83 | 1.46%(+1.60)#2,134 |
| 84. | Mansfield Center | 3.02% | 3.30%(-0.278)#84 | 1.46%(+1.56)#2,179 |
| 85. | Newburyport | 2.99% | 3.30%(-0.304)#85 | 1.46%(+1.53)#2,199 |
| 86. | Braintree Town | 2.98% | 3.30%(-0.314)#86 | 1.46%(+1.52)#2,212 |
| 87. | South Duxbury | 2.96% | 3.30%(-0.332)#87 | 1.46%(+1.51)#2,222 |
| 88. | Somerset | 2.96% | 3.30%(-0.339)#88 | 1.46%(+1.50)#2,228 |
| 89. | Ipswich | 2.94% | 3.30%(-0.360)#89 | 1.46%(+1.48)#2,254 |
| 90. | South Dennis | 2.90% | 3.30%(-0.393)#90 | 1.46%(+1.45)#2,294 |
| 91. | Lenox | 2.90% | 3.30%(-0.394)#91 | 1.46%(+1.45)#2,296 |
| 92. | East Falmouth | 2.90% | 3.30%(-0.398)#92 | 1.46%(+1.44)#2,300 |
| 93. | Gloucester | 2.88% | 3.30%(-0.415)#93 | 1.46%(+1.42)#2,314 |
| 94. | Lee | 2.85% | 3.30%(-0.442)#94 | 1.46%(+1.40)#2,346 |
| 95. | Stoneham | 2.83% | 3.30%(-0.464)#95 | 1.46%(+1.38)#2,369 |
| 96. | Waltham | 2.82% | 3.30%(-0.472)#96 | 1.46%(+1.37)#2,379 |
| 97. | Holbrook | 2.82% | 3.30%(-0.473)#97 | 1.46%(+1.37)#2,383 |
| 98. | Hull | 2.82% | 3.30%(-0.478)#98 | 1.46%(+1.36)#2,390 |
| 99. | Acushnet Center | 2.81% | 3.30%(-0.482)#99 | 1.46%(+1.36)#2,397 |
| 100. | West Wareham | 2.80% | 3.30%(-0.493)#100 | 1.46%(+1.35)#2,409 |
Common Questions
What are the Top 10 Cities with the Highest Percentage of Immigrants from Europe in Massachusetts?
Top 10 Cities with the Highest Percentage of Immigrants from Europe in Massachusetts are:
#1
16.95%
#2
13.66%
#3
11.61%
#4
9.92%
#5
9.18%
#6
8.93%
#7
8.27%
#8
8.05%
#9
8.00%
#10
7.92%
What city has the Highest Percentage of Immigrants from Europe in Massachusetts?
North Westport has the Highest Percentage of Immigrants from Europe in Massachusetts with 16.95%.
What is the Percentage of Immigrants from Europe in the State of Massachusetts?
Percentage of Immigrants from Europe in Massachusetts is 3.30%.
What is the Percentage of Immigrants from Europe in the United States?
Percentage of Immigrants from Europe in the United States is 1.46%.