Aguanga, CA Map & Demographics
Aguanga Map
Aguanga Overview
$42,819
PER CAPITA INCOME
$78,583
AVG FAMILY INCOME
$77,813
AVG HOUSEHOLD INCOME
0.56
INEQUALITY / GINI INDEX
603
TOTAL POPULATION
389
MALE POPULATION
214
FEMALE POPULATION
181.78
MALES / 100 FEMALES
55.01
FEMALES / 100 MALES
53.3
MEDIAN AGE
2.7
AVG FAMILY SIZE
2.4
AVG HOUSEHOLD SIZE
178
LABOR FORCE [ PEOPLE ]
37.2%
PERCENT IN LABOR FORCE
Aguanga Zip Codes
Aguanga Area Codes
Income in Aguanga
Income Overview in Aguanga
Per Capita Income in Aguanga is $42,819, while median incomes of families and households are $78,583 and $77,813 respectively.
| Characteristic | Number | Measure |
| Per Capita Income | 603 | $42,819 |
| Median Family Income | 188 | $78,583 |
| Mean Family Income | 188 | $125,625 |
| Median Household Income | 247 | $77,813 |
| Mean Household Income | 247 | $105,596 |
| Income Deficit | 188 | $0 |
| Wage / Income Gap (%) | 603 | 0.00% |
| Wage / Income Gap ($) | 603 | 100.00¢ per $1 |
| Gini / Inequality Index | 603 | 0.56 |
Earnings by Sex in Aguanga
| Sex | Number | Average Earnings |
| Male | 104 (58.4%) | $0 |
| Female | 74 (41.6%) | $0 |
| Total | 178 (100.0%) | $0 |
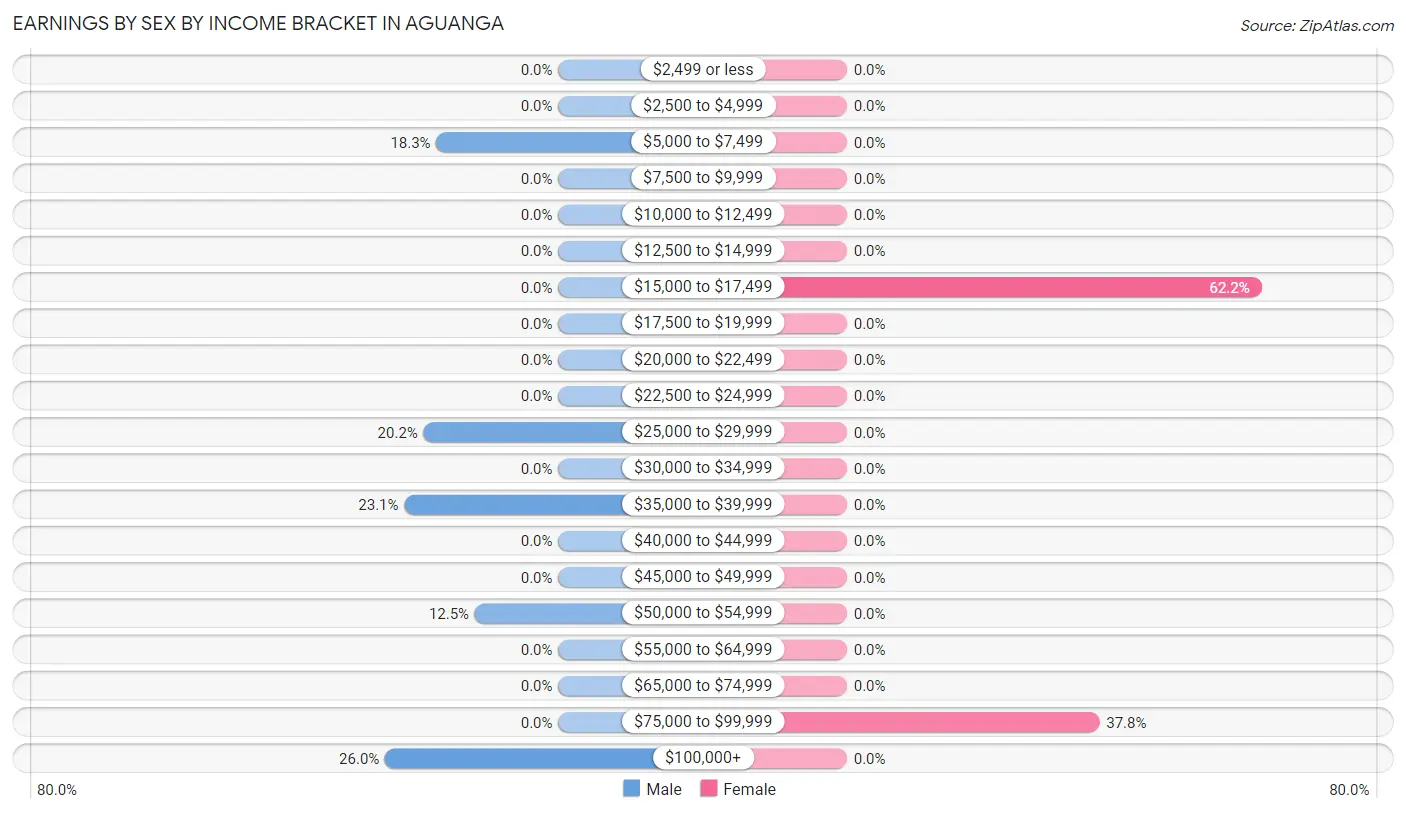
Earnings by Sex by Income Bracket in Aguanga
The most common earnings brackets in Aguanga are $100,000+ for men (27 | 26.0%) and $15,000 to $17,499 for women (46 | 62.2%).
| Income | Male | Female |
| $2,499 or less | 0 (0.0%) | 0 (0.0%) |
| $2,500 to $4,999 | 0 (0.0%) | 0 (0.0%) |
| $5,000 to $7,499 | 19 (18.3%) | 0 (0.0%) |
| $7,500 to $9,999 | 0 (0.0%) | 0 (0.0%) |
| $10,000 to $12,499 | 0 (0.0%) | 0 (0.0%) |
| $12,500 to $14,999 | 0 (0.0%) | 0 (0.0%) |
| $15,000 to $17,499 | 0 (0.0%) | 46 (62.2%) |
| $17,500 to $19,999 | 0 (0.0%) | 0 (0.0%) |
| $20,000 to $22,499 | 0 (0.0%) | 0 (0.0%) |
| $22,500 to $24,999 | 0 (0.0%) | 0 (0.0%) |
| $25,000 to $29,999 | 21 (20.2%) | 0 (0.0%) |
| $30,000 to $34,999 | 0 (0.0%) | 0 (0.0%) |
| $35,000 to $39,999 | 24 (23.1%) | 0 (0.0%) |
| $40,000 to $44,999 | 0 (0.0%) | 0 (0.0%) |
| $45,000 to $49,999 | 0 (0.0%) | 0 (0.0%) |
| $50,000 to $54,999 | 13 (12.5%) | 0 (0.0%) |
| $55,000 to $64,999 | 0 (0.0%) | 0 (0.0%) |
| $65,000 to $74,999 | 0 (0.0%) | 0 (0.0%) |
| $75,000 to $99,999 | 0 (0.0%) | 28 (37.8%) |
| $100,000+ | 27 (26.0%) | 0 (0.0%) |
| Total | 104 (100.0%) | 74 (100.0%) |
Earnings by Sex by Educational Attainment in Aguanga
| Educational Attainment | Male Income | Female Income |
| Less than High School | - | - |
| High School Diploma | - | - |
| College or Associate's Degree | - | - |
| Bachelor's Degree | - | - |
| Graduate Degree | - | - |
| Total | - | - |
Family Income in Aguanga
Family Income Brackets in Aguanga
According to the Aguanga family income data, there are 60 families falling into the $75,000 to $99,999 income range, which is the most common income bracket and makes up 31.9% of all families.
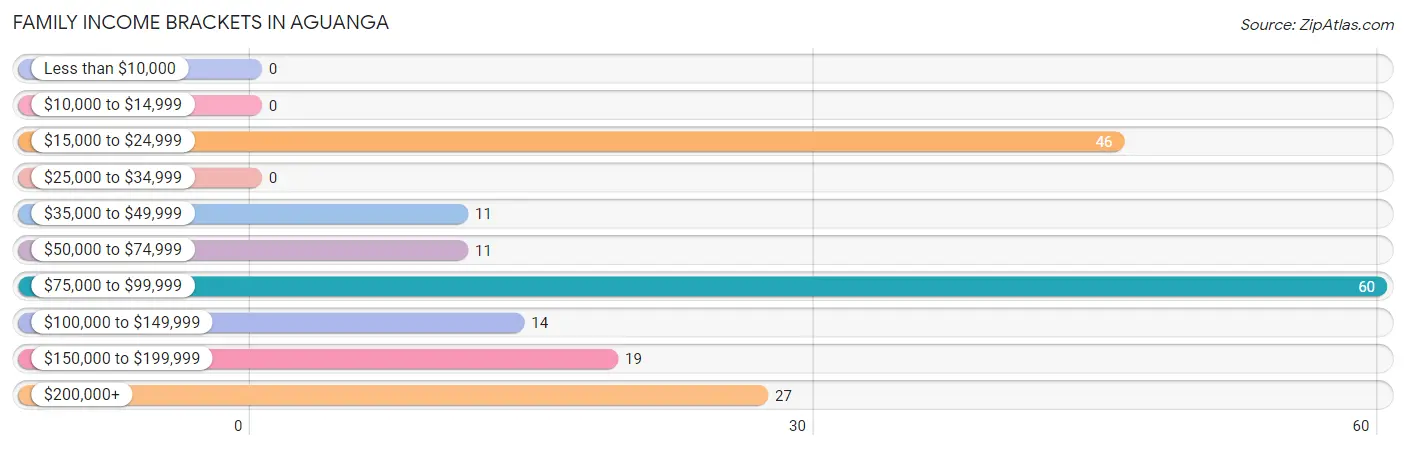
| Income Bracket | # Families | % Families |
| Less than $10,000 | 0 | 0.0% |
| $10,000 to $14,999 | 0 | 0.0% |
| $15,000 to $24,999 | 46 | 24.5% |
| $25,000 to $34,999 | 0 | 0.0% |
| $35,000 to $49,999 | 11 | 5.9% |
| $50,000 to $74,999 | 11 | 5.9% |
| $75,000 to $99,999 | 60 | 31.9% |
| $100,000 to $149,999 | 14 | 7.4% |
| $150,000 to $199,999 | 19 | 10.1% |
| $200,000+ | 27 | 14.4% |
Family Income by Famaliy Size in Aguanga
2-person families (123 | 65.4%) account for the highest median family income in Aguanga with $79,146 per family, while 2-person families (123 | 65.4%) have the highest median income of $39,573 per family member.
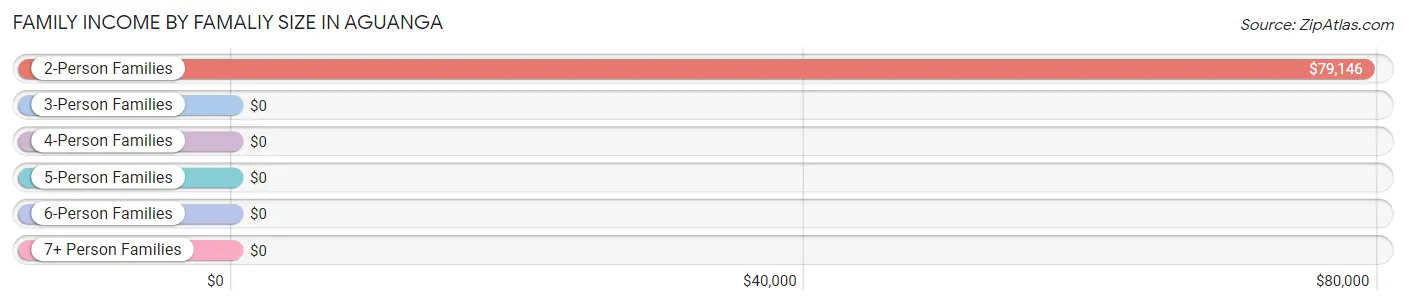
| Income Bracket | # Families | Median Income |
| 2-Person Families | 123 (65.4%) | $79,146 |
| 3-Person Families | 46 (24.5%) | $0 |
| 4-Person Families | 0 (0.0%) | $0 |
| 5-Person Families | 19 (10.1%) | $0 |
| 6-Person Families | 0 (0.0%) | $0 |
| 7+ Person Families | 0 (0.0%) | $0 |
| Total | 188 (100.0%) | $78,583 |
Family Income by Number of Earners in Aguanga
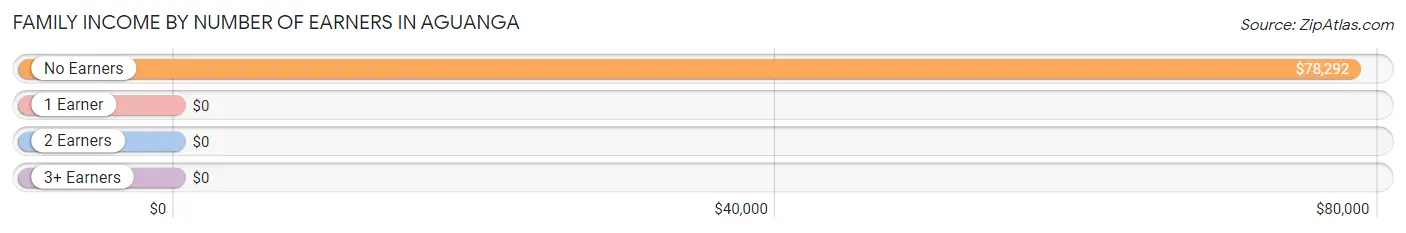
| Number of Earners | # Families | Median Income |
| No Earners | 82 (43.6%) | $78,292 |
| 1 Earner | 87 (46.3%) | $0 |
| 2 Earners | 0 (0.0%) | $0 |
| 3+ Earners | 19 (10.1%) | $0 |
| Total | 188 (100.0%) | $78,583 |
Household Income in Aguanga
Household Income Brackets in Aguanga
With 60 households falling in the category, the $75,000 to $99,999 income range is the most frequent in Aguanga, accounting for 24.3% of all households.
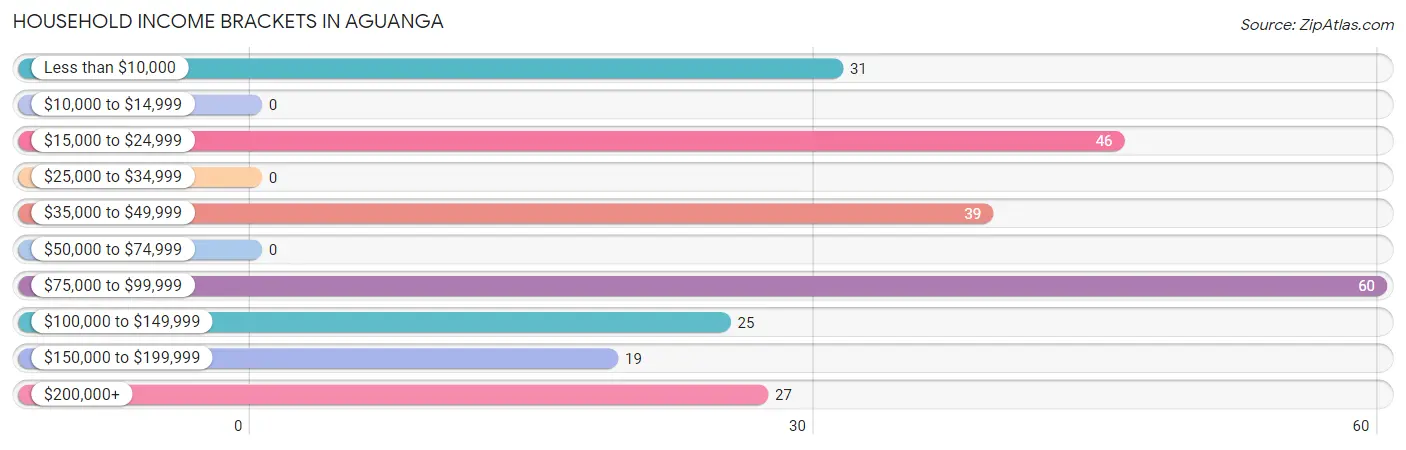
| Income Bracket | # Households | % Households |
| Less than $10,000 | 31 | 12.6% |
| $10,000 to $14,999 | 0 | 0.0% |
| $15,000 to $24,999 | 46 | 18.6% |
| $25,000 to $34,999 | 0 | 0.0% |
| $35,000 to $49,999 | 39 | 15.8% |
| $50,000 to $74,999 | 0 | 0.0% |
| $75,000 to $99,999 | 60 | 24.3% |
| $100,000 to $149,999 | 25 | 10.1% |
| $150,000 to $199,999 | 19 | 7.7% |
| $200,000+ | 27 | 10.9% |
Household Income by Householder Age in Aguanga
| Income Bracket | # Households | Median Income |
| 15 to 24 Years | 0 (0.0%) | $0 |
| 25 to 44 Years | 46 (18.6%) | $0 |
| 45 to 64 Years | 148 (59.9%) | $0 |
| 65+ Years | 53 (21.5%) | $0 |
| Total | 247 (100.0%) | $77,813 |
Poverty in Aguanga
Income Below Poverty by Sex and Age in Aguanga
With 37.5% poverty level for males and 26.2% for females among the residents of Aguanga, 5 year old males and 25 to 34 year old females are the most vulnerable to poverty, with 51 males (100.0%) and 46 females (100.0%) in their respective age groups living below the poverty level.
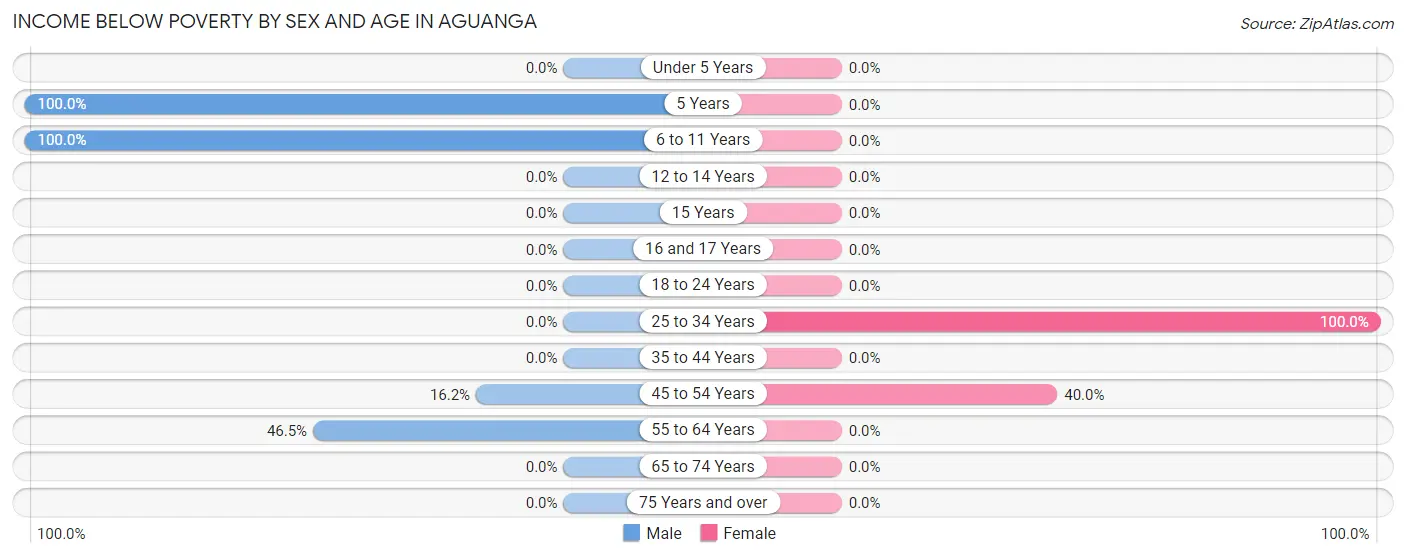
| Age Bracket | Male | Female |
| Under 5 Years | 0 (0.0%) | 0 (0.0%) |
| 5 Years | 51 (100.0%) | 0 (0.0%) |
| 6 to 11 Years | 50 (100.0%) | 0 (0.0%) |
| 12 to 14 Years | 0 (0.0%) | 0 (0.0%) |
| 15 Years | 0 (0.0%) | 0 (0.0%) |
| 16 and 17 Years | 0 (0.0%) | 0 (0.0%) |
| 18 to 24 Years | 0 (0.0%) | 0 (0.0%) |
| 25 to 34 Years | 0 (0.0%) | 46 (100.0%) |
| 35 to 44 Years | 0 (0.0%) | 0 (0.0%) |
| 45 to 54 Years | 12 (16.2%) | 10 (40.0%) |
| 55 to 64 Years | 33 (46.5%) | 0 (0.0%) |
| 65 to 74 Years | 0 (0.0%) | 0 (0.0%) |
| 75 Years and over | 0 (0.0%) | 0 (0.0%) |
| Total | 146 (37.5%) | 56 (26.2%) |
Income Above Poverty by Sex and Age in Aguanga
According to the poverty statistics in Aguanga, males aged 18 to 24 years and females aged 6 to 11 years are the age groups that are most secure financially, with 100.0% of males and 100.0% of females in these age groups living above the poverty line.
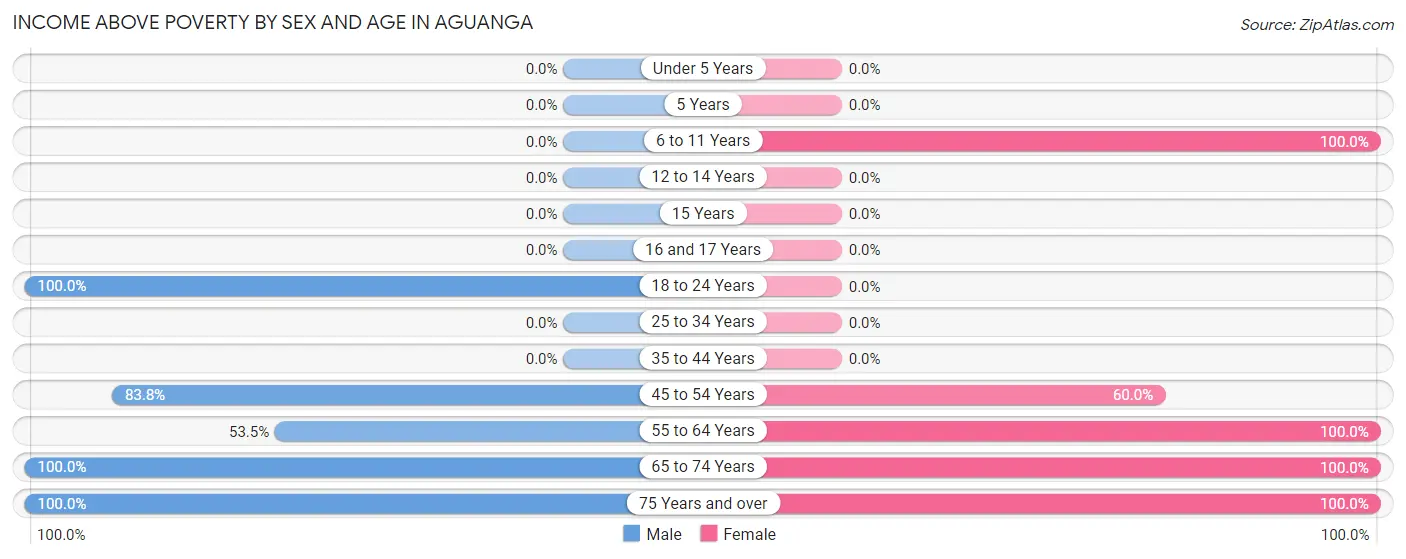
| Age Bracket | Male | Female |
| Under 5 Years | 0 (0.0%) | 0 (0.0%) |
| 5 Years | 0 (0.0%) | 0 (0.0%) |
| 6 to 11 Years | 0 (0.0%) | 24 (100.0%) |
| 12 to 14 Years | 0 (0.0%) | 0 (0.0%) |
| 15 Years | 0 (0.0%) | 0 (0.0%) |
| 16 and 17 Years | 0 (0.0%) | 0 (0.0%) |
| 18 to 24 Years | 45 (100.0%) | 0 (0.0%) |
| 25 to 34 Years | 0 (0.0%) | 0 (0.0%) |
| 35 to 44 Years | 0 (0.0%) | 0 (0.0%) |
| 45 to 54 Years | 62 (83.8%) | 15 (60.0%) |
| 55 to 64 Years | 38 (53.5%) | 73 (100.0%) |
| 65 to 74 Years | 84 (100.0%) | 10 (100.0%) |
| 75 Years and over | 14 (100.0%) | 36 (100.0%) |
| Total | 243 (62.5%) | 158 (73.8%) |
Income Below Poverty Among Married-Couple Families in Aguanga
| Children | Above Poverty | Below Poverty |
| No Children | 112 (100.0%) | 0 (0.0%) |
| 1 or 2 Children | 19 (100.0%) | 0 (0.0%) |
| 3 or 4 Children | 0 (0.0%) | 0 (0.0%) |
| 5 or more Children | 0 (0.0%) | 0 (0.0%) |
| Total | 131 (100.0%) | 0 (0.0%) |
Income Below Poverty Among Single-Parent Households in Aguanga
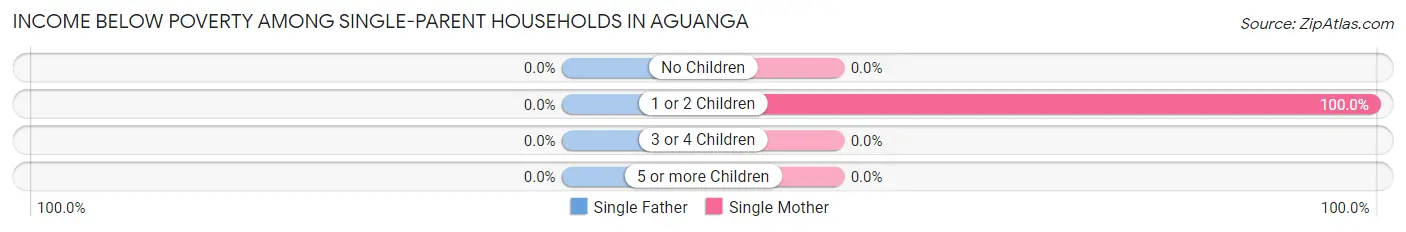
| Children | Single Father | Single Mother |
| No Children | 0 (0.0%) | 0 (0.0%) |
| 1 or 2 Children | 0 (0.0%) | 46 (100.0%) |
| 3 or 4 Children | 0 (0.0%) | 0 (0.0%) |
| 5 or more Children | 0 (0.0%) | 0 (0.0%) |
| Total | 0 (0.0%) | 46 (100.0%) |
Income Below Poverty Among Married-Couple vs Single-Parent Households in Aguanga
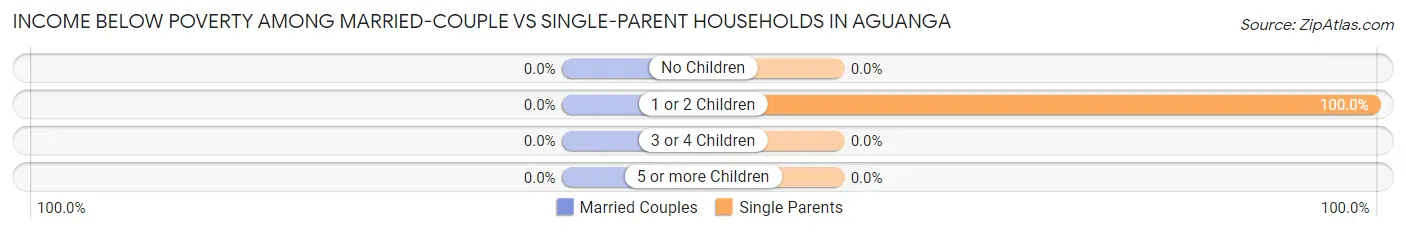
| Children | Married-Couple Families | Single-Parent Households |
| No Children | 0 (0.0%) | 0 (0.0%) |
| 1 or 2 Children | 0 (0.0%) | 46 (100.0%) |
| 3 or 4 Children | 0 (0.0%) | 0 (0.0%) |
| 5 or more Children | 0 (0.0%) | 0 (0.0%) |
| Total | 0 (0.0%) | 46 (80.7%) |
Race in Aguanga
The most populous races in Aguanga are White / Caucasian (478 | 79.3%), Two or more Races (103 | 17.1%), and Hispanic or Latino (94 | 15.6%).
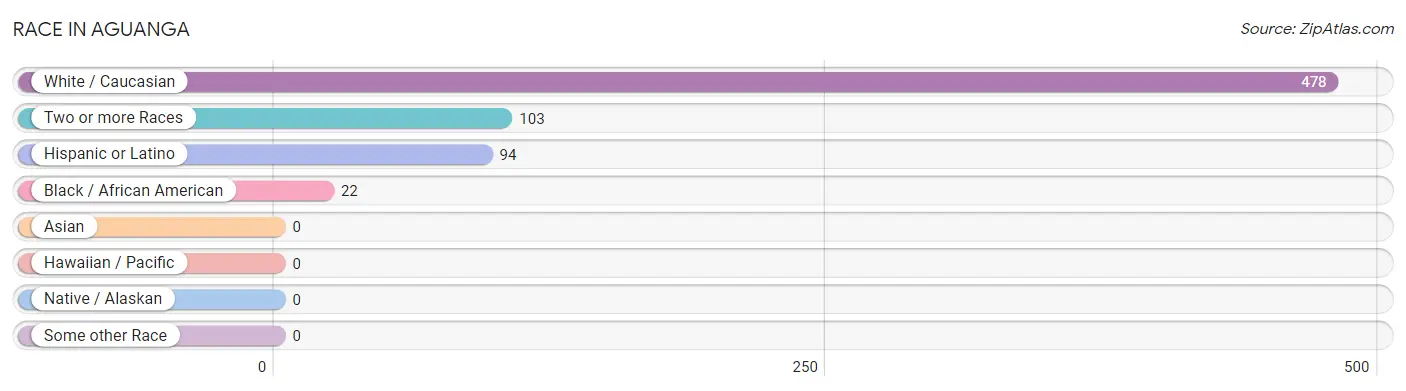
| Race | # Population | % Population |
| Asian | 0 | 0.0% |
| Black / African American | 22 | 3.6% |
| Hawaiian / Pacific | 0 | 0.0% |
| Hispanic or Latino | 94 | 15.6% |
| Native / Alaskan | 0 | 0.0% |
| White / Caucasian | 478 | 79.3% |
| Two or more Races | 103 | 17.1% |
| Some other Race | 0 | 0.0% |
| Total | 603 | 100.0% |
Ancestry in Aguanga
The most populous ancestries reported in Aguanga are American (207 | 34.3%), Mexican (84 | 13.9%), German (76 | 12.6%), Italian (75 | 12.4%), and Irish (48 | 8.0%), together accounting for 81.3% of all Aguanga residents.
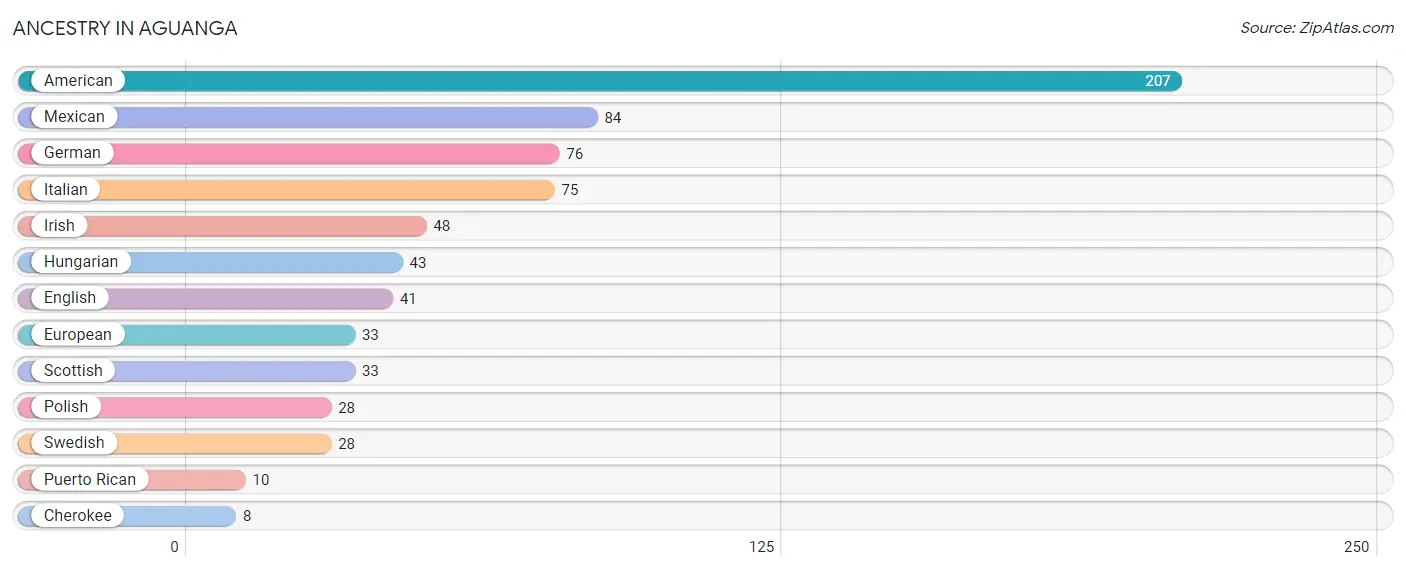
| Ancestry | # Population | % Population |
| American | 207 | 34.3% |
| Cherokee | 8 | 1.3% |
| English | 41 | 6.8% |
| European | 33 | 5.5% |
| German | 76 | 12.6% |
| Hungarian | 43 | 7.1% |
| Irish | 48 | 8.0% |
| Italian | 75 | 12.4% |
| Mexican | 84 | 13.9% |
| Polish | 28 | 4.6% |
| Puerto Rican | 10 | 1.7% |
| Scottish | 33 | 5.5% |
| Swedish | 28 | 4.6% | View All 13 Rows |
Immigrants in Aguanga
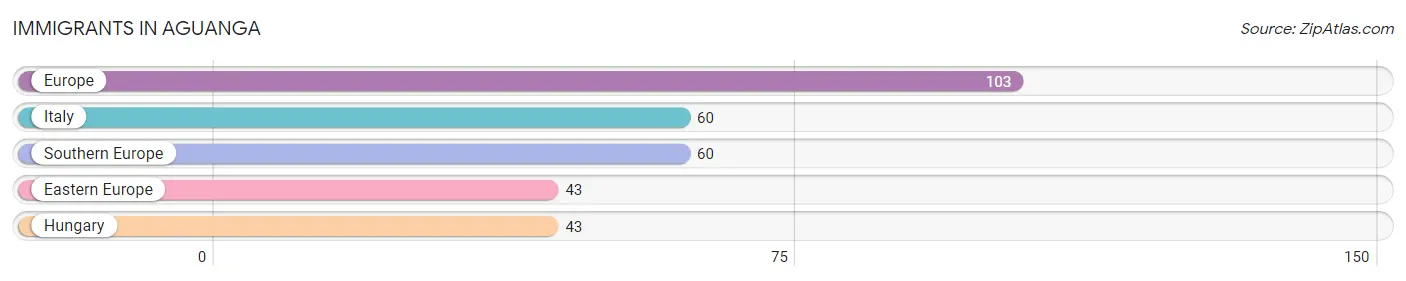
The most numerous immigrant groups reported in Aguanga came from Europe (103 | 17.1%), Italy (60 | 10.0%), Southern Europe (60 | 10.0%), Eastern Europe (43 | 7.1%), and Hungary (43 | 7.1%), together accounting for 51.2% of all Aguanga residents.
| Immigration Origin | # Population | % Population |
| Eastern Europe | 43 | 7.1% |
| Europe | 103 | 17.1% |
| Hungary | 43 | 7.1% |
| Italy | 60 | 10.0% |
| Southern Europe | 60 | 10.0% | View All 5 Rows |
Sex and Age in Aguanga
Sex and Age in Aguanga
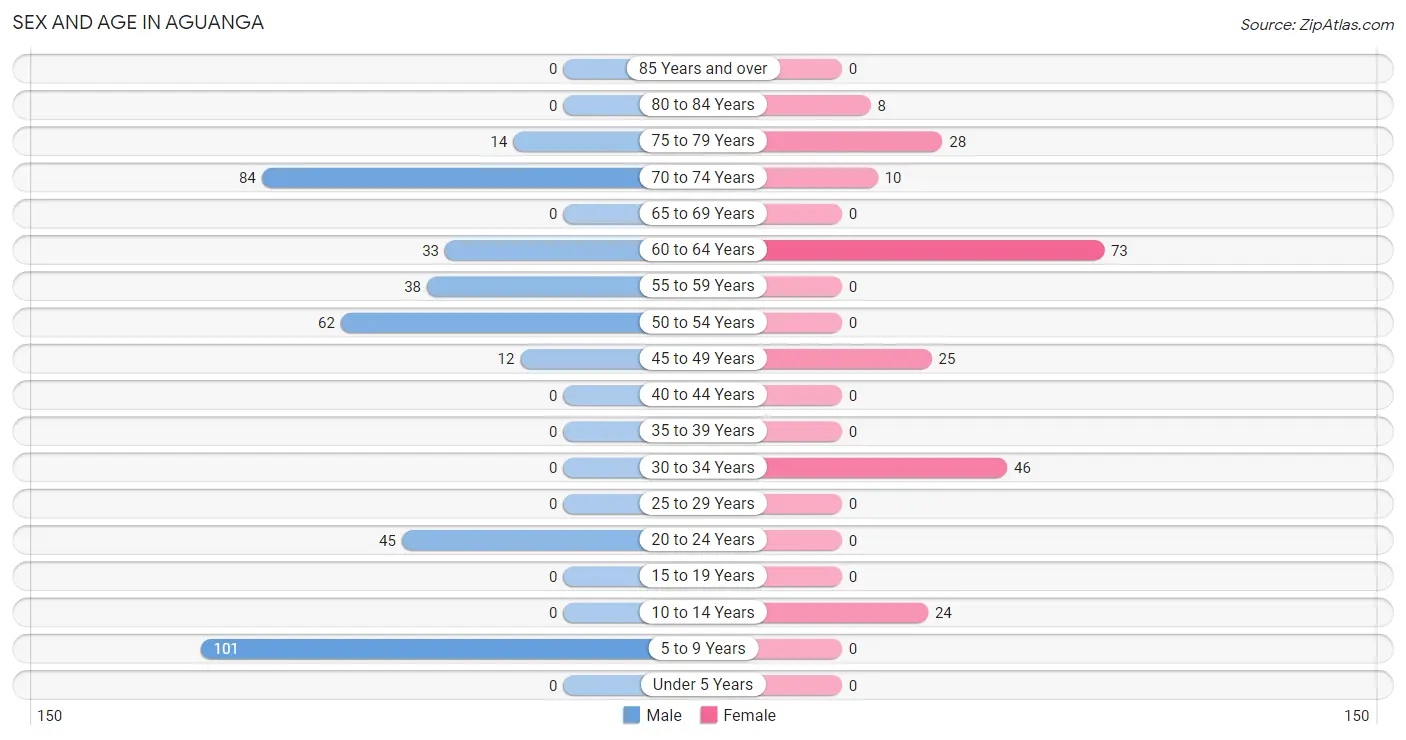
The most populous age groups in Aguanga are 5 to 9 Years (101 | 26.0%) for men and 60 to 64 Years (73 | 34.1%) for women.
| Age Bracket | Male | Female |
| Under 5 Years | 0 (0.0%) | 0 (0.0%) |
| 5 to 9 Years | 101 (26.0%) | 0 (0.0%) |
| 10 to 14 Years | 0 (0.0%) | 24 (11.2%) |
| 15 to 19 Years | 0 (0.0%) | 0 (0.0%) |
| 20 to 24 Years | 45 (11.6%) | 0 (0.0%) |
| 25 to 29 Years | 0 (0.0%) | 0 (0.0%) |
| 30 to 34 Years | 0 (0.0%) | 46 (21.5%) |
| 35 to 39 Years | 0 (0.0%) | 0 (0.0%) |
| 40 to 44 Years | 0 (0.0%) | 0 (0.0%) |
| 45 to 49 Years | 12 (3.1%) | 25 (11.7%) |
| 50 to 54 Years | 62 (15.9%) | 0 (0.0%) |
| 55 to 59 Years | 38 (9.8%) | 0 (0.0%) |
| 60 to 64 Years | 33 (8.5%) | 73 (34.1%) |
| 65 to 69 Years | 0 (0.0%) | 0 (0.0%) |
| 70 to 74 Years | 84 (21.6%) | 10 (4.7%) |
| 75 to 79 Years | 14 (3.6%) | 28 (13.1%) |
| 80 to 84 Years | 0 (0.0%) | 8 (3.7%) |
| 85 Years and over | 0 (0.0%) | 0 (0.0%) |
| Total | 389 (100.0%) | 214 (100.0%) |
Families and Households in Aguanga
Median Family Size in Aguanga
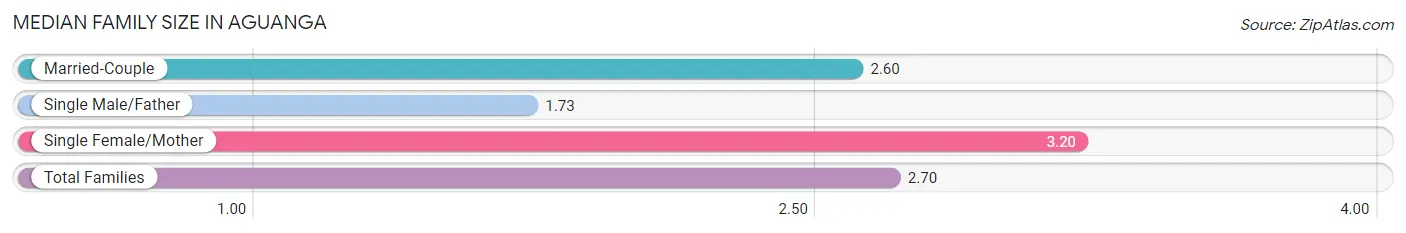
The median family size in Aguanga is 2.70 persons per family, with single female/mother families (46 | 24.5%) accounting for the largest median family size of 3.2 persons per family. On the other hand, single male/father families (11 | 5.9%) represent the smallest median family size with 1.73 persons per family.
| Family Type | # Families | Family Size |
| Married-Couple | 131 (69.7%) | 2.60 |
| Single Male/Father | 11 (5.9%) | 1.73 |
| Single Female/Mother | 46 (24.5%) | 3.20 |
| Total Families | 188 (100.0%) | 2.70 |
Median Household Size in Aguanga
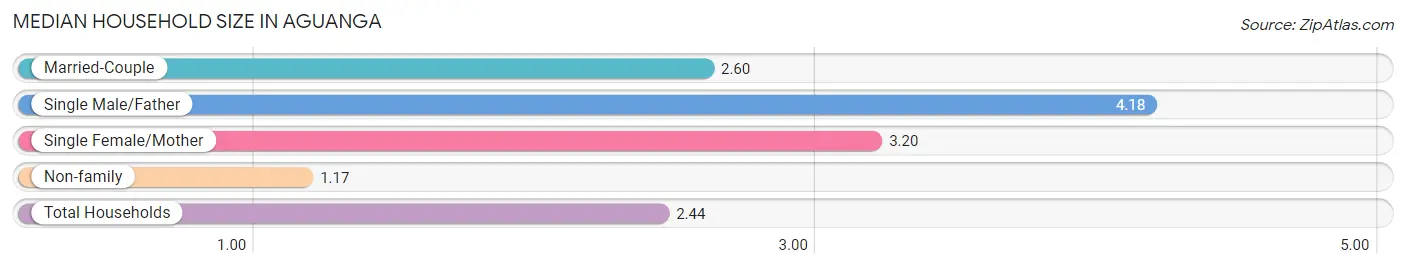
The median household size in Aguanga is 2.44 persons per household, with single male/father households (11 | 4.4%) accounting for the largest median household size of 4.18 persons per household. non-family households (59 | 23.9%) represent the smallest median household size with 1.17 persons per household.
| Household Type | # Households | Household Size |
| Married-Couple | 131 (53.0%) | 2.60 |
| Single Male/Father | 11 (4.4%) | 4.18 |
| Single Female/Mother | 46 (18.6%) | 3.20 |
| Non-family | 59 (23.9%) | 1.17 |
| Total Households | 247 (100.0%) | 2.44 |
Household Size by Marriage Status in Aguanga
Out of a total of 247 households in Aguanga, 188 (76.1%) are family households, while 59 (23.9%) are nonfamily households. The most numerous type of family households are 2-person households, comprising 112, and the most common type of nonfamily households are 1-person households, comprising 47.
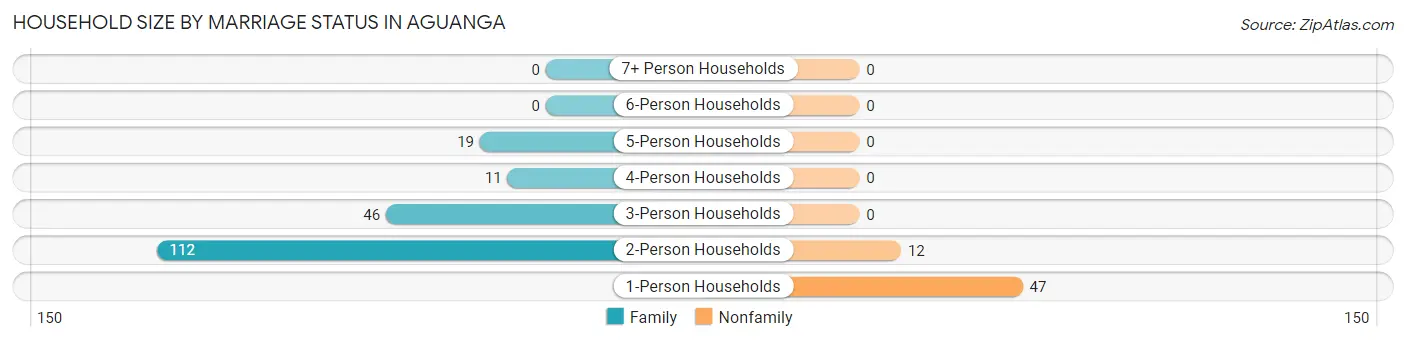
| Household Size | Family Households | Nonfamily Households |
| 1-Person Households | - | 47 (19.0%) |
| 2-Person Households | 112 (45.3%) | 12 (4.9%) |
| 3-Person Households | 46 (18.6%) | 0 (0.0%) |
| 4-Person Households | 11 (4.4%) | 0 (0.0%) |
| 5-Person Households | 19 (7.7%) | 0 (0.0%) |
| 6-Person Households | 0 (0.0%) | 0 (0.0%) |
| 7+ Person Households | 0 (0.0%) | 0 (0.0%) |
| Total | 188 (76.1%) | 59 (23.9%) |
Female Fertility in Aguanga
Fertility by Age in Aguanga
| Age Bracket | Women with Births | Births / 1,000 Women |
| 15 to 19 years | 0 (0.0%) | 0.0 |
| 20 to 34 years | 0 (0.0%) | 0.0 |
| 35 to 50 years | 0 (0.0%) | 0.0 |
| Total | 0 (0.0%) | 0.0 |
Fertility by Age by Marriage Status in Aguanga
| Age Bracket | Married | Unmarried |
| 15 to 19 years | 0 (0.0%) | 0 (0.0%) |
| 20 to 34 years | 0 (0.0%) | 0 (0.0%) |
| 35 to 50 years | 0 (0.0%) | 0 (0.0%) |
| Total | 0 (0.0%) | 0 (0.0%) |
Fertility by Education in Aguanga
| Educational Attainment | Women with Births | Births / 1,000 Women |
| Less than High School | 0 (0.0%) | 0.0 |
| High School Diploma | 0 (0.0%) | 0.0 |
| College or Associate's Degree | 0 (0.0%) | 0.0 |
| Bachelor's Degree | 0 (0.0%) | 0.0 |
| Graduate Degree | 0 (0.0%) | 0.0 |
| Total | 0 (0.0%) | 0.0 |
Fertility by Education by Marriage Status in Aguanga
| Educational Attainment | Married | Unmarried |
| Less than High School | 0 (0.0%) | 0 (0.0%) |
| High School Diploma | 0 (0.0%) | 0 (0.0%) |
| College or Associate's Degree | 0 (0.0%) | 0 (0.0%) |
| Bachelor's Degree | 0 (0.0%) | 0 (0.0%) |
| Graduate Degree | 0 (0.0%) | 0 (0.0%) |
| Total | 0 (0.0%) | 0 (0.0%) |
Employment Characteristics in Aguanga
Employment by Class of Employer in Aguanga
Among the 178 employed individuals in Aguanga, private company employees (133 | 74.7%), self-employed (incorporated) (19 | 10.7%), and self-employed (not incorporated) (13 | 7.3%) make up the most common classes of employment.
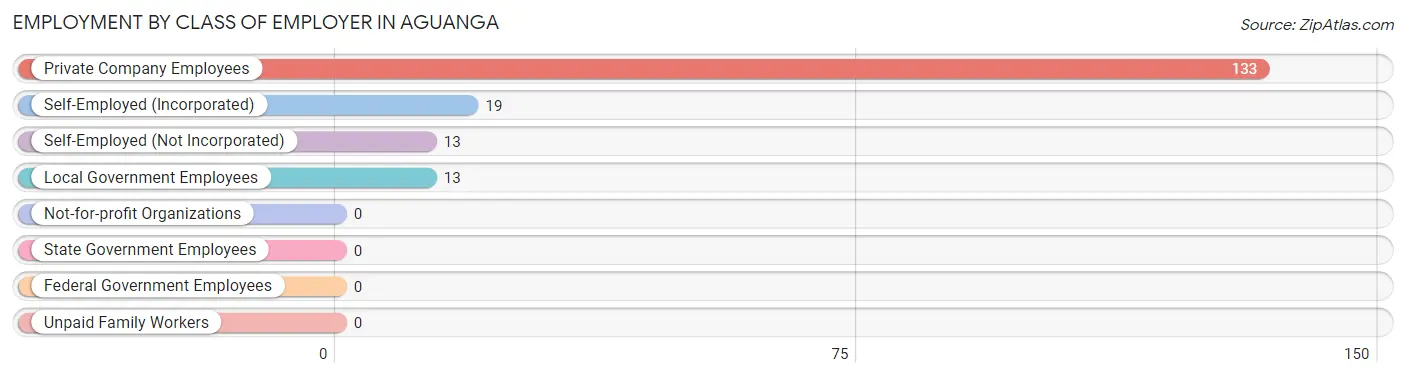
| Employer Class | # Employees | % Employees |
| Private Company Employees | 133 | 74.7% |
| Self-Employed (Incorporated) | 19 | 10.7% |
| Self-Employed (Not Incorporated) | 13 | 7.3% |
| Not-for-profit Organizations | 0 | 0.0% |
| Local Government Employees | 13 | 7.3% |
| State Government Employees | 0 | 0.0% |
| Federal Government Employees | 0 | 0.0% |
| Unpaid Family Workers | 0 | 0.0% |
| Total | 178 | 100.0% |
Employment Status by Age in Aguanga
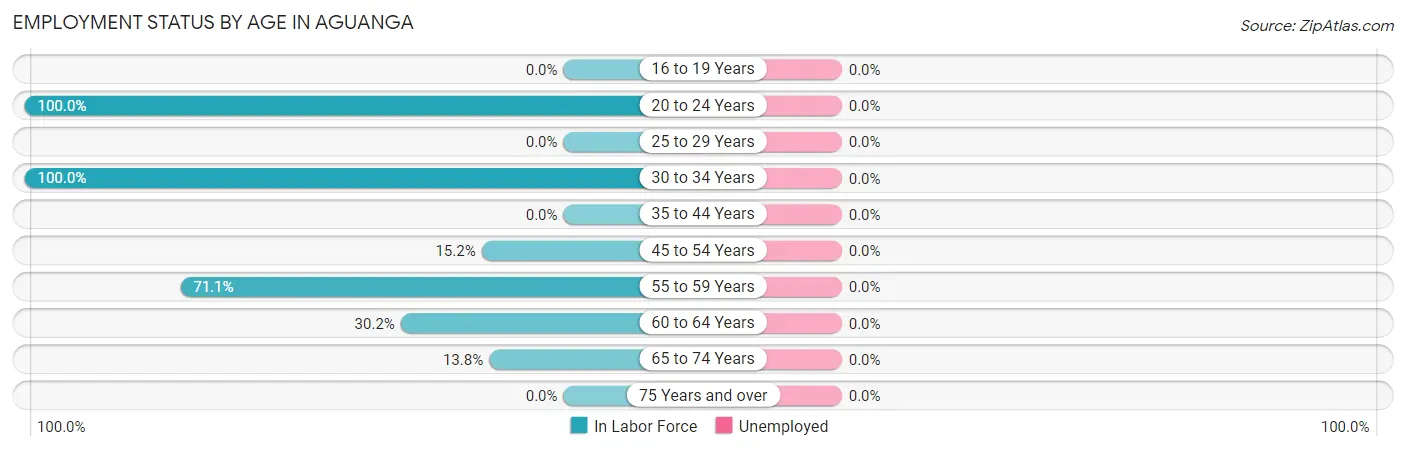
| Age Bracket | In Labor Force | Unemployed |
| 16 to 19 Years | 0 (0.0%) | 0 (0.0%) |
| 20 to 24 Years | 45 (100.0%) | 0 (0.0%) |
| 25 to 29 Years | 0 (0.0%) | 0 (0.0%) |
| 30 to 34 Years | 46 (100.0%) | 0 (0.0%) |
| 35 to 44 Years | 0 (0.0%) | 0 (0.0%) |
| 45 to 54 Years | 15 (15.2%) | 0 (0.0%) |
| 55 to 59 Years | 27 (71.1%) | 0 (0.0%) |
| 60 to 64 Years | 32 (30.2%) | 0 (0.0%) |
| 65 to 74 Years | 13 (13.8%) | 0 (0.0%) |
| 75 Years and over | 0 (0.0%) | 0 (0.0%) |
| Total | 178 (37.2%) | 0 (0.0%) |
Employment Status by Educational Attainment in Aguanga
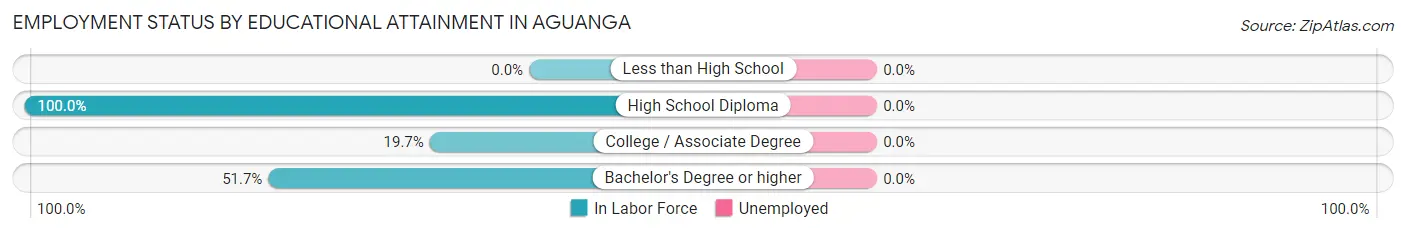
| Educational Attainment | In Labor Force | Unemployed |
| Less than High School | 0 (0.0%) | 0 (0.0%) |
| High School Diploma | 46 (100.0%) | 0 (0.0%) |
| College / Associate Degree | 28 (19.7%) | 0 (0.0%) |
| Bachelor's Degree or higher | 46 (51.7%) | 0 (0.0%) |
| Total | 120 (41.5%) | 0 (0.0%) |
Employment Occupations by Sex in Aguanga
Management, Business, Science and Arts Occupations
The most common Management, Business, Science and Arts occupations in Aguanga are Health Diagnosing & Treating (28 | 15.7%), Health Technologists (28 | 15.7%), and Management (27 | 15.2%).
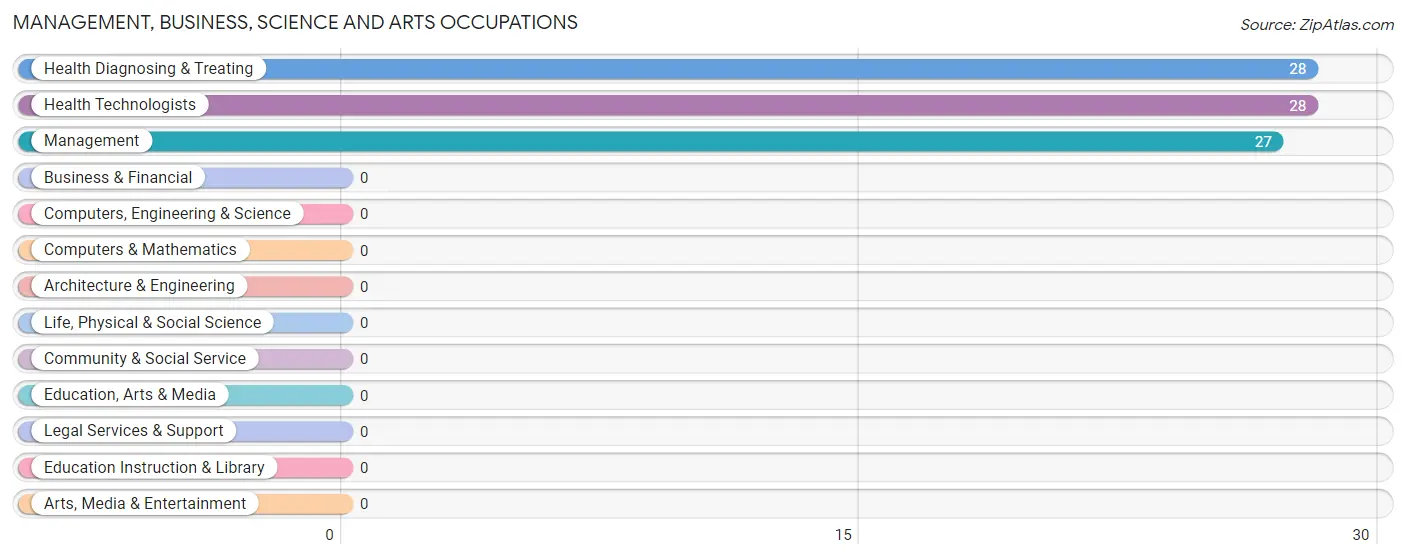
Management, Business, Science and Arts Occupations by Sex
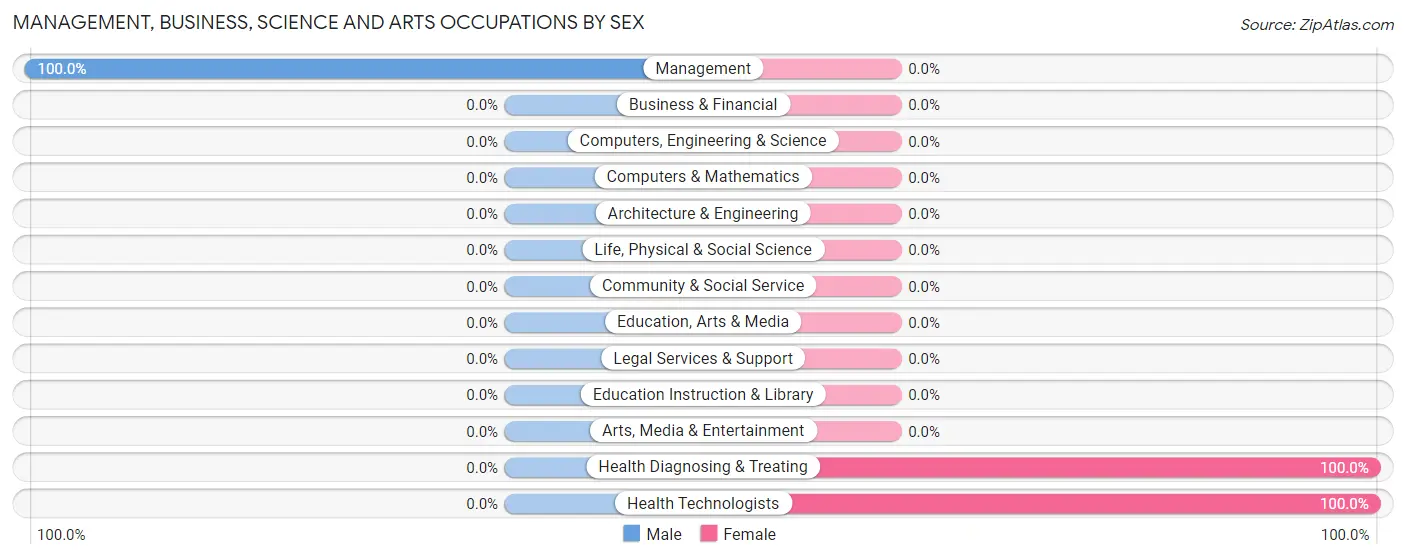
| Occupation | Male | Female |
| Management | 27 (100.0%) | 0 (0.0%) |
| Business & Financial | 0 (0.0%) | 0 (0.0%) |
| Computers, Engineering & Science | 0 (0.0%) | 0 (0.0%) |
| Computers & Mathematics | 0 (0.0%) | 0 (0.0%) |
| Architecture & Engineering | 0 (0.0%) | 0 (0.0%) |
| Life, Physical & Social Science | 0 (0.0%) | 0 (0.0%) |
| Community & Social Service | 0 (0.0%) | 0 (0.0%) |
| Education, Arts & Media | 0 (0.0%) | 0 (0.0%) |
| Legal Services & Support | 0 (0.0%) | 0 (0.0%) |
| Education Instruction & Library | 0 (0.0%) | 0 (0.0%) |
| Arts, Media & Entertainment | 0 (0.0%) | 0 (0.0%) |
| Health Diagnosing & Treating | 0 (0.0%) | 28 (100.0%) |
| Health Technologists | 0 (0.0%) | 28 (100.0%) |
| Total (Category) | 27 (49.1%) | 28 (50.9%) |
| Total (Overall) | 104 (58.4%) | 74 (41.6%) |
Services Occupations
The most common Services occupations in Aguanga are Cleaning & Maintenance (46 | 25.8%), and Personal Care & Service (13 | 7.3%).
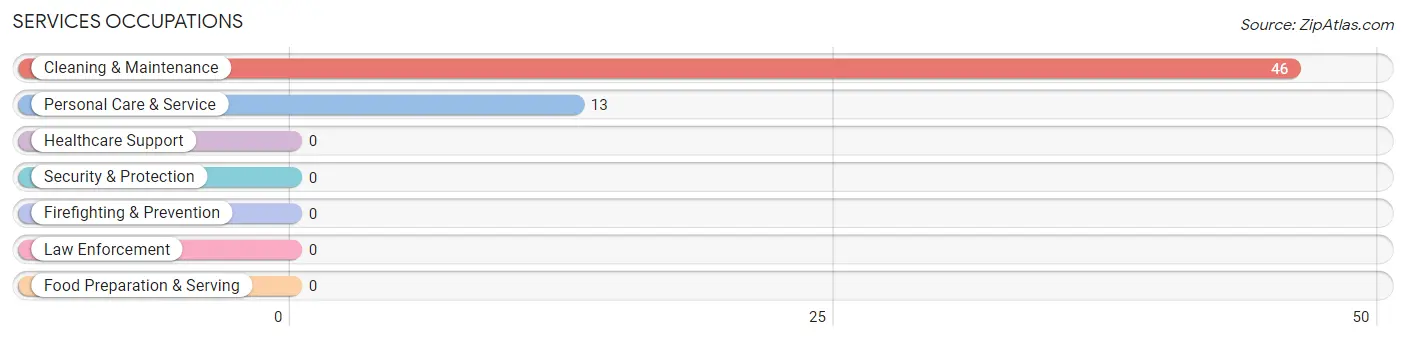
Services Occupations by Sex
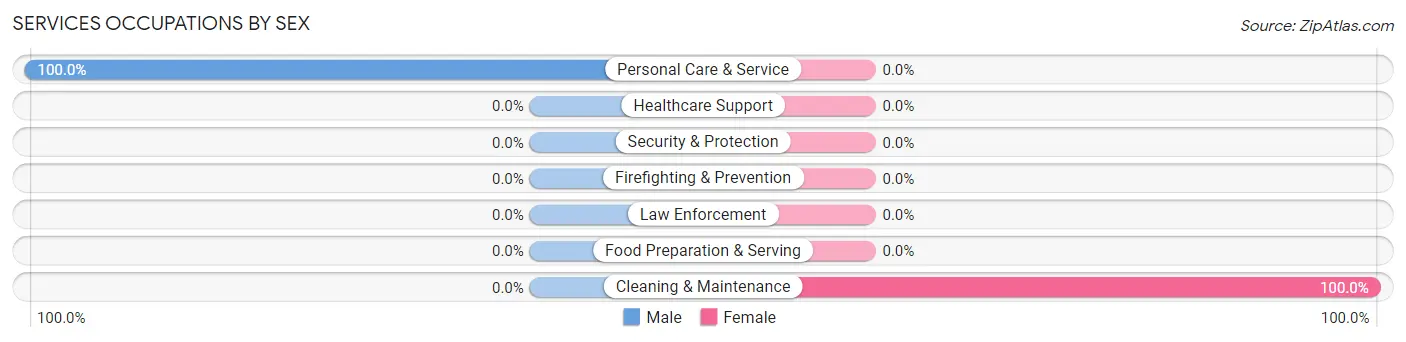
| Occupation | Male | Female |
| Healthcare Support | 0 (0.0%) | 0 (0.0%) |
| Security & Protection | 0 (0.0%) | 0 (0.0%) |
| Firefighting & Prevention | 0 (0.0%) | 0 (0.0%) |
| Law Enforcement | 0 (0.0%) | 0 (0.0%) |
| Food Preparation & Serving | 0 (0.0%) | 0 (0.0%) |
| Cleaning & Maintenance | 0 (0.0%) | 46 (100.0%) |
| Personal Care & Service | 13 (100.0%) | 0 (0.0%) |
| Total (Category) | 13 (22.0%) | 46 (78.0%) |
| Total (Overall) | 104 (58.4%) | 74 (41.6%) |
Sales and Office Occupations
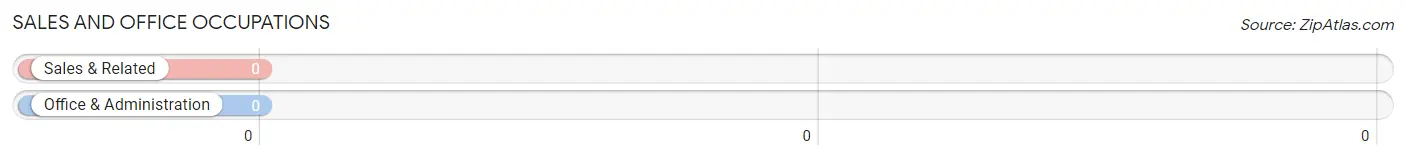
Sales and Office Occupations by Sex
| Occupation | Male | Female |
| Sales & Related | 0 (0.0%) | 0 (0.0%) |
| Office & Administration | 0 (0.0%) | 0 (0.0%) |
| Total (Category) | 0 (0.0%) | 0 (0.0%) |
| Total (Overall) | 104 (58.4%) | 74 (41.6%) |
Natural Resources, Construction and Maintenance Occupations
The most common Natural Resources, Construction and Maintenance occupations in Aguanga are , and Construction & Extraction (43 | 24.2%).
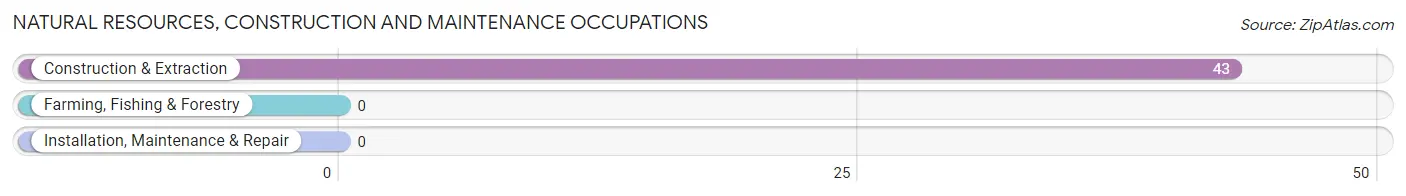
Natural Resources, Construction and Maintenance Occupations by Sex
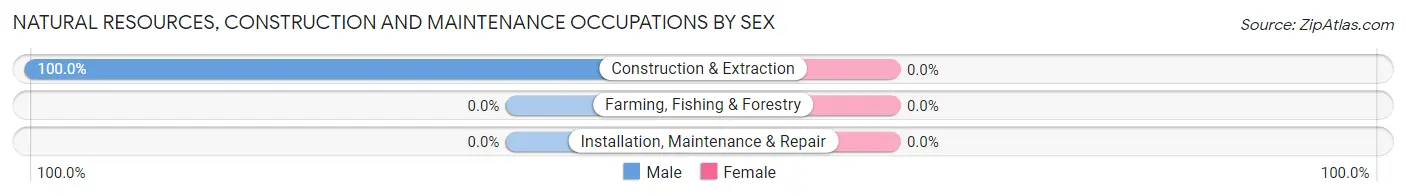
| Occupation | Male | Female |
| Farming, Fishing & Forestry | 0 (0.0%) | 0 (0.0%) |
| Construction & Extraction | 43 (100.0%) | 0 (0.0%) |
| Installation, Maintenance & Repair | 0 (0.0%) | 0 (0.0%) |
| Total (Category) | 43 (100.0%) | 0 (0.0%) |
| Total (Overall) | 104 (58.4%) | 74 (41.6%) |
Production, Transportation and Moving Occupations
The most common Production, Transportation and Moving occupations in Aguanga are , and Material Moving (21 | 11.8%).
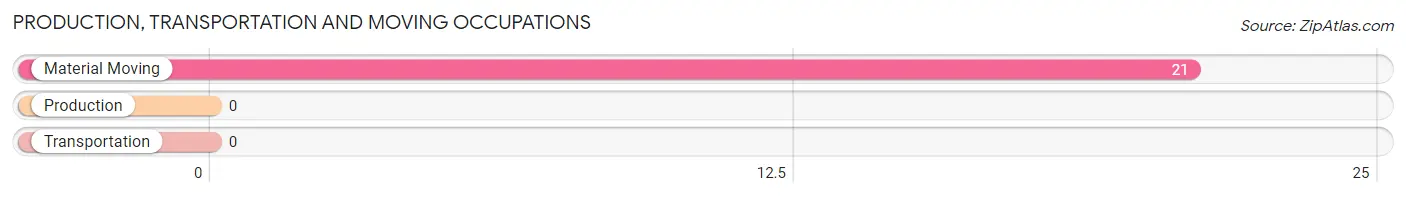
Production, Transportation and Moving Occupations by Sex
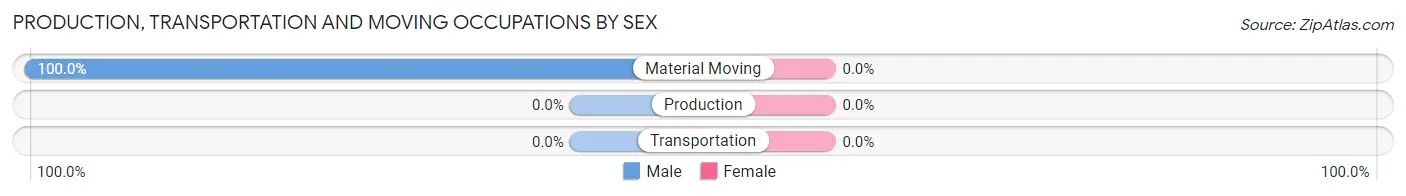
| Occupation | Male | Female |
| Production | 0 (0.0%) | 0 (0.0%) |
| Transportation | 0 (0.0%) | 0 (0.0%) |
| Material Moving | 21 (100.0%) | 0 (0.0%) |
| Total (Category) | 21 (100.0%) | 0 (0.0%) |
| Total (Overall) | 104 (58.4%) | 74 (41.6%) |
Employment Industries by Sex in Aguanga
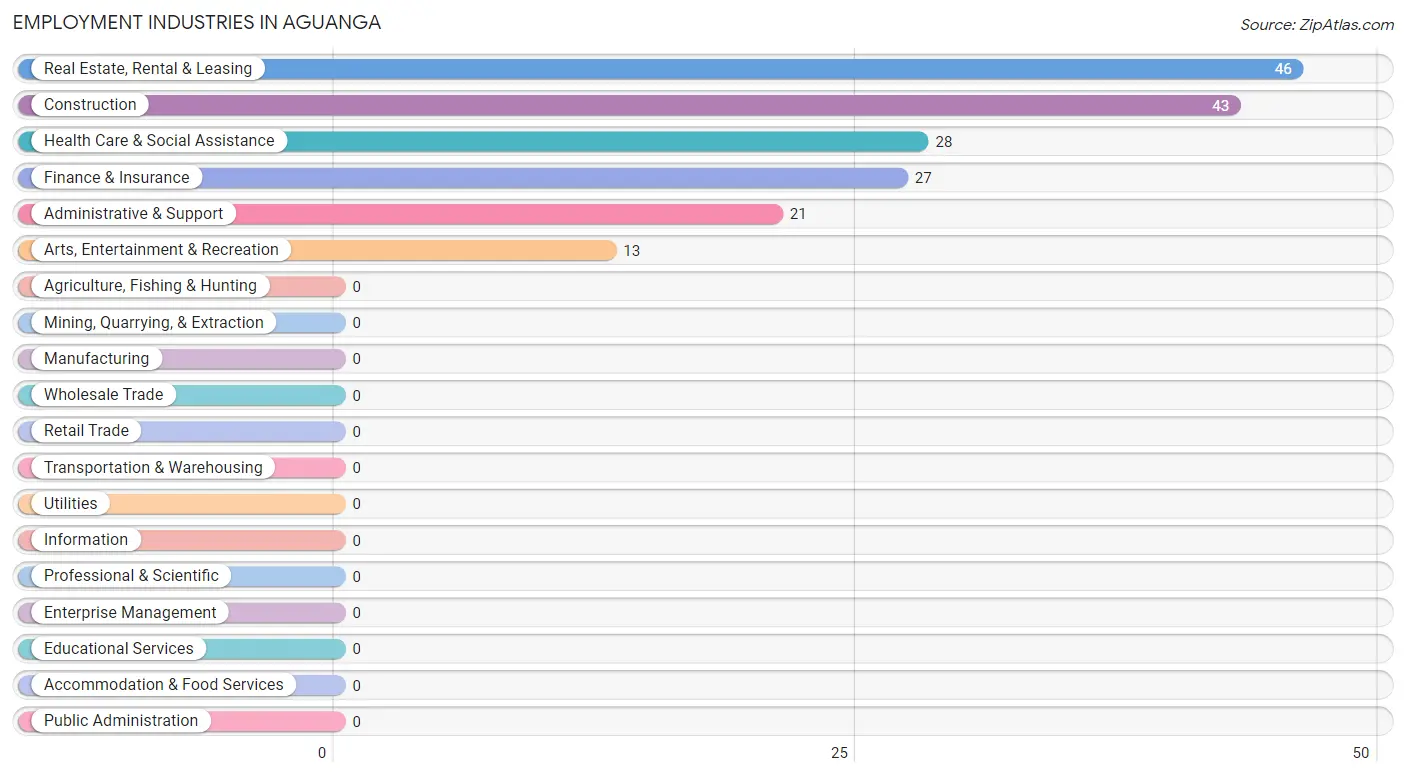
Employment Industries in Aguanga
The major employment industries in Aguanga include Real Estate, Rental & Leasing (46 | 25.8%), Construction (43 | 24.2%), Health Care & Social Assistance (28 | 15.7%), Finance & Insurance (27 | 15.2%), and Administrative & Support (21 | 11.8%).
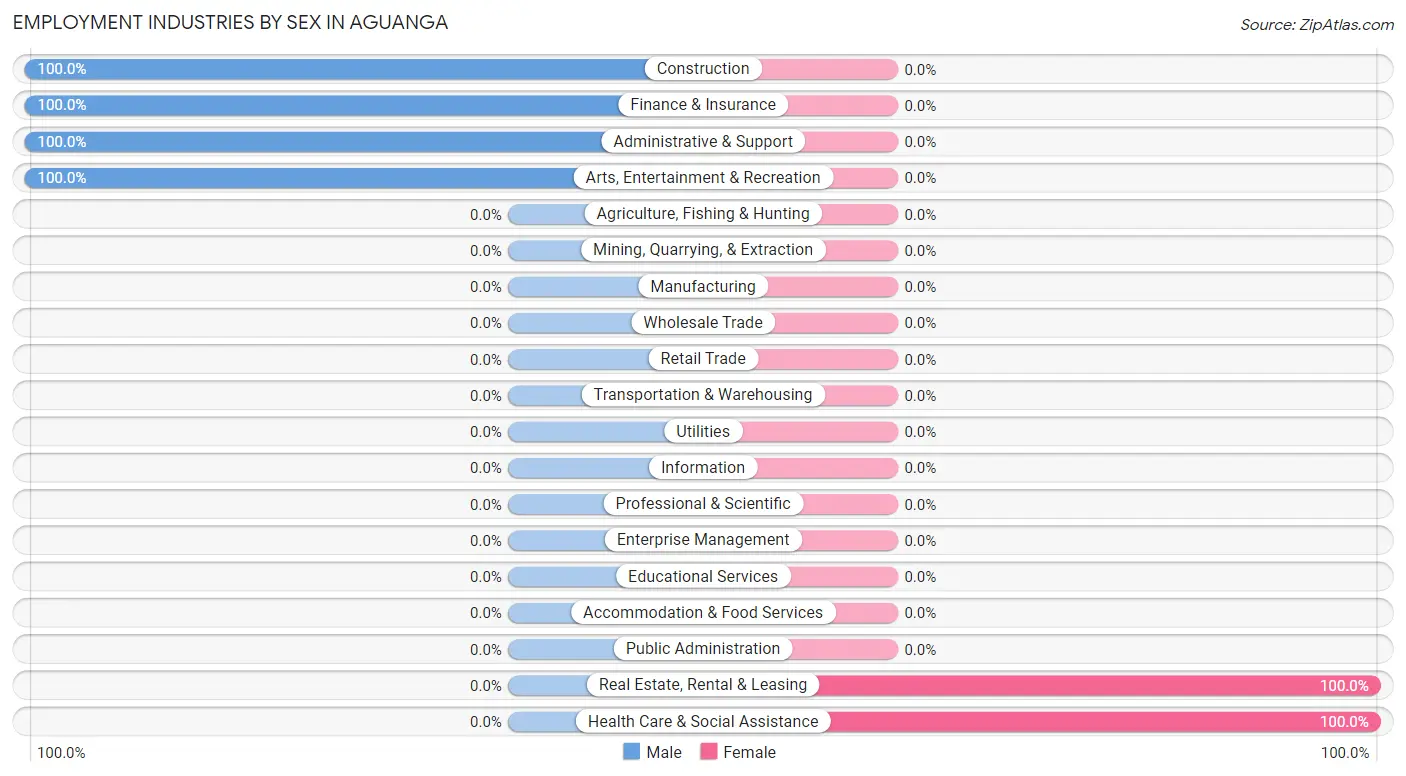
Employment Industries by Sex in Aguanga
The Aguanga industries that see more men than women are Construction (100.0%), Finance & Insurance (100.0%), and Administrative & Support (100.0%), whereas the industries that tend to have a higher number of women are Real Estate, Rental & Leasing (100.0%), and Health Care & Social Assistance (100.0%).
| Industry | Male | Female |
| Agriculture, Fishing & Hunting | 0 (0.0%) | 0 (0.0%) |
| Mining, Quarrying, & Extraction | 0 (0.0%) | 0 (0.0%) |
| Construction | 43 (100.0%) | 0 (0.0%) |
| Manufacturing | 0 (0.0%) | 0 (0.0%) |
| Wholesale Trade | 0 (0.0%) | 0 (0.0%) |
| Retail Trade | 0 (0.0%) | 0 (0.0%) |
| Transportation & Warehousing | 0 (0.0%) | 0 (0.0%) |
| Utilities | 0 (0.0%) | 0 (0.0%) |
| Information | 0 (0.0%) | 0 (0.0%) |
| Finance & Insurance | 27 (100.0%) | 0 (0.0%) |
| Real Estate, Rental & Leasing | 0 (0.0%) | 46 (100.0%) |
| Professional & Scientific | 0 (0.0%) | 0 (0.0%) |
| Enterprise Management | 0 (0.0%) | 0 (0.0%) |
| Administrative & Support | 21 (100.0%) | 0 (0.0%) |
| Educational Services | 0 (0.0%) | 0 (0.0%) |
| Health Care & Social Assistance | 0 (0.0%) | 28 (100.0%) |
| Arts, Entertainment & Recreation | 13 (100.0%) | 0 (0.0%) |
| Accommodation & Food Services | 0 (0.0%) | 0 (0.0%) |
| Public Administration | 0 (0.0%) | 0 (0.0%) |
| Total | 104 (58.4%) | 74 (41.6%) |
Education in Aguanga
School Enrollment in Aguanga
The most common levels of schooling among the 125 students in Aguanga are kindergarten (51 | 40.8%), elementary school (50 | 40.0%), and middle school (24 | 19.2%).
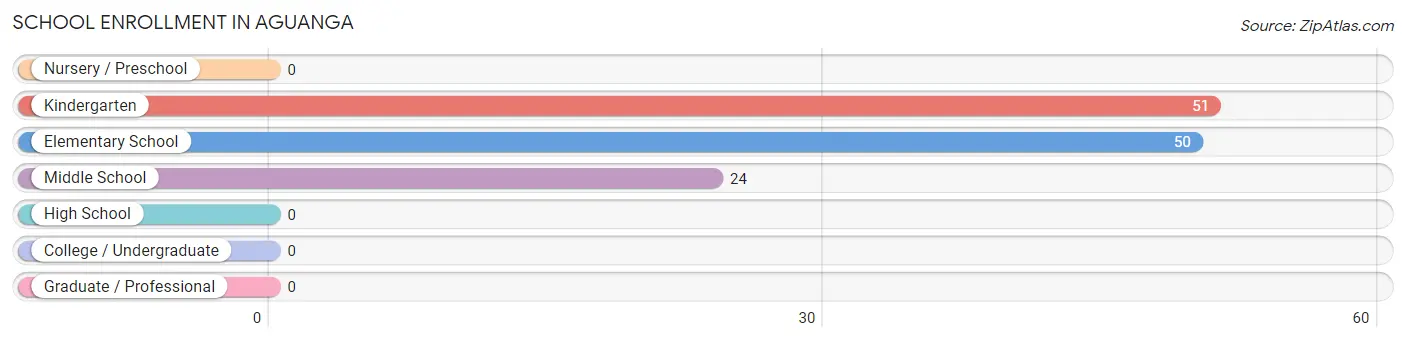
| School Level | # Students | % Students |
| Nursery / Preschool | 0 | 0.0% |
| Kindergarten | 51 | 40.8% |
| Elementary School | 50 | 40.0% |
| Middle School | 24 | 19.2% |
| High School | 0 | 0.0% |
| College / Undergraduate | 0 | 0.0% |
| Graduate / Professional | 0 | 0.0% |
| Total | 125 | 100.0% |
School Enrollment by Age by Funding Source in Aguanga
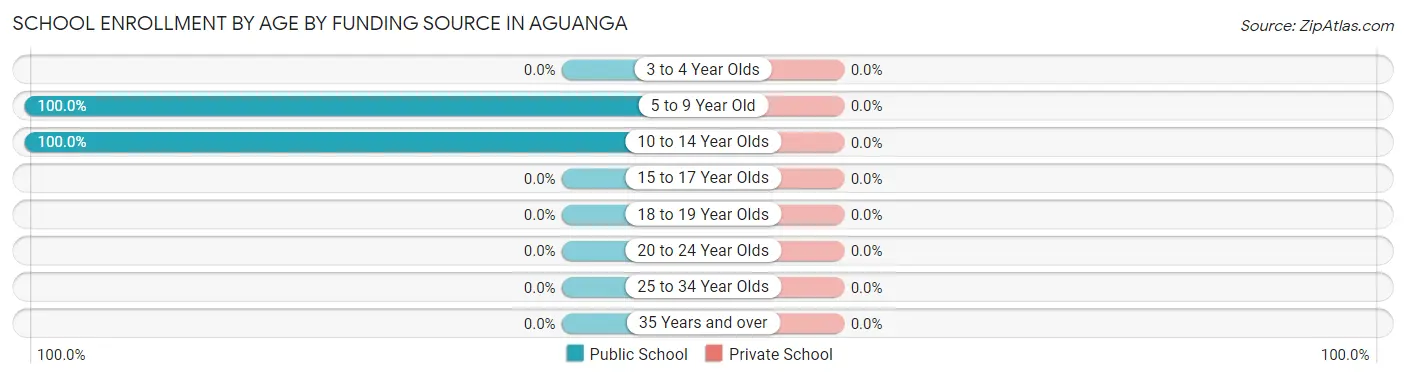
| Age Bracket | Public School | Private School |
| 3 to 4 Year Olds | 0 (0.0%) | 0 (0.0%) |
| 5 to 9 Year Old | 101 (100.0%) | 0 (0.0%) |
| 10 to 14 Year Olds | 24 (100.0%) | 0 (0.0%) |
| 15 to 17 Year Olds | 0 (0.0%) | 0 (0.0%) |
| 18 to 19 Year Olds | 0 (0.0%) | 0 (0.0%) |
| 20 to 24 Year Olds | 0 (0.0%) | 0 (0.0%) |
| 25 to 34 Year Olds | 0 (0.0%) | 0 (0.0%) |
| 35 Years and over | 0 (0.0%) | 0 (0.0%) |
| Total | 125 (100.0%) | 0 (0.0%) |
Educational Attainment by Field of Study in Aguanga
Liberal arts & history (43 | 34.4%), psychology (28 | 22.4%), literature & languages (27 | 21.6%), bio, nature & agricultural (19 | 15.2%), and science & technology (8 | 6.4%) are the most common fields of study among 125 individuals in Aguanga who have obtained a bachelor's degree or higher.
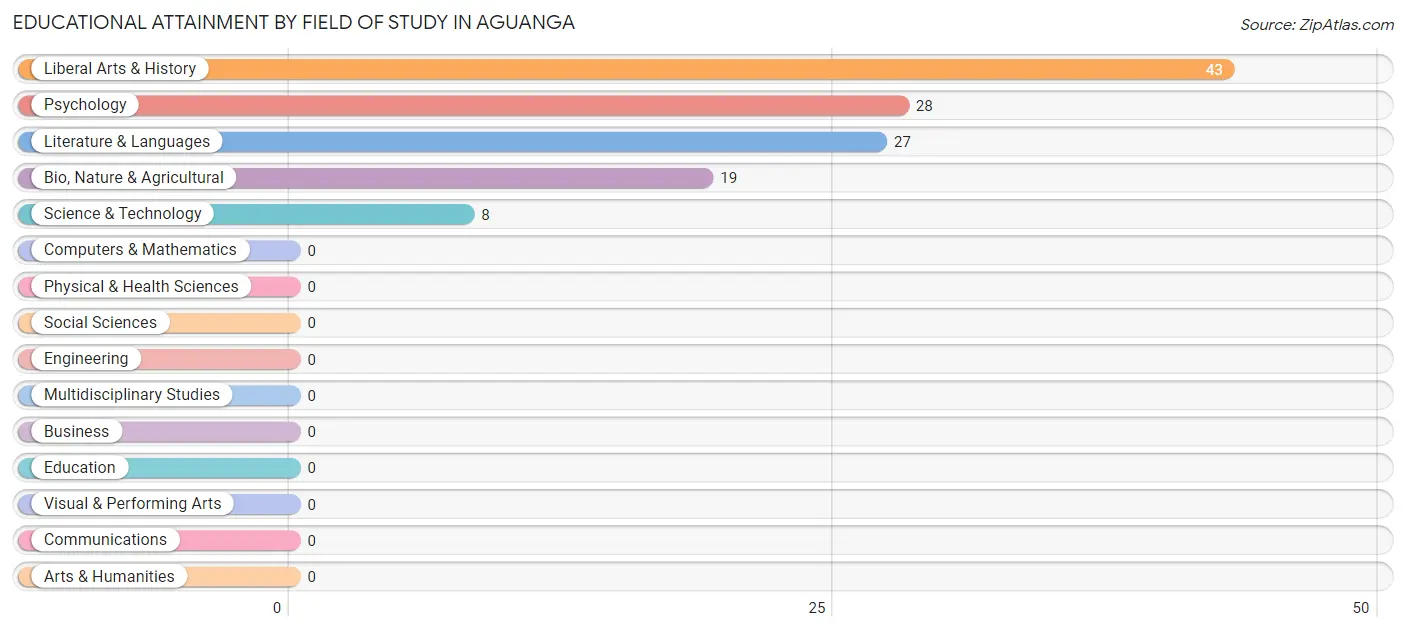
| Field of Study | # Graduates | % Graduates |
| Computers & Mathematics | 0 | 0.0% |
| Bio, Nature & Agricultural | 19 | 15.2% |
| Physical & Health Sciences | 0 | 0.0% |
| Psychology | 28 | 22.4% |
| Social Sciences | 0 | 0.0% |
| Engineering | 0 | 0.0% |
| Multidisciplinary Studies | 0 | 0.0% |
| Science & Technology | 8 | 6.4% |
| Business | 0 | 0.0% |
| Education | 0 | 0.0% |
| Literature & Languages | 27 | 21.6% |
| Liberal Arts & History | 43 | 34.4% |
| Visual & Performing Arts | 0 | 0.0% |
| Communications | 0 | 0.0% |
| Arts & Humanities | 0 | 0.0% |
| Total | 125 | 100.0% |
Transportation & Commute in Aguanga
Vehicle Availability by Sex in Aguanga
The most prevalent vehicle ownership categories in Aguanga are males with 1 vehicle (59, accounting for 56.7%) and females with 1 vehicle (46, making up 79.7%).
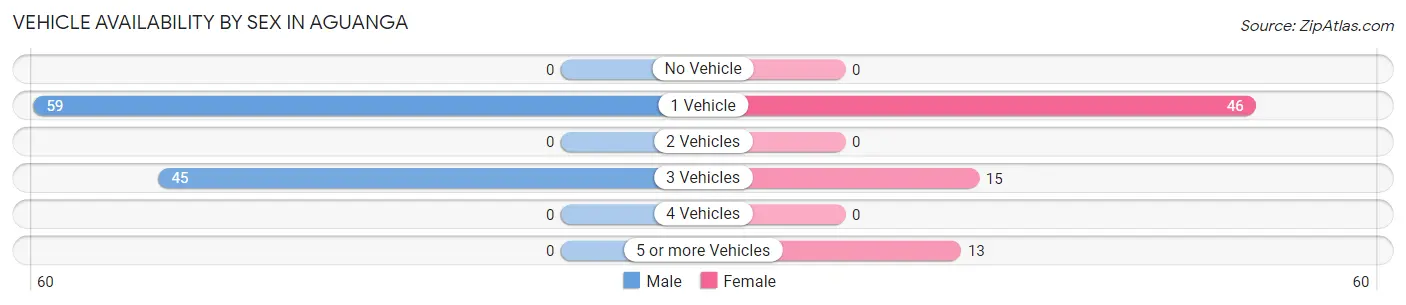
| Vehicles Available | Male | Female |
| No Vehicle | 0 (0.0%) | 0 (0.0%) |
| 1 Vehicle | 59 (56.7%) | 46 (62.2%) |
| 2 Vehicles | 0 (0.0%) | 0 (0.0%) |
| 3 Vehicles | 45 (43.3%) | 15 (20.3%) |
| 4 Vehicles | 0 (0.0%) | 0 (0.0%) |
| 5 or more Vehicles | 0 (0.0%) | 13 (17.6%) |
| Total | 104 (100.0%) | 74 (100.0%) |
Commute Time in Aguanga
The most frequently occuring commute durations in Aguanga are 45 to 59 minutes (67 commuters, 50.8%), 60 to 89 minutes (24 commuters, 18.2%), and 40 to 44 minutes (15 commuters, 11.4%).
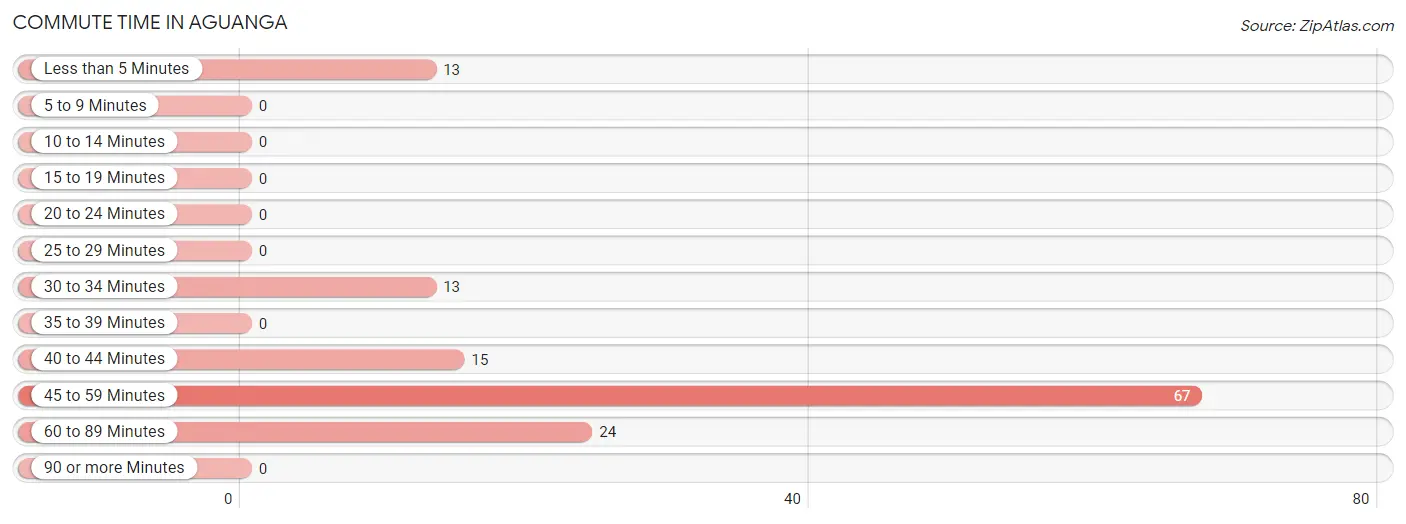
| Commute Time | # Commuters | % Commuters |
| Less than 5 Minutes | 13 | 9.9% |
| 5 to 9 Minutes | 0 | 0.0% |
| 10 to 14 Minutes | 0 | 0.0% |
| 15 to 19 Minutes | 0 | 0.0% |
| 20 to 24 Minutes | 0 | 0.0% |
| 25 to 29 Minutes | 0 | 0.0% |
| 30 to 34 Minutes | 13 | 9.9% |
| 35 to 39 Minutes | 0 | 0.0% |
| 40 to 44 Minutes | 15 | 11.4% |
| 45 to 59 Minutes | 67 | 50.8% |
| 60 to 89 Minutes | 24 | 18.2% |
| 90 or more Minutes | 0 | 0.0% |
Commute Time by Sex in Aguanga
The most common commute times in Aguanga are 60 to 89 minutes (24 commuters, 41.4%) for males and 45 to 59 minutes (46 commuters, 62.2%) for females.
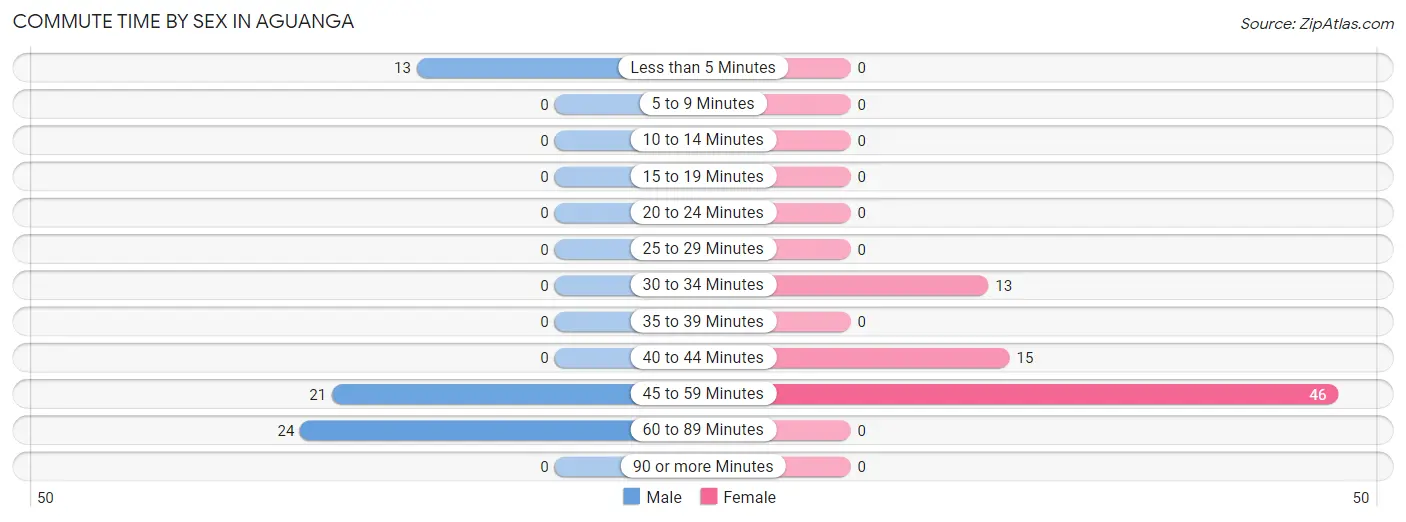
| Commute Time | Male | Female |
| Less than 5 Minutes | 13 (22.4%) | 0 (0.0%) |
| 5 to 9 Minutes | 0 (0.0%) | 0 (0.0%) |
| 10 to 14 Minutes | 0 (0.0%) | 0 (0.0%) |
| 15 to 19 Minutes | 0 (0.0%) | 0 (0.0%) |
| 20 to 24 Minutes | 0 (0.0%) | 0 (0.0%) |
| 25 to 29 Minutes | 0 (0.0%) | 0 (0.0%) |
| 30 to 34 Minutes | 0 (0.0%) | 13 (17.6%) |
| 35 to 39 Minutes | 0 (0.0%) | 0 (0.0%) |
| 40 to 44 Minutes | 0 (0.0%) | 15 (20.3%) |
| 45 to 59 Minutes | 21 (36.2%) | 46 (62.2%) |
| 60 to 89 Minutes | 24 (41.4%) | 0 (0.0%) |
| 90 or more Minutes | 0 (0.0%) | 0 (0.0%) |
Time of Departure to Work by Sex in Aguanga
The most frequent times of departure to work in Aguanga are 9:00 AM to 9:59 AM (24, 41.4%) for males and 6:30 AM to 6:59 AM (46, 62.2%) for females.
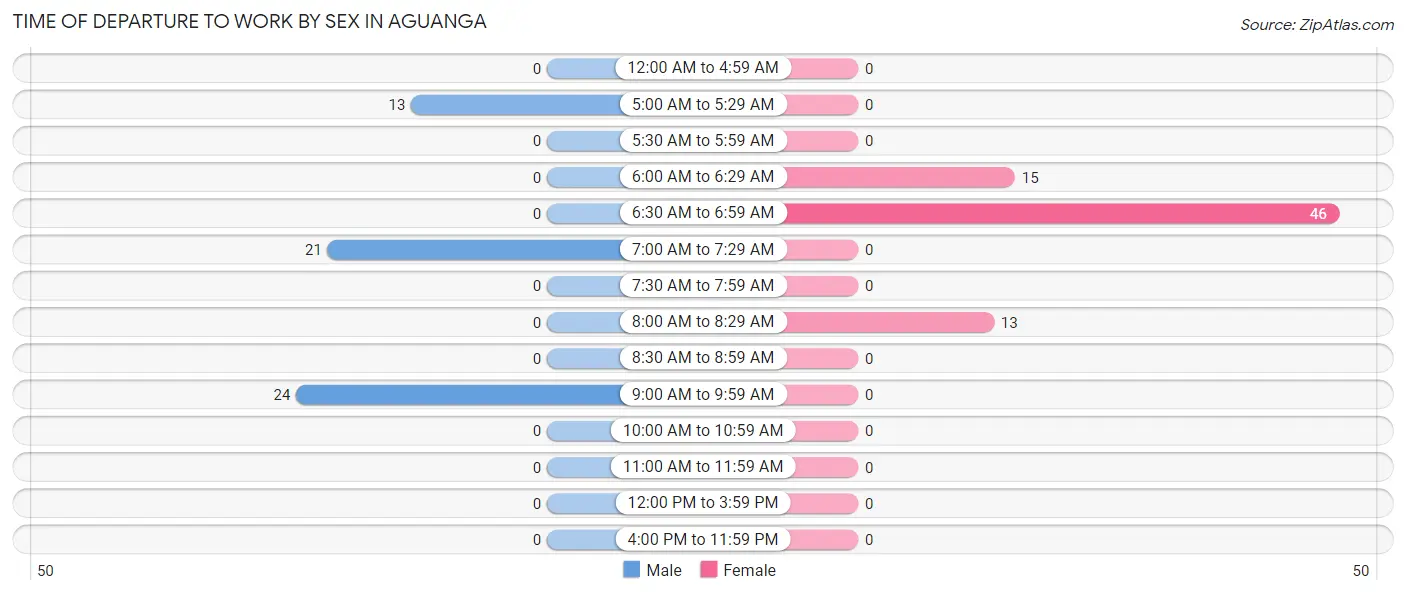
| Time of Departure | Male | Female |
| 12:00 AM to 4:59 AM | 0 (0.0%) | 0 (0.0%) |
| 5:00 AM to 5:29 AM | 13 (22.4%) | 0 (0.0%) |
| 5:30 AM to 5:59 AM | 0 (0.0%) | 0 (0.0%) |
| 6:00 AM to 6:29 AM | 0 (0.0%) | 15 (20.3%) |
| 6:30 AM to 6:59 AM | 0 (0.0%) | 46 (62.2%) |
| 7:00 AM to 7:29 AM | 21 (36.2%) | 0 (0.0%) |
| 7:30 AM to 7:59 AM | 0 (0.0%) | 0 (0.0%) |
| 8:00 AM to 8:29 AM | 0 (0.0%) | 13 (17.6%) |
| 8:30 AM to 8:59 AM | 0 (0.0%) | 0 (0.0%) |
| 9:00 AM to 9:59 AM | 24 (41.4%) | 0 (0.0%) |
| 10:00 AM to 10:59 AM | 0 (0.0%) | 0 (0.0%) |
| 11:00 AM to 11:59 AM | 0 (0.0%) | 0 (0.0%) |
| 12:00 PM to 3:59 PM | 0 (0.0%) | 0 (0.0%) |
| 4:00 PM to 11:59 PM | 0 (0.0%) | 0 (0.0%) |
| Total | 58 (100.0%) | 74 (100.0%) |
Housing Occupancy in Aguanga
Occupancy by Ownership in Aguanga
Of the total 247 dwellings in Aguanga, owner-occupied units account for 201 (81.4%), while renter-occupied units make up 46 (18.6%).
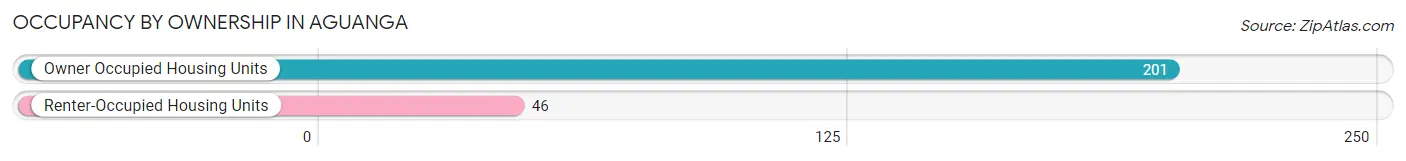
| Occupancy | # Housing Units | % Housing Units |
| Owner Occupied Housing Units | 201 | 81.4% |
| Renter-Occupied Housing Units | 46 | 18.6% |
| Total Occupied Housing Units | 247 | 100.0% |
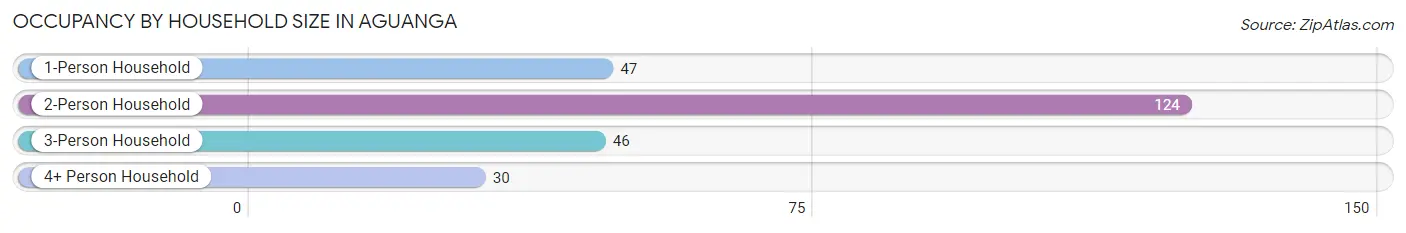
Occupancy by Household Size in Aguanga
| Household Size | # Housing Units | % Housing Units |
| 1-Person Household | 47 | 19.0% |
| 2-Person Household | 124 | 50.2% |
| 3-Person Household | 46 | 18.6% |
| 4+ Person Household | 30 | 12.1% |
| Total Housing Units | 247 | 100.0% |
Occupancy by Ownership by Household Size in Aguanga
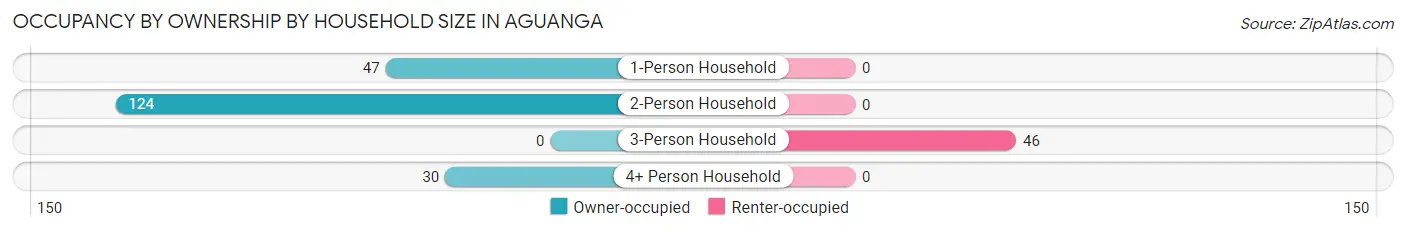
| Household Size | Owner-occupied | Renter-occupied |
| 1-Person Household | 47 (100.0%) | 0 (0.0%) |
| 2-Person Household | 124 (100.0%) | 0 (0.0%) |
| 3-Person Household | 0 (0.0%) | 46 (100.0%) |
| 4+ Person Household | 30 (100.0%) | 0 (0.0%) |
| Total Housing Units | 201 (81.4%) | 46 (18.6%) |
Occupancy by Educational Attainment in Aguanga
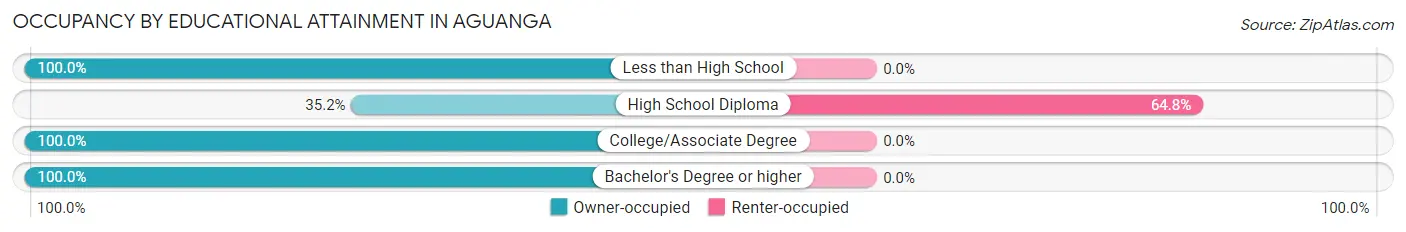
| Household Size | Owner-occupied | Renter-occupied |
| Less than High School | 12 (100.0%) | 0 (0.0%) |
| High School Diploma | 25 (35.2%) | 46 (64.8%) |
| College/Associate Degree | 90 (100.0%) | 0 (0.0%) |
| Bachelor's Degree or higher | 74 (100.0%) | 0 (0.0%) |
Occupancy by Age of Householder in Aguanga
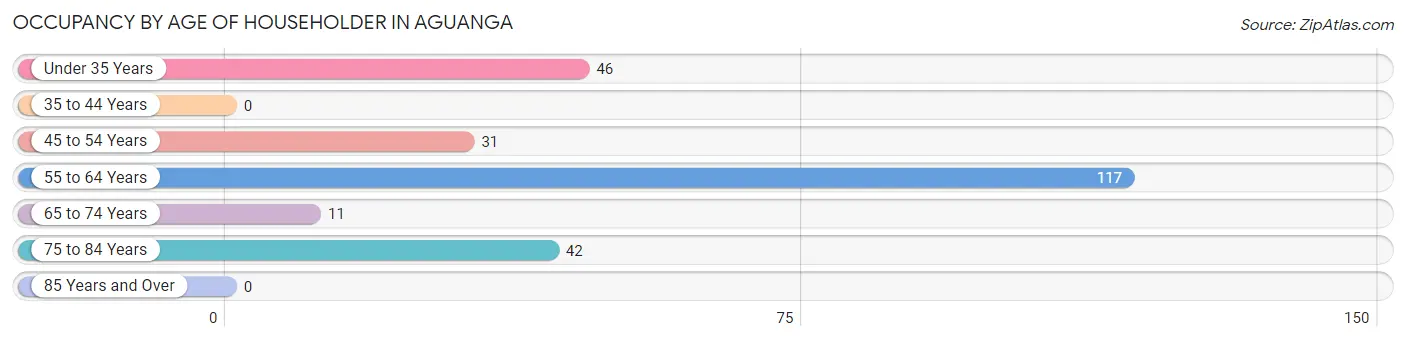
| Age Bracket | # Households | % Households |
| Under 35 Years | 46 | 18.6% |
| 35 to 44 Years | 0 | 0.0% |
| 45 to 54 Years | 31 | 12.6% |
| 55 to 64 Years | 117 | 47.4% |
| 65 to 74 Years | 11 | 4.4% |
| 75 to 84 Years | 42 | 17.0% |
| 85 Years and Over | 0 | 0.0% |
| Total | 247 | 100.0% |
Housing Finances in Aguanga
Median Income by Occupancy in Aguanga
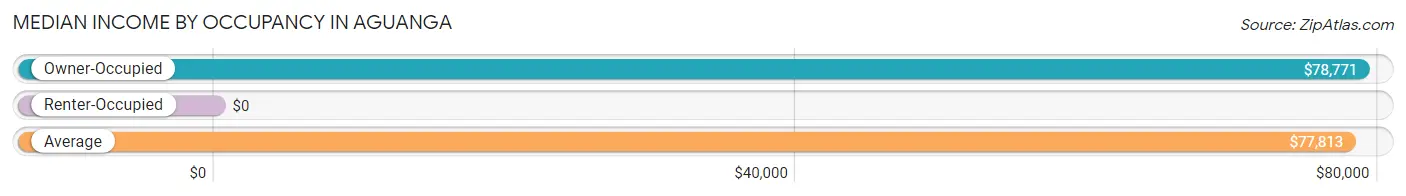
| Occupancy Type | # Households | Median Income |
| Owner-Occupied | 201 (81.4%) | $78,771 |
| Renter-Occupied | 46 (18.6%) | $0 |
| Average | 247 (100.0%) | $77,813 |
Occupancy by Householder Income Bracket in Aguanga
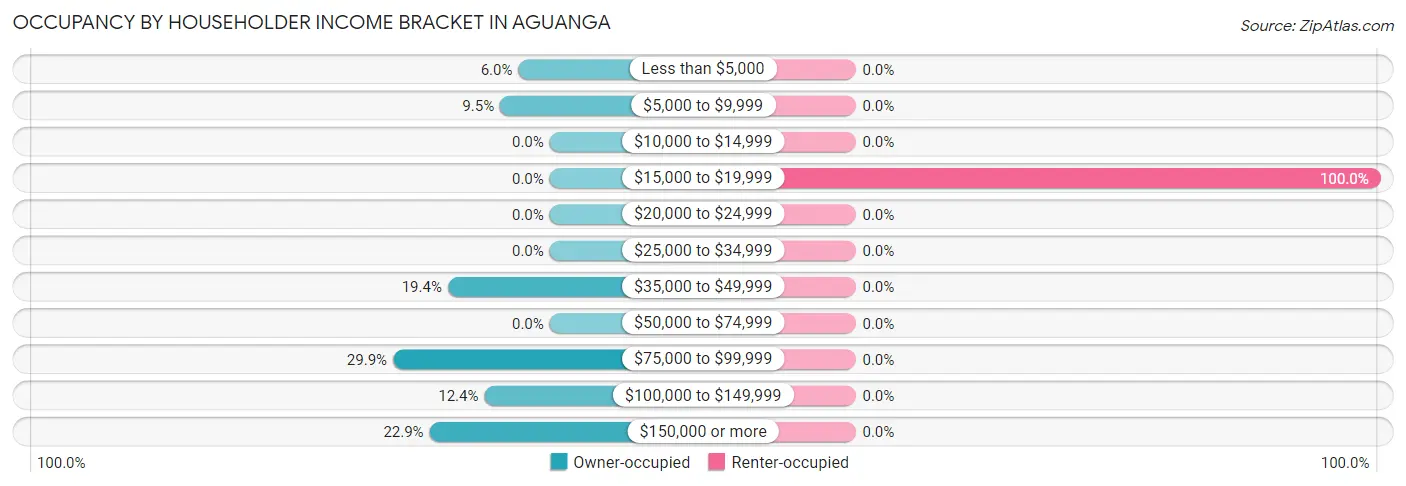
| Income Bracket | Owner-occupied | Renter-occupied |
| Less than $5,000 | 12 (6.0%) | 0 (0.0%) |
| $5,000 to $9,999 | 19 (9.5%) | 0 (0.0%) |
| $10,000 to $14,999 | 0 (0.0%) | 0 (0.0%) |
| $15,000 to $19,999 | 0 (0.0%) | 46 (100.0%) |
| $20,000 to $24,999 | 0 (0.0%) | 0 (0.0%) |
| $25,000 to $34,999 | 0 (0.0%) | 0 (0.0%) |
| $35,000 to $49,999 | 39 (19.4%) | 0 (0.0%) |
| $50,000 to $74,999 | 0 (0.0%) | 0 (0.0%) |
| $75,000 to $99,999 | 60 (29.8%) | 0 (0.0%) |
| $100,000 to $149,999 | 25 (12.4%) | 0 (0.0%) |
| $150,000 or more | 46 (22.9%) | 0 (0.0%) |
| Total | 201 (100.0%) | 46 (100.0%) |
Monthly Housing Cost Tiers in Aguanga
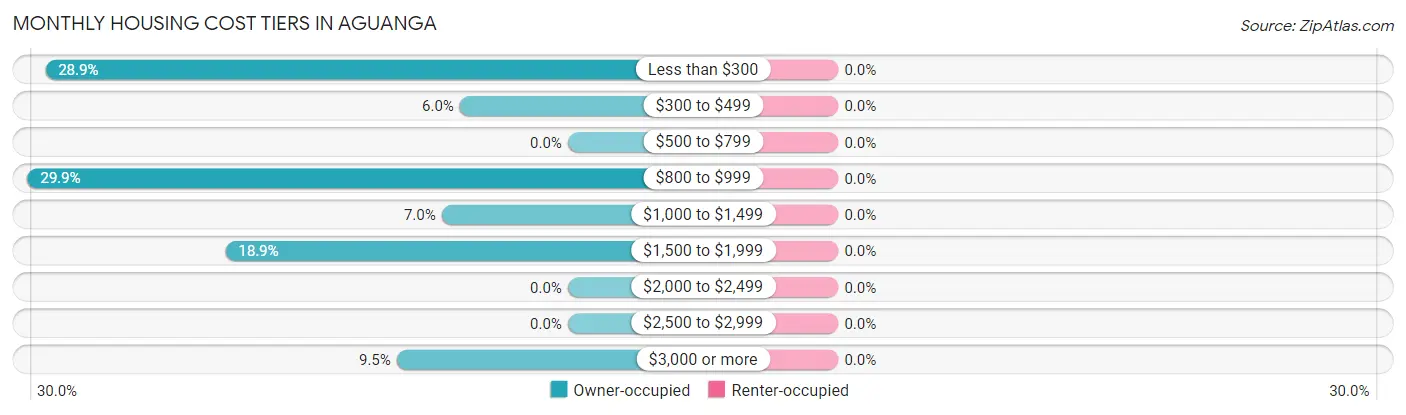
| Monthly Cost | Owner-occupied | Renter-occupied |
| Less than $300 | 58 (28.9%) | 0 (0.0%) |
| $300 to $499 | 12 (6.0%) | 0 (0.0%) |
| $500 to $799 | 0 (0.0%) | 0 (0.0%) |
| $800 to $999 | 60 (29.8%) | 0 (0.0%) |
| $1,000 to $1,499 | 14 (7.0%) | 0 (0.0%) |
| $1,500 to $1,999 | 38 (18.9%) | 0 (0.0%) |
| $2,000 to $2,499 | 0 (0.0%) | 0 (0.0%) |
| $2,500 to $2,999 | 0 (0.0%) | 0 (0.0%) |
| $3,000 or more | 19 (9.5%) | 0 (0.0%) |
| Total | 201 (100.0%) | 46 (100.0%) |
Physical Housing Characteristics in Aguanga
Housing Structures in Aguanga
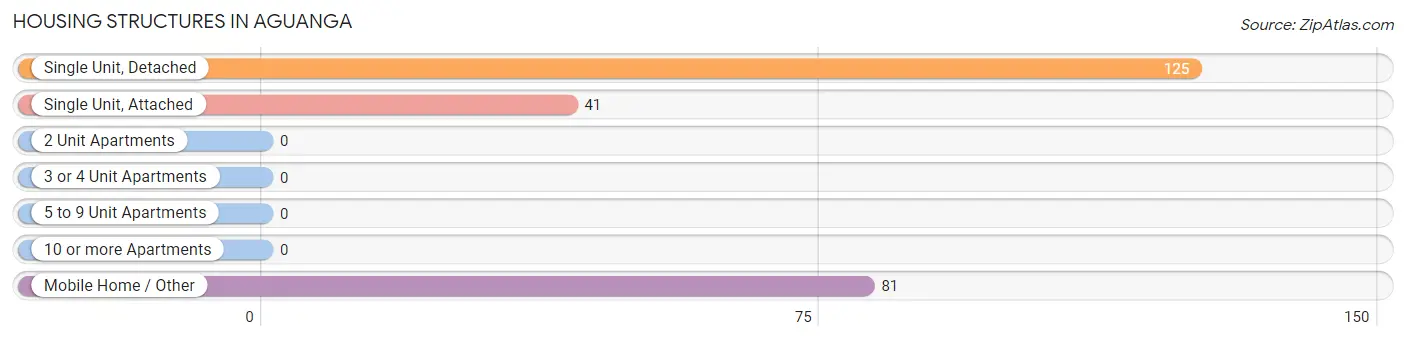
| Structure Type | # Housing Units | % Housing Units |
| Single Unit, Detached | 125 | 50.6% |
| Single Unit, Attached | 41 | 16.6% |
| 2 Unit Apartments | 0 | 0.0% |
| 3 or 4 Unit Apartments | 0 | 0.0% |
| 5 to 9 Unit Apartments | 0 | 0.0% |
| 10 or more Apartments | 0 | 0.0% |
| Mobile Home / Other | 81 | 32.8% |
| Total | 247 | 100.0% |
Housing Structures by Occupancy in Aguanga
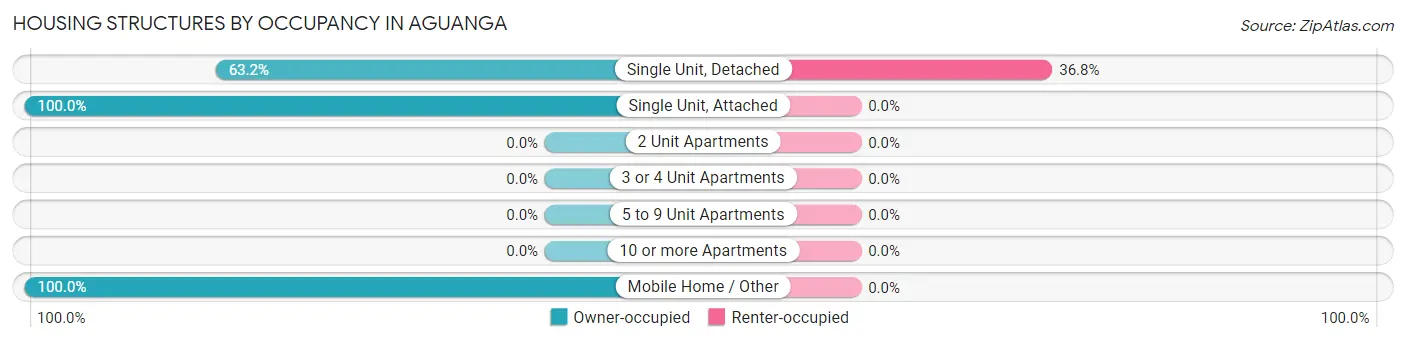
| Structure Type | Owner-occupied | Renter-occupied |
| Single Unit, Detached | 79 (63.2%) | 46 (36.8%) |
| Single Unit, Attached | 41 (100.0%) | 0 (0.0%) |
| 2 Unit Apartments | 0 (0.0%) | 0 (0.0%) |
| 3 or 4 Unit Apartments | 0 (0.0%) | 0 (0.0%) |
| 5 to 9 Unit Apartments | 0 (0.0%) | 0 (0.0%) |
| 10 or more Apartments | 0 (0.0%) | 0 (0.0%) |
| Mobile Home / Other | 81 (100.0%) | 0 (0.0%) |
| Total | 201 (81.4%) | 46 (18.6%) |
Housing Structures by Number of Rooms in Aguanga
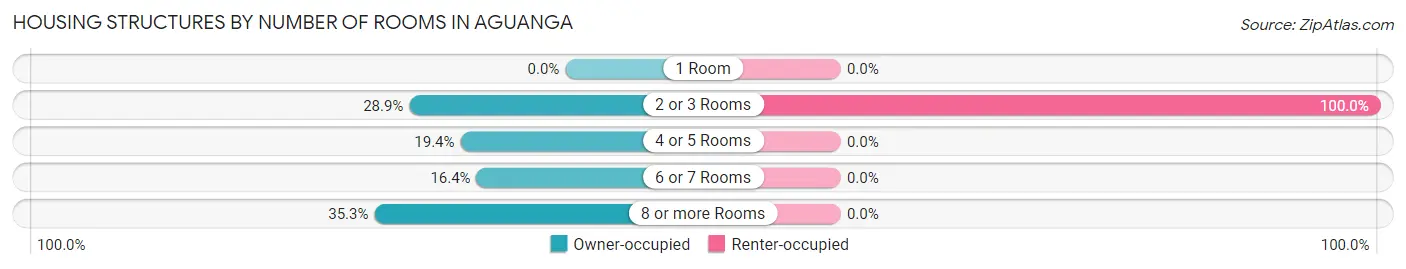
| Number of Rooms | Owner-occupied | Renter-occupied |
| 1 Room | 0 (0.0%) | 0 (0.0%) |
| 2 or 3 Rooms | 58 (28.9%) | 46 (100.0%) |
| 4 or 5 Rooms | 39 (19.4%) | 0 (0.0%) |
| 6 or 7 Rooms | 33 (16.4%) | 0 (0.0%) |
| 8 or more Rooms | 71 (35.3%) | 0 (0.0%) |
| Total | 201 (100.0%) | 46 (100.0%) |
Housing Structure by Heating Type in Aguanga
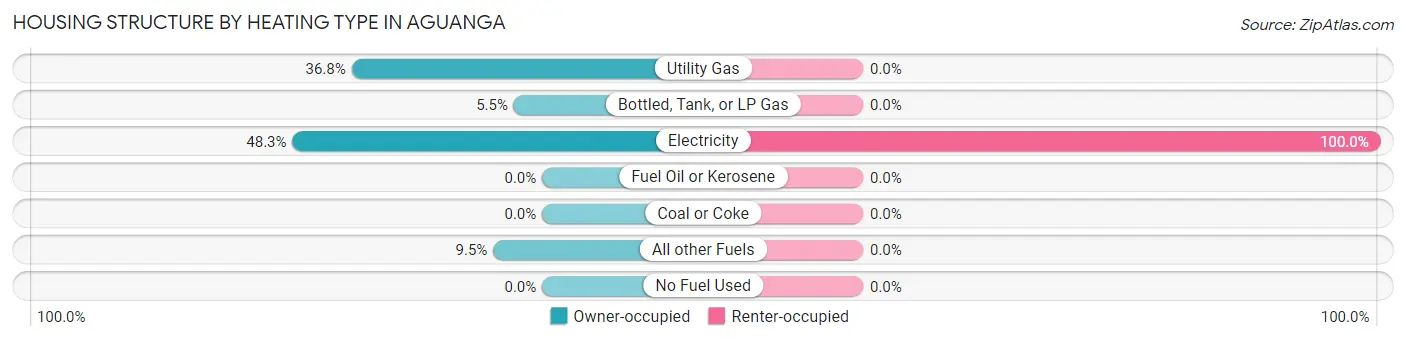
| Heating Type | Owner-occupied | Renter-occupied |
| Utility Gas | 74 (36.8%) | 0 (0.0%) |
| Bottled, Tank, or LP Gas | 11 (5.5%) | 0 (0.0%) |
| Electricity | 97 (48.3%) | 46 (100.0%) |
| Fuel Oil or Kerosene | 0 (0.0%) | 0 (0.0%) |
| Coal or Coke | 0 (0.0%) | 0 (0.0%) |
| All other Fuels | 19 (9.5%) | 0 (0.0%) |
| No Fuel Used | 0 (0.0%) | 0 (0.0%) |
| Total | 201 (100.0%) | 46 (100.0%) |
Household Vehicle Usage in Aguanga
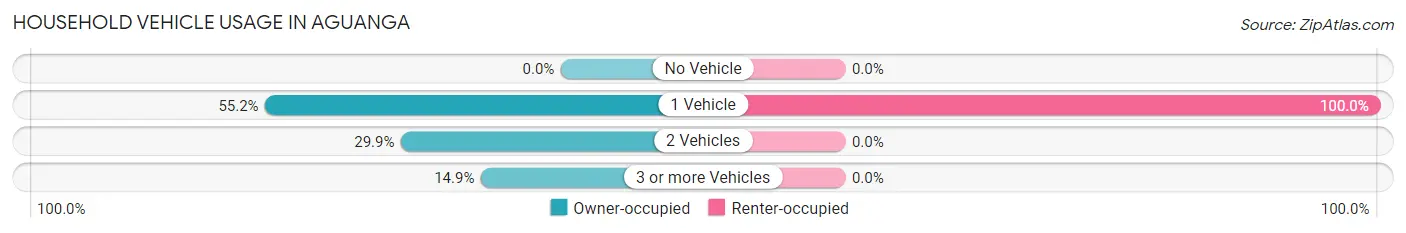
| Vehicles per Household | Owner-occupied | Renter-occupied |
| No Vehicle | 0 (0.0%) | 0 (0.0%) |
| 1 Vehicle | 111 (55.2%) | 46 (100.0%) |
| 2 Vehicles | 60 (29.8%) | 0 (0.0%) |
| 3 or more Vehicles | 30 (14.9%) | 0 (0.0%) |
| Total | 201 (100.0%) | 46 (100.0%) |
Real Estate & Mortgages in Aguanga
Real Estate and Mortgage Overview in Aguanga
| Characteristic | Without Mortgage | With Mortgage |
| Housing Units | 157 | 44 |
| Median Property Value | - | - |
| Median Household Income | $77,854 | $19 |
| Monthly Housing Costs | - | - |
| Real Estate Taxes | $4,625 | $0 |
Property Value by Mortgage Status in Aguanga
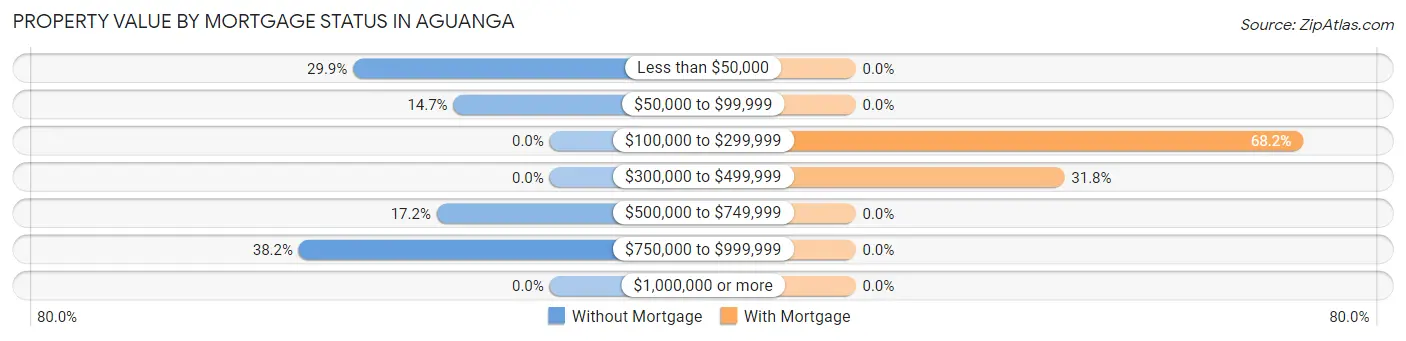
| Property Value | Without Mortgage | With Mortgage |
| Less than $50,000 | 47 (29.9%) | 0 (0.0%) |
| $50,000 to $99,999 | 23 (14.6%) | 0 (0.0%) |
| $100,000 to $299,999 | 0 (0.0%) | 30 (68.2%) |
| $300,000 to $499,999 | 0 (0.0%) | 14 (31.8%) |
| $500,000 to $749,999 | 27 (17.2%) | 0 (0.0%) |
| $750,000 to $999,999 | 60 (38.2%) | 0 (0.0%) |
| $1,000,000 or more | 0 (0.0%) | 0 (0.0%) |
| Total | 157 (100.0%) | 44 (100.0%) |
Household Income by Mortgage Status in Aguanga
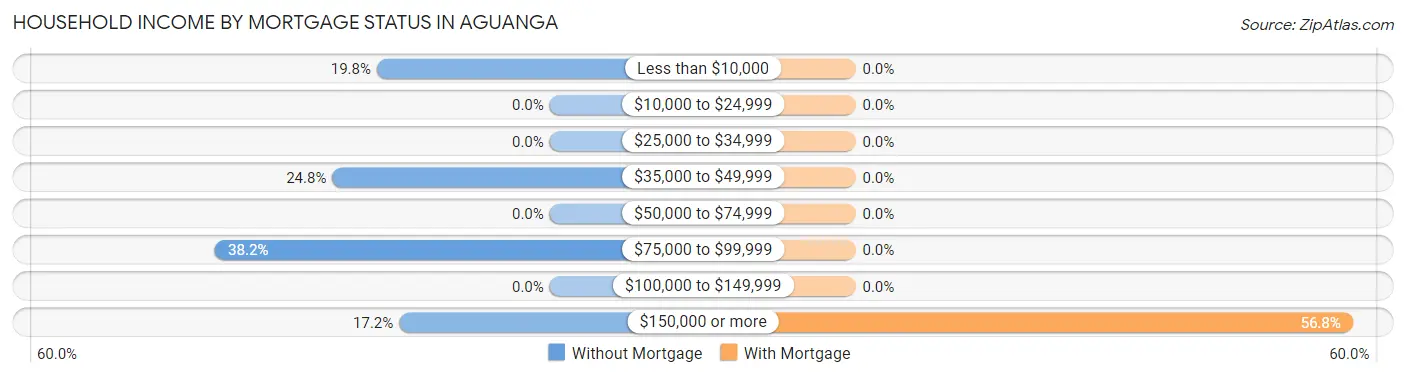
| Household Income | Without Mortgage | With Mortgage |
| Less than $10,000 | 31 (19.8%) | 0 (0.0%) |
| $10,000 to $24,999 | 0 (0.0%) | 0 (0.0%) |
| $25,000 to $34,999 | 0 (0.0%) | 0 (0.0%) |
| $35,000 to $49,999 | 39 (24.8%) | 0 (0.0%) |
| $50,000 to $74,999 | 0 (0.0%) | 0 (0.0%) |
| $75,000 to $99,999 | 60 (38.2%) | 0 (0.0%) |
| $100,000 to $149,999 | 0 (0.0%) | 0 (0.0%) |
| $150,000 or more | 27 (17.2%) | 25 (56.8%) |
| Total | 157 (100.0%) | 44 (100.0%) |
Property Value to Household Income Ratio in Aguanga
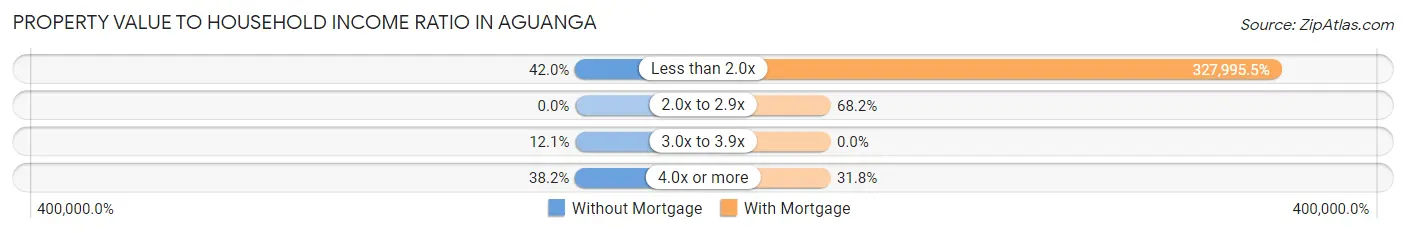
| Value-to-Income Ratio | Without Mortgage | With Mortgage |
| Less than 2.0x | 66 (42.0%) | 144,318 (327,995.4%) |
| 2.0x to 2.9x | 0 (0.0%) | 30 (68.2%) |
| 3.0x to 3.9x | 19 (12.1%) | 0 (0.0%) |
| 4.0x or more | 60 (38.2%) | 14 (31.8%) |
| Total | 157 (100.0%) | 44 (100.0%) |
Real Estate Taxes by Mortgage Status in Aguanga
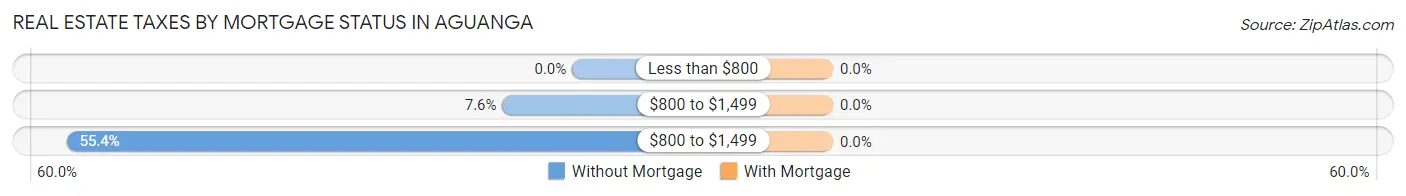
| Property Taxes | Without Mortgage | With Mortgage |
| Less than $800 | 0 (0.0%) | 0 (0.0%) |
| $800 to $1,499 | 12 (7.6%) | 0 (0.0%) |
| $800 to $1,499 | 87 (55.4%) | 0 (0.0%) |
| Total | 157 (100.0%) | 44 (100.0%) |
Health & Disability in Aguanga
Health Insurance Coverage by Age in Aguanga
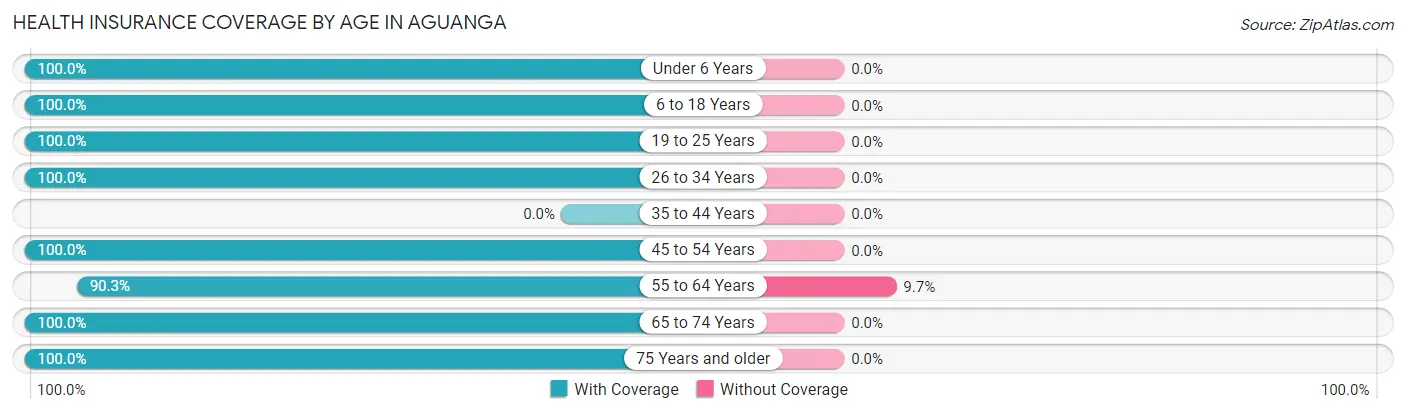
| Age Bracket | With Coverage | Without Coverage |
| Under 6 Years | 51 (100.0%) | 0 (0.0%) |
| 6 to 18 Years | 74 (100.0%) | 0 (0.0%) |
| 19 to 25 Years | 45 (100.0%) | 0 (0.0%) |
| 26 to 34 Years | 46 (100.0%) | 0 (0.0%) |
| 35 to 44 Years | 0 (0.0%) | 0 (0.0%) |
| 45 to 54 Years | 99 (100.0%) | 0 (0.0%) |
| 55 to 64 Years | 130 (90.3%) | 14 (9.7%) |
| 65 to 74 Years | 94 (100.0%) | 0 (0.0%) |
| 75 Years and older | 50 (100.0%) | 0 (0.0%) |
| Total | 589 (97.7%) | 14 (2.3%) |
Health Insurance Coverage by Citizenship Status in Aguanga
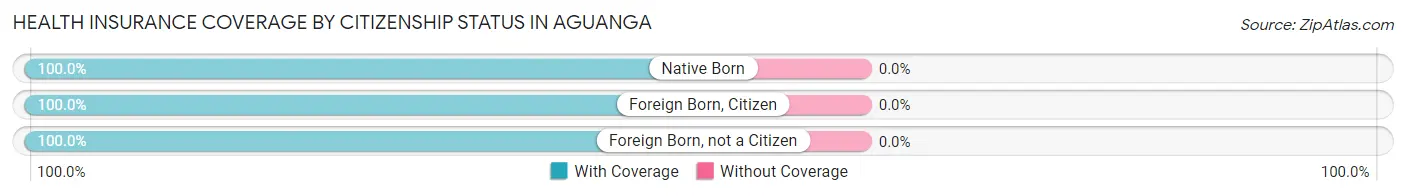
| Citizenship Status | With Coverage | Without Coverage |
| Native Born | 51 (100.0%) | 0 (0.0%) |
| Foreign Born, Citizen | 74 (100.0%) | 0 (0.0%) |
| Foreign Born, not a Citizen | 45 (100.0%) | 0 (0.0%) |
Health Insurance Coverage by Household Income in Aguanga
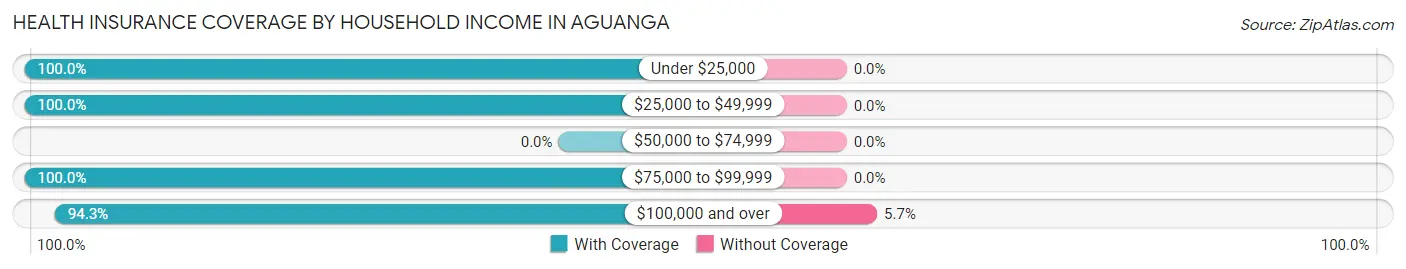
| Household Income | With Coverage | Without Coverage |
| Under $25,000 | 188 (100.0%) | 0 (0.0%) |
| $25,000 to $49,999 | 49 (100.0%) | 0 (0.0%) |
| $50,000 to $74,999 | 0 (0.0%) | 0 (0.0%) |
| $75,000 to $99,999 | 120 (100.0%) | 0 (0.0%) |
| $100,000 and over | 232 (94.3%) | 14 (5.7%) |
Public vs Private Health Insurance Coverage by Age in Aguanga
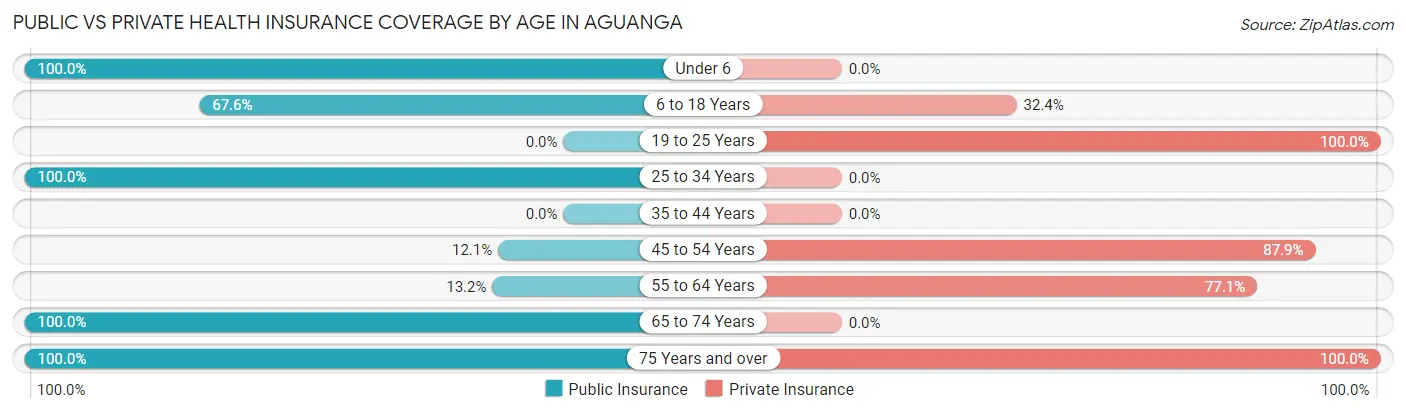
| Age Bracket | Public Insurance | Private Insurance |
| Under 6 | 51 (100.0%) | 0 (0.0%) |
| 6 to 18 Years | 50 (67.6%) | 24 (32.4%) |
| 19 to 25 Years | 0 (0.0%) | 45 (100.0%) |
| 25 to 34 Years | 46 (100.0%) | 0 (0.0%) |
| 35 to 44 Years | 0 (0.0%) | 0 (0.0%) |
| 45 to 54 Years | 12 (12.1%) | 87 (87.9%) |
| 55 to 64 Years | 19 (13.2%) | 111 (77.1%) |
| 65 to 74 Years | 94 (100.0%) | 0 (0.0%) |
| 75 Years and over | 50 (100.0%) | 50 (100.0%) |
| Total | 322 (53.4%) | 317 (52.6%) |
Disability Status by Sex by Age in Aguanga
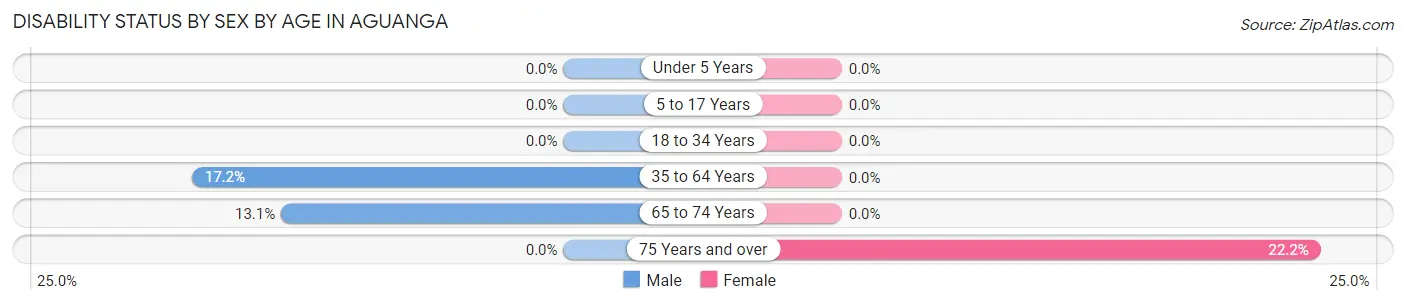
| Age Bracket | Male | Female |
| Under 5 Years | 0 (0.0%) | 0 (0.0%) |
| 5 to 17 Years | 0 (0.0%) | 0 (0.0%) |
| 18 to 34 Years | 0 (0.0%) | 0 (0.0%) |
| 35 to 64 Years | 25 (17.2%) | 0 (0.0%) |
| 65 to 74 Years | 11 (13.1%) | 0 (0.0%) |
| 75 Years and over | 0 (0.0%) | 8 (22.2%) |
Disability Class by Sex by Age in Aguanga
Disability Class: Hearing Difficulty
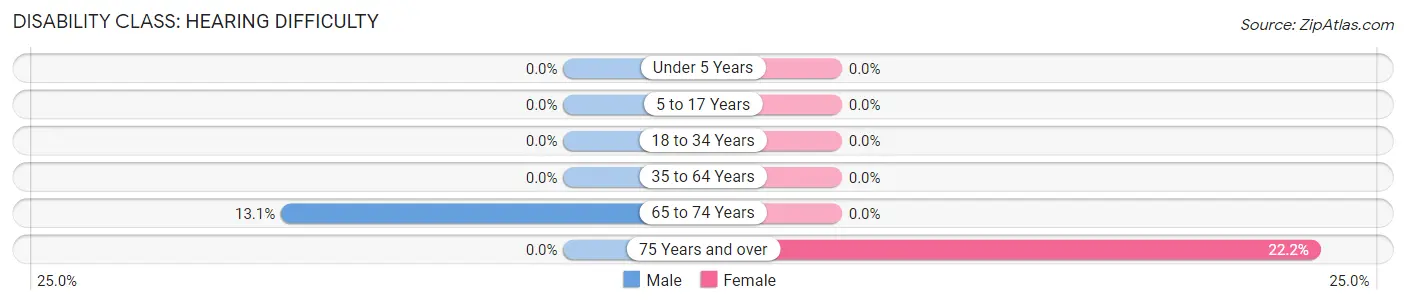
| Age Bracket | Male | Female |
| Under 5 Years | 0 (0.0%) | 0 (0.0%) |
| 5 to 17 Years | 0 (0.0%) | 0 (0.0%) |
| 18 to 34 Years | 0 (0.0%) | 0 (0.0%) |
| 35 to 64 Years | 0 (0.0%) | 0 (0.0%) |
| 65 to 74 Years | 11 (13.1%) | 0 (0.0%) |
| 75 Years and over | 0 (0.0%) | 8 (22.2%) |
Disability Class: Vision Difficulty
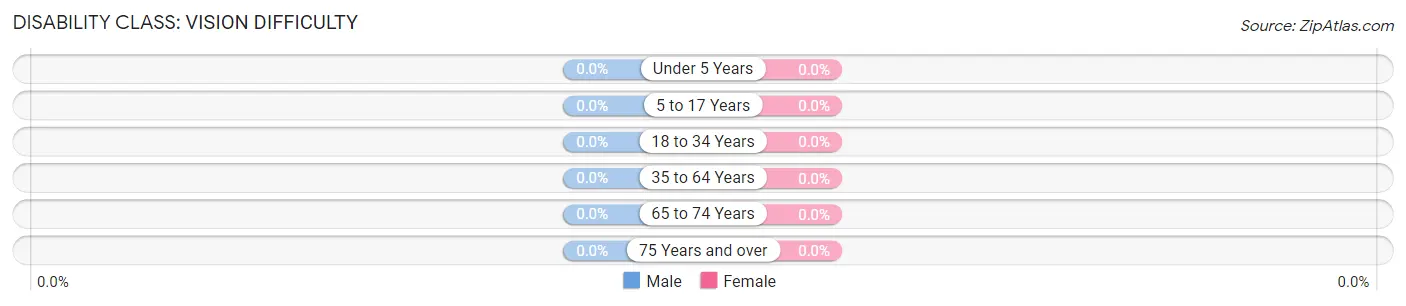
| Age Bracket | Male | Female |
| Under 5 Years | 0 (0.0%) | 0 (0.0%) |
| 5 to 17 Years | 0 (0.0%) | 0 (0.0%) |
| 18 to 34 Years | 0 (0.0%) | 0 (0.0%) |
| 35 to 64 Years | 0 (0.0%) | 0 (0.0%) |
| 65 to 74 Years | 0 (0.0%) | 0 (0.0%) |
| 75 Years and over | 0 (0.0%) | 0 (0.0%) |
Disability Class: Cognitive Difficulty
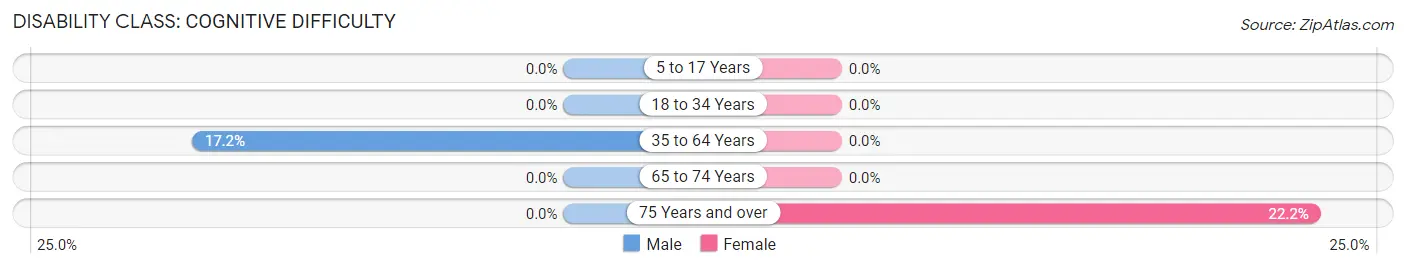
| Age Bracket | Male | Female |
| 5 to 17 Years | 0 (0.0%) | 0 (0.0%) |
| 18 to 34 Years | 0 (0.0%) | 0 (0.0%) |
| 35 to 64 Years | 25 (17.2%) | 0 (0.0%) |
| 65 to 74 Years | 0 (0.0%) | 0 (0.0%) |
| 75 Years and over | 0 (0.0%) | 8 (22.2%) |
Disability Class: Ambulatory Difficulty
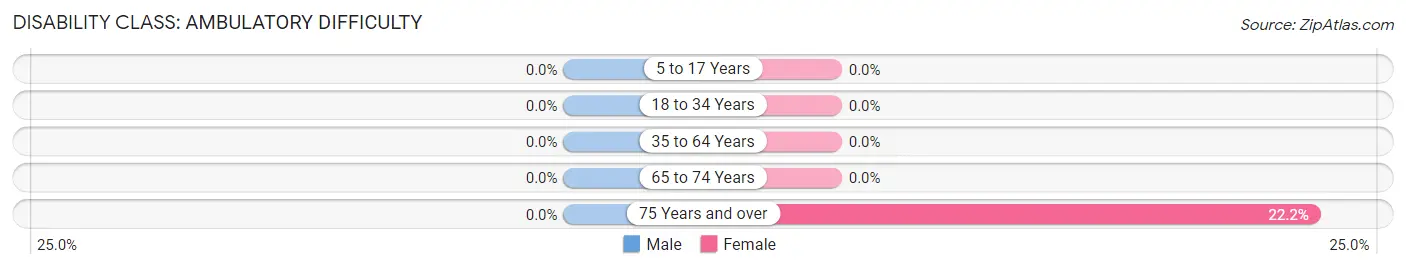
| Age Bracket | Male | Female |
| 5 to 17 Years | 0 (0.0%) | 0 (0.0%) |
| 18 to 34 Years | 0 (0.0%) | 0 (0.0%) |
| 35 to 64 Years | 0 (0.0%) | 0 (0.0%) |
| 65 to 74 Years | 0 (0.0%) | 0 (0.0%) |
| 75 Years and over | 0 (0.0%) | 8 (22.2%) |
Disability Class: Self-Care Difficulty
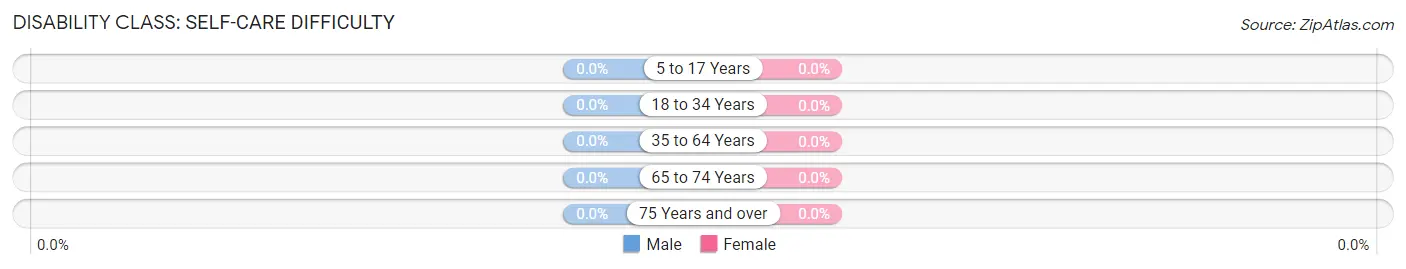
| Age Bracket | Male | Female |
| 5 to 17 Years | 0 (0.0%) | 0 (0.0%) |
| 18 to 34 Years | 0 (0.0%) | 0 (0.0%) |
| 35 to 64 Years | 0 (0.0%) | 0 (0.0%) |
| 65 to 74 Years | 0 (0.0%) | 0 (0.0%) |
| 75 Years and over | 0 (0.0%) | 0 (0.0%) |
Technology Access in Aguanga
Computing Device Access in Aguanga
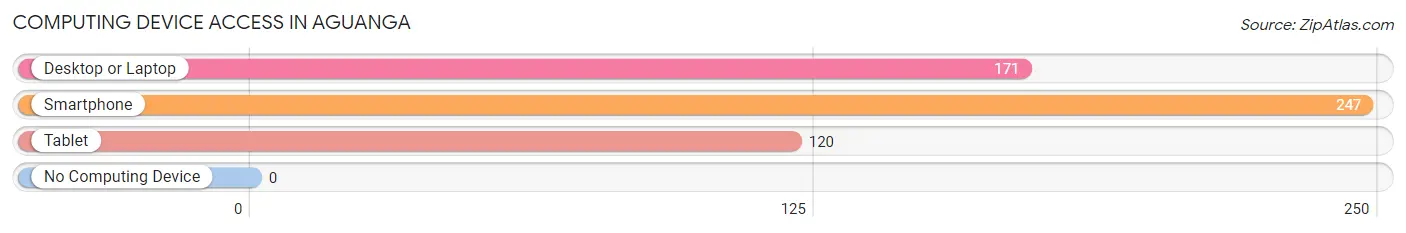
| Device Type | # Households | % Households |
| Desktop or Laptop | 171 | 69.2% |
| Smartphone | 247 | 100.0% |
| Tablet | 120 | 48.6% |
| No Computing Device | 0 | 0.0% |
| Total | 247 | 100.0% |
Internet Access in Aguanga
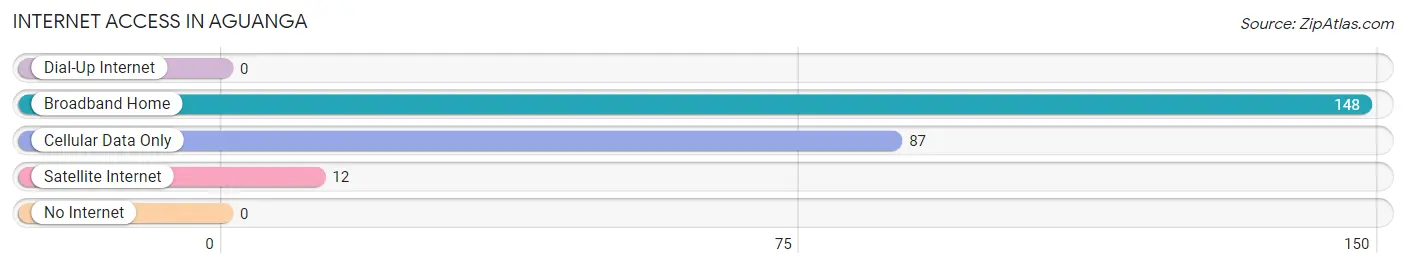
| Internet Type | # Households | % Households |
| Dial-Up Internet | 0 | 0.0% |
| Broadband Home | 148 | 59.9% |
| Cellular Data Only | 87 | 35.2% |
| Satellite Internet | 12 | 4.9% |
| No Internet | 0 | 0.0% |
| Total | 247 | 100.0% |
Aguanga Summary
Aguanga is an unincorporated community located in Riverside County, California. It is situated in the foothills of the Palomar Mountain Range, approximately 25 miles southeast of Temecula and 50 miles northeast of San Diego. The community is located in the San Jacinto Valley, which is part of the Inland Empire region of Southern California. The population of Aguanga was estimated to be 1,845 in 2019.
History
The area now known as Aguanga was originally inhabited by the Cahuilla Indians. The name “Aguanga” is derived from the Cahuilla word for “place of the big water”, referring to the nearby San Jacinto River. The first non-native settlers arrived in the area in the late 1800s, and the community was officially established in 1883.
The area was initially used for cattle ranching and farming, and the first post office was established in 1887. In the early 1900s, the area began to attract more settlers, and the population began to grow. The first school was built in 1910, and the first church was built in 1912.
In the 1920s, the area began to attract more tourists, and the first hotel was built in 1924. The area continued to grow throughout the 20th century, and the population reached 1,000 in the 1970s.
Geography
Aguanga is located in the San Jacinto Valley, which is part of the Inland Empire region of Southern California. The community is situated in the foothills of the Palomar Mountain Range, approximately 25 miles southeast of Temecula and 50 miles northeast of San Diego.
The area is characterized by rolling hills and valleys, with elevations ranging from 1,000 to 4,000 feet. The climate is semi-arid, with hot summers and mild winters. The average annual precipitation is approximately 10 inches.
Economy
The economy of Aguanga is largely based on agriculture and tourism. The area is known for its vineyards and wineries, and the local economy is supported by the production of wine, olives, and other agricultural products.
Tourism is also an important part of the local economy, with visitors coming to the area to enjoy the scenic views, hiking trails, and other outdoor activities. The area is also home to several resorts and golf courses.
Demographics
As of 2019, the population of Aguanga was estimated to be 1,845. The racial makeup of the community was 79.3% White, 0.7% African American, 0.7% Native American, 0.7% Asian, 0.2% Pacific Islander, and 16.7% from other races. The median household income was $50,000, and the median age was 44.
Conclusion
Aguanga is an unincorporated community located in Riverside County, California. It is situated in the foothills of the Palomar Mountain Range, approximately 25 miles southeast of Temecula and 50 miles northeast of San Diego. The population of Aguanga was estimated to be 1,845 in 2019. The economy of Aguanga is largely based on agriculture and tourism, and the area is known for its vineyards and wineries. The racial makeup of the community was 79.3% White, 0.7% African American, 0.7% Native American, 0.7% Asian, 0.2% Pacific Islander, and 16.7% from other races. The median household income was $50,000, and the median age was 44.
Common Questions
What is Per Capita Income in Aguanga?
Per Capita income in Aguanga is $42,819.
What is the Median Family Income in Aguanga?
Median Family Income in Aguanga is $78,583.
What is the Median Household income in Aguanga?
Median Household Income in Aguanga is $77,813.
What is Inequality or Gini Index in Aguanga?
Inequality or Gini Index in Aguanga is 0.56.
What is the Total Population of Aguanga?
Total Population of Aguanga is 603.
What is the Total Male Population of Aguanga?
Total Male Population of Aguanga is 389.
What is the Total Female Population of Aguanga?
Total Female Population of Aguanga is 214.
What is the Ratio of Males per 100 Females in Aguanga?
There are 181.78 Males per 100 Females in Aguanga.
What is the Ratio of Females per 100 Males in Aguanga?
There are 55.01 Females per 100 Males in Aguanga.
What is the Median Population Age in Aguanga?
Median Population Age in Aguanga is 53.3 Years.
What is the Average Family Size in Aguanga
Average Family Size in Aguanga is 2.7 People.
What is the Average Household Size in Aguanga
Average Household Size in Aguanga is 2.4 People.
How Large is the Labor Force in Aguanga?
There are 178 People in the Labor Forcein in Aguanga.
What is the Percentage of People in the Labor Force in Aguanga?
37.2% of People are in the Labor Force in Aguanga.