Benbow, CA Map & Demographics
Benbow Map
Benbow Overview
$36,253
PER CAPITA INCOME
$40,962
AVG HOUSEHOLD INCOME
0.41
INEQUALITY / GINI INDEX
153
TOTAL POPULATION
82
MALE POPULATION
71
FEMALE POPULATION
115.49
MALES / 100 FEMALES
86.59
FEMALES / 100 MALES
62.2
MEDIAN AGE
2.5
AVG FAMILY SIZE
1.7
AVG HOUSEHOLD SIZE
78
LABOR FORCE [ PEOPLE ]
51.0%
PERCENT IN LABOR FORCE
14.1%
UNEMPLOYMENT RATE
Income in Benbow
Income Overview in Benbow
| Characteristic | Number | Measure |
| Per Capita Income | 153 | $36,253 |
| Median Family Income | 35 | $0 |
| Mean Family Income | 35 | $50,569 |
| Median Household Income | 88 | $40,962 |
| Mean Household Income | 88 | $65,574 |
| Income Deficit | 35 | $0 |
| Wage / Income Gap (%) | 153 | 0.00% |
| Wage / Income Gap ($) | 153 | 100.00¢ per $1 |
| Gini / Inequality Index | 153 | 0.41 |
Earnings by Sex in Benbow
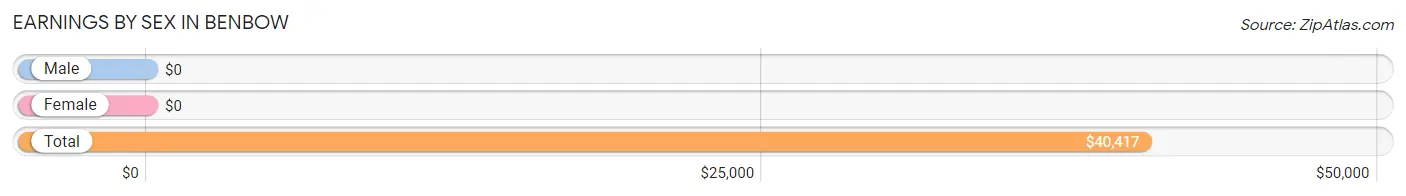
| Sex | Number | Average Earnings |
| Male | 24 (35.8%) | $0 |
| Female | 43 (64.2%) | $0 |
| Total | 67 (100.0%) | $40,417 |
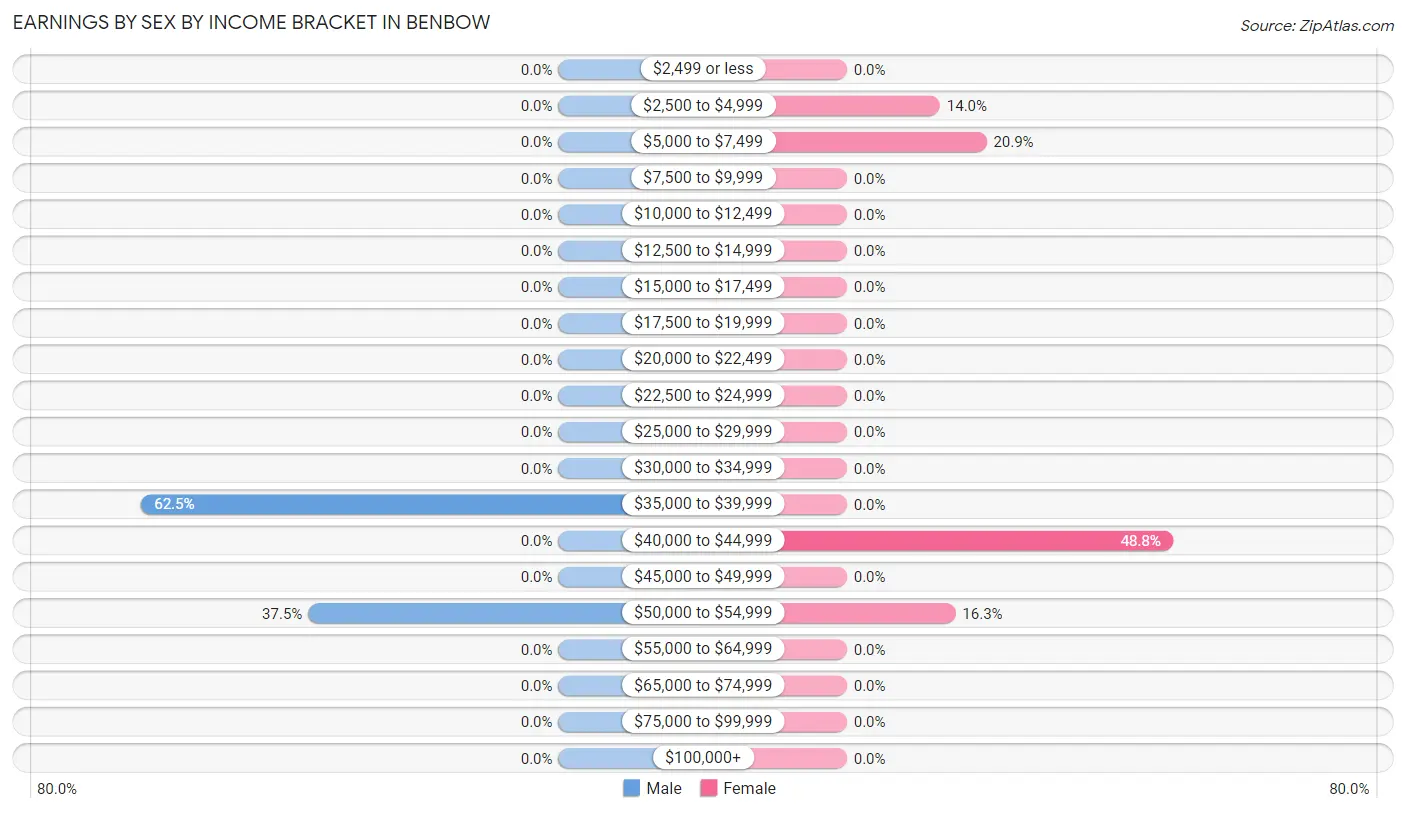
Earnings by Sex by Income Bracket in Benbow
The most common earnings brackets in Benbow are $35,000 to $39,999 for men (15 | 62.5%) and $40,000 to $44,999 for women (21 | 48.8%).
| Income | Male | Female |
| $2,499 or less | 0 (0.0%) | 0 (0.0%) |
| $2,500 to $4,999 | 0 (0.0%) | 6 (14.0%) |
| $5,000 to $7,499 | 0 (0.0%) | 9 (20.9%) |
| $7,500 to $9,999 | 0 (0.0%) | 0 (0.0%) |
| $10,000 to $12,499 | 0 (0.0%) | 0 (0.0%) |
| $12,500 to $14,999 | 0 (0.0%) | 0 (0.0%) |
| $15,000 to $17,499 | 0 (0.0%) | 0 (0.0%) |
| $17,500 to $19,999 | 0 (0.0%) | 0 (0.0%) |
| $20,000 to $22,499 | 0 (0.0%) | 0 (0.0%) |
| $22,500 to $24,999 | 0 (0.0%) | 0 (0.0%) |
| $25,000 to $29,999 | 0 (0.0%) | 0 (0.0%) |
| $30,000 to $34,999 | 0 (0.0%) | 0 (0.0%) |
| $35,000 to $39,999 | 15 (62.5%) | 0 (0.0%) |
| $40,000 to $44,999 | 0 (0.0%) | 21 (48.8%) |
| $45,000 to $49,999 | 0 (0.0%) | 0 (0.0%) |
| $50,000 to $54,999 | 9 (37.5%) | 7 (16.3%) |
| $55,000 to $64,999 | 0 (0.0%) | 0 (0.0%) |
| $65,000 to $74,999 | 0 (0.0%) | 0 (0.0%) |
| $75,000 to $99,999 | 0 (0.0%) | 0 (0.0%) |
| $100,000+ | 0 (0.0%) | 0 (0.0%) |
| Total | 24 (100.0%) | 43 (100.0%) |
Earnings by Sex by Educational Attainment in Benbow
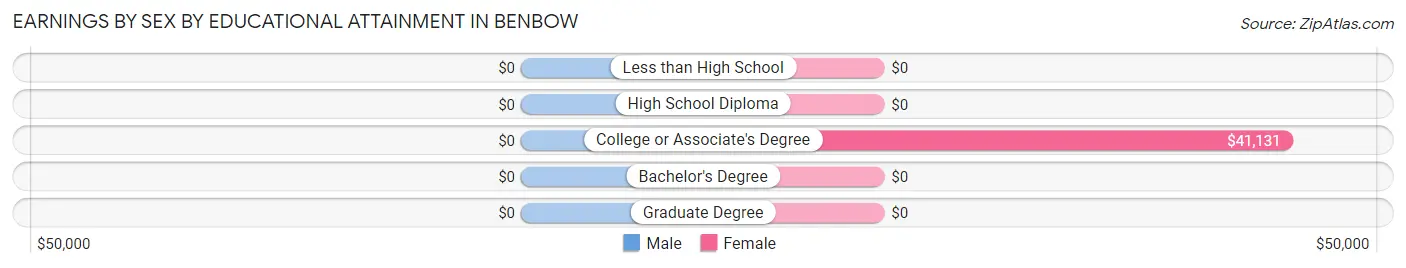
| Educational Attainment | Male Income | Female Income |
| Less than High School | - | - |
| High School Diploma | - | - |
| College or Associate's Degree | - | - |
| Bachelor's Degree | - | - |
| Graduate Degree | - | - |
| Total | - | - |
Family Income in Benbow
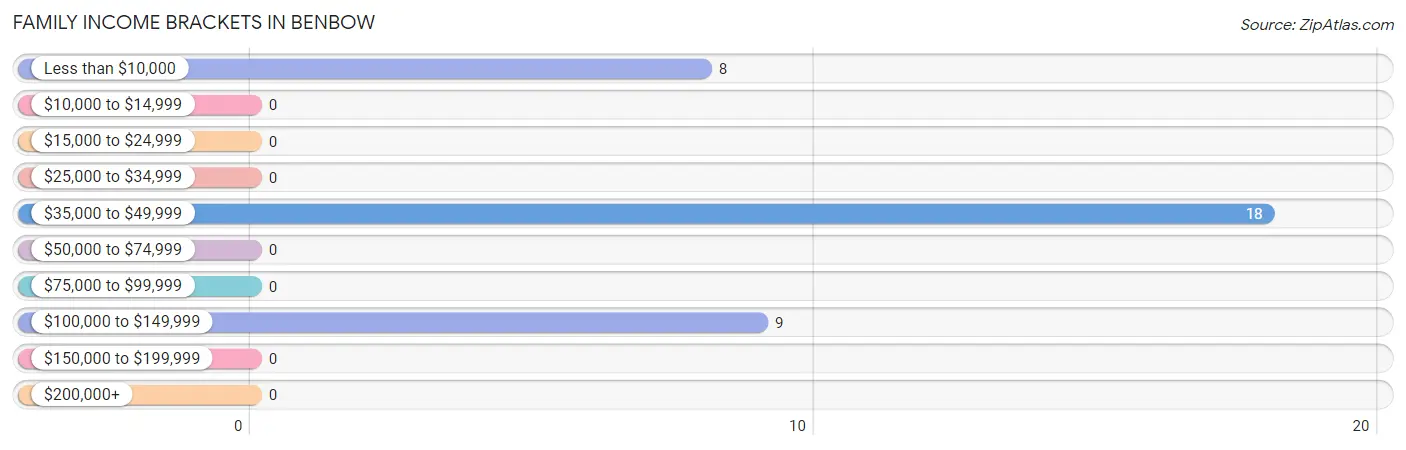
Family Income Brackets in Benbow
According to the Benbow family income data, there are 18 families falling into the $35,000 to $49,999 income range, which is the most common income bracket and makes up 51.4% of all families.
| Income Bracket | # Families | % Families |
| Less than $10,000 | 8 | 22.9% |
| $10,000 to $14,999 | 0 | 0.0% |
| $15,000 to $24,999 | 0 | 0.0% |
| $25,000 to $34,999 | 0 | 0.0% |
| $35,000 to $49,999 | 18 | 51.4% |
| $50,000 to $74,999 | 0 | 0.0% |
| $75,000 to $99,999 | 0 | 0.0% |
| $100,000 to $149,999 | 9 | 25.7% |
| $150,000 to $199,999 | 0 | 0.0% |
| $200,000+ | 0 | 0.0% |
Family Income by Famaliy Size in Benbow
| Income Bracket | # Families | Median Income |
| 2-Person Families | 26 (74.3%) | $0 |
| 3-Person Families | 0 (0.0%) | $0 |
| 4-Person Families | 9 (25.7%) | $0 |
| 5-Person Families | 0 (0.0%) | $0 |
| 6-Person Families | 0 (0.0%) | $0 |
| 7+ Person Families | 0 (0.0%) | $0 |
| Total | 35 (100.0%) | $0 |
Family Income by Number of Earners in Benbow
| Number of Earners | # Families | Median Income |
| No Earners | 26 (74.3%) | $0 |
| 1 Earner | 0 (0.0%) | $0 |
| 2 Earners | 9 (25.7%) | $0 |
| 3+ Earners | 0 (0.0%) | $0 |
| Total | 35 (100.0%) | $0 |
Household Income in Benbow
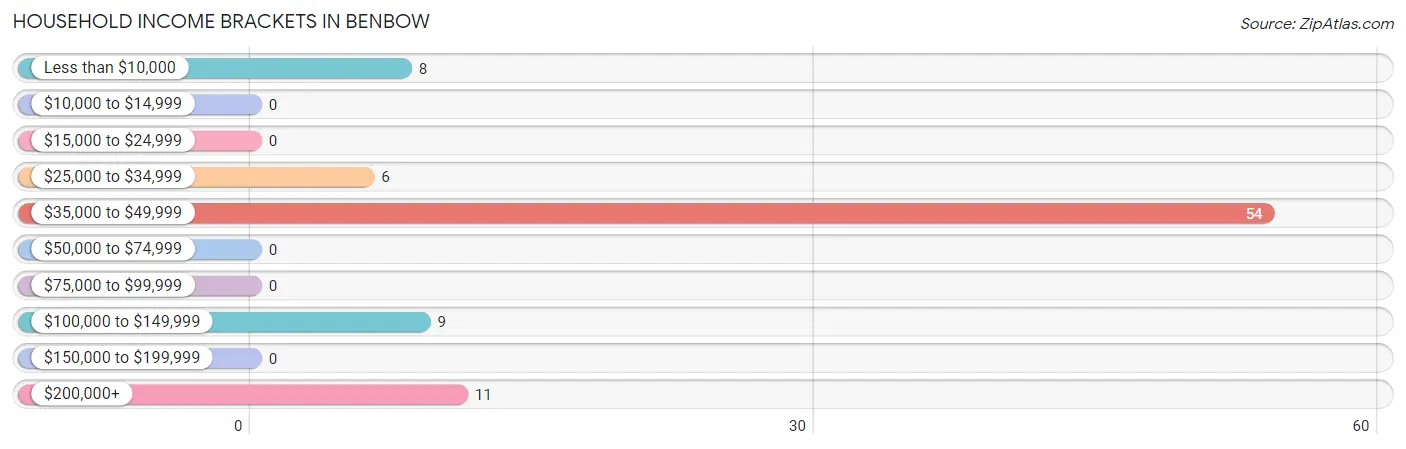
Household Income Brackets in Benbow
With 54 households falling in the category, the $35,000 to $49,999 income range is the most frequent in Benbow, accounting for 61.4% of all households.
| Income Bracket | # Households | % Households |
| Less than $10,000 | 8 | 9.1% |
| $10,000 to $14,999 | 0 | 0.0% |
| $15,000 to $24,999 | 0 | 0.0% |
| $25,000 to $34,999 | 6 | 6.8% |
| $35,000 to $49,999 | 54 | 61.4% |
| $50,000 to $74,999 | 0 | 0.0% |
| $75,000 to $99,999 | 0 | 0.0% |
| $100,000 to $149,999 | 9 | 10.2% |
| $150,000 to $199,999 | 0 | 0.0% |
| $200,000+ | 11 | 12.5% |
Household Income by Householder Age in Benbow
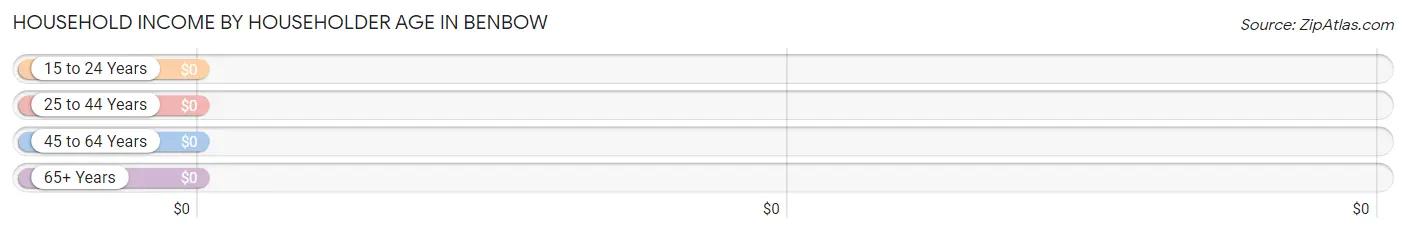
| Income Bracket | # Households | Median Income |
| 15 to 24 Years | 0 (0.0%) | $0 |
| 25 to 44 Years | 21 (23.9%) | $0 |
| 45 to 64 Years | 32 (36.4%) | $0 |
| 65+ Years | 35 (39.8%) | $0 |
| Total | 88 (100.0%) | $40,962 |
Poverty in Benbow
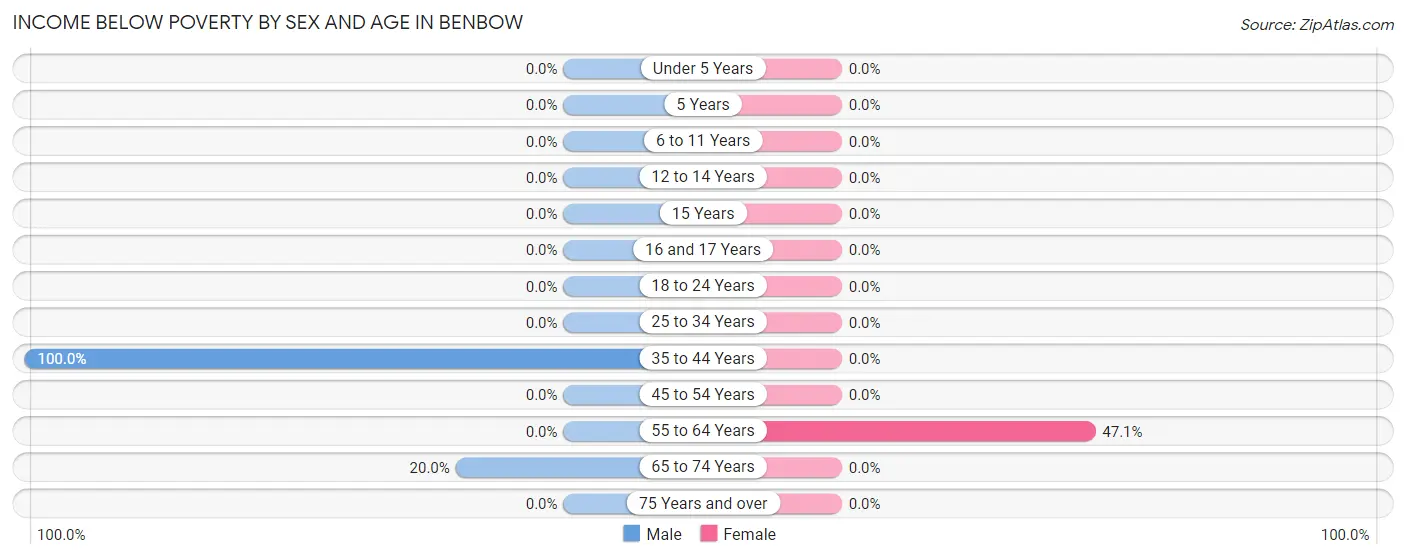
Income Below Poverty by Sex and Age in Benbow
With 12.2% poverty level for males and 11.3% for females among the residents of Benbow, 35 to 44 year old males and 55 to 64 year old females are the most vulnerable to poverty, with 3 males (100.0%) and 8 females (47.1%) in their respective age groups living below the poverty level.
| Age Bracket | Male | Female |
| Under 5 Years | 0 (0.0%) | 0 (0.0%) |
| 5 Years | 0 (0.0%) | 0 (0.0%) |
| 6 to 11 Years | 0 (0.0%) | 0 (0.0%) |
| 12 to 14 Years | 0 (0.0%) | 0 (0.0%) |
| 15 Years | 0 (0.0%) | 0 (0.0%) |
| 16 and 17 Years | 0 (0.0%) | 0 (0.0%) |
| 18 to 24 Years | 0 (0.0%) | 0 (0.0%) |
| 25 to 34 Years | 0 (0.0%) | 0 (0.0%) |
| 35 to 44 Years | 3 (100.0%) | 0 (0.0%) |
| 45 to 54 Years | 0 (0.0%) | 0 (0.0%) |
| 55 to 64 Years | 0 (0.0%) | 8 (47.1%) |
| 65 to 74 Years | 7 (20.0%) | 0 (0.0%) |
| 75 Years and over | 0 (0.0%) | 0 (0.0%) |
| Total | 10 (12.2%) | 8 (11.3%) |
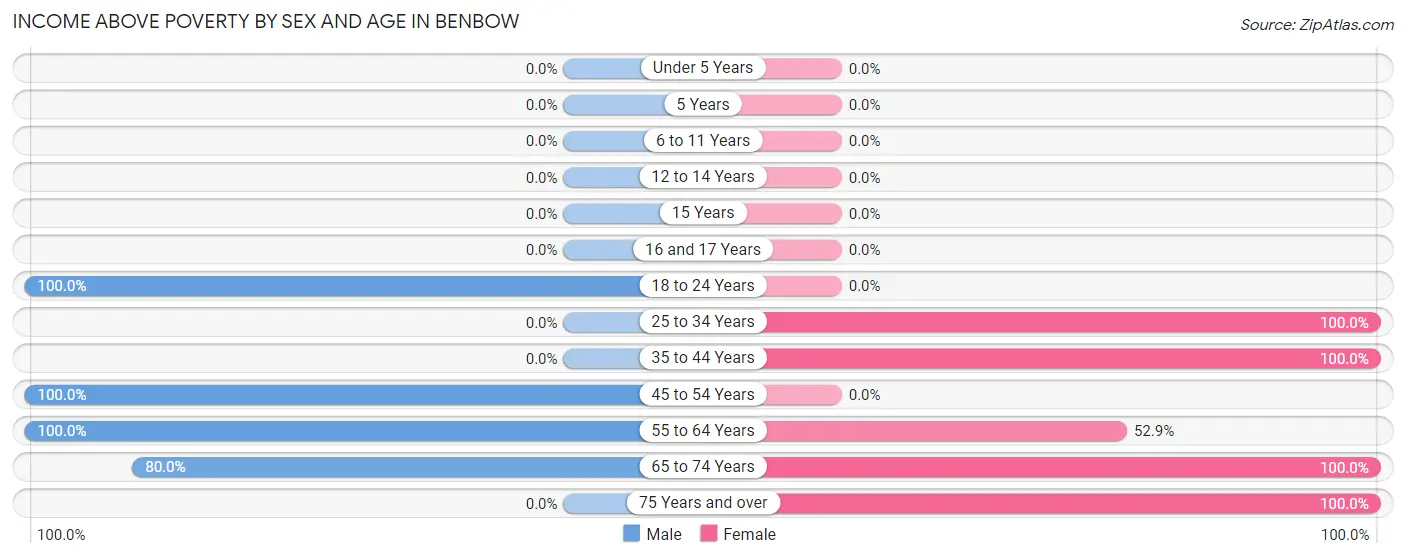
Income Above Poverty by Sex and Age in Benbow
According to the poverty statistics in Benbow, males aged 18 to 24 years and females aged 25 to 34 years are the age groups that are most secure financially, with 100.0% of males and 100.0% of females in these age groups living above the poverty line.
| Age Bracket | Male | Female |
| Under 5 Years | 0 (0.0%) | 0 (0.0%) |
| 5 Years | 0 (0.0%) | 0 (0.0%) |
| 6 to 11 Years | 0 (0.0%) | 0 (0.0%) |
| 12 to 14 Years | 0 (0.0%) | 0 (0.0%) |
| 15 Years | 0 (0.0%) | 0 (0.0%) |
| 16 and 17 Years | 0 (0.0%) | 0 (0.0%) |
| 18 to 24 Years | 20 (100.0%) | 0 (0.0%) |
| 25 to 34 Years | 0 (0.0%) | 21 (100.0%) |
| 35 to 44 Years | 0 (0.0%) | 7 (100.0%) |
| 45 to 54 Years | 9 (100.0%) | 0 (0.0%) |
| 55 to 64 Years | 15 (100.0%) | 9 (52.9%) |
| 65 to 74 Years | 28 (80.0%) | 24 (100.0%) |
| 75 Years and over | 0 (0.0%) | 2 (100.0%) |
| Total | 72 (87.8%) | 63 (88.7%) |
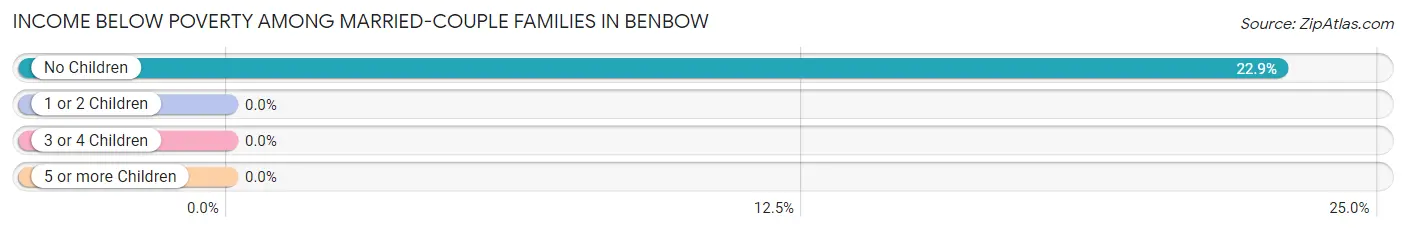
Income Below Poverty Among Married-Couple Families in Benbow
The poverty statistics for married-couple families in Benbow show that 22.9% or 8 of the total 35 families live below the poverty line. Families with no children have the highest poverty rate of 22.9%, comprising of 8 families. On the other hand, families with no children have the lowest poverty rate of 22.9%, which includes 8 families.
| Children | Above Poverty | Below Poverty |
| No Children | 27 (77.1%) | 8 (22.9%) |
| 1 or 2 Children | 0 (0.0%) | 0 (0.0%) |
| 3 or 4 Children | 0 (0.0%) | 0 (0.0%) |
| 5 or more Children | 0 (0.0%) | 0 (0.0%) |
| Total | 27 (77.1%) | 8 (22.9%) |
Income Below Poverty Among Single-Parent Households in Benbow
| Children | Single Father | Single Mother |
| No Children | 0 (0.0%) | 0 (0.0%) |
| 1 or 2 Children | 0 (0.0%) | 0 (0.0%) |
| 3 or 4 Children | 0 (0.0%) | 0 (0.0%) |
| 5 or more Children | 0 (0.0%) | 0 (0.0%) |
| Total | 0 (0.0%) | 0 (0.0%) |
Income Below Poverty Among Married-Couple vs Single-Parent Households in Benbow
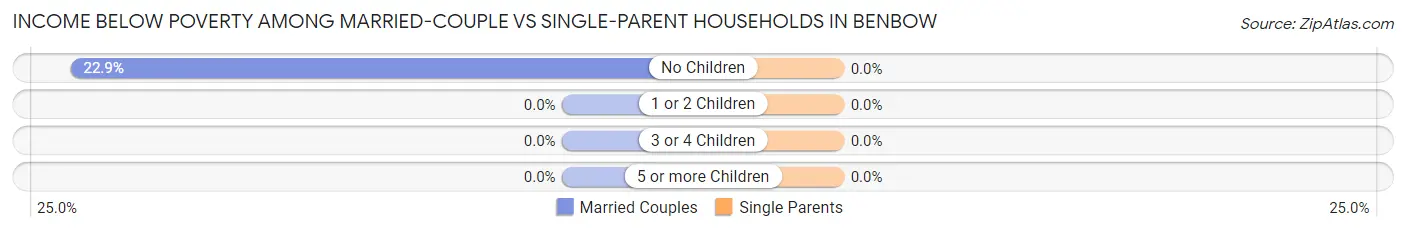
| Children | Married-Couple Families | Single-Parent Households |
| No Children | 8 (22.9%) | 0 (0.0%) |
| 1 or 2 Children | 0 (0.0%) | 0 (0.0%) |
| 3 or 4 Children | 0 (0.0%) | 0 (0.0%) |
| 5 or more Children | 0 (0.0%) | 0 (0.0%) |
| Total | 8 (22.9%) | 0 (0.0%) |
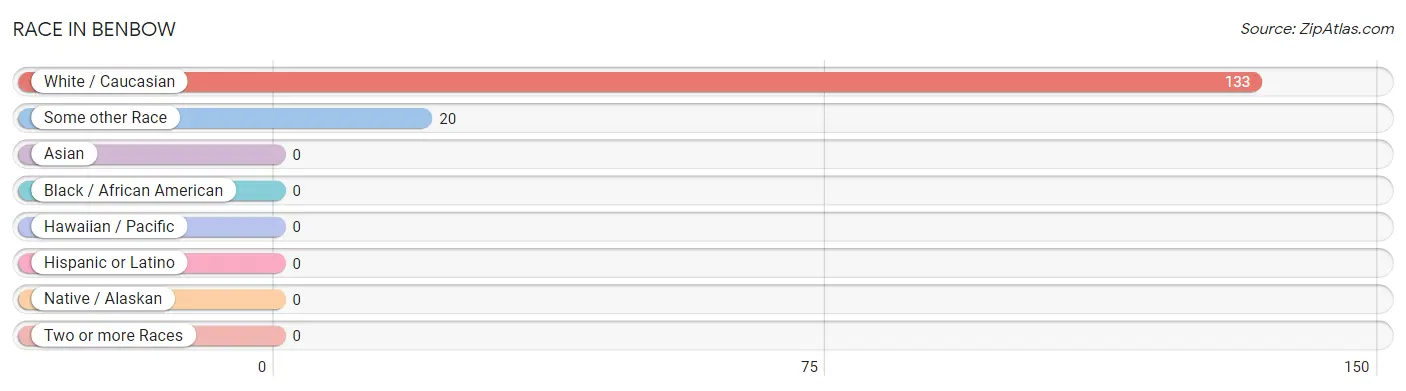
Race in Benbow
The most populous races in Benbow are White / Caucasian (133 | 86.9%), and Some other Race (20 | 13.1%).
| Race | # Population | % Population |
| Asian | 0 | 0.0% |
| Black / African American | 0 | 0.0% |
| Hawaiian / Pacific | 0 | 0.0% |
| Hispanic or Latino | 0 | 0.0% |
| Native / Alaskan | 0 | 0.0% |
| White / Caucasian | 133 | 86.9% |
| Two or more Races | 0 | 0.0% |
| Some other Race | 20 | 13.1% |
| Total | 153 | 100.0% |
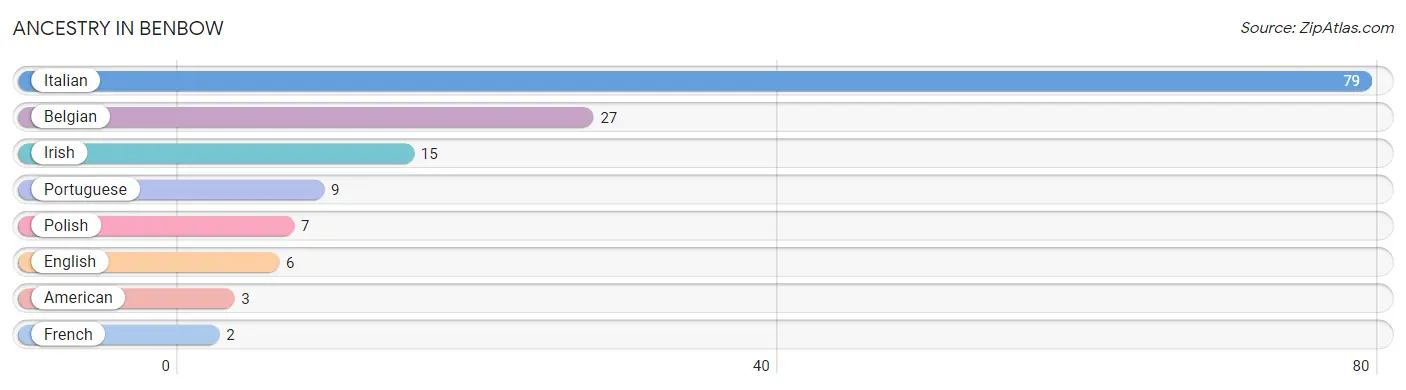
Ancestry in Benbow
The most populous ancestries reported in Benbow are Italian (79 | 51.6%), Belgian (27 | 17.6%), Irish (15 | 9.8%), Portuguese (9 | 5.9%), and Polish (7 | 4.6%), together accounting for 89.5% of all Benbow residents.
| Ancestry | # Population | % Population |
| American | 3 | 2.0% |
| Belgian | 27 | 17.6% |
| English | 6 | 3.9% |
| French | 2 | 1.3% |
| Irish | 15 | 9.8% |
| Italian | 79 | 51.6% |
| Polish | 7 | 4.6% |
| Portuguese | 9 | 5.9% | View All 8 Rows |
Immigrants in Benbow
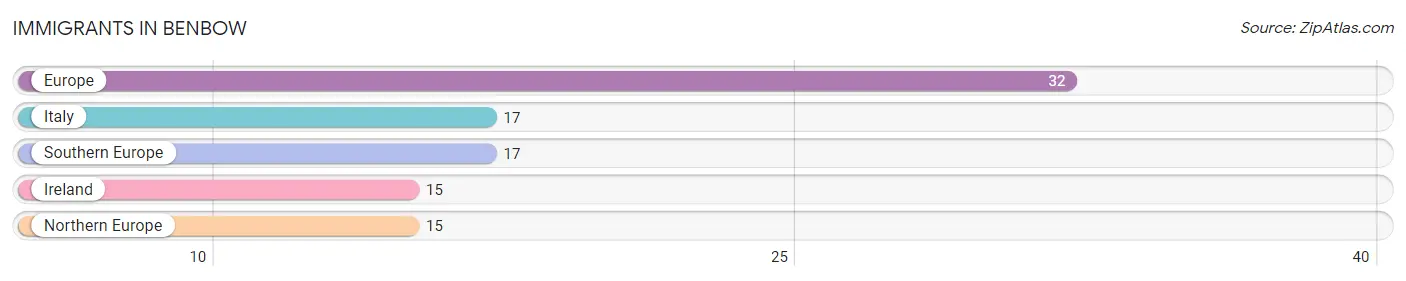
The most numerous immigrant groups reported in Benbow came from Europe (32 | 20.9%), Italy (17 | 11.1%), Southern Europe (17 | 11.1%), Ireland (15 | 9.8%), and Northern Europe (15 | 9.8%), together accounting for 62.7% of all Benbow residents.
| Immigration Origin | # Population | % Population |
| Europe | 32 | 20.9% |
| Ireland | 15 | 9.8% |
| Italy | 17 | 11.1% |
| Northern Europe | 15 | 9.8% |
| Southern Europe | 17 | 11.1% | View All 5 Rows |
Sex and Age in Benbow
Sex and Age in Benbow
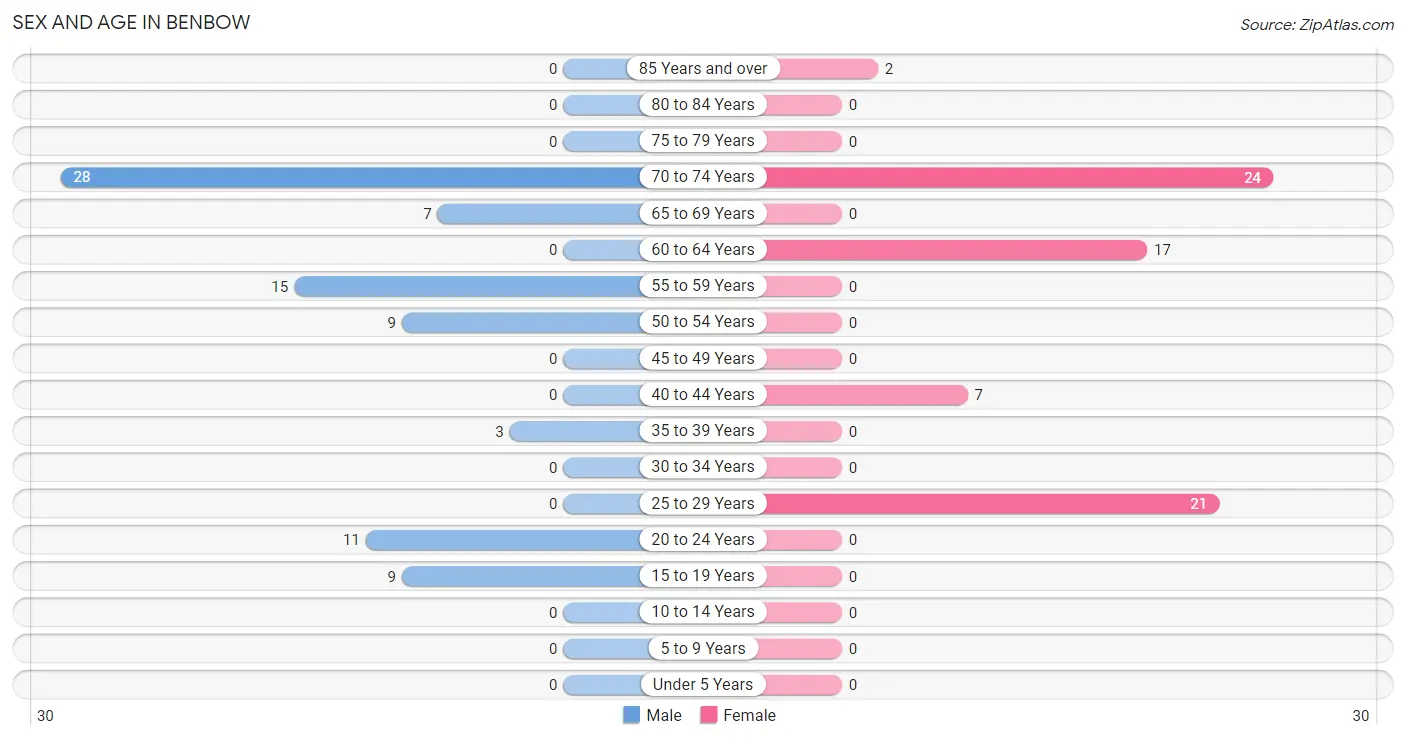
The most populous age groups in Benbow are 70 to 74 Years (28 | 34.2%) for men and 70 to 74 Years (24 | 33.8%) for women.
| Age Bracket | Male | Female |
| Under 5 Years | 0 (0.0%) | 0 (0.0%) |
| 5 to 9 Years | 0 (0.0%) | 0 (0.0%) |
| 10 to 14 Years | 0 (0.0%) | 0 (0.0%) |
| 15 to 19 Years | 9 (11.0%) | 0 (0.0%) |
| 20 to 24 Years | 11 (13.4%) | 0 (0.0%) |
| 25 to 29 Years | 0 (0.0%) | 21 (29.6%) |
| 30 to 34 Years | 0 (0.0%) | 0 (0.0%) |
| 35 to 39 Years | 3 (3.7%) | 0 (0.0%) |
| 40 to 44 Years | 0 (0.0%) | 7 (9.9%) |
| 45 to 49 Years | 0 (0.0%) | 0 (0.0%) |
| 50 to 54 Years | 9 (11.0%) | 0 (0.0%) |
| 55 to 59 Years | 15 (18.3%) | 0 (0.0%) |
| 60 to 64 Years | 0 (0.0%) | 17 (23.9%) |
| 65 to 69 Years | 7 (8.5%) | 0 (0.0%) |
| 70 to 74 Years | 28 (34.2%) | 24 (33.8%) |
| 75 to 79 Years | 0 (0.0%) | 0 (0.0%) |
| 80 to 84 Years | 0 (0.0%) | 0 (0.0%) |
| 85 Years and over | 0 (0.0%) | 2 (2.8%) |
| Total | 82 (100.0%) | 71 (100.0%) |
Families and Households in Benbow
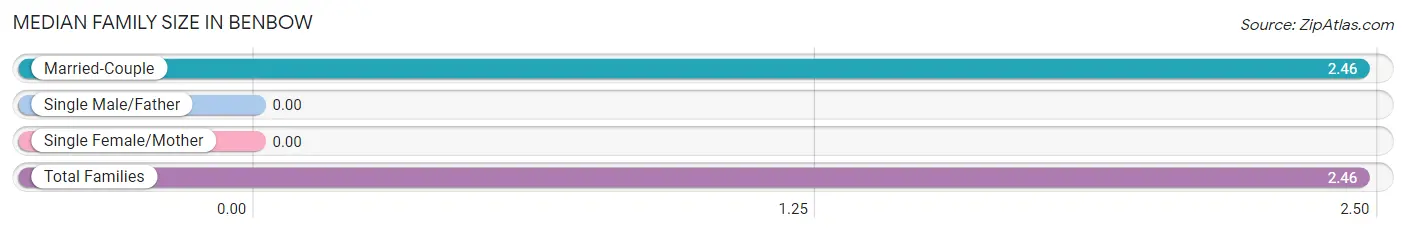
Median Family Size in Benbow
| Family Type | # Families | Family Size |
| Married-Couple | 35 (100.0%) | 2.46 |
| Single Male/Father | 0 (0.0%) | - |
| Single Female/Mother | 0 (0.0%) | - |
| Total Families | 35 (100.0%) | 2.46 |
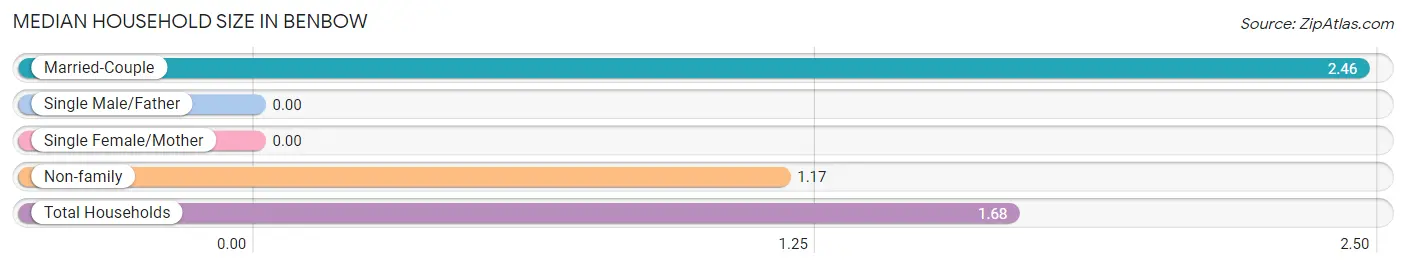
Median Household Size in Benbow
| Household Type | # Households | Household Size |
| Married-Couple | 35 (39.8%) | 2.46 |
| Single Male/Father | 0 (0.0%) | - |
| Single Female/Mother | 0 (0.0%) | - |
| Non-family | 53 (60.2%) | 1.17 |
| Total Households | 88 (100.0%) | 1.68 |
Household Size by Marriage Status in Benbow
Out of a total of 88 households in Benbow, 35 (39.8%) are family households, while 53 (60.2%) are nonfamily households. The most numerous type of family households are 2-person households, comprising 26, and the most common type of nonfamily households are 1-person households, comprising 42.
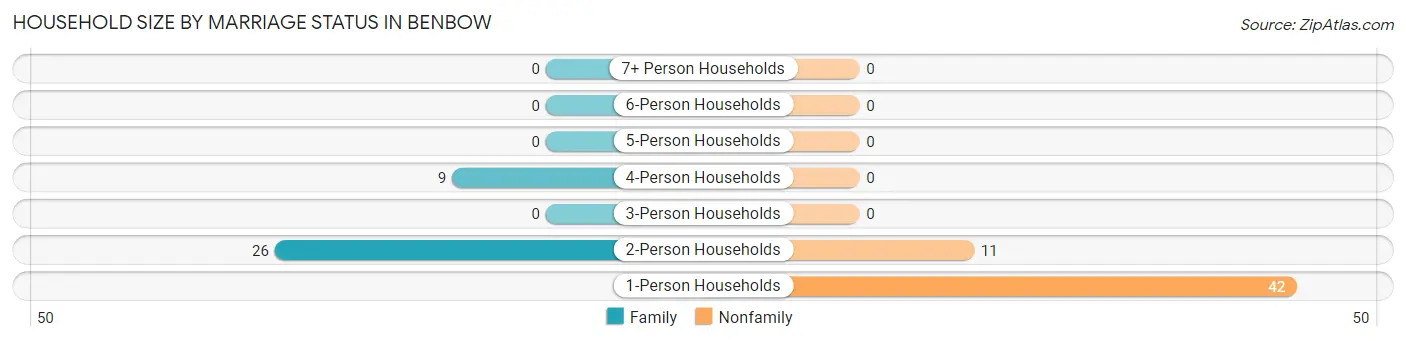
| Household Size | Family Households | Nonfamily Households |
| 1-Person Households | - | 42 (47.7%) |
| 2-Person Households | 26 (29.5%) | 11 (12.5%) |
| 3-Person Households | 0 (0.0%) | 0 (0.0%) |
| 4-Person Households | 9 (10.2%) | 0 (0.0%) |
| 5-Person Households | 0 (0.0%) | 0 (0.0%) |
| 6-Person Households | 0 (0.0%) | 0 (0.0%) |
| 7+ Person Households | 0 (0.0%) | 0 (0.0%) |
| Total | 35 (39.8%) | 53 (60.2%) |
Female Fertility in Benbow
Fertility by Age in Benbow
| Age Bracket | Women with Births | Births / 1,000 Women |
| 15 to 19 years | 0 (0.0%) | 0.0 |
| 20 to 34 years | 0 (0.0%) | 0.0 |
| 35 to 50 years | 0 (0.0%) | 0.0 |
| Total | 0 (0.0%) | 0.0 |
Fertility by Age by Marriage Status in Benbow
| Age Bracket | Married | Unmarried |
| 15 to 19 years | 0 (0.0%) | 0 (0.0%) |
| 20 to 34 years | 0 (0.0%) | 0 (0.0%) |
| 35 to 50 years | 0 (0.0%) | 0 (0.0%) |
| Total | 0 (0.0%) | 0 (0.0%) |
Fertility by Education in Benbow
| Educational Attainment | Women with Births | Births / 1,000 Women |
| Less than High School | 0 (0.0%) | 0.0 |
| High School Diploma | 0 (0.0%) | 0.0 |
| College or Associate's Degree | 0 (0.0%) | 0.0 |
| Bachelor's Degree | 0 (0.0%) | 0.0 |
| Graduate Degree | 0 (0.0%) | 0.0 |
| Total | 0 (0.0%) | 0.0 |
Fertility by Education by Marriage Status in Benbow
| Educational Attainment | Married | Unmarried |
| Less than High School | 0 (0.0%) | 0 (0.0%) |
| High School Diploma | 0 (0.0%) | 0 (0.0%) |
| College or Associate's Degree | 0 (0.0%) | 0 (0.0%) |
| Bachelor's Degree | 0 (0.0%) | 0 (0.0%) |
| Graduate Degree | 0 (0.0%) | 0 (0.0%) |
| Total | 0 (0.0%) | 0 (0.0%) |
Employment Characteristics in Benbow
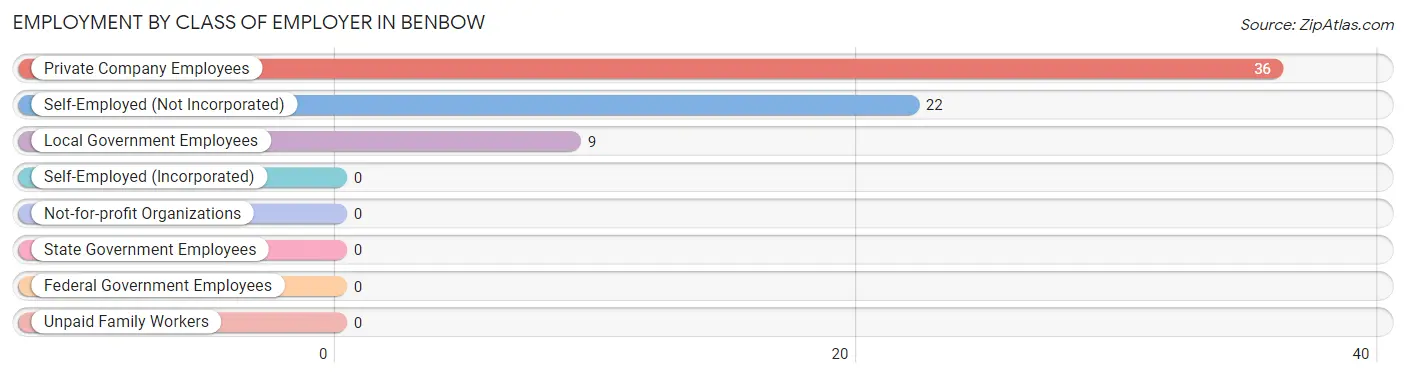
Employment by Class of Employer in Benbow
Among the 67 employed individuals in Benbow, private company employees (36 | 53.7%), self-employed (not incorporated) (22 | 32.8%), and local government employees (9 | 13.4%) make up the most common classes of employment.
| Employer Class | # Employees | % Employees |
| Private Company Employees | 36 | 53.7% |
| Self-Employed (Incorporated) | 0 | 0.0% |
| Self-Employed (Not Incorporated) | 22 | 32.8% |
| Not-for-profit Organizations | 0 | 0.0% |
| Local Government Employees | 9 | 13.4% |
| State Government Employees | 0 | 0.0% |
| Federal Government Employees | 0 | 0.0% |
| Unpaid Family Workers | 0 | 0.0% |
| Total | 67 | 100.0% |
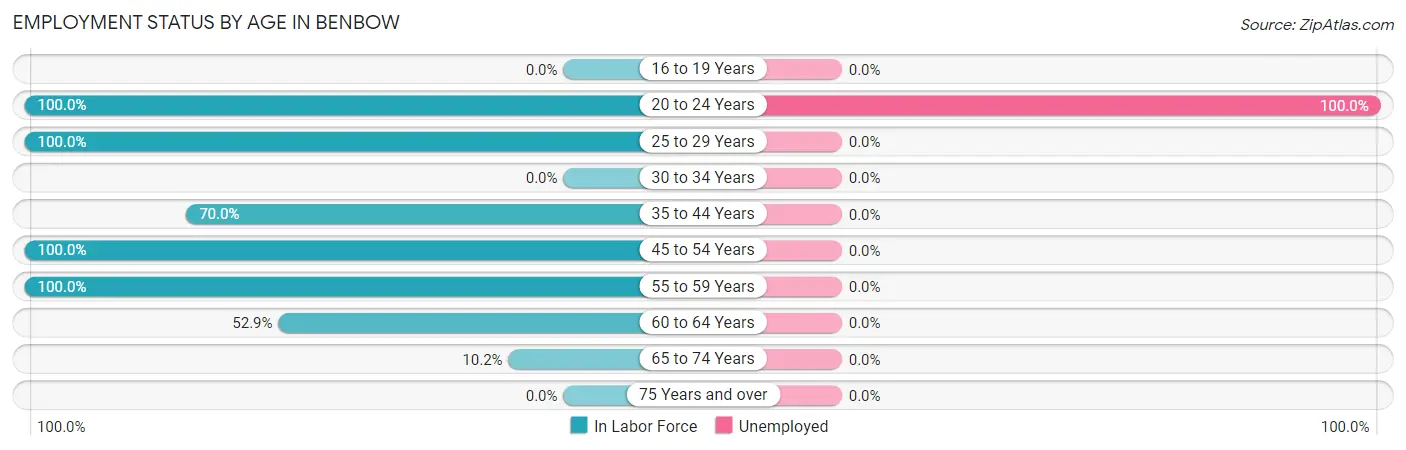
Employment Status by Age in Benbow
According to the labor force statistics for Benbow, out of the total population over 16 years of age (153), 51.0% or 78 individuals are in the labor force, with 14.1% or 11 of them unemployed. The age group with the highest labor force participation rate is 20 to 24 years, with 100.0% or 11 individuals in the labor force. Within the labor force, the 20 to 24 years age range has the highest percentage of unemployed individuals, with 100.0% or 11 of them being unemployed.
| Age Bracket | In Labor Force | Unemployed |
| 16 to 19 Years | 0 (0.0%) | 0 (0.0%) |
| 20 to 24 Years | 11 (100.0%) | 11 (100.0%) |
| 25 to 29 Years | 21 (100.0%) | 0 (0.0%) |
| 30 to 34 Years | 0 (0.0%) | 0 (0.0%) |
| 35 to 44 Years | 7 (70.0%) | 0 (0.0%) |
| 45 to 54 Years | 9 (100.0%) | 0 (0.0%) |
| 55 to 59 Years | 15 (100.0%) | 0 (0.0%) |
| 60 to 64 Years | 9 (52.9%) | 0 (0.0%) |
| 65 to 74 Years | 6 (10.2%) | 0 (0.0%) |
| 75 Years and over | 0 (0.0%) | 0 (0.0%) |
| Total | 78 (51.0%) | 11 (14.1%) |
Employment Status by Educational Attainment in Benbow
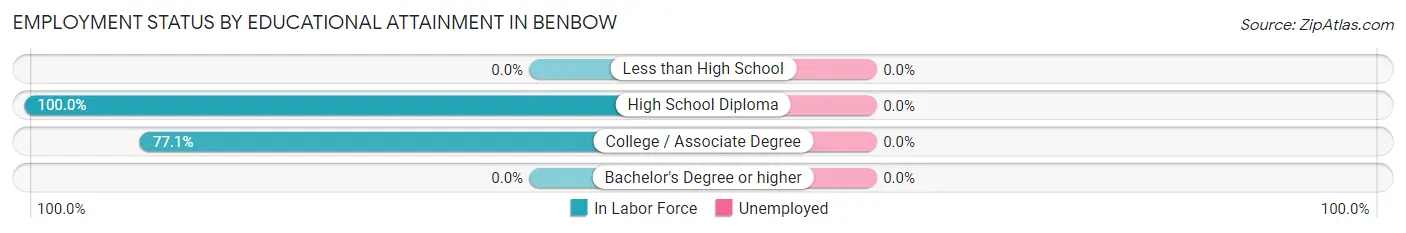
| Educational Attainment | In Labor Force | Unemployed |
| Less than High School | 0 (0.0%) | 0 (0.0%) |
| High School Diploma | 24 (100.0%) | 0 (0.0%) |
| College / Associate Degree | 37 (77.1%) | 0 (0.0%) |
| Bachelor's Degree or higher | 0 (0.0%) | 0 (0.0%) |
| Total | 61 (84.7%) | 0 (0.0%) |
Employment Occupations by Sex in Benbow
Management, Business, Science and Arts Occupations
The most common Management, Business, Science and Arts occupations in Benbow are Community & Social Service (15 | 22.4%), Education Instruction & Library (9 | 13.4%), and Education, Arts & Media (6 | 9.0%).
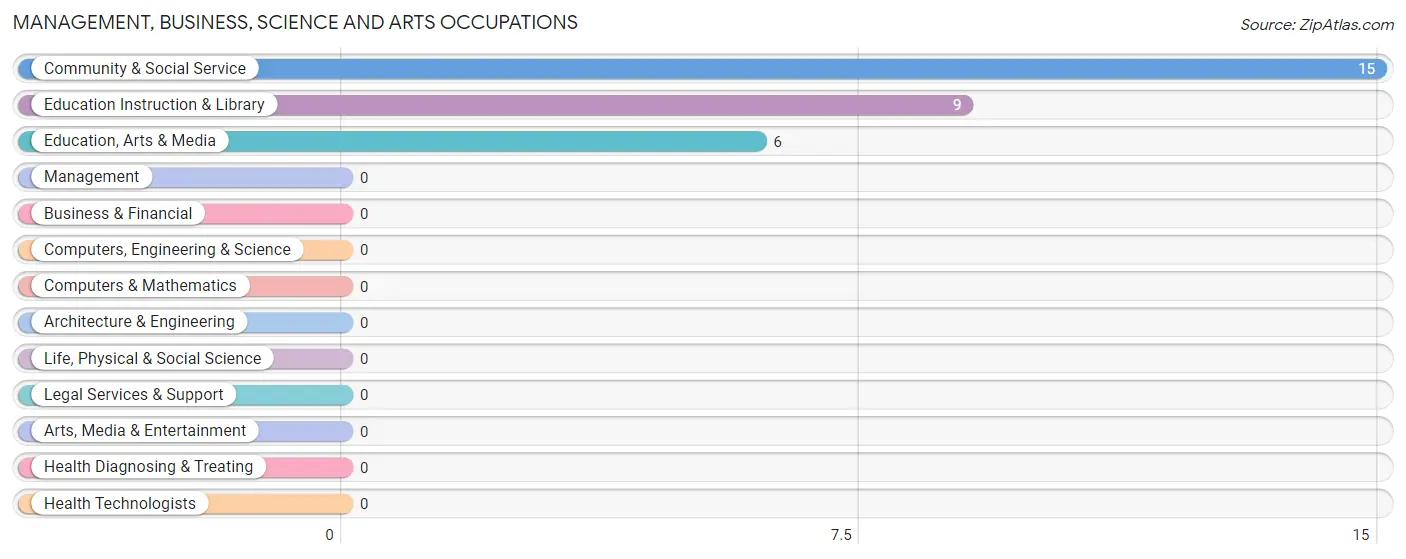
Management, Business, Science and Arts Occupations by Sex
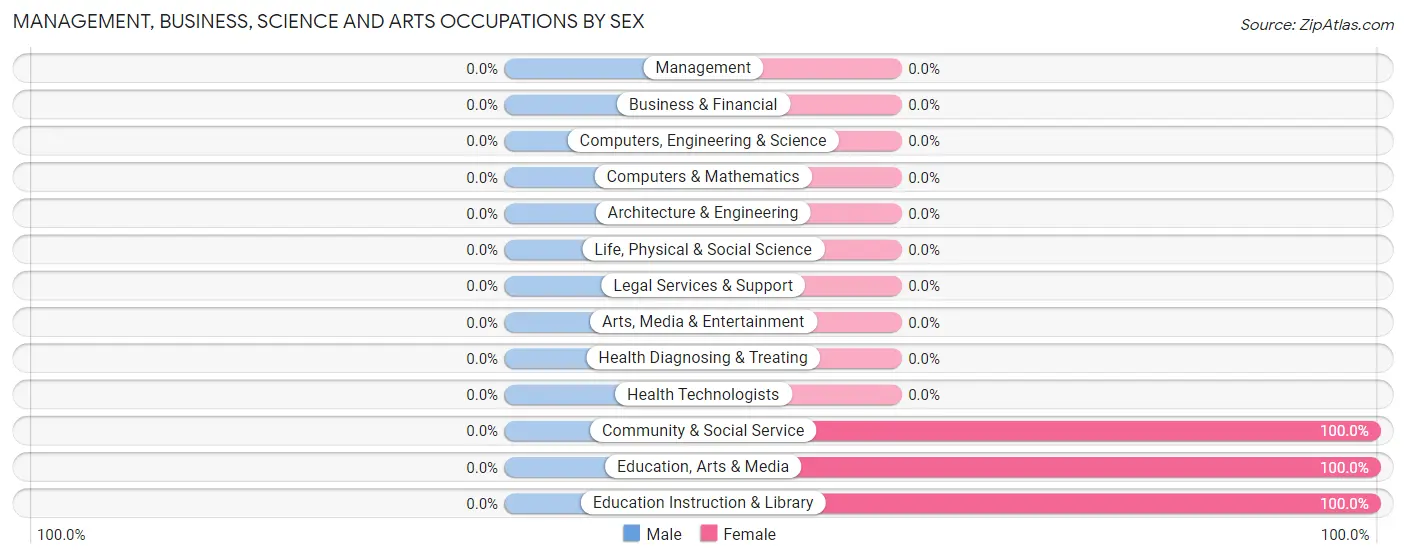
| Occupation | Male | Female |
| Management | 0 (0.0%) | 0 (0.0%) |
| Business & Financial | 0 (0.0%) | 0 (0.0%) |
| Computers, Engineering & Science | 0 (0.0%) | 0 (0.0%) |
| Computers & Mathematics | 0 (0.0%) | 0 (0.0%) |
| Architecture & Engineering | 0 (0.0%) | 0 (0.0%) |
| Life, Physical & Social Science | 0 (0.0%) | 0 (0.0%) |
| Community & Social Service | 0 (0.0%) | 15 (100.0%) |
| Education, Arts & Media | 0 (0.0%) | 6 (100.0%) |
| Legal Services & Support | 0 (0.0%) | 0 (0.0%) |
| Education Instruction & Library | 0 (0.0%) | 9 (100.0%) |
| Arts, Media & Entertainment | 0 (0.0%) | 0 (0.0%) |
| Health Diagnosing & Treating | 0 (0.0%) | 0 (0.0%) |
| Health Technologists | 0 (0.0%) | 0 (0.0%) |
| Total (Category) | 0 (0.0%) | 15 (100.0%) |
| Total (Overall) | 24 (35.8%) | 43 (64.2%) |
Services Occupations
The most common Services occupations in Benbow are , and Food Preparation & Serving (21 | 31.3%).
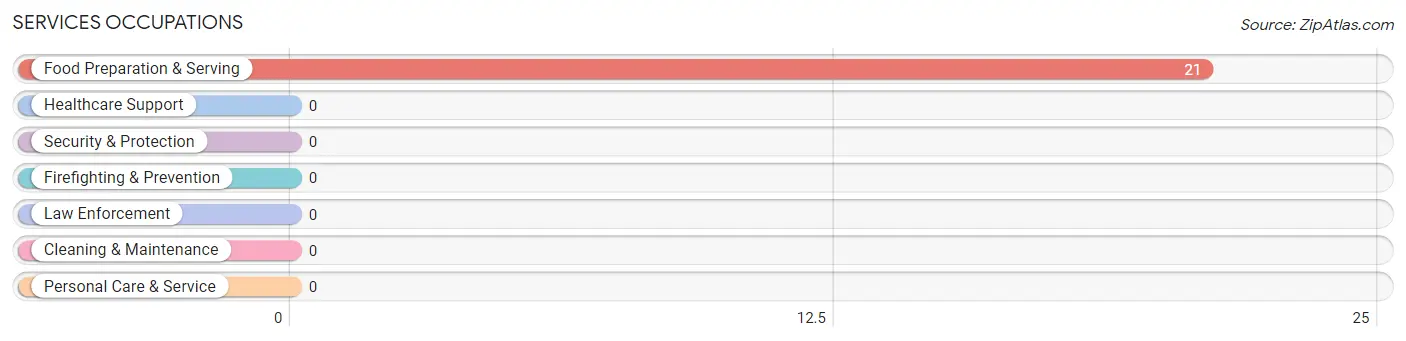
Services Occupations by Sex
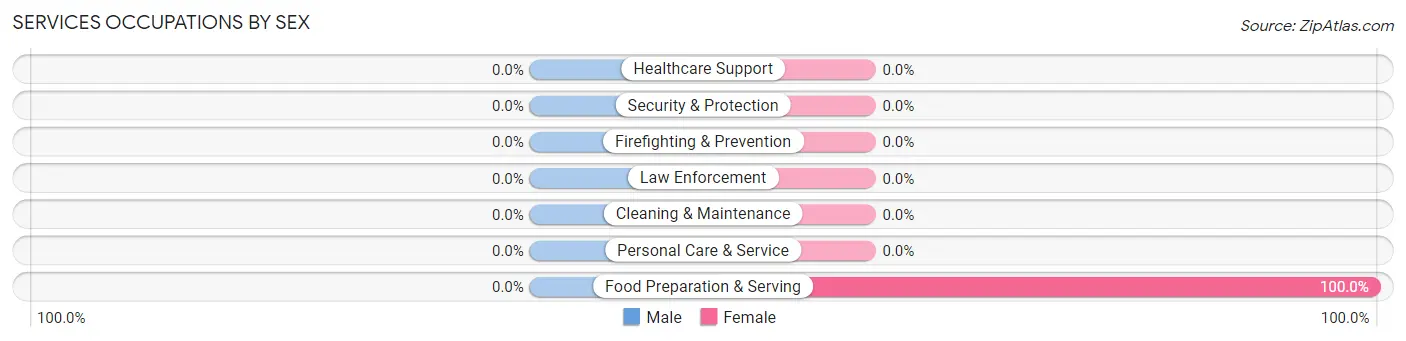
| Occupation | Male | Female |
| Healthcare Support | 0 (0.0%) | 0 (0.0%) |
| Security & Protection | 0 (0.0%) | 0 (0.0%) |
| Firefighting & Prevention | 0 (0.0%) | 0 (0.0%) |
| Law Enforcement | 0 (0.0%) | 0 (0.0%) |
| Food Preparation & Serving | 0 (0.0%) | 21 (100.0%) |
| Cleaning & Maintenance | 0 (0.0%) | 0 (0.0%) |
| Personal Care & Service | 0 (0.0%) | 0 (0.0%) |
| Total (Category) | 0 (0.0%) | 21 (100.0%) |
| Total (Overall) | 24 (35.8%) | 43 (64.2%) |
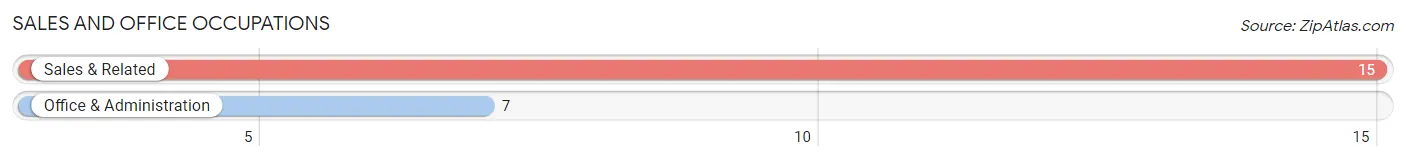
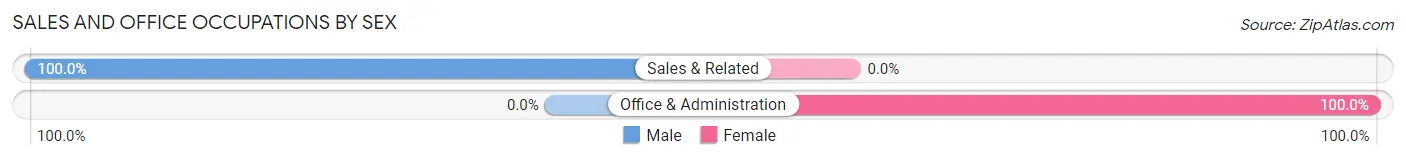
Sales and Office Occupations
The most common Sales and Office occupations in Benbow are Sales & Related (15 | 22.4%), and Office & Administration (7 | 10.4%).
Sales and Office Occupations by Sex
| Occupation | Male | Female |
| Sales & Related | 15 (100.0%) | 0 (0.0%) |
| Office & Administration | 0 (0.0%) | 7 (100.0%) |
| Total (Category) | 15 (68.2%) | 7 (31.8%) |
| Total (Overall) | 24 (35.8%) | 43 (64.2%) |
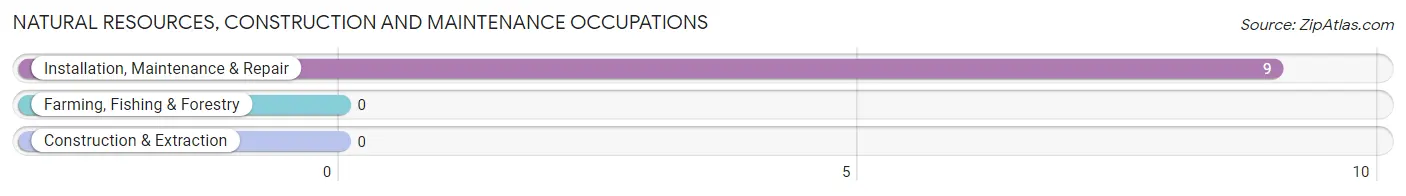
Natural Resources, Construction and Maintenance Occupations
The most common Natural Resources, Construction and Maintenance occupations in Benbow are , and Installation, Maintenance & Repair (9 | 13.4%).
Natural Resources, Construction and Maintenance Occupations by Sex
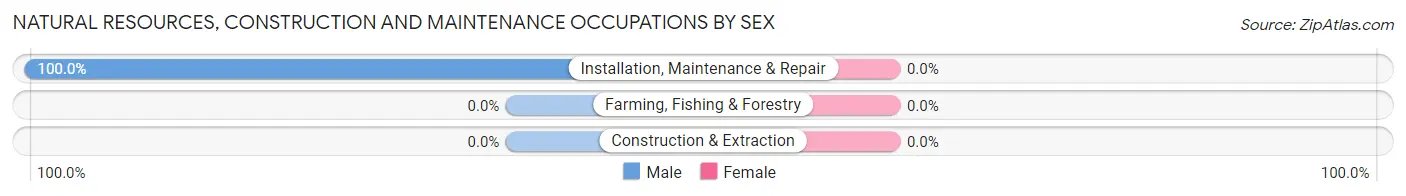
| Occupation | Male | Female |
| Farming, Fishing & Forestry | 0 (0.0%) | 0 (0.0%) |
| Construction & Extraction | 0 (0.0%) | 0 (0.0%) |
| Installation, Maintenance & Repair | 9 (100.0%) | 0 (0.0%) |
| Total (Category) | 9 (100.0%) | 0 (0.0%) |
| Total (Overall) | 24 (35.8%) | 43 (64.2%) |
Production, Transportation and Moving Occupations
Production, Transportation and Moving Occupations by Sex
| Occupation | Male | Female |
| Production | 0 (0.0%) | 0 (0.0%) |
| Transportation | 0 (0.0%) | 0 (0.0%) |
| Material Moving | 0 (0.0%) | 0 (0.0%) |
| Total (Category) | 0 (0.0%) | 0 (0.0%) |
| Total (Overall) | 24 (35.8%) | 43 (64.2%) |
Employment Industries by Sex in Benbow
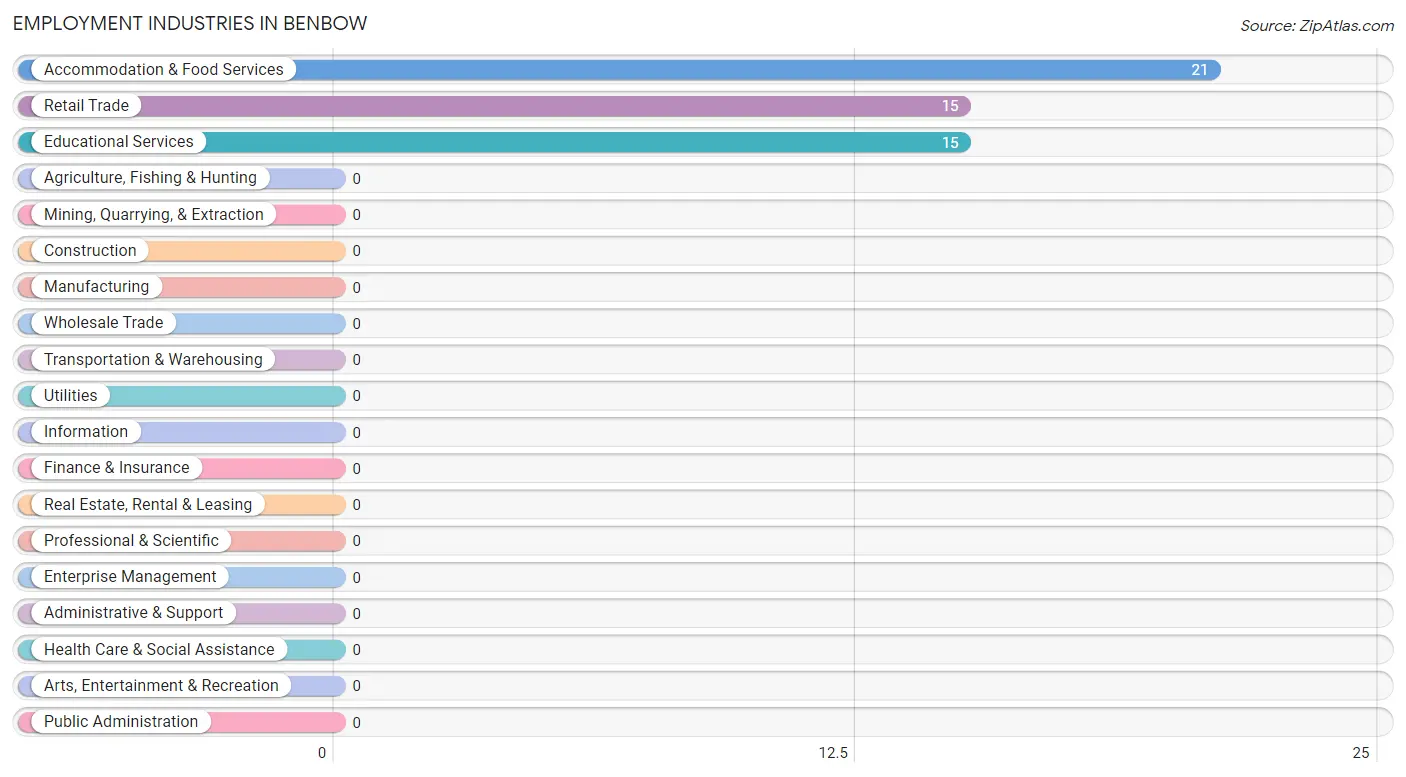
Employment Industries in Benbow
The major employment industries in Benbow include Accommodation & Food Services (21 | 31.3%), Retail Trade (15 | 22.4%), and Educational Services (15 | 22.4%).
Employment Industries by Sex in Benbow
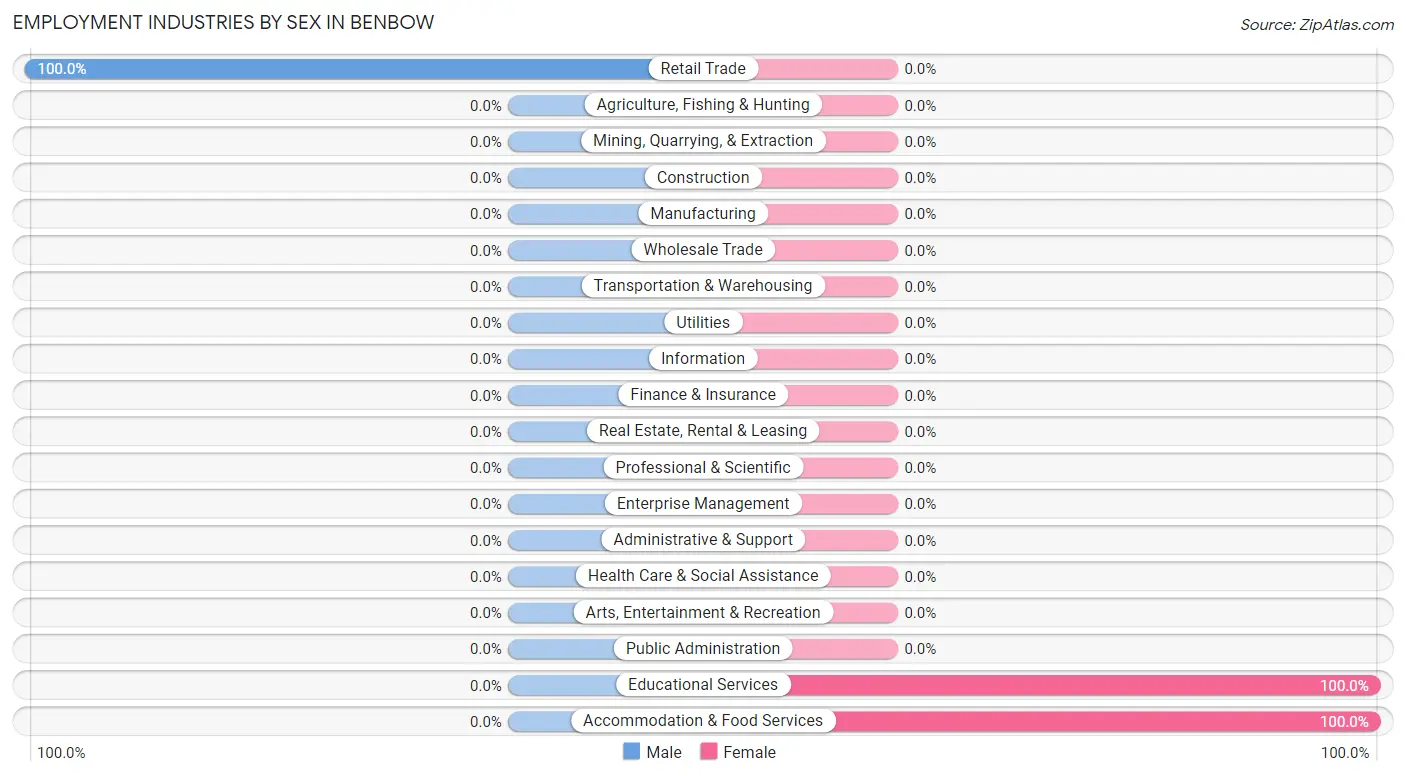
| Industry | Male | Female |
| Agriculture, Fishing & Hunting | 0 (0.0%) | 0 (0.0%) |
| Mining, Quarrying, & Extraction | 0 (0.0%) | 0 (0.0%) |
| Construction | 0 (0.0%) | 0 (0.0%) |
| Manufacturing | 0 (0.0%) | 0 (0.0%) |
| Wholesale Trade | 0 (0.0%) | 0 (0.0%) |
| Retail Trade | 15 (100.0%) | 0 (0.0%) |
| Transportation & Warehousing | 0 (0.0%) | 0 (0.0%) |
| Utilities | 0 (0.0%) | 0 (0.0%) |
| Information | 0 (0.0%) | 0 (0.0%) |
| Finance & Insurance | 0 (0.0%) | 0 (0.0%) |
| Real Estate, Rental & Leasing | 0 (0.0%) | 0 (0.0%) |
| Professional & Scientific | 0 (0.0%) | 0 (0.0%) |
| Enterprise Management | 0 (0.0%) | 0 (0.0%) |
| Administrative & Support | 0 (0.0%) | 0 (0.0%) |
| Educational Services | 0 (0.0%) | 15 (100.0%) |
| Health Care & Social Assistance | 0 (0.0%) | 0 (0.0%) |
| Arts, Entertainment & Recreation | 0 (0.0%) | 0 (0.0%) |
| Accommodation & Food Services | 0 (0.0%) | 21 (100.0%) |
| Public Administration | 0 (0.0%) | 0 (0.0%) |
| Total | 24 (35.8%) | 43 (64.2%) |
Education in Benbow
School Enrollment in Benbow
| School Level | # Students | % Students |
| Nursery / Preschool | 0 | 0.0% |
| Kindergarten | 0 | 0.0% |
| Elementary School | 0 | 0.0% |
| Middle School | 0 | 0.0% |
| High School | 0 | 0.0% |
| College / Undergraduate | 0 | 0.0% |
| Graduate / Professional | 0 | 0.0% |
| Total | 0 | 0.0% |
School Enrollment by Age by Funding Source in Benbow
| Age Bracket | Public School | Private School |
| 3 to 4 Year Olds | 0 (0.0%) | 0 (0.0%) |
| 5 to 9 Year Old | 0 (0.0%) | 0 (0.0%) |
| 10 to 14 Year Olds | 0 (0.0%) | 0 (0.0%) |
| 15 to 17 Year Olds | 0 (0.0%) | 0 (0.0%) |
| 18 to 19 Year Olds | 0 (0.0%) | 0 (0.0%) |
| 20 to 24 Year Olds | 0 (0.0%) | 0 (0.0%) |
| 25 to 34 Year Olds | 0 (0.0%) | 0 (0.0%) |
| 35 Years and over | 0 (0.0%) | 0 (0.0%) |
| Total | 0 (0.0%) | 0 (0.0%) |
Educational Attainment by Field of Study in Benbow
Social sciences (6 | 75.0%), and arts & humanities (2 | 25.0%) are the most common fields of study among 8 individuals in Benbow who have obtained a bachelor's degree or higher.
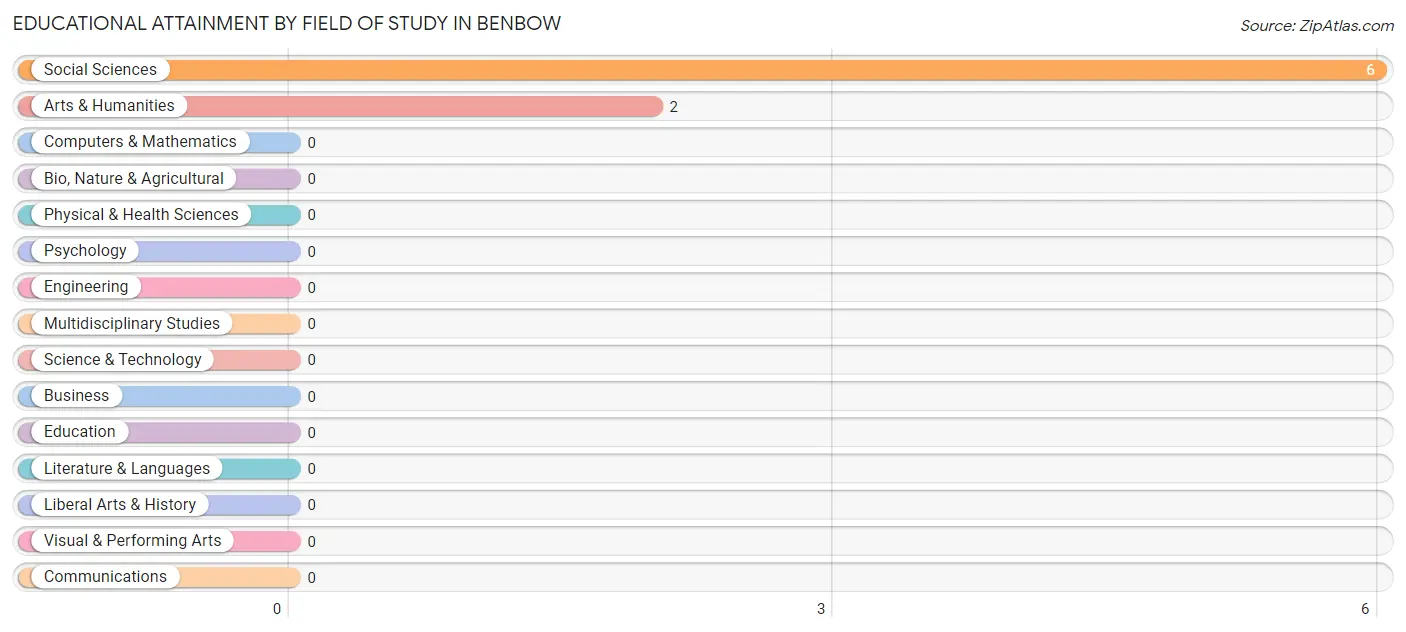
| Field of Study | # Graduates | % Graduates |
| Computers & Mathematics | 0 | 0.0% |
| Bio, Nature & Agricultural | 0 | 0.0% |
| Physical & Health Sciences | 0 | 0.0% |
| Psychology | 0 | 0.0% |
| Social Sciences | 6 | 75.0% |
| Engineering | 0 | 0.0% |
| Multidisciplinary Studies | 0 | 0.0% |
| Science & Technology | 0 | 0.0% |
| Business | 0 | 0.0% |
| Education | 0 | 0.0% |
| Literature & Languages | 0 | 0.0% |
| Liberal Arts & History | 0 | 0.0% |
| Visual & Performing Arts | 0 | 0.0% |
| Communications | 0 | 0.0% |
| Arts & Humanities | 2 | 25.0% |
| Total | 8 | 100.0% |
Transportation & Commute in Benbow
Vehicle Availability by Sex in Benbow
The most prevalent vehicle ownership categories in Benbow are males with 1 vehicle (15, accounting for 62.5%) and females with 1 vehicle (0, making up 34.9%).
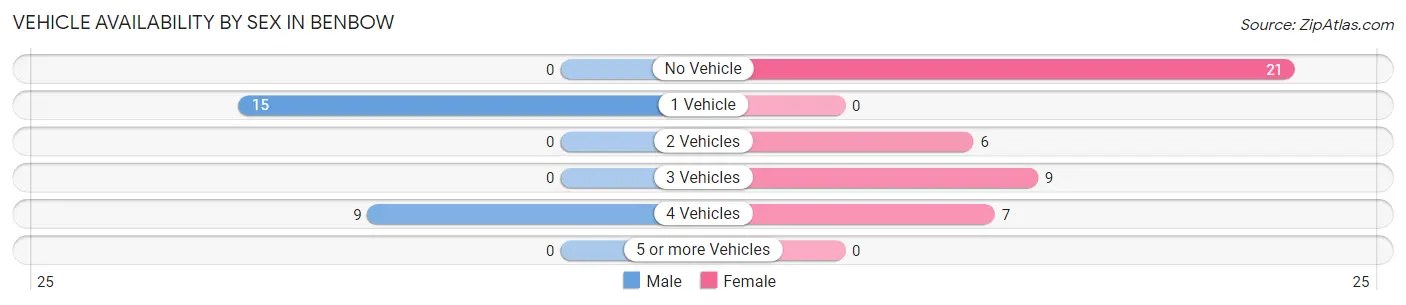
| Vehicles Available | Male | Female |
| No Vehicle | 0 (0.0%) | 21 (48.8%) |
| 1 Vehicle | 15 (62.5%) | 0 (0.0%) |
| 2 Vehicles | 0 (0.0%) | 6 (14.0%) |
| 3 Vehicles | 0 (0.0%) | 9 (20.9%) |
| 4 Vehicles | 9 (37.5%) | 7 (16.3%) |
| 5 or more Vehicles | 0 (0.0%) | 0 (0.0%) |
| Total | 24 (100.0%) | 43 (100.0%) |
Commute Time in Benbow
The most frequently occuring commute durations in Benbow are 15 to 19 minutes (31 commuters, 50.8%), 10 to 14 minutes (21 commuters, 34.4%), and 30 to 34 minutes (9 commuters, 14.7%).
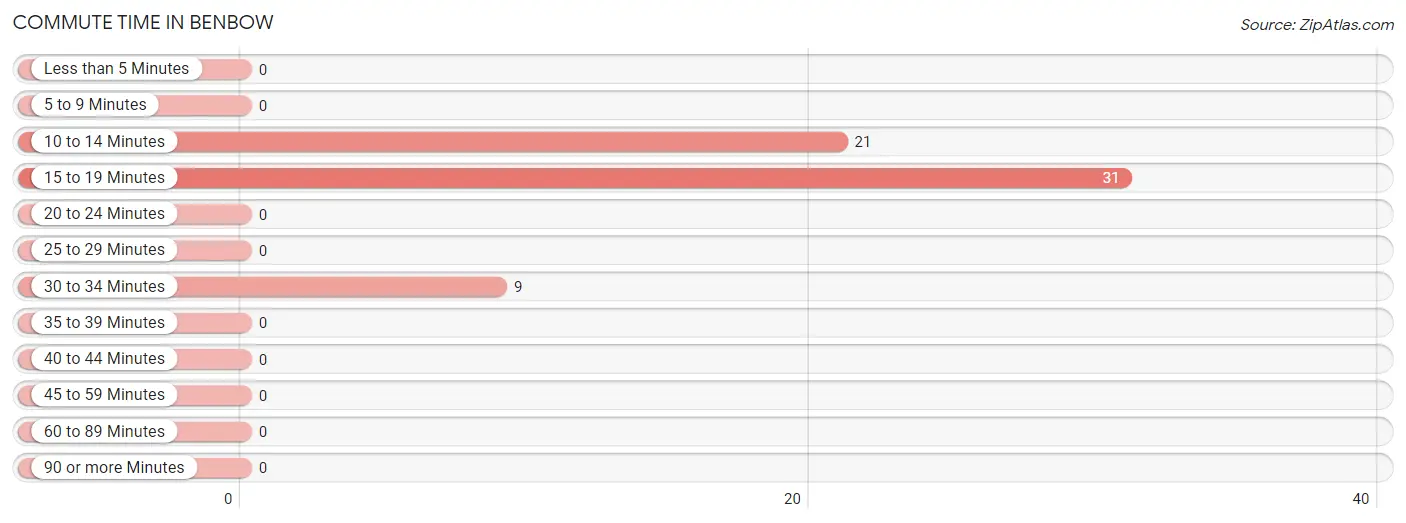
| Commute Time | # Commuters | % Commuters |
| Less than 5 Minutes | 0 | 0.0% |
| 5 to 9 Minutes | 0 | 0.0% |
| 10 to 14 Minutes | 21 | 34.4% |
| 15 to 19 Minutes | 31 | 50.8% |
| 20 to 24 Minutes | 0 | 0.0% |
| 25 to 29 Minutes | 0 | 0.0% |
| 30 to 34 Minutes | 9 | 14.7% |
| 35 to 39 Minutes | 0 | 0.0% |
| 40 to 44 Minutes | 0 | 0.0% |
| 45 to 59 Minutes | 0 | 0.0% |
| 60 to 89 Minutes | 0 | 0.0% |
| 90 or more Minutes | 0 | 0.0% |
Commute Time by Sex in Benbow
The most common commute times in Benbow are 15 to 19 minutes (24 commuters, 100.0%) for males and 10 to 14 minutes (21 commuters, 56.8%) for females.
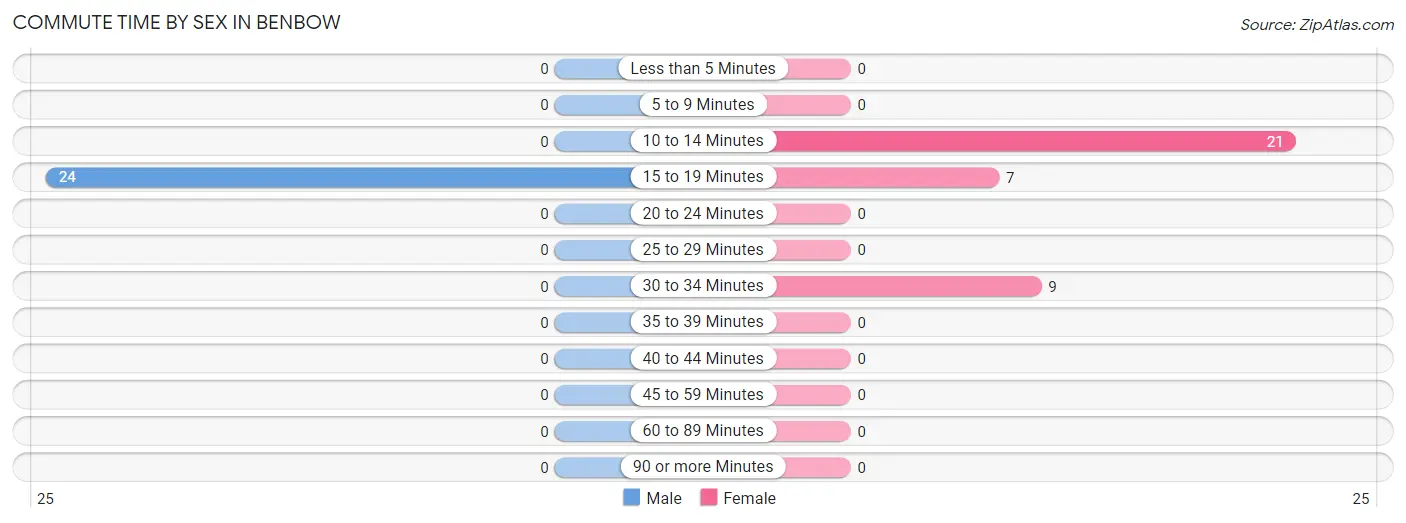
| Commute Time | Male | Female |
| Less than 5 Minutes | 0 (0.0%) | 0 (0.0%) |
| 5 to 9 Minutes | 0 (0.0%) | 0 (0.0%) |
| 10 to 14 Minutes | 0 (0.0%) | 21 (56.8%) |
| 15 to 19 Minutes | 24 (100.0%) | 7 (18.9%) |
| 20 to 24 Minutes | 0 (0.0%) | 0 (0.0%) |
| 25 to 29 Minutes | 0 (0.0%) | 0 (0.0%) |
| 30 to 34 Minutes | 0 (0.0%) | 9 (24.3%) |
| 35 to 39 Minutes | 0 (0.0%) | 0 (0.0%) |
| 40 to 44 Minutes | 0 (0.0%) | 0 (0.0%) |
| 45 to 59 Minutes | 0 (0.0%) | 0 (0.0%) |
| 60 to 89 Minutes | 0 (0.0%) | 0 (0.0%) |
| 90 or more Minutes | 0 (0.0%) | 0 (0.0%) |
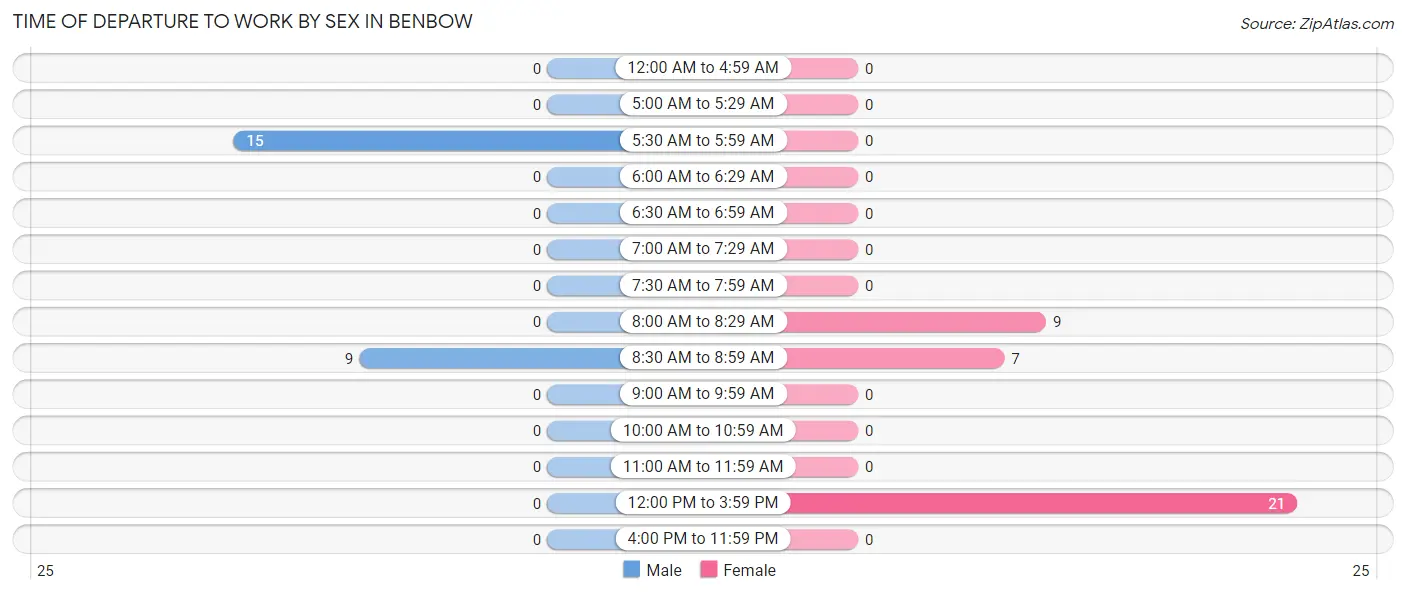
Time of Departure to Work by Sex in Benbow
The most frequent times of departure to work in Benbow are 5:30 AM to 5:59 AM (15, 62.5%) for males and 12:00 PM to 3:59 PM (21, 56.8%) for females.
| Time of Departure | Male | Female |
| 12:00 AM to 4:59 AM | 0 (0.0%) | 0 (0.0%) |
| 5:00 AM to 5:29 AM | 0 (0.0%) | 0 (0.0%) |
| 5:30 AM to 5:59 AM | 15 (62.5%) | 0 (0.0%) |
| 6:00 AM to 6:29 AM | 0 (0.0%) | 0 (0.0%) |
| 6:30 AM to 6:59 AM | 0 (0.0%) | 0 (0.0%) |
| 7:00 AM to 7:29 AM | 0 (0.0%) | 0 (0.0%) |
| 7:30 AM to 7:59 AM | 0 (0.0%) | 0 (0.0%) |
| 8:00 AM to 8:29 AM | 0 (0.0%) | 9 (24.3%) |
| 8:30 AM to 8:59 AM | 9 (37.5%) | 7 (18.9%) |
| 9:00 AM to 9:59 AM | 0 (0.0%) | 0 (0.0%) |
| 10:00 AM to 10:59 AM | 0 (0.0%) | 0 (0.0%) |
| 11:00 AM to 11:59 AM | 0 (0.0%) | 0 (0.0%) |
| 12:00 PM to 3:59 PM | 0 (0.0%) | 21 (56.8%) |
| 4:00 PM to 11:59 PM | 0 (0.0%) | 0 (0.0%) |
| Total | 24 (100.0%) | 37 (100.0%) |
Housing Occupancy in Benbow
Occupancy by Ownership in Benbow
Of the total 88 dwellings in Benbow, owner-occupied units account for 52 (59.1%), while renter-occupied units make up 36 (40.9%).
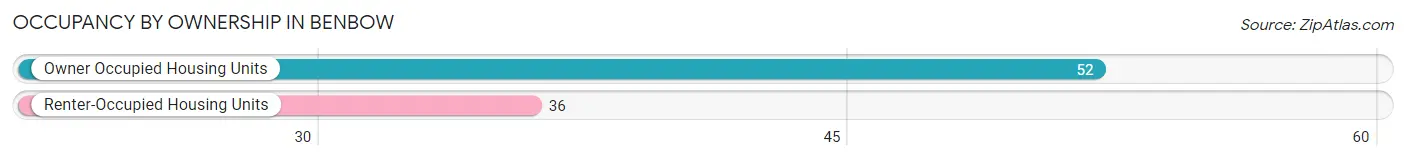
| Occupancy | # Housing Units | % Housing Units |
| Owner Occupied Housing Units | 52 | 59.1% |
| Renter-Occupied Housing Units | 36 | 40.9% |
| Total Occupied Housing Units | 88 | 100.0% |
Occupancy by Household Size in Benbow
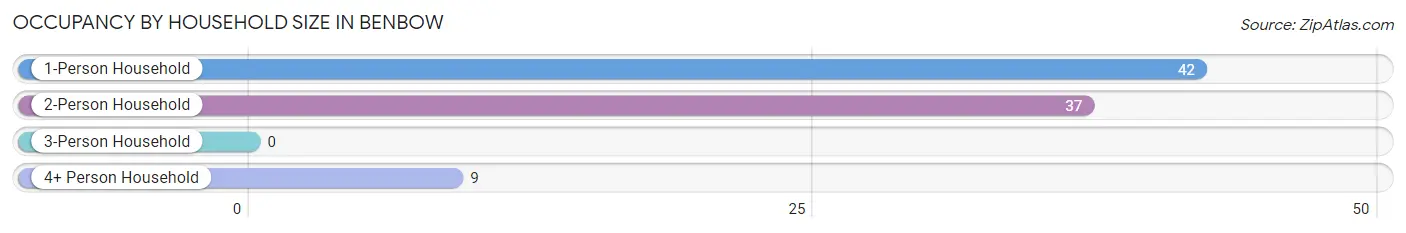
| Household Size | # Housing Units | % Housing Units |
| 1-Person Household | 42 | 47.7% |
| 2-Person Household | 37 | 42.0% |
| 3-Person Household | 0 | 0.0% |
| 4+ Person Household | 9 | 10.2% |
| Total Housing Units | 88 | 100.0% |
Occupancy by Ownership by Household Size in Benbow
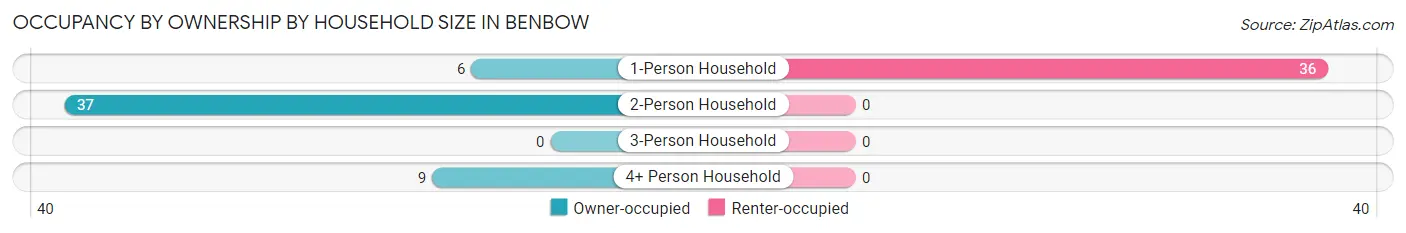
| Household Size | Owner-occupied | Renter-occupied |
| 1-Person Household | 6 (14.3%) | 36 (85.7%) |
| 2-Person Household | 37 (100.0%) | 0 (0.0%) |
| 3-Person Household | 0 (0.0%) | 0 (0.0%) |
| 4+ Person Household | 9 (100.0%) | 0 (0.0%) |
| Total Housing Units | 52 (59.1%) | 36 (40.9%) |
Occupancy by Educational Attainment in Benbow
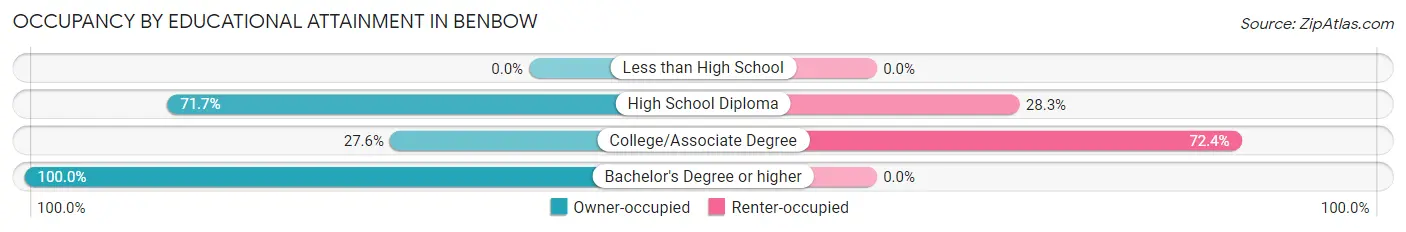
| Household Size | Owner-occupied | Renter-occupied |
| Less than High School | 0 (0.0%) | 0 (0.0%) |
| High School Diploma | 38 (71.7%) | 15 (28.3%) |
| College/Associate Degree | 8 (27.6%) | 21 (72.4%) |
| Bachelor's Degree or higher | 6 (100.0%) | 0 (0.0%) |
Occupancy by Age of Householder in Benbow
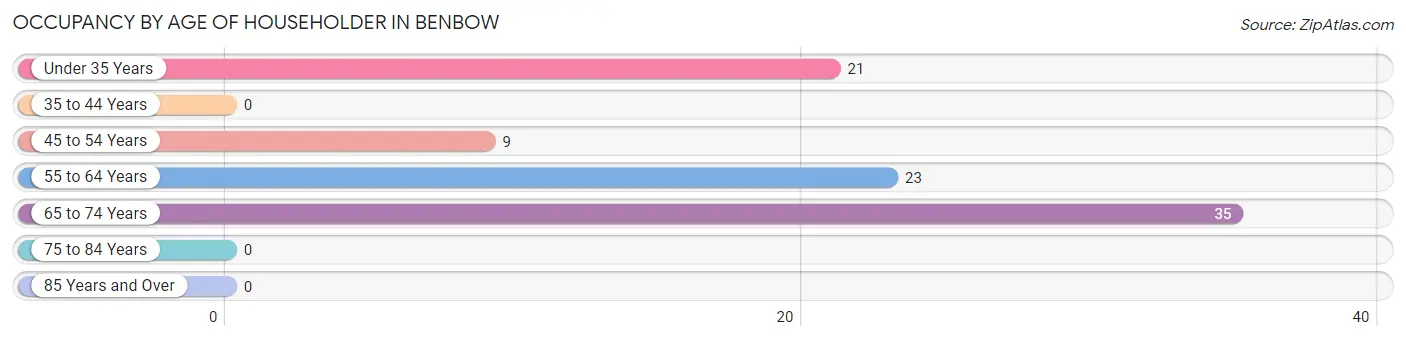
| Age Bracket | # Households | % Households |
| Under 35 Years | 21 | 23.9% |
| 35 to 44 Years | 0 | 0.0% |
| 45 to 54 Years | 9 | 10.2% |
| 55 to 64 Years | 23 | 26.1% |
| 65 to 74 Years | 35 | 39.8% |
| 75 to 84 Years | 0 | 0.0% |
| 85 Years and Over | 0 | 0.0% |
| Total | 88 | 100.0% |
Housing Finances in Benbow
Median Income by Occupancy in Benbow
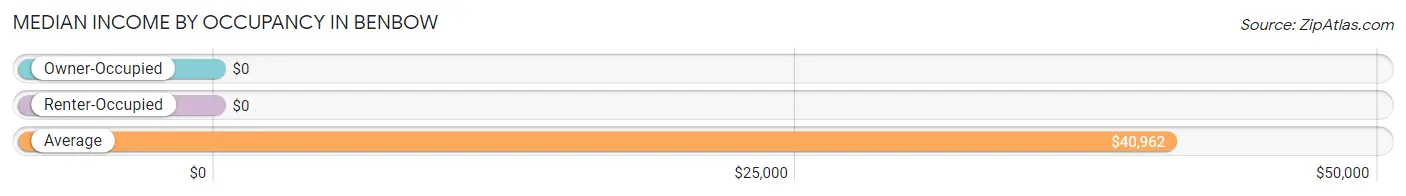
| Occupancy Type | # Households | Median Income |
| Owner-Occupied | 52 (59.1%) | $0 |
| Renter-Occupied | 36 (40.9%) | $0 |
| Average | 88 (100.0%) | $40,962 |
Occupancy by Householder Income Bracket in Benbow
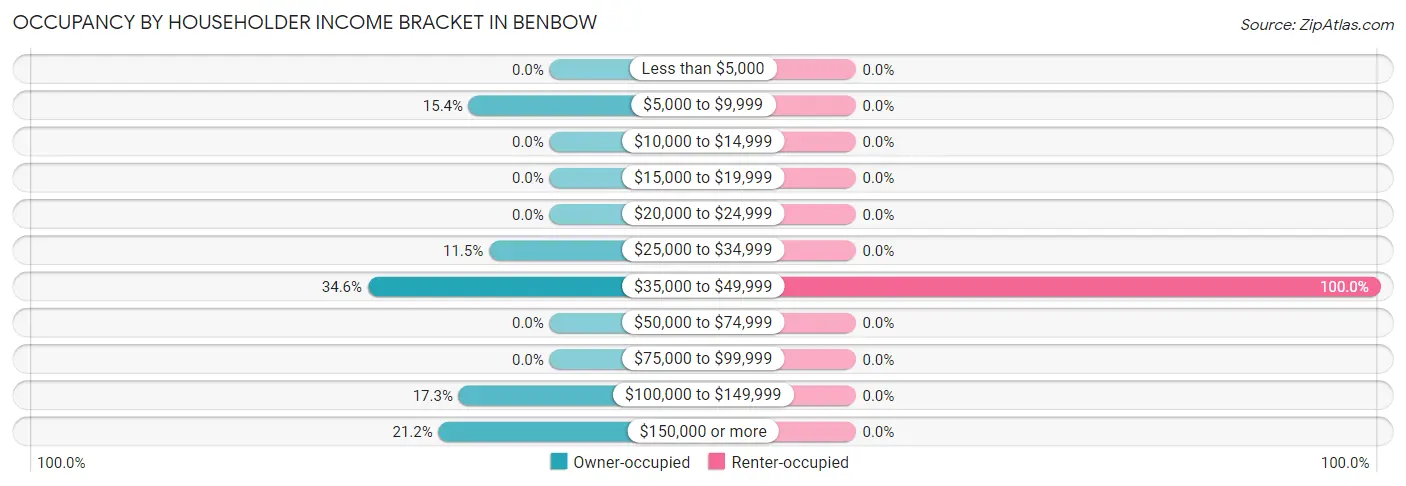
| Income Bracket | Owner-occupied | Renter-occupied |
| Less than $5,000 | 0 (0.0%) | 0 (0.0%) |
| $5,000 to $9,999 | 8 (15.4%) | 0 (0.0%) |
| $10,000 to $14,999 | 0 (0.0%) | 0 (0.0%) |
| $15,000 to $19,999 | 0 (0.0%) | 0 (0.0%) |
| $20,000 to $24,999 | 0 (0.0%) | 0 (0.0%) |
| $25,000 to $34,999 | 6 (11.5%) | 0 (0.0%) |
| $35,000 to $49,999 | 18 (34.6%) | 36 (100.0%) |
| $50,000 to $74,999 | 0 (0.0%) | 0 (0.0%) |
| $75,000 to $99,999 | 0 (0.0%) | 0 (0.0%) |
| $100,000 to $149,999 | 9 (17.3%) | 0 (0.0%) |
| $150,000 or more | 11 (21.1%) | 0 (0.0%) |
| Total | 52 (100.0%) | 36 (100.0%) |
Monthly Housing Cost Tiers in Benbow
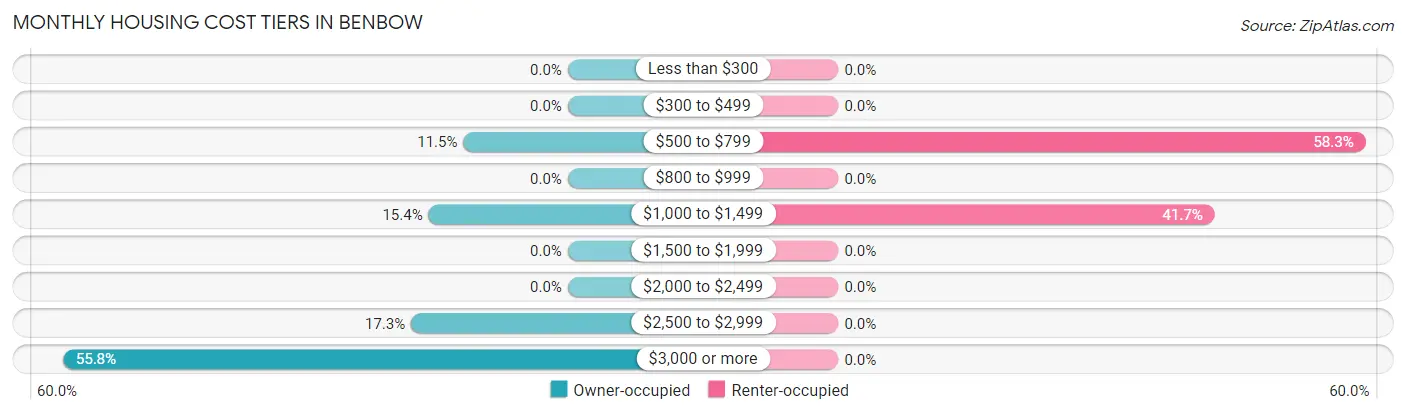
| Monthly Cost | Owner-occupied | Renter-occupied |
| Less than $300 | 0 (0.0%) | 0 (0.0%) |
| $300 to $499 | 0 (0.0%) | 0 (0.0%) |
| $500 to $799 | 6 (11.5%) | 21 (58.3%) |
| $800 to $999 | 0 (0.0%) | 0 (0.0%) |
| $1,000 to $1,499 | 8 (15.4%) | 15 (41.7%) |
| $1,500 to $1,999 | 0 (0.0%) | 0 (0.0%) |
| $2,000 to $2,499 | 0 (0.0%) | 0 (0.0%) |
| $2,500 to $2,999 | 9 (17.3%) | 0 (0.0%) |
| $3,000 or more | 29 (55.8%) | 0 (0.0%) |
| Total | 52 (100.0%) | 36 (100.0%) |
Physical Housing Characteristics in Benbow
Housing Structures in Benbow
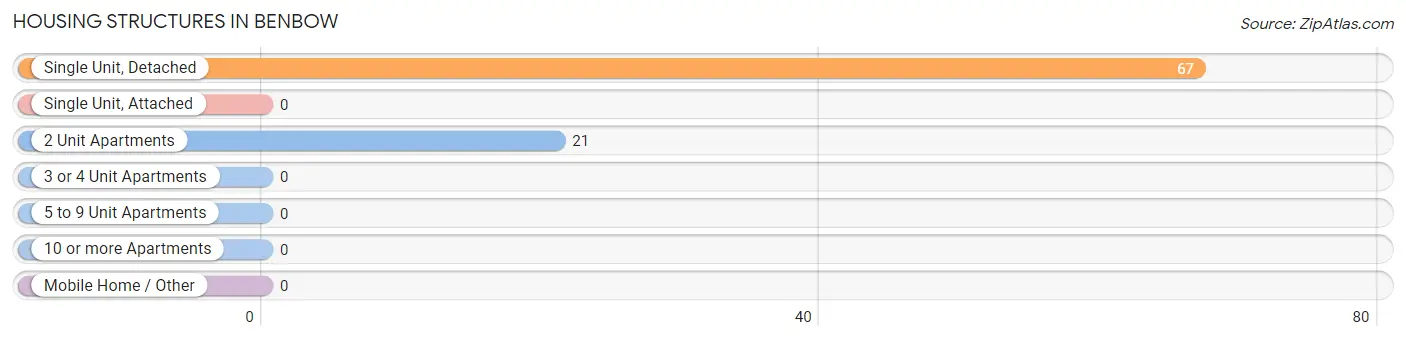
| Structure Type | # Housing Units | % Housing Units |
| Single Unit, Detached | 67 | 76.1% |
| Single Unit, Attached | 0 | 0.0% |
| 2 Unit Apartments | 21 | 23.9% |
| 3 or 4 Unit Apartments | 0 | 0.0% |
| 5 to 9 Unit Apartments | 0 | 0.0% |
| 10 or more Apartments | 0 | 0.0% |
| Mobile Home / Other | 0 | 0.0% |
| Total | 88 | 100.0% |
Housing Structures by Occupancy in Benbow
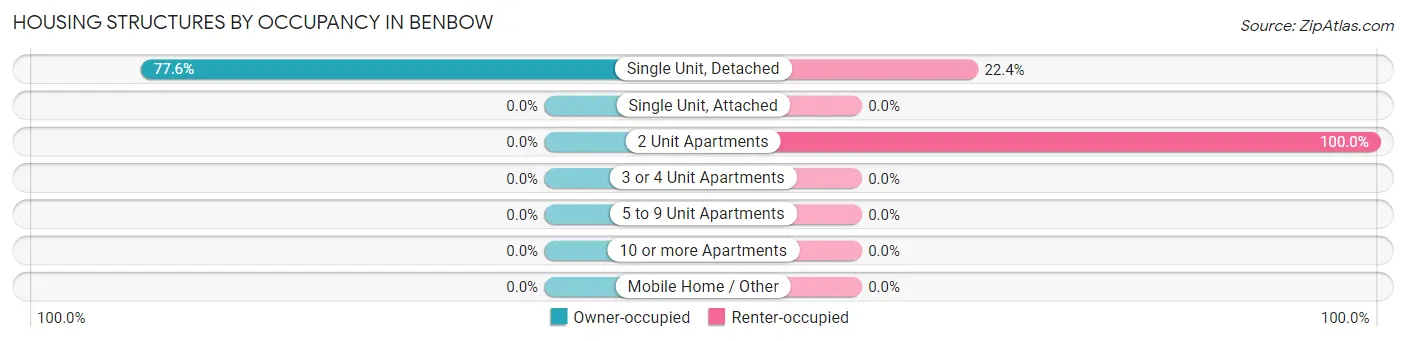
| Structure Type | Owner-occupied | Renter-occupied |
| Single Unit, Detached | 52 (77.6%) | 15 (22.4%) |
| Single Unit, Attached | 0 (0.0%) | 0 (0.0%) |
| 2 Unit Apartments | 0 (0.0%) | 21 (100.0%) |
| 3 or 4 Unit Apartments | 0 (0.0%) | 0 (0.0%) |
| 5 to 9 Unit Apartments | 0 (0.0%) | 0 (0.0%) |
| 10 or more Apartments | 0 (0.0%) | 0 (0.0%) |
| Mobile Home / Other | 0 (0.0%) | 0 (0.0%) |
| Total | 52 (59.1%) | 36 (40.9%) |
Housing Structures by Number of Rooms in Benbow
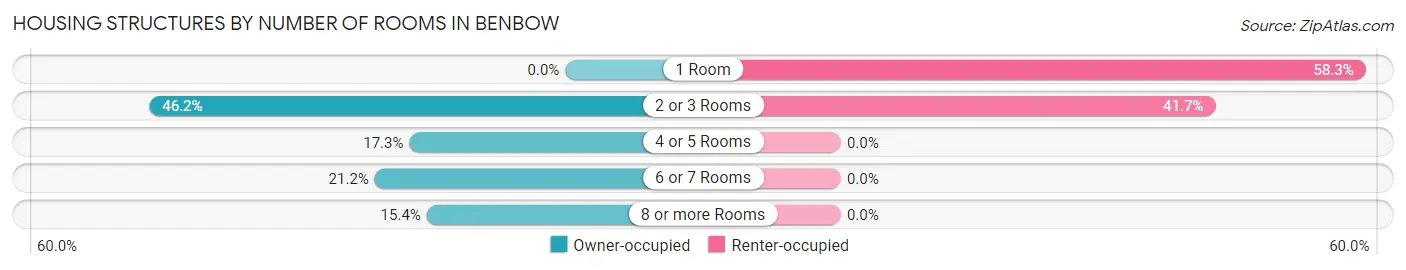
| Number of Rooms | Owner-occupied | Renter-occupied |
| 1 Room | 0 (0.0%) | 21 (58.3%) |
| 2 or 3 Rooms | 24 (46.2%) | 15 (41.7%) |
| 4 or 5 Rooms | 9 (17.3%) | 0 (0.0%) |
| 6 or 7 Rooms | 11 (21.1%) | 0 (0.0%) |
| 8 or more Rooms | 8 (15.4%) | 0 (0.0%) |
| Total | 52 (100.0%) | 36 (100.0%) |
Housing Structure by Heating Type in Benbow
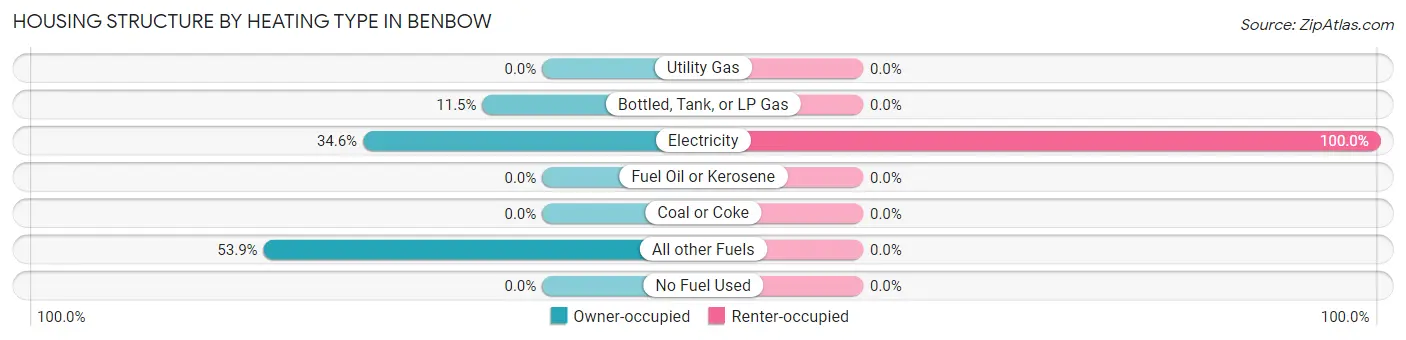
| Heating Type | Owner-occupied | Renter-occupied |
| Utility Gas | 0 (0.0%) | 0 (0.0%) |
| Bottled, Tank, or LP Gas | 6 (11.5%) | 0 (0.0%) |
| Electricity | 18 (34.6%) | 36 (100.0%) |
| Fuel Oil or Kerosene | 0 (0.0%) | 0 (0.0%) |
| Coal or Coke | 0 (0.0%) | 0 (0.0%) |
| All other Fuels | 28 (53.8%) | 0 (0.0%) |
| No Fuel Used | 0 (0.0%) | 0 (0.0%) |
| Total | 52 (100.0%) | 36 (100.0%) |
Household Vehicle Usage in Benbow
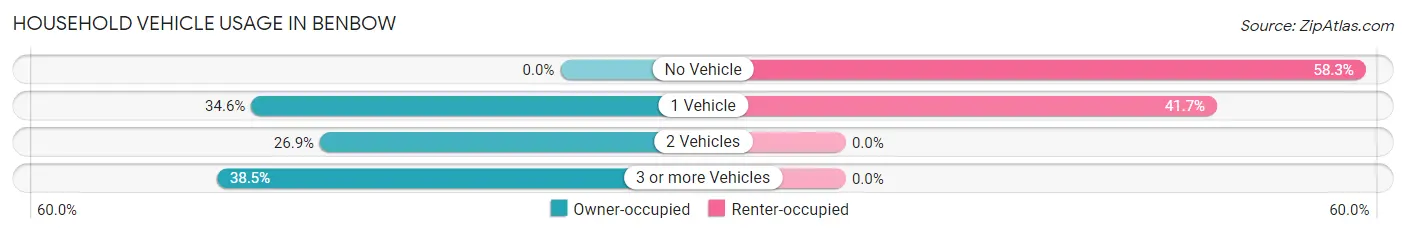
| Vehicles per Household | Owner-occupied | Renter-occupied |
| No Vehicle | 0 (0.0%) | 21 (58.3%) |
| 1 Vehicle | 18 (34.6%) | 15 (41.7%) |
| 2 Vehicles | 14 (26.9%) | 0 (0.0%) |
| 3 or more Vehicles | 20 (38.5%) | 0 (0.0%) |
| Total | 52 (100.0%) | 36 (100.0%) |
Real Estate & Mortgages in Benbow
Real Estate and Mortgage Overview in Benbow
| Characteristic | Without Mortgage | With Mortgage |
| Housing Units | 6 | 46 |
| Median Property Value | - | - |
| Median Household Income | - | - |
| Monthly Housing Costs | - | - |
| Real Estate Taxes | - | - |
Property Value by Mortgage Status in Benbow
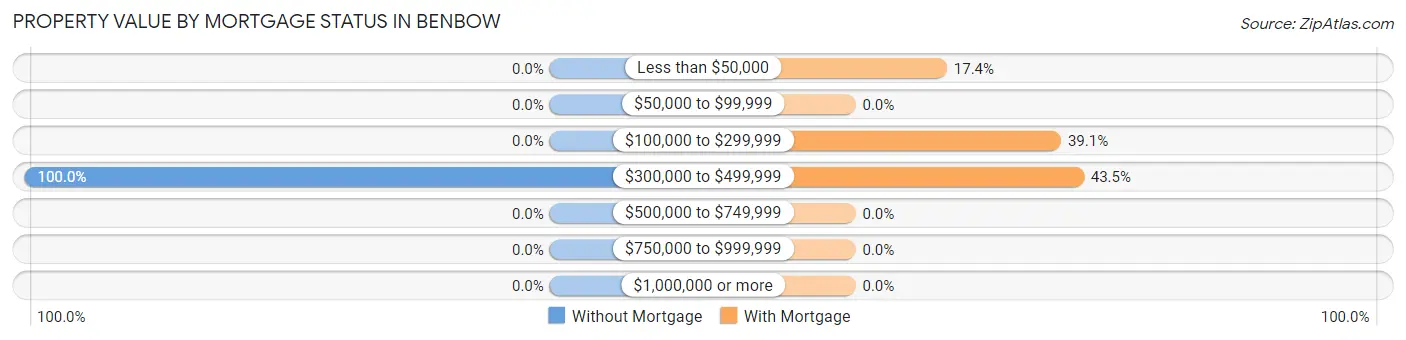
| Property Value | Without Mortgage | With Mortgage |
| Less than $50,000 | 0 (0.0%) | 8 (17.4%) |
| $50,000 to $99,999 | 0 (0.0%) | 0 (0.0%) |
| $100,000 to $299,999 | 0 (0.0%) | 18 (39.1%) |
| $300,000 to $499,999 | 6 (100.0%) | 20 (43.5%) |
| $500,000 to $749,999 | 0 (0.0%) | 0 (0.0%) |
| $750,000 to $999,999 | 0 (0.0%) | 0 (0.0%) |
| $1,000,000 or more | 0 (0.0%) | 0 (0.0%) |
| Total | 6 (100.0%) | 46 (100.0%) |
Household Income by Mortgage Status in Benbow
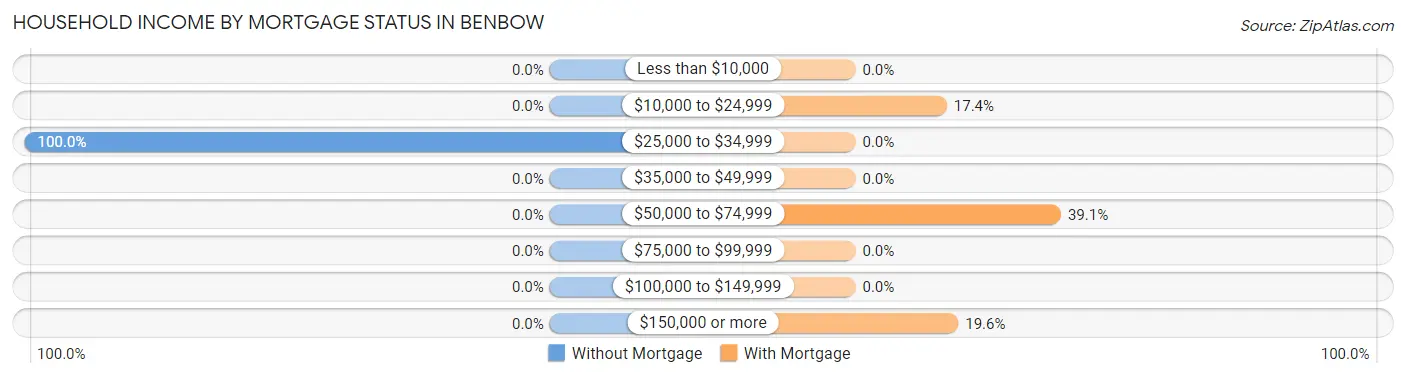
| Household Income | Without Mortgage | With Mortgage |
| Less than $10,000 | 0 (0.0%) | 0 (0.0%) |
| $10,000 to $24,999 | 0 (0.0%) | 8 (17.4%) |
| $25,000 to $34,999 | 6 (100.0%) | 0 (0.0%) |
| $35,000 to $49,999 | 0 (0.0%) | 0 (0.0%) |
| $50,000 to $74,999 | 0 (0.0%) | 18 (39.1%) |
| $75,000 to $99,999 | 0 (0.0%) | 0 (0.0%) |
| $100,000 to $149,999 | 0 (0.0%) | 0 (0.0%) |
| $150,000 or more | 0 (0.0%) | 9 (19.6%) |
| Total | 6 (100.0%) | 46 (100.0%) |
Property Value to Household Income Ratio in Benbow
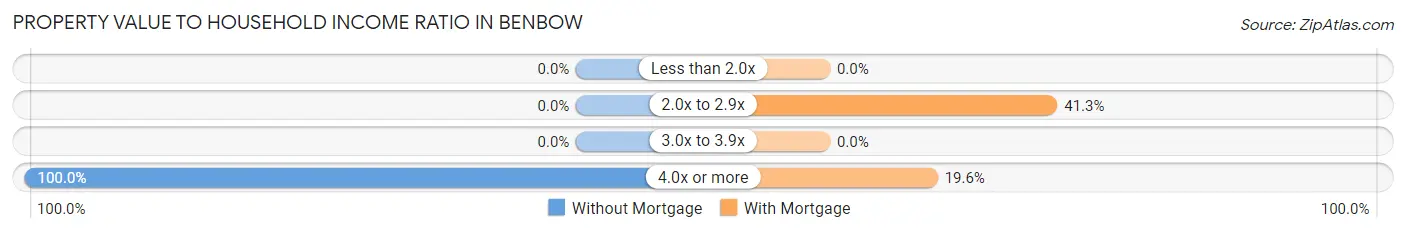
| Value-to-Income Ratio | Without Mortgage | With Mortgage |
| Less than 2.0x | 0 (0.0%) | 0 (0.0%) |
| 2.0x to 2.9x | 0 (0.0%) | 19 (41.3%) |
| 3.0x to 3.9x | 0 (0.0%) | 0 (0.0%) |
| 4.0x or more | 6 (100.0%) | 9 (19.6%) |
| Total | 6 (100.0%) | 46 (100.0%) |
Real Estate Taxes by Mortgage Status in Benbow
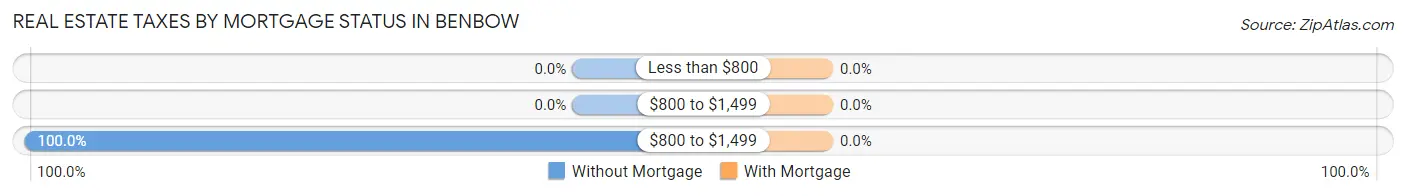
| Property Taxes | Without Mortgage | With Mortgage |
| Less than $800 | 0 (0.0%) | 0 (0.0%) |
| $800 to $1,499 | 0 (0.0%) | 0 (0.0%) |
| $800 to $1,499 | 6 (100.0%) | 0 (0.0%) |
| Total | 6 (100.0%) | 46 (100.0%) |
Health & Disability in Benbow
Health Insurance Coverage by Age in Benbow
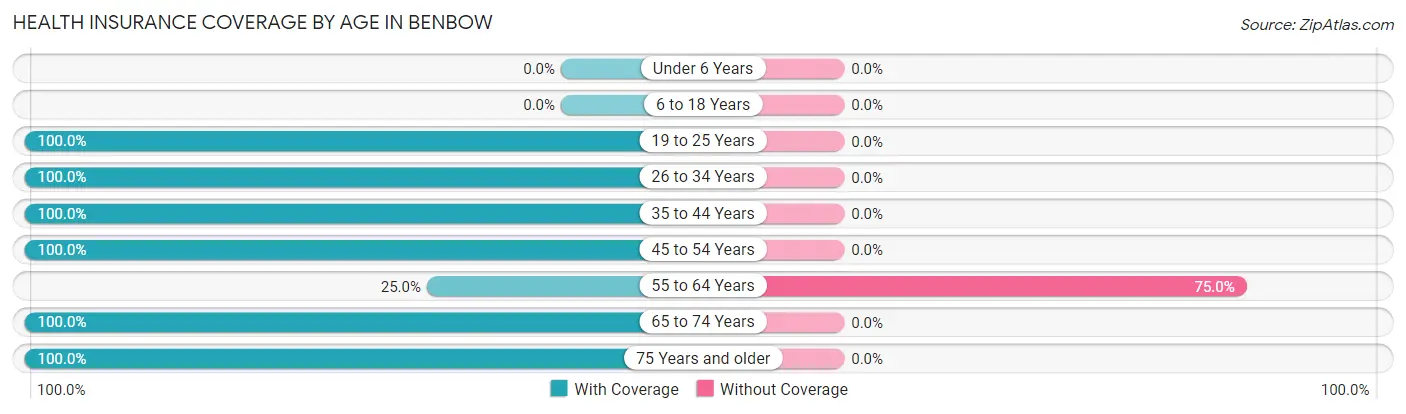
| Age Bracket | With Coverage | Without Coverage |
| Under 6 Years | 0 (0.0%) | 0 (0.0%) |
| 6 to 18 Years | 0 (0.0%) | 0 (0.0%) |
| 19 to 25 Years | 20 (100.0%) | 0 (0.0%) |
| 26 to 34 Years | 21 (100.0%) | 0 (0.0%) |
| 35 to 44 Years | 10 (100.0%) | 0 (0.0%) |
| 45 to 54 Years | 9 (100.0%) | 0 (0.0%) |
| 55 to 64 Years | 8 (25.0%) | 24 (75.0%) |
| 65 to 74 Years | 59 (100.0%) | 0 (0.0%) |
| 75 Years and older | 2 (100.0%) | 0 (0.0%) |
| Total | 129 (84.3%) | 24 (15.7%) |
Health Insurance Coverage by Citizenship Status in Benbow
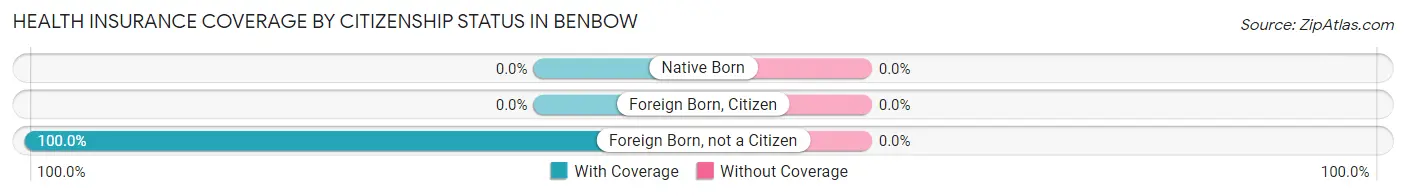
| Citizenship Status | With Coverage | Without Coverage |
| Native Born | 0 (0.0%) | 0 (0.0%) |
| Foreign Born, Citizen | 0 (0.0%) | 0 (0.0%) |
| Foreign Born, not a Citizen | 20 (100.0%) | 0 (0.0%) |
Health Insurance Coverage by Household Income in Benbow
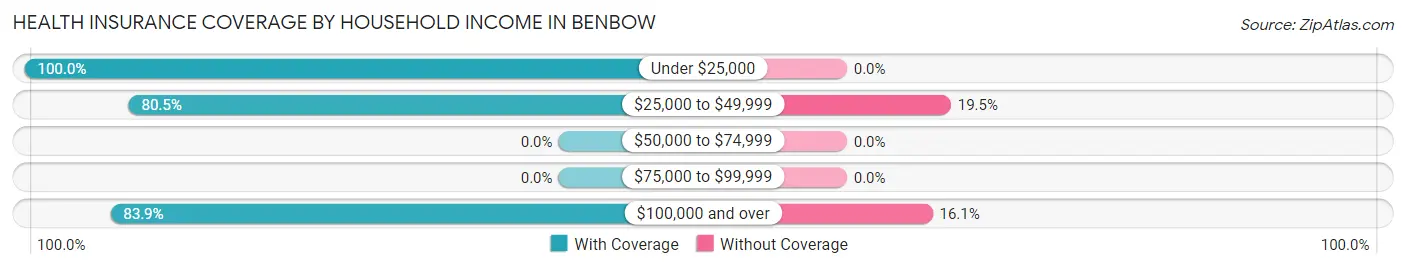
| Household Income | With Coverage | Without Coverage |
| Under $25,000 | 15 (100.0%) | 0 (0.0%) |
| $25,000 to $49,999 | 62 (80.5%) | 15 (19.5%) |
| $50,000 to $74,999 | 0 (0.0%) | 0 (0.0%) |
| $75,000 to $99,999 | 0 (0.0%) | 0 (0.0%) |
| $100,000 and over | 47 (83.9%) | 9 (16.1%) |
Public vs Private Health Insurance Coverage by Age in Benbow
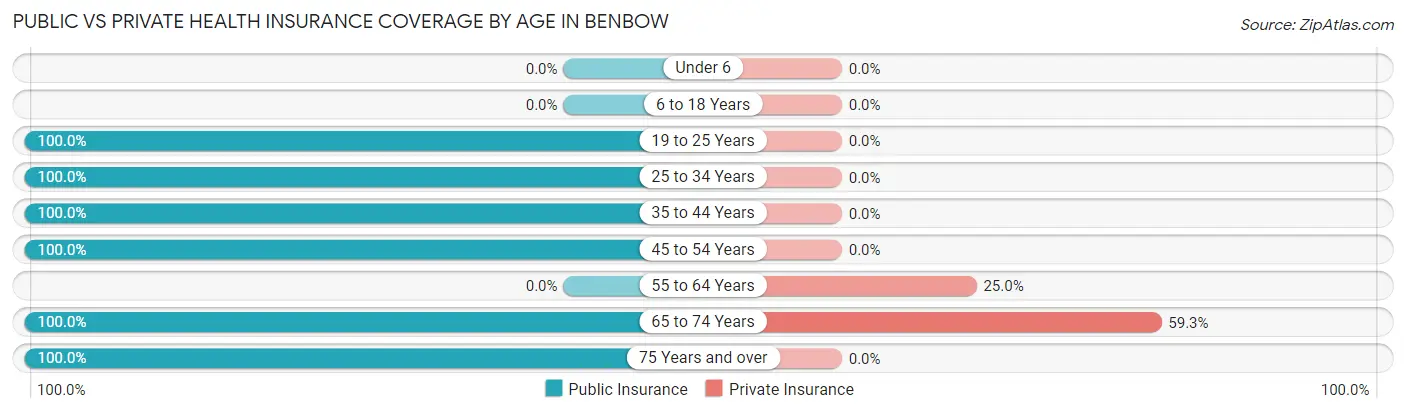
| Age Bracket | Public Insurance | Private Insurance |
| Under 6 | 0 (0.0%) | 0 (0.0%) |
| 6 to 18 Years | 0 (0.0%) | 0 (0.0%) |
| 19 to 25 Years | 20 (100.0%) | 0 (0.0%) |
| 25 to 34 Years | 21 (100.0%) | 0 (0.0%) |
| 35 to 44 Years | 10 (100.0%) | 0 (0.0%) |
| 45 to 54 Years | 9 (100.0%) | 0 (0.0%) |
| 55 to 64 Years | 0 (0.0%) | 8 (25.0%) |
| 65 to 74 Years | 59 (100.0%) | 35 (59.3%) |
| 75 Years and over | 2 (100.0%) | 0 (0.0%) |
| Total | 121 (79.1%) | 43 (28.1%) |
Disability Status by Sex by Age in Benbow
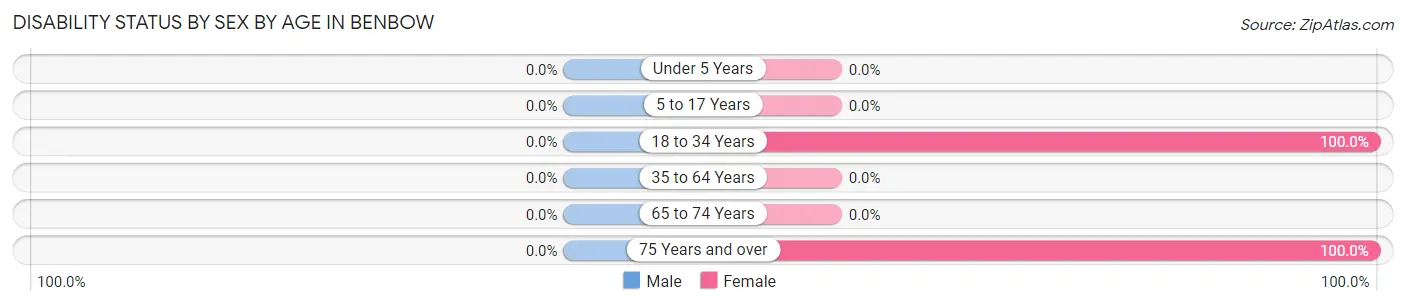
| Age Bracket | Male | Female |
| Under 5 Years | 0 (0.0%) | 0 (0.0%) |
| 5 to 17 Years | 0 (0.0%) | 0 (0.0%) |
| 18 to 34 Years | 0 (0.0%) | 21 (100.0%) |
| 35 to 64 Years | 0 (0.0%) | 0 (0.0%) |
| 65 to 74 Years | 0 (0.0%) | 0 (0.0%) |
| 75 Years and over | 0 (0.0%) | 2 (100.0%) |
Disability Class by Sex by Age in Benbow
Disability Class: Hearing Difficulty
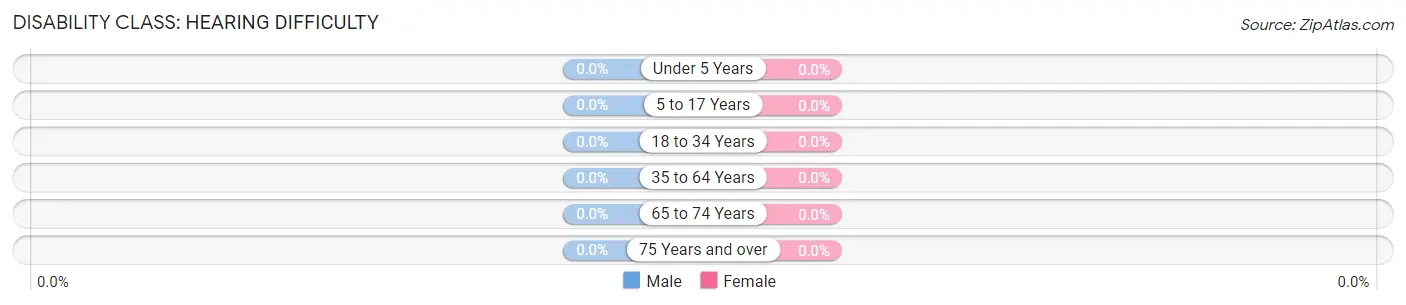
| Age Bracket | Male | Female |
| Under 5 Years | 0 (0.0%) | 0 (0.0%) |
| 5 to 17 Years | 0 (0.0%) | 0 (0.0%) |
| 18 to 34 Years | 0 (0.0%) | 0 (0.0%) |
| 35 to 64 Years | 0 (0.0%) | 0 (0.0%) |
| 65 to 74 Years | 0 (0.0%) | 0 (0.0%) |
| 75 Years and over | 0 (0.0%) | 0 (0.0%) |
Disability Class: Vision Difficulty
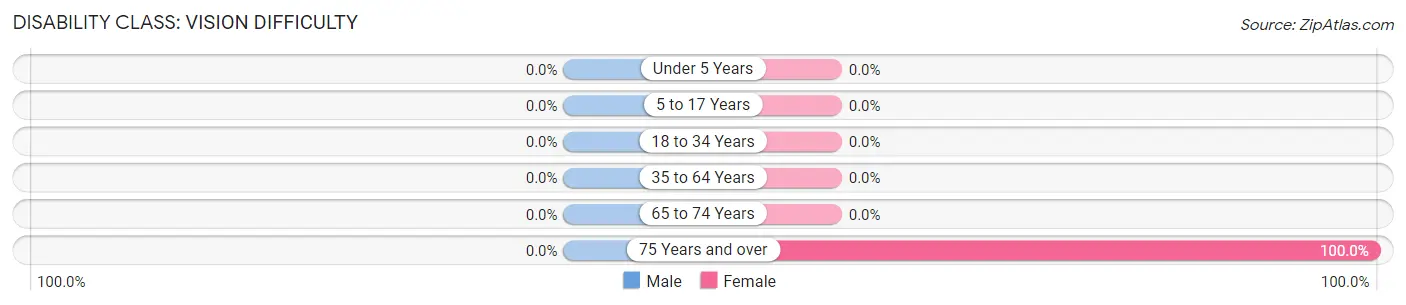
| Age Bracket | Male | Female |
| Under 5 Years | 0 (0.0%) | 0 (0.0%) |
| 5 to 17 Years | 0 (0.0%) | 0 (0.0%) |
| 18 to 34 Years | 0 (0.0%) | 0 (0.0%) |
| 35 to 64 Years | 0 (0.0%) | 0 (0.0%) |
| 65 to 74 Years | 0 (0.0%) | 0 (0.0%) |
| 75 Years and over | 0 (0.0%) | 2 (100.0%) |
Disability Class: Cognitive Difficulty
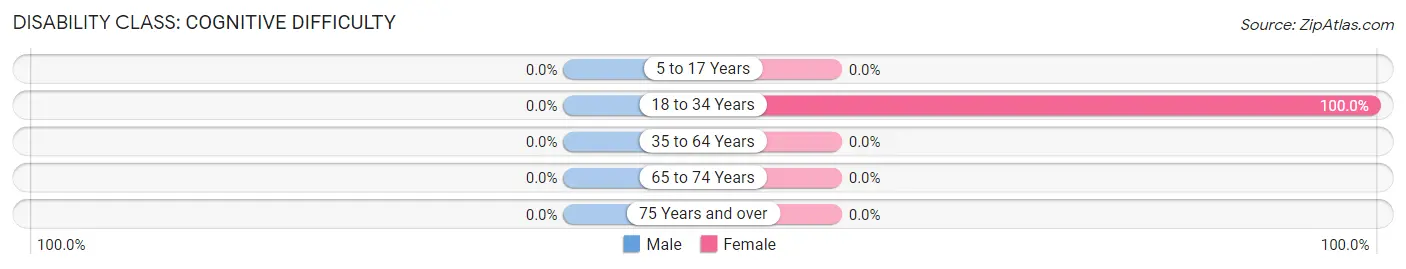
| Age Bracket | Male | Female |
| 5 to 17 Years | 0 (0.0%) | 0 (0.0%) |
| 18 to 34 Years | 0 (0.0%) | 21 (100.0%) |
| 35 to 64 Years | 0 (0.0%) | 0 (0.0%) |
| 65 to 74 Years | 0 (0.0%) | 0 (0.0%) |
| 75 Years and over | 0 (0.0%) | 0 (0.0%) |
Disability Class: Ambulatory Difficulty
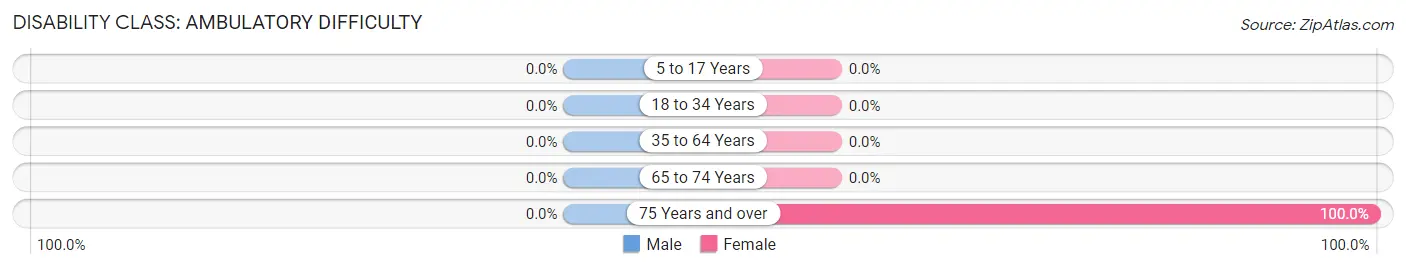
| Age Bracket | Male | Female |
| 5 to 17 Years | 0 (0.0%) | 0 (0.0%) |
| 18 to 34 Years | 0 (0.0%) | 0 (0.0%) |
| 35 to 64 Years | 0 (0.0%) | 0 (0.0%) |
| 65 to 74 Years | 0 (0.0%) | 0 (0.0%) |
| 75 Years and over | 0 (0.0%) | 2 (100.0%) |
Disability Class: Self-Care Difficulty
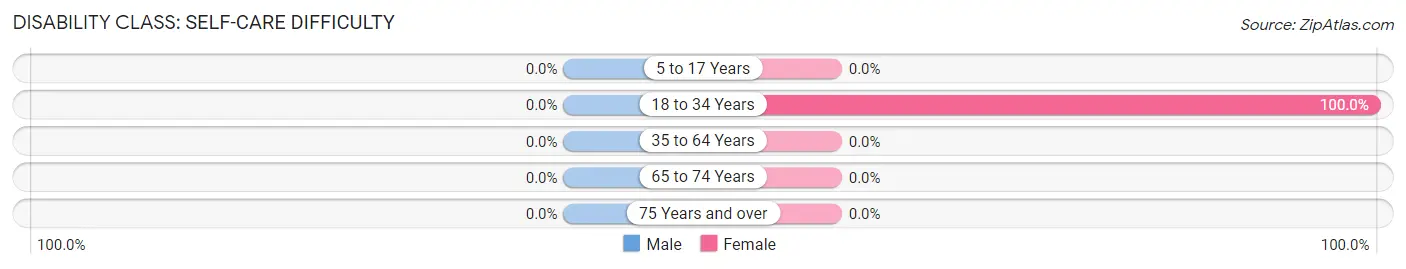
| Age Bracket | Male | Female |
| 5 to 17 Years | 0 (0.0%) | 0 (0.0%) |
| 18 to 34 Years | 0 (0.0%) | 21 (100.0%) |
| 35 to 64 Years | 0 (0.0%) | 0 (0.0%) |
| 65 to 74 Years | 0 (0.0%) | 0 (0.0%) |
| 75 Years and over | 0 (0.0%) | 0 (0.0%) |
Technology Access in Benbow
Computing Device Access in Benbow
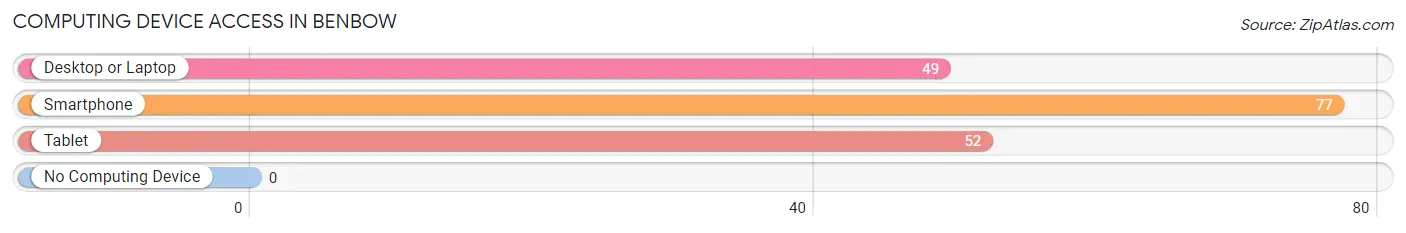
| Device Type | # Households | % Households |
| Desktop or Laptop | 49 | 55.7% |
| Smartphone | 77 | 87.5% |
| Tablet | 52 | 59.1% |
| No Computing Device | 0 | 0.0% |
| Total | 88 | 100.0% |
Internet Access in Benbow
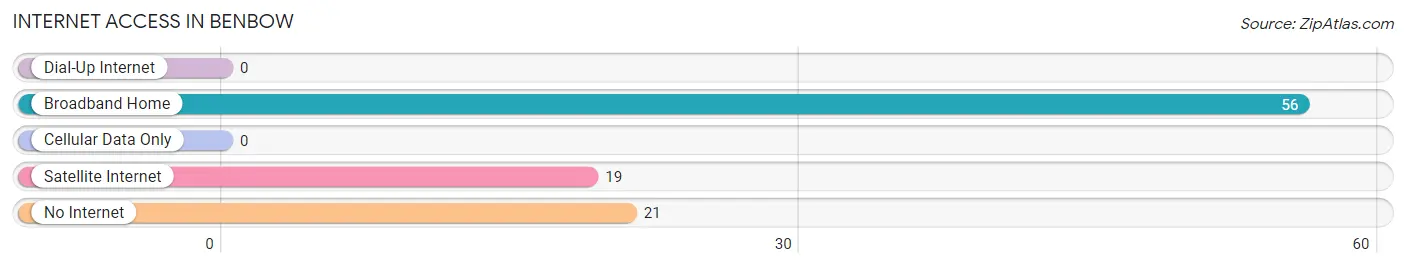
| Internet Type | # Households | % Households |
| Dial-Up Internet | 0 | 0.0% |
| Broadband Home | 56 | 63.6% |
| Cellular Data Only | 0 | 0.0% |
| Satellite Internet | 19 | 21.6% |
| No Internet | 21 | 23.9% |
| Total | 88 | 100.0% |
Benbow Summary
Benbow, California is a small unincorporated community located in Humboldt County, California. It is situated on the banks of the Eel River, approximately 10 miles south of Garberville. The town was founded in the late 1800s by William Benbow, a lumberman who established a sawmill in the area. Benbow is known for its picturesque scenery, its historic buildings, and its proximity to the redwood forests of the region.
History
Benbow was founded in the late 1800s by William Benbow, a lumberman who established a sawmill in the area. The town was named after him and was incorporated in 1908. Benbow was a thriving lumber town for many years, with a population of over 1,000 people. The town was home to several businesses, including a hotel, a general store, a post office, and a school.
In the early 1900s, the lumber industry began to decline in Benbow, and the population began to dwindle. By the 1950s, the town had become a ghost town, with only a few residents remaining. In the 1970s, the town was revitalized by the establishment of the Benbow Inn, a historic hotel and resort. The Benbow Inn has become a popular destination for tourists, and the town has seen a resurgence in population and economic activity.
Geography
Benbow is located in Humboldt County, California, approximately 10 miles south of Garberville. The town is situated on the banks of the Eel River, and is surrounded by redwood forests. The climate in Benbow is mild, with temperatures ranging from the mid-50s to the mid-70s throughout the year.
Economy
The economy of Benbow is largely based on tourism. The town is home to the Benbow Inn, a historic hotel and resort that attracts visitors from all over the world. The Benbow Inn also hosts a variety of events throughout the year, including weddings, conferences, and other special occasions.
In addition to the Benbow Inn, the town is home to several other businesses, including a general store, a post office, and a gas station. The town also has a small airport, which is used for private planes and helicopters.
Demographics
As of the 2010 census, the population of Benbow was 545. The racial makeup of the town was 94.3% White, 0.7% African American, 0.7% Native American, 0.7% Asian, 0.4% Pacific Islander, and 2.7% from other races. The median household income in Benbow was $37,500, and the median age was 44.
Conclusion
Benbow, California is a small unincorporated community located in Humboldt County, California. It was founded in the late 1800s by William Benbow, a lumberman who established a sawmill in the area. Benbow is known for its picturesque scenery, its historic buildings, and its proximity to the redwood forests of the region. The economy of Benbow is largely based on tourism, with the Benbow Inn being the main attraction. The population of Benbow was 545 as of the 2010 census, with a median household income of $37,500 and a median age of 44.
Common Questions
What is Per Capita Income in Benbow?
Per Capita income in Benbow is $36,253.
What is the Median Household income in Benbow?
Median Household Income in Benbow is $40,962.
What is Inequality or Gini Index in Benbow?
Inequality or Gini Index in Benbow is 0.41.
What is the Total Population of Benbow?
Total Population of Benbow is 153.
What is the Total Male Population of Benbow?
Total Male Population of Benbow is 82.
What is the Total Female Population of Benbow?
Total Female Population of Benbow is 71.
What is the Ratio of Males per 100 Females in Benbow?
There are 115.49 Males per 100 Females in Benbow.
What is the Ratio of Females per 100 Males in Benbow?
There are 86.59 Females per 100 Males in Benbow.
What is the Median Population Age in Benbow?
Median Population Age in Benbow is 62.2 Years.
What is the Average Family Size in Benbow
Average Family Size in Benbow is 2.5 People.
What is the Average Household Size in Benbow
Average Household Size in Benbow is 1.7 People.
How Large is the Labor Force in Benbow?
There are 78 People in the Labor Forcein in Benbow.
What is the Percentage of People in the Labor Force in Benbow?
51.0% of People are in the Labor Force in Benbow.
What is the Unemployment Rate in Benbow?
Unemployment Rate in Benbow is 14.1%.