East Earl, PA Map & Demographics
East Earl Map
East Earl Overview
$40,511
PER CAPITA INCOME
$98,734
AVG FAMILY INCOME
$98,734
AVG HOUSEHOLD INCOME
47.8%
WAGE / INCOME GAP [ % ]
52.2¢/ $1
WAGE / INCOME GAP [ $ ]
0.26
INEQUALITY / GINI INDEX
1,144
TOTAL POPULATION
607
MALE POPULATION
537
FEMALE POPULATION
113.04
MALES / 100 FEMALES
88.47
FEMALES / 100 MALES
49.4
MEDIAN AGE
2.9
AVG FAMILY SIZE
2.9
AVG HOUSEHOLD SIZE
683
LABOR FORCE [ PEOPLE ]
68.4%
PERCENT IN LABOR FORCE
4.7%
UNEMPLOYMENT RATE
East Earl Zip Codes
East Earl Area Codes
Income in East Earl
Income Overview in East Earl
Per Capita Income in East Earl is $40,511, while median incomes of families and households are $98,734 and $98,734 respectively.
| Characteristic | Number | Measure |
| Per Capita Income | 1,144 | $40,511 |
| Median Family Income | 393 | $98,734 |
| Mean Family Income | 393 | $114,806 |
| Median Household Income | 393 | $98,734 |
| Mean Household Income | 393 | $114,806 |
| Income Deficit | 393 | $0 |
| Wage / Income Gap (%) | 1,144 | 47.83% |
| Wage / Income Gap ($) | 1,144 | 52.17¢ per $1 |
| Gini / Inequality Index | 1,144 | 0.26 |
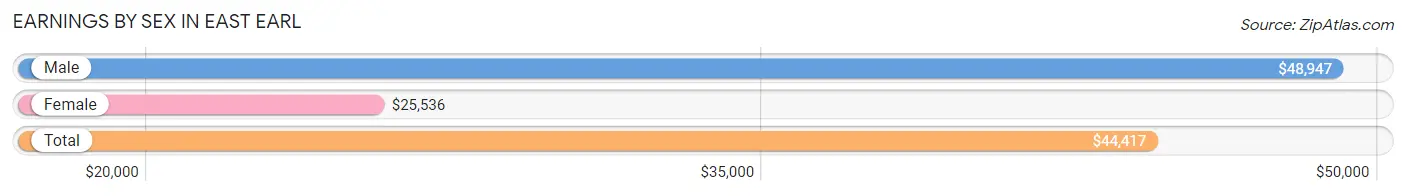
Earnings by Sex in East Earl
Average Earnings in East Earl are $44,417, $48,947 for men and $25,536 for women, a difference of 47.8%.
| Sex | Number | Average Earnings |
| Male | 472 (63.7%) | $48,947 |
| Female | 269 (36.3%) | $25,536 |
| Total | 741 (100.0%) | $44,417 |
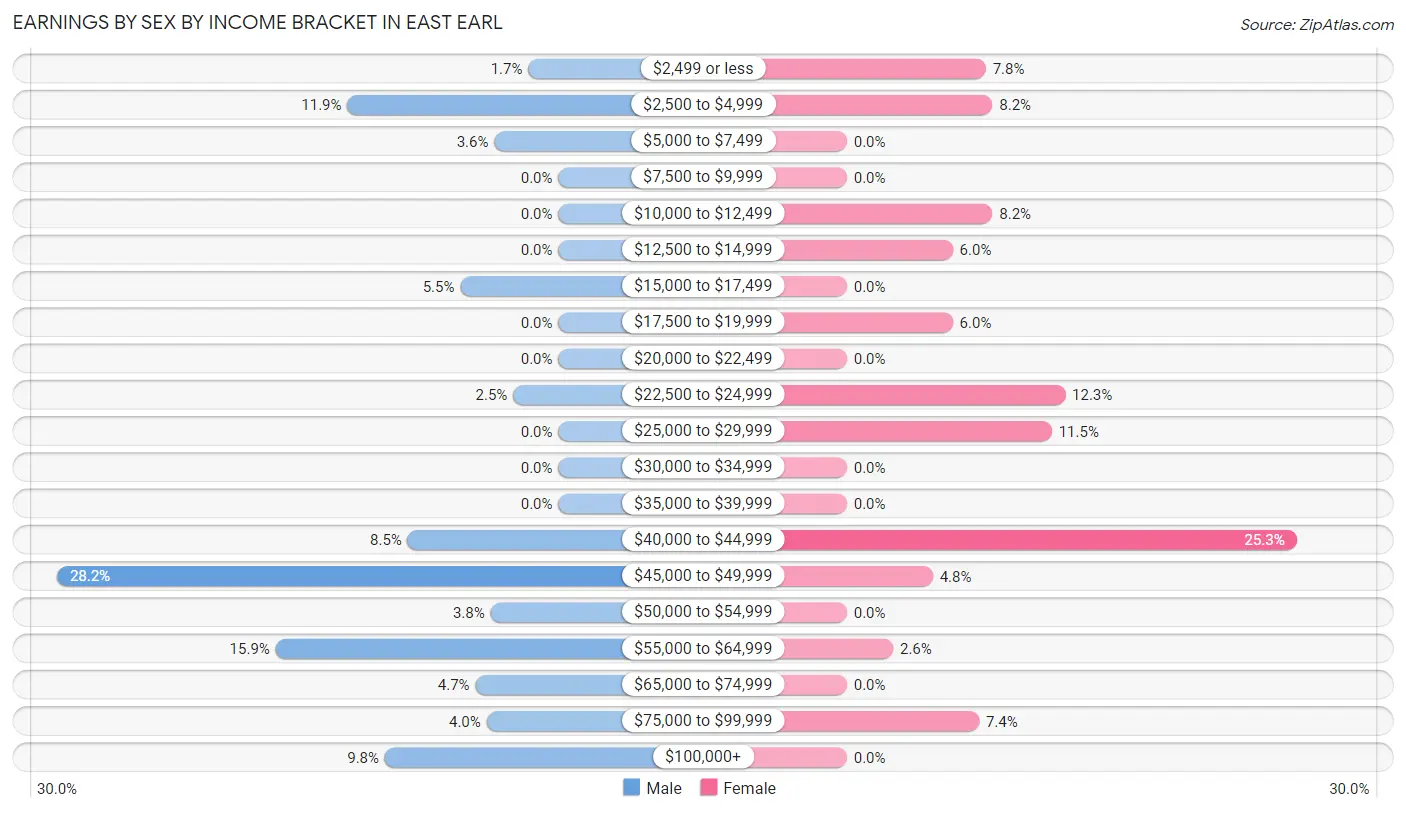
Earnings by Sex by Income Bracket in East Earl
The most common earnings brackets in East Earl are $45,000 to $49,999 for men (133 | 28.2%) and $40,000 to $44,999 for women (68 | 25.3%).
| Income | Male | Female |
| $2,499 or less | 8 (1.7%) | 21 (7.8%) |
| $2,500 to $4,999 | 56 (11.9%) | 22 (8.2%) |
| $5,000 to $7,499 | 17 (3.6%) | 0 (0.0%) |
| $7,500 to $9,999 | 0 (0.0%) | 0 (0.0%) |
| $10,000 to $12,499 | 0 (0.0%) | 22 (8.2%) |
| $12,500 to $14,999 | 0 (0.0%) | 16 (5.9%) |
| $15,000 to $17,499 | 26 (5.5%) | 0 (0.0%) |
| $17,500 to $19,999 | 0 (0.0%) | 16 (5.9%) |
| $20,000 to $22,499 | 0 (0.0%) | 0 (0.0%) |
| $22,500 to $24,999 | 12 (2.5%) | 33 (12.3%) |
| $25,000 to $29,999 | 0 (0.0%) | 31 (11.5%) |
| $30,000 to $34,999 | 0 (0.0%) | 0 (0.0%) |
| $35,000 to $39,999 | 0 (0.0%) | 0 (0.0%) |
| $40,000 to $44,999 | 40 (8.5%) | 68 (25.3%) |
| $45,000 to $49,999 | 133 (28.2%) | 13 (4.8%) |
| $50,000 to $54,999 | 18 (3.8%) | 0 (0.0%) |
| $55,000 to $64,999 | 75 (15.9%) | 7 (2.6%) |
| $65,000 to $74,999 | 22 (4.7%) | 0 (0.0%) |
| $75,000 to $99,999 | 19 (4.0%) | 20 (7.4%) |
| $100,000+ | 46 (9.8%) | 0 (0.0%) |
| Total | 472 (100.0%) | 269 (100.0%) |
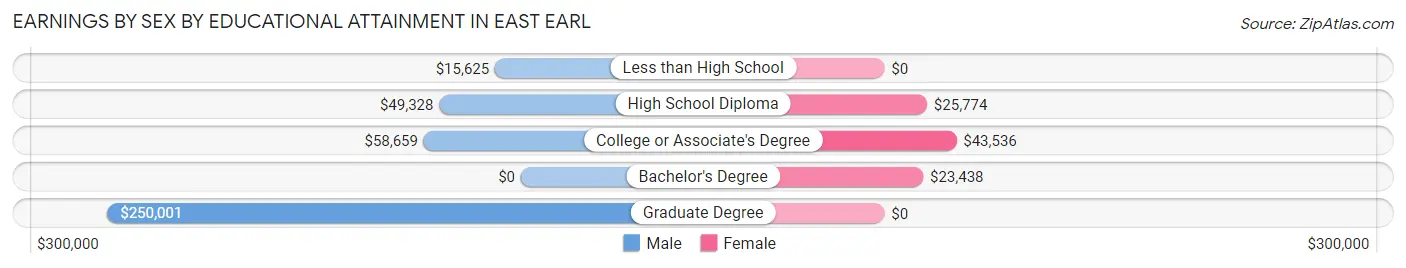
Earnings by Sex by Educational Attainment in East Earl
Average earnings in East Earl are $52,778 for men and $29,750 for women, a difference of 43.6%. Men with an educational attainment of graduate degree enjoy the highest average annual earnings of $250,001, while those with less than high school education earn the least with $15,625. Women with an educational attainment of college or associate's degree earn the most with the average annual earnings of $43,536, while those with bachelor's degree education have the smallest earnings of $23,438.
| Educational Attainment | Male Income | Female Income |
| Less than High School | $15,625 | $0 |
| High School Diploma | $49,328 | $25,774 |
| College or Associate's Degree | $58,659 | $43,536 |
| Bachelor's Degree | - | - |
| Graduate Degree | $250,001 | $0 |
| Total | $52,778 | $29,750 |
Family Income in East Earl
Family Income Brackets in East Earl
According to the East Earl family income data, there are 186 families falling into the $75,000 to $99,999 income range, which is the most common income bracket and makes up 47.3% of all families.
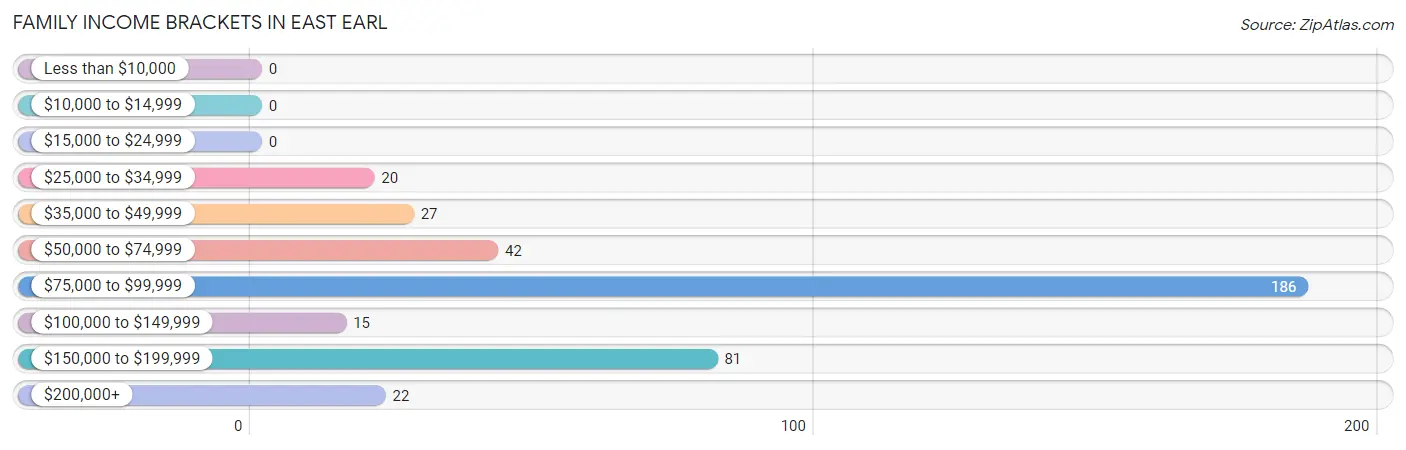
| Income Bracket | # Families | % Families |
| Less than $10,000 | 0 | 0.0% |
| $10,000 to $14,999 | 0 | 0.0% |
| $15,000 to $24,999 | 0 | 0.0% |
| $25,000 to $34,999 | 20 | 5.1% |
| $35,000 to $49,999 | 27 | 6.9% |
| $50,000 to $74,999 | 42 | 10.7% |
| $75,000 to $99,999 | 186 | 47.3% |
| $100,000 to $149,999 | 15 | 3.8% |
| $150,000 to $199,999 | 81 | 20.6% |
| $200,000+ | 22 | 5.6% |
Family Income by Famaliy Size in East Earl
3-person families (47 | 12.0%) account for the highest median family income in East Earl with $99,132 per family, while 2-person families (247 | 62.8%) have the highest median income of $48,902 per family member.
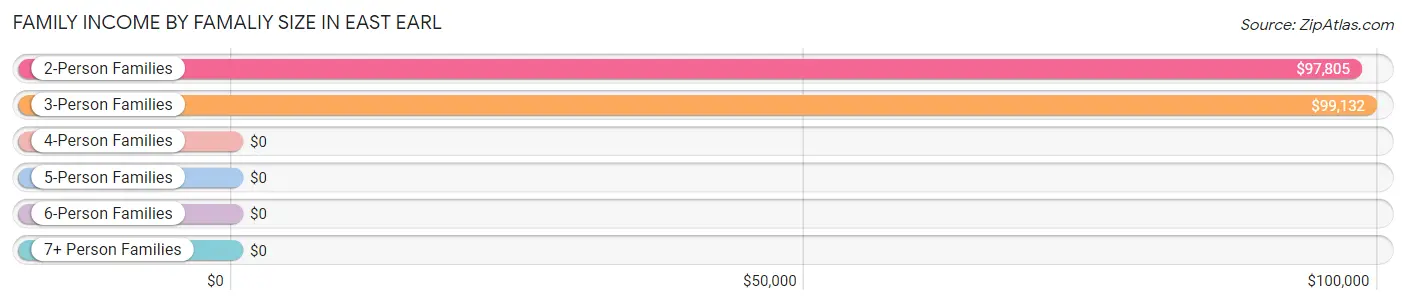
| Income Bracket | # Families | Median Income |
| 2-Person Families | 247 (62.8%) | $97,805 |
| 3-Person Families | 47 (12.0%) | $99,132 |
| 4-Person Families | 46 (11.7%) | $0 |
| 5-Person Families | 21 (5.3%) | $0 |
| 6-Person Families | 32 (8.1%) | $0 |
| 7+ Person Families | 0 (0.0%) | $0 |
| Total | 393 (100.0%) | $98,734 |
Family Income by Number of Earners in East Earl
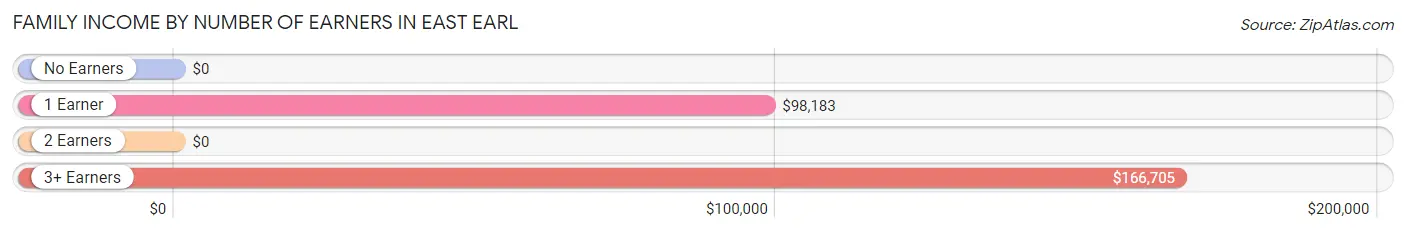
| Number of Earners | # Families | Median Income |
| No Earners | 13 (3.3%) | $0 |
| 1 Earner | 203 (51.6%) | $98,183 |
| 2 Earners | 68 (17.3%) | $0 |
| 3+ Earners | 109 (27.7%) | $166,705 |
| Total | 393 (100.0%) | $98,734 |
Household Income in East Earl
Household Income Brackets in East Earl
With 186 households falling in the category, the $75,000 to $99,999 income range is the most frequent in East Earl, accounting for 47.3% of all households.
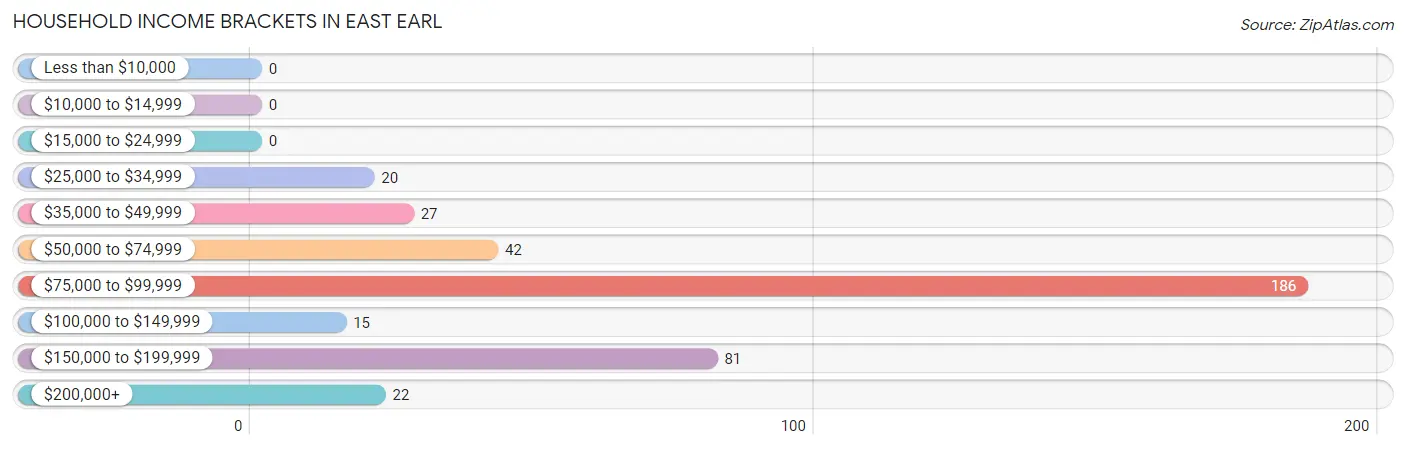
| Income Bracket | # Households | % Households |
| Less than $10,000 | 0 | 0.0% |
| $10,000 to $14,999 | 0 | 0.0% |
| $15,000 to $24,999 | 0 | 0.0% |
| $25,000 to $34,999 | 20 | 5.1% |
| $35,000 to $49,999 | 27 | 6.9% |
| $50,000 to $74,999 | 42 | 10.7% |
| $75,000 to $99,999 | 186 | 47.3% |
| $100,000 to $149,999 | 15 | 3.8% |
| $150,000 to $199,999 | 81 | 20.6% |
| $200,000+ | 22 | 5.6% |
Household Income by Householder Age in East Earl
The median household income in East Earl is $98,734, with the highest median household income of $110,341 found in the 45 to 64 years age bracket for the primary householder. A total of 75 households (19.1%) fall into this category.
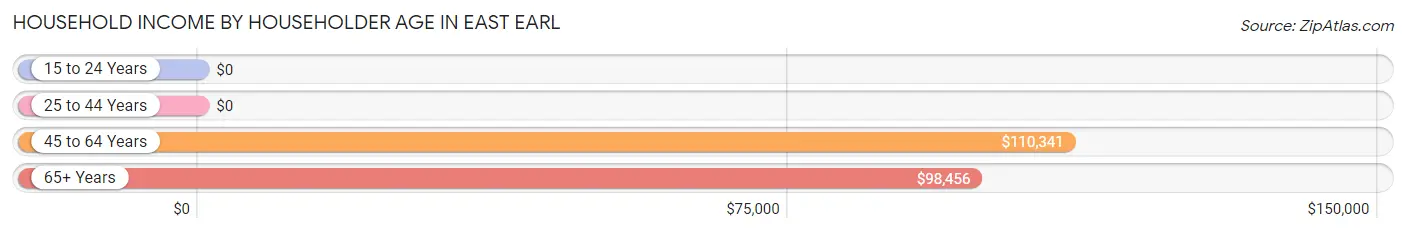
| Income Bracket | # Households | Median Income |
| 15 to 24 Years | 0 (0.0%) | $0 |
| 25 to 44 Years | 85 (21.6%) | $0 |
| 45 to 64 Years | 75 (19.1%) | $110,341 |
| 65+ Years | 233 (59.3%) | $98,456 |
| Total | 393 (100.0%) | $98,734 |
Poverty in East Earl
Income Below Poverty by Sex and Age in East Earl
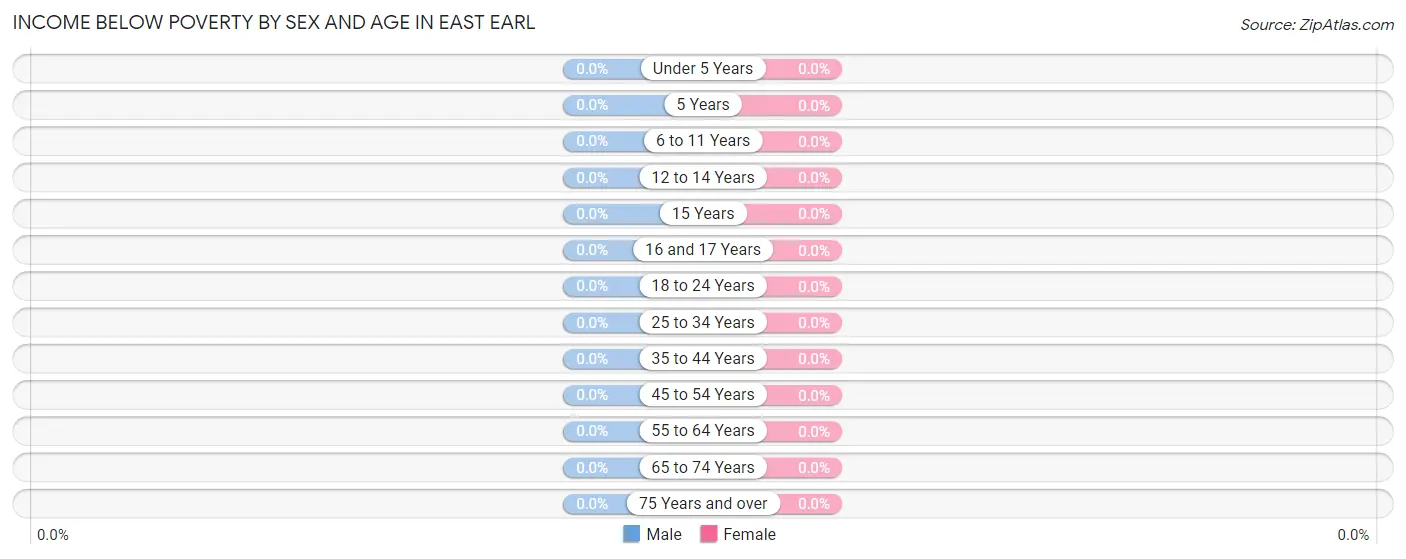
| Age Bracket | Male | Female |
| Under 5 Years | 0 (0.0%) | 0 (0.0%) |
| 5 Years | 0 (0.0%) | 0 (0.0%) |
| 6 to 11 Years | 0 (0.0%) | 0 (0.0%) |
| 12 to 14 Years | 0 (0.0%) | 0 (0.0%) |
| 15 Years | 0 (0.0%) | 0 (0.0%) |
| 16 and 17 Years | 0 (0.0%) | 0 (0.0%) |
| 18 to 24 Years | 0 (0.0%) | 0 (0.0%) |
| 25 to 34 Years | 0 (0.0%) | 0 (0.0%) |
| 35 to 44 Years | 0 (0.0%) | 0 (0.0%) |
| 45 to 54 Years | 0 (0.0%) | 0 (0.0%) |
| 55 to 64 Years | 0 (0.0%) | 0 (0.0%) |
| 65 to 74 Years | 0 (0.0%) | 0 (0.0%) |
| 75 Years and over | 0 (0.0%) | 0 (0.0%) |
| Total | 0 (0.0%) | 0 (0.0%) |
Income Above Poverty by Sex and Age in East Earl
According to the poverty statistics in East Earl, males aged under 5 years and females aged 6 to 11 years are the age groups that are most secure financially, with 100.0% of males and 100.0% of females in these age groups living above the poverty line.
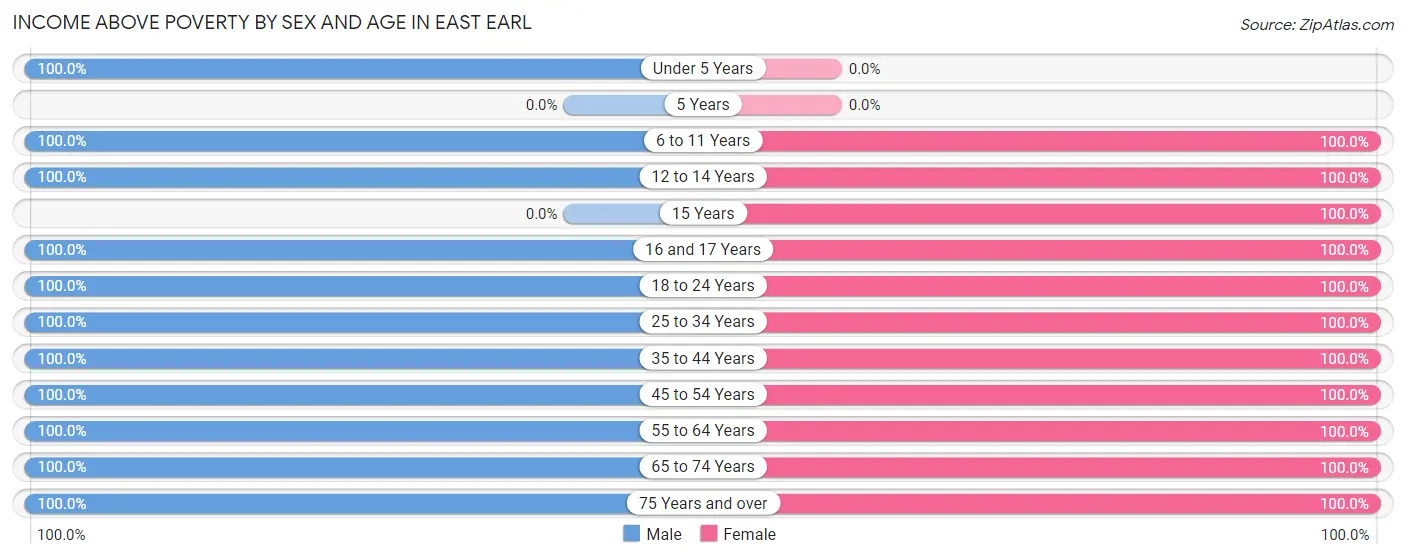
| Age Bracket | Male | Female |
| Under 5 Years | 17 (100.0%) | 0 (0.0%) |
| 5 Years | 0 (0.0%) | 0 (0.0%) |
| 6 to 11 Years | 22 (100.0%) | 23 (100.0%) |
| 12 to 14 Years | 10 (100.0%) | 64 (100.0%) |
| 15 Years | 0 (0.0%) | 10 (100.0%) |
| 16 and 17 Years | 8 (100.0%) | 11 (100.0%) |
| 18 to 24 Years | 108 (100.0%) | 40 (100.0%) |
| 25 to 34 Years | 30 (100.0%) | 4 (100.0%) |
| 35 to 44 Years | 62 (100.0%) | 105 (100.0%) |
| 45 to 54 Years | 75 (100.0%) | 46 (100.0%) |
| 55 to 64 Years | 42 (100.0%) | 63 (100.0%) |
| 65 to 74 Years | 156 (100.0%) | 131 (100.0%) |
| 75 Years and over | 77 (100.0%) | 40 (100.0%) |
| Total | 607 (100.0%) | 537 (100.0%) |
Income Below Poverty Among Married-Couple Families in East Earl
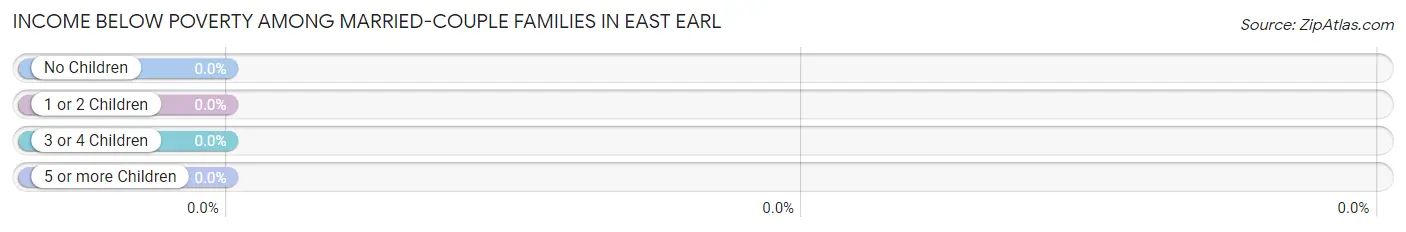
| Children | Above Poverty | Below Poverty |
| No Children | 285 (100.0%) | 0 (0.0%) |
| 1 or 2 Children | 35 (100.0%) | 0 (0.0%) |
| 3 or 4 Children | 21 (100.0%) | 0 (0.0%) |
| 5 or more Children | 0 (0.0%) | 0 (0.0%) |
| Total | 341 (100.0%) | 0 (0.0%) |
Income Below Poverty Among Single-Parent Households in East Earl
| Children | Single Father | Single Mother |
| No Children | 0 (0.0%) | 0 (0.0%) |
| 1 or 2 Children | 0 (0.0%) | 0 (0.0%) |
| 3 or 4 Children | 0 (0.0%) | 0 (0.0%) |
| 5 or more Children | 0 (0.0%) | 0 (0.0%) |
| Total | 0 (0.0%) | 0 (0.0%) |
Income Below Poverty Among Married-Couple vs Single-Parent Households in East Earl
| Children | Married-Couple Families | Single-Parent Households |
| No Children | 0 (0.0%) | 0 (0.0%) |
| 1 or 2 Children | 0 (0.0%) | 0 (0.0%) |
| 3 or 4 Children | 0 (0.0%) | 0 (0.0%) |
| 5 or more Children | 0 (0.0%) | 0 (0.0%) |
| Total | 0 (0.0%) | 0 (0.0%) |
Race in East Earl
The most populous races in East Earl are White / Caucasian (1,115 | 97.5%), and Asian (29 | 2.5%).
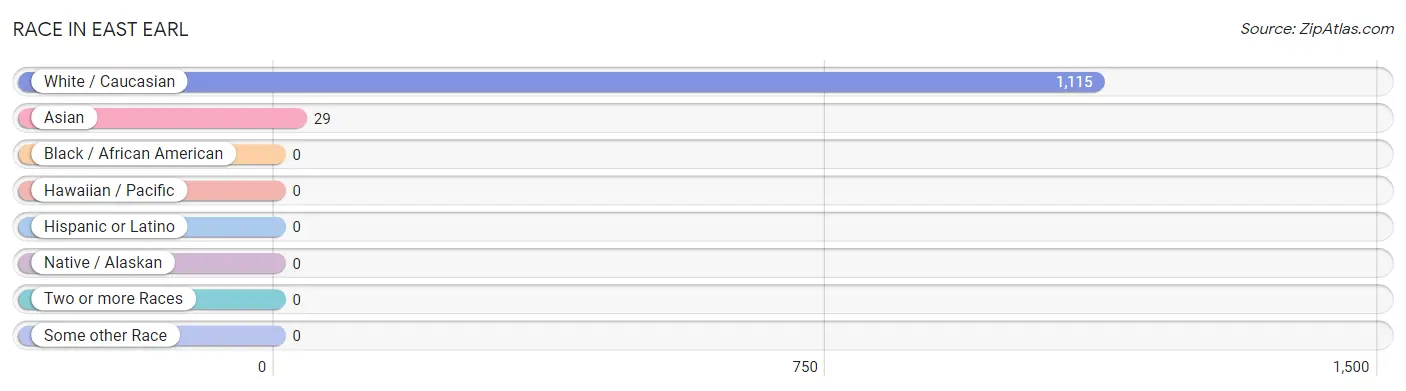
| Race | # Population | % Population |
| Asian | 29 | 2.5% |
| Black / African American | 0 | 0.0% |
| Hawaiian / Pacific | 0 | 0.0% |
| Hispanic or Latino | 0 | 0.0% |
| Native / Alaskan | 0 | 0.0% |
| White / Caucasian | 1,115 | 97.5% |
| Two or more Races | 0 | 0.0% |
| Some other Race | 0 | 0.0% |
| Total | 1,144 | 100.0% |
Ancestry in East Earl
The most populous ancestries reported in East Earl are German (581 | 50.8%), Italian (271 | 23.7%), English (159 | 13.9%), Irish (97 | 8.5%), and Swiss (42 | 3.7%), together accounting for 100.5% of all East Earl residents.
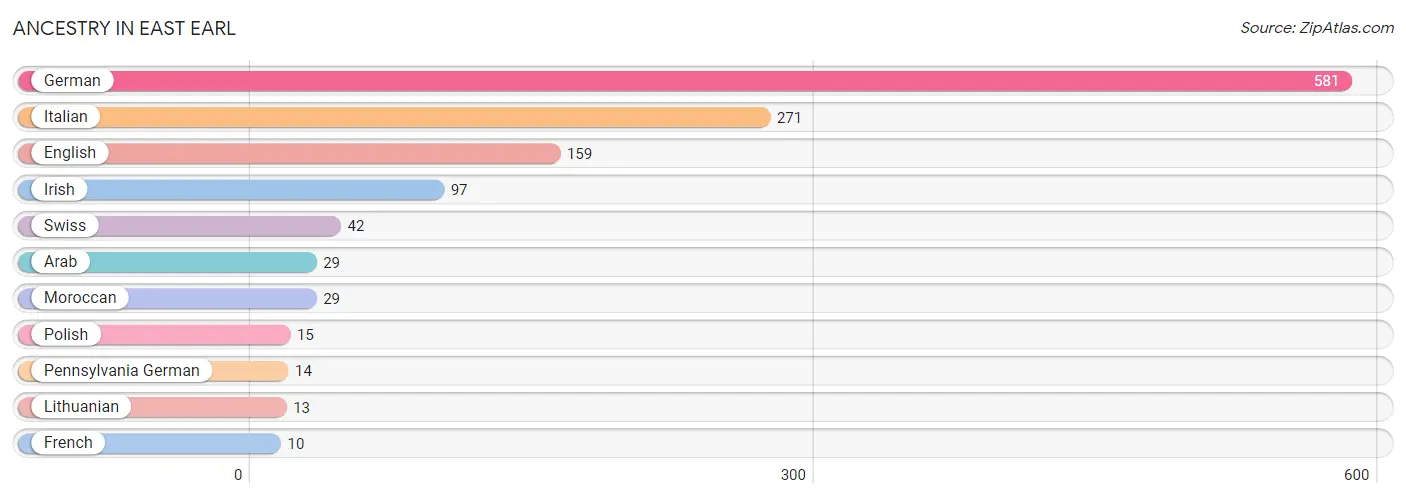
| Ancestry | # Population | % Population |
| Arab | 29 | 2.5% |
| English | 159 | 13.9% |
| French | 10 | 0.9% |
| German | 581 | 50.8% |
| Irish | 97 | 8.5% |
| Italian | 271 | 23.7% |
| Lithuanian | 13 | 1.1% |
| Moroccan | 29 | 2.5% |
| Pennsylvania German | 14 | 1.2% |
| Polish | 15 | 1.3% |
| Swiss | 42 | 3.7% | View All 11 Rows |
Immigrants in East Earl
The most numerous immigrant groups reported in East Earl came from Europe (224 | 19.6%), Italy (224 | 19.6%), and Southern Europe (224 | 19.6%), together accounting for 58.7% of all East Earl residents.
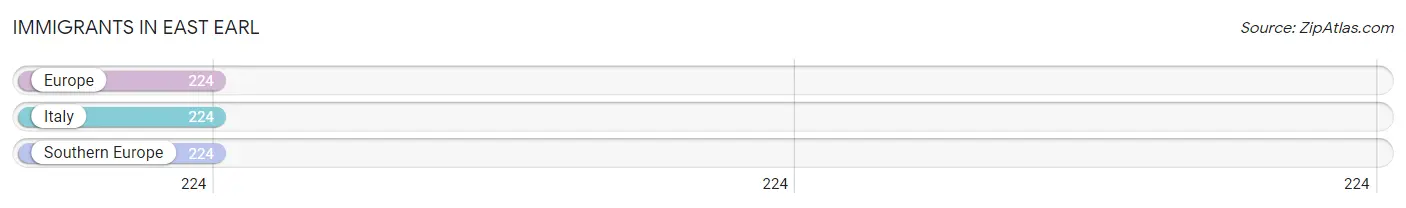
| Immigration Origin | # Population | % Population |
| Europe | 224 | 19.6% |
| Italy | 224 | 19.6% |
| Southern Europe | 224 | 19.6% | View All 3 Rows |
Sex and Age in East Earl
Sex and Age in East Earl
The most populous age groups in East Earl are 70 to 74 Years (129 | 21.2%) for men and 70 to 74 Years (105 | 19.6%) for women.
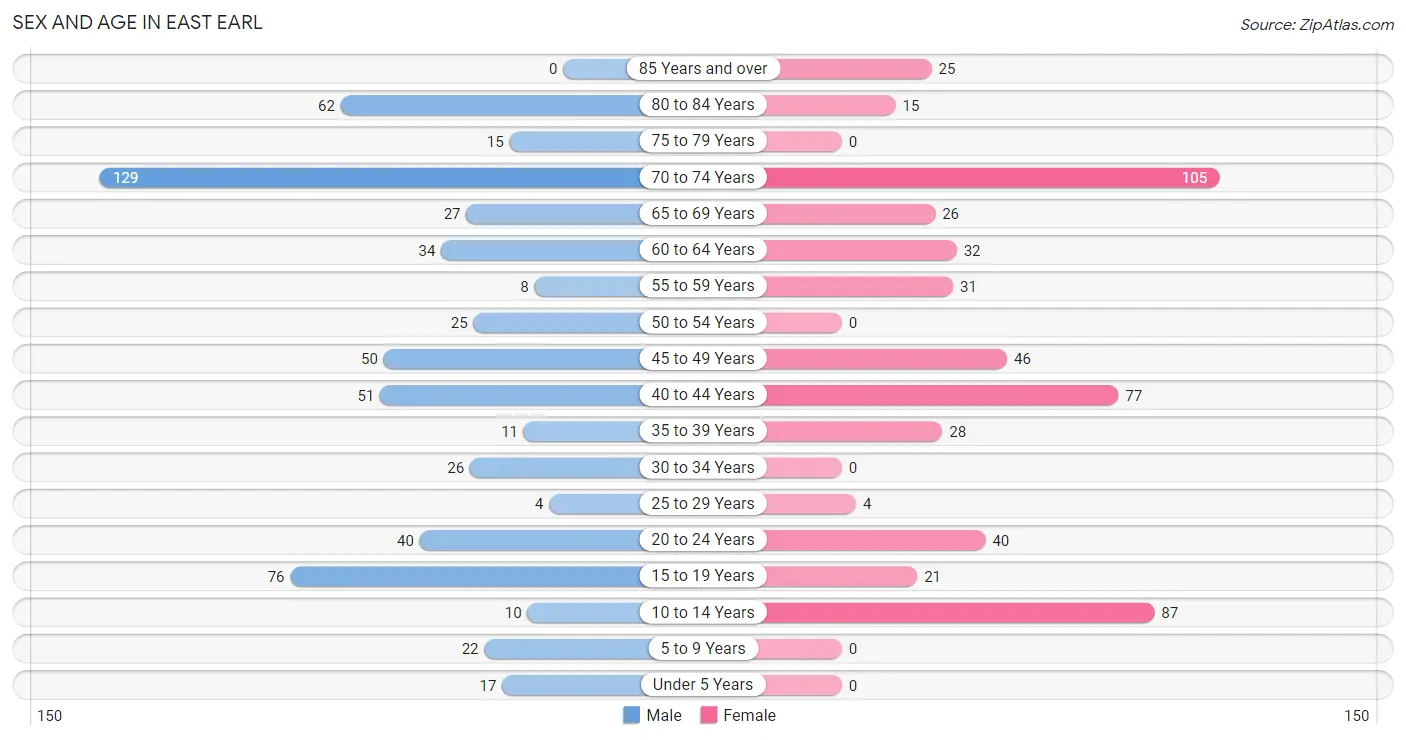
| Age Bracket | Male | Female |
| Under 5 Years | 17 (2.8%) | 0 (0.0%) |
| 5 to 9 Years | 22 (3.6%) | 0 (0.0%) |
| 10 to 14 Years | 10 (1.7%) | 87 (16.2%) |
| 15 to 19 Years | 76 (12.5%) | 21 (3.9%) |
| 20 to 24 Years | 40 (6.6%) | 40 (7.4%) |
| 25 to 29 Years | 4 (0.7%) | 4 (0.7%) |
| 30 to 34 Years | 26 (4.3%) | 0 (0.0%) |
| 35 to 39 Years | 11 (1.8%) | 28 (5.2%) |
| 40 to 44 Years | 51 (8.4%) | 77 (14.3%) |
| 45 to 49 Years | 50 (8.2%) | 46 (8.6%) |
| 50 to 54 Years | 25 (4.1%) | 0 (0.0%) |
| 55 to 59 Years | 8 (1.3%) | 31 (5.8%) |
| 60 to 64 Years | 34 (5.6%) | 32 (6.0%) |
| 65 to 69 Years | 27 (4.4%) | 26 (4.8%) |
| 70 to 74 Years | 129 (21.2%) | 105 (19.6%) |
| 75 to 79 Years | 15 (2.5%) | 0 (0.0%) |
| 80 to 84 Years | 62 (10.2%) | 15 (2.8%) |
| 85 Years and over | 0 (0.0%) | 25 (4.7%) |
| Total | 607 (100.0%) | 537 (100.0%) |
Families and Households in East Earl
Median Family Size in East Earl
The median family size in East Earl is 2.91 persons per family, with single male/father families (32 | 8.1%) accounting for the largest median family size of 6.81 persons per family. On the other hand, single female/mother families (20 | 5.1%) represent the smallest median family size with 2.00 persons per family.
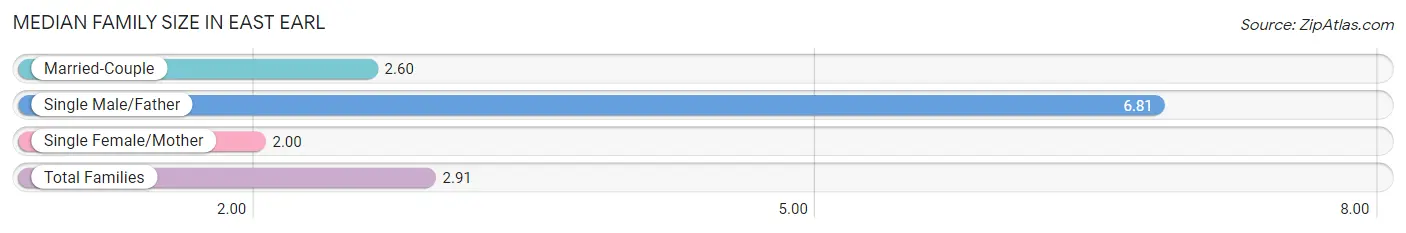
| Family Type | # Families | Family Size |
| Married-Couple | 341 (86.8%) | 2.60 |
| Single Male/Father | 32 (8.1%) | 6.81 |
| Single Female/Mother | 20 (5.1%) | 2.00 |
| Total Families | 393 (100.0%) | 2.91 |
Median Household Size in East Earl
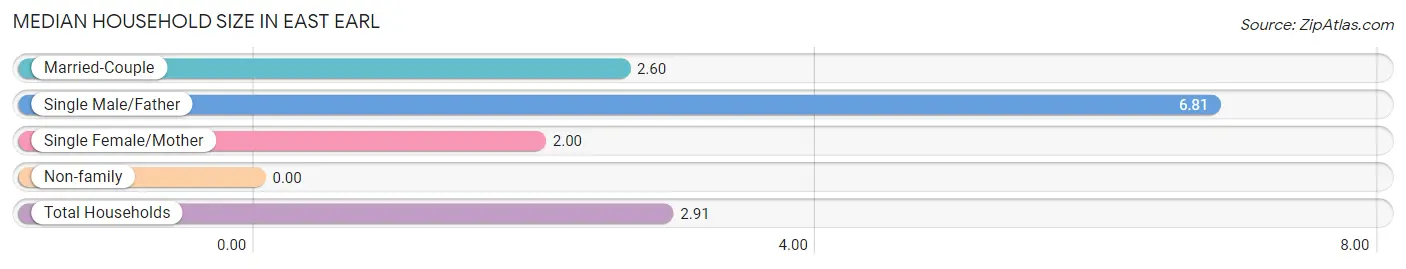
| Household Type | # Households | Household Size |
| Married-Couple | 341 (86.8%) | 2.60 |
| Single Male/Father | 32 (8.1%) | 6.81 |
| Single Female/Mother | 20 (5.1%) | 2.00 |
| Non-family | 0 (0.0%) | - |
| Total Households | 393 (100.0%) | 2.91 |
Household Size by Marriage Status in East Earl
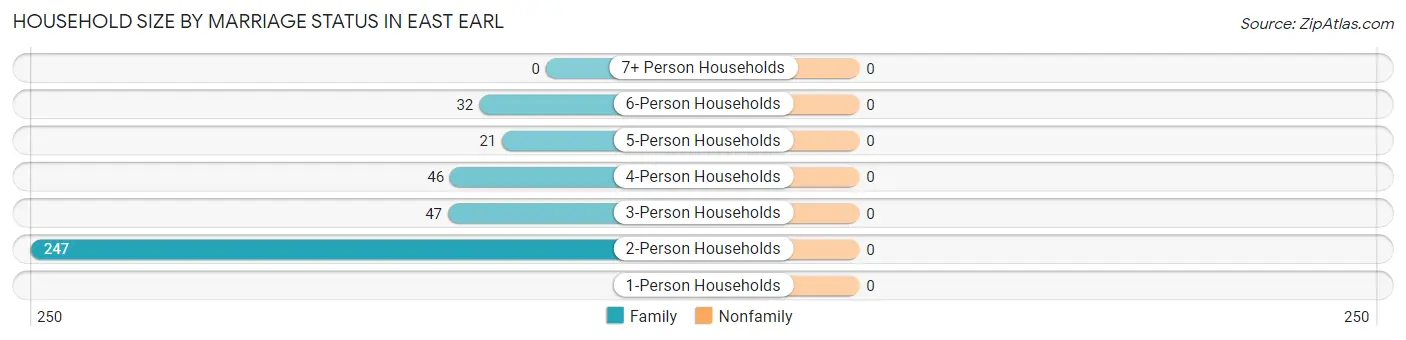
| Household Size | Family Households | Nonfamily Households |
| 1-Person Households | - | 0 (0.0%) |
| 2-Person Households | 247 (62.8%) | 0 (0.0%) |
| 3-Person Households | 47 (12.0%) | 0 (0.0%) |
| 4-Person Households | 46 (11.7%) | 0 (0.0%) |
| 5-Person Households | 21 (5.3%) | 0 (0.0%) |
| 6-Person Households | 32 (8.1%) | 0 (0.0%) |
| 7+ Person Households | 0 (0.0%) | 0 (0.0%) |
| Total | 393 (100.0%) | 0 (0.0%) |
Female Fertility in East Earl
Fertility by Age in East Earl
| Age Bracket | Women with Births | Births / 1,000 Women |
| 15 to 19 years | 0 (0.0%) | 0.0 |
| 20 to 34 years | 0 (0.0%) | 0.0 |
| 35 to 50 years | 0 (0.0%) | 0.0 |
| Total | 0 (0.0%) | 0.0 |
Fertility by Age by Marriage Status in East Earl
| Age Bracket | Married | Unmarried |
| 15 to 19 years | 0 (0.0%) | 0 (0.0%) |
| 20 to 34 years | 0 (0.0%) | 0 (0.0%) |
| 35 to 50 years | 0 (0.0%) | 0 (0.0%) |
| Total | 0 (0.0%) | 0 (0.0%) |
Fertility by Education in East Earl
| Educational Attainment | Women with Births | Births / 1,000 Women |
| Less than High School | 0 (0.0%) | 0.0 |
| High School Diploma | 0 (0.0%) | 0.0 |
| College or Associate's Degree | 0 (0.0%) | 0.0 |
| Bachelor's Degree | 0 (0.0%) | 0.0 |
| Graduate Degree | 0 (0.0%) | 0.0 |
| Total | 0 (0.0%) | 0.0 |
Fertility by Education by Marriage Status in East Earl
| Educational Attainment | Married | Unmarried |
| Less than High School | 0 (0.0%) | 0 (0.0%) |
| High School Diploma | 0 (0.0%) | 0 (0.0%) |
| College or Associate's Degree | 0 (0.0%) | 0 (0.0%) |
| Bachelor's Degree | 0 (0.0%) | 0 (0.0%) |
| Graduate Degree | 0 (0.0%) | 0 (0.0%) |
| Total | 0 (0.0%) | 0 (0.0%) |
Employment Characteristics in East Earl
Employment by Class of Employer in East Earl
Among the 651 employed individuals in East Earl, private company employees (413 | 63.4%), not-for-profit organizations (154 | 23.7%), and local government employees (36 | 5.5%) make up the most common classes of employment.
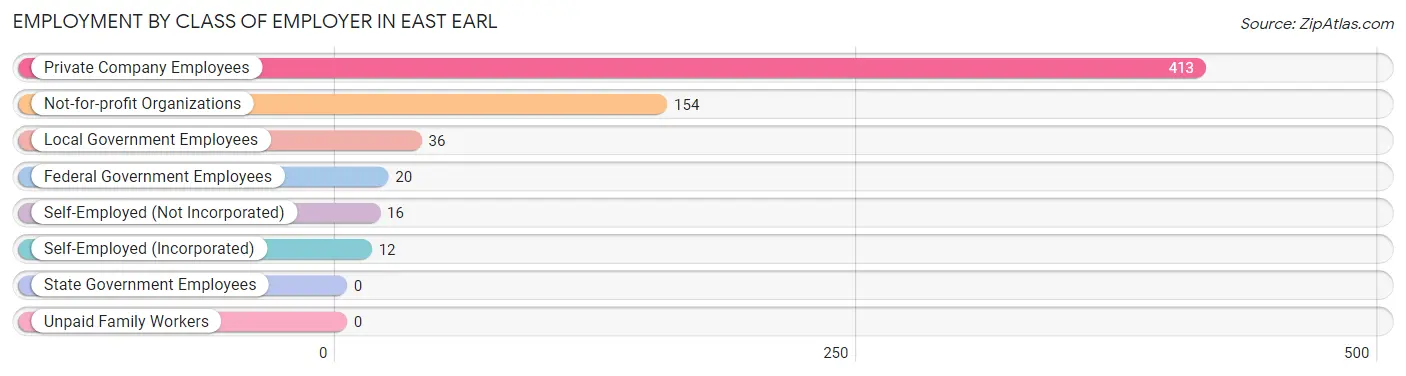
| Employer Class | # Employees | % Employees |
| Private Company Employees | 413 | 63.4% |
| Self-Employed (Incorporated) | 12 | 1.8% |
| Self-Employed (Not Incorporated) | 16 | 2.5% |
| Not-for-profit Organizations | 154 | 23.7% |
| Local Government Employees | 36 | 5.5% |
| State Government Employees | 0 | 0.0% |
| Federal Government Employees | 20 | 3.1% |
| Unpaid Family Workers | 0 | 0.0% |
| Total | 651 | 100.0% |
Employment Status by Age in East Earl
According to the labor force statistics for East Earl, out of the total population over 16 years of age (998), 68.4% or 683 individuals are in the labor force, with 4.7% or 32 of them unemployed. The age group with the highest labor force participation rate is 30 to 34 years, with 100.0% or 26 individuals in the labor force. Within the labor force, the 65 to 74 years age range has the highest percentage of unemployed individuals, with 19.9% or 32 of them being unemployed.
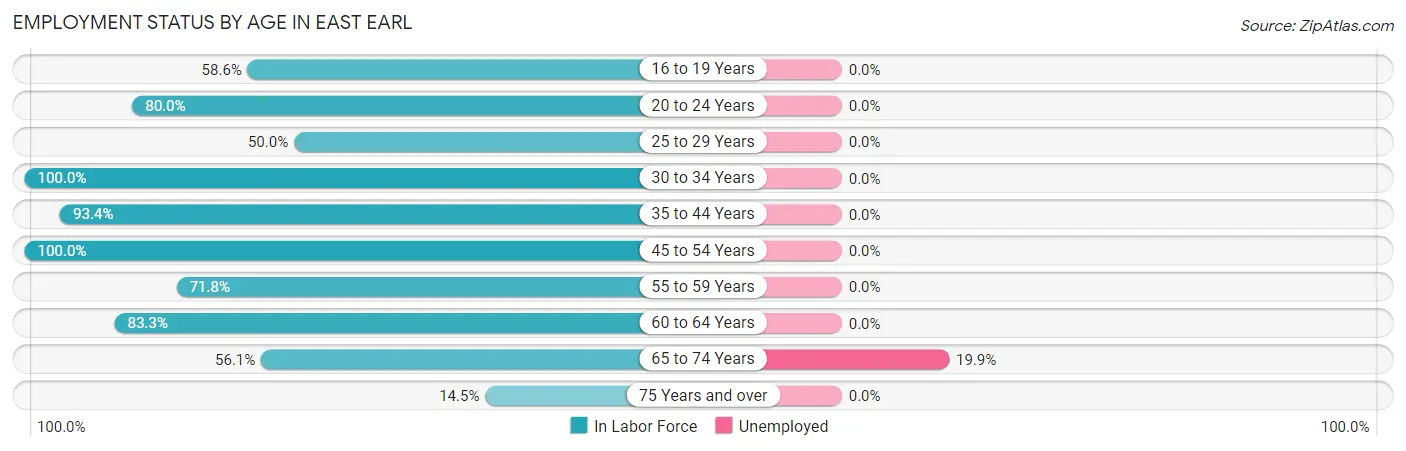
| Age Bracket | In Labor Force | Unemployed |
| 16 to 19 Years | 51 (58.6%) | 0 (0.0%) |
| 20 to 24 Years | 64 (80.0%) | 0 (0.0%) |
| 25 to 29 Years | 4 (50.0%) | 0 (0.0%) |
| 30 to 34 Years | 26 (100.0%) | 0 (0.0%) |
| 35 to 44 Years | 156 (93.4%) | 0 (0.0%) |
| 45 to 54 Years | 121 (100.0%) | 0 (0.0%) |
| 55 to 59 Years | 28 (71.8%) | 0 (0.0%) |
| 60 to 64 Years | 55 (83.3%) | 0 (0.0%) |
| 65 to 74 Years | 161 (56.1%) | 32 (19.9%) |
| 75 Years and over | 17 (14.5%) | 0 (0.0%) |
| Total | 683 (68.4%) | 32 (4.7%) |
Employment Status by Educational Attainment in East Earl
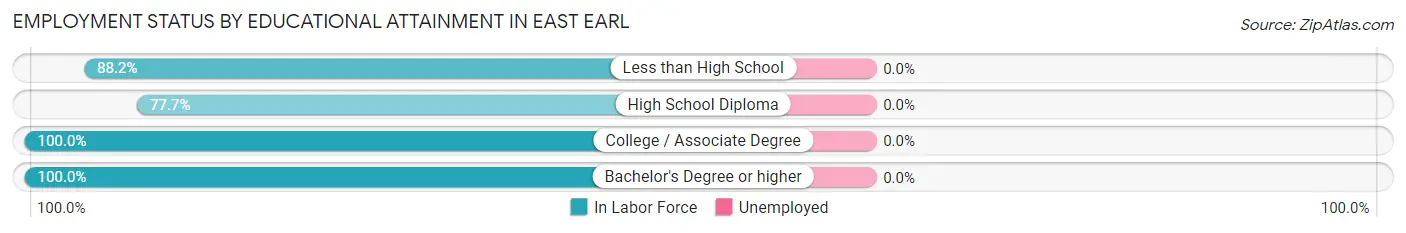
| Educational Attainment | In Labor Force | Unemployed |
| Less than High School | 30 (88.2%) | 0 (0.0%) |
| High School Diploma | 115 (77.7%) | 0 (0.0%) |
| College / Associate Degree | 129 (100.0%) | 0 (0.0%) |
| Bachelor's Degree or higher | 116 (100.0%) | 0 (0.0%) |
| Total | 390 (91.3%) | 0 (0.0%) |
Employment Occupations by Sex in East Earl
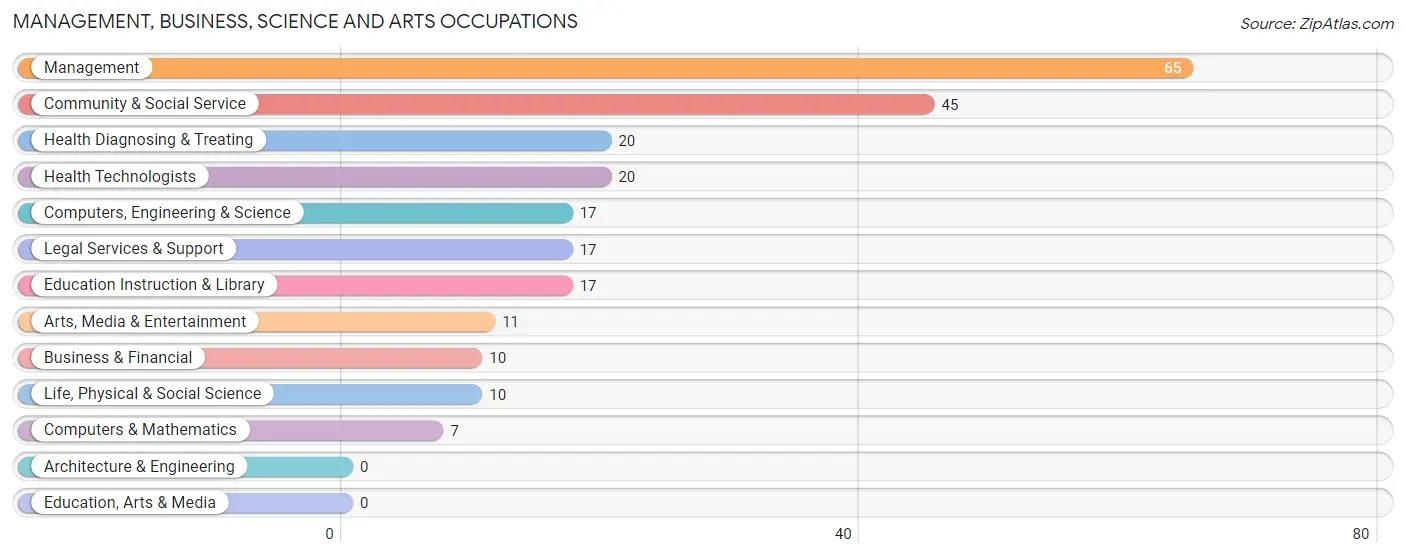
Management, Business, Science and Arts Occupations
The most common Management, Business, Science and Arts occupations in East Earl are Management (65 | 10.0%), Community & Social Service (45 | 6.9%), Health Diagnosing & Treating (20 | 3.1%), Health Technologists (20 | 3.1%), and Computers, Engineering & Science (17 | 2.6%).
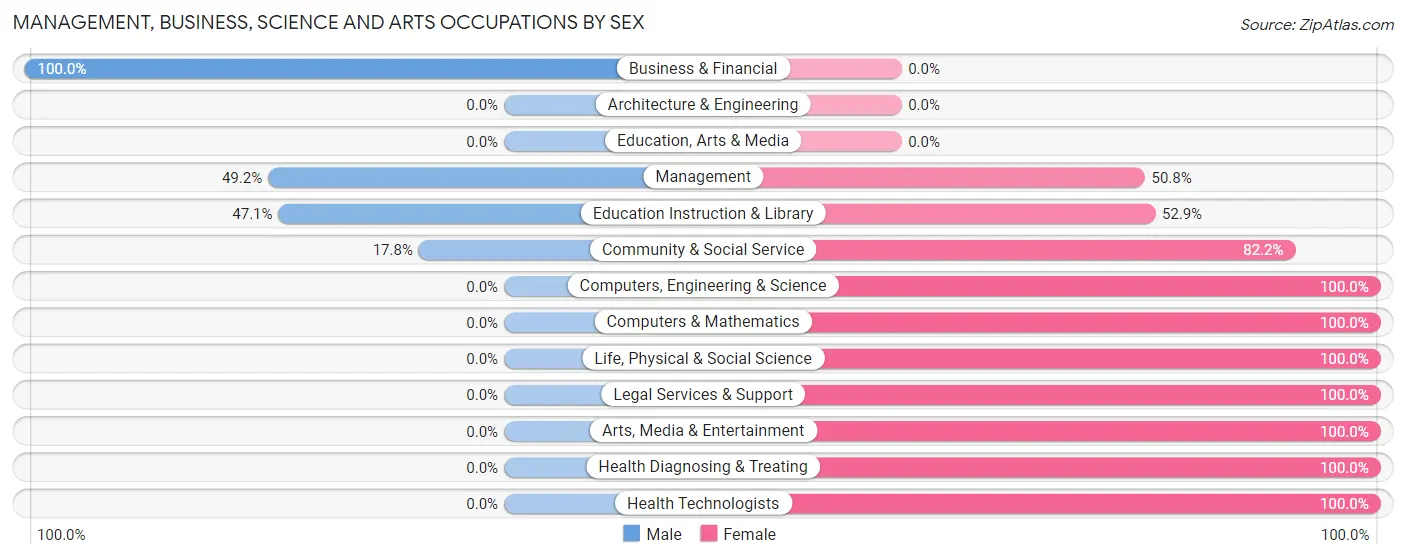
Management, Business, Science and Arts Occupations by Sex
Within the Management, Business, Science and Arts occupations in East Earl, the most male-oriented occupations are Business & Financial (100.0%), Management (49.2%), and Education Instruction & Library (47.1%), while the most female-oriented occupations are Computers, Engineering & Science (100.0%), Computers & Mathematics (100.0%), and Life, Physical & Social Science (100.0%).
| Occupation | Male | Female |
| Management | 32 (49.2%) | 33 (50.8%) |
| Business & Financial | 10 (100.0%) | 0 (0.0%) |
| Computers, Engineering & Science | 0 (0.0%) | 17 (100.0%) |
| Computers & Mathematics | 0 (0.0%) | 7 (100.0%) |
| Architecture & Engineering | 0 (0.0%) | 0 (0.0%) |
| Life, Physical & Social Science | 0 (0.0%) | 10 (100.0%) |
| Community & Social Service | 8 (17.8%) | 37 (82.2%) |
| Education, Arts & Media | 0 (0.0%) | 0 (0.0%) |
| Legal Services & Support | 0 (0.0%) | 17 (100.0%) |
| Education Instruction & Library | 8 (47.1%) | 9 (52.9%) |
| Arts, Media & Entertainment | 0 (0.0%) | 11 (100.0%) |
| Health Diagnosing & Treating | 0 (0.0%) | 20 (100.0%) |
| Health Technologists | 0 (0.0%) | 20 (100.0%) |
| Total (Category) | 50 (31.9%) | 107 (68.1%) |
| Total (Overall) | 425 (65.3%) | 226 (34.7%) |
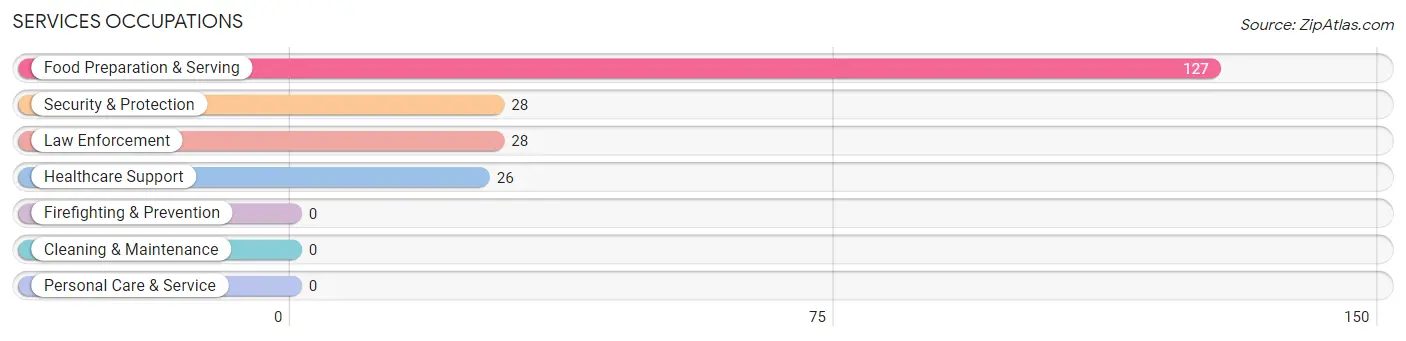
Services Occupations
The most common Services occupations in East Earl are Food Preparation & Serving (127 | 19.5%), Security & Protection (28 | 4.3%), Law Enforcement (28 | 4.3%), and Healthcare Support (26 | 4.0%).
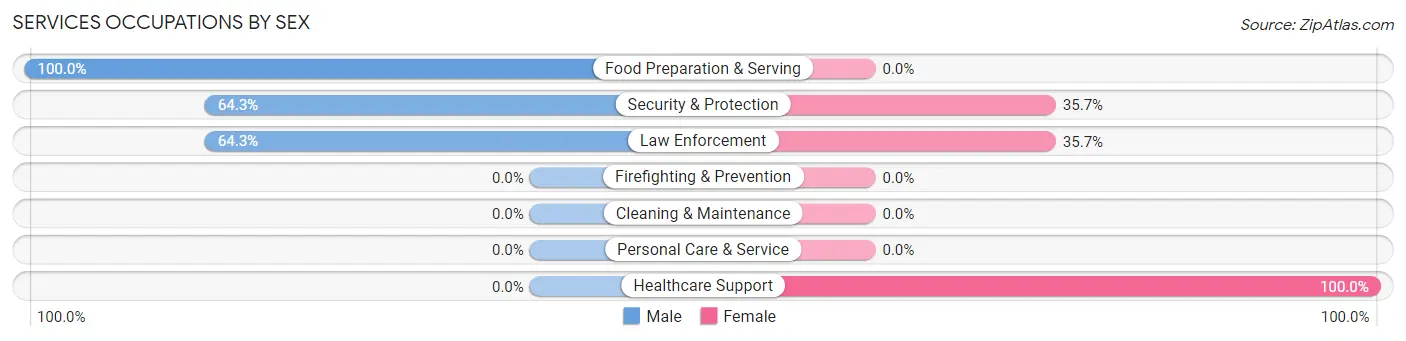
Services Occupations by Sex
Within the Services occupations in East Earl, the most male-oriented occupations are Food Preparation & Serving (100.0%), Security & Protection (64.3%), and Law Enforcement (64.3%), while the most female-oriented occupations are Healthcare Support (100.0%), Security & Protection (35.7%), and Law Enforcement (35.7%).
| Occupation | Male | Female |
| Healthcare Support | 0 (0.0%) | 26 (100.0%) |
| Security & Protection | 18 (64.3%) | 10 (35.7%) |
| Firefighting & Prevention | 0 (0.0%) | 0 (0.0%) |
| Law Enforcement | 18 (64.3%) | 10 (35.7%) |
| Food Preparation & Serving | 127 (100.0%) | 0 (0.0%) |
| Cleaning & Maintenance | 0 (0.0%) | 0 (0.0%) |
| Personal Care & Service | 0 (0.0%) | 0 (0.0%) |
| Total (Category) | 145 (80.1%) | 36 (19.9%) |
| Total (Overall) | 425 (65.3%) | 226 (34.7%) |
Sales and Office Occupations
The most common Sales and Office occupations in East Earl are Office & Administration (88 | 13.5%), and Sales & Related (47 | 7.2%).
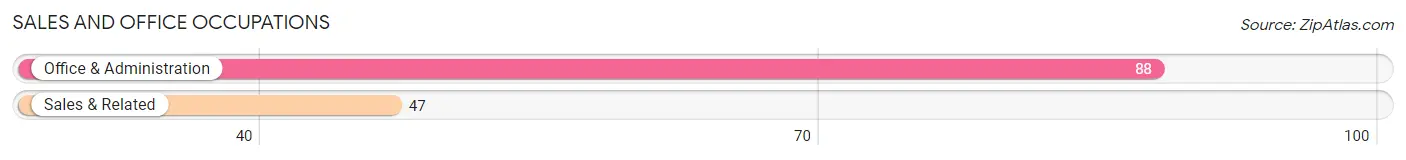
Sales and Office Occupations by Sex
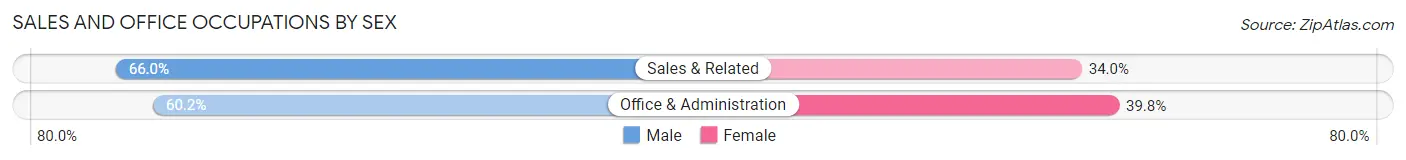
| Occupation | Male | Female |
| Sales & Related | 31 (66.0%) | 16 (34.0%) |
| Office & Administration | 53 (60.2%) | 35 (39.8%) |
| Total (Category) | 84 (62.2%) | 51 (37.8%) |
| Total (Overall) | 425 (65.3%) | 226 (34.7%) |
Natural Resources, Construction and Maintenance Occupations
The most common Natural Resources, Construction and Maintenance occupations in East Earl are Installation, Maintenance & Repair (12 | 1.8%), Farming, Fishing & Forestry (11 | 1.7%), and Construction & Extraction (4 | 0.6%).
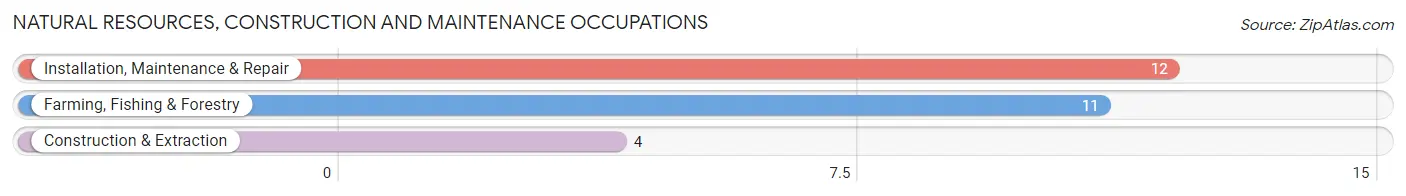
Natural Resources, Construction and Maintenance Occupations by Sex
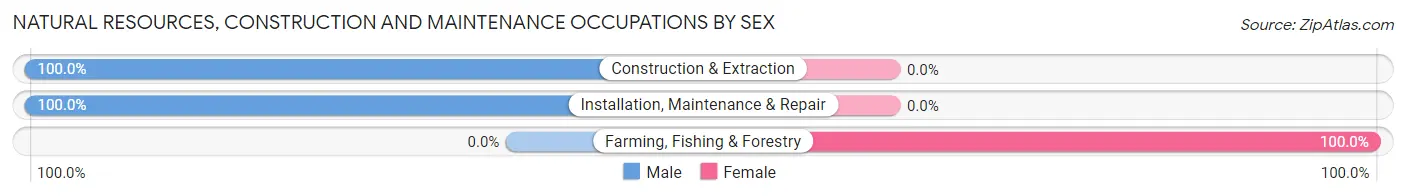
| Occupation | Male | Female |
| Farming, Fishing & Forestry | 0 (0.0%) | 11 (100.0%) |
| Construction & Extraction | 4 (100.0%) | 0 (0.0%) |
| Installation, Maintenance & Repair | 12 (100.0%) | 0 (0.0%) |
| Total (Category) | 16 (59.3%) | 11 (40.7%) |
| Total (Overall) | 425 (65.3%) | 226 (34.7%) |
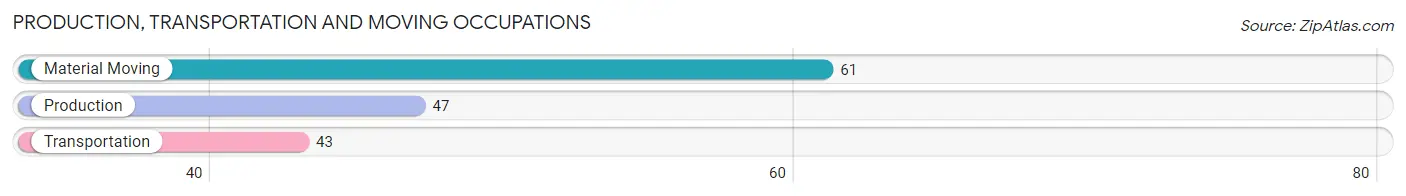
Production, Transportation and Moving Occupations
The most common Production, Transportation and Moving occupations in East Earl are Material Moving (61 | 9.4%), Production (47 | 7.2%), and Transportation (43 | 6.6%).
Production, Transportation and Moving Occupations by Sex
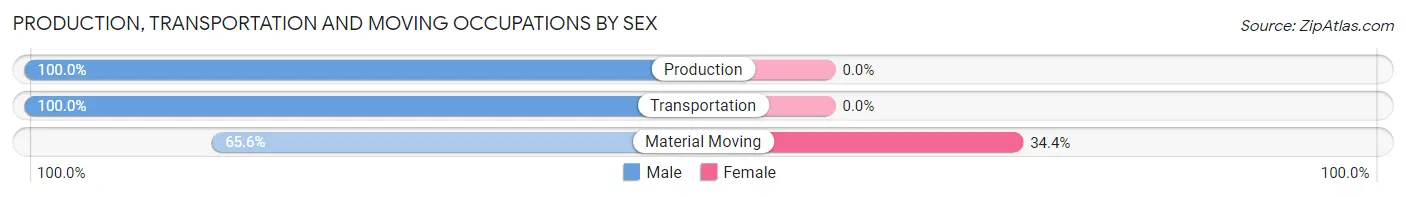
| Occupation | Male | Female |
| Production | 47 (100.0%) | 0 (0.0%) |
| Transportation | 43 (100.0%) | 0 (0.0%) |
| Material Moving | 40 (65.6%) | 21 (34.4%) |
| Total (Category) | 130 (86.1%) | 21 (13.9%) |
| Total (Overall) | 425 (65.3%) | 226 (34.7%) |
Employment Industries by Sex in East Earl
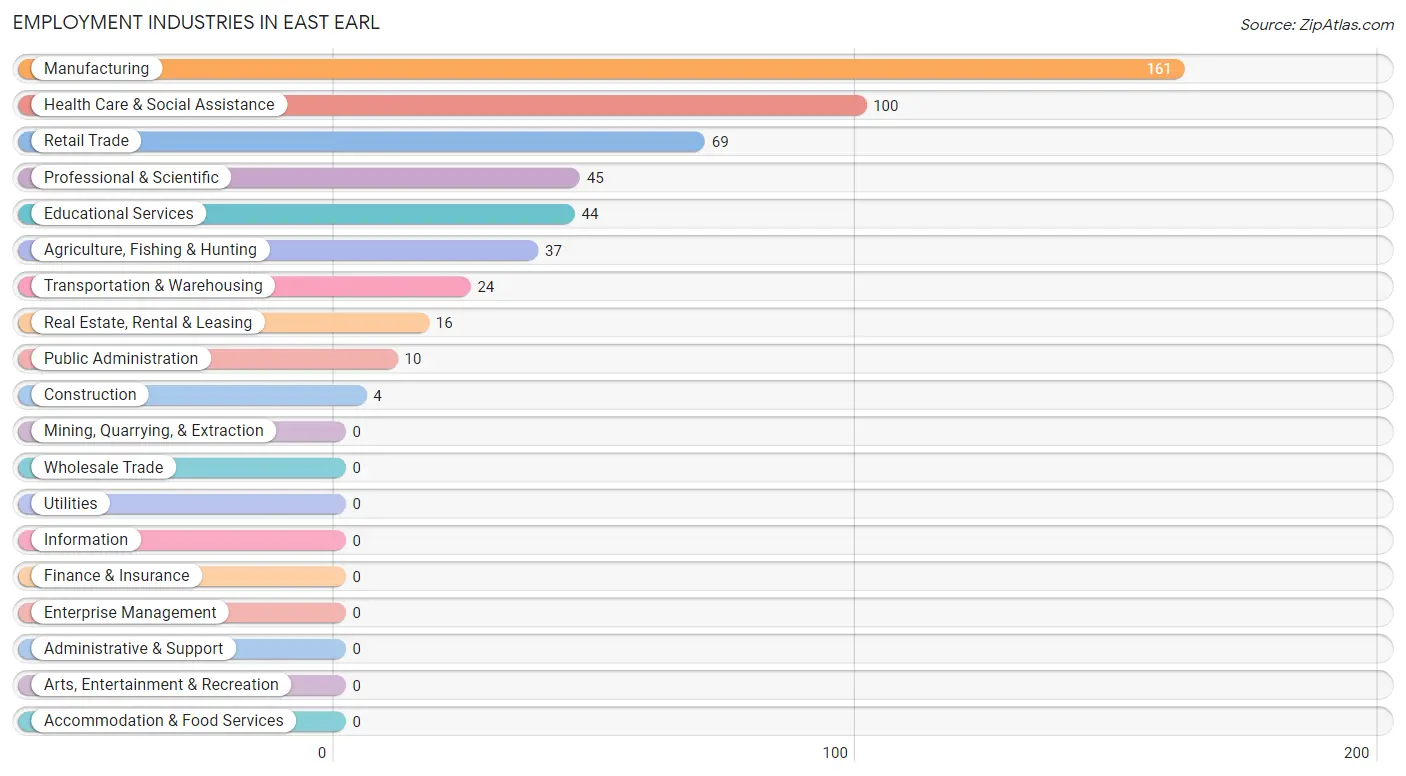
Employment Industries in East Earl
The major employment industries in East Earl include Manufacturing (161 | 24.7%), Health Care & Social Assistance (100 | 15.4%), Retail Trade (69 | 10.6%), Professional & Scientific (45 | 6.9%), and Educational Services (44 | 6.8%).
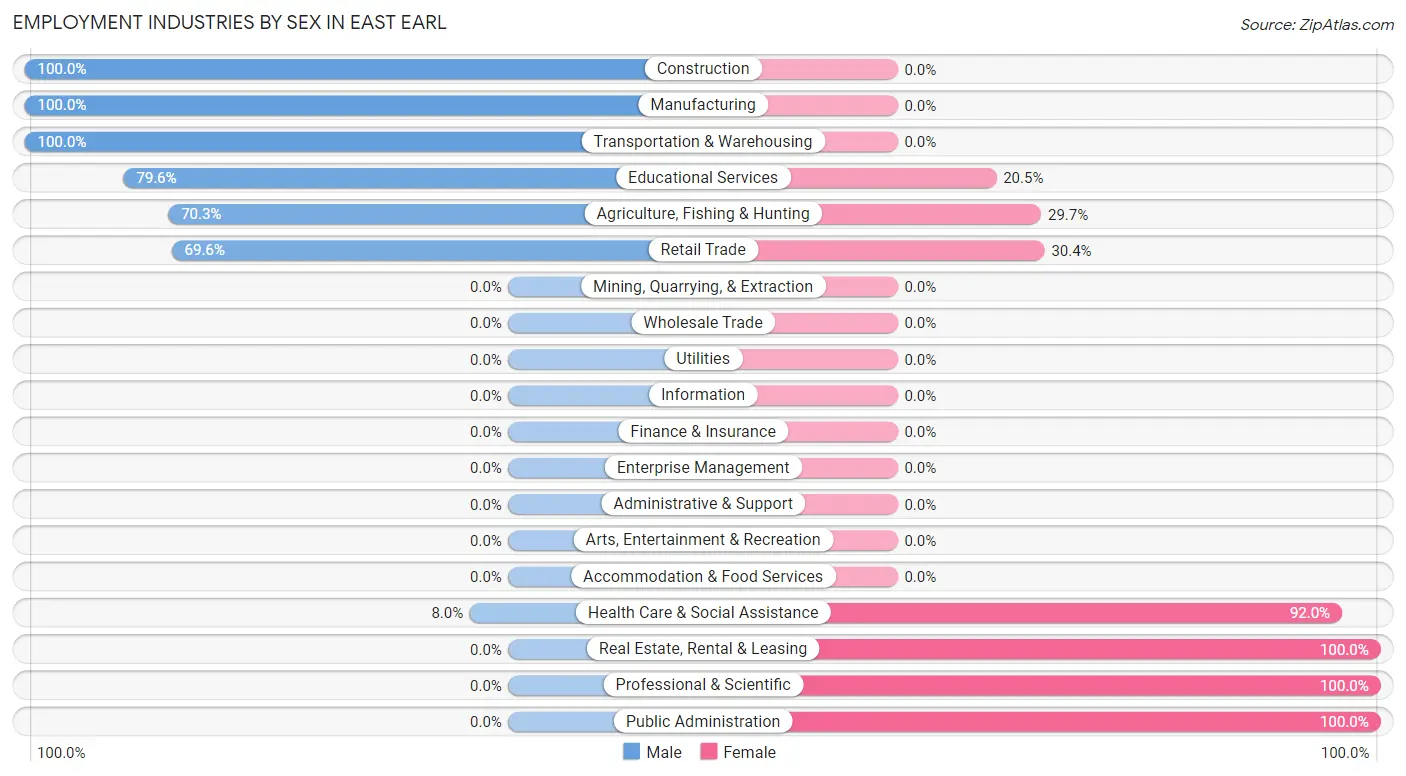
Employment Industries by Sex in East Earl
The East Earl industries that see more men than women are Construction (100.0%), Manufacturing (100.0%), and Transportation & Warehousing (100.0%), whereas the industries that tend to have a higher number of women are Real Estate, Rental & Leasing (100.0%), Professional & Scientific (100.0%), and Public Administration (100.0%).
| Industry | Male | Female |
| Agriculture, Fishing & Hunting | 26 (70.3%) | 11 (29.7%) |
| Mining, Quarrying, & Extraction | 0 (0.0%) | 0 (0.0%) |
| Construction | 4 (100.0%) | 0 (0.0%) |
| Manufacturing | 161 (100.0%) | 0 (0.0%) |
| Wholesale Trade | 0 (0.0%) | 0 (0.0%) |
| Retail Trade | 48 (69.6%) | 21 (30.4%) |
| Transportation & Warehousing | 24 (100.0%) | 0 (0.0%) |
| Utilities | 0 (0.0%) | 0 (0.0%) |
| Information | 0 (0.0%) | 0 (0.0%) |
| Finance & Insurance | 0 (0.0%) | 0 (0.0%) |
| Real Estate, Rental & Leasing | 0 (0.0%) | 16 (100.0%) |
| Professional & Scientific | 0 (0.0%) | 45 (100.0%) |
| Enterprise Management | 0 (0.0%) | 0 (0.0%) |
| Administrative & Support | 0 (0.0%) | 0 (0.0%) |
| Educational Services | 35 (79.5%) | 9 (20.4%) |
| Health Care & Social Assistance | 8 (8.0%) | 92 (92.0%) |
| Arts, Entertainment & Recreation | 0 (0.0%) | 0 (0.0%) |
| Accommodation & Food Services | 0 (0.0%) | 0 (0.0%) |
| Public Administration | 0 (0.0%) | 10 (100.0%) |
| Total | 425 (65.3%) | 226 (34.7%) |
Education in East Earl
School Enrollment in East Earl
The most common levels of schooling among the 242 students in East Earl are high school (88 | 36.4%), middle school (74 | 30.6%), and college / undergraduate (58 | 24.0%).
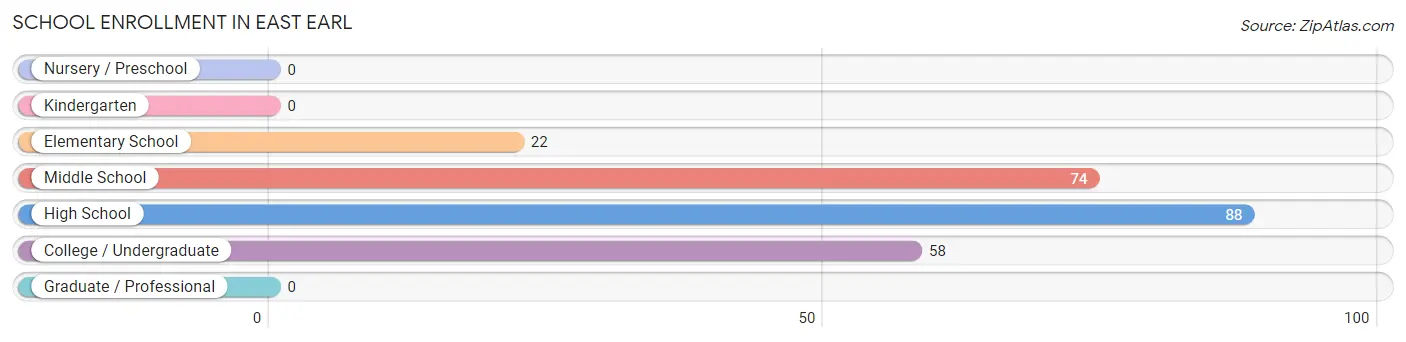
| School Level | # Students | % Students |
| Nursery / Preschool | 0 | 0.0% |
| Kindergarten | 0 | 0.0% |
| Elementary School | 22 | 9.1% |
| Middle School | 74 | 30.6% |
| High School | 88 | 36.4% |
| College / Undergraduate | 58 | 24.0% |
| Graduate / Professional | 0 | 0.0% |
| Total | 242 | 100.0% |
School Enrollment by Age by Funding Source in East Earl
Out of a total of 242 students who are enrolled in schools in East Earl, 39 (16.1%) attend a private institution, while the remaining 203 (83.9%) are enrolled in public schools. The age group of 20 to 24 year olds has the highest likelihood of being enrolled in private schools, with 16 (59.3% in the age bracket) enrolled. Conversely, the age group of 5 to 9 year old has the lowest likelihood of being enrolled in a private school, with 22 (100.0% in the age bracket) attending a public institution.
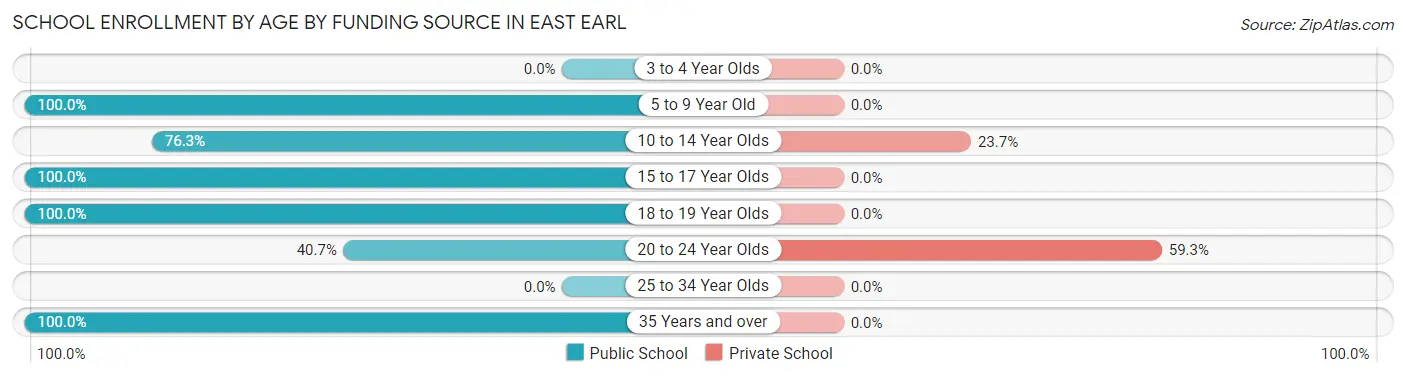
| Age Bracket | Public School | Private School |
| 3 to 4 Year Olds | 0 (0.0%) | 0 (0.0%) |
| 5 to 9 Year Old | 22 (100.0%) | 0 (0.0%) |
| 10 to 14 Year Olds | 74 (76.3%) | 23 (23.7%) |
| 15 to 17 Year Olds | 29 (100.0%) | 0 (0.0%) |
| 18 to 19 Year Olds | 56 (100.0%) | 0 (0.0%) |
| 20 to 24 Year Olds | 11 (40.7%) | 16 (59.3%) |
| 25 to 34 Year Olds | 0 (0.0%) | 0 (0.0%) |
| 35 Years and over | 11 (100.0%) | 0 (0.0%) |
| Total | 203 (83.9%) | 39 (16.1%) |
Educational Attainment by Field of Study in East Earl
Education (43 | 23.6%), science & technology (34 | 18.7%), psychology (33 | 18.1%), physical & health sciences (32 | 17.6%), and bio, nature & agricultural (22 | 12.1%) are the most common fields of study among 182 individuals in East Earl who have obtained a bachelor's degree or higher.
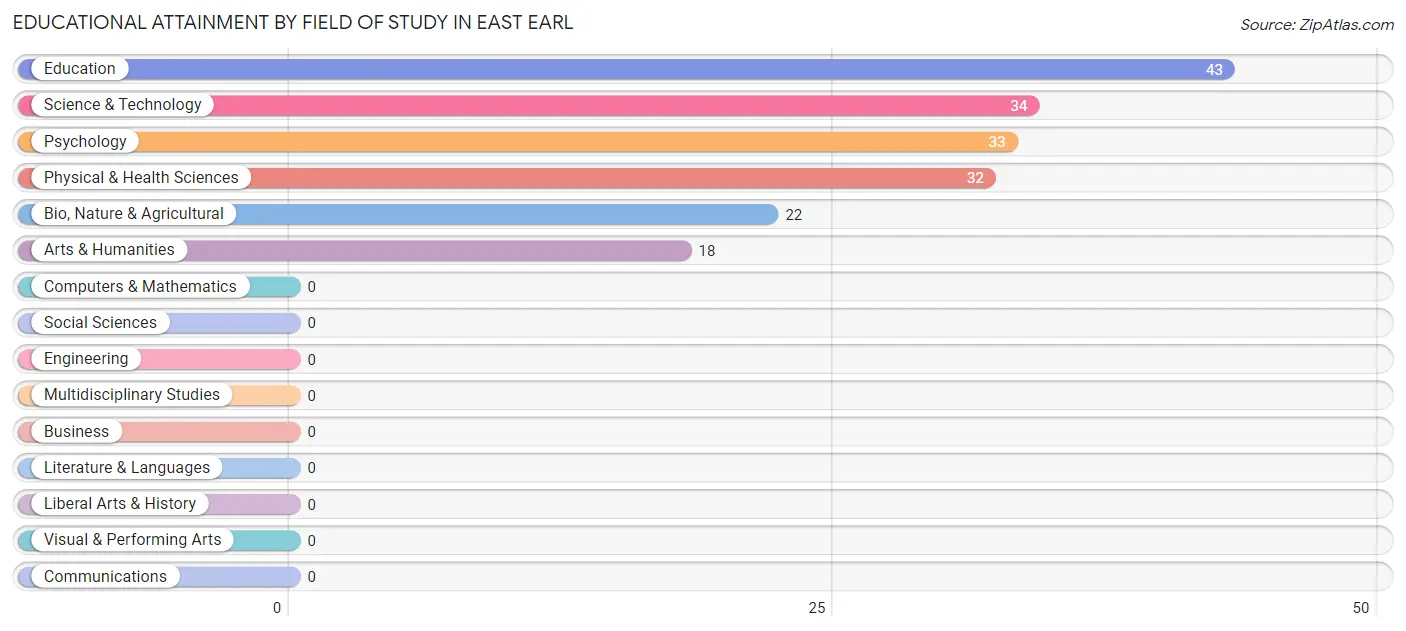
| Field of Study | # Graduates | % Graduates |
| Computers & Mathematics | 0 | 0.0% |
| Bio, Nature & Agricultural | 22 | 12.1% |
| Physical & Health Sciences | 32 | 17.6% |
| Psychology | 33 | 18.1% |
| Social Sciences | 0 | 0.0% |
| Engineering | 0 | 0.0% |
| Multidisciplinary Studies | 0 | 0.0% |
| Science & Technology | 34 | 18.7% |
| Business | 0 | 0.0% |
| Education | 43 | 23.6% |
| Literature & Languages | 0 | 0.0% |
| Liberal Arts & History | 0 | 0.0% |
| Visual & Performing Arts | 0 | 0.0% |
| Communications | 0 | 0.0% |
| Arts & Humanities | 18 | 9.9% |
| Total | 182 | 100.0% |
Transportation & Commute in East Earl
Vehicle Availability by Sex in East Earl
The most prevalent vehicle ownership categories in East Earl are males with 2 vehicles (202, accounting for 47.5%) and females with 2 vehicles (56, making up 89.4%).
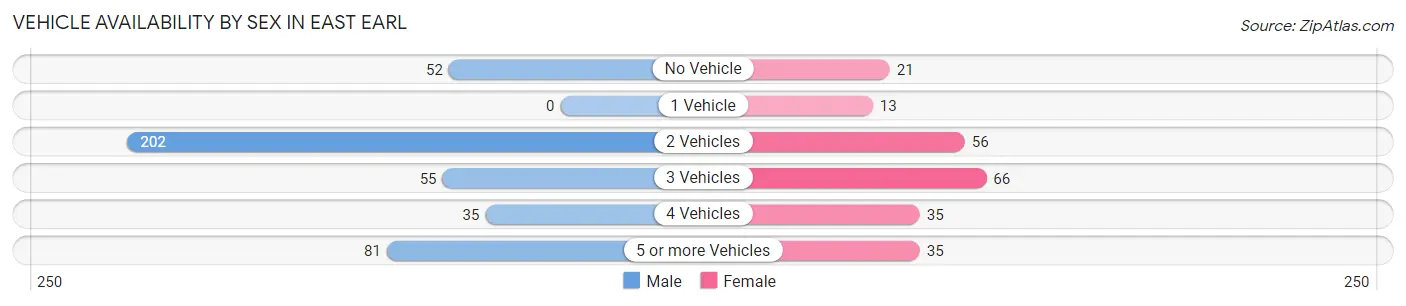
| Vehicles Available | Male | Female |
| No Vehicle | 52 (12.2%) | 21 (9.3%) |
| 1 Vehicle | 0 (0.0%) | 13 (5.8%) |
| 2 Vehicles | 202 (47.5%) | 56 (24.8%) |
| 3 Vehicles | 55 (12.9%) | 66 (29.2%) |
| 4 Vehicles | 35 (8.2%) | 35 (15.5%) |
| 5 or more Vehicles | 81 (19.1%) | 35 (15.5%) |
| Total | 425 (100.0%) | 226 (100.0%) |
Commute Time in East Earl
The most frequently occuring commute durations in East Earl are 5 to 9 minutes (188 commuters, 30.0%), 45 to 59 minutes (125 commuters, 20.0%), and 10 to 14 minutes (112 commuters, 17.9%).
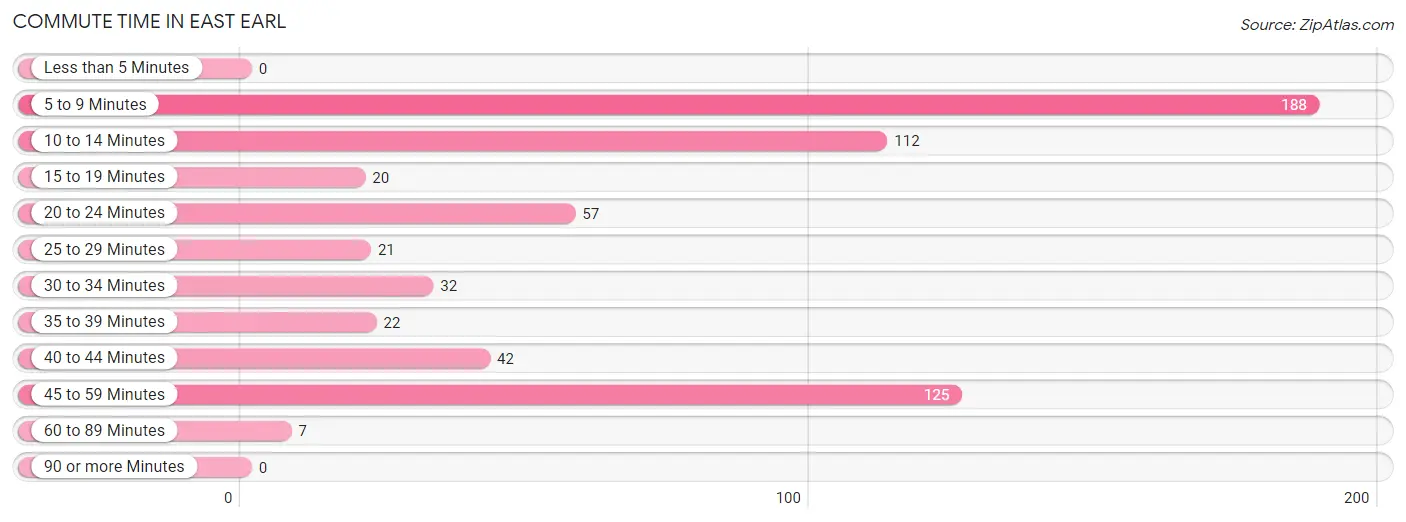
| Commute Time | # Commuters | % Commuters |
| Less than 5 Minutes | 0 | 0.0% |
| 5 to 9 Minutes | 188 | 30.0% |
| 10 to 14 Minutes | 112 | 17.9% |
| 15 to 19 Minutes | 20 | 3.2% |
| 20 to 24 Minutes | 57 | 9.1% |
| 25 to 29 Minutes | 21 | 3.4% |
| 30 to 34 Minutes | 32 | 5.1% |
| 35 to 39 Minutes | 22 | 3.5% |
| 40 to 44 Minutes | 42 | 6.7% |
| 45 to 59 Minutes | 125 | 20.0% |
| 60 to 89 Minutes | 7 | 1.1% |
| 90 or more Minutes | 0 | 0.0% |
Commute Time by Sex in East Earl
The most common commute times in East Earl are 5 to 9 minutes (167 commuters, 39.3%) for males and 45 to 59 minutes (55 commuters, 27.4%) for females.
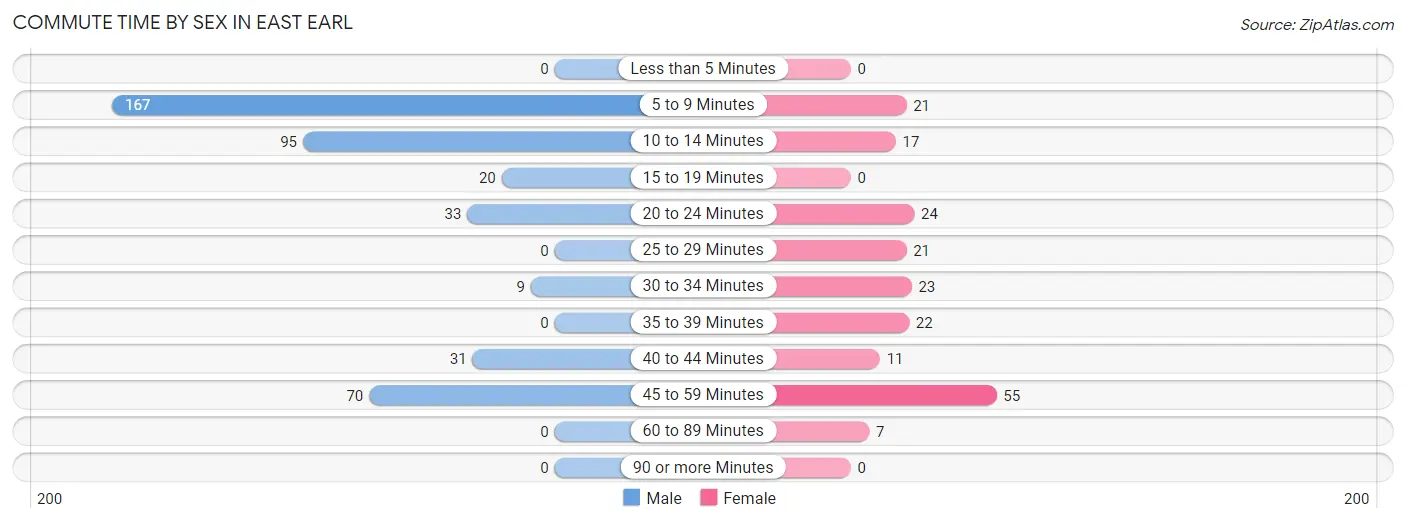
| Commute Time | Male | Female |
| Less than 5 Minutes | 0 (0.0%) | 0 (0.0%) |
| 5 to 9 Minutes | 167 (39.3%) | 21 (10.4%) |
| 10 to 14 Minutes | 95 (22.4%) | 17 (8.5%) |
| 15 to 19 Minutes | 20 (4.7%) | 0 (0.0%) |
| 20 to 24 Minutes | 33 (7.8%) | 24 (11.9%) |
| 25 to 29 Minutes | 0 (0.0%) | 21 (10.4%) |
| 30 to 34 Minutes | 9 (2.1%) | 23 (11.4%) |
| 35 to 39 Minutes | 0 (0.0%) | 22 (11.0%) |
| 40 to 44 Minutes | 31 (7.3%) | 11 (5.5%) |
| 45 to 59 Minutes | 70 (16.5%) | 55 (27.4%) |
| 60 to 89 Minutes | 0 (0.0%) | 7 (3.5%) |
| 90 or more Minutes | 0 (0.0%) | 0 (0.0%) |
Time of Departure to Work by Sex in East Earl
The most frequent times of departure to work in East Earl are 7:00 AM to 7:29 AM (190, 44.7%) for males and 6:30 AM to 6:59 AM (48, 23.9%) for females.
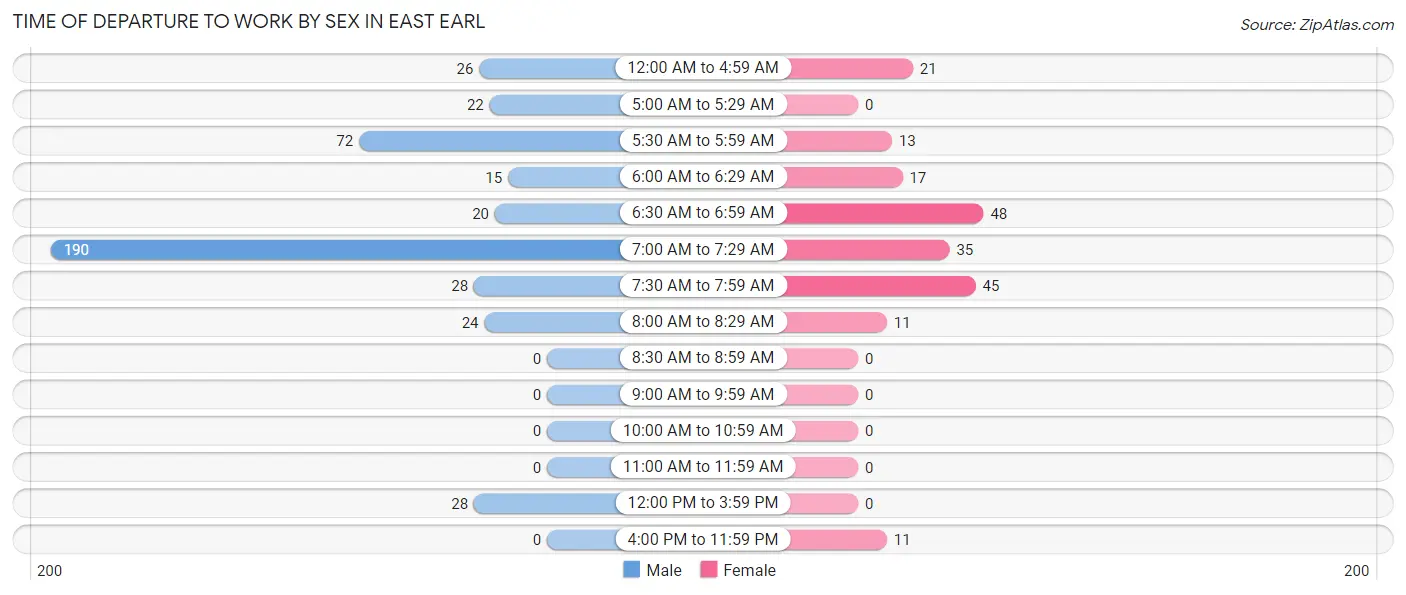
| Time of Departure | Male | Female |
| 12:00 AM to 4:59 AM | 26 (6.1%) | 21 (10.4%) |
| 5:00 AM to 5:29 AM | 22 (5.2%) | 0 (0.0%) |
| 5:30 AM to 5:59 AM | 72 (16.9%) | 13 (6.5%) |
| 6:00 AM to 6:29 AM | 15 (3.5%) | 17 (8.5%) |
| 6:30 AM to 6:59 AM | 20 (4.7%) | 48 (23.9%) |
| 7:00 AM to 7:29 AM | 190 (44.7%) | 35 (17.4%) |
| 7:30 AM to 7:59 AM | 28 (6.6%) | 45 (22.4%) |
| 8:00 AM to 8:29 AM | 24 (5.7%) | 11 (5.5%) |
| 8:30 AM to 8:59 AM | 0 (0.0%) | 0 (0.0%) |
| 9:00 AM to 9:59 AM | 0 (0.0%) | 0 (0.0%) |
| 10:00 AM to 10:59 AM | 0 (0.0%) | 0 (0.0%) |
| 11:00 AM to 11:59 AM | 0 (0.0%) | 0 (0.0%) |
| 12:00 PM to 3:59 PM | 28 (6.6%) | 0 (0.0%) |
| 4:00 PM to 11:59 PM | 0 (0.0%) | 11 (5.5%) |
| Total | 425 (100.0%) | 201 (100.0%) |
Housing Occupancy in East Earl
Occupancy by Ownership in East Earl
Of the total 393 dwellings in East Earl, owner-occupied units account for 393 (100.0%), while renter-occupied units make up 0 (0.0%).
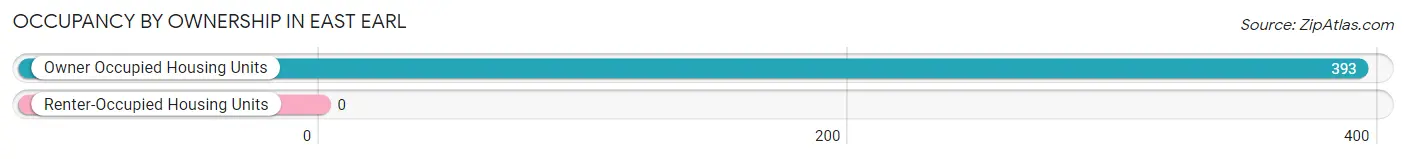
| Occupancy | # Housing Units | % Housing Units |
| Owner Occupied Housing Units | 393 | 100.0% |
| Renter-Occupied Housing Units | 0 | 0.0% |
| Total Occupied Housing Units | 393 | 100.0% |
Occupancy by Household Size in East Earl
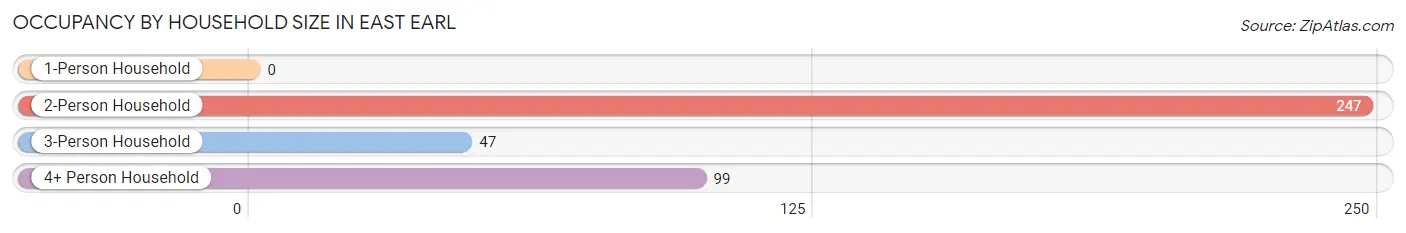
| Household Size | # Housing Units | % Housing Units |
| 1-Person Household | 0 | 0.0% |
| 2-Person Household | 247 | 62.8% |
| 3-Person Household | 47 | 12.0% |
| 4+ Person Household | 99 | 25.2% |
| Total Housing Units | 393 | 100.0% |
Occupancy by Ownership by Household Size in East Earl
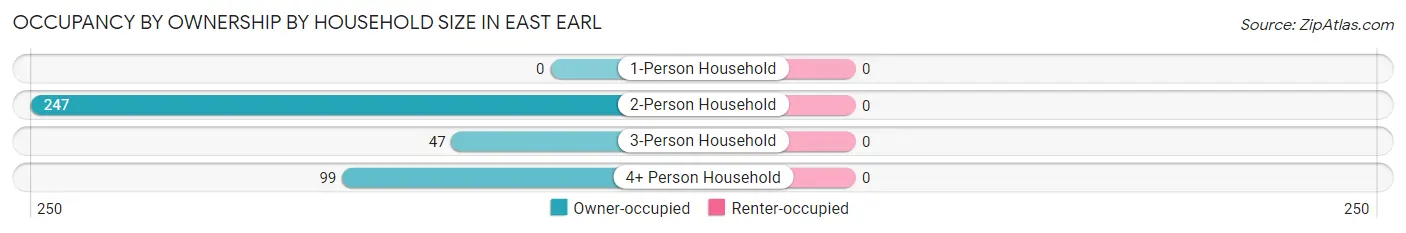
| Household Size | Owner-occupied | Renter-occupied |
| 1-Person Household | 0 (0.0%) | 0 (0.0%) |
| 2-Person Household | 247 (100.0%) | 0 (0.0%) |
| 3-Person Household | 47 (100.0%) | 0 (0.0%) |
| 4+ Person Household | 99 (100.0%) | 0 (0.0%) |
| Total Housing Units | 393 (100.0%) | 0 (0.0%) |
Occupancy by Educational Attainment in East Earl
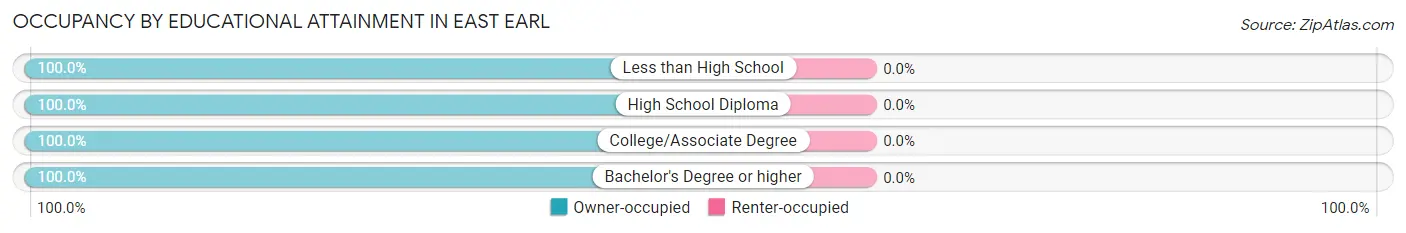
| Household Size | Owner-occupied | Renter-occupied |
| Less than High School | 53 (100.0%) | 0 (0.0%) |
| High School Diploma | 177 (100.0%) | 0 (0.0%) |
| College/Associate Degree | 52 (100.0%) | 0 (0.0%) |
| Bachelor's Degree or higher | 111 (100.0%) | 0 (0.0%) |
Occupancy by Age of Householder in East Earl
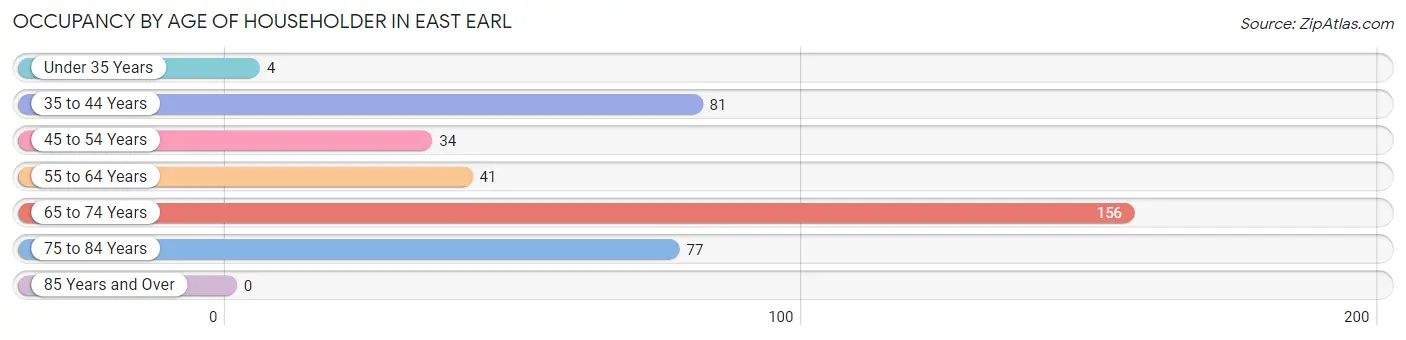
| Age Bracket | # Households | % Households |
| Under 35 Years | 4 | 1.0% |
| 35 to 44 Years | 81 | 20.6% |
| 45 to 54 Years | 34 | 8.6% |
| 55 to 64 Years | 41 | 10.4% |
| 65 to 74 Years | 156 | 39.7% |
| 75 to 84 Years | 77 | 19.6% |
| 85 Years and Over | 0 | 0.0% |
| Total | 393 | 100.0% |
Housing Finances in East Earl
Median Income by Occupancy in East Earl
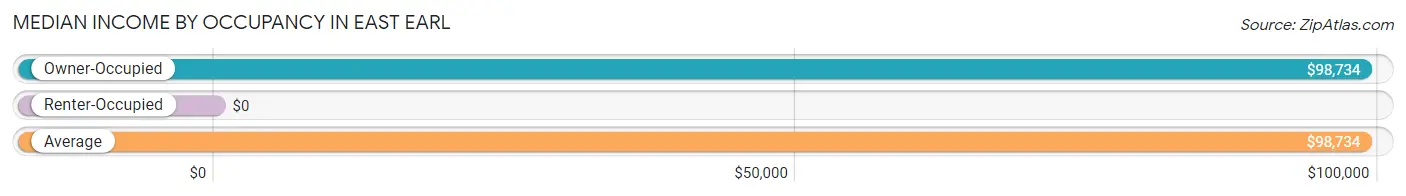
| Occupancy Type | # Households | Median Income |
| Owner-Occupied | 393 (100.0%) | $98,734 |
| Renter-Occupied | 0 (0.0%) | $0 |
| Average | 393 (100.0%) | $98,734 |
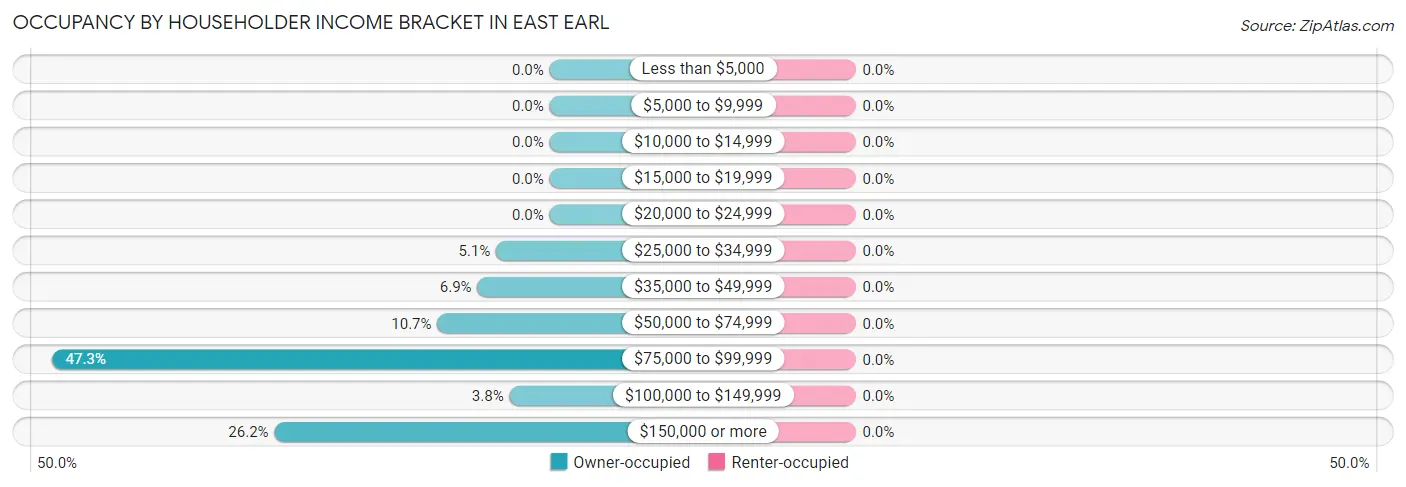
Occupancy by Householder Income Bracket in East Earl
| Income Bracket | Owner-occupied | Renter-occupied |
| Less than $5,000 | 0 (0.0%) | 0 (0.0%) |
| $5,000 to $9,999 | 0 (0.0%) | 0 (0.0%) |
| $10,000 to $14,999 | 0 (0.0%) | 0 (0.0%) |
| $15,000 to $19,999 | 0 (0.0%) | 0 (0.0%) |
| $20,000 to $24,999 | 0 (0.0%) | 0 (0.0%) |
| $25,000 to $34,999 | 20 (5.1%) | 0 (0.0%) |
| $35,000 to $49,999 | 27 (6.9%) | 0 (0.0%) |
| $50,000 to $74,999 | 42 (10.7%) | 0 (0.0%) |
| $75,000 to $99,999 | 186 (47.3%) | 0 (0.0%) |
| $100,000 to $149,999 | 15 (3.8%) | 0 (0.0%) |
| $150,000 or more | 103 (26.2%) | 0 (0.0%) |
| Total | 393 (100.0%) | 0 (0.0%) |
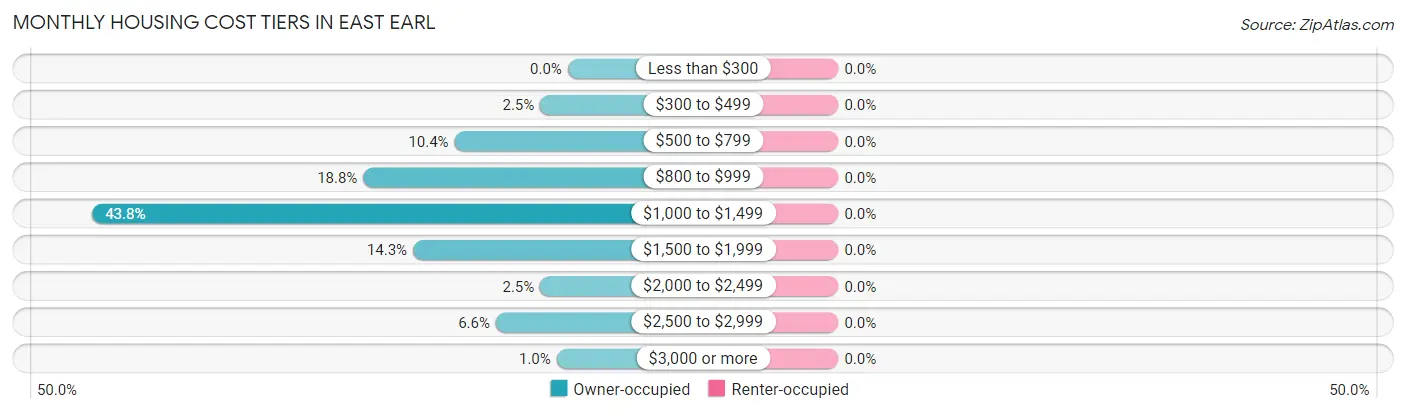
Monthly Housing Cost Tiers in East Earl
| Monthly Cost | Owner-occupied | Renter-occupied |
| Less than $300 | 0 (0.0%) | 0 (0.0%) |
| $300 to $499 | 10 (2.5%) | 0 (0.0%) |
| $500 to $799 | 41 (10.4%) | 0 (0.0%) |
| $800 to $999 | 74 (18.8%) | 0 (0.0%) |
| $1,000 to $1,499 | 172 (43.8%) | 0 (0.0%) |
| $1,500 to $1,999 | 56 (14.2%) | 0 (0.0%) |
| $2,000 to $2,499 | 10 (2.5%) | 0 (0.0%) |
| $2,500 to $2,999 | 26 (6.6%) | 0 (0.0%) |
| $3,000 or more | 4 (1.0%) | 0 (0.0%) |
| Total | 393 (100.0%) | 0 (0.0%) |
Physical Housing Characteristics in East Earl
Housing Structures in East Earl
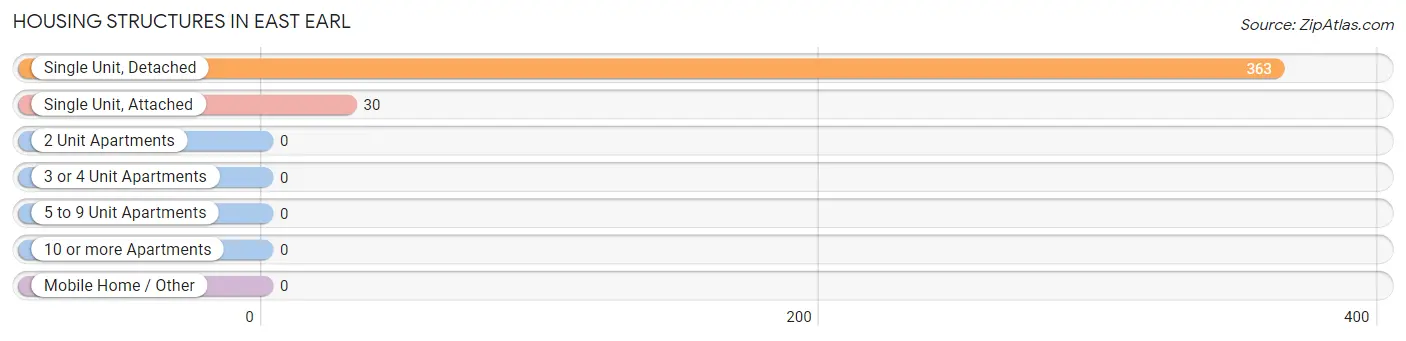
| Structure Type | # Housing Units | % Housing Units |
| Single Unit, Detached | 363 | 92.4% |
| Single Unit, Attached | 30 | 7.6% |
| 2 Unit Apartments | 0 | 0.0% |
| 3 or 4 Unit Apartments | 0 | 0.0% |
| 5 to 9 Unit Apartments | 0 | 0.0% |
| 10 or more Apartments | 0 | 0.0% |
| Mobile Home / Other | 0 | 0.0% |
| Total | 393 | 100.0% |
Housing Structures by Occupancy in East Earl
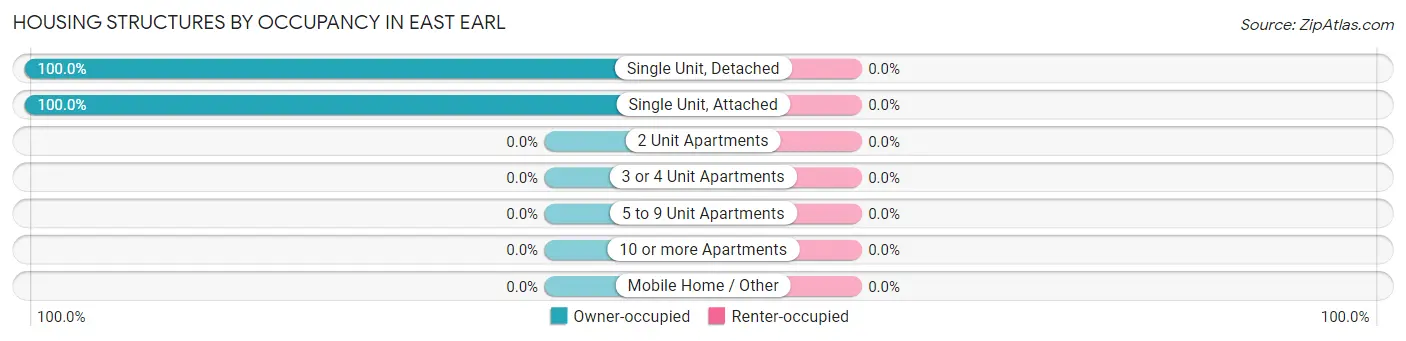
| Structure Type | Owner-occupied | Renter-occupied |
| Single Unit, Detached | 363 (100.0%) | 0 (0.0%) |
| Single Unit, Attached | 30 (100.0%) | 0 (0.0%) |
| 2 Unit Apartments | 0 (0.0%) | 0 (0.0%) |
| 3 or 4 Unit Apartments | 0 (0.0%) | 0 (0.0%) |
| 5 to 9 Unit Apartments | 0 (0.0%) | 0 (0.0%) |
| 10 or more Apartments | 0 (0.0%) | 0 (0.0%) |
| Mobile Home / Other | 0 (0.0%) | 0 (0.0%) |
| Total | 393 (100.0%) | 0 (0.0%) |
Housing Structures by Number of Rooms in East Earl
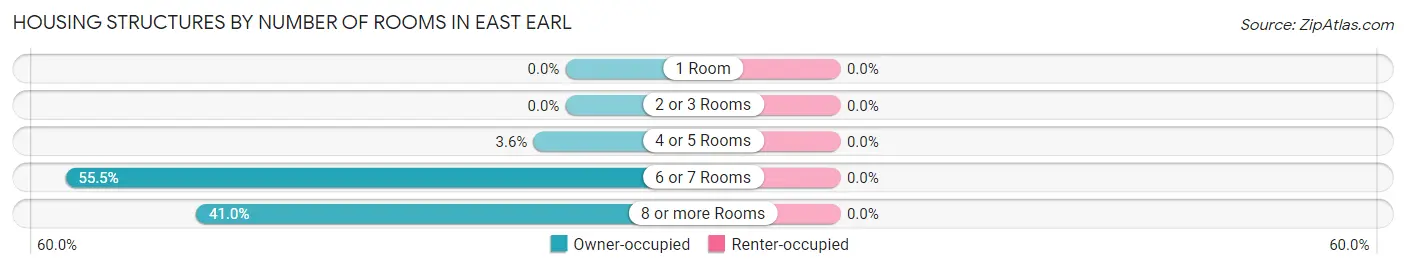
| Number of Rooms | Owner-occupied | Renter-occupied |
| 1 Room | 0 (0.0%) | 0 (0.0%) |
| 2 or 3 Rooms | 0 (0.0%) | 0 (0.0%) |
| 4 or 5 Rooms | 14 (3.6%) | 0 (0.0%) |
| 6 or 7 Rooms | 218 (55.5%) | 0 (0.0%) |
| 8 or more Rooms | 161 (41.0%) | 0 (0.0%) |
| Total | 393 (100.0%) | 0 (0.0%) |
Housing Structure by Heating Type in East Earl
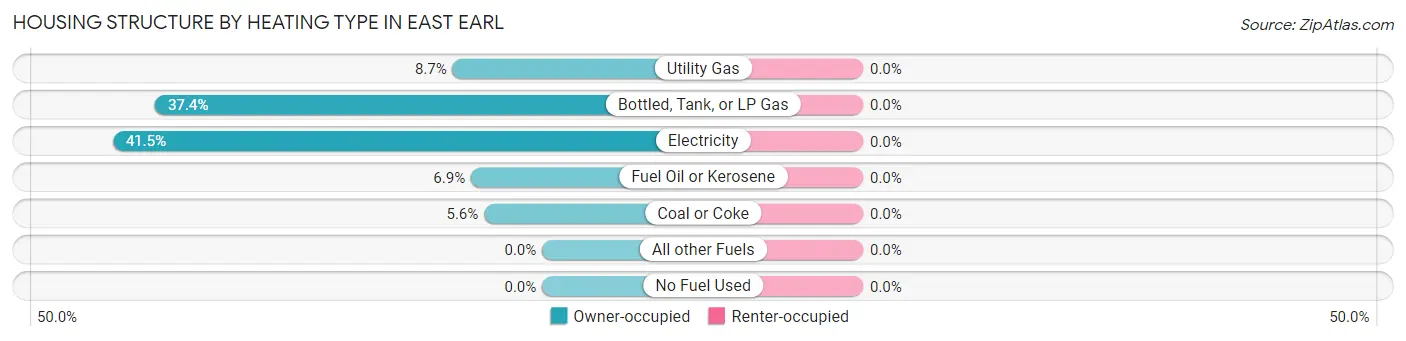
| Heating Type | Owner-occupied | Renter-occupied |
| Utility Gas | 34 (8.6%) | 0 (0.0%) |
| Bottled, Tank, or LP Gas | 147 (37.4%) | 0 (0.0%) |
| Electricity | 163 (41.5%) | 0 (0.0%) |
| Fuel Oil or Kerosene | 27 (6.9%) | 0 (0.0%) |
| Coal or Coke | 22 (5.6%) | 0 (0.0%) |
| All other Fuels | 0 (0.0%) | 0 (0.0%) |
| No Fuel Used | 0 (0.0%) | 0 (0.0%) |
| Total | 393 (100.0%) | 0 (0.0%) |
Household Vehicle Usage in East Earl
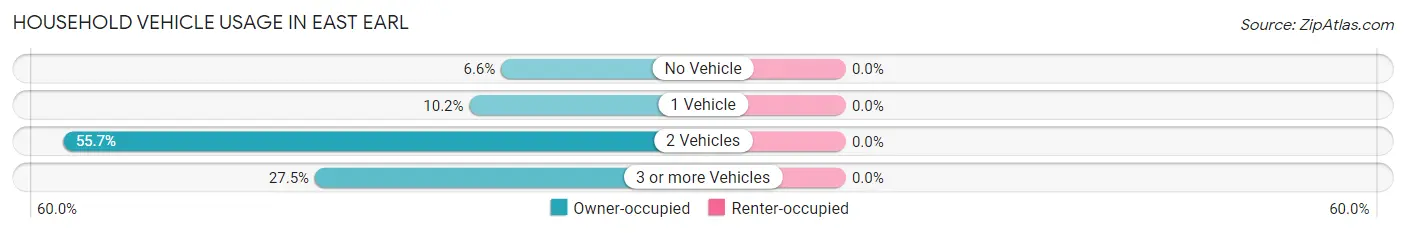
| Vehicles per Household | Owner-occupied | Renter-occupied |
| No Vehicle | 26 (6.6%) | 0 (0.0%) |
| 1 Vehicle | 40 (10.2%) | 0 (0.0%) |
| 2 Vehicles | 219 (55.7%) | 0 (0.0%) |
| 3 or more Vehicles | 108 (27.5%) | 0 (0.0%) |
| Total | 393 (100.0%) | 0 (0.0%) |
Real Estate & Mortgages in East Earl
Real Estate and Mortgage Overview in East Earl
| Characteristic | Without Mortgage | With Mortgage |
| Housing Units | 109 | 284 |
| Median Property Value | $310,900 | $353,100 |
| Median Household Income | $94,904 | $60 |
| Monthly Housing Costs | $832 | $4 |
| Real Estate Taxes | $5,151 | $0 |
Property Value by Mortgage Status in East Earl
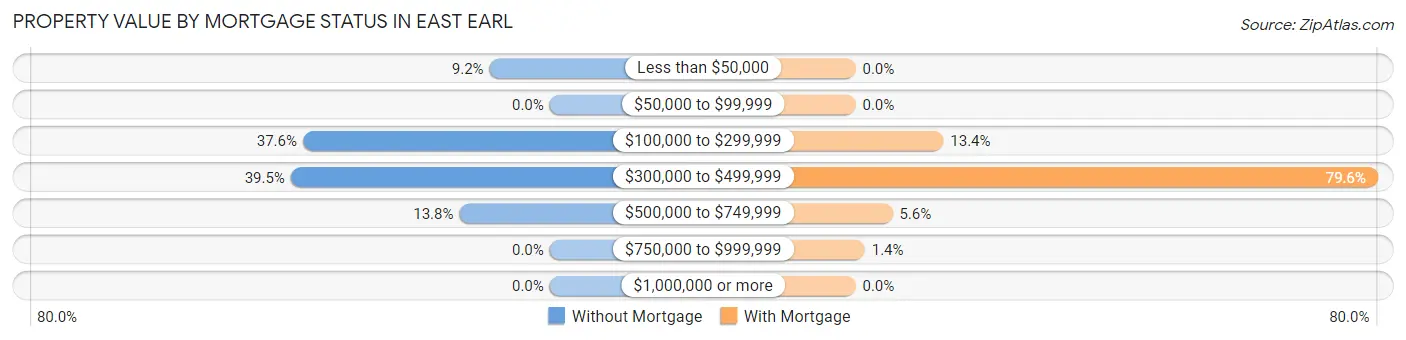
| Property Value | Without Mortgage | With Mortgage |
| Less than $50,000 | 10 (9.2%) | 0 (0.0%) |
| $50,000 to $99,999 | 0 (0.0%) | 0 (0.0%) |
| $100,000 to $299,999 | 41 (37.6%) | 38 (13.4%) |
| $300,000 to $499,999 | 43 (39.5%) | 226 (79.6%) |
| $500,000 to $749,999 | 15 (13.8%) | 16 (5.6%) |
| $750,000 to $999,999 | 0 (0.0%) | 4 (1.4%) |
| $1,000,000 or more | 0 (0.0%) | 0 (0.0%) |
| Total | 109 (100.0%) | 284 (100.0%) |
Household Income by Mortgage Status in East Earl
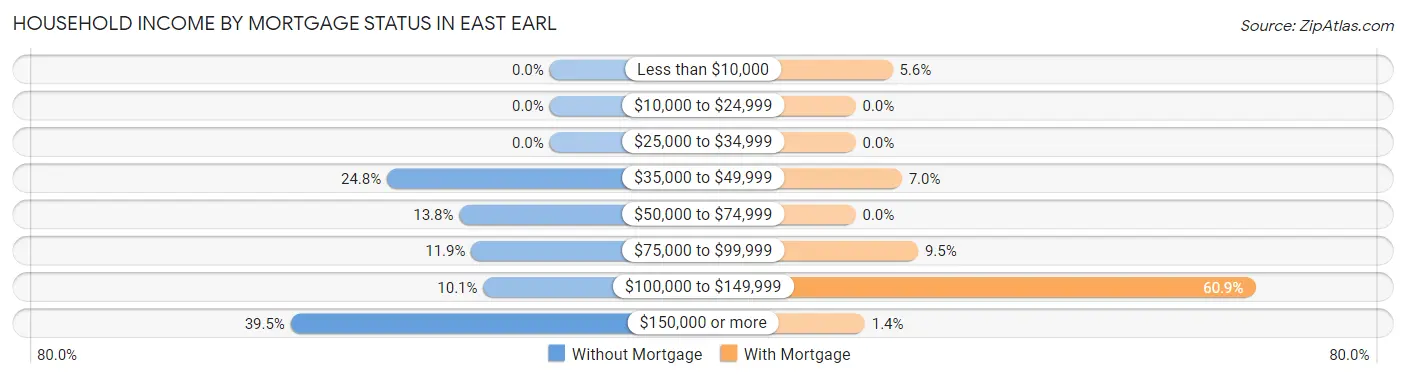
| Household Income | Without Mortgage | With Mortgage |
| Less than $10,000 | 0 (0.0%) | 16 (5.6%) |
| $10,000 to $24,999 | 0 (0.0%) | 0 (0.0%) |
| $25,000 to $34,999 | 0 (0.0%) | 0 (0.0%) |
| $35,000 to $49,999 | 27 (24.8%) | 20 (7.0%) |
| $50,000 to $74,999 | 15 (13.8%) | 0 (0.0%) |
| $75,000 to $99,999 | 13 (11.9%) | 27 (9.5%) |
| $100,000 to $149,999 | 11 (10.1%) | 173 (60.9%) |
| $150,000 or more | 43 (39.5%) | 4 (1.4%) |
| Total | 109 (100.0%) | 284 (100.0%) |
Property Value to Household Income Ratio in East Earl
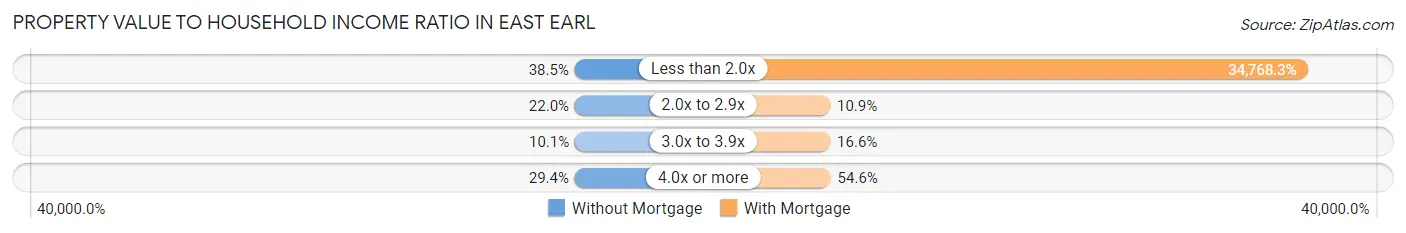
| Value-to-Income Ratio | Without Mortgage | With Mortgage |
| Less than 2.0x | 42 (38.5%) | 98,742 (34,768.3%) |
| 2.0x to 2.9x | 24 (22.0%) | 31 (10.9%) |
| 3.0x to 3.9x | 11 (10.1%) | 47 (16.6%) |
| 4.0x or more | 32 (29.4%) | 155 (54.6%) |
| Total | 109 (100.0%) | 284 (100.0%) |
Real Estate Taxes by Mortgage Status in East Earl
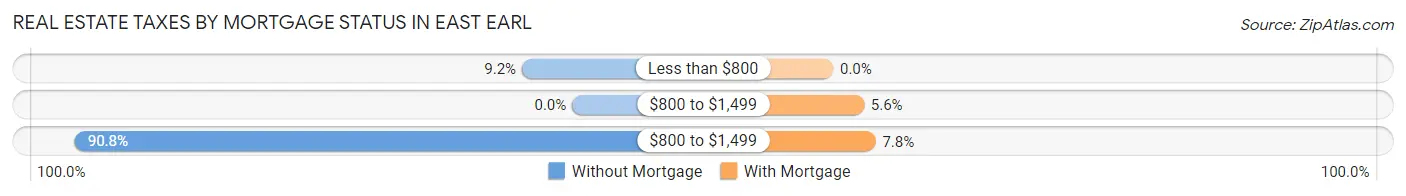
| Property Taxes | Without Mortgage | With Mortgage |
| Less than $800 | 10 (9.2%) | 0 (0.0%) |
| $800 to $1,499 | 0 (0.0%) | 16 (5.6%) |
| $800 to $1,499 | 99 (90.8%) | 22 (7.7%) |
| Total | 109 (100.0%) | 284 (100.0%) |
Health & Disability in East Earl
Health Insurance Coverage by Age in East Earl
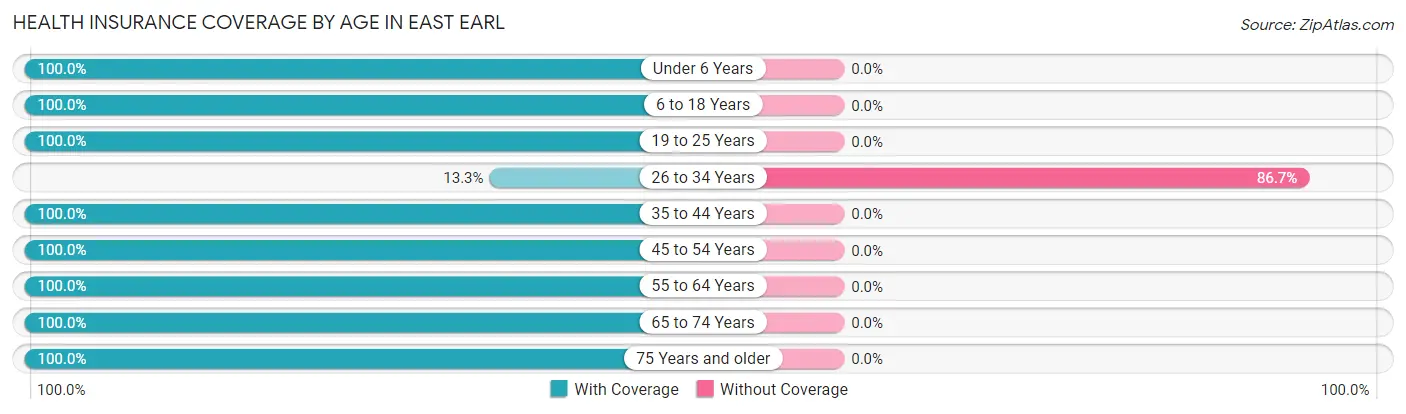
| Age Bracket | With Coverage | Without Coverage |
| Under 6 Years | 17 (100.0%) | 0 (0.0%) |
| 6 to 18 Years | 204 (100.0%) | 0 (0.0%) |
| 19 to 25 Years | 96 (100.0%) | 0 (0.0%) |
| 26 to 34 Years | 4 (13.3%) | 26 (86.7%) |
| 35 to 44 Years | 167 (100.0%) | 0 (0.0%) |
| 45 to 54 Years | 121 (100.0%) | 0 (0.0%) |
| 55 to 64 Years | 105 (100.0%) | 0 (0.0%) |
| 65 to 74 Years | 287 (100.0%) | 0 (0.0%) |
| 75 Years and older | 117 (100.0%) | 0 (0.0%) |
| Total | 1,118 (97.7%) | 26 (2.3%) |
Health Insurance Coverage by Citizenship Status in East Earl
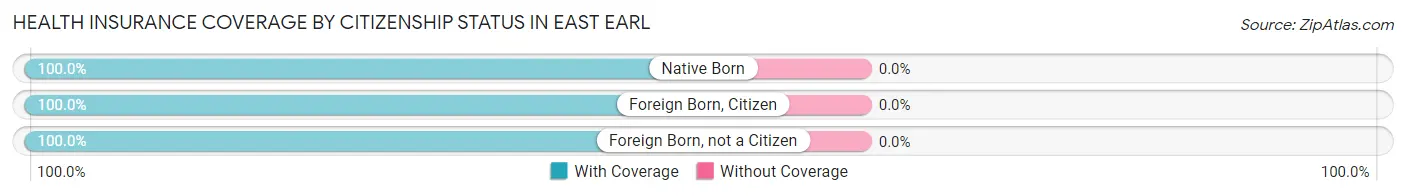
| Citizenship Status | With Coverage | Without Coverage |
| Native Born | 17 (100.0%) | 0 (0.0%) |
| Foreign Born, Citizen | 204 (100.0%) | 0 (0.0%) |
| Foreign Born, not a Citizen | 96 (100.0%) | 0 (0.0%) |
Health Insurance Coverage by Household Income in East Earl
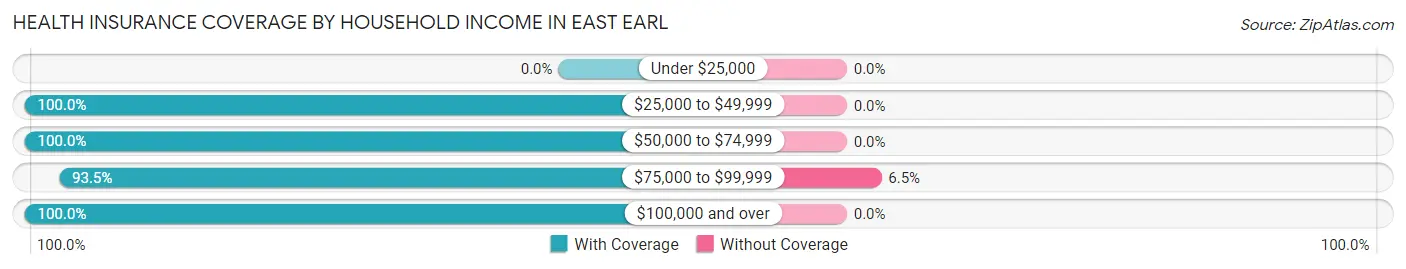
| Household Income | With Coverage | Without Coverage |
| Under $25,000 | 0 (0.0%) | 0 (0.0%) |
| $25,000 to $49,999 | 102 (100.0%) | 0 (0.0%) |
| $50,000 to $74,999 | 115 (100.0%) | 0 (0.0%) |
| $75,000 to $99,999 | 376 (93.5%) | 26 (6.5%) |
| $100,000 and over | 525 (100.0%) | 0 (0.0%) |
Public vs Private Health Insurance Coverage by Age in East Earl
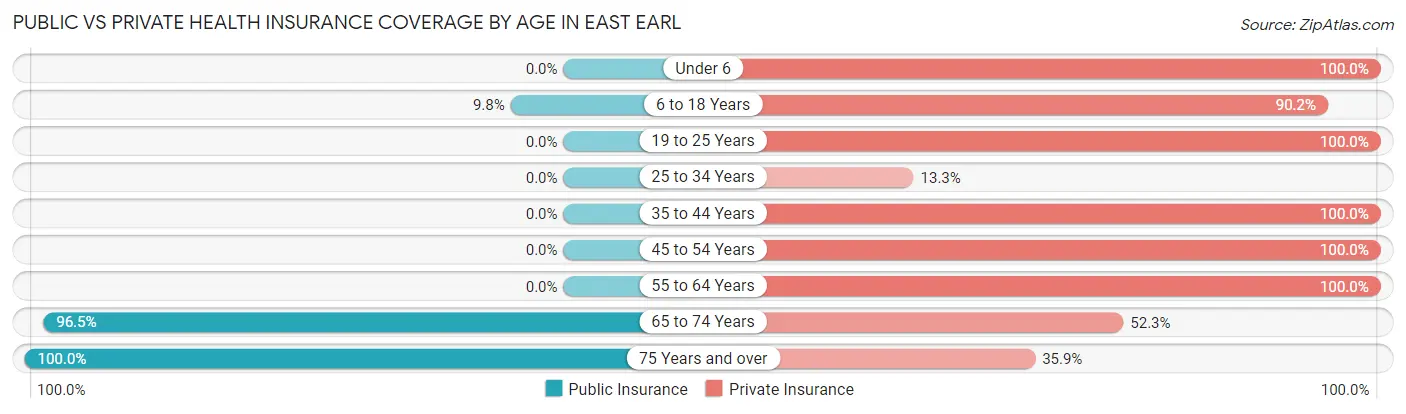
| Age Bracket | Public Insurance | Private Insurance |
| Under 6 | 0 (0.0%) | 17 (100.0%) |
| 6 to 18 Years | 20 (9.8%) | 184 (90.2%) |
| 19 to 25 Years | 0 (0.0%) | 96 (100.0%) |
| 25 to 34 Years | 0 (0.0%) | 4 (13.3%) |
| 35 to 44 Years | 0 (0.0%) | 167 (100.0%) |
| 45 to 54 Years | 0 (0.0%) | 121 (100.0%) |
| 55 to 64 Years | 0 (0.0%) | 105 (100.0%) |
| 65 to 74 Years | 277 (96.5%) | 150 (52.3%) |
| 75 Years and over | 117 (100.0%) | 42 (35.9%) |
| Total | 414 (36.2%) | 886 (77.4%) |
Disability Status by Sex by Age in East Earl
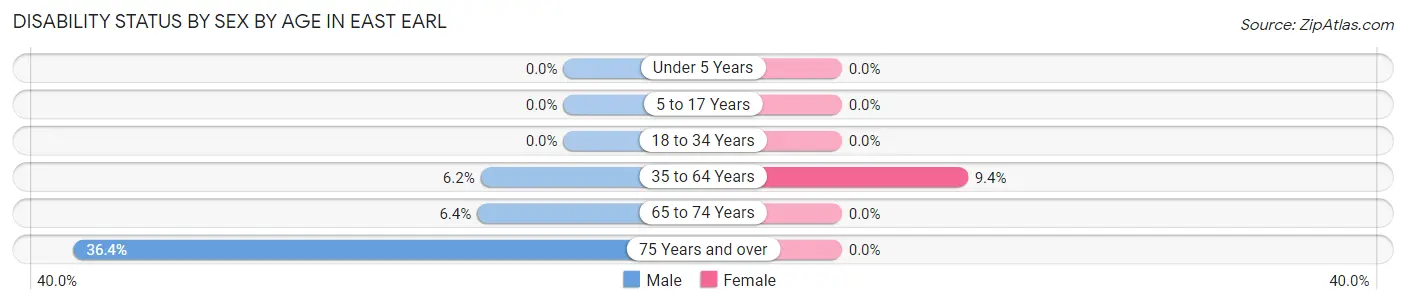
| Age Bracket | Male | Female |
| Under 5 Years | 0 (0.0%) | 0 (0.0%) |
| 5 to 17 Years | 0 (0.0%) | 0 (0.0%) |
| 18 to 34 Years | 0 (0.0%) | 0 (0.0%) |
| 35 to 64 Years | 11 (6.1%) | 20 (9.3%) |
| 65 to 74 Years | 10 (6.4%) | 0 (0.0%) |
| 75 Years and over | 28 (36.4%) | 0 (0.0%) |
Disability Class by Sex by Age in East Earl
Disability Class: Hearing Difficulty
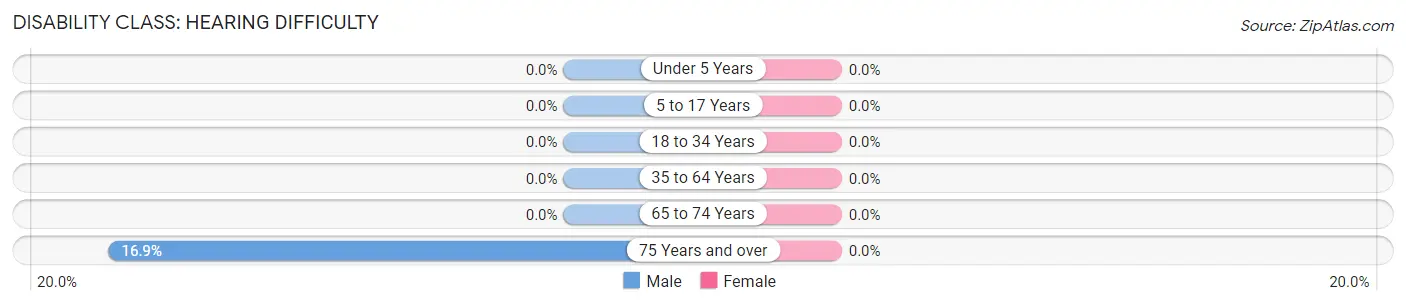
| Age Bracket | Male | Female |
| Under 5 Years | 0 (0.0%) | 0 (0.0%) |
| 5 to 17 Years | 0 (0.0%) | 0 (0.0%) |
| 18 to 34 Years | 0 (0.0%) | 0 (0.0%) |
| 35 to 64 Years | 0 (0.0%) | 0 (0.0%) |
| 65 to 74 Years | 0 (0.0%) | 0 (0.0%) |
| 75 Years and over | 13 (16.9%) | 0 (0.0%) |
Disability Class: Vision Difficulty
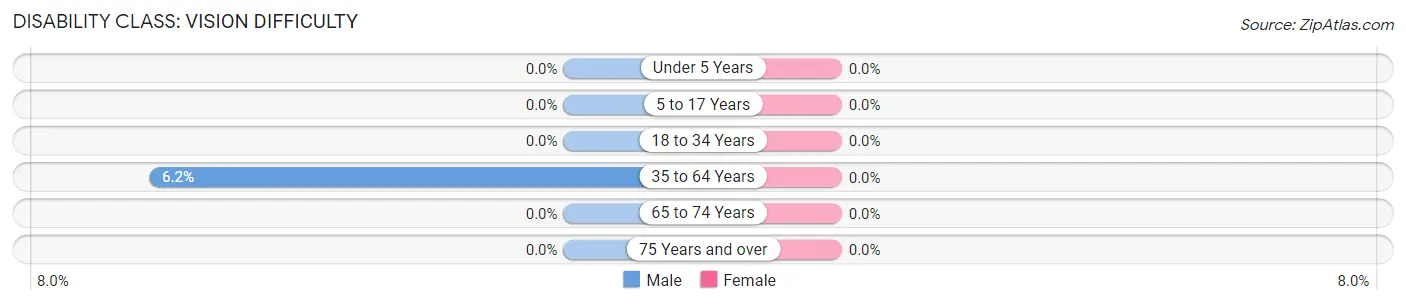
| Age Bracket | Male | Female |
| Under 5 Years | 0 (0.0%) | 0 (0.0%) |
| 5 to 17 Years | 0 (0.0%) | 0 (0.0%) |
| 18 to 34 Years | 0 (0.0%) | 0 (0.0%) |
| 35 to 64 Years | 11 (6.1%) | 0 (0.0%) |
| 65 to 74 Years | 0 (0.0%) | 0 (0.0%) |
| 75 Years and over | 0 (0.0%) | 0 (0.0%) |
Disability Class: Cognitive Difficulty
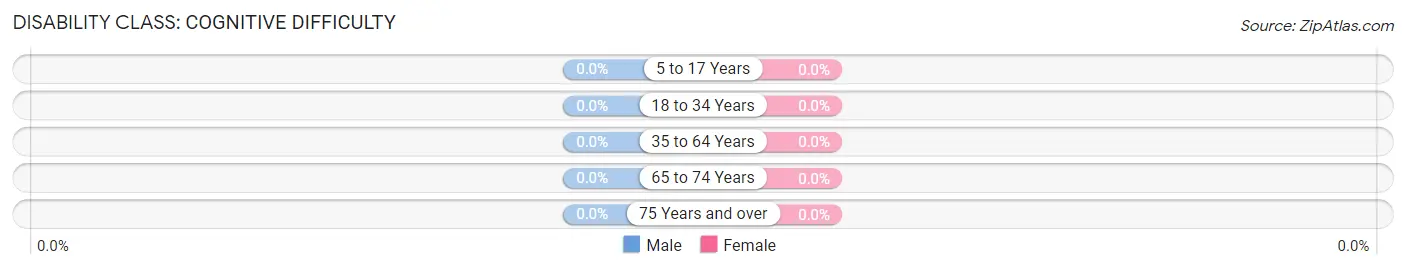
| Age Bracket | Male | Female |
| 5 to 17 Years | 0 (0.0%) | 0 (0.0%) |
| 18 to 34 Years | 0 (0.0%) | 0 (0.0%) |
| 35 to 64 Years | 0 (0.0%) | 0 (0.0%) |
| 65 to 74 Years | 0 (0.0%) | 0 (0.0%) |
| 75 Years and over | 0 (0.0%) | 0 (0.0%) |
Disability Class: Ambulatory Difficulty
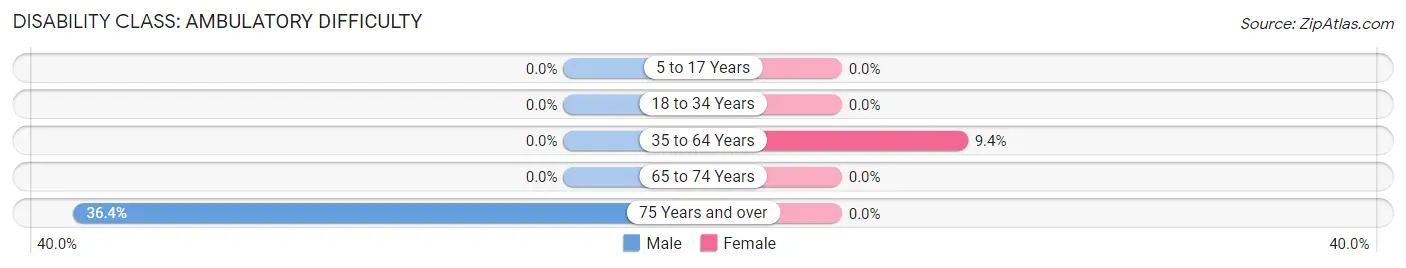
| Age Bracket | Male | Female |
| 5 to 17 Years | 0 (0.0%) | 0 (0.0%) |
| 18 to 34 Years | 0 (0.0%) | 0 (0.0%) |
| 35 to 64 Years | 0 (0.0%) | 20 (9.3%) |
| 65 to 74 Years | 0 (0.0%) | 0 (0.0%) |
| 75 Years and over | 28 (36.4%) | 0 (0.0%) |
Disability Class: Self-Care Difficulty
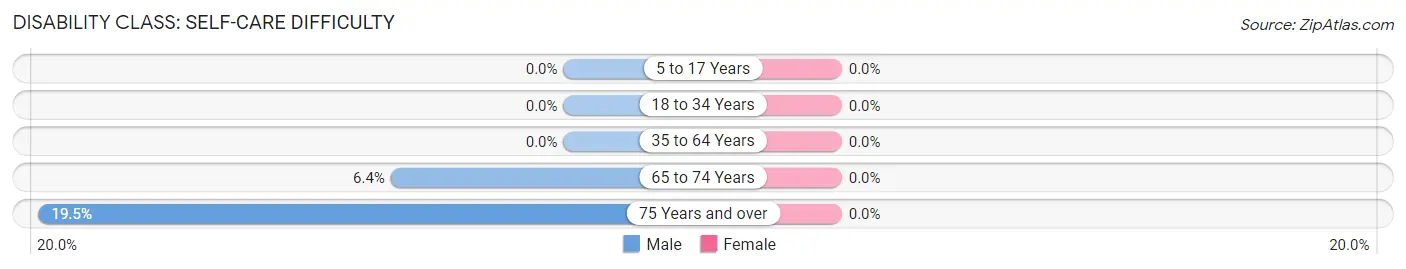
| Age Bracket | Male | Female |
| 5 to 17 Years | 0 (0.0%) | 0 (0.0%) |
| 18 to 34 Years | 0 (0.0%) | 0 (0.0%) |
| 35 to 64 Years | 0 (0.0%) | 0 (0.0%) |
| 65 to 74 Years | 10 (6.4%) | 0 (0.0%) |
| 75 Years and over | 15 (19.5%) | 0 (0.0%) |
Technology Access in East Earl
Computing Device Access in East Earl
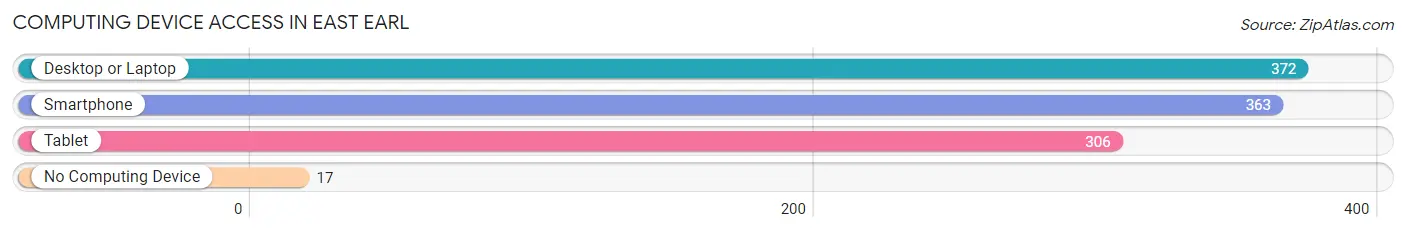
| Device Type | # Households | % Households |
| Desktop or Laptop | 372 | 94.7% |
| Smartphone | 363 | 92.4% |
| Tablet | 306 | 77.9% |
| No Computing Device | 17 | 4.3% |
| Total | 393 | 100.0% |
Internet Access in East Earl
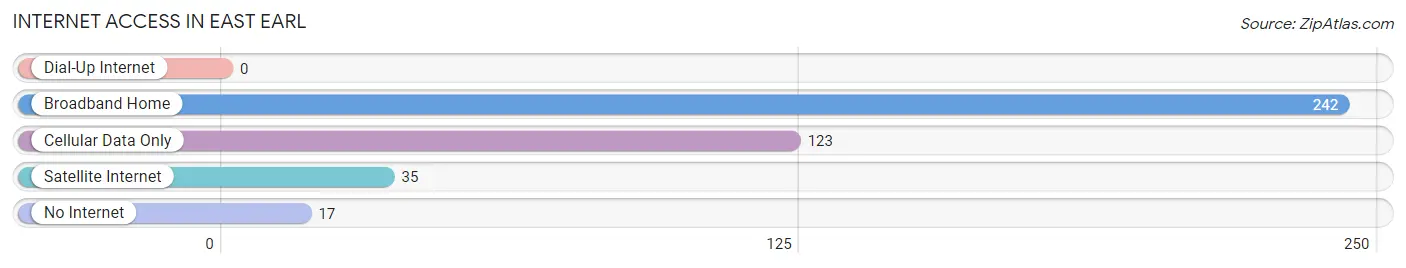
| Internet Type | # Households | % Households |
| Dial-Up Internet | 0 | 0.0% |
| Broadband Home | 242 | 61.6% |
| Cellular Data Only | 123 | 31.3% |
| Satellite Internet | 35 | 8.9% |
| No Internet | 17 | 4.3% |
| Total | 393 | 100.0% |
East Earl Summary
East Earl Township is a township located in Lancaster County, Pennsylvania. It is situated in the southeastern corner of the county, and is bordered by the townships of West Earl, Upper Leacock, and Paradise. The township is home to a population of approximately 8,000 people, and is part of the Lancaster Metropolitan Statistical Area.
History
East Earl Township was established in 1729, when it was created from a portion of the original Lancaster County. The township was named after Earl of Chester, a title held by the English monarchs from 1071 to 1232. The township was originally part of the Earl of Chester's estate, and was later divided into two parts: East Earl and West Earl.
The first settlers in East Earl Township were German immigrants, who arrived in the area in the early 1700s. The township was primarily agricultural, and the settlers were mainly farmers. The township was also home to a number of small businesses, including a grist mill, a saw mill, and a tannery.
In the late 1800s, the township began to experience a period of growth and development. The population increased, and the township became home to a number of small industries, including a brickyard, a cigar factory, and a furniture factory. The township also became home to a number of churches, schools, and other institutions.
Geography
East Earl Township is located in the southeastern corner of Lancaster County, and is bordered by the townships of West Earl, Upper Leacock, and Paradise. The township is situated in the rolling hills of the Pennsylvania Dutch Country, and is home to a number of small streams and creeks. The township is located approximately 25 miles east of the city of Lancaster, and is approximately 50 miles west of Philadelphia.
The township is home to a number of parks and recreational areas, including the East Earl Township Park, the East Earl Township Community Park, and the East Earl Township Nature Preserve. The township is also home to a number of historic sites, including the East Earl Township Historic District, the East Earl Township Historic Cemetery, and the East Earl Township Historic Schoolhouse.
Economy
East Earl Township is primarily a rural, agricultural community. The township is home to a number of small businesses, including a number of farms, a furniture factory, and a number of small retail stores. The township is also home to a number of restaurants, including the East Earl Township Diner and the East Earl Township Pizza Shop.
The township is also home to a number of manufacturing companies, including the East Earl Township Manufacturing Company, which produces a variety of products, including furniture, cabinets, and other wood products. The township is also home to a number of small technology companies, including the East Earl Township Technology Center, which provides a variety of services, including web design, software development, and computer programming.
Demographics
As of the 2010 census, East Earl Township had a population of 8,000 people. The racial makeup of the township was 95.3% White, 0.9% African American, 0.3% Native American, 0.7% Asian, 0.1% Pacific Islander, 1.2% from other races, and 1.6% from two or more races. Hispanic or Latino of any race were 3.2% of the population.
The median household income in East Earl Township was $60,000, and the median family income was $68,000. The per capita income in the township was $25,000. Approximately 8.5% of the population was below the poverty line.
East Earl Township is home to a number of churches, including the East Earl Township Church of the Brethren, the East Earl Township United Methodist Church, and the East Earl Township Lutheran Church. The township is also home to a number of schools, including the East Earl Township Elementary School, the East Earl Township Middle School, and the East Earl Township High School.
Common Questions
What is Per Capita Income in East Earl?
Per Capita income in East Earl is $40,511.
What is the Median Family Income in East Earl?
Median Family Income in East Earl is $98,734.
What is the Median Household income in East Earl?
Median Household Income in East Earl is $98,734.
What is Income or Wage Gap in East Earl?
Income or Wage Gap in East Earl is 47.8%.
Women in East Earl earn 52.2 cents for every dollar earned by a man.
What is Inequality or Gini Index in East Earl?
Inequality or Gini Index in East Earl is 0.26.
What is the Total Population of East Earl?
Total Population of East Earl is 1,144.
What is the Total Male Population of East Earl?
Total Male Population of East Earl is 607.
What is the Total Female Population of East Earl?
Total Female Population of East Earl is 537.
What is the Ratio of Males per 100 Females in East Earl?
There are 113.04 Males per 100 Females in East Earl.
What is the Ratio of Females per 100 Males in East Earl?
There are 88.47 Females per 100 Males in East Earl.
What is the Median Population Age in East Earl?
Median Population Age in East Earl is 49.4 Years.
What is the Average Family Size in East Earl
Average Family Size in East Earl is 2.9 People.
What is the Average Household Size in East Earl
Average Household Size in East Earl is 2.9 People.
How Large is the Labor Force in East Earl?
There are 683 People in the Labor Forcein in East Earl.
What is the Percentage of People in the Labor Force in East Earl?
68.4% of People are in the Labor Force in East Earl.
What is the Unemployment Rate in East Earl?
Unemployment Rate in East Earl is 4.7%.