Niland, CA Map & Demographics
Niland Map
Niland Overview
$5,472
PER CAPITA INCOME
$2,499
AVG HOUSEHOLD INCOME
0.70
INEQUALITY / GINI INDEX
602
TOTAL POPULATION
304
MALE POPULATION
298
FEMALE POPULATION
102.01
MALES / 100 FEMALES
98.03
FEMALES / 100 MALES
23.4
MEDIAN AGE
5.4
AVG FAMILY SIZE
2.1
AVG HOUSEHOLD SIZE
247
LABOR FORCE [ PEOPLE ]
71.2%
PERCENT IN LABOR FORCE
Niland Zip Codes
Niland Area Codes
Income in Niland
Income Overview in Niland
| Characteristic | Number | Measure |
| Per Capita Income | 602 | $5,472 |
| Median Family Income | 72 | $0 |
| Mean Family Income | 72 | $31,879 |
| Median Household Income | 287 | $2,499 |
| Mean Household Income | 287 | $10,917 |
| Income Deficit | 72 | $0 |
| Wage / Income Gap (%) | 602 | 0.00% |
| Wage / Income Gap ($) | 602 | 100.00¢ per $1 |
| Gini / Inequality Index | 602 | 0.70 |
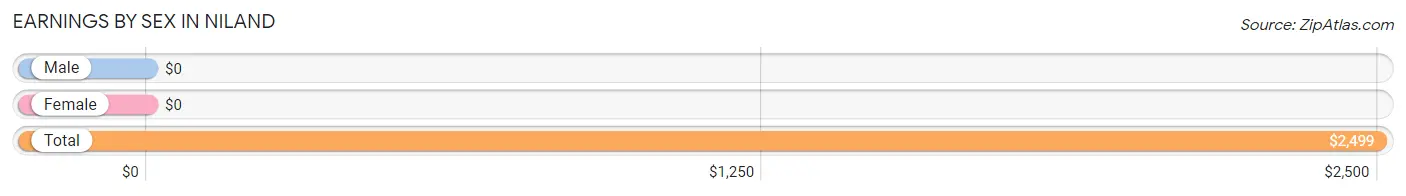
Earnings by Sex in Niland
| Sex | Number | Average Earnings |
| Male | 175 (70.9%) | $0 |
| Female | 72 (29.1%) | $0 |
| Total | 247 (100.0%) | $2,499 |
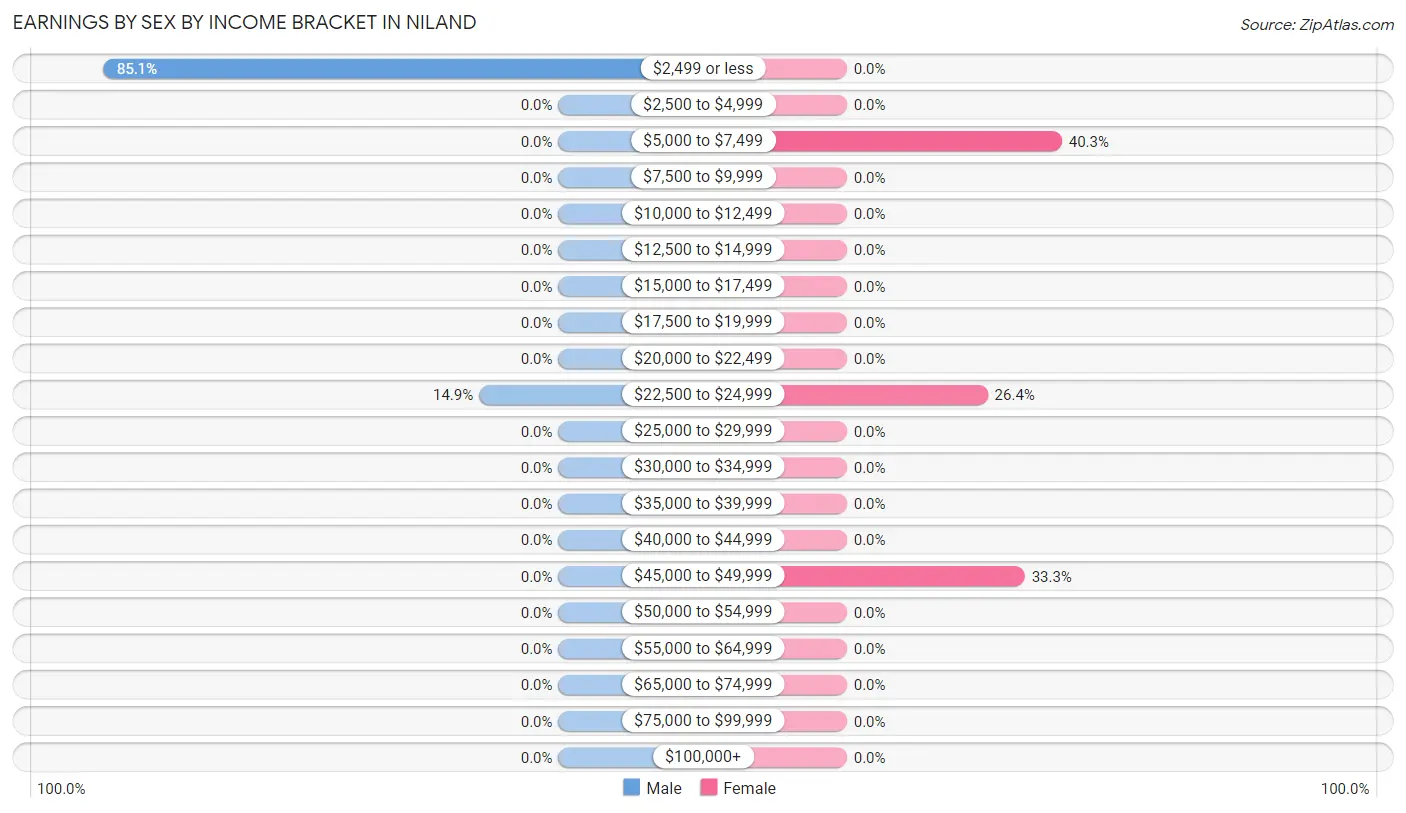
Earnings by Sex by Income Bracket in Niland
The most common earnings brackets in Niland are $2,499 or less for men (149 | 85.1%) and $5,000 to $7,499 for women (29 | 40.3%).
| Income | Male | Female |
| $2,499 or less | 149 (85.1%) | 0 (0.0%) |
| $2,500 to $4,999 | 0 (0.0%) | 0 (0.0%) |
| $5,000 to $7,499 | 0 (0.0%) | 29 (40.3%) |
| $7,500 to $9,999 | 0 (0.0%) | 0 (0.0%) |
| $10,000 to $12,499 | 0 (0.0%) | 0 (0.0%) |
| $12,500 to $14,999 | 0 (0.0%) | 0 (0.0%) |
| $15,000 to $17,499 | 0 (0.0%) | 0 (0.0%) |
| $17,500 to $19,999 | 0 (0.0%) | 0 (0.0%) |
| $20,000 to $22,499 | 0 (0.0%) | 0 (0.0%) |
| $22,500 to $24,999 | 26 (14.9%) | 19 (26.4%) |
| $25,000 to $29,999 | 0 (0.0%) | 0 (0.0%) |
| $30,000 to $34,999 | 0 (0.0%) | 0 (0.0%) |
| $35,000 to $39,999 | 0 (0.0%) | 0 (0.0%) |
| $40,000 to $44,999 | 0 (0.0%) | 0 (0.0%) |
| $45,000 to $49,999 | 0 (0.0%) | 24 (33.3%) |
| $50,000 to $54,999 | 0 (0.0%) | 0 (0.0%) |
| $55,000 to $64,999 | 0 (0.0%) | 0 (0.0%) |
| $65,000 to $74,999 | 0 (0.0%) | 0 (0.0%) |
| $75,000 to $99,999 | 0 (0.0%) | 0 (0.0%) |
| $100,000+ | 0 (0.0%) | 0 (0.0%) |
| Total | 175 (100.0%) | 72 (100.0%) |
Earnings by Sex by Educational Attainment in Niland
| Educational Attainment | Male Income | Female Income |
| Less than High School | - | - |
| High School Diploma | - | - |
| College or Associate's Degree | - | - |
| Bachelor's Degree | - | - |
| Graduate Degree | - | - |
| Total | - | - |
Family Income in Niland
Family Income Brackets in Niland
According to the Niland family income data, there are 29 families falling into the less than $10,000 income range, which is the most common income bracket and makes up 40.3% of all families.
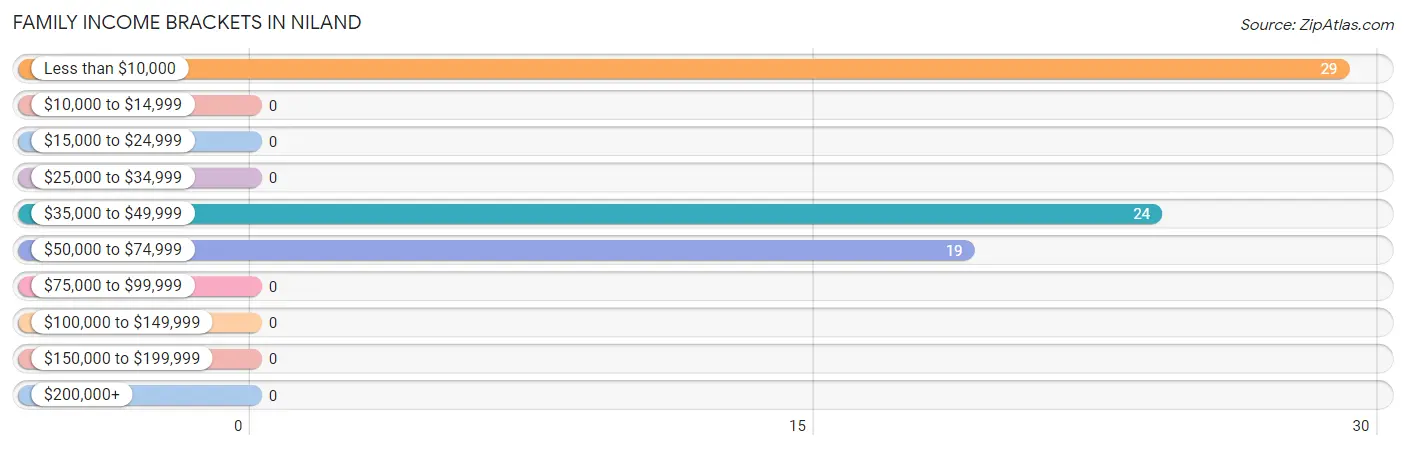
| Income Bracket | # Families | % Families |
| Less than $10,000 | 29 | 40.3% |
| $10,000 to $14,999 | 0 | 0.0% |
| $15,000 to $24,999 | 0 | 0.0% |
| $25,000 to $34,999 | 0 | 0.0% |
| $35,000 to $49,999 | 24 | 33.3% |
| $50,000 to $74,999 | 19 | 26.4% |
| $75,000 to $99,999 | 0 | 0.0% |
| $100,000 to $149,999 | 0 | 0.0% |
| $150,000 to $199,999 | 0 | 0.0% |
| $200,000+ | 0 | 0.0% |
Family Income by Famaliy Size in Niland
| Income Bracket | # Families | Median Income |
| 2-Person Families | 0 (0.0%) | $0 |
| 3-Person Families | 29 (40.3%) | $0 |
| 4-Person Families | 24 (33.3%) | $0 |
| 5-Person Families | 0 (0.0%) | $0 |
| 6-Person Families | 19 (26.4%) | $0 |
| 7+ Person Families | 0 (0.0%) | $0 |
| Total | 72 (100.0%) | $0 |
Family Income by Number of Earners in Niland
| Number of Earners | # Families | Median Income |
| No Earners | 0 (0.0%) | $0 |
| 1 Earner | 53 (73.6%) | $0 |
| 2 Earners | 19 (26.4%) | $0 |
| 3+ Earners | 0 (0.0%) | $0 |
| Total | 72 (100.0%) | $0 |
Household Income in Niland
Household Income Brackets in Niland
With 202 households falling in the category, the less than $10,000 income range is the most frequent in Niland, accounting for 70.4% of all households.
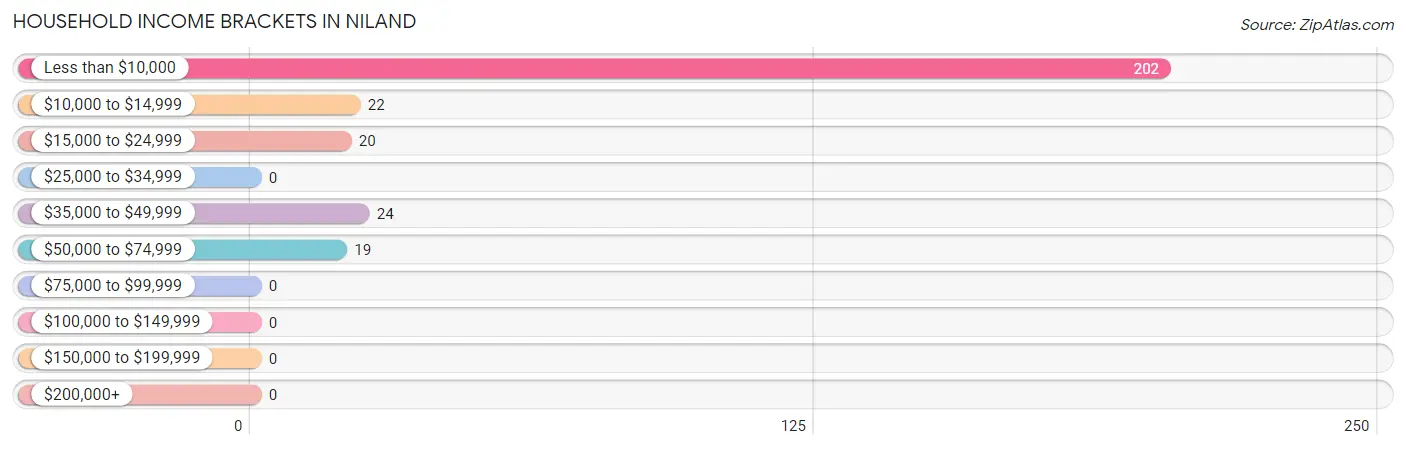
| Income Bracket | # Households | % Households |
| Less than $10,000 | 202 | 70.4% |
| $10,000 to $14,999 | 22 | 7.7% |
| $15,000 to $24,999 | 20 | 7.0% |
| $25,000 to $34,999 | 0 | 0.0% |
| $35,000 to $49,999 | 24 | 8.4% |
| $50,000 to $74,999 | 19 | 6.6% |
| $75,000 to $99,999 | 0 | 0.0% |
| $100,000 to $149,999 | 0 | 0.0% |
| $150,000 to $199,999 | 0 | 0.0% |
| $200,000+ | 0 | 0.0% |
Household Income by Householder Age in Niland
The median household income in Niland is $2,499, with the highest median household income of $11,023 found in the 65+ years age bracket for the primary householder. A total of 66 households (23.0%) fall into this category. Meanwhile, the 15 to 24 years age bracket for the primary householder has the lowest median household income of $0, with 29 households (10.1%) in this group.
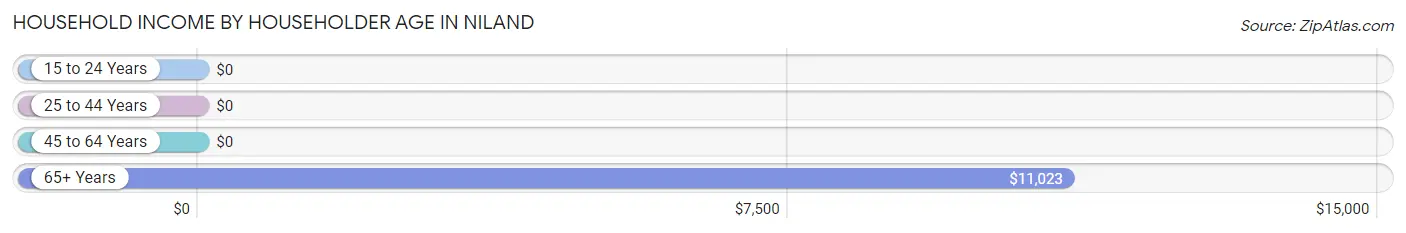
| Income Bracket | # Households | Median Income |
| 15 to 24 Years | 29 (10.1%) | $0 |
| 25 to 44 Years | 19 (6.6%) | $0 |
| 45 to 64 Years | 173 (60.3%) | $0 |
| 65+ Years | 66 (23.0%) | $11,023 |
| Total | 287 (100.0%) | $2,499 |
Poverty in Niland
Income Below Poverty by Sex and Age in Niland
With 61.2% poverty level for males and 39.3% for females among the residents of Niland, under 5 year old males and 18 to 24 year old females are the most vulnerable to poverty, with 37 males (100.0%) and 29 females (100.0%) in their respective age groups living below the poverty level.
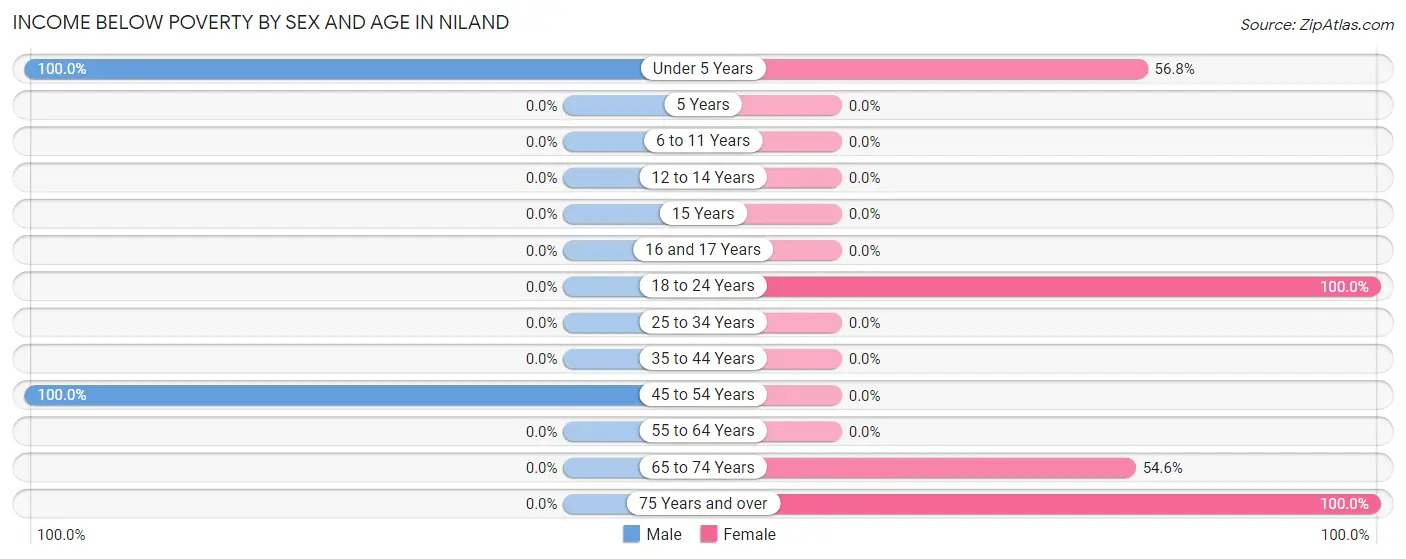
| Age Bracket | Male | Female |
| Under 5 Years | 37 (100.0%) | 42 (56.8%) |
| 5 Years | 0 (0.0%) | 0 (0.0%) |
| 6 to 11 Years | 0 (0.0%) | 0 (0.0%) |
| 12 to 14 Years | 0 (0.0%) | 0 (0.0%) |
| 15 Years | 0 (0.0%) | 0 (0.0%) |
| 16 and 17 Years | 0 (0.0%) | 0 (0.0%) |
| 18 to 24 Years | 0 (0.0%) | 29 (100.0%) |
| 25 to 34 Years | 0 (0.0%) | 0 (0.0%) |
| 35 to 44 Years | 0 (0.0%) | 0 (0.0%) |
| 45 to 54 Years | 149 (100.0%) | 0 (0.0%) |
| 55 to 64 Years | 0 (0.0%) | 0 (0.0%) |
| 65 to 74 Years | 0 (0.0%) | 24 (54.5%) |
| 75 Years and over | 0 (0.0%) | 22 (100.0%) |
| Total | 186 (61.2%) | 117 (39.3%) |
Income Above Poverty by Sex and Age in Niland
According to the poverty statistics in Niland, males aged 6 to 11 years and females aged 6 to 11 years are the age groups that are most secure financially, with 100.0% of males and 100.0% of females in these age groups living above the poverty line.
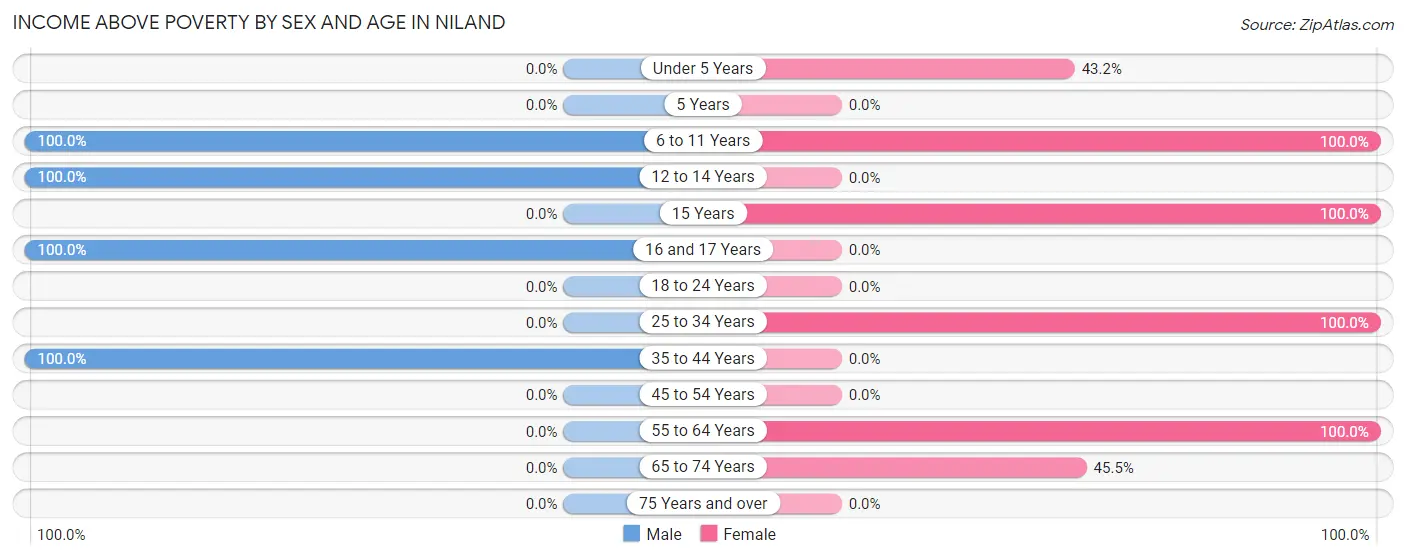
| Age Bracket | Male | Female |
| Under 5 Years | 0 (0.0%) | 32 (43.2%) |
| 5 Years | 0 (0.0%) | 0 (0.0%) |
| 6 to 11 Years | 24 (100.0%) | 52 (100.0%) |
| 12 to 14 Years | 34 (100.0%) | 0 (0.0%) |
| 15 Years | 0 (0.0%) | 34 (100.0%) |
| 16 and 17 Years | 34 (100.0%) | 0 (0.0%) |
| 18 to 24 Years | 0 (0.0%) | 0 (0.0%) |
| 25 to 34 Years | 0 (0.0%) | 19 (100.0%) |
| 35 to 44 Years | 26 (100.0%) | 0 (0.0%) |
| 45 to 54 Years | 0 (0.0%) | 0 (0.0%) |
| 55 to 64 Years | 0 (0.0%) | 24 (100.0%) |
| 65 to 74 Years | 0 (0.0%) | 20 (45.5%) |
| 75 Years and over | 0 (0.0%) | 0 (0.0%) |
| Total | 118 (38.8%) | 181 (60.7%) |
Income Below Poverty Among Married-Couple Families in Niland
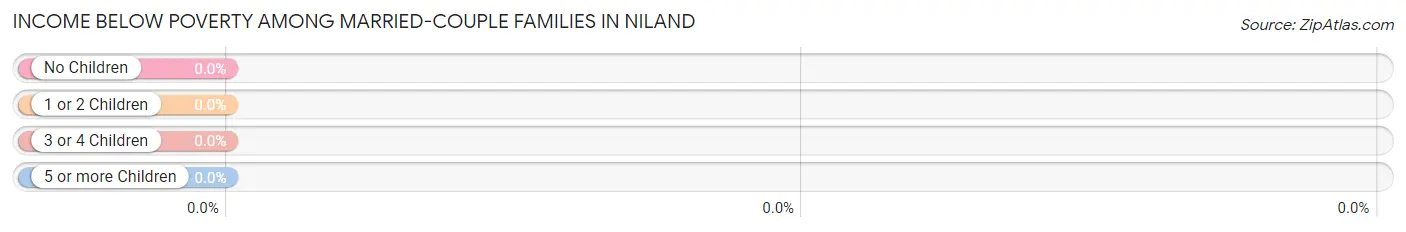
| Children | Above Poverty | Below Poverty |
| No Children | 0 (0.0%) | 0 (0.0%) |
| 1 or 2 Children | 0 (0.0%) | 0 (0.0%) |
| 3 or 4 Children | 19 (100.0%) | 0 (0.0%) |
| 5 or more Children | 0 (0.0%) | 0 (0.0%) |
| Total | 19 (100.0%) | 0 (0.0%) |
Income Below Poverty Among Single-Parent Households in Niland
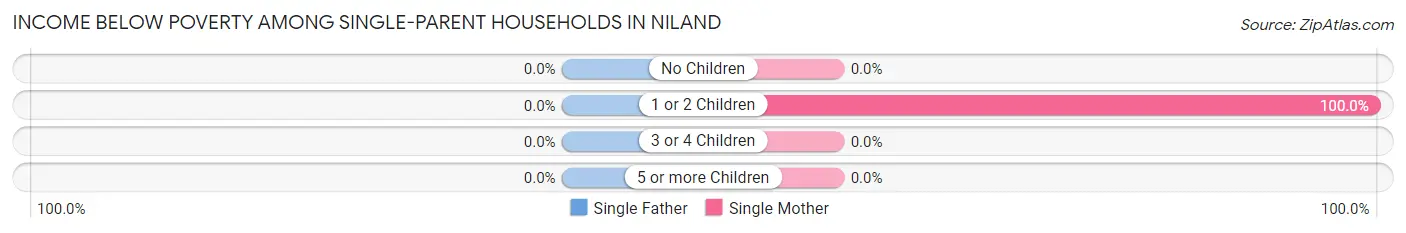
| Children | Single Father | Single Mother |
| No Children | 0 (0.0%) | 0 (0.0%) |
| 1 or 2 Children | 0 (0.0%) | 29 (100.0%) |
| 3 or 4 Children | 0 (0.0%) | 0 (0.0%) |
| 5 or more Children | 0 (0.0%) | 0 (0.0%) |
| Total | 0 (0.0%) | 29 (54.7%) |
Income Below Poverty Among Married-Couple vs Single-Parent Households in Niland
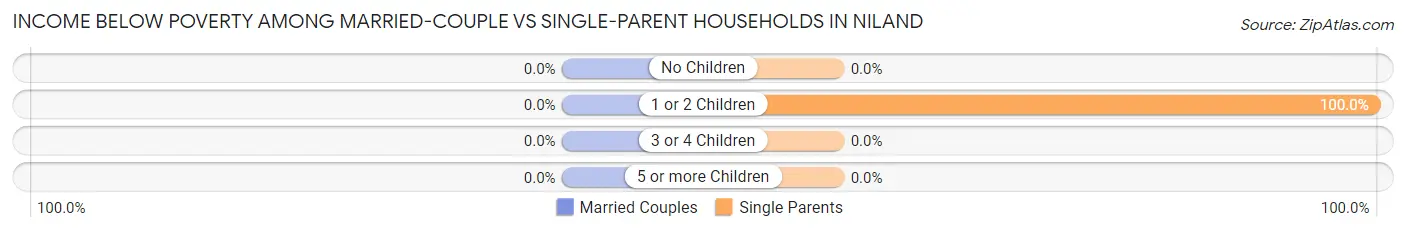
| Children | Married-Couple Families | Single-Parent Households |
| No Children | 0 (0.0%) | 0 (0.0%) |
| 1 or 2 Children | 0 (0.0%) | 29 (100.0%) |
| 3 or 4 Children | 0 (0.0%) | 0 (0.0%) |
| 5 or more Children | 0 (0.0%) | 0 (0.0%) |
| Total | 0 (0.0%) | 29 (54.7%) |
Race in Niland
The most populous races in Niland are Hispanic or Latino (404 | 67.1%), White / Caucasian (276 | 45.9%), and Black / African American (178 | 29.6%).
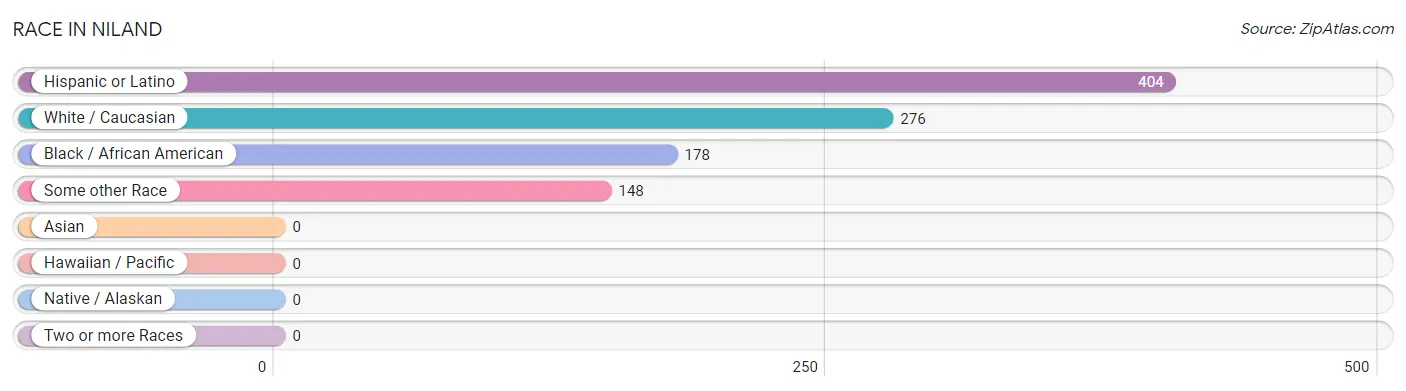
| Race | # Population | % Population |
| Asian | 0 | 0.0% |
| Black / African American | 178 | 29.6% |
| Hawaiian / Pacific | 0 | 0.0% |
| Hispanic or Latino | 404 | 67.1% |
| Native / Alaskan | 0 | 0.0% |
| White / Caucasian | 276 | 45.9% |
| Two or more Races | 0 | 0.0% |
| Some other Race | 148 | 24.6% |
| Total | 602 | 100.0% |
Ancestry in Niland
The most populous ancestries reported in Niland are Mexican (404 | 67.1%), French (24 | 4.0%), and German (20 | 3.3%), together accounting for 74.4% of all Niland residents.
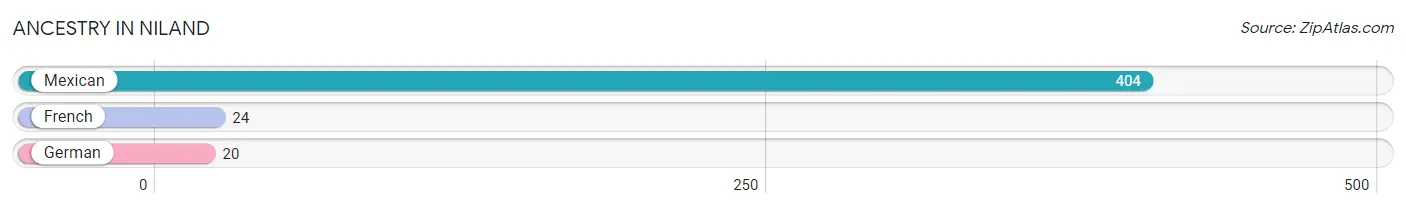
| Ancestry | # Population | % Population |
| French | 24 | 4.0% |
| German | 20 | 3.3% |
| Mexican | 404 | 67.1% | View All 3 Rows |
Immigrants in Niland
The most numerous immigrant groups reported in Niland came from Central America (115 | 19.1%), Latin America (115 | 19.1%), and Mexico (115 | 19.1%), together accounting for 57.3% of all Niland residents.
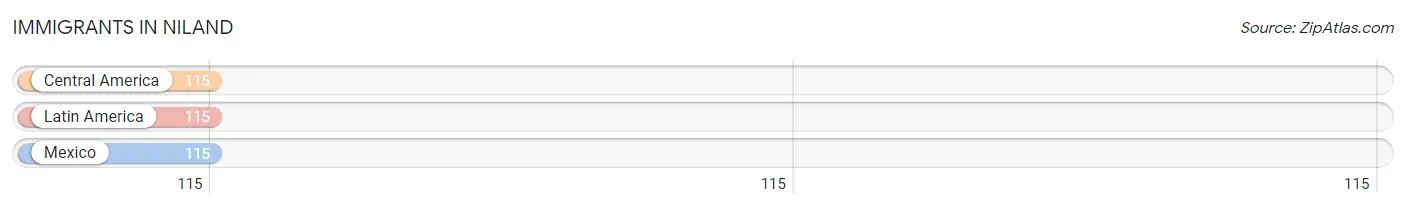
| Immigration Origin | # Population | % Population |
| Central America | 115 | 19.1% |
| Latin America | 115 | 19.1% |
| Mexico | 115 | 19.1% | View All 3 Rows |
Sex and Age in Niland
Sex and Age in Niland
The most populous age groups in Niland are 50 to 54 Years (149 | 49.0%) for men and Under 5 Years (74 | 24.8%) for women.
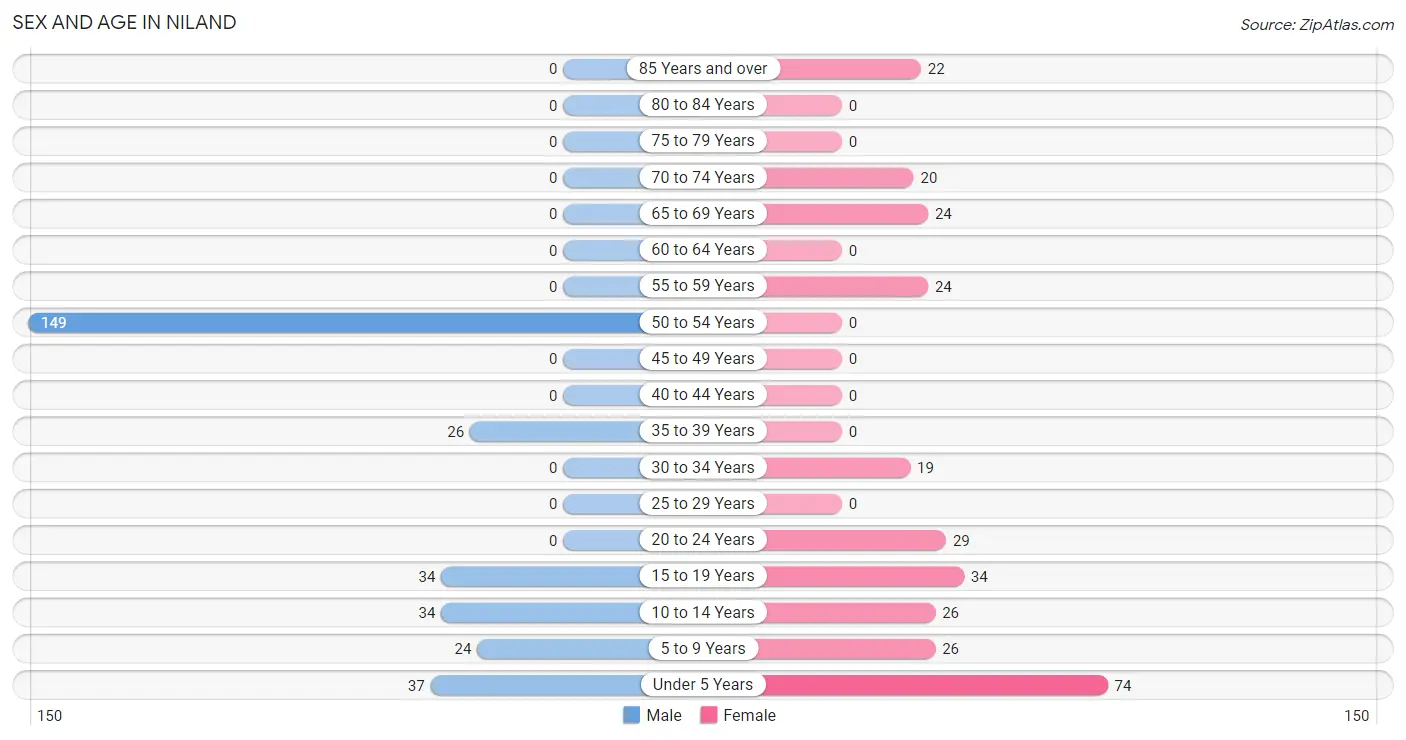
| Age Bracket | Male | Female |
| Under 5 Years | 37 (12.2%) | 74 (24.8%) |
| 5 to 9 Years | 24 (7.9%) | 26 (8.7%) |
| 10 to 14 Years | 34 (11.2%) | 26 (8.7%) |
| 15 to 19 Years | 34 (11.2%) | 34 (11.4%) |
| 20 to 24 Years | 0 (0.0%) | 29 (9.7%) |
| 25 to 29 Years | 0 (0.0%) | 0 (0.0%) |
| 30 to 34 Years | 0 (0.0%) | 19 (6.4%) |
| 35 to 39 Years | 26 (8.6%) | 0 (0.0%) |
| 40 to 44 Years | 0 (0.0%) | 0 (0.0%) |
| 45 to 49 Years | 0 (0.0%) | 0 (0.0%) |
| 50 to 54 Years | 149 (49.0%) | 0 (0.0%) |
| 55 to 59 Years | 0 (0.0%) | 24 (8.1%) |
| 60 to 64 Years | 0 (0.0%) | 0 (0.0%) |
| 65 to 69 Years | 0 (0.0%) | 24 (8.1%) |
| 70 to 74 Years | 0 (0.0%) | 20 (6.7%) |
| 75 to 79 Years | 0 (0.0%) | 0 (0.0%) |
| 80 to 84 Years | 0 (0.0%) | 0 (0.0%) |
| 85 Years and over | 0 (0.0%) | 22 (7.4%) |
| Total | 304 (100.0%) | 298 (100.0%) |
Families and Households in Niland
Median Family Size in Niland
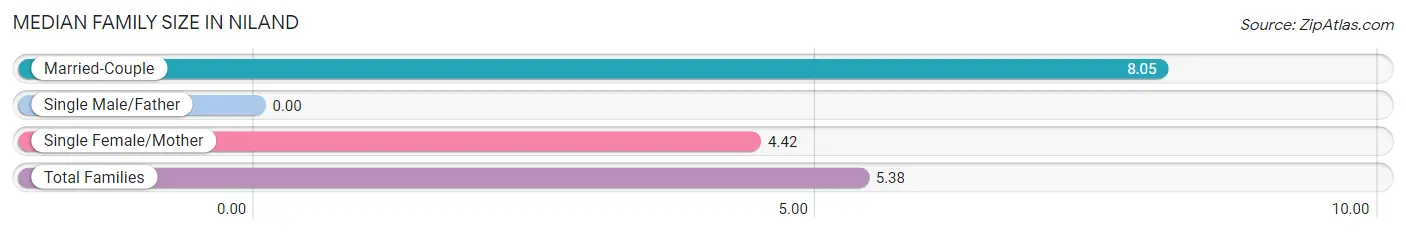
| Family Type | # Families | Family Size |
| Married-Couple | 19 (26.4%) | 8.05 |
| Single Male/Father | 0 (0.0%) | - |
| Single Female/Mother | 53 (73.6%) | 4.42 |
| Total Families | 72 (100.0%) | 5.38 |
Median Household Size in Niland
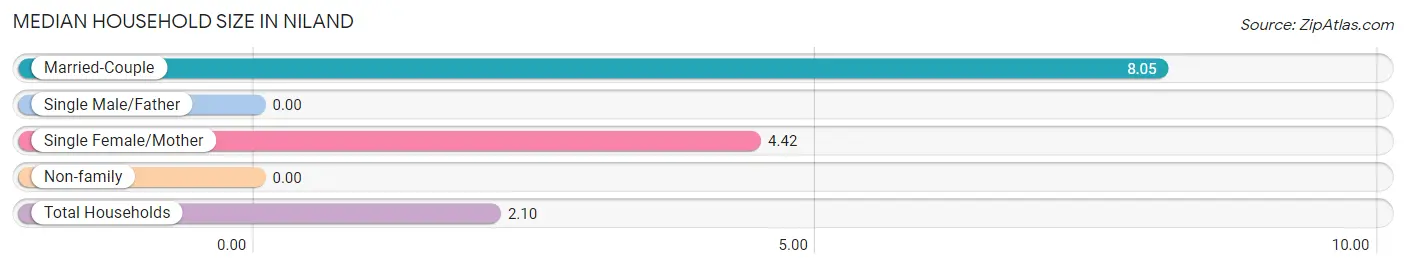
| Household Type | # Households | Household Size |
| Married-Couple | 19 (6.6%) | 8.05 |
| Single Male/Father | 0 (0.0%) | - |
| Single Female/Mother | 53 (18.5%) | 4.42 |
| Non-family | 215 (74.9%) | - |
| Total Households | 287 (100.0%) | 2.10 |
Household Size by Marriage Status in Niland
Out of a total of 287 households in Niland, 72 (25.1%) are family households, while 215 (74.9%) are nonfamily households. The most numerous type of family households are 3-person households, comprising 29, and the most common type of nonfamily households are 1-person households, comprising 215.
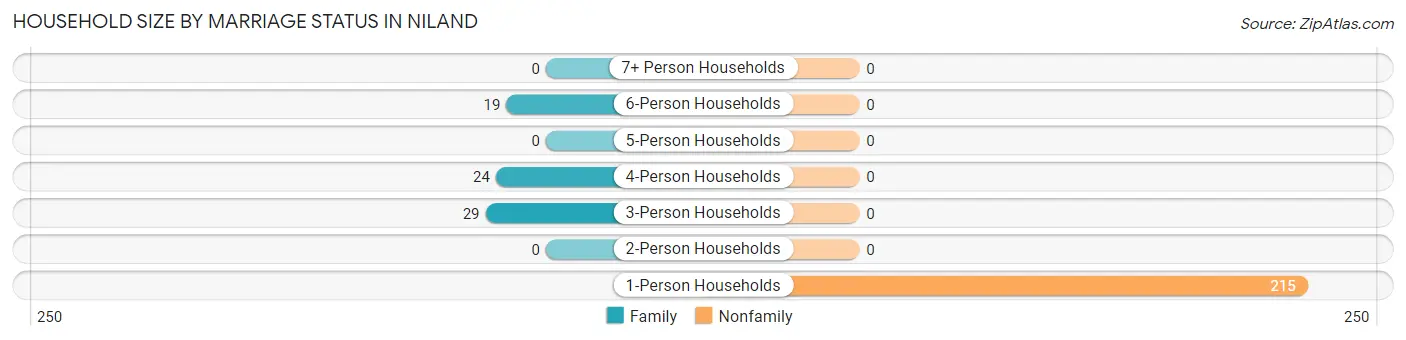
| Household Size | Family Households | Nonfamily Households |
| 1-Person Households | - | 215 (74.9%) |
| 2-Person Households | 0 (0.0%) | 0 (0.0%) |
| 3-Person Households | 29 (10.1%) | 0 (0.0%) |
| 4-Person Households | 24 (8.4%) | 0 (0.0%) |
| 5-Person Households | 0 (0.0%) | 0 (0.0%) |
| 6-Person Households | 19 (6.6%) | 0 (0.0%) |
| 7+ Person Households | 0 (0.0%) | 0 (0.0%) |
| Total | 72 (25.1%) | 215 (74.9%) |
Female Fertility in Niland
Fertility by Age in Niland
| Age Bracket | Women with Births | Births / 1,000 Women |
| 15 to 19 years | 0 (0.0%) | 0.0 |
| 20 to 34 years | 0 (0.0%) | 0.0 |
| 35 to 50 years | 0 (0.0%) | 0.0 |
| Total | 0 (0.0%) | 0.0 |
Fertility by Age by Marriage Status in Niland
| Age Bracket | Married | Unmarried |
| 15 to 19 years | 0 (0.0%) | 0 (0.0%) |
| 20 to 34 years | 0 (0.0%) | 0 (0.0%) |
| 35 to 50 years | 0 (0.0%) | 0 (0.0%) |
| Total | 0 (0.0%) | 0 (0.0%) |
Fertility by Education in Niland
| Educational Attainment | Women with Births | Births / 1,000 Women |
| Less than High School | 0 (0.0%) | 0.0 |
| High School Diploma | 0 (0.0%) | 0.0 |
| College or Associate's Degree | 0 (0.0%) | 0.0 |
| Bachelor's Degree | 0 (0.0%) | 0.0 |
| Graduate Degree | 0 (0.0%) | 0.0 |
| Total | 0 (0.0%) | 0.0 |
Fertility by Education by Marriage Status in Niland
| Educational Attainment | Married | Unmarried |
| Less than High School | 0 (0.0%) | 0 (0.0%) |
| High School Diploma | 0 (0.0%) | 0 (0.0%) |
| College or Associate's Degree | 0 (0.0%) | 0 (0.0%) |
| Bachelor's Degree | 0 (0.0%) | 0 (0.0%) |
| Graduate Degree | 0 (0.0%) | 0 (0.0%) |
| Total | 0 (0.0%) | 0 (0.0%) |
Employment Characteristics in Niland
Employment by Class of Employer in Niland
Among the 247 employed individuals in Niland, self-employed (not incorporated) (149 | 60.3%), private company employees (69 | 27.9%), and local government employees (29 | 11.7%) make up the most common classes of employment.
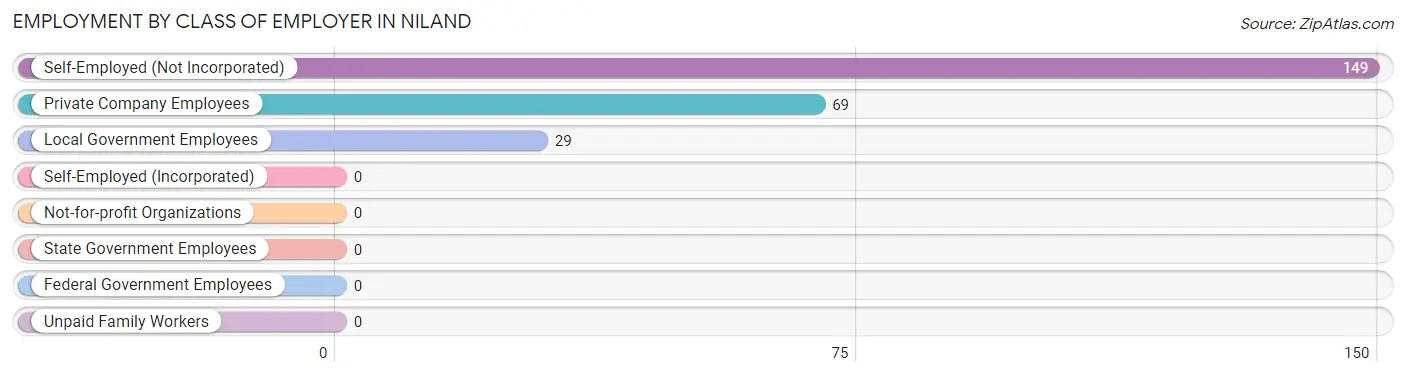
| Employer Class | # Employees | % Employees |
| Private Company Employees | 69 | 27.9% |
| Self-Employed (Incorporated) | 0 | 0.0% |
| Self-Employed (Not Incorporated) | 149 | 60.3% |
| Not-for-profit Organizations | 0 | 0.0% |
| Local Government Employees | 29 | 11.7% |
| State Government Employees | 0 | 0.0% |
| Federal Government Employees | 0 | 0.0% |
| Unpaid Family Workers | 0 | 0.0% |
| Total | 247 | 100.0% |
Employment Status by Age in Niland
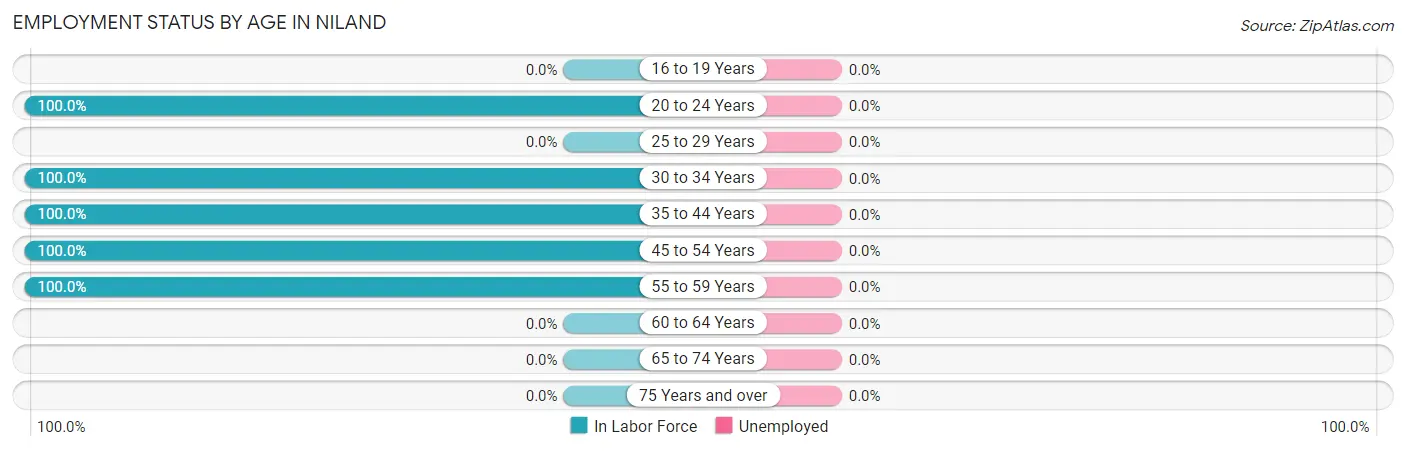
| Age Bracket | In Labor Force | Unemployed |
| 16 to 19 Years | 0 (0.0%) | 0 (0.0%) |
| 20 to 24 Years | 29 (100.0%) | 0 (0.0%) |
| 25 to 29 Years | 0 (0.0%) | 0 (0.0%) |
| 30 to 34 Years | 19 (100.0%) | 0 (0.0%) |
| 35 to 44 Years | 26 (100.0%) | 0 (0.0%) |
| 45 to 54 Years | 149 (100.0%) | 0 (0.0%) |
| 55 to 59 Years | 24 (100.0%) | 0 (0.0%) |
| 60 to 64 Years | 0 (0.0%) | 0 (0.0%) |
| 65 to 74 Years | 0 (0.0%) | 0 (0.0%) |
| 75 Years and over | 0 (0.0%) | 0 (0.0%) |
| Total | 247 (71.2%) | 0 (0.0%) |
Employment Status by Educational Attainment in Niland
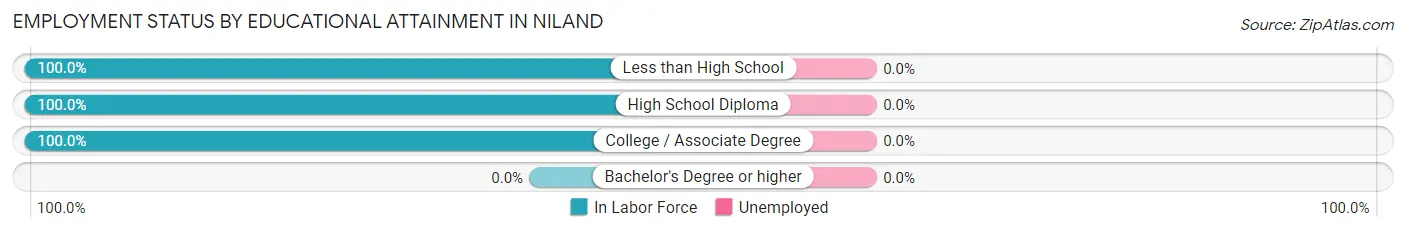
| Educational Attainment | In Labor Force | Unemployed |
| Less than High School | 45 (100.0%) | 0 (0.0%) |
| High School Diploma | 24 (100.0%) | 0 (0.0%) |
| College / Associate Degree | 149 (100.0%) | 0 (0.0%) |
| Bachelor's Degree or higher | 0 (0.0%) | 0 (0.0%) |
| Total | 218 (100.0%) | 0 (0.0%) |
Employment Occupations by Sex in Niland
Management, Business, Science and Arts Occupations
Management, Business, Science and Arts Occupations by Sex
| Occupation | Male | Female |
| Management | 0 (0.0%) | 0 (0.0%) |
| Business & Financial | 0 (0.0%) | 0 (0.0%) |
| Computers, Engineering & Science | 0 (0.0%) | 0 (0.0%) |
| Computers & Mathematics | 0 (0.0%) | 0 (0.0%) |
| Architecture & Engineering | 0 (0.0%) | 0 (0.0%) |
| Life, Physical & Social Science | 0 (0.0%) | 0 (0.0%) |
| Community & Social Service | 0 (0.0%) | 0 (0.0%) |
| Education, Arts & Media | 0 (0.0%) | 0 (0.0%) |
| Legal Services & Support | 0 (0.0%) | 0 (0.0%) |
| Education Instruction & Library | 0 (0.0%) | 0 (0.0%) |
| Arts, Media & Entertainment | 0 (0.0%) | 0 (0.0%) |
| Health Diagnosing & Treating | 0 (0.0%) | 0 (0.0%) |
| Health Technologists | 0 (0.0%) | 0 (0.0%) |
| Total (Category) | 0 (0.0%) | 0 (0.0%) |
| Total (Overall) | 175 (70.9%) | 72 (29.1%) |
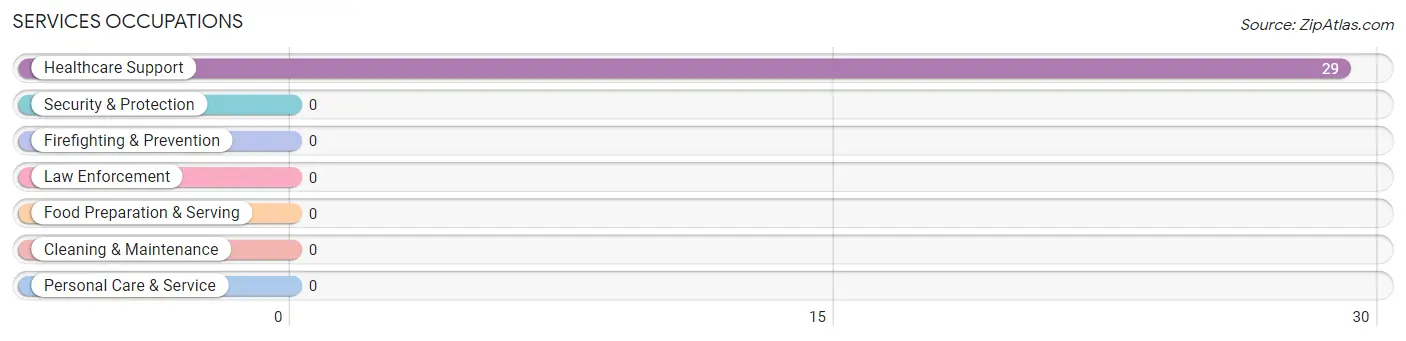
Services Occupations
The most common Services occupations in Niland are , and Healthcare Support (29 | 11.7%).
Services Occupations by Sex
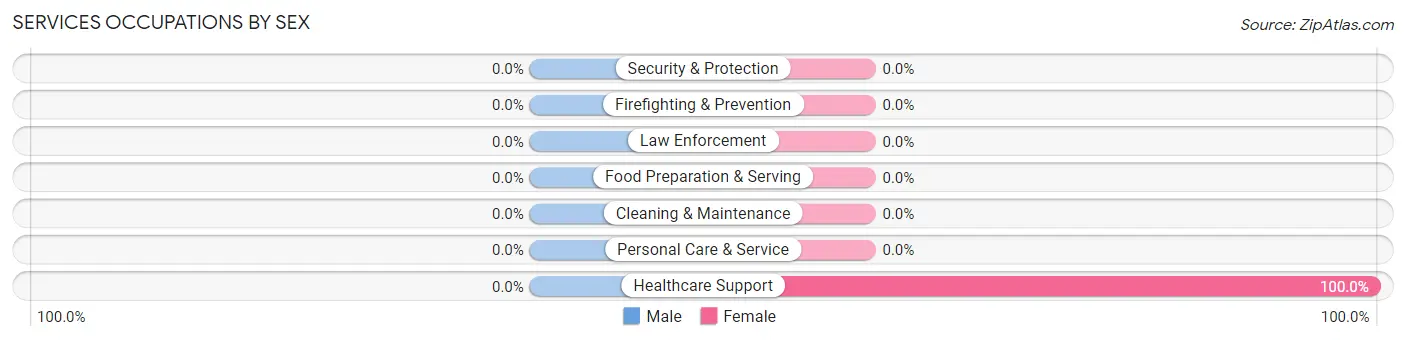
| Occupation | Male | Female |
| Healthcare Support | 0 (0.0%) | 29 (100.0%) |
| Security & Protection | 0 (0.0%) | 0 (0.0%) |
| Firefighting & Prevention | 0 (0.0%) | 0 (0.0%) |
| Law Enforcement | 0 (0.0%) | 0 (0.0%) |
| Food Preparation & Serving | 0 (0.0%) | 0 (0.0%) |
| Cleaning & Maintenance | 0 (0.0%) | 0 (0.0%) |
| Personal Care & Service | 0 (0.0%) | 0 (0.0%) |
| Total (Category) | 0 (0.0%) | 29 (100.0%) |
| Total (Overall) | 175 (70.9%) | 72 (29.1%) |
Sales and Office Occupations
The most common Sales and Office occupations in Niland are , and Office & Administration (24 | 9.7%).
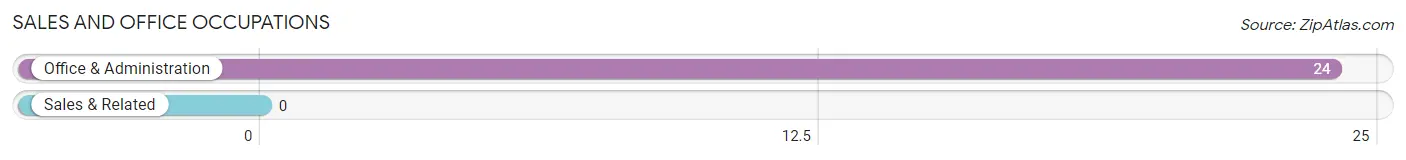
Sales and Office Occupations by Sex
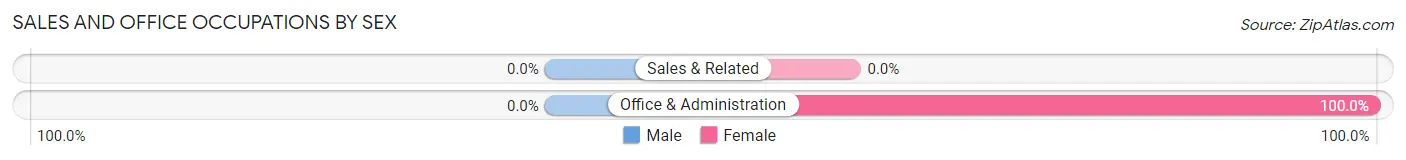
| Occupation | Male | Female |
| Sales & Related | 0 (0.0%) | 0 (0.0%) |
| Office & Administration | 0 (0.0%) | 24 (100.0%) |
| Total (Category) | 0 (0.0%) | 24 (100.0%) |
| Total (Overall) | 175 (70.9%) | 72 (29.1%) |
Natural Resources, Construction and Maintenance Occupations
The most common Natural Resources, Construction and Maintenance occupations in Niland are Construction & Extraction (149 | 60.3%), and Farming, Fishing & Forestry (45 | 18.2%).
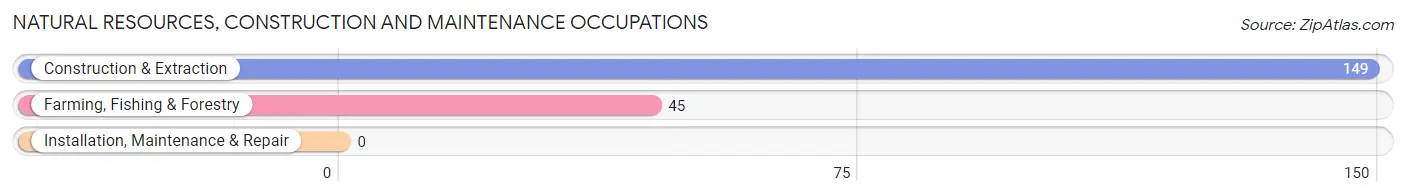
Natural Resources, Construction and Maintenance Occupations by Sex
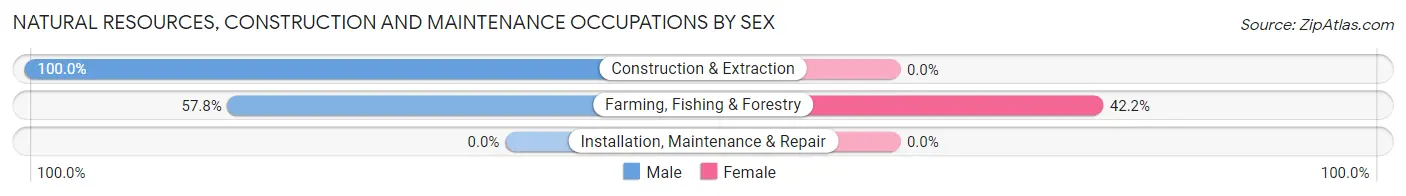
| Occupation | Male | Female |
| Farming, Fishing & Forestry | 26 (57.8%) | 19 (42.2%) |
| Construction & Extraction | 149 (100.0%) | 0 (0.0%) |
| Installation, Maintenance & Repair | 0 (0.0%) | 0 (0.0%) |
| Total (Category) | 175 (90.2%) | 19 (9.8%) |
| Total (Overall) | 175 (70.9%) | 72 (29.1%) |
Production, Transportation and Moving Occupations
Production, Transportation and Moving Occupations by Sex
| Occupation | Male | Female |
| Production | 0 (0.0%) | 0 (0.0%) |
| Transportation | 0 (0.0%) | 0 (0.0%) |
| Material Moving | 0 (0.0%) | 0 (0.0%) |
| Total (Category) | 0 (0.0%) | 0 (0.0%) |
| Total (Overall) | 175 (70.9%) | 72 (29.1%) |
Employment Industries by Sex in Niland
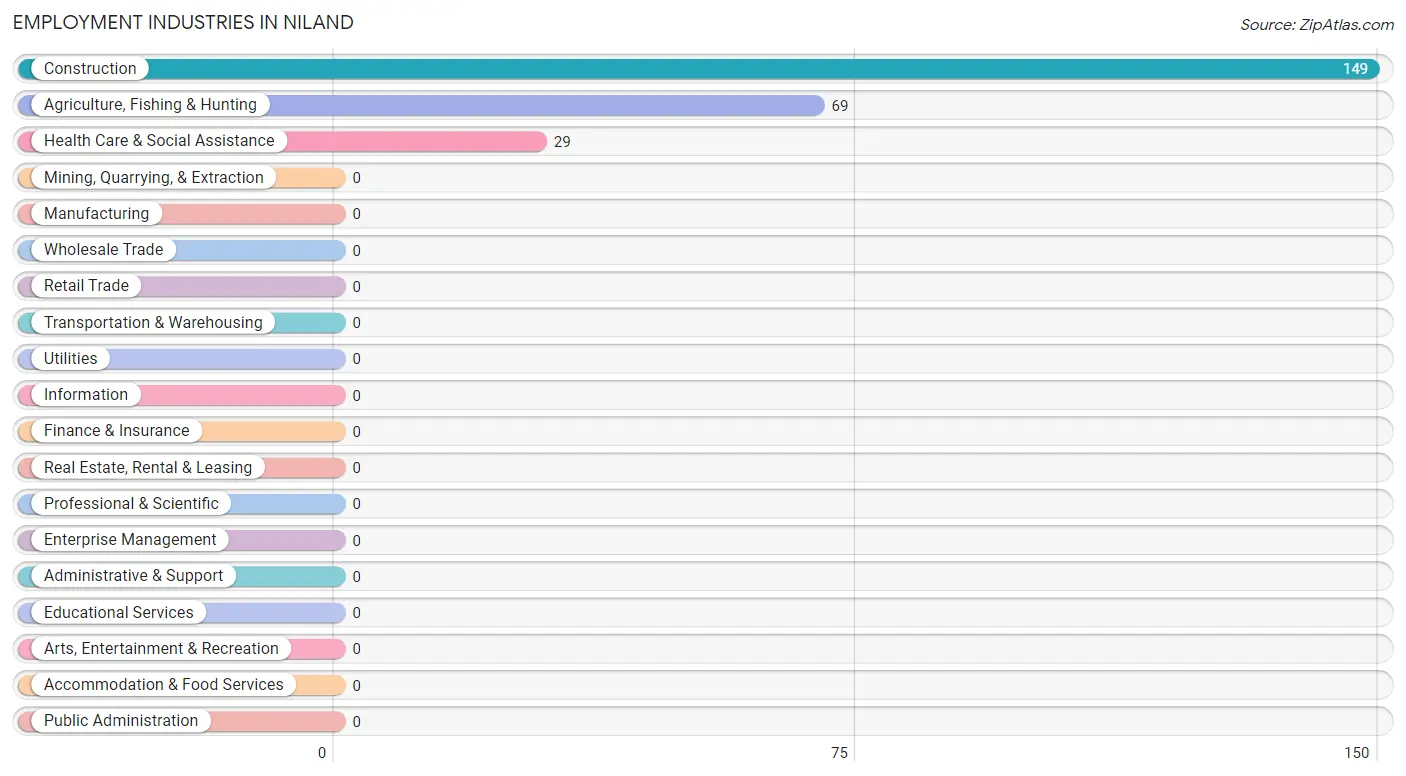
Employment Industries in Niland
The major employment industries in Niland include Construction (149 | 60.3%), Agriculture, Fishing & Hunting (69 | 27.9%), and Health Care & Social Assistance (29 | 11.7%).
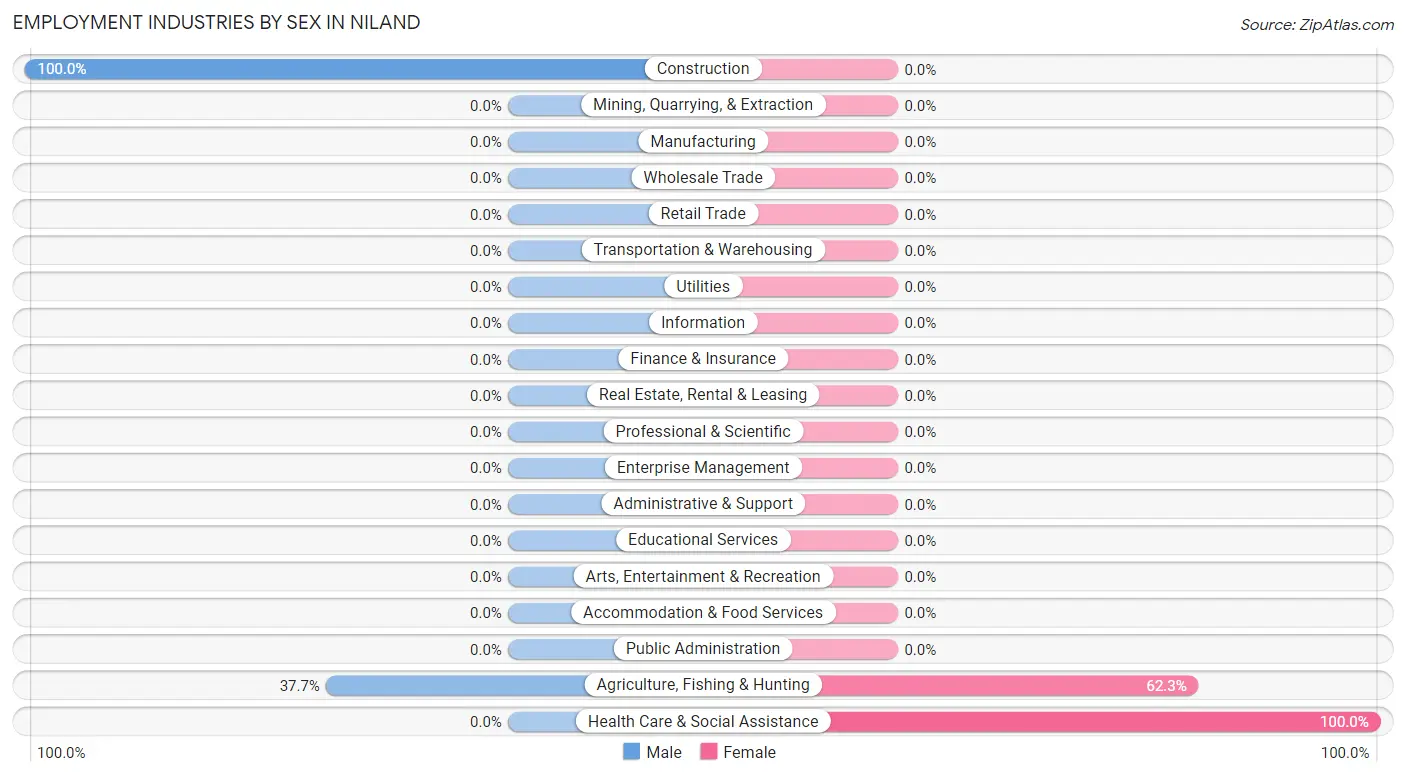
Employment Industries by Sex in Niland
The Niland industries that see more men than women are Construction (100.0%), and Agriculture, Fishing & Hunting (37.7%), whereas the industries that tend to have a higher number of women are Health Care & Social Assistance (100.0%), and Agriculture, Fishing & Hunting (62.3%).
| Industry | Male | Female |
| Agriculture, Fishing & Hunting | 26 (37.7%) | 43 (62.3%) |
| Mining, Quarrying, & Extraction | 0 (0.0%) | 0 (0.0%) |
| Construction | 149 (100.0%) | 0 (0.0%) |
| Manufacturing | 0 (0.0%) | 0 (0.0%) |
| Wholesale Trade | 0 (0.0%) | 0 (0.0%) |
| Retail Trade | 0 (0.0%) | 0 (0.0%) |
| Transportation & Warehousing | 0 (0.0%) | 0 (0.0%) |
| Utilities | 0 (0.0%) | 0 (0.0%) |
| Information | 0 (0.0%) | 0 (0.0%) |
| Finance & Insurance | 0 (0.0%) | 0 (0.0%) |
| Real Estate, Rental & Leasing | 0 (0.0%) | 0 (0.0%) |
| Professional & Scientific | 0 (0.0%) | 0 (0.0%) |
| Enterprise Management | 0 (0.0%) | 0 (0.0%) |
| Administrative & Support | 0 (0.0%) | 0 (0.0%) |
| Educational Services | 0 (0.0%) | 0 (0.0%) |
| Health Care & Social Assistance | 0 (0.0%) | 29 (100.0%) |
| Arts, Entertainment & Recreation | 0 (0.0%) | 0 (0.0%) |
| Accommodation & Food Services | 0 (0.0%) | 0 (0.0%) |
| Public Administration | 0 (0.0%) | 0 (0.0%) |
| Total | 175 (70.9%) | 72 (29.1%) |
Education in Niland
School Enrollment in Niland
The most common levels of schooling among the 178 students in Niland are high school (68 | 38.2%), middle school (60 | 33.7%), and elementary school (26 | 14.6%).
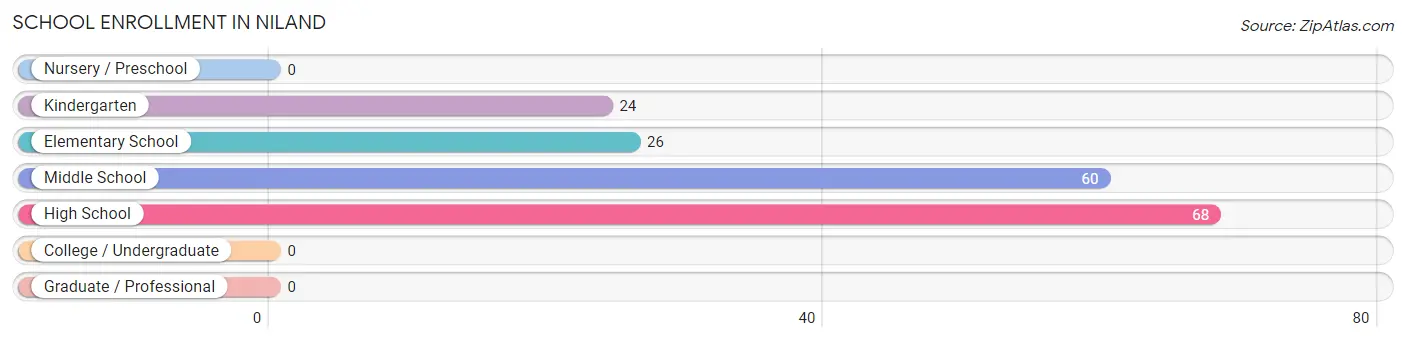
| School Level | # Students | % Students |
| Nursery / Preschool | 0 | 0.0% |
| Kindergarten | 24 | 13.5% |
| Elementary School | 26 | 14.6% |
| Middle School | 60 | 33.7% |
| High School | 68 | 38.2% |
| College / Undergraduate | 0 | 0.0% |
| Graduate / Professional | 0 | 0.0% |
| Total | 178 | 100.0% |
School Enrollment by Age by Funding Source in Niland
Out of a total of 178 students who are enrolled in schools in Niland, 34 (19.1%) attend a private institution, while the remaining 144 (80.9%) are enrolled in public schools. The age group of 10 to 14 year olds has the highest likelihood of being enrolled in private schools, with 34 (56.7% in the age bracket) enrolled. Conversely, the age group of 5 to 9 year old has the lowest likelihood of being enrolled in a private school, with 50 (100.0% in the age bracket) attending a public institution.
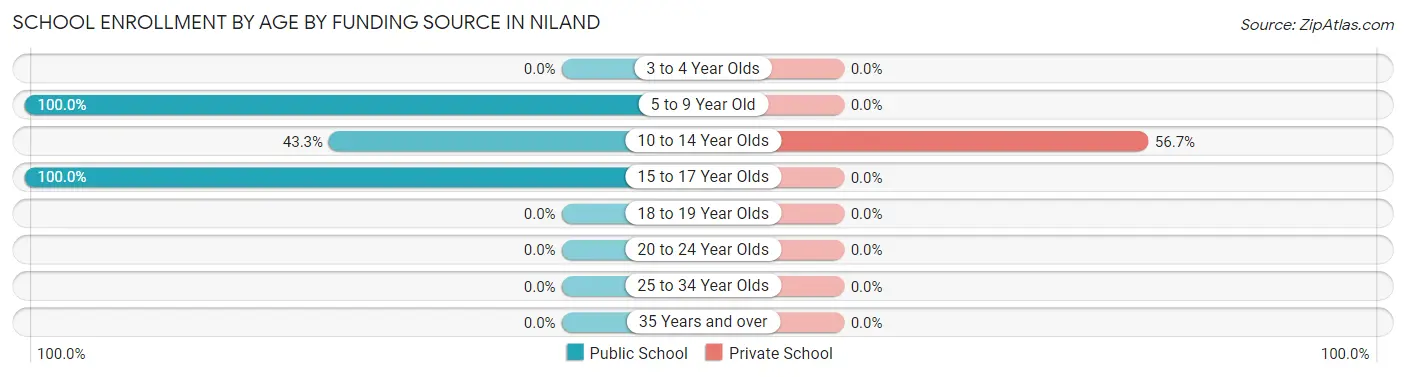
| Age Bracket | Public School | Private School |
| 3 to 4 Year Olds | 0 (0.0%) | 0 (0.0%) |
| 5 to 9 Year Old | 50 (100.0%) | 0 (0.0%) |
| 10 to 14 Year Olds | 26 (43.3%) | 34 (56.7%) |
| 15 to 17 Year Olds | 68 (100.0%) | 0 (0.0%) |
| 18 to 19 Year Olds | 0 (0.0%) | 0 (0.0%) |
| 20 to 24 Year Olds | 0 (0.0%) | 0 (0.0%) |
| 25 to 34 Year Olds | 0 (0.0%) | 0 (0.0%) |
| 35 Years and over | 0 (0.0%) | 0 (0.0%) |
| Total | 144 (80.9%) | 34 (19.1%) |
Educational Attainment by Field of Study in Niland
| Field of Study | # Graduates | % Graduates |
| Computers & Mathematics | 0 | 0.0% |
| Bio, Nature & Agricultural | 0 | 0.0% |
| Physical & Health Sciences | 0 | 0.0% |
| Psychology | 0 | 0.0% |
| Social Sciences | 0 | 0.0% |
| Engineering | 0 | 0.0% |
| Multidisciplinary Studies | 0 | 0.0% |
| Science & Technology | 0 | 0.0% |
| Business | 0 | 0.0% |
| Education | 0 | 0.0% |
| Literature & Languages | 0 | 0.0% |
| Liberal Arts & History | 0 | 0.0% |
| Visual & Performing Arts | 0 | 0.0% |
| Communications | 0 | 0.0% |
| Arts & Humanities | 0 | 0.0% |
| Total | 0 | 0.0% |
Transportation & Commute in Niland
Vehicle Availability by Sex in Niland
The most prevalent vehicle ownership categories in Niland are males with 1 vehicle (149, accounting for 85.1%) and females with 1 vehicle (29, making up 206.9%).
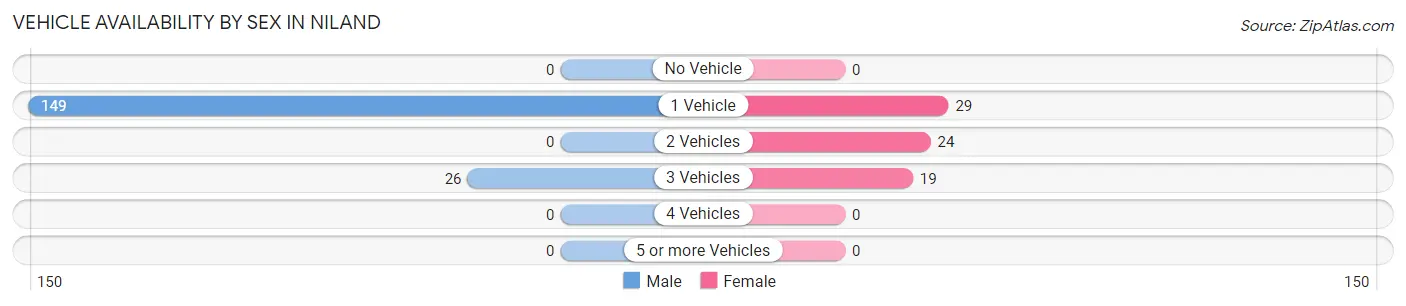
| Vehicles Available | Male | Female |
| No Vehicle | 0 (0.0%) | 0 (0.0%) |
| 1 Vehicle | 149 (85.1%) | 29 (40.3%) |
| 2 Vehicles | 0 (0.0%) | 24 (33.3%) |
| 3 Vehicles | 26 (14.9%) | 19 (26.4%) |
| 4 Vehicles | 0 (0.0%) | 0 (0.0%) |
| 5 or more Vehicles | 0 (0.0%) | 0 (0.0%) |
| Total | 175 (100.0%) | 72 (100.0%) |
Commute Time in Niland
The most frequently occuring commute durations in Niland are 5 to 9 minutes (149 commuters, 60.3%), 30 to 34 minutes (45 commuters, 18.2%), and 10 to 14 minutes (29 commuters, 11.7%).
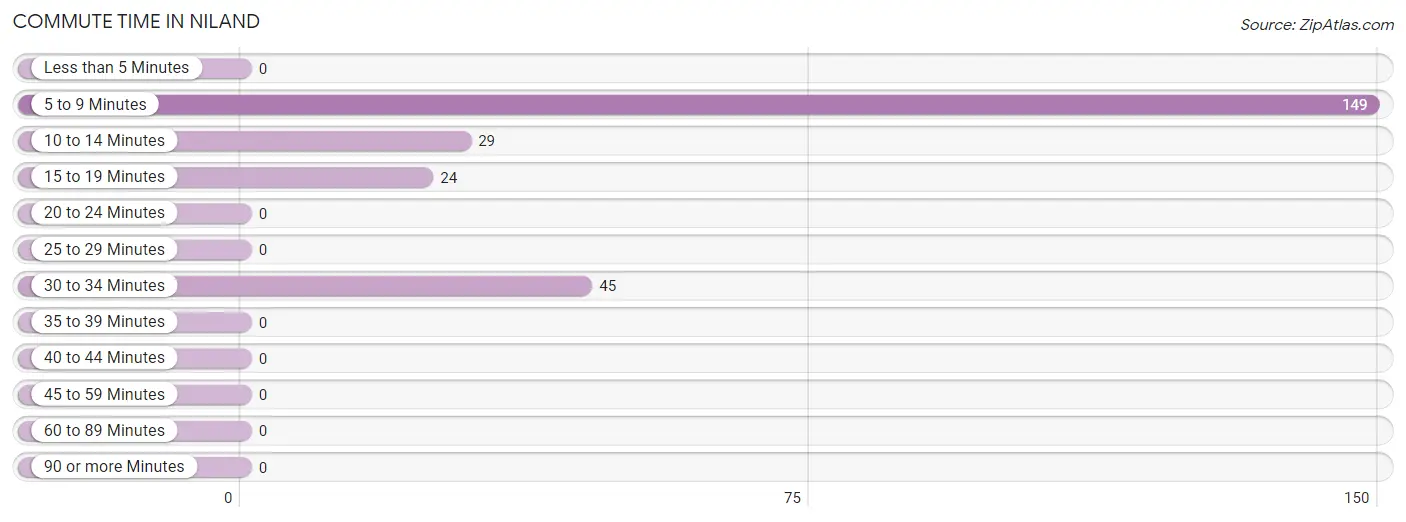
| Commute Time | # Commuters | % Commuters |
| Less than 5 Minutes | 0 | 0.0% |
| 5 to 9 Minutes | 149 | 60.3% |
| 10 to 14 Minutes | 29 | 11.7% |
| 15 to 19 Minutes | 24 | 9.7% |
| 20 to 24 Minutes | 0 | 0.0% |
| 25 to 29 Minutes | 0 | 0.0% |
| 30 to 34 Minutes | 45 | 18.2% |
| 35 to 39 Minutes | 0 | 0.0% |
| 40 to 44 Minutes | 0 | 0.0% |
| 45 to 59 Minutes | 0 | 0.0% |
| 60 to 89 Minutes | 0 | 0.0% |
| 90 or more Minutes | 0 | 0.0% |
Commute Time by Sex in Niland
The most common commute times in Niland are 5 to 9 minutes (149 commuters, 85.1%) for males and 10 to 14 minutes (29 commuters, 40.3%) for females.
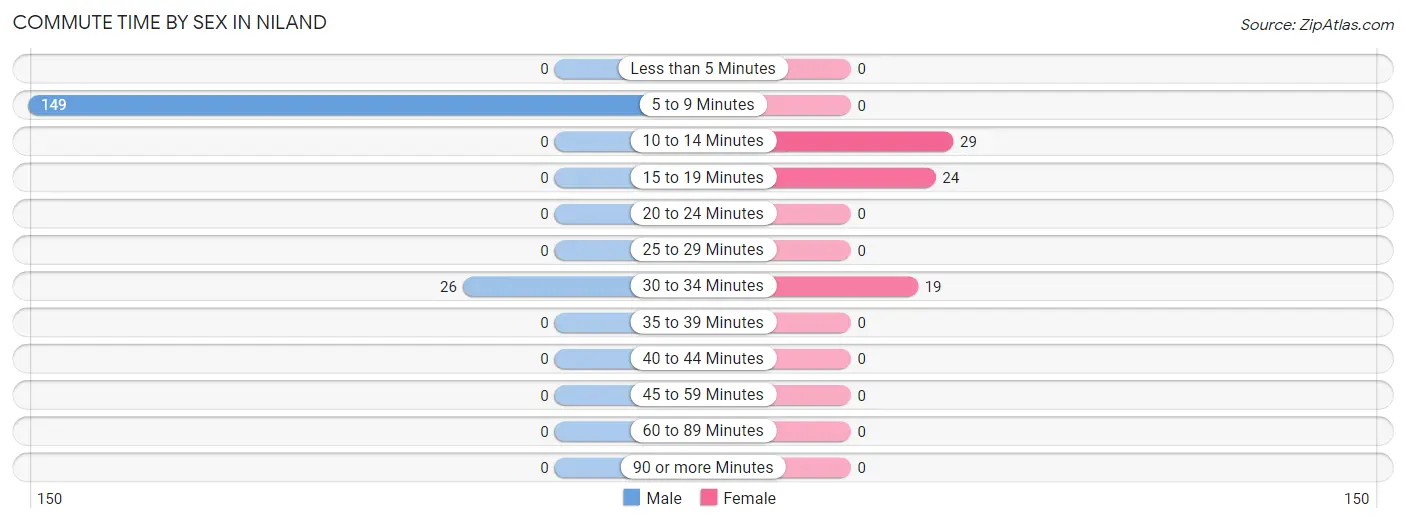
| Commute Time | Male | Female |
| Less than 5 Minutes | 0 (0.0%) | 0 (0.0%) |
| 5 to 9 Minutes | 149 (85.1%) | 0 (0.0%) |
| 10 to 14 Minutes | 0 (0.0%) | 29 (40.3%) |
| 15 to 19 Minutes | 0 (0.0%) | 24 (33.3%) |
| 20 to 24 Minutes | 0 (0.0%) | 0 (0.0%) |
| 25 to 29 Minutes | 0 (0.0%) | 0 (0.0%) |
| 30 to 34 Minutes | 26 (14.9%) | 19 (26.4%) |
| 35 to 39 Minutes | 0 (0.0%) | 0 (0.0%) |
| 40 to 44 Minutes | 0 (0.0%) | 0 (0.0%) |
| 45 to 59 Minutes | 0 (0.0%) | 0 (0.0%) |
| 60 to 89 Minutes | 0 (0.0%) | 0 (0.0%) |
| 90 or more Minutes | 0 (0.0%) | 0 (0.0%) |
Time of Departure to Work by Sex in Niland
The most frequent times of departure to work in Niland are 7:30 AM to 7:59 AM (149, 85.1%) for males and 7:30 AM to 7:59 AM (29, 40.3%) for females.
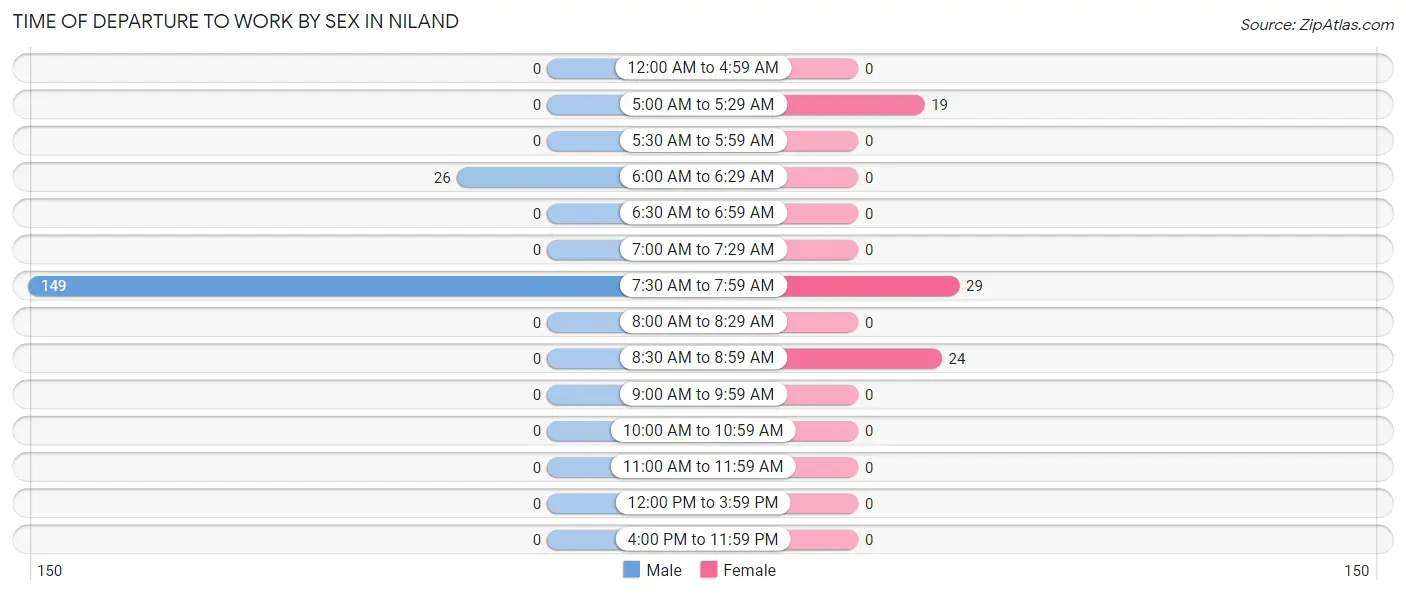
| Time of Departure | Male | Female |
| 12:00 AM to 4:59 AM | 0 (0.0%) | 0 (0.0%) |
| 5:00 AM to 5:29 AM | 0 (0.0%) | 19 (26.4%) |
| 5:30 AM to 5:59 AM | 0 (0.0%) | 0 (0.0%) |
| 6:00 AM to 6:29 AM | 26 (14.9%) | 0 (0.0%) |
| 6:30 AM to 6:59 AM | 0 (0.0%) | 0 (0.0%) |
| 7:00 AM to 7:29 AM | 0 (0.0%) | 0 (0.0%) |
| 7:30 AM to 7:59 AM | 149 (85.1%) | 29 (40.3%) |
| 8:00 AM to 8:29 AM | 0 (0.0%) | 0 (0.0%) |
| 8:30 AM to 8:59 AM | 0 (0.0%) | 24 (33.3%) |
| 9:00 AM to 9:59 AM | 0 (0.0%) | 0 (0.0%) |
| 10:00 AM to 10:59 AM | 0 (0.0%) | 0 (0.0%) |
| 11:00 AM to 11:59 AM | 0 (0.0%) | 0 (0.0%) |
| 12:00 PM to 3:59 PM | 0 (0.0%) | 0 (0.0%) |
| 4:00 PM to 11:59 PM | 0 (0.0%) | 0 (0.0%) |
| Total | 175 (100.0%) | 72 (100.0%) |
Housing Occupancy in Niland
Occupancy by Ownership in Niland
Of the total 287 dwellings in Niland, owner-occupied units account for 85 (29.6%), while renter-occupied units make up 202 (70.4%).
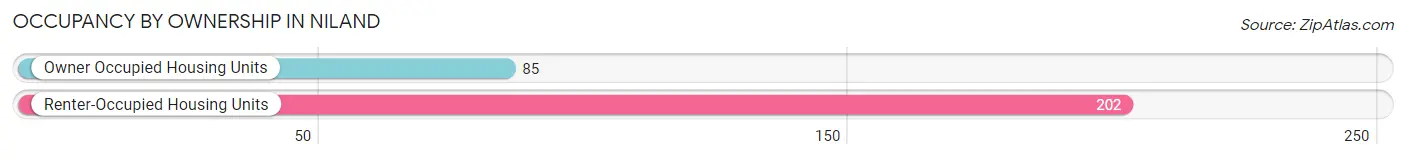
| Occupancy | # Housing Units | % Housing Units |
| Owner Occupied Housing Units | 85 | 29.6% |
| Renter-Occupied Housing Units | 202 | 70.4% |
| Total Occupied Housing Units | 287 | 100.0% |
Occupancy by Household Size in Niland
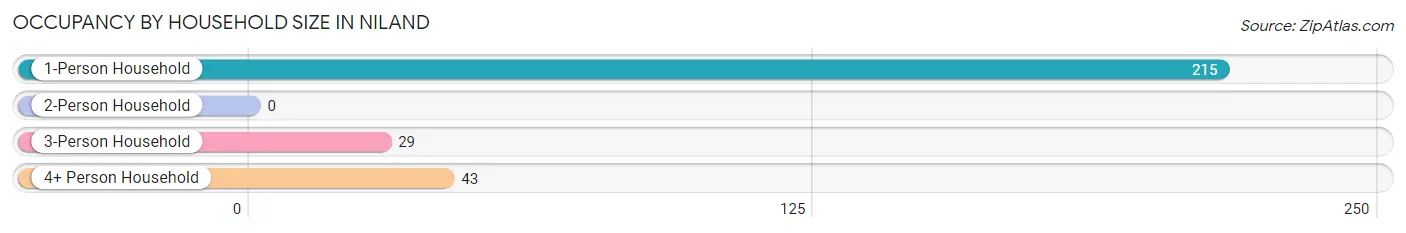
| Household Size | # Housing Units | % Housing Units |
| 1-Person Household | 215 | 74.9% |
| 2-Person Household | 0 | 0.0% |
| 3-Person Household | 29 | 10.1% |
| 4+ Person Household | 43 | 15.0% |
| Total Housing Units | 287 | 100.0% |
Occupancy by Ownership by Household Size in Niland
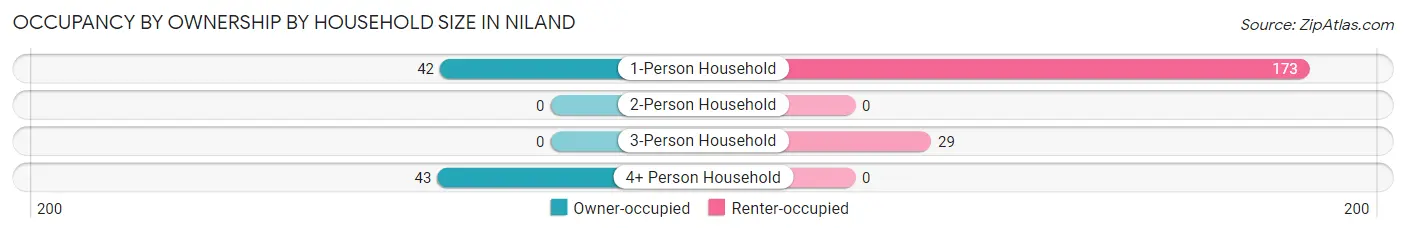
| Household Size | Owner-occupied | Renter-occupied |
| 1-Person Household | 42 (19.5%) | 173 (80.5%) |
| 2-Person Household | 0 (0.0%) | 0 (0.0%) |
| 3-Person Household | 0 (0.0%) | 29 (100.0%) |
| 4+ Person Household | 43 (100.0%) | 0 (0.0%) |
| Total Housing Units | 85 (29.6%) | 202 (70.4%) |
Occupancy by Educational Attainment in Niland
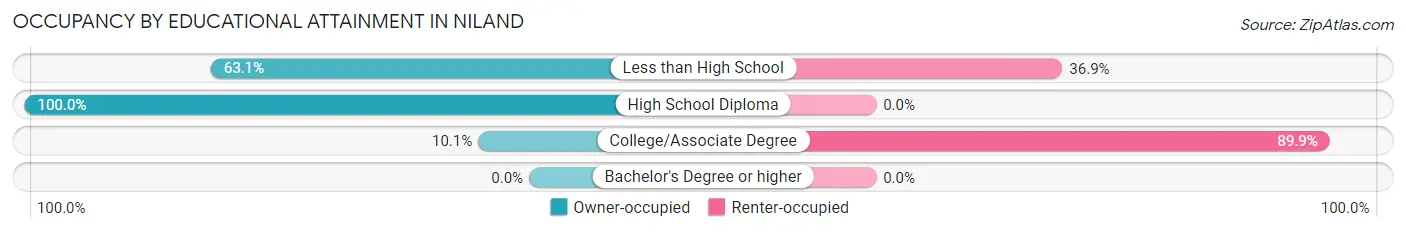
| Household Size | Owner-occupied | Renter-occupied |
| Less than High School | 41 (63.1%) | 24 (36.9%) |
| High School Diploma | 24 (100.0%) | 0 (0.0%) |
| College/Associate Degree | 20 (10.1%) | 178 (89.9%) |
| Bachelor's Degree or higher | 0 (0.0%) | 0 (0.0%) |
Occupancy by Age of Householder in Niland
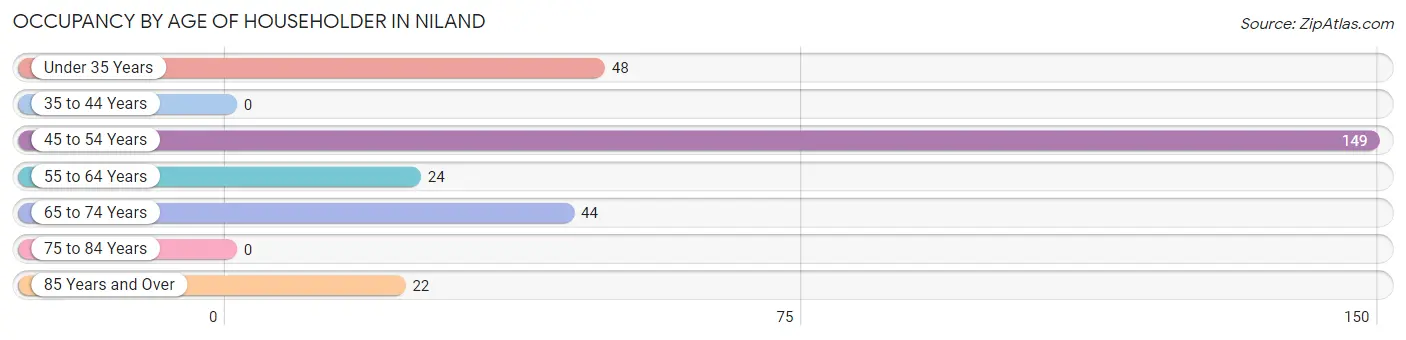
| Age Bracket | # Households | % Households |
| Under 35 Years | 48 | 16.7% |
| 35 to 44 Years | 0 | 0.0% |
| 45 to 54 Years | 149 | 51.9% |
| 55 to 64 Years | 24 | 8.4% |
| 65 to 74 Years | 44 | 15.3% |
| 75 to 84 Years | 0 | 0.0% |
| 85 Years and Over | 22 | 7.7% |
| Total | 287 | 100.0% |
Housing Finances in Niland
Median Income by Occupancy in Niland
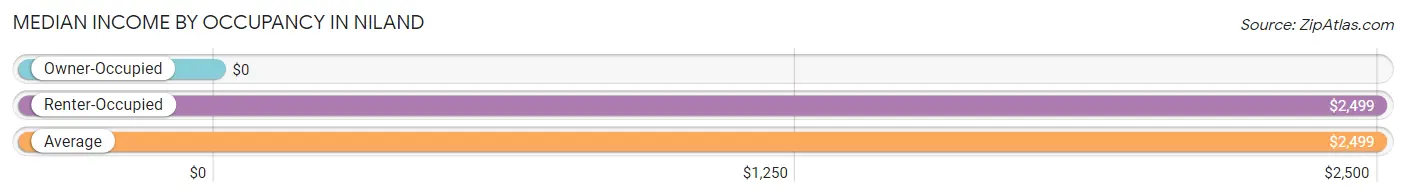
| Occupancy Type | # Households | Median Income |
| Owner-Occupied | 85 (29.6%) | $0 |
| Renter-Occupied | 202 (70.4%) | $2,499 |
| Average | 287 (100.0%) | $2,499 |
Occupancy by Householder Income Bracket in Niland
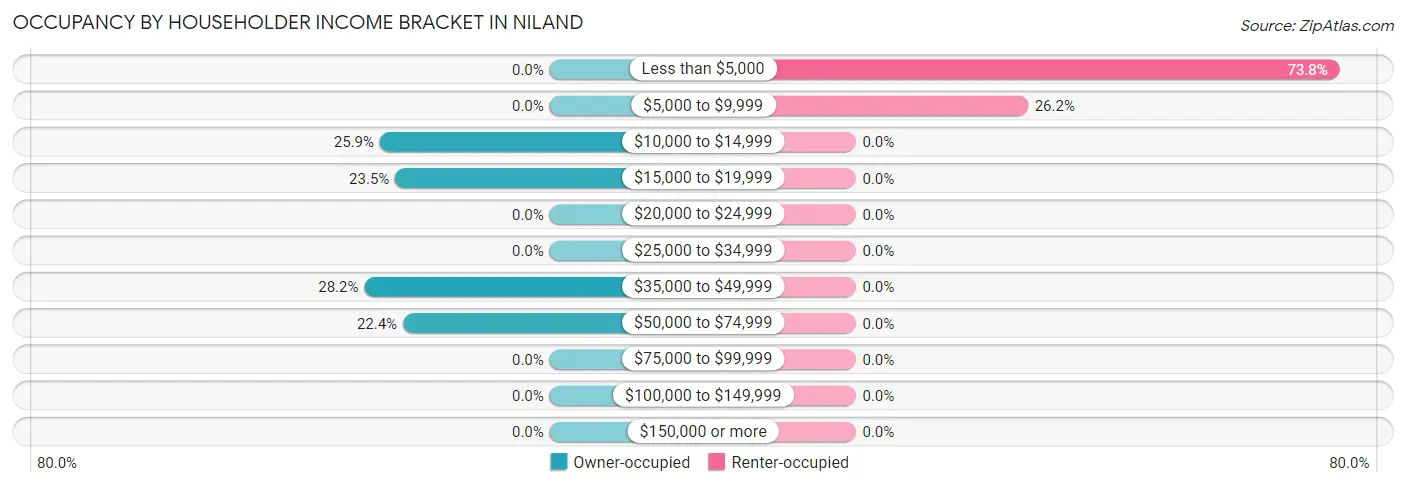
| Income Bracket | Owner-occupied | Renter-occupied |
| Less than $5,000 | 0 (0.0%) | 149 (73.8%) |
| $5,000 to $9,999 | 0 (0.0%) | 53 (26.2%) |
| $10,000 to $14,999 | 22 (25.9%) | 0 (0.0%) |
| $15,000 to $19,999 | 20 (23.5%) | 0 (0.0%) |
| $20,000 to $24,999 | 0 (0.0%) | 0 (0.0%) |
| $25,000 to $34,999 | 0 (0.0%) | 0 (0.0%) |
| $35,000 to $49,999 | 24 (28.2%) | 0 (0.0%) |
| $50,000 to $74,999 | 19 (22.4%) | 0 (0.0%) |
| $75,000 to $99,999 | 0 (0.0%) | 0 (0.0%) |
| $100,000 to $149,999 | 0 (0.0%) | 0 (0.0%) |
| $150,000 or more | 0 (0.0%) | 0 (0.0%) |
| Total | 85 (100.0%) | 202 (100.0%) |
Monthly Housing Cost Tiers in Niland
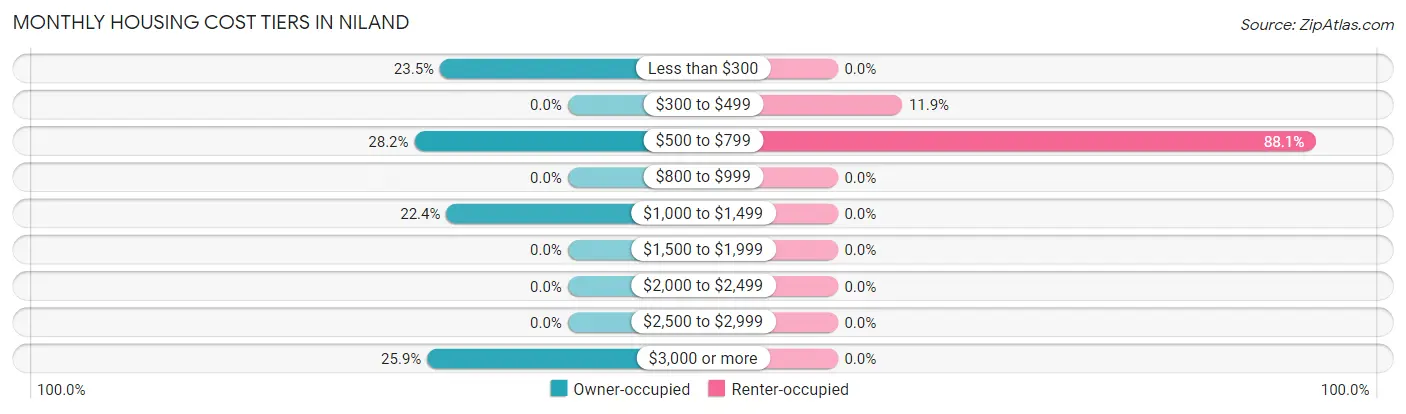
| Monthly Cost | Owner-occupied | Renter-occupied |
| Less than $300 | 20 (23.5%) | 0 (0.0%) |
| $300 to $499 | 0 (0.0%) | 24 (11.9%) |
| $500 to $799 | 24 (28.2%) | 178 (88.1%) |
| $800 to $999 | 0 (0.0%) | 0 (0.0%) |
| $1,000 to $1,499 | 19 (22.4%) | 0 (0.0%) |
| $1,500 to $1,999 | 0 (0.0%) | 0 (0.0%) |
| $2,000 to $2,499 | 0 (0.0%) | 0 (0.0%) |
| $2,500 to $2,999 | 0 (0.0%) | 0 (0.0%) |
| $3,000 or more | 22 (25.9%) | 0 (0.0%) |
| Total | 85 (100.0%) | 202 (100.0%) |
Physical Housing Characteristics in Niland
Housing Structures in Niland
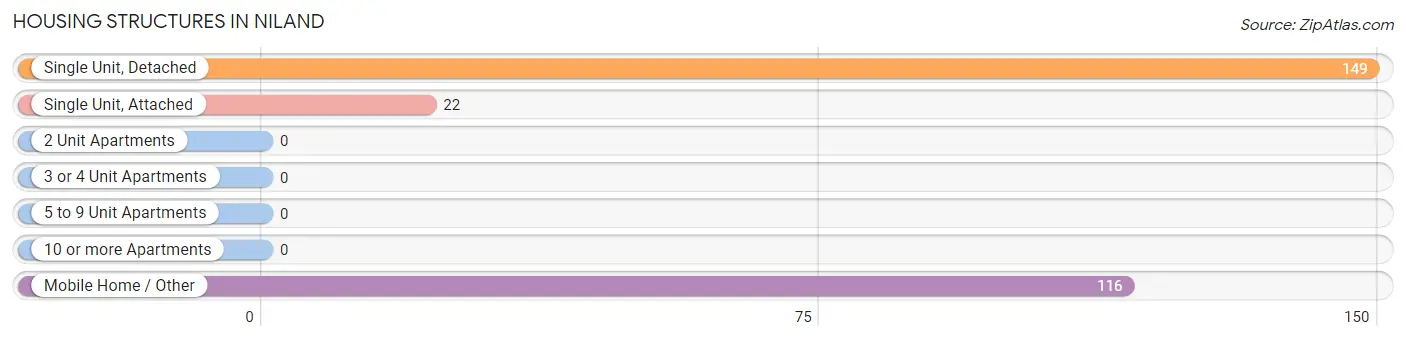
| Structure Type | # Housing Units | % Housing Units |
| Single Unit, Detached | 149 | 51.9% |
| Single Unit, Attached | 22 | 7.7% |
| 2 Unit Apartments | 0 | 0.0% |
| 3 or 4 Unit Apartments | 0 | 0.0% |
| 5 to 9 Unit Apartments | 0 | 0.0% |
| 10 or more Apartments | 0 | 0.0% |
| Mobile Home / Other | 116 | 40.4% |
| Total | 287 | 100.0% |
Housing Structures by Occupancy in Niland
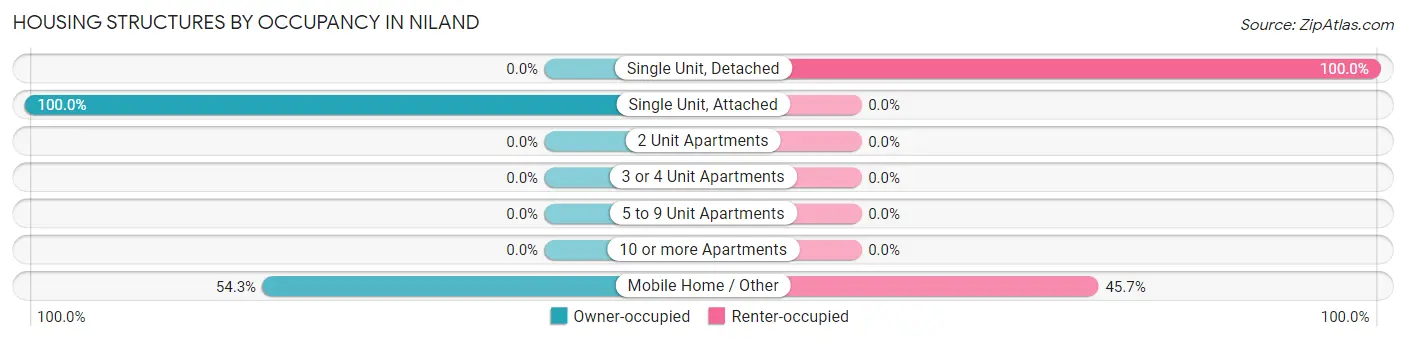
| Structure Type | Owner-occupied | Renter-occupied |
| Single Unit, Detached | 0 (0.0%) | 149 (100.0%) |
| Single Unit, Attached | 22 (100.0%) | 0 (0.0%) |
| 2 Unit Apartments | 0 (0.0%) | 0 (0.0%) |
| 3 or 4 Unit Apartments | 0 (0.0%) | 0 (0.0%) |
| 5 to 9 Unit Apartments | 0 (0.0%) | 0 (0.0%) |
| 10 or more Apartments | 0 (0.0%) | 0 (0.0%) |
| Mobile Home / Other | 63 (54.3%) | 53 (45.7%) |
| Total | 85 (29.6%) | 202 (70.4%) |
Housing Structures by Number of Rooms in Niland
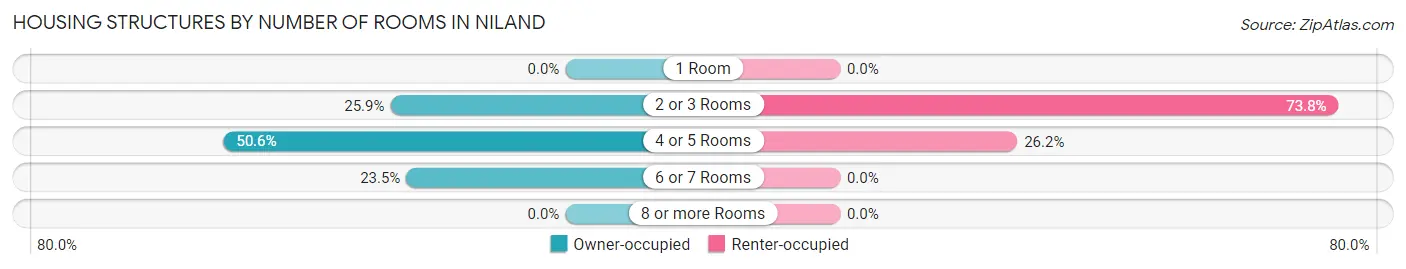
| Number of Rooms | Owner-occupied | Renter-occupied |
| 1 Room | 0 (0.0%) | 0 (0.0%) |
| 2 or 3 Rooms | 22 (25.9%) | 149 (73.8%) |
| 4 or 5 Rooms | 43 (50.6%) | 53 (26.2%) |
| 6 or 7 Rooms | 20 (23.5%) | 0 (0.0%) |
| 8 or more Rooms | 0 (0.0%) | 0 (0.0%) |
| Total | 85 (100.0%) | 202 (100.0%) |
Housing Structure by Heating Type in Niland
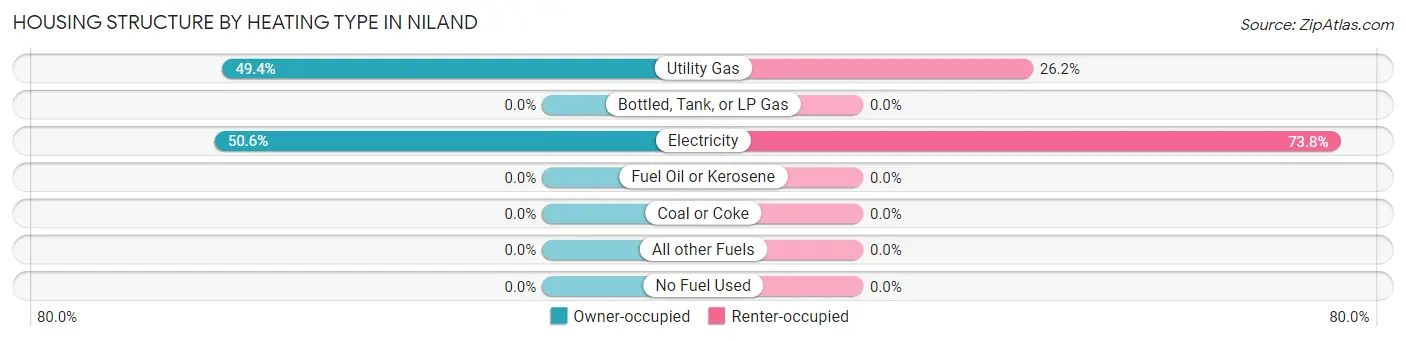
| Heating Type | Owner-occupied | Renter-occupied |
| Utility Gas | 42 (49.4%) | 53 (26.2%) |
| Bottled, Tank, or LP Gas | 0 (0.0%) | 0 (0.0%) |
| Electricity | 43 (50.6%) | 149 (73.8%) |
| Fuel Oil or Kerosene | 0 (0.0%) | 0 (0.0%) |
| Coal or Coke | 0 (0.0%) | 0 (0.0%) |
| All other Fuels | 0 (0.0%) | 0 (0.0%) |
| No Fuel Used | 0 (0.0%) | 0 (0.0%) |
| Total | 85 (100.0%) | 202 (100.0%) |
Household Vehicle Usage in Niland
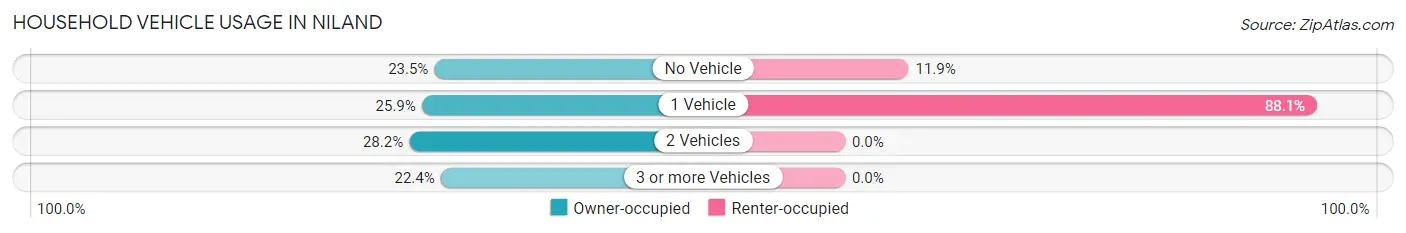
| Vehicles per Household | Owner-occupied | Renter-occupied |
| No Vehicle | 20 (23.5%) | 24 (11.9%) |
| 1 Vehicle | 22 (25.9%) | 178 (88.1%) |
| 2 Vehicles | 24 (28.2%) | 0 (0.0%) |
| 3 or more Vehicles | 19 (22.4%) | 0 (0.0%) |
| Total | 85 (100.0%) | 202 (100.0%) |
Real Estate & Mortgages in Niland
Real Estate and Mortgage Overview in Niland
| Characteristic | Without Mortgage | With Mortgage |
| Housing Units | 44 | 41 |
| Median Property Value | - | - |
| Median Household Income | - | - |
| Monthly Housing Costs | - | - |
| Real Estate Taxes | - | - |
Property Value by Mortgage Status in Niland
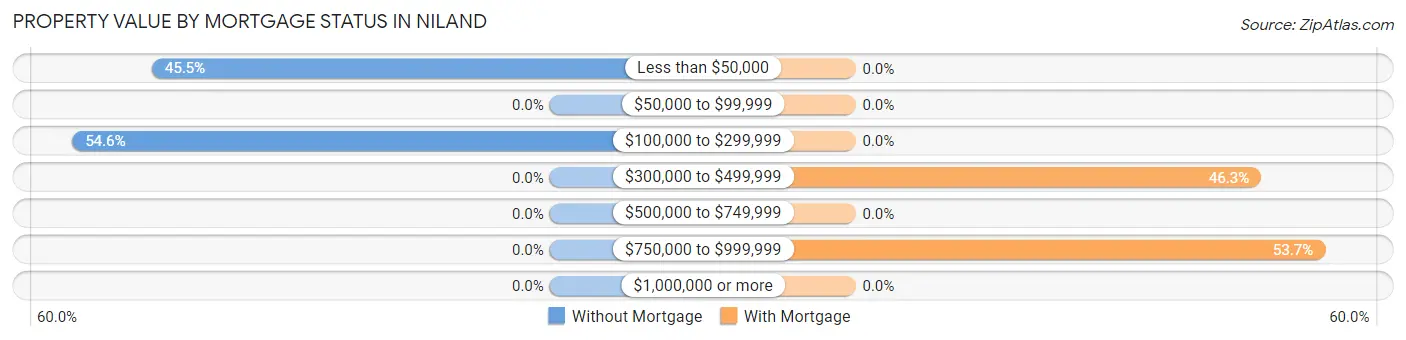
| Property Value | Without Mortgage | With Mortgage |
| Less than $50,000 | 20 (45.5%) | 0 (0.0%) |
| $50,000 to $99,999 | 0 (0.0%) | 0 (0.0%) |
| $100,000 to $299,999 | 24 (54.5%) | 0 (0.0%) |
| $300,000 to $499,999 | 0 (0.0%) | 19 (46.3%) |
| $500,000 to $749,999 | 0 (0.0%) | 0 (0.0%) |
| $750,000 to $999,999 | 0 (0.0%) | 22 (53.7%) |
| $1,000,000 or more | 0 (0.0%) | 0 (0.0%) |
| Total | 44 (100.0%) | 41 (100.0%) |
Household Income by Mortgage Status in Niland
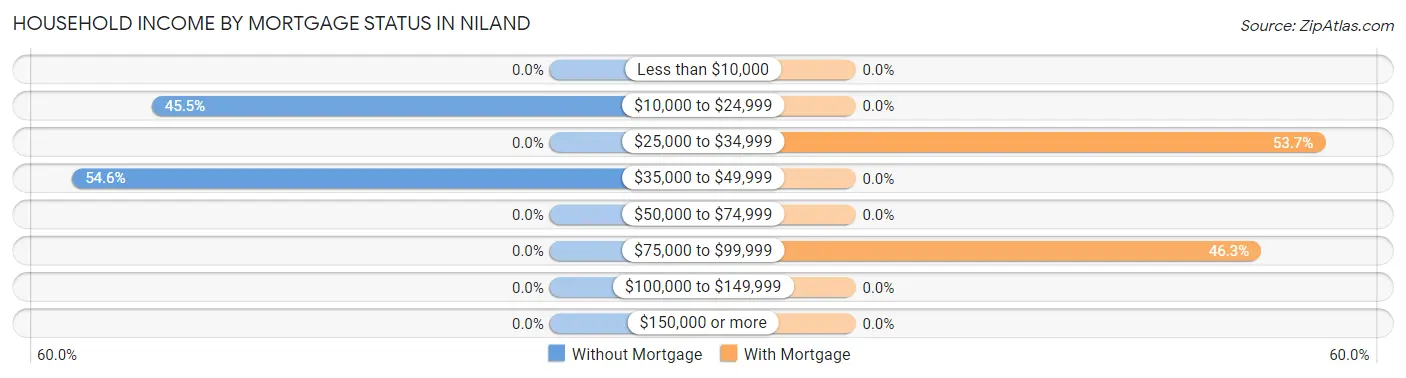
| Household Income | Without Mortgage | With Mortgage |
| Less than $10,000 | 0 (0.0%) | 0 (0.0%) |
| $10,000 to $24,999 | 20 (45.5%) | 0 (0.0%) |
| $25,000 to $34,999 | 0 (0.0%) | 22 (53.7%) |
| $35,000 to $49,999 | 24 (54.5%) | 0 (0.0%) |
| $50,000 to $74,999 | 0 (0.0%) | 0 (0.0%) |
| $75,000 to $99,999 | 0 (0.0%) | 19 (46.3%) |
| $100,000 to $149,999 | 0 (0.0%) | 0 (0.0%) |
| $150,000 or more | 0 (0.0%) | 0 (0.0%) |
| Total | 44 (100.0%) | 41 (100.0%) |
Property Value to Household Income Ratio in Niland
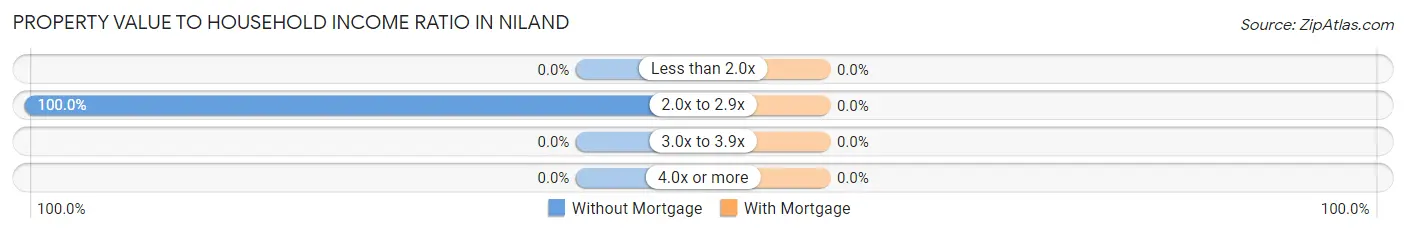
| Value-to-Income Ratio | Without Mortgage | With Mortgage |
| Less than 2.0x | 0 (0.0%) | 0 (0.0%) |
| 2.0x to 2.9x | 44 (100.0%) | 0 (0.0%) |
| 3.0x to 3.9x | 0 (0.0%) | 0 (0.0%) |
| 4.0x or more | 0 (0.0%) | 0 (0.0%) |
| Total | 44 (100.0%) | 41 (100.0%) |
Real Estate Taxes by Mortgage Status in Niland
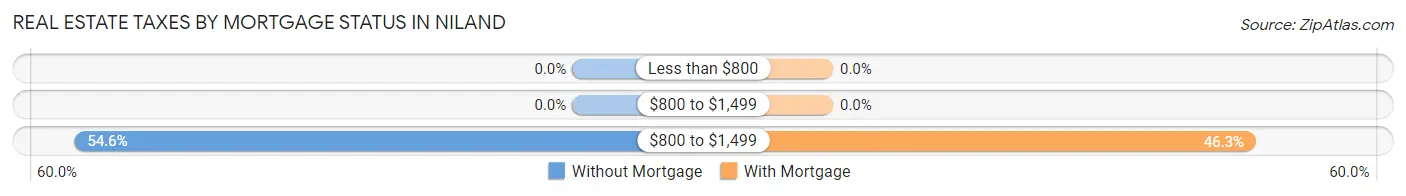
| Property Taxes | Without Mortgage | With Mortgage |
| Less than $800 | 0 (0.0%) | 0 (0.0%) |
| $800 to $1,499 | 0 (0.0%) | 0 (0.0%) |
| $800 to $1,499 | 24 (54.5%) | 19 (46.3%) |
| Total | 44 (100.0%) | 41 (100.0%) |
Health & Disability in Niland
Health Insurance Coverage by Age in Niland
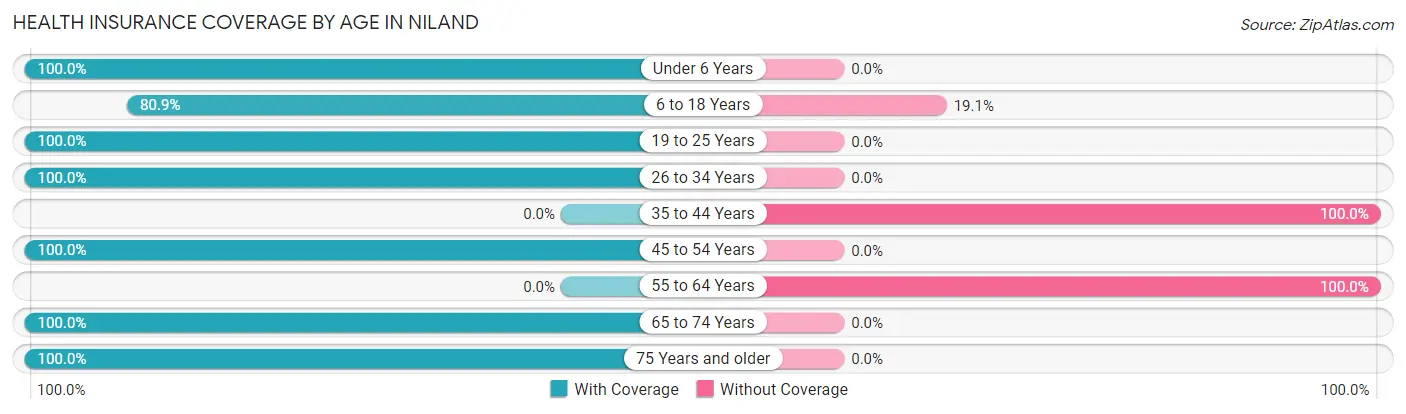
| Age Bracket | With Coverage | Without Coverage |
| Under 6 Years | 111 (100.0%) | 0 (0.0%) |
| 6 to 18 Years | 144 (80.9%) | 34 (19.1%) |
| 19 to 25 Years | 29 (100.0%) | 0 (0.0%) |
| 26 to 34 Years | 19 (100.0%) | 0 (0.0%) |
| 35 to 44 Years | 0 (0.0%) | 26 (100.0%) |
| 45 to 54 Years | 149 (100.0%) | 0 (0.0%) |
| 55 to 64 Years | 0 (0.0%) | 24 (100.0%) |
| 65 to 74 Years | 44 (100.0%) | 0 (0.0%) |
| 75 Years and older | 22 (100.0%) | 0 (0.0%) |
| Total | 518 (86.1%) | 84 (14.0%) |
Health Insurance Coverage by Citizenship Status in Niland
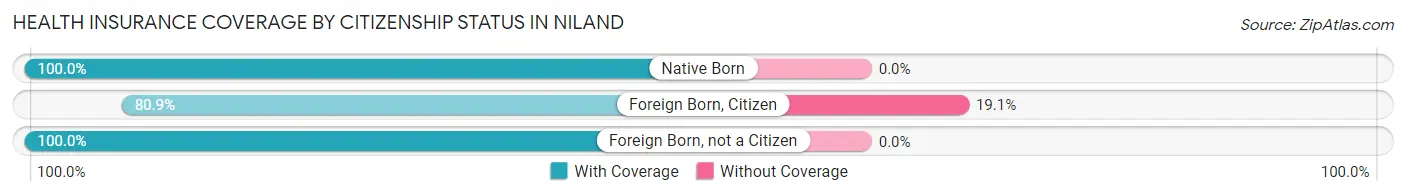
| Citizenship Status | With Coverage | Without Coverage |
| Native Born | 111 (100.0%) | 0 (0.0%) |
| Foreign Born, Citizen | 144 (80.9%) | 34 (19.1%) |
| Foreign Born, not a Citizen | 29 (100.0%) | 0 (0.0%) |
Health Insurance Coverage by Household Income in Niland
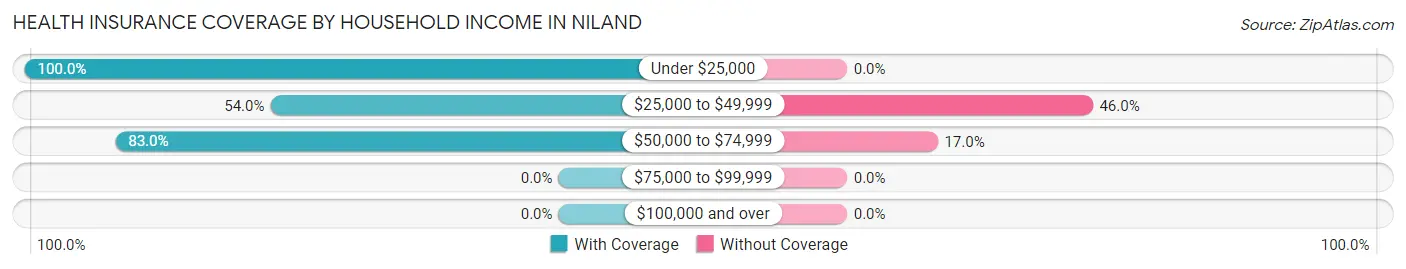
| Household Income | With Coverage | Without Coverage |
| Under $25,000 | 323 (100.0%) | 0 (0.0%) |
| $25,000 to $49,999 | 68 (54.0%) | 58 (46.0%) |
| $50,000 to $74,999 | 127 (83.0%) | 26 (17.0%) |
| $75,000 to $99,999 | 0 (0.0%) | 0 (0.0%) |
| $100,000 and over | 0 (0.0%) | 0 (0.0%) |
Public vs Private Health Insurance Coverage by Age in Niland
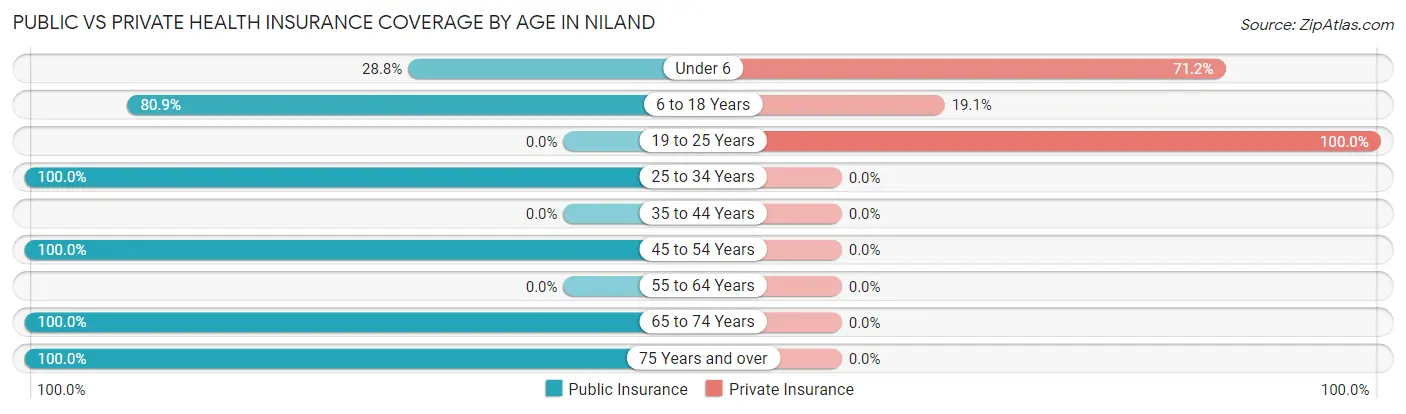
| Age Bracket | Public Insurance | Private Insurance |
| Under 6 | 32 (28.8%) | 79 (71.2%) |
| 6 to 18 Years | 144 (80.9%) | 34 (19.1%) |
| 19 to 25 Years | 0 (0.0%) | 29 (100.0%) |
| 25 to 34 Years | 19 (100.0%) | 0 (0.0%) |
| 35 to 44 Years | 0 (0.0%) | 0 (0.0%) |
| 45 to 54 Years | 149 (100.0%) | 0 (0.0%) |
| 55 to 64 Years | 0 (0.0%) | 0 (0.0%) |
| 65 to 74 Years | 44 (100.0%) | 0 (0.0%) |
| 75 Years and over | 22 (100.0%) | 0 (0.0%) |
| Total | 410 (68.1%) | 142 (23.6%) |
Disability Status by Sex by Age in Niland
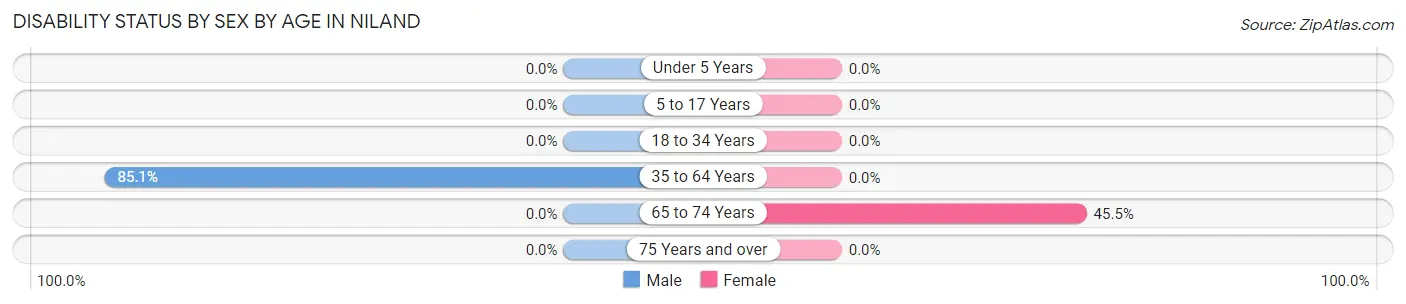
| Age Bracket | Male | Female |
| Under 5 Years | 0 (0.0%) | 0 (0.0%) |
| 5 to 17 Years | 0 (0.0%) | 0 (0.0%) |
| 18 to 34 Years | 0 (0.0%) | 0 (0.0%) |
| 35 to 64 Years | 149 (85.1%) | 0 (0.0%) |
| 65 to 74 Years | 0 (0.0%) | 20 (45.5%) |
| 75 Years and over | 0 (0.0%) | 0 (0.0%) |
Disability Class by Sex by Age in Niland
Disability Class: Hearing Difficulty
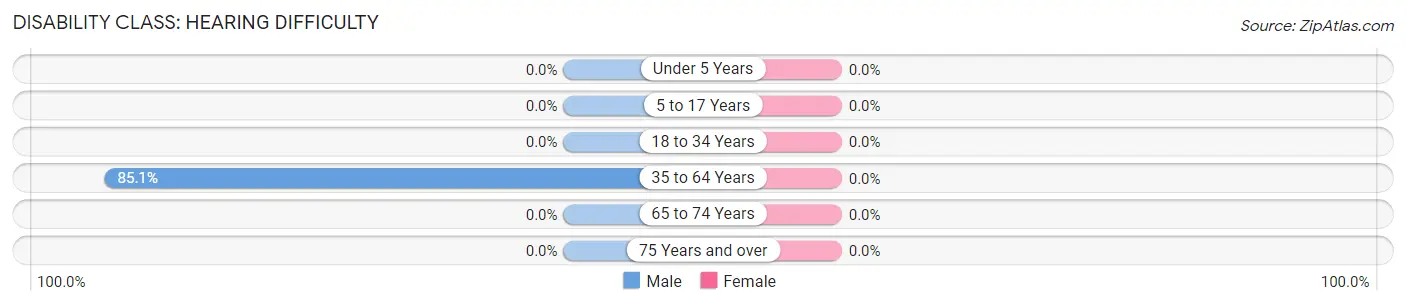
| Age Bracket | Male | Female |
| Under 5 Years | 0 (0.0%) | 0 (0.0%) |
| 5 to 17 Years | 0 (0.0%) | 0 (0.0%) |
| 18 to 34 Years | 0 (0.0%) | 0 (0.0%) |
| 35 to 64 Years | 149 (85.1%) | 0 (0.0%) |
| 65 to 74 Years | 0 (0.0%) | 0 (0.0%) |
| 75 Years and over | 0 (0.0%) | 0 (0.0%) |
Disability Class: Vision Difficulty
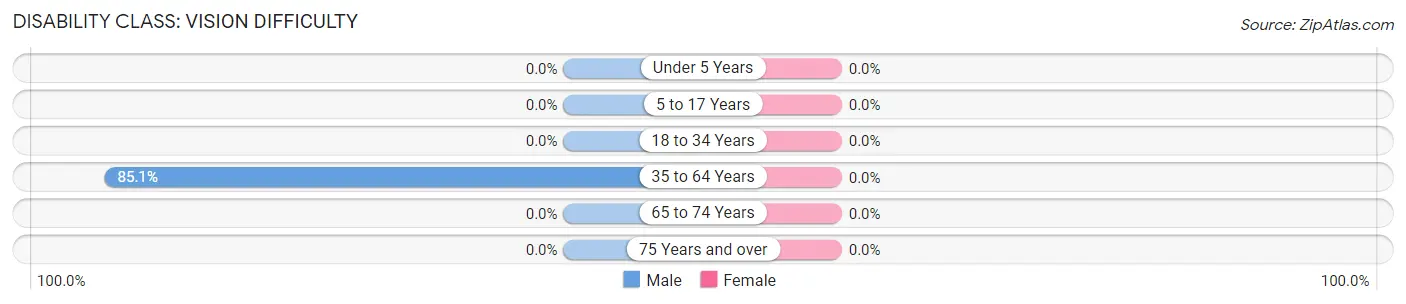
| Age Bracket | Male | Female |
| Under 5 Years | 0 (0.0%) | 0 (0.0%) |
| 5 to 17 Years | 0 (0.0%) | 0 (0.0%) |
| 18 to 34 Years | 0 (0.0%) | 0 (0.0%) |
| 35 to 64 Years | 149 (85.1%) | 0 (0.0%) |
| 65 to 74 Years | 0 (0.0%) | 0 (0.0%) |
| 75 Years and over | 0 (0.0%) | 0 (0.0%) |
Disability Class: Cognitive Difficulty
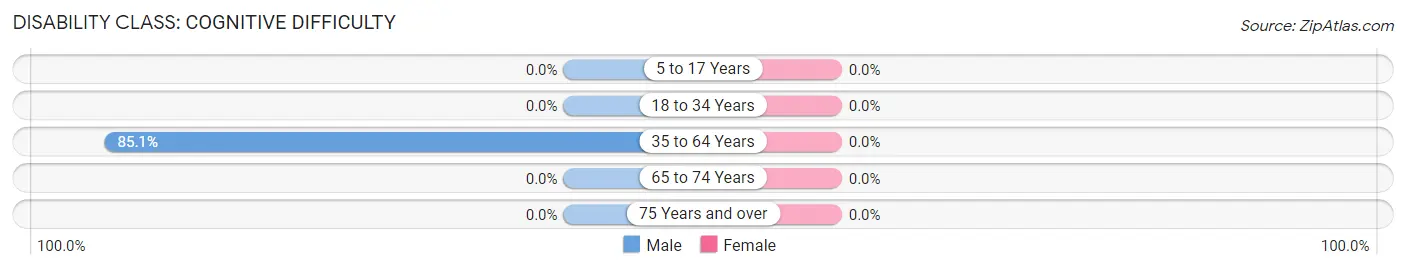
| Age Bracket | Male | Female |
| 5 to 17 Years | 0 (0.0%) | 0 (0.0%) |
| 18 to 34 Years | 0 (0.0%) | 0 (0.0%) |
| 35 to 64 Years | 149 (85.1%) | 0 (0.0%) |
| 65 to 74 Years | 0 (0.0%) | 0 (0.0%) |
| 75 Years and over | 0 (0.0%) | 0 (0.0%) |
Disability Class: Ambulatory Difficulty
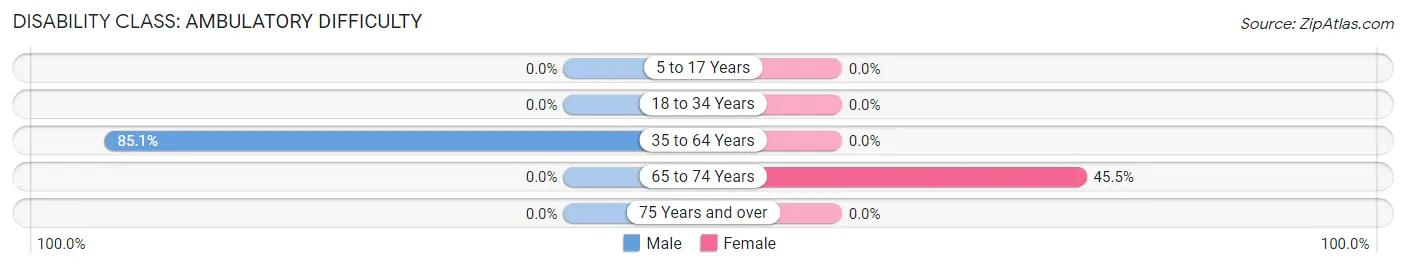
| Age Bracket | Male | Female |
| 5 to 17 Years | 0 (0.0%) | 0 (0.0%) |
| 18 to 34 Years | 0 (0.0%) | 0 (0.0%) |
| 35 to 64 Years | 149 (85.1%) | 0 (0.0%) |
| 65 to 74 Years | 0 (0.0%) | 20 (45.5%) |
| 75 Years and over | 0 (0.0%) | 0 (0.0%) |
Disability Class: Self-Care Difficulty
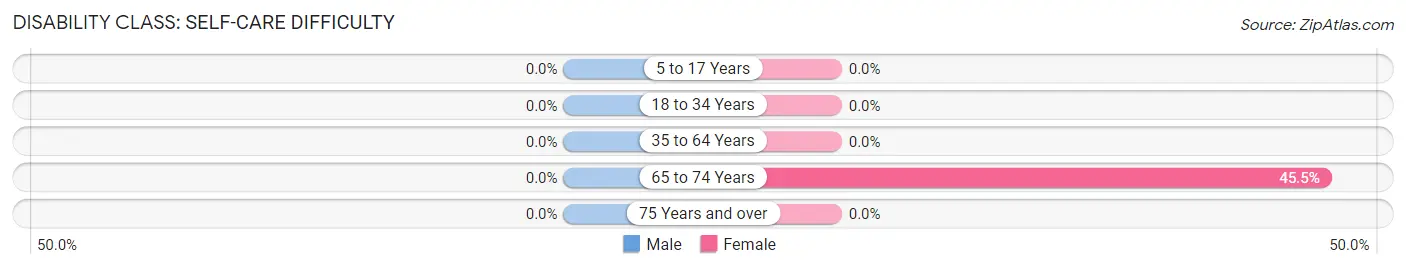
| Age Bracket | Male | Female |
| 5 to 17 Years | 0 (0.0%) | 0 (0.0%) |
| 18 to 34 Years | 0 (0.0%) | 0 (0.0%) |
| 35 to 64 Years | 0 (0.0%) | 0 (0.0%) |
| 65 to 74 Years | 0 (0.0%) | 20 (45.5%) |
| 75 Years and over | 0 (0.0%) | 0 (0.0%) |
Technology Access in Niland
Computing Device Access in Niland
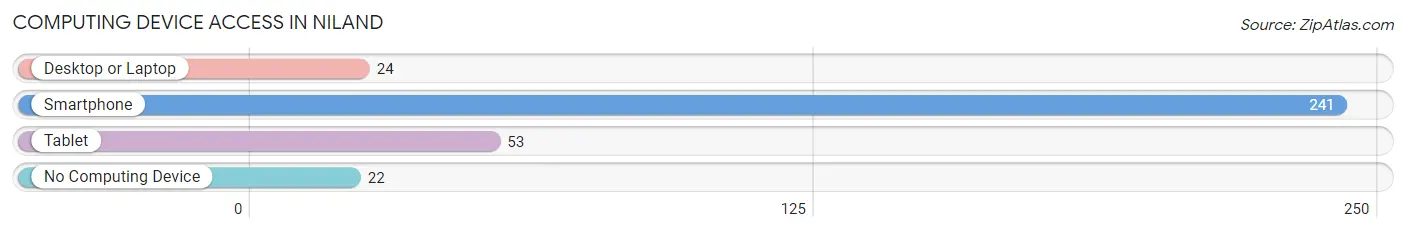
| Device Type | # Households | % Households |
| Desktop or Laptop | 24 | 8.4% |
| Smartphone | 241 | 84.0% |
| Tablet | 53 | 18.5% |
| No Computing Device | 22 | 7.7% |
| Total | 287 | 100.0% |
Internet Access in Niland
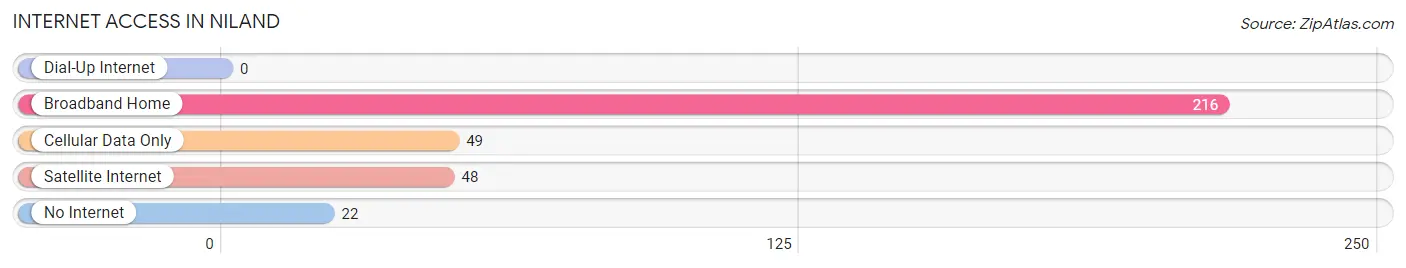
| Internet Type | # Households | % Households |
| Dial-Up Internet | 0 | 0.0% |
| Broadband Home | 216 | 75.3% |
| Cellular Data Only | 49 | 17.1% |
| Satellite Internet | 48 | 16.7% |
| No Internet | 22 | 7.7% |
| Total | 287 | 100.0% |
Niland Summary
Niland is a small unincorporated community located in Imperial County, California. It is situated in the southeastern corner of the state, approximately 10 miles east of the Salton Sea and 30 miles north of the Mexican border. The population of Niland was estimated to be 1,006 in 2019.
History
Niland was founded in the early 1900s by the Niland family, who were among the first settlers in the area. The family had previously lived in Arizona and moved to California in search of better opportunities. The town was originally called Niland Station, as it was a stop on the Southern Pacific Railroad. In the early days, the town was a hub for agricultural activity, with cotton and alfalfa being the main crops.
In the 1930s, the town experienced a period of growth as the nearby Salton Sea became a popular destination for tourists. The town was also home to a number of businesses, including a general store, a gas station, and a post office.
In the 1950s, the town began to decline as the Salton Sea became polluted and the railroad stopped running. The town was further impacted by the construction of the All-American Canal, which diverted water away from the area. By the 1970s, the population had dropped to just over 200 people.
Geography
Niland is located in the southeastern corner of California, approximately 10 miles east of the Salton Sea and 30 miles north of the Mexican border. The town is situated in the Sonoran Desert, which is characterized by hot, dry summers and mild winters. The terrain is mostly flat, with some hills in the surrounding area.
The town is located in Imperial County, which is the largest county in California by area. The county is home to a number of agricultural communities, as well as the Imperial Sand Dunes, which are a popular destination for off-road enthusiasts.
Economy
The economy of Niland is largely based on agriculture. The town is home to a number of farms, which produce a variety of crops, including cotton, alfalfa, and vegetables. The town is also home to a number of businesses, including a general store, a gas station, and a post office.
In recent years, the town has become a popular destination for off-road enthusiasts, who come to explore the nearby Imperial Sand Dunes. The town is also home to a number of RV parks, which attract visitors from across the country.
Demographics
As of 2019, the population of Niland was estimated to be 1,006. The town is predominantly white, with a small Hispanic population. The median household income is $31,250, and the median home value is $90,000. The town has a poverty rate of 28.3%, which is higher than the national average.
Common Questions
What is Per Capita Income in Niland?
Per Capita income in Niland is $5,472.
What is the Median Household income in Niland?
Median Household Income in Niland is $2,499.
What is Inequality or Gini Index in Niland?
Inequality or Gini Index in Niland is 0.70.
What is the Total Population of Niland?
Total Population of Niland is 602.
What is the Total Male Population of Niland?
Total Male Population of Niland is 304.
What is the Total Female Population of Niland?
Total Female Population of Niland is 298.
What is the Ratio of Males per 100 Females in Niland?
There are 102.01 Males per 100 Females in Niland.
What is the Ratio of Females per 100 Males in Niland?
There are 98.03 Females per 100 Males in Niland.
What is the Median Population Age in Niland?
Median Population Age in Niland is 23.4 Years.
What is the Average Family Size in Niland
Average Family Size in Niland is 5.4 People.
What is the Average Household Size in Niland
Average Household Size in Niland is 2.1 People.
How Large is the Labor Force in Niland?
There are 247 People in the Labor Forcein in Niland.
What is the Percentage of People in the Labor Force in Niland?
71.2% of People are in the Labor Force in Niland.