Glendale, CO Map & Demographics
Glendale Map
Glendale Overview
$25,435
PER CAPITA INCOME
18.8%
WAGE / INCOME GAP [ % ]
81.2¢/ $1
WAGE / INCOME GAP [ $ ]
0.65
INEQUALITY / GINI INDEX
68
TOTAL POPULATION
48
MALE POPULATION
20
FEMALE POPULATION
240.00
MALES / 100 FEMALES
41.67
FEMALES / 100 MALES
71.2
MEDIAN AGE
2.6
AVG FAMILY SIZE
1.2
AVG HOUSEHOLD SIZE
14
LABOR FORCE [ PEOPLE ]
23.0%
PERCENT IN LABOR FORCE
Glendale Area Codes
Income in Glendale
Income Overview in Glendale
| Characteristic | Number | Measure |
| Per Capita Income | 68 | $25,435 |
| Median Family Income | 8 | $0 |
| Mean Family Income | 8 | $0 |
| Median Household Income | 55 | $0 |
| Mean Household Income | 55 | $38,185 |
| Income Deficit | 8 | $0 |
| Wage / Income Gap (%) | 68 | 18.85% |
| Wage / Income Gap ($) | 68 | 81.15¢ per $1 |
| Gini / Inequality Index | 68 | 0.65 |
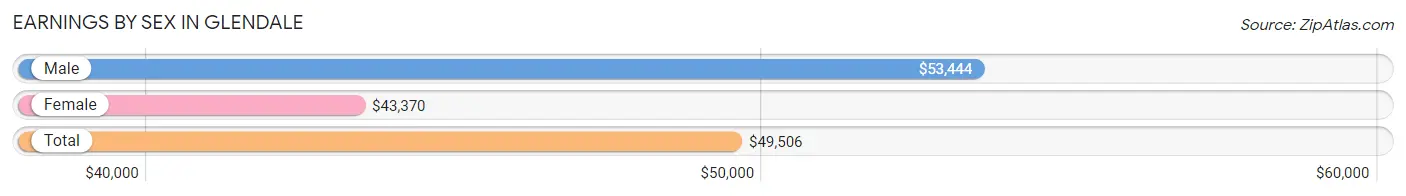
Earnings by Sex in Glendale
Average Earnings in Glendale are $49,506, $53,444 for men and $43,370 for women, a difference of 18.9%.
| Sex | Number | Average Earnings |
| Male | 6 (42.9%) | $53,444 |
| Female | 8 (57.1%) | $43,370 |
| Total | 14 (100.0%) | $49,506 |
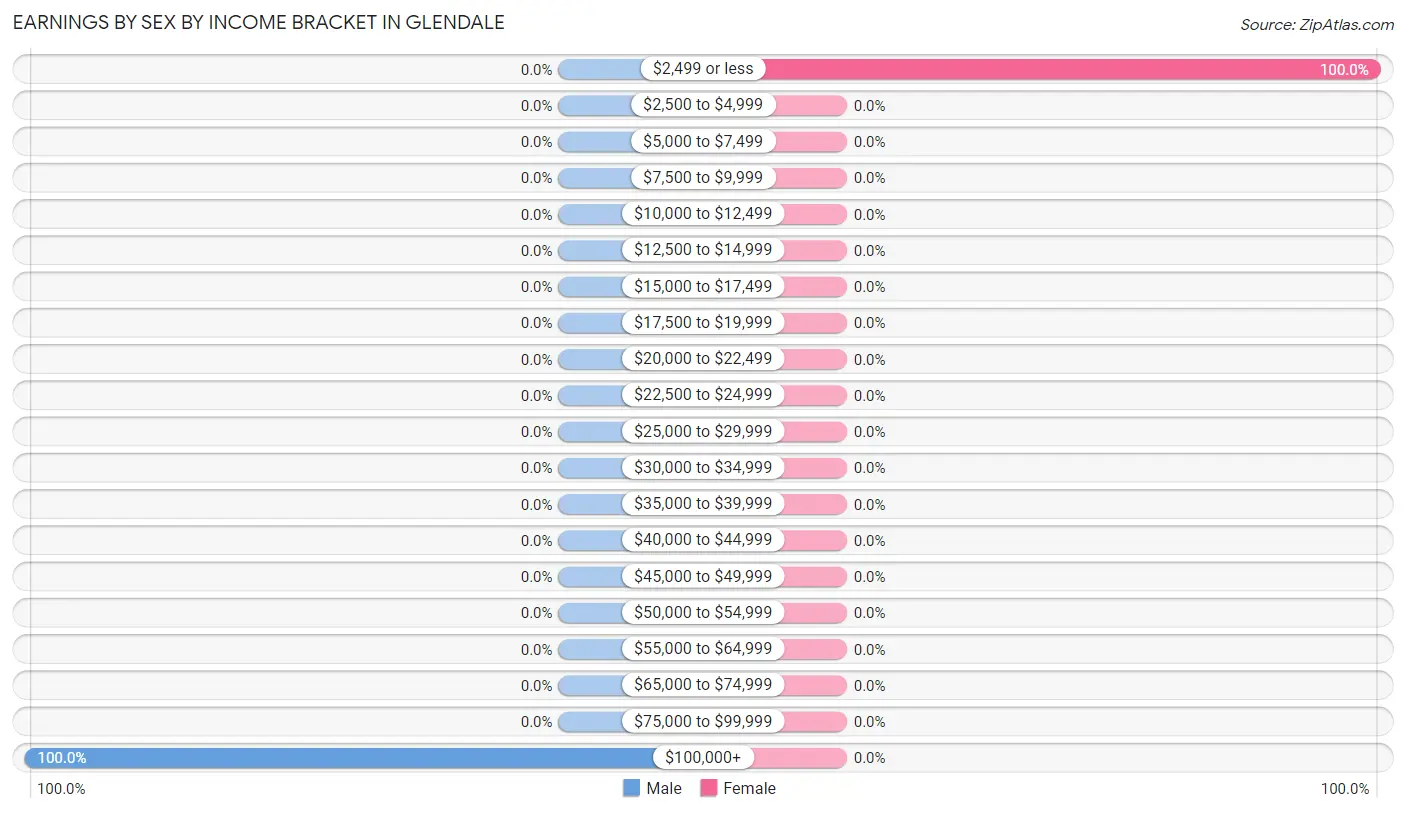
Earnings by Sex by Income Bracket in Glendale
The most common earnings brackets in Glendale are $100,000+ for men (6 | 100.0%) and $2,499 or less for women (8 | 100.0%).
| Income | Male | Female |
| $2,499 or less | 0 (0.0%) | 8 (100.0%) |
| $2,500 to $4,999 | 0 (0.0%) | 0 (0.0%) |
| $5,000 to $7,499 | 0 (0.0%) | 0 (0.0%) |
| $7,500 to $9,999 | 0 (0.0%) | 0 (0.0%) |
| $10,000 to $12,499 | 0 (0.0%) | 0 (0.0%) |
| $12,500 to $14,999 | 0 (0.0%) | 0 (0.0%) |
| $15,000 to $17,499 | 0 (0.0%) | 0 (0.0%) |
| $17,500 to $19,999 | 0 (0.0%) | 0 (0.0%) |
| $20,000 to $22,499 | 0 (0.0%) | 0 (0.0%) |
| $22,500 to $24,999 | 0 (0.0%) | 0 (0.0%) |
| $25,000 to $29,999 | 0 (0.0%) | 0 (0.0%) |
| $30,000 to $34,999 | 0 (0.0%) | 0 (0.0%) |
| $35,000 to $39,999 | 0 (0.0%) | 0 (0.0%) |
| $40,000 to $44,999 | 0 (0.0%) | 0 (0.0%) |
| $45,000 to $49,999 | 0 (0.0%) | 0 (0.0%) |
| $50,000 to $54,999 | 0 (0.0%) | 0 (0.0%) |
| $55,000 to $64,999 | 0 (0.0%) | 0 (0.0%) |
| $65,000 to $74,999 | 0 (0.0%) | 0 (0.0%) |
| $75,000 to $99,999 | 0 (0.0%) | 0 (0.0%) |
| $100,000+ | 6 (100.0%) | 0 (0.0%) |
| Total | 6 (100.0%) | 8 (100.0%) |
Earnings by Sex by Educational Attainment in Glendale
| Educational Attainment | Male Income | Female Income |
| Less than High School | - | - |
| High School Diploma | - | - |
| College or Associate's Degree | - | - |
| Bachelor's Degree | - | - |
| Graduate Degree | - | - |
| Total | - | - |
Family Income in Glendale
Family Income Brackets in Glendale
According to the Glendale family income data, there are 8 families falling into the $150,000 to $199,999 income range, which is the most common income bracket and makes up 100.0% of all families.
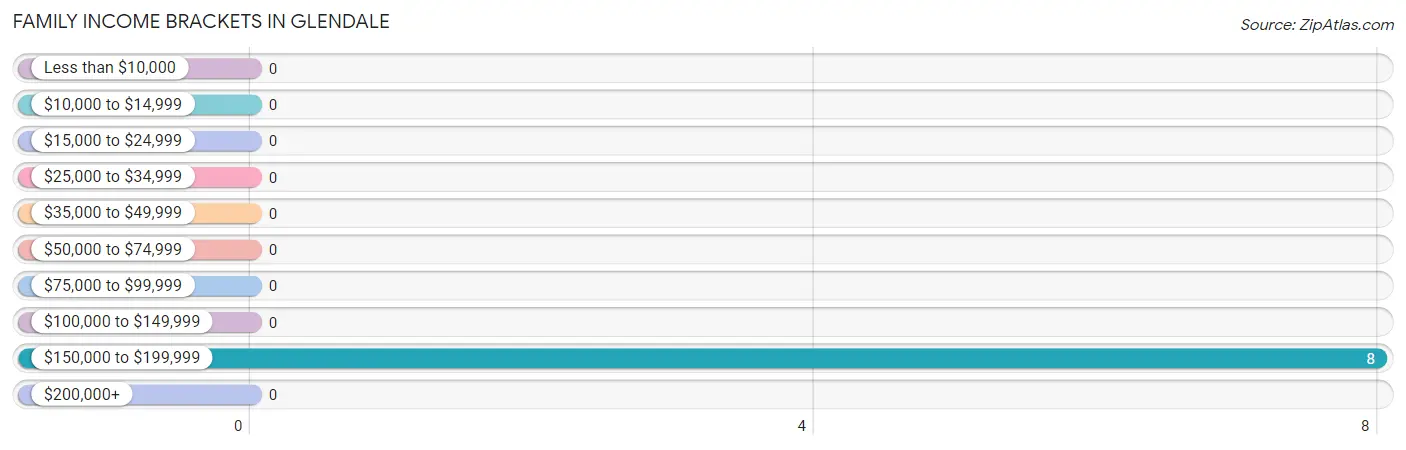
| Income Bracket | # Families | % Families |
| Less than $10,000 | 0 | 0.0% |
| $10,000 to $14,999 | 0 | 0.0% |
| $15,000 to $24,999 | 0 | 0.0% |
| $25,000 to $34,999 | 0 | 0.0% |
| $35,000 to $49,999 | 0 | 0.0% |
| $50,000 to $74,999 | 0 | 0.0% |
| $75,000 to $99,999 | 0 | 0.0% |
| $100,000 to $149,999 | 0 | 0.0% |
| $150,000 to $199,999 | 8 | 100.0% |
| $200,000+ | 0 | 0.0% |
Family Income by Famaliy Size in Glendale
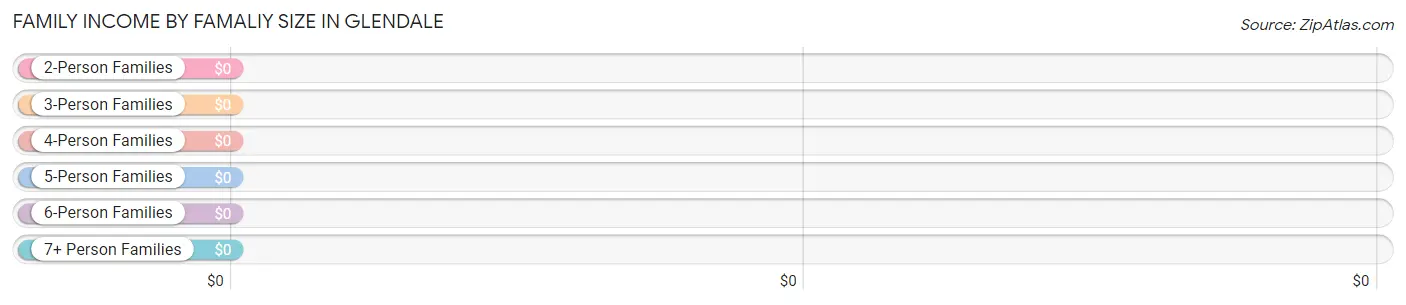
| Income Bracket | # Families | Median Income |
| 2-Person Families | 0 (0.0%) | $0 |
| 3-Person Families | 8 (100.0%) | $0 |
| 4-Person Families | 0 (0.0%) | $0 |
| 5-Person Families | 0 (0.0%) | $0 |
| 6-Person Families | 0 (0.0%) | $0 |
| 7+ Person Families | 0 (0.0%) | $0 |
| Total | 8 (100.0%) | $0 |
Family Income by Number of Earners in Glendale
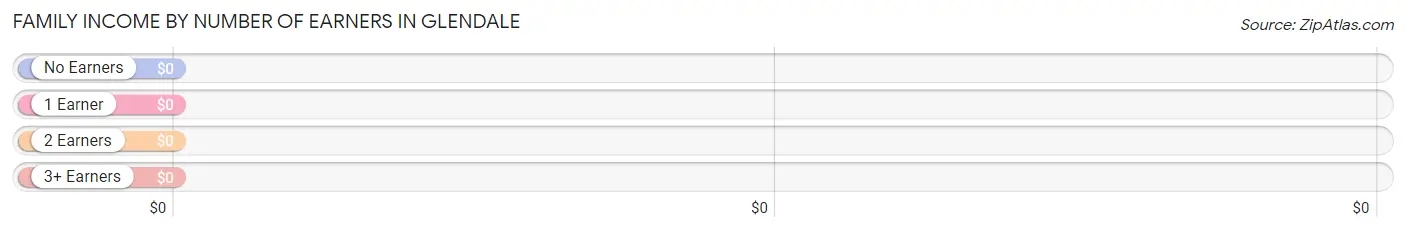
| Number of Earners | # Families | Median Income |
| No Earners | 0 (0.0%) | $0 |
| 1 Earner | 0 (0.0%) | $0 |
| 2 Earners | 8 (100.0%) | $0 |
| 3+ Earners | 0 (0.0%) | $0 |
| Total | 8 (100.0%) | $0 |
Household Income in Glendale
Household Income Brackets in Glendale
With 42 households falling in the category, the less than $10,000 income range is the most frequent in Glendale, accounting for 76.4% of all households.
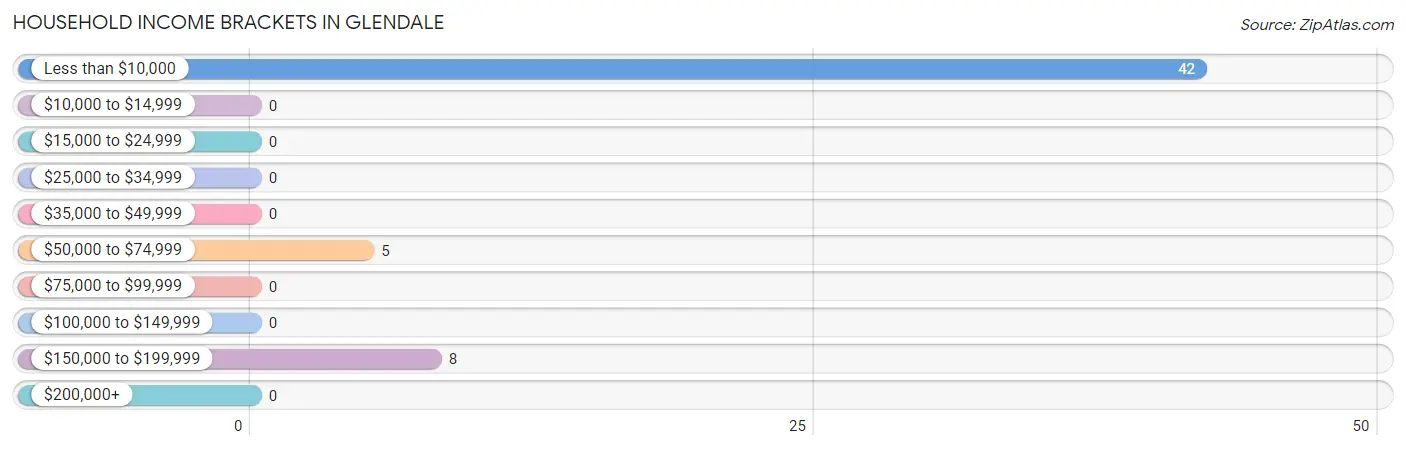
| Income Bracket | # Households | % Households |
| Less than $10,000 | 42 | 76.4% |
| $10,000 to $14,999 | 0 | 0.0% |
| $15,000 to $24,999 | 0 | 0.0% |
| $25,000 to $34,999 | 0 | 0.0% |
| $35,000 to $49,999 | 0 | 0.0% |
| $50,000 to $74,999 | 5 | 9.1% |
| $75,000 to $99,999 | 0 | 0.0% |
| $100,000 to $149,999 | 0 | 0.0% |
| $150,000 to $199,999 | 8 | 14.5% |
| $200,000+ | 0 | 0.0% |
Household Income by Householder Age in Glendale
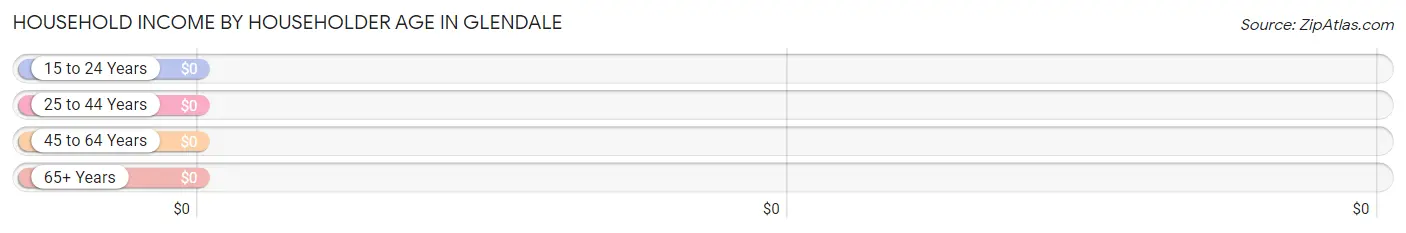
| Income Bracket | # Households | Median Income |
| 15 to 24 Years | 0 (0.0%) | $0 |
| 25 to 44 Years | 8 (14.5%) | $0 |
| 45 to 64 Years | 5 (9.1%) | $0 |
| 65+ Years | 42 (76.4%) | $0 |
| Total | 55 (100.0%) | $0 |
Poverty in Glendale
Income Below Poverty by Sex and Age in Glendale
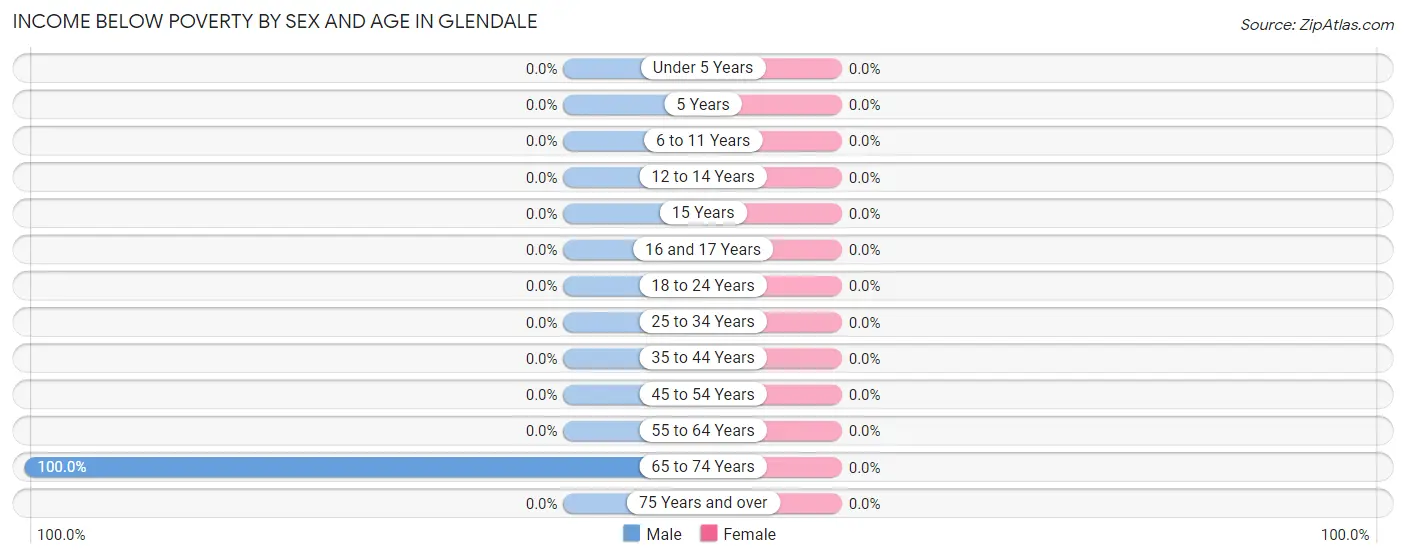
| Age Bracket | Male | Female |
| Under 5 Years | 0 (0.0%) | 0 (0.0%) |
| 5 Years | 0 (0.0%) | 0 (0.0%) |
| 6 to 11 Years | 0 (0.0%) | 0 (0.0%) |
| 12 to 14 Years | 0 (0.0%) | 0 (0.0%) |
| 15 Years | 0 (0.0%) | 0 (0.0%) |
| 16 and 17 Years | 0 (0.0%) | 0 (0.0%) |
| 18 to 24 Years | 0 (0.0%) | 0 (0.0%) |
| 25 to 34 Years | 0 (0.0%) | 0 (0.0%) |
| 35 to 44 Years | 0 (0.0%) | 0 (0.0%) |
| 45 to 54 Years | 0 (0.0%) | 0 (0.0%) |
| 55 to 64 Years | 0 (0.0%) | 0 (0.0%) |
| 65 to 74 Years | 42 (100.0%) | 0 (0.0%) |
| 75 Years and over | 0 (0.0%) | 0 (0.0%) |
| Total | 42 (87.5%) | 0 (0.0%) |
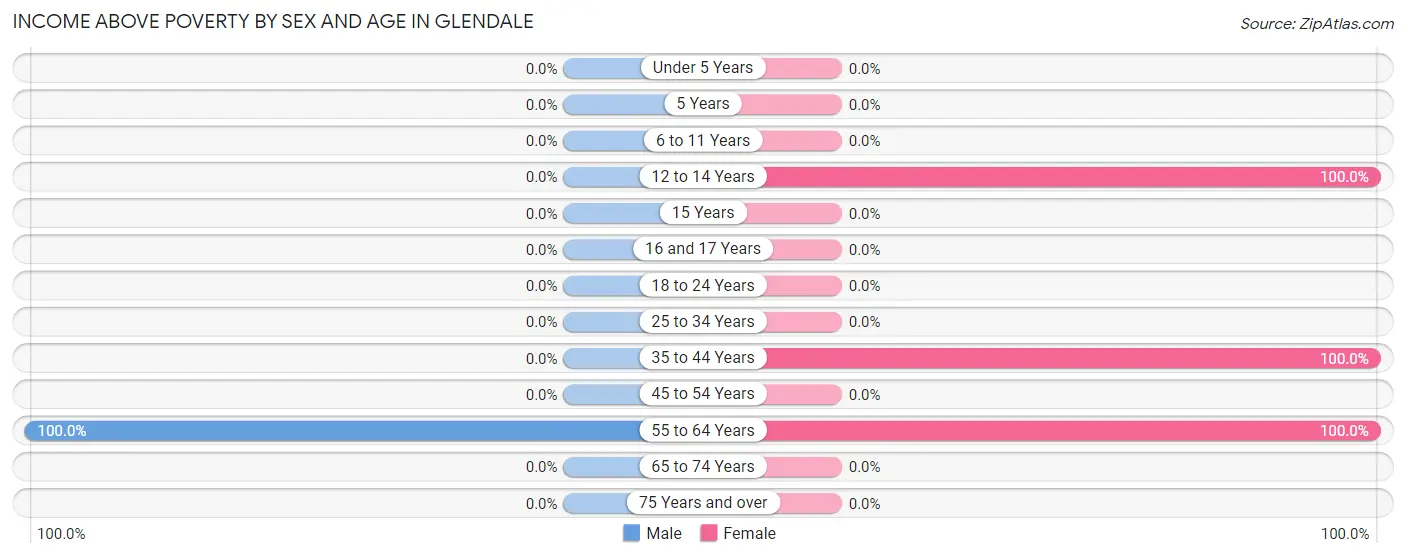
Income Above Poverty by Sex and Age in Glendale
According to the poverty statistics in Glendale, males aged 55 to 64 years and females aged 12 to 14 years are the age groups that are most secure financially, with 100.0% of males and 100.0% of females in these age groups living above the poverty line.
| Age Bracket | Male | Female |
| Under 5 Years | 0 (0.0%) | 0 (0.0%) |
| 5 Years | 0 (0.0%) | 0 (0.0%) |
| 6 to 11 Years | 0 (0.0%) | 0 (0.0%) |
| 12 to 14 Years | 0 (0.0%) | 7 (100.0%) |
| 15 Years | 0 (0.0%) | 0 (0.0%) |
| 16 and 17 Years | 0 (0.0%) | 0 (0.0%) |
| 18 to 24 Years | 0 (0.0%) | 0 (0.0%) |
| 25 to 34 Years | 0 (0.0%) | 0 (0.0%) |
| 35 to 44 Years | 0 (0.0%) | 8 (100.0%) |
| 45 to 54 Years | 0 (0.0%) | 0 (0.0%) |
| 55 to 64 Years | 6 (100.0%) | 5 (100.0%) |
| 65 to 74 Years | 0 (0.0%) | 0 (0.0%) |
| 75 Years and over | 0 (0.0%) | 0 (0.0%) |
| Total | 6 (12.5%) | 20 (100.0%) |
Income Below Poverty Among Married-Couple Families in Glendale
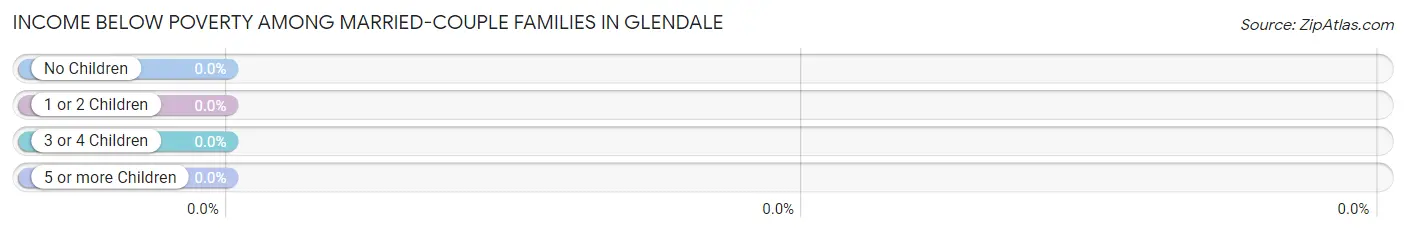
| Children | Above Poverty | Below Poverty |
| No Children | 0 (0.0%) | 0 (0.0%) |
| 1 or 2 Children | 8 (100.0%) | 0 (0.0%) |
| 3 or 4 Children | 0 (0.0%) | 0 (0.0%) |
| 5 or more Children | 0 (0.0%) | 0 (0.0%) |
| Total | 8 (100.0%) | 0 (0.0%) |
Income Below Poverty Among Single-Parent Households in Glendale
| Children | Single Father | Single Mother |
| No Children | 0 (0.0%) | 0 (0.0%) |
| 1 or 2 Children | 0 (0.0%) | 0 (0.0%) |
| 3 or 4 Children | 0 (0.0%) | 0 (0.0%) |
| 5 or more Children | 0 (0.0%) | 0 (0.0%) |
| Total | 0 (0.0%) | 0 (0.0%) |
Income Below Poverty Among Married-Couple vs Single-Parent Households in Glendale
| Children | Married-Couple Families | Single-Parent Households |
| No Children | 0 (0.0%) | 0 (0.0%) |
| 1 or 2 Children | 0 (0.0%) | 0 (0.0%) |
| 3 or 4 Children | 0 (0.0%) | 0 (0.0%) |
| 5 or more Children | 0 (0.0%) | 0 (0.0%) |
| Total | 0 (0.0%) | 0 (0.0%) |
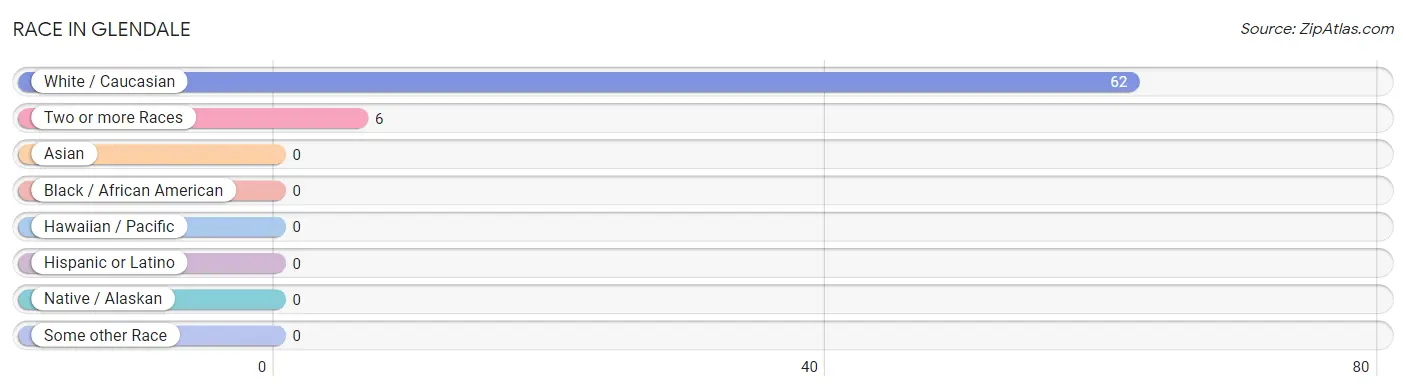
Race in Glendale
The most populous races in Glendale are White / Caucasian (62 | 91.2%), and Two or more Races (6 | 8.8%).
| Race | # Population | % Population |
| Asian | 0 | 0.0% |
| Black / African American | 0 | 0.0% |
| Hawaiian / Pacific | 0 | 0.0% |
| Hispanic or Latino | 0 | 0.0% |
| Native / Alaskan | 0 | 0.0% |
| White / Caucasian | 62 | 91.2% |
| Two or more Races | 6 | 8.8% |
| Some other Race | 0 | 0.0% |
| Total | 68 | 100.0% |
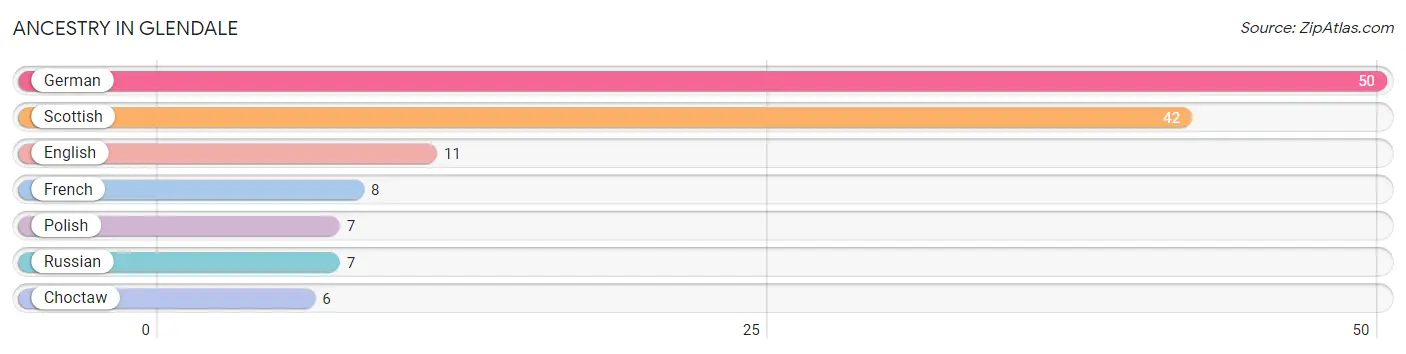
Ancestry in Glendale
The most populous ancestries reported in Glendale are German (50 | 73.5%), Scottish (42 | 61.8%), English (11 | 16.2%), French (8 | 11.8%), and Polish (7 | 10.3%), together accounting for 173.5% of all Glendale residents.
| Ancestry | # Population | % Population |
| Choctaw | 6 | 8.8% |
| English | 11 | 16.2% |
| French | 8 | 11.8% |
| German | 50 | 73.5% |
| Polish | 7 | 10.3% |
| Russian | 7 | 10.3% |
| Scottish | 42 | 61.8% | View All 7 Rows |
Immigrants in Glendale

| Immigration Origin | # Population | % Population | View All 0 Rows |
Sex and Age in Glendale
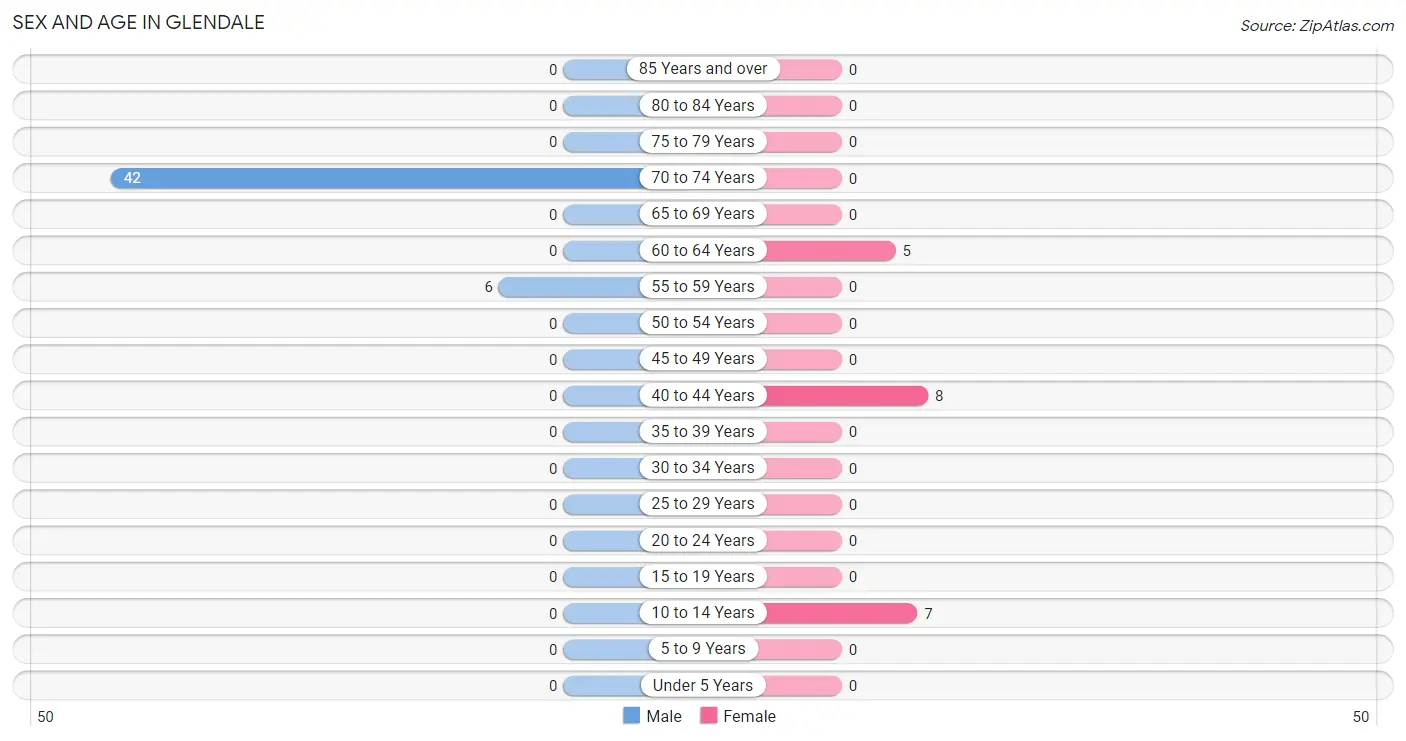
Sex and Age in Glendale
The most populous age groups in Glendale are 70 to 74 Years (42 | 87.5%) for men and 40 to 44 Years (8 | 40.0%) for women.
| Age Bracket | Male | Female |
| Under 5 Years | 0 (0.0%) | 0 (0.0%) |
| 5 to 9 Years | 0 (0.0%) | 0 (0.0%) |
| 10 to 14 Years | 0 (0.0%) | 7 (35.0%) |
| 15 to 19 Years | 0 (0.0%) | 0 (0.0%) |
| 20 to 24 Years | 0 (0.0%) | 0 (0.0%) |
| 25 to 29 Years | 0 (0.0%) | 0 (0.0%) |
| 30 to 34 Years | 0 (0.0%) | 0 (0.0%) |
| 35 to 39 Years | 0 (0.0%) | 0 (0.0%) |
| 40 to 44 Years | 0 (0.0%) | 8 (40.0%) |
| 45 to 49 Years | 0 (0.0%) | 0 (0.0%) |
| 50 to 54 Years | 0 (0.0%) | 0 (0.0%) |
| 55 to 59 Years | 6 (12.5%) | 0 (0.0%) |
| 60 to 64 Years | 0 (0.0%) | 5 (25.0%) |
| 65 to 69 Years | 0 (0.0%) | 0 (0.0%) |
| 70 to 74 Years | 42 (87.5%) | 0 (0.0%) |
| 75 to 79 Years | 0 (0.0%) | 0 (0.0%) |
| 80 to 84 Years | 0 (0.0%) | 0 (0.0%) |
| 85 Years and over | 0 (0.0%) | 0 (0.0%) |
| Total | 48 (100.0%) | 20 (100.0%) |
Families and Households in Glendale
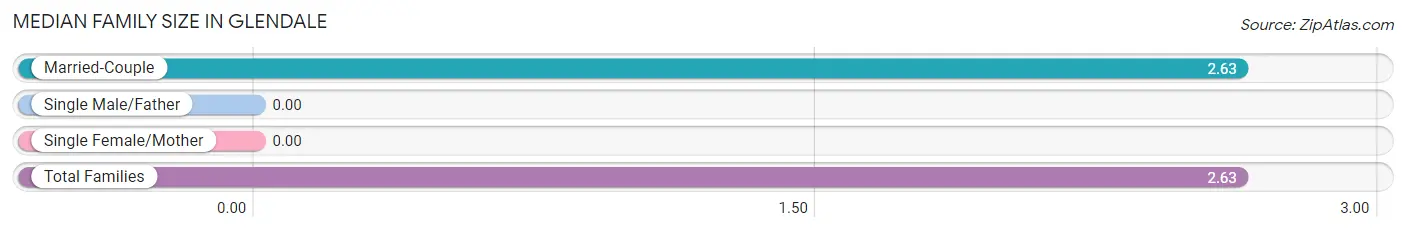
Median Family Size in Glendale
| Family Type | # Families | Family Size |
| Married-Couple | 8 (100.0%) | 2.63 |
| Single Male/Father | 0 (0.0%) | - |
| Single Female/Mother | 0 (0.0%) | - |
| Total Families | 8 (100.0%) | 2.63 |
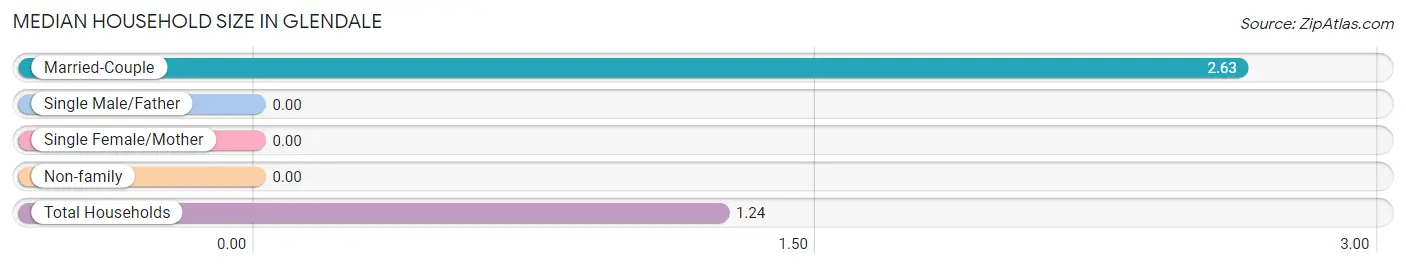
Median Household Size in Glendale
| Household Type | # Households | Household Size |
| Married-Couple | 8 (14.5%) | 2.63 |
| Single Male/Father | 0 (0.0%) | - |
| Single Female/Mother | 0 (0.0%) | - |
| Non-family | 47 (85.5%) | - |
| Total Households | 55 (100.0%) | 1.24 |
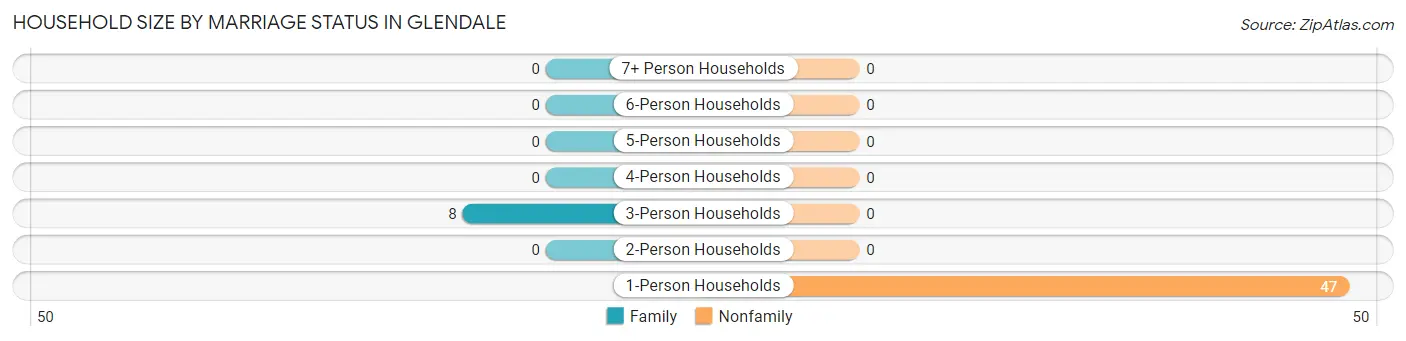
Household Size by Marriage Status in Glendale
Out of a total of 55 households in Glendale, 8 (14.5%) are family households, while 47 (85.5%) are nonfamily households. The most numerous type of family households are 3-person households, comprising 8, and the most common type of nonfamily households are 1-person households, comprising 47.
| Household Size | Family Households | Nonfamily Households |
| 1-Person Households | - | 47 (85.5%) |
| 2-Person Households | 0 (0.0%) | 0 (0.0%) |
| 3-Person Households | 8 (14.5%) | 0 (0.0%) |
| 4-Person Households | 0 (0.0%) | 0 (0.0%) |
| 5-Person Households | 0 (0.0%) | 0 (0.0%) |
| 6-Person Households | 0 (0.0%) | 0 (0.0%) |
| 7+ Person Households | 0 (0.0%) | 0 (0.0%) |
| Total | 8 (14.5%) | 47 (85.5%) |
Female Fertility in Glendale
Fertility by Age in Glendale
| Age Bracket | Women with Births | Births / 1,000 Women |
| 15 to 19 years | 0 (0.0%) | 0.0 |
| 20 to 34 years | 0 (0.0%) | 0.0 |
| 35 to 50 years | 0 (0.0%) | 0.0 |
| Total | 0 (0.0%) | 0.0 |
Fertility by Age by Marriage Status in Glendale
| Age Bracket | Married | Unmarried |
| 15 to 19 years | 0 (0.0%) | 0 (0.0%) |
| 20 to 34 years | 0 (0.0%) | 0 (0.0%) |
| 35 to 50 years | 0 (0.0%) | 0 (0.0%) |
| Total | 0 (0.0%) | 0 (0.0%) |
Fertility by Education in Glendale
| Educational Attainment | Women with Births | Births / 1,000 Women |
| Less than High School | 0 (0.0%) | 0.0 |
| High School Diploma | 0 (0.0%) | 0.0 |
| College or Associate's Degree | 0 (0.0%) | 0.0 |
| Bachelor's Degree | 0 (0.0%) | 0.0 |
| Graduate Degree | 0 (0.0%) | 0.0 |
| Total | 0 (0.0%) | 0.0 |
Fertility by Education by Marriage Status in Glendale
| Educational Attainment | Married | Unmarried |
| Less than High School | 0 (0.0%) | 0 (0.0%) |
| High School Diploma | 0 (0.0%) | 0 (0.0%) |
| College or Associate's Degree | 0 (0.0%) | 0 (0.0%) |
| Bachelor's Degree | 0 (0.0%) | 0 (0.0%) |
| Graduate Degree | 0 (0.0%) | 0 (0.0%) |
| Total | 0 (0.0%) | 0 (0.0%) |
Employment Characteristics in Glendale
Employment by Class of Employer in Glendale
Among the 14 employed individuals in Glendale, self-employed (not incorporated) (8 | 57.1%), and federal government employees (6 | 42.9%) make up the most common classes of employment.
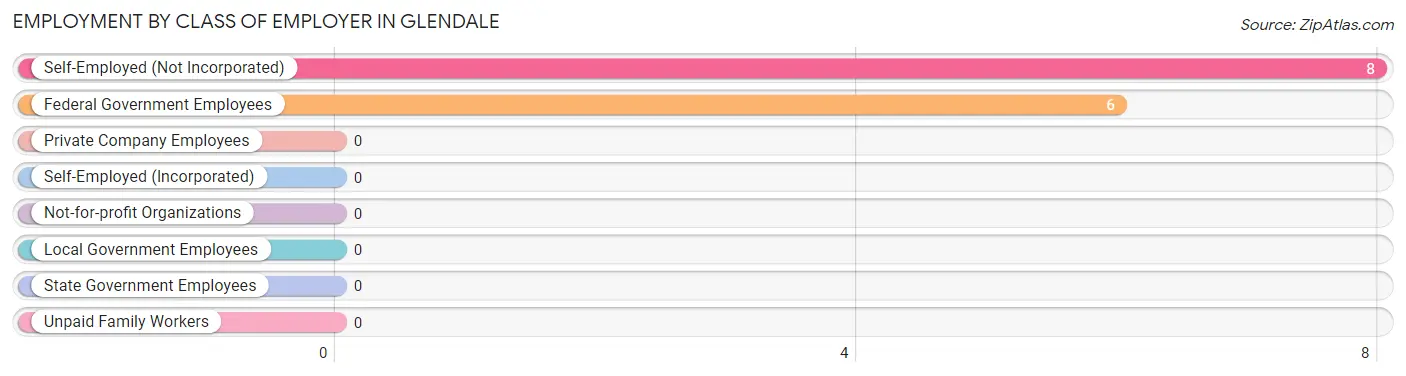
| Employer Class | # Employees | % Employees |
| Private Company Employees | 0 | 0.0% |
| Self-Employed (Incorporated) | 0 | 0.0% |
| Self-Employed (Not Incorporated) | 8 | 57.1% |
| Not-for-profit Organizations | 0 | 0.0% |
| Local Government Employees | 0 | 0.0% |
| State Government Employees | 0 | 0.0% |
| Federal Government Employees | 6 | 42.9% |
| Unpaid Family Workers | 0 | 0.0% |
| Total | 14 | 100.0% |
Employment Status by Age in Glendale
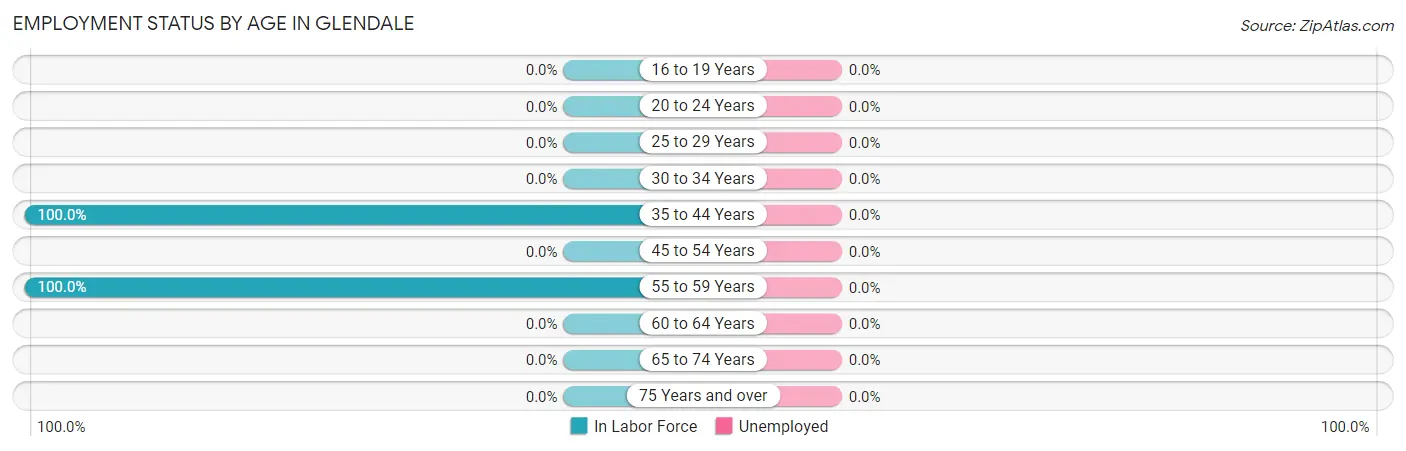
| Age Bracket | In Labor Force | Unemployed |
| 16 to 19 Years | 0 (0.0%) | 0 (0.0%) |
| 20 to 24 Years | 0 (0.0%) | 0 (0.0%) |
| 25 to 29 Years | 0 (0.0%) | 0 (0.0%) |
| 30 to 34 Years | 0 (0.0%) | 0 (0.0%) |
| 35 to 44 Years | 8 (100.0%) | 0 (0.0%) |
| 45 to 54 Years | 0 (0.0%) | 0 (0.0%) |
| 55 to 59 Years | 6 (100.0%) | 0 (0.0%) |
| 60 to 64 Years | 0 (0.0%) | 0 (0.0%) |
| 65 to 74 Years | 0 (0.0%) | 0 (0.0%) |
| 75 Years and over | 0 (0.0%) | 0 (0.0%) |
| Total | 14 (23.0%) | 0 (0.0%) |
Employment Status by Educational Attainment in Glendale
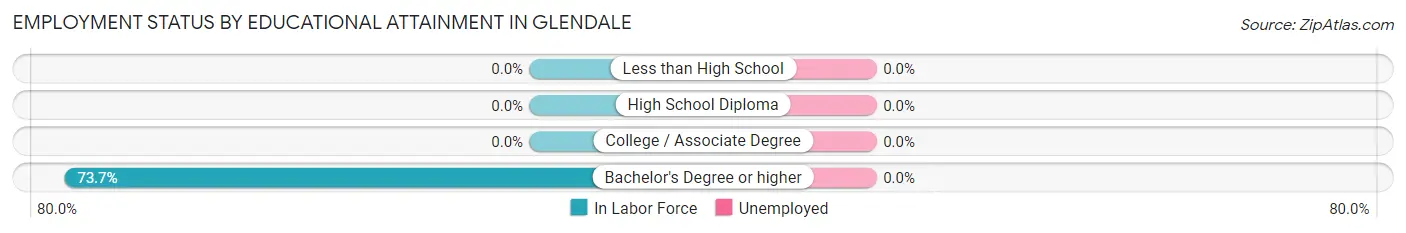
| Educational Attainment | In Labor Force | Unemployed |
| Less than High School | 0 (0.0%) | 0 (0.0%) |
| High School Diploma | 0 (0.0%) | 0 (0.0%) |
| College / Associate Degree | 0 (0.0%) | 0 (0.0%) |
| Bachelor's Degree or higher | 14 (73.7%) | 0 (0.0%) |
| Total | 14 (73.7%) | 0 (0.0%) |
Employment Occupations by Sex in Glendale
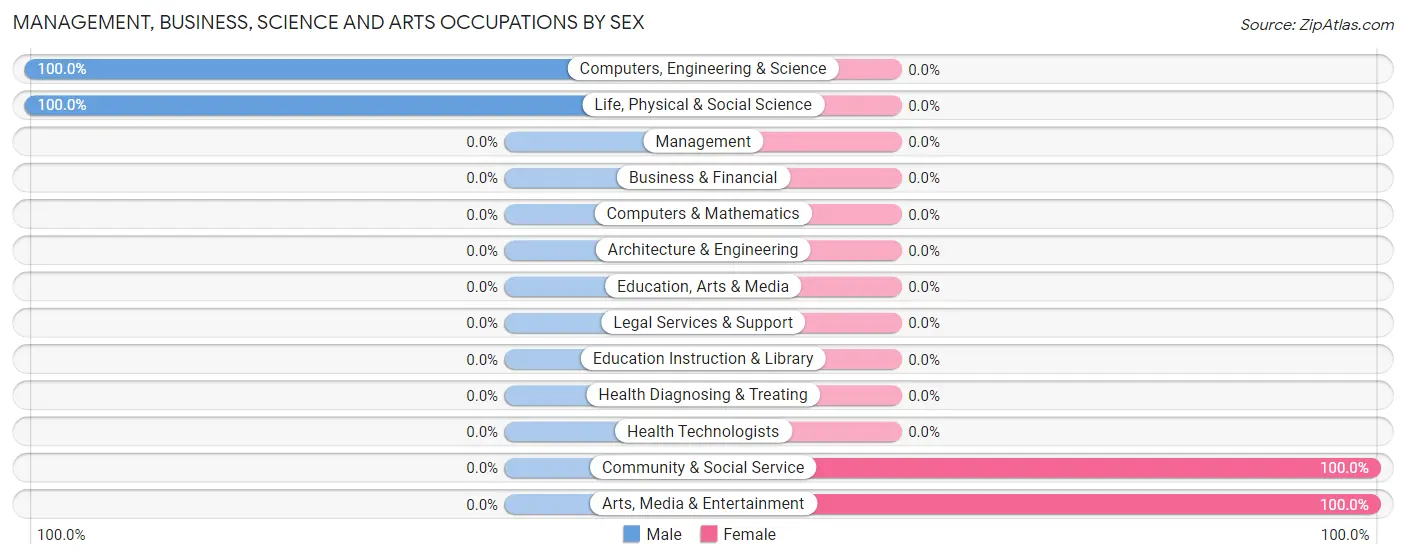
Management, Business, Science and Arts Occupations
The most common Management, Business, Science and Arts occupations in Glendale are Community & Social Service (8 | 57.1%), Arts, Media & Entertainment (8 | 57.1%), Computers, Engineering & Science (6 | 42.9%), and Life, Physical & Social Science (6 | 42.9%).
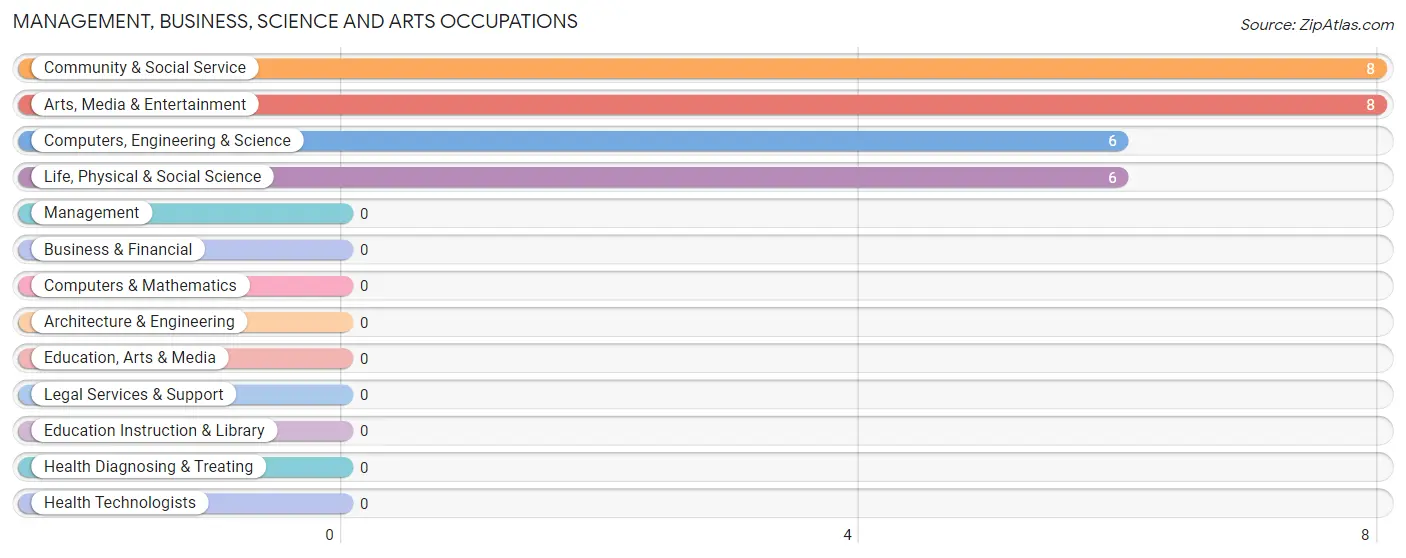
Management, Business, Science and Arts Occupations by Sex
Within the Management, Business, Science and Arts occupations in Glendale, the most male-oriented occupations are Computers, Engineering & Science (100.0%), and Life, Physical & Social Science (100.0%), while the most female-oriented occupations are Community & Social Service (100.0%), and Arts, Media & Entertainment (100.0%).
| Occupation | Male | Female |
| Management | 0 (0.0%) | 0 (0.0%) |
| Business & Financial | 0 (0.0%) | 0 (0.0%) |
| Computers, Engineering & Science | 6 (100.0%) | 0 (0.0%) |
| Computers & Mathematics | 0 (0.0%) | 0 (0.0%) |
| Architecture & Engineering | 0 (0.0%) | 0 (0.0%) |
| Life, Physical & Social Science | 6 (100.0%) | 0 (0.0%) |
| Community & Social Service | 0 (0.0%) | 8 (100.0%) |
| Education, Arts & Media | 0 (0.0%) | 0 (0.0%) |
| Legal Services & Support | 0 (0.0%) | 0 (0.0%) |
| Education Instruction & Library | 0 (0.0%) | 0 (0.0%) |
| Arts, Media & Entertainment | 0 (0.0%) | 8 (100.0%) |
| Health Diagnosing & Treating | 0 (0.0%) | 0 (0.0%) |
| Health Technologists | 0 (0.0%) | 0 (0.0%) |
| Total (Category) | 6 (42.9%) | 8 (57.1%) |
| Total (Overall) | 6 (42.9%) | 8 (57.1%) |
Services Occupations
Services Occupations by Sex
| Occupation | Male | Female |
| Healthcare Support | 0 (0.0%) | 0 (0.0%) |
| Security & Protection | 0 (0.0%) | 0 (0.0%) |
| Firefighting & Prevention | 0 (0.0%) | 0 (0.0%) |
| Law Enforcement | 0 (0.0%) | 0 (0.0%) |
| Food Preparation & Serving | 0 (0.0%) | 0 (0.0%) |
| Cleaning & Maintenance | 0 (0.0%) | 0 (0.0%) |
| Personal Care & Service | 0 (0.0%) | 0 (0.0%) |
| Total (Category) | 0 (0.0%) | 0 (0.0%) |
| Total (Overall) | 6 (42.9%) | 8 (57.1%) |
Sales and Office Occupations
Sales and Office Occupations by Sex
| Occupation | Male | Female |
| Sales & Related | 0 (0.0%) | 0 (0.0%) |
| Office & Administration | 0 (0.0%) | 0 (0.0%) |
| Total (Category) | 0 (0.0%) | 0 (0.0%) |
| Total (Overall) | 6 (42.9%) | 8 (57.1%) |
Natural Resources, Construction and Maintenance Occupations
Natural Resources, Construction and Maintenance Occupations by Sex
| Occupation | Male | Female |
| Farming, Fishing & Forestry | 0 (0.0%) | 0 (0.0%) |
| Construction & Extraction | 0 (0.0%) | 0 (0.0%) |
| Installation, Maintenance & Repair | 0 (0.0%) | 0 (0.0%) |
| Total (Category) | 0 (0.0%) | 0 (0.0%) |
| Total (Overall) | 6 (42.9%) | 8 (57.1%) |
Production, Transportation and Moving Occupations
Production, Transportation and Moving Occupations by Sex
| Occupation | Male | Female |
| Production | 0 (0.0%) | 0 (0.0%) |
| Transportation | 0 (0.0%) | 0 (0.0%) |
| Material Moving | 0 (0.0%) | 0 (0.0%) |
| Total (Category) | 0 (0.0%) | 0 (0.0%) |
| Total (Overall) | 6 (42.9%) | 8 (57.1%) |
Employment Industries by Sex in Glendale
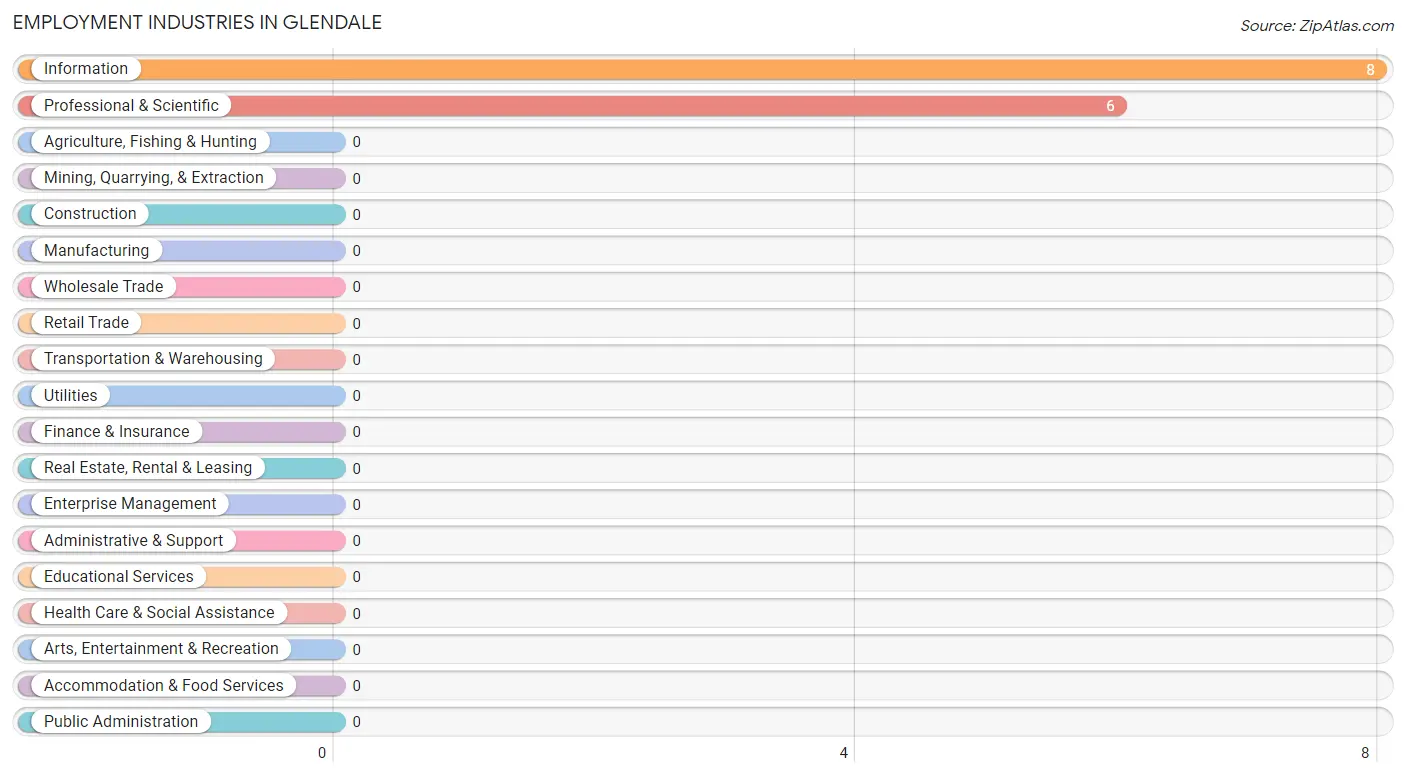
Employment Industries in Glendale
The major employment industries in Glendale include Information (8 | 57.1%), and Professional & Scientific (6 | 42.9%).
Employment Industries by Sex in Glendale
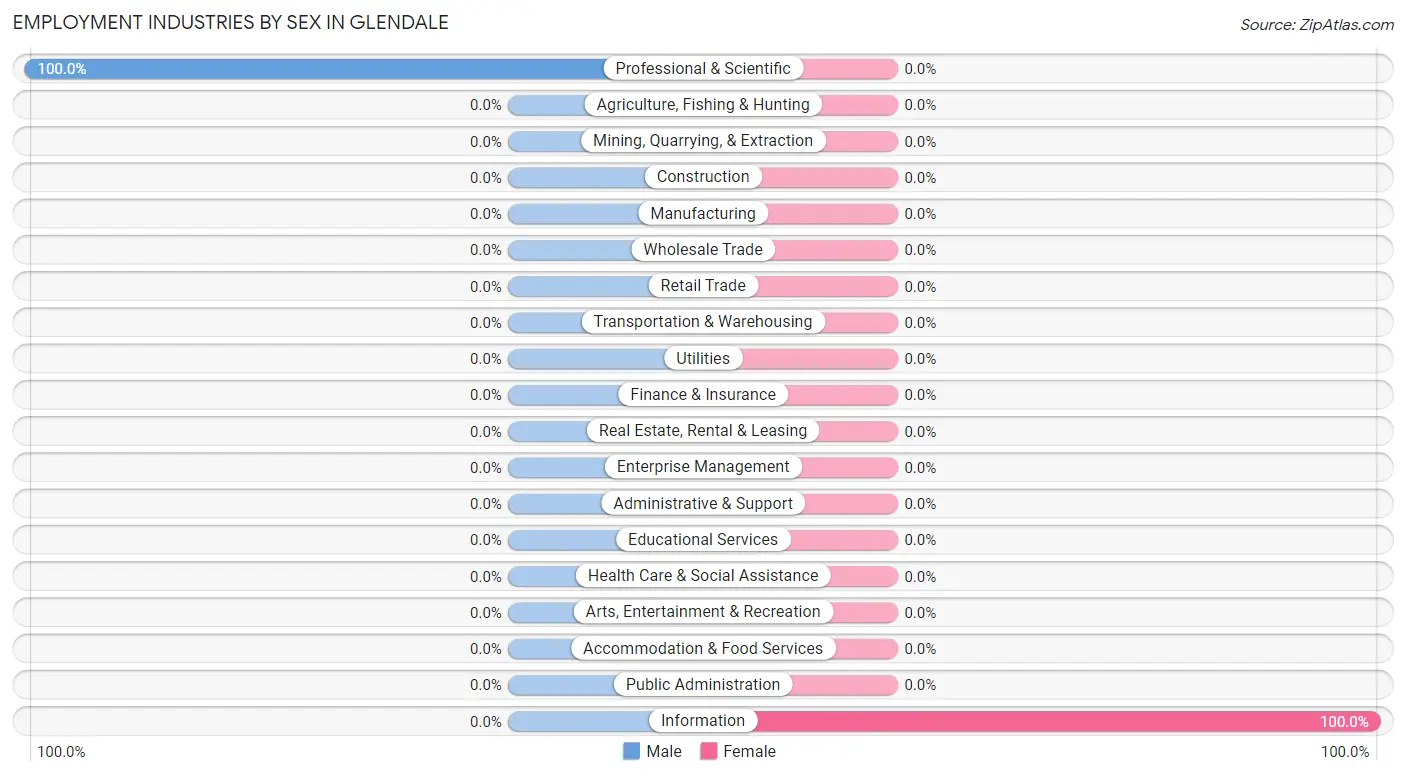
| Industry | Male | Female |
| Agriculture, Fishing & Hunting | 0 (0.0%) | 0 (0.0%) |
| Mining, Quarrying, & Extraction | 0 (0.0%) | 0 (0.0%) |
| Construction | 0 (0.0%) | 0 (0.0%) |
| Manufacturing | 0 (0.0%) | 0 (0.0%) |
| Wholesale Trade | 0 (0.0%) | 0 (0.0%) |
| Retail Trade | 0 (0.0%) | 0 (0.0%) |
| Transportation & Warehousing | 0 (0.0%) | 0 (0.0%) |
| Utilities | 0 (0.0%) | 0 (0.0%) |
| Information | 0 (0.0%) | 8 (100.0%) |
| Finance & Insurance | 0 (0.0%) | 0 (0.0%) |
| Real Estate, Rental & Leasing | 0 (0.0%) | 0 (0.0%) |
| Professional & Scientific | 6 (100.0%) | 0 (0.0%) |
| Enterprise Management | 0 (0.0%) | 0 (0.0%) |
| Administrative & Support | 0 (0.0%) | 0 (0.0%) |
| Educational Services | 0 (0.0%) | 0 (0.0%) |
| Health Care & Social Assistance | 0 (0.0%) | 0 (0.0%) |
| Arts, Entertainment & Recreation | 0 (0.0%) | 0 (0.0%) |
| Accommodation & Food Services | 0 (0.0%) | 0 (0.0%) |
| Public Administration | 0 (0.0%) | 0 (0.0%) |
| Total | 6 (42.9%) | 8 (57.1%) |
Education in Glendale
School Enrollment in Glendale
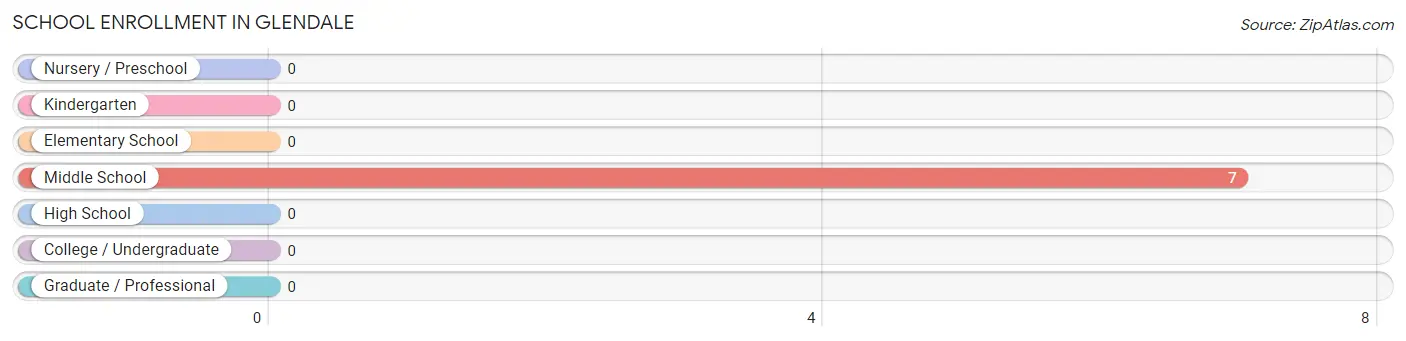
| School Level | # Students | % Students |
| Nursery / Preschool | 0 | 0.0% |
| Kindergarten | 0 | 0.0% |
| Elementary School | 0 | 0.0% |
| Middle School | 7 | 100.0% |
| High School | 0 | 0.0% |
| College / Undergraduate | 0 | 0.0% |
| Graduate / Professional | 0 | 0.0% |
| Total | 7 | 100.0% |
School Enrollment by Age by Funding Source in Glendale
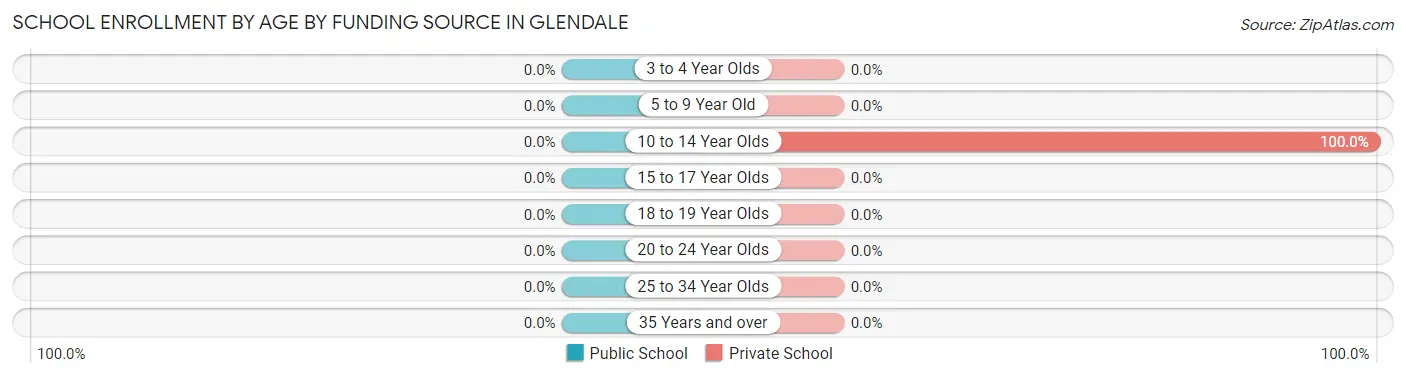
| Age Bracket | Public School | Private School |
| 3 to 4 Year Olds | 0 (0.0%) | 0 (0.0%) |
| 5 to 9 Year Old | 0 (0.0%) | 0 (0.0%) |
| 10 to 14 Year Olds | 0 (0.0%) | 7 (100.0%) |
| 15 to 17 Year Olds | 0 (0.0%) | 0 (0.0%) |
| 18 to 19 Year Olds | 0 (0.0%) | 0 (0.0%) |
| 20 to 24 Year Olds | 0 (0.0%) | 0 (0.0%) |
| 25 to 34 Year Olds | 0 (0.0%) | 0 (0.0%) |
| 35 Years and over | 0 (0.0%) | 0 (0.0%) |
| Total | 0 (0.0%) | 7 (100.0%) |
Educational Attainment by Field of Study in Glendale
Psychology (47 | 45.6%), liberal arts & history (42 | 40.8%), literature & languages (8 | 7.8%), and physical & health sciences (6 | 5.8%) are the most common fields of study among 103 individuals in Glendale who have obtained a bachelor's degree or higher.
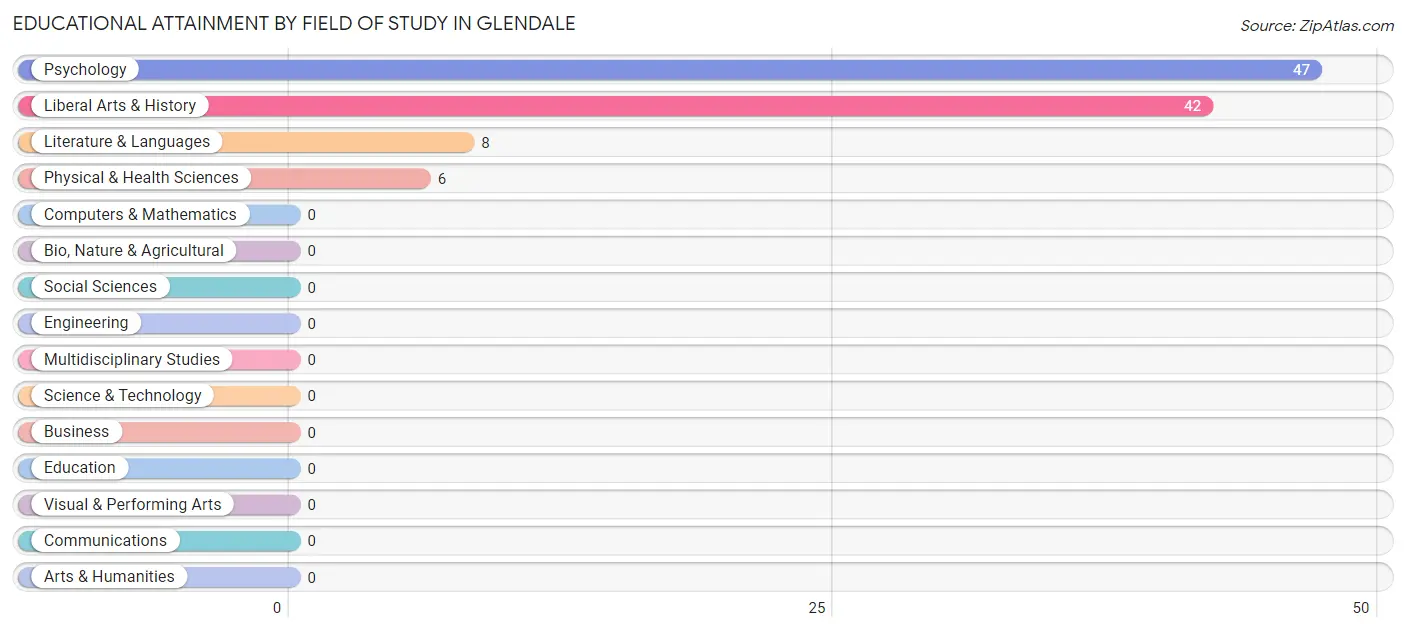
| Field of Study | # Graduates | % Graduates |
| Computers & Mathematics | 0 | 0.0% |
| Bio, Nature & Agricultural | 0 | 0.0% |
| Physical & Health Sciences | 6 | 5.8% |
| Psychology | 47 | 45.6% |
| Social Sciences | 0 | 0.0% |
| Engineering | 0 | 0.0% |
| Multidisciplinary Studies | 0 | 0.0% |
| Science & Technology | 0 | 0.0% |
| Business | 0 | 0.0% |
| Education | 0 | 0.0% |
| Literature & Languages | 8 | 7.8% |
| Liberal Arts & History | 42 | 40.8% |
| Visual & Performing Arts | 0 | 0.0% |
| Communications | 0 | 0.0% |
| Arts & Humanities | 0 | 0.0% |
| Total | 103 | 100.0% |
Transportation & Commute in Glendale
Vehicle Availability by Sex in Glendale
The most prevalent vehicle ownership categories in Glendale are males with 3 vehicles (6, accounting for 100.0%) and females with 3 vehicles (8, making up 75.0%).
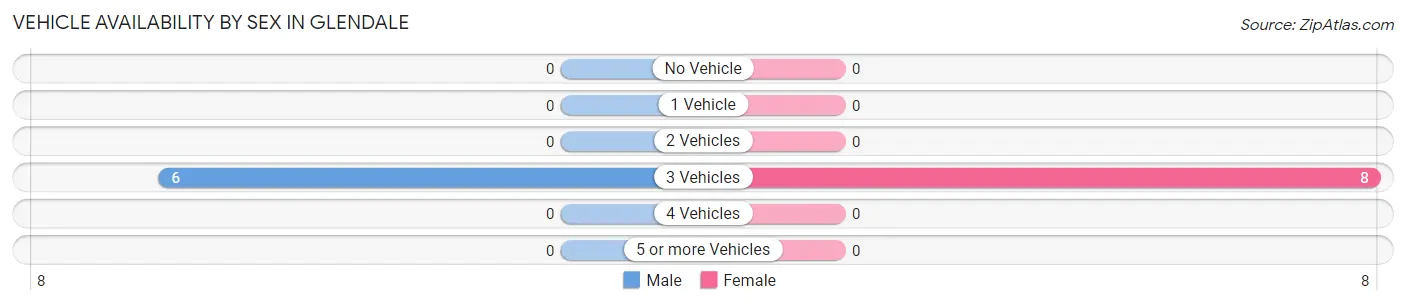
| Vehicles Available | Male | Female |
| No Vehicle | 0 (0.0%) | 0 (0.0%) |
| 1 Vehicle | 0 (0.0%) | 0 (0.0%) |
| 2 Vehicles | 0 (0.0%) | 0 (0.0%) |
| 3 Vehicles | 6 (100.0%) | 8 (100.0%) |
| 4 Vehicles | 0 (0.0%) | 0 (0.0%) |
| 5 or more Vehicles | 0 (0.0%) | 0 (0.0%) |
| Total | 6 (100.0%) | 8 (100.0%) |
Commute Time in Glendale
The most frequently occuring commute durations in Glendale are 30 to 34 minutes (6 commuters, 100.0%), less than 5 minutes (0 commuters, 0.0%), and 5 to 9 minutes (0 commuters, 0.0%).
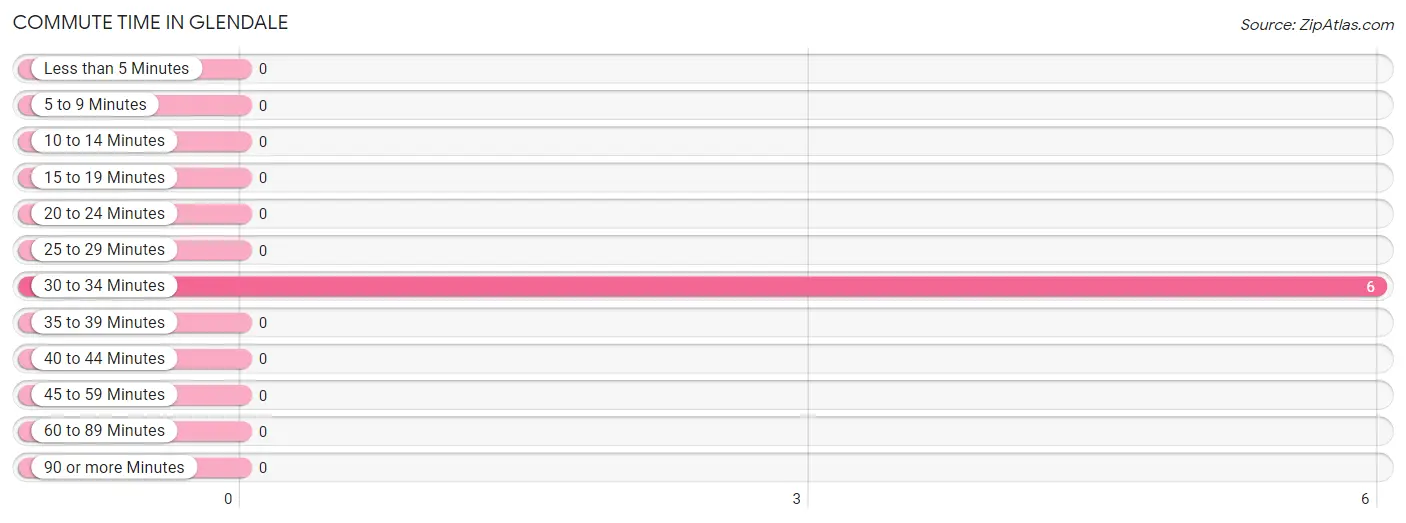
| Commute Time | # Commuters | % Commuters |
| Less than 5 Minutes | 0 | 0.0% |
| 5 to 9 Minutes | 0 | 0.0% |
| 10 to 14 Minutes | 0 | 0.0% |
| 15 to 19 Minutes | 0 | 0.0% |
| 20 to 24 Minutes | 0 | 0.0% |
| 25 to 29 Minutes | 0 | 0.0% |
| 30 to 34 Minutes | 6 | 100.0% |
| 35 to 39 Minutes | 0 | 0.0% |
| 40 to 44 Minutes | 0 | 0.0% |
| 45 to 59 Minutes | 0 | 0.0% |
| 60 to 89 Minutes | 0 | 0.0% |
| 90 or more Minutes | 0 | 0.0% |
Commute Time by Sex in Glendale
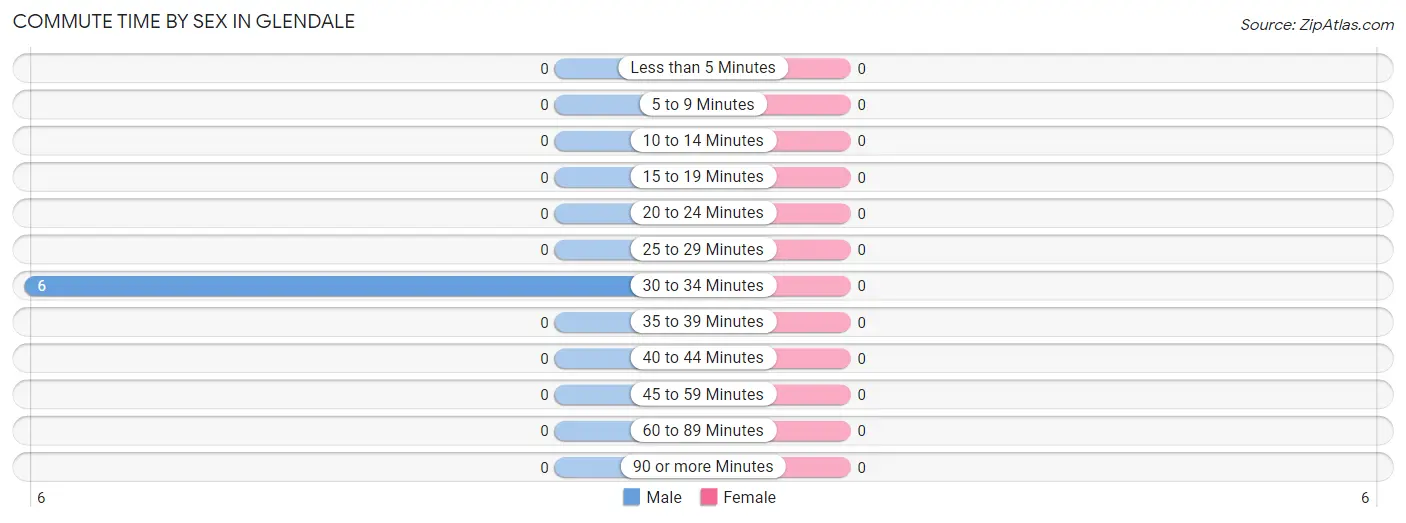
| Commute Time | Male | Female |
| Less than 5 Minutes | 0 (0.0%) | 0 (0.0%) |
| 5 to 9 Minutes | 0 (0.0%) | 0 (0.0%) |
| 10 to 14 Minutes | 0 (0.0%) | 0 (0.0%) |
| 15 to 19 Minutes | 0 (0.0%) | 0 (0.0%) |
| 20 to 24 Minutes | 0 (0.0%) | 0 (0.0%) |
| 25 to 29 Minutes | 0 (0.0%) | 0 (0.0%) |
| 30 to 34 Minutes | 6 (100.0%) | 0 (0.0%) |
| 35 to 39 Minutes | 0 (0.0%) | 0 (0.0%) |
| 40 to 44 Minutes | 0 (0.0%) | 0 (0.0%) |
| 45 to 59 Minutes | 0 (0.0%) | 0 (0.0%) |
| 60 to 89 Minutes | 0 (0.0%) | 0 (0.0%) |
| 90 or more Minutes | 0 (0.0%) | 0 (0.0%) |
Time of Departure to Work by Sex in Glendale
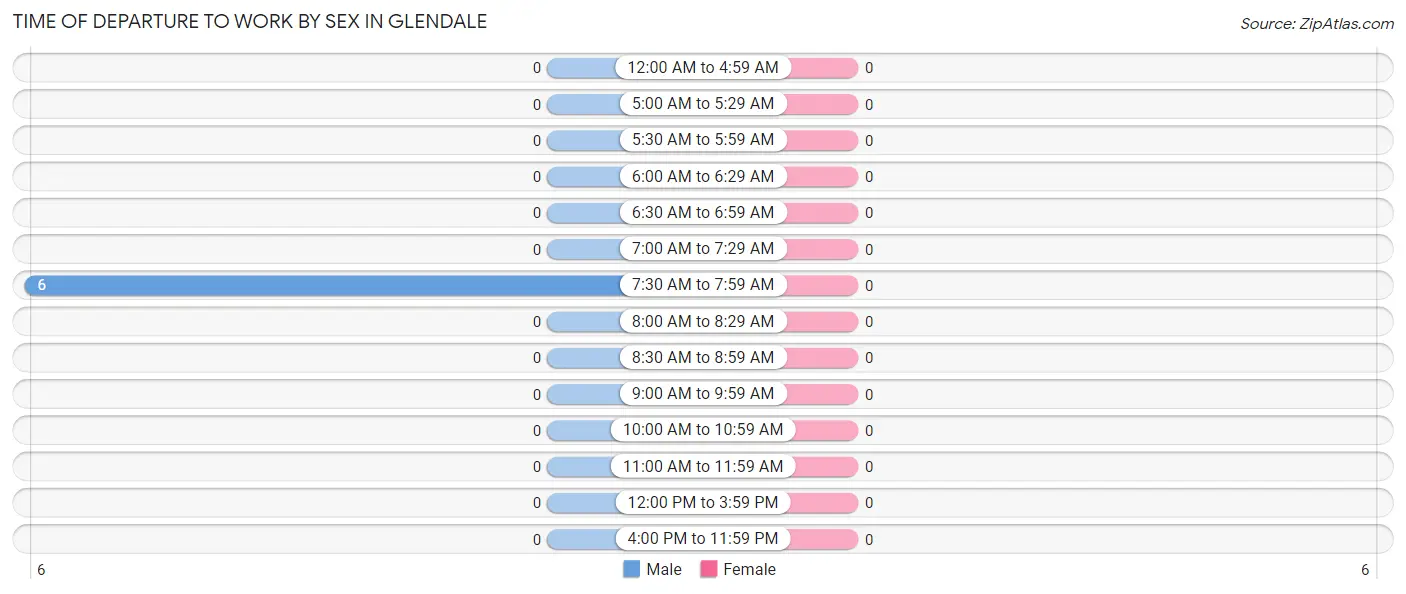
| Time of Departure | Male | Female |
| 12:00 AM to 4:59 AM | 0 (0.0%) | 0 (0.0%) |
| 5:00 AM to 5:29 AM | 0 (0.0%) | 0 (0.0%) |
| 5:30 AM to 5:59 AM | 0 (0.0%) | 0 (0.0%) |
| 6:00 AM to 6:29 AM | 0 (0.0%) | 0 (0.0%) |
| 6:30 AM to 6:59 AM | 0 (0.0%) | 0 (0.0%) |
| 7:00 AM to 7:29 AM | 0 (0.0%) | 0 (0.0%) |
| 7:30 AM to 7:59 AM | 6 (100.0%) | 0 (0.0%) |
| 8:00 AM to 8:29 AM | 0 (0.0%) | 0 (0.0%) |
| 8:30 AM to 8:59 AM | 0 (0.0%) | 0 (0.0%) |
| 9:00 AM to 9:59 AM | 0 (0.0%) | 0 (0.0%) |
| 10:00 AM to 10:59 AM | 0 (0.0%) | 0 (0.0%) |
| 11:00 AM to 11:59 AM | 0 (0.0%) | 0 (0.0%) |
| 12:00 PM to 3:59 PM | 0 (0.0%) | 0 (0.0%) |
| 4:00 PM to 11:59 PM | 0 (0.0%) | 0 (0.0%) |
| Total | 6 (100.0%) | 0 (0.0%) |
Housing Occupancy in Glendale
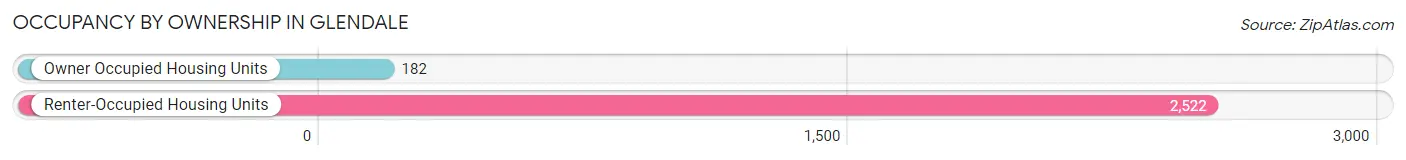
Occupancy by Ownership in Glendale
Of the total 2,704 dwellings in Glendale, owner-occupied units account for 182 (6.7%), while renter-occupied units make up 2,522 (93.3%).
| Occupancy | # Housing Units | % Housing Units |
| Owner Occupied Housing Units | 182 | 6.7% |
| Renter-Occupied Housing Units | 2,522 | 93.3% |
| Total Occupied Housing Units | 2,704 | 100.0% |
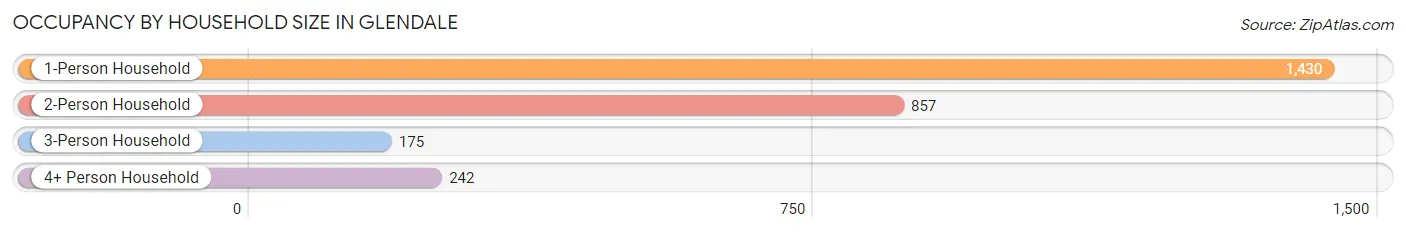
Occupancy by Household Size in Glendale
| Household Size | # Housing Units | % Housing Units |
| 1-Person Household | 1,430 | 52.9% |
| 2-Person Household | 857 | 31.7% |
| 3-Person Household | 175 | 6.5% |
| 4+ Person Household | 242 | 8.9% |
| Total Housing Units | 2,704 | 100.0% |
Occupancy by Ownership by Household Size in Glendale
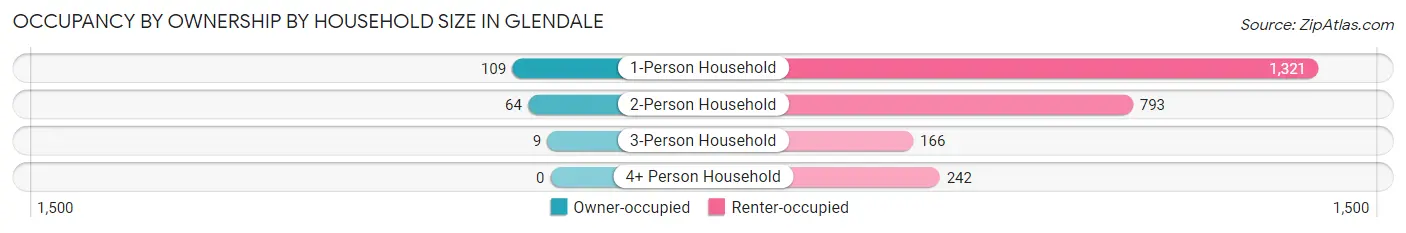
| Household Size | Owner-occupied | Renter-occupied |
| 1-Person Household | 109 (7.6%) | 1,321 (92.4%) |
| 2-Person Household | 64 (7.5%) | 793 (92.5%) |
| 3-Person Household | 9 (5.1%) | 166 (94.9%) |
| 4+ Person Household | 0 (0.0%) | 242 (100.0%) |
| Total Housing Units | 182 (6.7%) | 2,522 (93.3%) |
Occupancy by Educational Attainment in Glendale
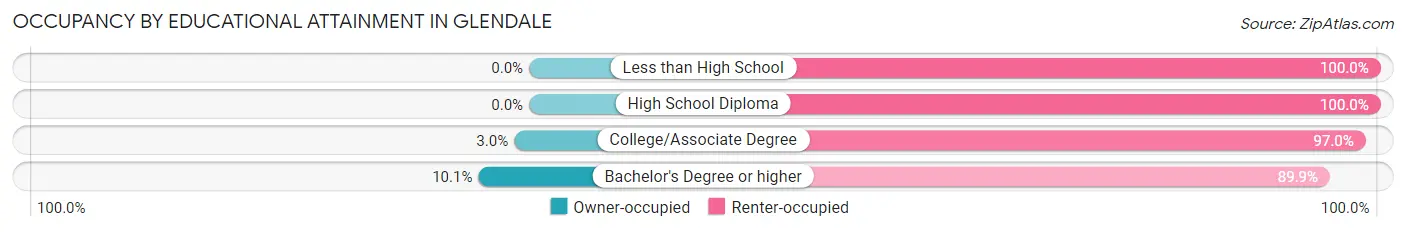
| Household Size | Owner-occupied | Renter-occupied |
| Less than High School | 0 (0.0%) | 82 (100.0%) |
| High School Diploma | 0 (0.0%) | 314 (100.0%) |
| College/Associate Degree | 21 (3.0%) | 686 (97.0%) |
| Bachelor's Degree or higher | 161 (10.1%) | 1,440 (89.9%) |
Occupancy by Age of Householder in Glendale
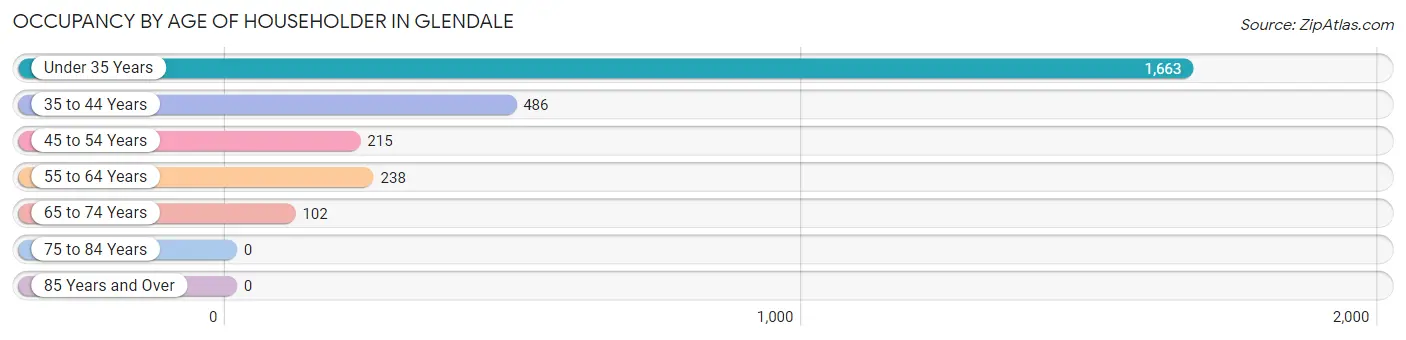
| Age Bracket | # Households | % Households |
| Under 35 Years | 1,663 | 61.5% |
| 35 to 44 Years | 486 | 18.0% |
| 45 to 54 Years | 215 | 8.0% |
| 55 to 64 Years | 238 | 8.8% |
| 65 to 74 Years | 102 | 3.8% |
| 75 to 84 Years | 0 | 0.0% |
| 85 Years and Over | 0 | 0.0% |
| Total | 2,704 | 100.0% |
Housing Finances in Glendale
Median Income by Occupancy in Glendale
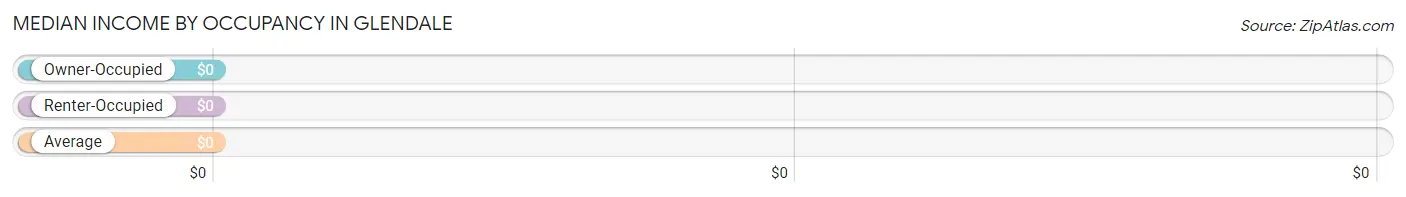
| Occupancy Type | # Households | Median Income |
| Owner-Occupied | 55 (100.0%) | $0 |
| Renter-Occupied | 0 (0.0%) | $0 |
| Average | 55 (100.0%) | $0 |
Occupancy by Householder Income Bracket in Glendale
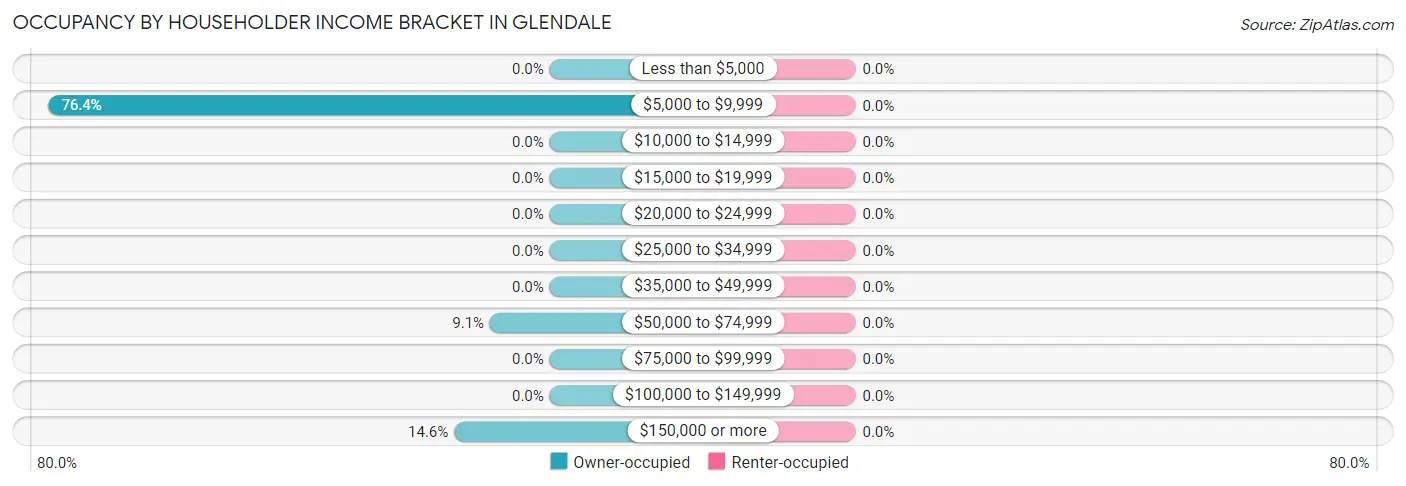
| Income Bracket | Owner-occupied | Renter-occupied |
| Less than $5,000 | 0 (0.0%) | 0 (0.0%) |
| $5,000 to $9,999 | 42 (76.4%) | 0 (0.0%) |
| $10,000 to $14,999 | 0 (0.0%) | 0 (0.0%) |
| $15,000 to $19,999 | 0 (0.0%) | 0 (0.0%) |
| $20,000 to $24,999 | 0 (0.0%) | 0 (0.0%) |
| $25,000 to $34,999 | 0 (0.0%) | 0 (0.0%) |
| $35,000 to $49,999 | 0 (0.0%) | 0 (0.0%) |
| $50,000 to $74,999 | 5 (9.1%) | 0 (0.0%) |
| $75,000 to $99,999 | 0 (0.0%) | 0 (0.0%) |
| $100,000 to $149,999 | 0 (0.0%) | 0 (0.0%) |
| $150,000 or more | 8 (14.5%) | 0 (0.0%) |
| Total | 55 (100.0%) | 0 (0.0%) |
Monthly Housing Cost Tiers in Glendale
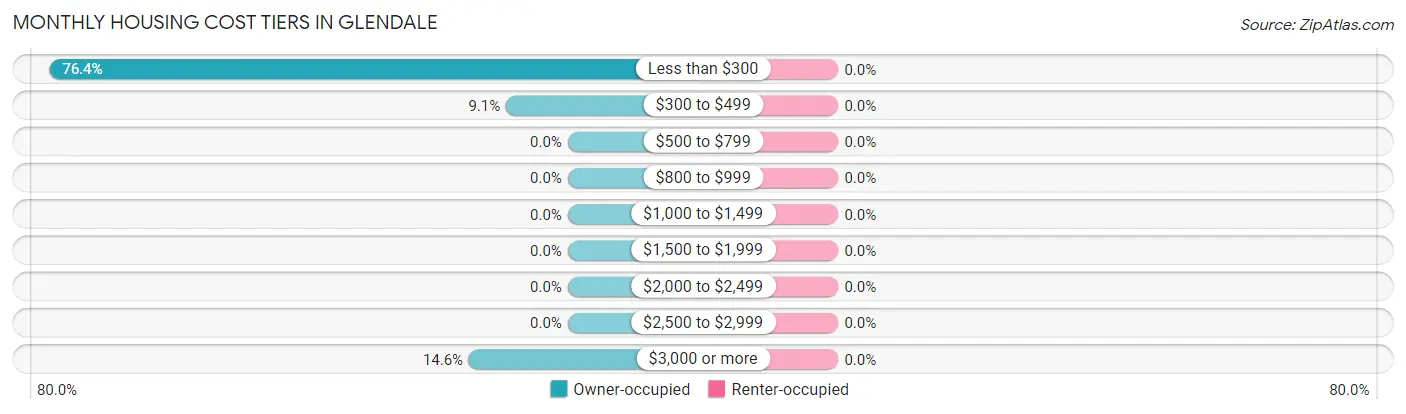
| Monthly Cost | Owner-occupied | Renter-occupied |
| Less than $300 | 42 (76.4%) | 0 (0.0%) |
| $300 to $499 | 5 (9.1%) | 0 (0.0%) |
| $500 to $799 | 0 (0.0%) | 0 (0.0%) |
| $800 to $999 | 0 (0.0%) | 0 (0.0%) |
| $1,000 to $1,499 | 0 (0.0%) | 0 (0.0%) |
| $1,500 to $1,999 | 0 (0.0%) | 0 (0.0%) |
| $2,000 to $2,499 | 0 (0.0%) | 0 (0.0%) |
| $2,500 to $2,999 | 0 (0.0%) | 0 (0.0%) |
| $3,000 or more | 8 (14.5%) | 0 (0.0%) |
| Total | 55 (100.0%) | 0 (0.0%) |
Physical Housing Characteristics in Glendale
Housing Structures in Glendale
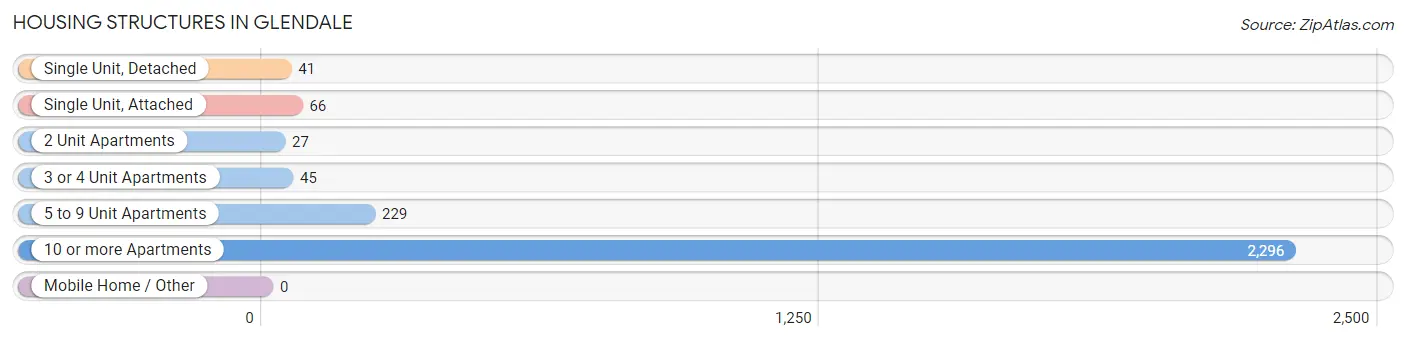
| Structure Type | # Housing Units | % Housing Units |
| Single Unit, Detached | 41 | 1.5% |
| Single Unit, Attached | 66 | 2.4% |
| 2 Unit Apartments | 27 | 1.0% |
| 3 or 4 Unit Apartments | 45 | 1.7% |
| 5 to 9 Unit Apartments | 229 | 8.5% |
| 10 or more Apartments | 2,296 | 84.9% |
| Mobile Home / Other | 0 | 0.0% |
| Total | 2,704 | 100.0% |
Housing Structures by Occupancy in Glendale
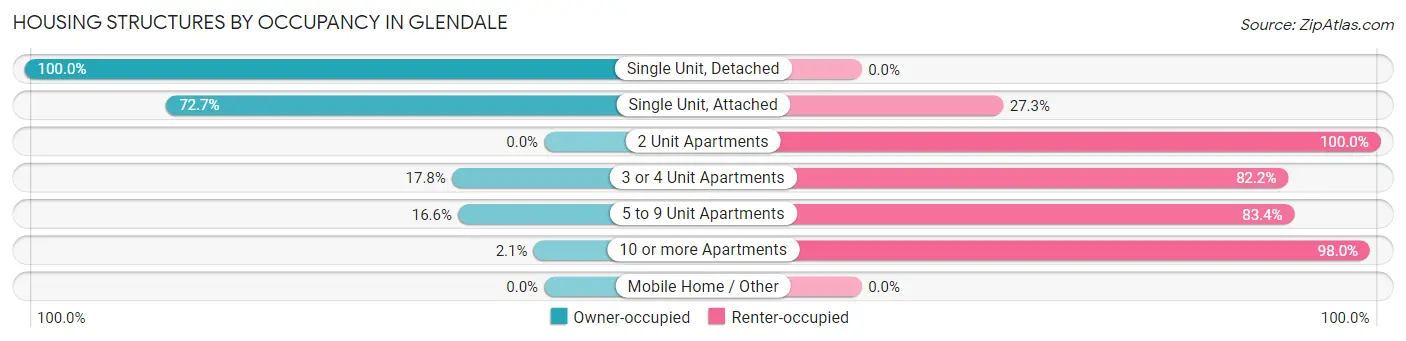
| Structure Type | Owner-occupied | Renter-occupied |
| Single Unit, Detached | 41 (100.0%) | 0 (0.0%) |
| Single Unit, Attached | 48 (72.7%) | 18 (27.3%) |
| 2 Unit Apartments | 0 (0.0%) | 27 (100.0%) |
| 3 or 4 Unit Apartments | 8 (17.8%) | 37 (82.2%) |
| 5 to 9 Unit Apartments | 38 (16.6%) | 191 (83.4%) |
| 10 or more Apartments | 47 (2.1%) | 2,249 (98.0%) |
| Mobile Home / Other | 0 (0.0%) | 0 (0.0%) |
| Total | 182 (6.7%) | 2,522 (93.3%) |
Housing Structures by Number of Rooms in Glendale
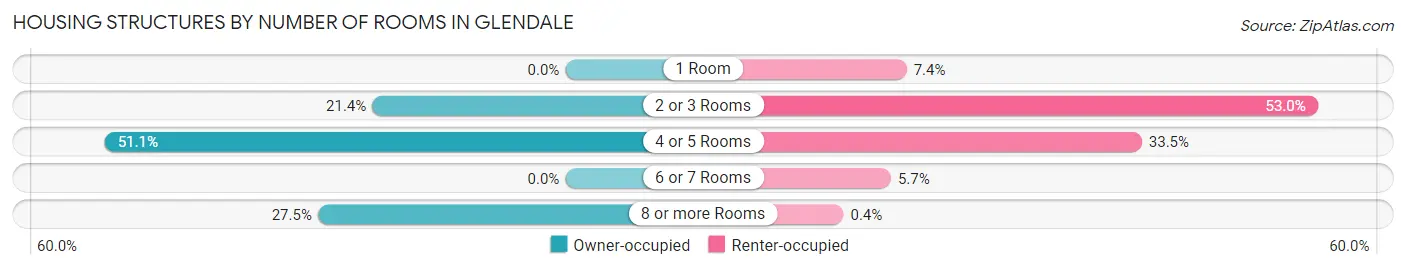
| Number of Rooms | Owner-occupied | Renter-occupied |
| 1 Room | 0 (0.0%) | 187 (7.4%) |
| 2 or 3 Rooms | 39 (21.4%) | 1,337 (53.0%) |
| 4 or 5 Rooms | 93 (51.1%) | 845 (33.5%) |
| 6 or 7 Rooms | 0 (0.0%) | 143 (5.7%) |
| 8 or more Rooms | 50 (27.5%) | 10 (0.4%) |
| Total | 182 (100.0%) | 2,522 (100.0%) |
Housing Structure by Heating Type in Glendale
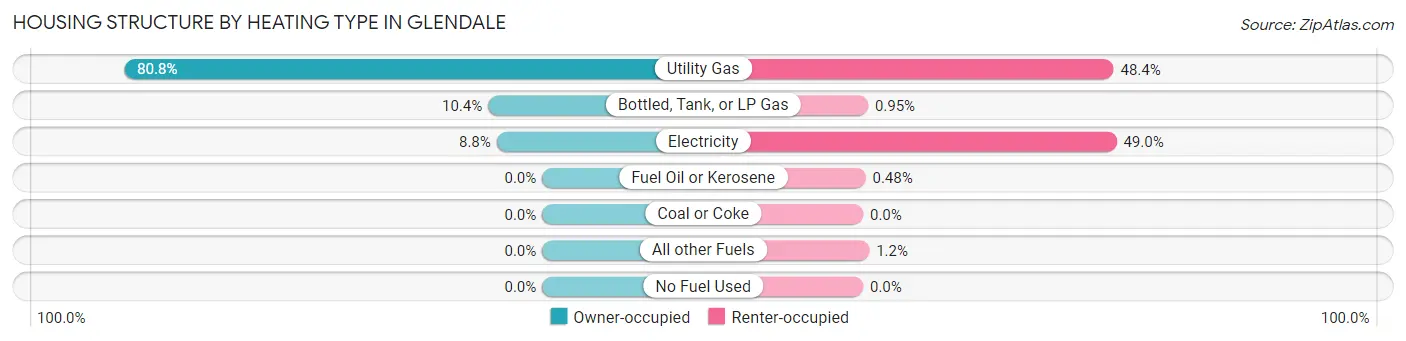
| Heating Type | Owner-occupied | Renter-occupied |
| Utility Gas | 147 (80.8%) | 1,221 (48.4%) |
| Bottled, Tank, or LP Gas | 19 (10.4%) | 24 (0.9%) |
| Electricity | 16 (8.8%) | 1,235 (49.0%) |
| Fuel Oil or Kerosene | 0 (0.0%) | 12 (0.5%) |
| Coal or Coke | 0 (0.0%) | 0 (0.0%) |
| All other Fuels | 0 (0.0%) | 30 (1.2%) |
| No Fuel Used | 0 (0.0%) | 0 (0.0%) |
| Total | 182 (100.0%) | 2,522 (100.0%) |
Household Vehicle Usage in Glendale
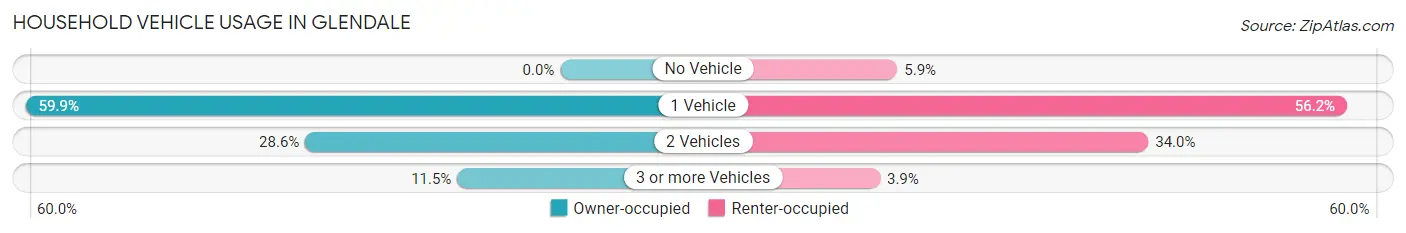
| Vehicles per Household | Owner-occupied | Renter-occupied |
| No Vehicle | 0 (0.0%) | 148 (5.9%) |
| 1 Vehicle | 109 (59.9%) | 1,418 (56.2%) |
| 2 Vehicles | 52 (28.6%) | 857 (34.0%) |
| 3 or more Vehicles | 21 (11.5%) | 99 (3.9%) |
| Total | 182 (100.0%) | 2,522 (100.0%) |
Real Estate & Mortgages in Glendale
Real Estate and Mortgage Overview in Glendale
| Characteristic | Without Mortgage | With Mortgage |
| Housing Units | 47 | 8 |
| Median Property Value | - | - |
| Median Household Income | - | - |
| Monthly Housing Costs | - | - |
| Real Estate Taxes | - | - |
Property Value by Mortgage Status in Glendale
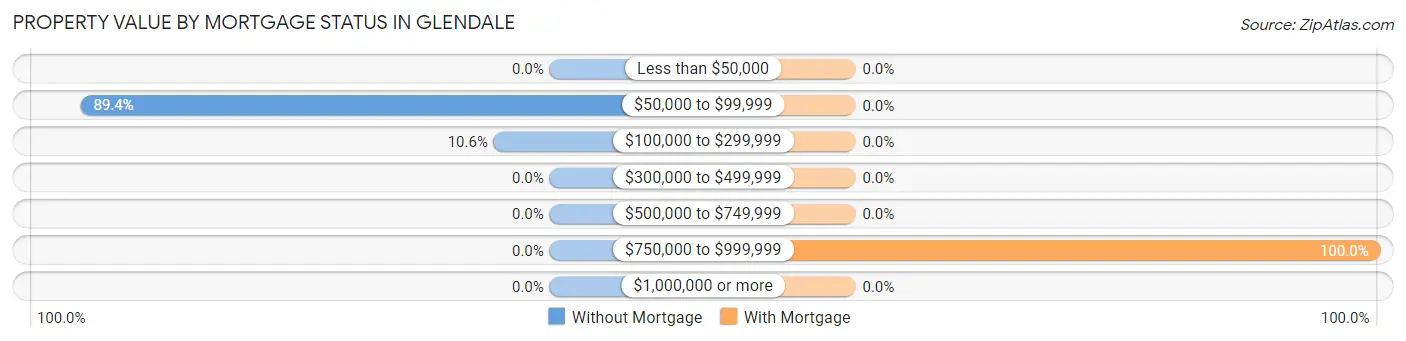
| Property Value | Without Mortgage | With Mortgage |
| Less than $50,000 | 0 (0.0%) | 0 (0.0%) |
| $50,000 to $99,999 | 42 (89.4%) | 0 (0.0%) |
| $100,000 to $299,999 | 5 (10.6%) | 0 (0.0%) |
| $300,000 to $499,999 | 0 (0.0%) | 0 (0.0%) |
| $500,000 to $749,999 | 0 (0.0%) | 0 (0.0%) |
| $750,000 to $999,999 | 0 (0.0%) | 8 (100.0%) |
| $1,000,000 or more | 0 (0.0%) | 0 (0.0%) |
| Total | 47 (100.0%) | 8 (100.0%) |
Household Income by Mortgage Status in Glendale
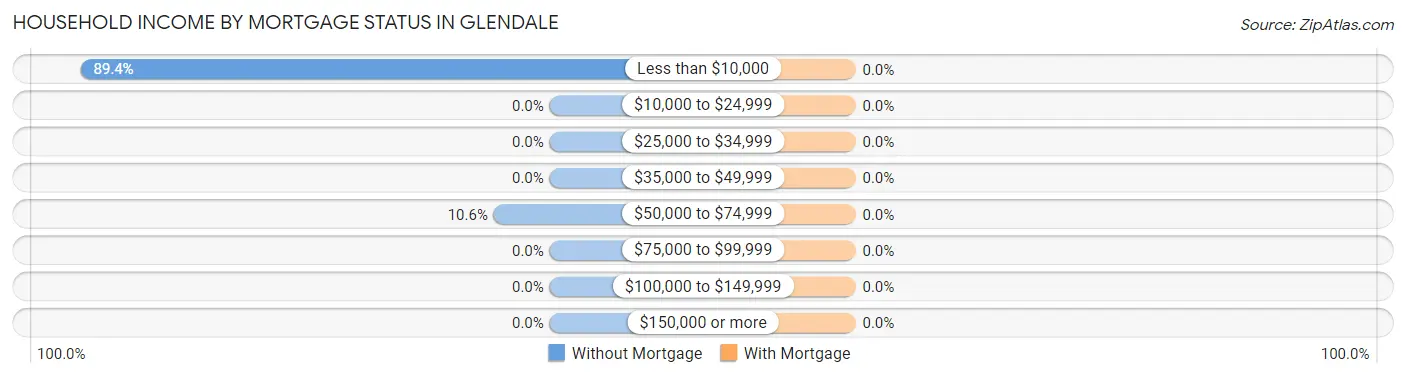
| Household Income | Without Mortgage | With Mortgage |
| Less than $10,000 | 42 (89.4%) | 0 (0.0%) |
| $10,000 to $24,999 | 0 (0.0%) | 0 (0.0%) |
| $25,000 to $34,999 | 0 (0.0%) | 0 (0.0%) |
| $35,000 to $49,999 | 0 (0.0%) | 0 (0.0%) |
| $50,000 to $74,999 | 5 (10.6%) | 0 (0.0%) |
| $75,000 to $99,999 | 0 (0.0%) | 0 (0.0%) |
| $100,000 to $149,999 | 0 (0.0%) | 0 (0.0%) |
| $150,000 or more | 0 (0.0%) | 0 (0.0%) |
| Total | 47 (100.0%) | 8 (100.0%) |
Property Value to Household Income Ratio in Glendale
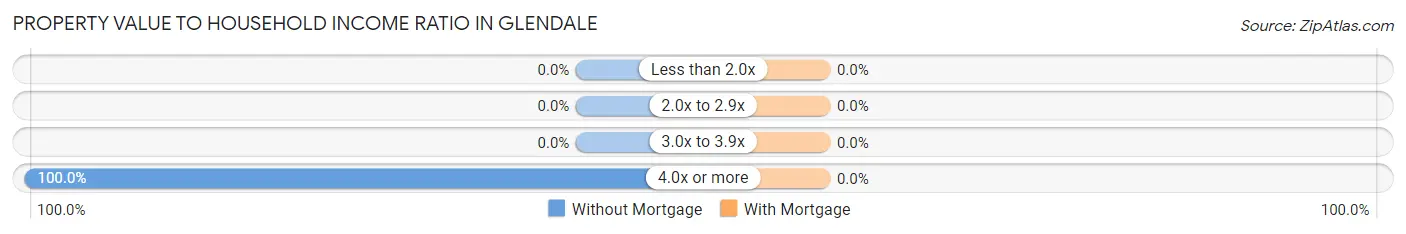
| Value-to-Income Ratio | Without Mortgage | With Mortgage |
| Less than 2.0x | 0 (0.0%) | 0 (0.0%) |
| 2.0x to 2.9x | 0 (0.0%) | 0 (0.0%) |
| 3.0x to 3.9x | 0 (0.0%) | 0 (0.0%) |
| 4.0x or more | 47 (100.0%) | 0 (0.0%) |
| Total | 47 (100.0%) | 8 (100.0%) |
Real Estate Taxes by Mortgage Status in Glendale
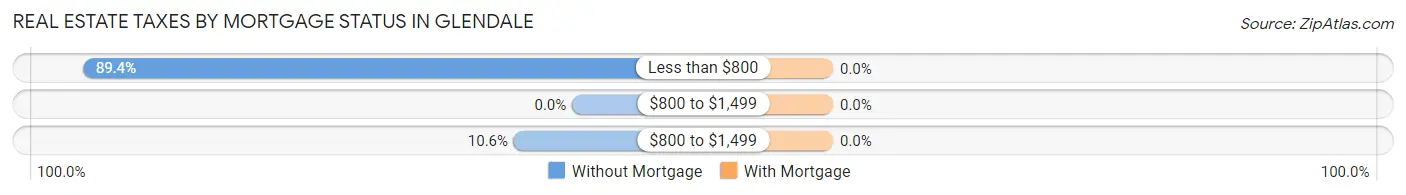
| Property Taxes | Without Mortgage | With Mortgage |
| Less than $800 | 42 (89.4%) | 0 (0.0%) |
| $800 to $1,499 | 0 (0.0%) | 0 (0.0%) |
| $800 to $1,499 | 5 (10.6%) | 0 (0.0%) |
| Total | 47 (100.0%) | 8 (100.0%) |
Health & Disability in Glendale
Health Insurance Coverage by Age in Glendale
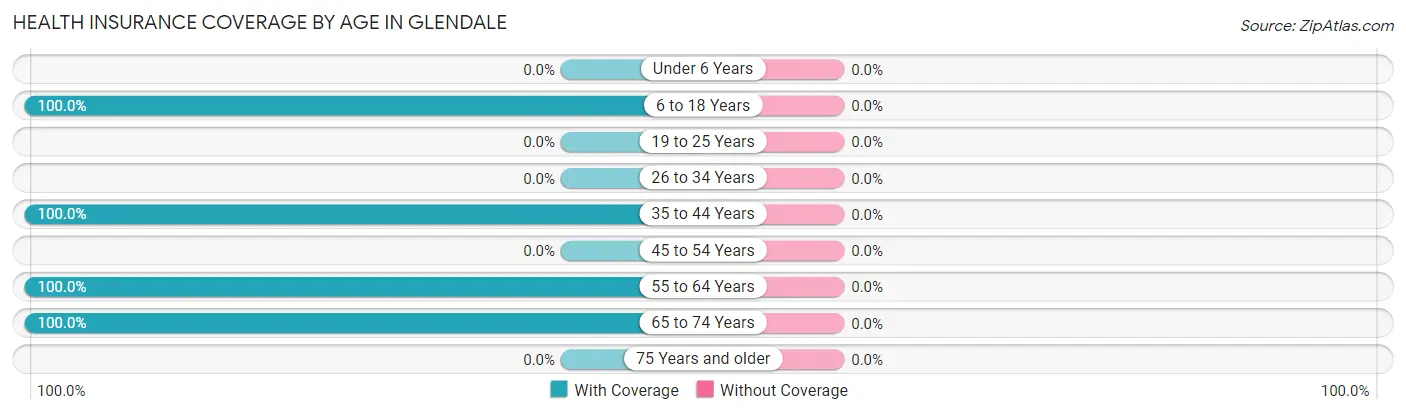
| Age Bracket | With Coverage | Without Coverage |
| Under 6 Years | 0 (0.0%) | 0 (0.0%) |
| 6 to 18 Years | 7 (100.0%) | 0 (0.0%) |
| 19 to 25 Years | 0 (0.0%) | 0 (0.0%) |
| 26 to 34 Years | 0 (0.0%) | 0 (0.0%) |
| 35 to 44 Years | 8 (100.0%) | 0 (0.0%) |
| 45 to 54 Years | 0 (0.0%) | 0 (0.0%) |
| 55 to 64 Years | 11 (100.0%) | 0 (0.0%) |
| 65 to 74 Years | 42 (100.0%) | 0 (0.0%) |
| 75 Years and older | 0 (0.0%) | 0 (0.0%) |
| Total | 68 (100.0%) | 0 (0.0%) |
Health Insurance Coverage by Citizenship Status in Glendale
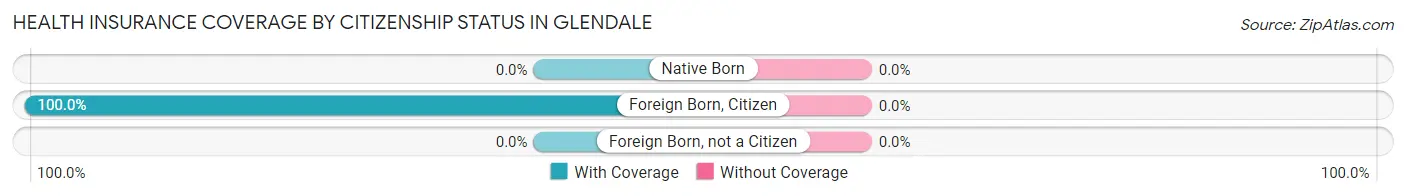
| Citizenship Status | With Coverage | Without Coverage |
| Native Born | 0 (0.0%) | 0 (0.0%) |
| Foreign Born, Citizen | 7 (100.0%) | 0 (0.0%) |
| Foreign Born, not a Citizen | 0 (0.0%) | 0 (0.0%) |
Health Insurance Coverage by Household Income in Glendale
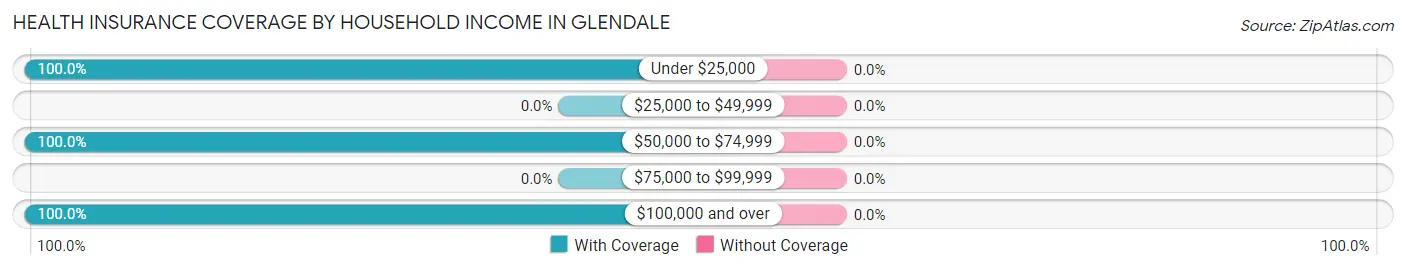
| Household Income | With Coverage | Without Coverage |
| Under $25,000 | 42 (100.0%) | 0 (0.0%) |
| $25,000 to $49,999 | 0 (0.0%) | 0 (0.0%) |
| $50,000 to $74,999 | 5 (100.0%) | 0 (0.0%) |
| $75,000 to $99,999 | 0 (0.0%) | 0 (0.0%) |
| $100,000 and over | 21 (100.0%) | 0 (0.0%) |
Public vs Private Health Insurance Coverage by Age in Glendale
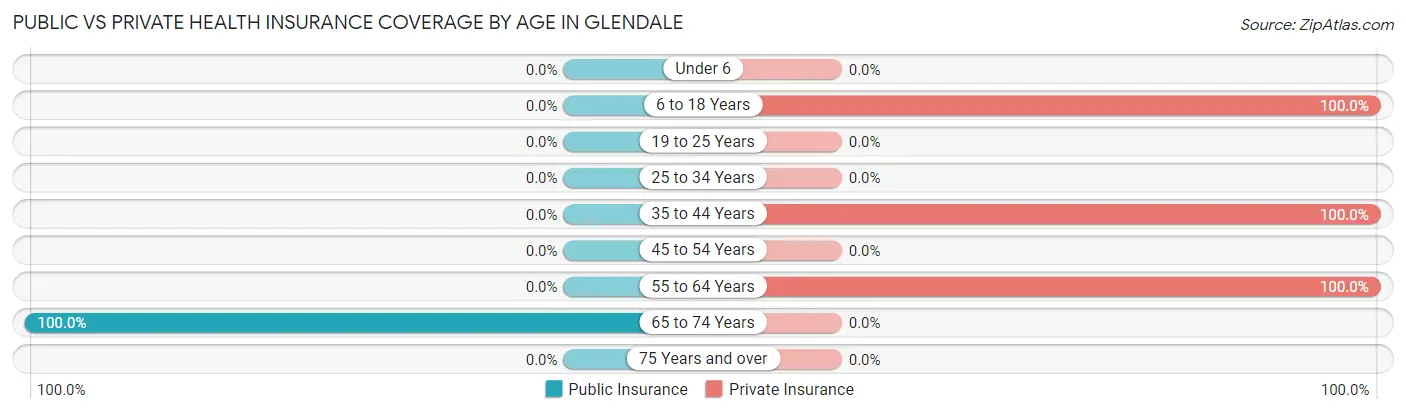
| Age Bracket | Public Insurance | Private Insurance |
| Under 6 | 0 (0.0%) | 0 (0.0%) |
| 6 to 18 Years | 0 (0.0%) | 7 (100.0%) |
| 19 to 25 Years | 0 (0.0%) | 0 (0.0%) |
| 25 to 34 Years | 0 (0.0%) | 0 (0.0%) |
| 35 to 44 Years | 0 (0.0%) | 8 (100.0%) |
| 45 to 54 Years | 0 (0.0%) | 0 (0.0%) |
| 55 to 64 Years | 0 (0.0%) | 11 (100.0%) |
| 65 to 74 Years | 42 (100.0%) | 0 (0.0%) |
| 75 Years and over | 0 (0.0%) | 0 (0.0%) |
| Total | 42 (61.8%) | 26 (38.2%) |
Disability Status by Sex by Age in Glendale
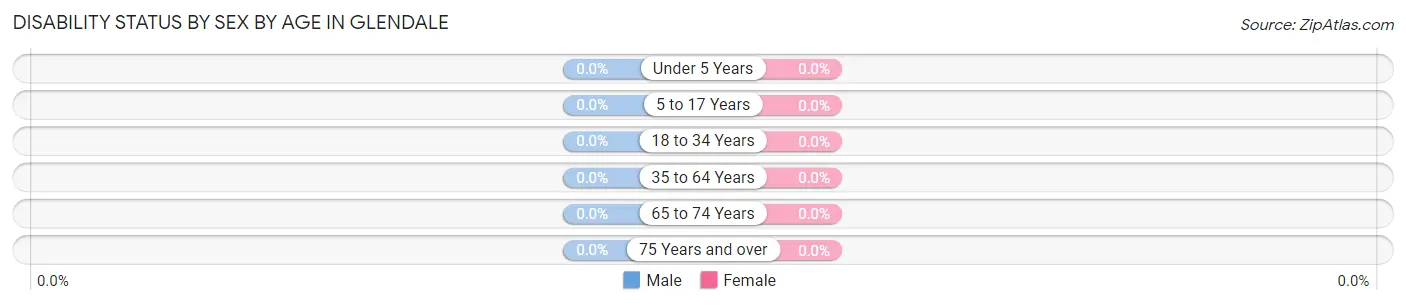
| Age Bracket | Male | Female |
| Under 5 Years | 0 (0.0%) | 0 (0.0%) |
| 5 to 17 Years | 0 (0.0%) | 0 (0.0%) |
| 18 to 34 Years | 0 (0.0%) | 0 (0.0%) |
| 35 to 64 Years | 0 (0.0%) | 0 (0.0%) |
| 65 to 74 Years | 0 (0.0%) | 0 (0.0%) |
| 75 Years and over | 0 (0.0%) | 0 (0.0%) |
Disability Class by Sex by Age in Glendale
Disability Class: Hearing Difficulty
| Age Bracket | Male | Female |
| Under 5 Years | 0 (0.0%) | 0 (0.0%) |
| 5 to 17 Years | 0 (0.0%) | 0 (0.0%) |
| 18 to 34 Years | 0 (0.0%) | 0 (0.0%) |
| 35 to 64 Years | 0 (0.0%) | 0 (0.0%) |
| 65 to 74 Years | 0 (0.0%) | 0 (0.0%) |
| 75 Years and over | 0 (0.0%) | 0 (0.0%) |
Disability Class: Vision Difficulty
| Age Bracket | Male | Female |
| Under 5 Years | 0 (0.0%) | 0 (0.0%) |
| 5 to 17 Years | 0 (0.0%) | 0 (0.0%) |
| 18 to 34 Years | 0 (0.0%) | 0 (0.0%) |
| 35 to 64 Years | 0 (0.0%) | 0 (0.0%) |
| 65 to 74 Years | 0 (0.0%) | 0 (0.0%) |
| 75 Years and over | 0 (0.0%) | 0 (0.0%) |
Disability Class: Cognitive Difficulty
| Age Bracket | Male | Female |
| 5 to 17 Years | 0 (0.0%) | 0 (0.0%) |
| 18 to 34 Years | 0 (0.0%) | 0 (0.0%) |
| 35 to 64 Years | 0 (0.0%) | 0 (0.0%) |
| 65 to 74 Years | 0 (0.0%) | 0 (0.0%) |
| 75 Years and over | 0 (0.0%) | 0 (0.0%) |
Disability Class: Ambulatory Difficulty
| Age Bracket | Male | Female |
| 5 to 17 Years | 0 (0.0%) | 0 (0.0%) |
| 18 to 34 Years | 0 (0.0%) | 0 (0.0%) |
| 35 to 64 Years | 0 (0.0%) | 0 (0.0%) |
| 65 to 74 Years | 0 (0.0%) | 0 (0.0%) |
| 75 Years and over | 0 (0.0%) | 0 (0.0%) |
Disability Class: Self-Care Difficulty
| Age Bracket | Male | Female |
| 5 to 17 Years | 0 (0.0%) | 0 (0.0%) |
| 18 to 34 Years | 0 (0.0%) | 0 (0.0%) |
| 35 to 64 Years | 0 (0.0%) | 0 (0.0%) |
| 65 to 74 Years | 0 (0.0%) | 0 (0.0%) |
| 75 Years and over | 0 (0.0%) | 0 (0.0%) |
Technology Access in Glendale
Computing Device Access in Glendale
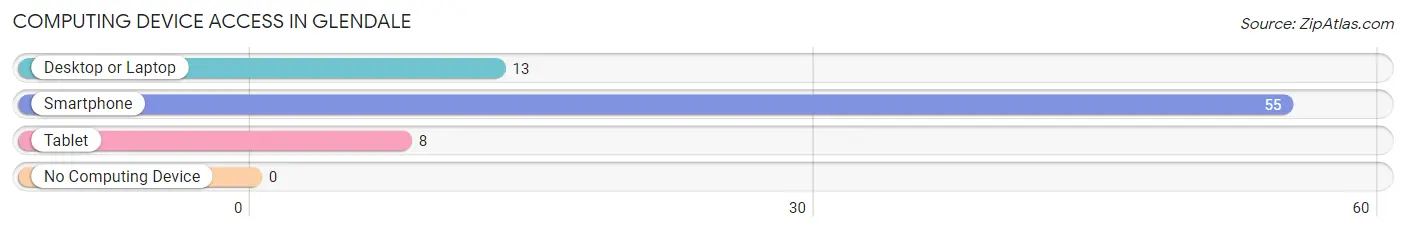
| Device Type | # Households | % Households |
| Desktop or Laptop | 13 | 23.6% |
| Smartphone | 55 | 100.0% |
| Tablet | 8 | 14.5% |
| No Computing Device | 0 | 0.0% |
| Total | 55 | 100.0% |
Internet Access in Glendale
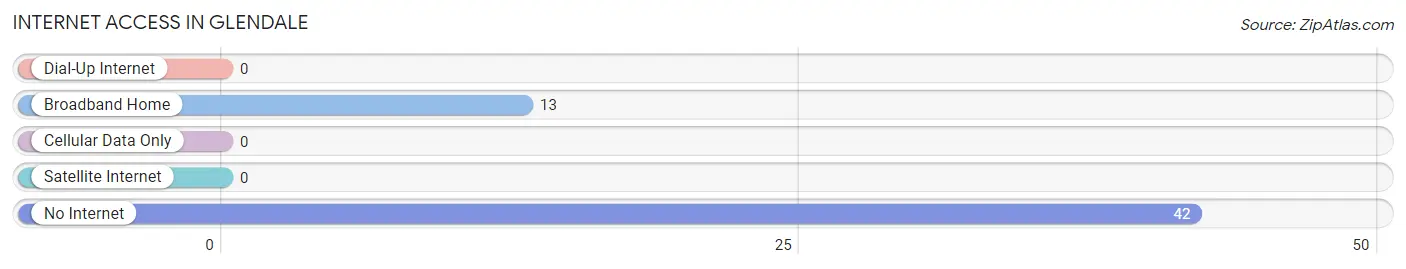
| Internet Type | # Households | % Households |
| Dial-Up Internet | 0 | 0.0% |
| Broadband Home | 13 | 23.6% |
| Cellular Data Only | 0 | 0.0% |
| Satellite Internet | 0 | 0.0% |
| No Internet | 42 | 76.4% |
| Total | 55 | 100.0% |
Glendale Summary
Glendale, Colorado is a small city located in the Denver metropolitan area. It is located in Arapahoe County and is bordered by Denver to the north, Englewood to the east, and Cherry Hills Village to the south. The city has a population of 5,467 as of the 2020 census, making it the smallest city in the Denver metropolitan area.
Geography
Glendale is located in the South Platte River Valley, at an elevation of 5,400 feet. The city is situated on the western edge of the Denver metropolitan area, and is bordered by Denver to the north, Englewood to the east, and Cherry Hills Village to the south. The city covers an area of 1.3 square miles, and is located approximately 10 miles south of downtown Denver.
The city is located in a semi-arid climate, with hot summers and cold winters. The average annual temperature is 54 degrees Fahrenheit, with an average high of 79 degrees in the summer and an average low of 28 degrees in the winter. The average annual precipitation is 15.5 inches, with most of the precipitation occurring in the spring and summer months.
History
Glendale was founded in 1891 by a group of settlers from the Midwest. The city was originally named “Glendale Park”, and was incorporated in 1952. The city was named after the nearby Glendale Ranch, which was owned by the prominent Denver businessman, William N. Byers.
The city was originally a small farming community, but began to grow in the 1950s and 1960s as the Denver metropolitan area expanded. The city was home to a number of small businesses, including a grocery store, a hardware store, and a gas station.
In the 1970s, the city began to experience rapid growth as the Denver metropolitan area continued to expand. The city was annexed by Denver in 1975, and the population grew to over 5,000 by the 2000 census.
Economy
Glendale’s economy is largely based on the service industry, with a number of restaurants, bars, and retail stores located in the city. The city is also home to a number of corporate offices, including the headquarters of the Colorado Rockies baseball team.
The city is also home to a number of small businesses, including a number of auto repair shops, a grocery store, and a hardware store. The city is also home to a number of professional services, including accounting, legal, and medical services.
Demographics
As of the 2020 census, Glendale had a population of 5,467. The racial makeup of the city was 79.2% White, 8.2% Hispanic or Latino, 5.3% African American, 3.2% Asian, and 2.9% from other races. The median household income was $60,945, and the median home value was $400,000.
Conclusion
Glendale, Colorado is a small city located in the Denver metropolitan area. It is located in Arapahoe County and is bordered by Denver to the north, Englewood to the east, and Cherry Hills Village to the south. The city has a population of 5,467 as of the 2020 census, making it the smallest city in the Denver metropolitan area. The city is located in a semi-arid climate, with hot summers and cold winters. The city’s economy is largely based on the service industry, with a number of restaurants, bars, and retail stores located in the city. The city is also home to a number of corporate offices, including the headquarters of the Colorado Rockies baseball team. As of the 2020 census, Glendale had a population of 5,467, with a median household income of $60,945 and a median home value of $400,000.
Common Questions
What is Per Capita Income in Glendale?
Per Capita income in Glendale is $25,435.
What is Income or Wage Gap in Glendale?
Income or Wage Gap in Glendale is 18.8%.
Women in Glendale earn 81.2 cents for every dollar earned by a man.
What is Inequality or Gini Index in Glendale?
Inequality or Gini Index in Glendale is 0.65.
What is the Total Population of Glendale?
Total Population of Glendale is 68.
What is the Total Male Population of Glendale?
Total Male Population of Glendale is 48.
What is the Total Female Population of Glendale?
Total Female Population of Glendale is 20.
What is the Ratio of Males per 100 Females in Glendale?
There are 240.00 Males per 100 Females in Glendale.
What is the Ratio of Females per 100 Males in Glendale?
There are 41.67 Females per 100 Males in Glendale.
What is the Median Population Age in Glendale?
Median Population Age in Glendale is 71.2 Years.
What is the Average Family Size in Glendale
Average Family Size in Glendale is 2.6 People.
What is the Average Household Size in Glendale
Average Household Size in Glendale is 1.2 People.
How Large is the Labor Force in Glendale?
There are 14 People in the Labor Forcein in Glendale.
What is the Percentage of People in the Labor Force in Glendale?
23.0% of People are in the Labor Force in Glendale.