Cities with the Highest Percentage of Households with Income Below $10,000 in Pennsylvania
RELATED REPORTS & OPTIONS
Household Income | $0-10k
Pennsylvania
Compare Cities
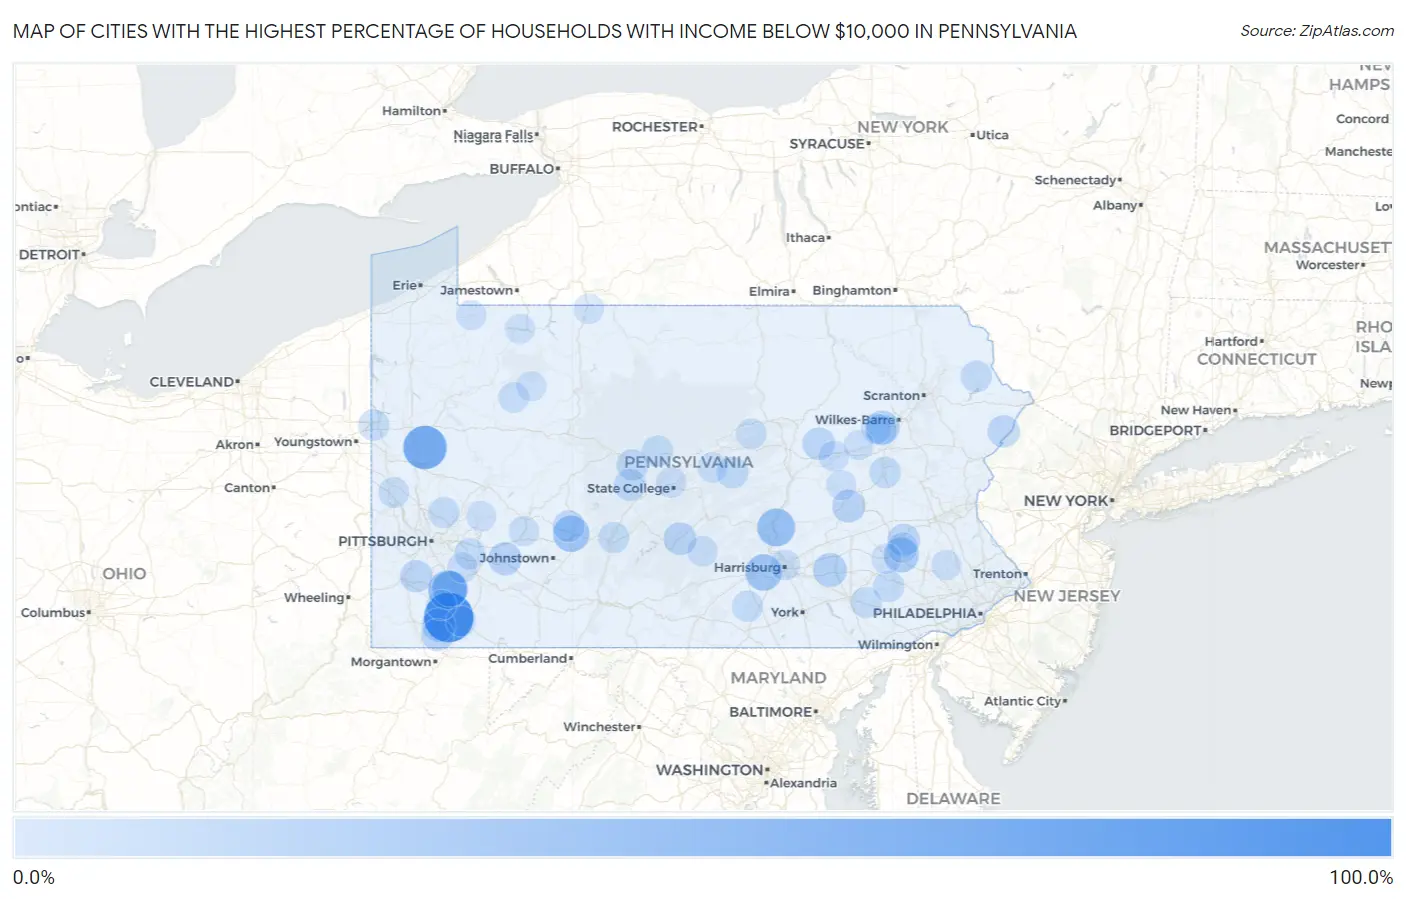
Map of Cities with the Highest Percentage of Households with Income Below $10,000 in Pennsylvania
0.0%
100.0%
Cities with the Highest Percentage of Households with Income Below $10,000 in Pennsylvania
| City | Households with Income < $10k | vs State | vs National | |
| 1. | Buffington | 100.0% | 4.8%(+95.2)#1 | 4.9%(+95.1)#5 |
| 2. | Vail | 100.0% | 4.8%(+95.2)#2 | 4.9%(+95.1)#33 |
| 3. | Slippery Rock University | 71.4% | 4.8%(+66.6)#3 | 4.9%(+66.5)#68 |
| 4. | Naomi | 50.0% | 4.8%(+45.2)#4 | 4.9%(+45.1)#165 |
| 5. | Linds Crossing | 49.2% | 4.8%(+44.4)#5 | 4.9%(+44.3)#176 |
| 6. | Lenkerville | 46.0% | 4.8%(+41.2)#6 | 4.9%(+41.1)#211 |
| 7. | Cotton | 42.9% | 4.8%(+38.1)#7 | 4.9%(+38.0)#259 |
| 8. | New Kingstown | 40.2% | 4.8%(+35.4)#8 | 4.9%(+35.3)#291 |
| 9. | Nealmont | 40.0% | 4.8%(+35.2)#9 | 4.9%(+35.1)#299 |
| 10. | Revloc | 39.6% | 4.8%(+34.8)#10 | 4.9%(+34.7)#307 |
| 11. | Arnold City | 36.6% | 4.8%(+31.8)#11 | 4.9%(+31.7)#356 |
| 12. | Stony Creek Mills | 33.3% | 4.8%(+28.5)#12 | 4.9%(+28.4)#441 |
| 13. | Aaronsburg Cdp Washington County | 28.8% | 4.8%(+24.0)#13 | 4.9%(+23.9)#606 |
| 14. | Sheatown | 28.1% | 4.8%(+23.3)#14 | 4.9%(+23.2)#636 |
| 15. | Timber Hills | 28.1% | 4.8%(+23.3)#15 | 4.9%(+23.2)#637 |
| 16. | Nemacolin | 27.1% | 4.8%(+22.3)#16 | 4.9%(+22.2)#679 |
| 17. | Bradenville | 25.8% | 4.8%(+21.0)#17 | 4.9%(+20.9)#749 |
| 18. | Branchdale | 24.6% | 4.8%(+19.8)#18 | 4.9%(+19.7)#825 |
| 19. | Atkinson Mills | 23.5% | 4.8%(+18.7)#19 | 4.9%(+18.6)#896 |
| 20. | Benton Borough | 23.3% | 4.8%(+18.5)#20 | 4.9%(+18.4)#907 |
| 21. | Jerseytown | 23.1% | 4.8%(+18.3)#21 | 4.9%(+18.2)#926 |
| 22. | Carson Valley | 23.1% | 4.8%(+18.3)#22 | 4.9%(+18.2)#929 |
| 23. | Walnuttown | 23.0% | 4.8%(+18.2)#23 | 4.9%(+18.1)#941 |
| 24. | Grampian Borough | 22.3% | 4.8%(+17.5)#24 | 4.9%(+17.4)#993 |
| 25. | Pocono Ranch Lands | 21.5% | 4.8%(+16.7)#25 | 4.9%(+16.6)#1,054 |
| 26. | Wylandville | 21.5% | 4.8%(+16.7)#26 | 4.9%(+16.6)#1,058 |
| 27. | Mapletown | 21.4% | 4.8%(+16.6)#27 | 4.9%(+16.5)#1,073 |
| 28. | Blue Knob | 21.4% | 4.8%(+16.6)#28 | 4.9%(+16.5)#1,076 |
| 29. | Sandy Ridge | 20.2% | 4.8%(+15.4)#29 | 4.9%(+15.3)#1,176 |
| 30. | New Morgan Borough | 20.0% | 4.8%(+15.2)#30 | 4.9%(+15.1)#1,215 |
| 31. | Edwardsville Borough | 19.7% | 4.8%(+14.9)#31 | 4.9%(+14.8)#1,250 |
| 32. | Colver | 19.3% | 4.8%(+14.5)#32 | 4.9%(+14.4)#1,302 |
| 33. | New Columbus Borough | 19.0% | 4.8%(+14.2)#33 | 4.9%(+14.1)#1,344 |
| 34. | Morrisdale | 18.9% | 4.8%(+14.1)#34 | 4.9%(+14.0)#1,361 |
| 35. | Penbrook Borough | 18.8% | 4.8%(+14.0)#35 | 4.9%(+13.9)#1,370 |
| 36. | Woodward | 18.8% | 4.8%(+14.0)#36 | 4.9%(+13.9)#1,388 |
| 37. | Kelayres | 18.3% | 4.8%(+13.5)#37 | 4.9%(+13.4)#1,445 |
| 38. | Moshannon | 18.0% | 4.8%(+13.2)#38 | 4.9%(+13.1)#1,494 |
| 39. | White Mills | 17.9% | 4.8%(+13.1)#39 | 4.9%(+13.0)#1,500 |
| 40. | Dauphin Borough | 17.8% | 4.8%(+13.0)#40 | 4.9%(+12.9)#1,522 |
| 41. | Wilmerding Borough | 17.5% | 4.8%(+12.7)#41 | 4.9%(+12.6)#1,561 |
| 42. | Wanamie | 17.3% | 4.8%(+12.5)#42 | 4.9%(+12.4)#1,594 |
| 43. | Bairdford | 17.2% | 4.8%(+12.4)#43 | 4.9%(+12.3)#1,609 |
| 44. | Gardners | 17.2% | 4.8%(+12.4)#44 | 4.9%(+12.3)#1,618 |
| 45. | Oreminea | 17.0% | 4.8%(+12.2)#45 | 4.9%(+12.1)#1,657 |
| 46. | Harrison City | 16.9% | 4.8%(+12.1)#46 | 4.9%(+12.0)#1,682 |
| 47. | Farrell | 16.8% | 4.8%(+12.0)#47 | 4.9%(+11.9)#1,686 |
| 48. | Churchtown | 16.8% | 4.8%(+12.0)#48 | 4.9%(+11.9)#1,701 |
| 49. | Ronks | 16.1% | 4.8%(+11.3)#49 | 4.9%(+11.2)#1,853 |
| 50. | Lakemont | 16.0% | 4.8%(+11.2)#50 | 4.9%(+11.1)#1,862 |
| 51. | Beaver Falls | 15.4% | 4.8%(+10.6)#51 | 4.9%(+10.5)#1,989 |
| 52. | New Washington Borough | 15.4% | 4.8%(+10.6)#52 | 4.9%(+10.5)#2,018 |
| 53. | Slippery Rock Borough | 15.3% | 4.8%(+10.5)#53 | 4.9%(+10.4)#2,022 |
| 54. | Friesville | 15.2% | 4.8%(+10.4)#54 | 4.9%(+10.3)#2,055 |
| 55. | State College Borough | 15.1% | 4.8%(+10.3)#55 | 4.9%(+10.2)#2,062 |
| 56. | North Charleroi Borough | 15.0% | 4.8%(+10.2)#56 | 4.9%(+10.1)#2,087 |
| 57. | Mckees Rocks Borough | 14.9% | 4.8%(+10.1)#57 | 4.9%(+10.00)#2,110 |
| 58. | Donegal Borough | 14.8% | 4.8%(+10.0)#58 | 4.9%(+9.90)#2,167 |
| 59. | Crown | 14.7% | 4.8%(+9.90)#59 | 4.9%(+9.80)#2,196 |
| 60. | Bloomsburg | 14.2% | 4.8%(+9.40)#60 | 4.9%(+9.30)#2,303 |
| 61. | Fallston Borough | 14.2% | 4.8%(+9.40)#61 | 4.9%(+9.30)#2,319 |
| 62. | Toftrees | 14.1% | 4.8%(+9.30)#62 | 4.9%(+9.20)#2,327 |
| 63. | Alsace Manor | 13.9% | 4.8%(+9.10)#63 | 4.9%(+9.00)#2,403 |
| 64. | Northern Cambria Borough | 13.8% | 4.8%(+9.00)#64 | 4.9%(+8.90)#2,419 |
| 65. | Glen Lyon | 13.8% | 4.8%(+9.00)#65 | 4.9%(+8.90)#2,426 |
| 66. | Braddock Borough | 13.8% | 4.8%(+9.00)#66 | 4.9%(+8.90)#2,427 |
| 67. | Centerville Borough Crawford County | 13.8% | 4.8%(+9.00)#67 | 4.9%(+8.90)#2,441 |
| 68. | Harrisburg | 13.7% | 4.8%(+8.90)#68 | 4.9%(+8.80)#2,447 |
| 69. | Herminie | 13.7% | 4.8%(+8.90)#69 | 4.9%(+8.80)#2,467 |
| 70. | Oval | 13.6% | 4.8%(+8.80)#70 | 4.9%(+8.70)#2,491 |
| 71. | Spring Drive Mobile Home Park | 13.6% | 4.8%(+8.80)#71 | 4.9%(+8.70)#2,494 |
| 72. | Madisonburg | 13.6% | 4.8%(+8.80)#72 | 4.9%(+8.70)#2,498 |
| 73. | Smicksburg Borough | 13.6% | 4.8%(+8.80)#73 | 4.9%(+8.70)#2,500 |
| 74. | East Waterford | 13.5% | 4.8%(+8.70)#74 | 4.9%(+8.60)#2,531 |
| 75. | Coral | 13.4% | 4.8%(+8.60)#75 | 4.9%(+8.50)#2,561 |
| 76. | Uniontown | 13.1% | 4.8%(+8.30)#76 | 4.9%(+8.20)#2,654 |
| 77. | Donora Borough | 13.1% | 4.8%(+8.30)#77 | 4.9%(+8.20)#2,658 |
| 78. | West Wyomissing | 13.0% | 4.8%(+8.20)#78 | 4.9%(+8.10)#2,699 |
| 79. | Spring Mount | 13.0% | 4.8%(+8.20)#79 | 4.9%(+8.10)#2,701 |
| 80. | Foster Brook | 13.0% | 4.8%(+8.20)#80 | 4.9%(+8.10)#2,705 |
| 81. | Elco Borough | 13.0% | 4.8%(+8.20)#81 | 4.9%(+8.10)#2,719 |
| 82. | Foundryville | 13.0% | 4.8%(+8.20)#82 | 4.9%(+8.10)#2,728 |
| 83. | Darby Borough | 12.9% | 4.8%(+8.10)#83 | 4.9%(+8.00)#2,734 |
| 84. | Delmont Borough | 12.9% | 4.8%(+8.10)#84 | 4.9%(+8.00)#2,744 |
| 85. | Brownsville Borough | 12.9% | 4.8%(+8.10)#85 | 4.9%(+8.00)#2,746 |
| 86. | Ridgway Borough | 12.8% | 4.8%(+8.00)#86 | 4.9%(+7.90)#2,780 |
| 87. | Mount Oliver Borough | 12.8% | 4.8%(+8.00)#87 | 4.9%(+7.90)#2,783 |
| 88. | Orrstown Borough | 12.8% | 4.8%(+8.00)#88 | 4.9%(+7.90)#2,803 |
| 89. | Corry | 12.6% | 4.8%(+7.80)#89 | 4.9%(+7.70)#2,848 |
| 90. | Turtle Creek Borough | 12.6% | 4.8%(+7.80)#90 | 4.9%(+7.70)#2,850 |
| 91. | Starbrick | 12.6% | 4.8%(+7.80)#91 | 4.9%(+7.70)#2,861 |
| 92. | Newry Borough | 12.6% | 4.8%(+7.80)#92 | 4.9%(+7.70)#2,883 |
| 93. | Marienville | 12.5% | 4.8%(+7.70)#93 | 4.9%(+7.60)#2,900 |
| 94. | Homewood At Martinsburg | 12.5% | 4.8%(+7.70)#94 | 4.9%(+7.60)#2,929 |
| 95. | Bentleyville Borough | 12.4% | 4.8%(+7.60)#95 | 4.9%(+7.50)#2,970 |
| 96. | Dushore Borough | 12.4% | 4.8%(+7.60)#96 | 4.9%(+7.50)#2,992 |
| 97. | Wilburton Number One | 12.4% | 4.8%(+7.60)#97 | 4.9%(+7.50)#2,995 |
| 98. | North Vandergrift | 12.4% | 4.8%(+7.60)#98 | 4.9%(+7.50)#2,997 |
| 99. | Folcroft Borough | 12.3% | 4.8%(+7.50)#99 | 4.9%(+7.40)#3,007 |
| 100. | Hiller | 12.3% | 4.8%(+7.50)#100 | 4.9%(+7.40)#3,019 |
Common Questions
What are the Top 10 Cities with the Highest Percentage of Households with Income Below $10,000 in Pennsylvania?
Top 10 Cities with the Highest Percentage of Households with Income Below $10,000 in Pennsylvania are:
#1
100.0%
#2
71.4%
#3
50.0%
#4
46.0%
#5
40.2%
#6
39.6%
#7
36.6%
#8
33.3%
#9
28.1%
#10
28.1%
What city has the Highest Percentage of Households with Income Below $10,000 in Pennsylvania?
Buffington has the Highest Percentage of Households with Income Below $10,000 in Pennsylvania with 100.0%.
What is the Percentage of Households with Income Below $10,000 in the State of Pennsylvania?
Percentage of Households with Income Below $10,000 in Pennsylvania is 4.8%.
What is the Percentage of Households with Income Below $10,000 in the United States?
Percentage of Households with Income Below $10,000 in the United States is 4.9%.