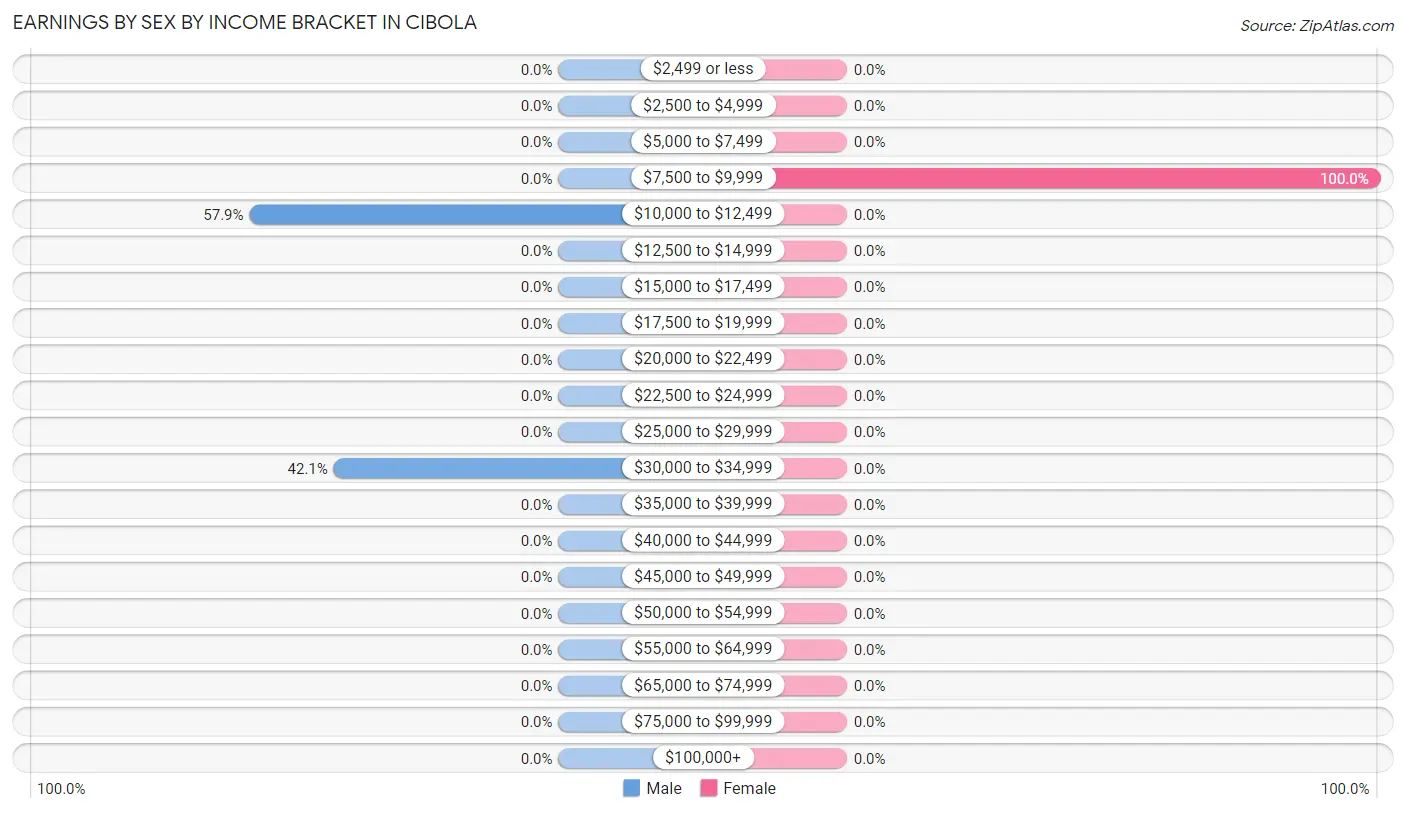
The most common earnings brackets in Cibola are $10,000 to $12,499 for men (22 | 57.9%) and $7,500 to $9,999 for women (33 | 100.0%).
Income
Male
Female
$2,499 or less
0 (0.0%)
0 (0.0%)
$2,500 to $4,999
0 (0.0%)
0 (0.0%)
$5,000 to $7,499
0 (0.0%)
0 (0.0%)
$7,500 to $9,999
0 (0.0%)
33 (100.0%)
$10,000 to $12,499
22 (57.9%)
0 (0.0%)
$12,500 to $14,999
0 (0.0%)
0 (0.0%)
$15,000 to $17,499
0 (0.0%)
0 (0.0%)
$17,500 to $19,999
0 (0.0%)
0 (0.0%)
$20,000 to $22,499
0 (0.0%)
0 (0.0%)
$22,500 to $24,999
0 (0.0%)
0 (0.0%)
$25,000 to $29,999
0 (0.0%)
0 (0.0%)
$30,000 to $34,999
16 (42.1%)
0 (0.0%)
$35,000 to $39,999
0 (0.0%)
0 (0.0%)
$40,000 to $44,999
0 (0.0%)
0 (0.0%)
$45,000 to $49,999
0 (0.0%)
0 (0.0%)
$50,000 to $54,999
0 (0.0%)
0 (0.0%)
$55,000 to $64,999
0 (0.0%)
0 (0.0%)
$65,000 to $74,999
0 (0.0%)
0 (0.0%)
$75,000 to $99,999
0 (0.0%)
0 (0.0%)
$100,000+
0 (0.0%)
0 (0.0%)
Total
38 (100.0%)
33 (100.0%)
Earnings by Sex by Educational Attainment in Cibola
Educational Attainment
Male Income
Female Income
Less than High School
-
-
High School Diploma
-
-
College or Associate's Degree
-
-
Bachelor's Degree
-
-
Graduate Degree
-
-
Total
-
-
Family Income in Cibola
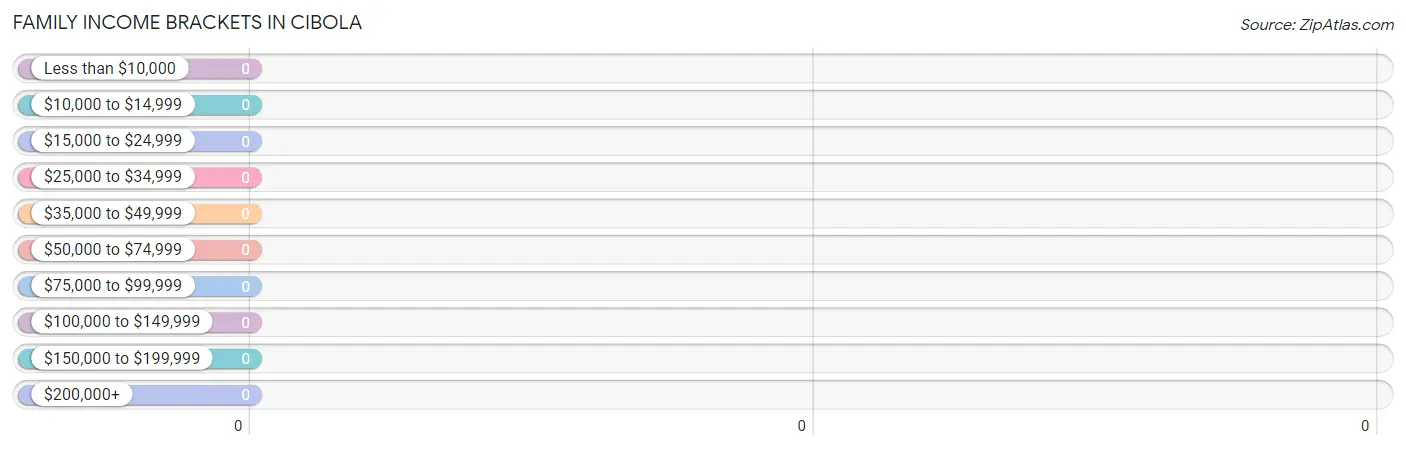
Family Income Brackets in Cibola
Income Bracket
# Families
% Families
Less than $10,000
0
0.0%
$10,000 to $14,999
0
0.0%
$15,000 to $24,999
0
0.0%
$25,000 to $34,999
0
0.0%
$35,000 to $49,999
0
0.0%
$50,000 to $74,999
0
0.0%
$75,000 to $99,999
0
0.0%
$100,000 to $149,999
0
0.0%
$150,000 to $199,999
0
0.0%
$200,000+
0
0.0%
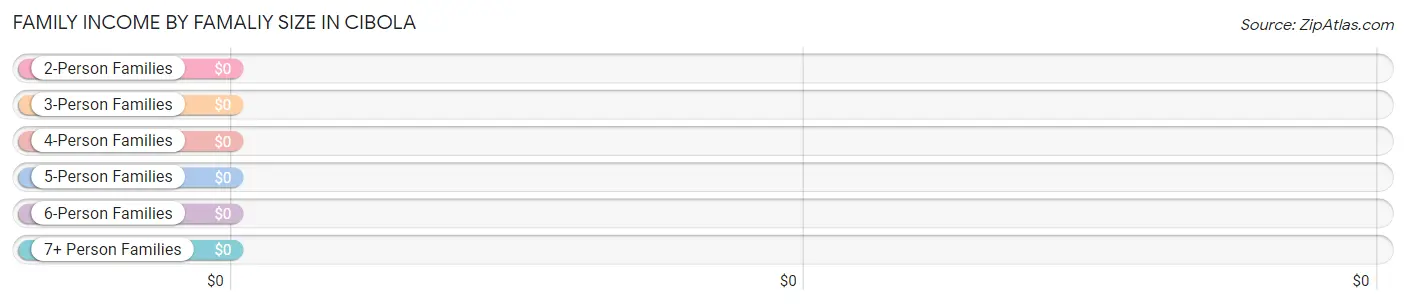
Family Income by Famaliy Size in Cibola
Income Bracket
# Families
Median Income
2-Person Families
0 (0.0%)
$0
3-Person Families
0 (0.0%)
$0
4-Person Families
0 (0.0%)
$0
5-Person Families
0 (0.0%)
$0
6-Person Families
0 (0.0%)
$0
7+ Person Families
0 (0.0%)
$0
Total
0 (0.0%)
$0
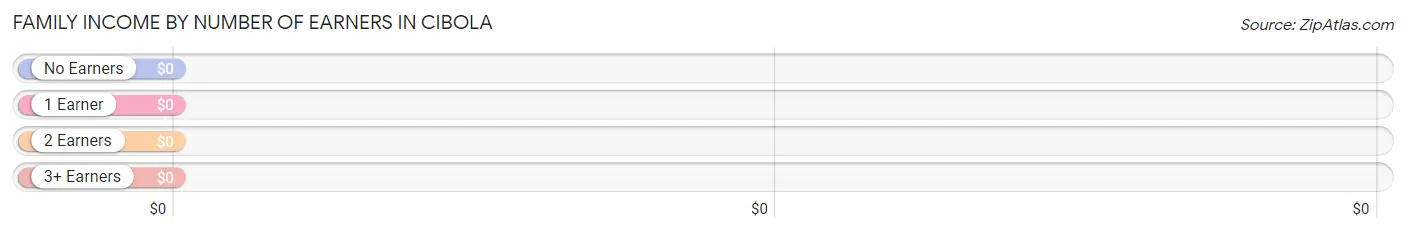
Family Income by Number of Earners in Cibola
Number of Earners
# Families
Median Income
No Earners
0 (0.0%)
$0
1 Earner
0 (0.0%)
$0
2 Earners
0 (0.0%)
$0
3+ Earners
0 (0.0%)
$0
Total
0 (0.0%)
$0
Household Income in Cibola
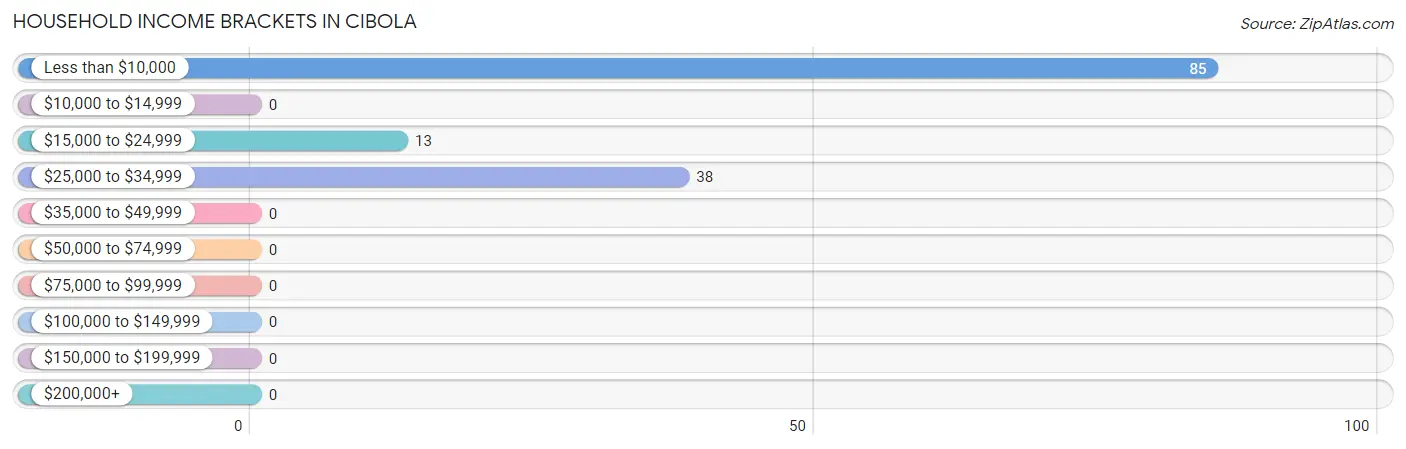
Household Income Brackets in Cibola
With 85 households falling in the category, the less than $10,000 income range is the most frequent in Cibola, accounting for 62.5% of all households.
Income Bracket
# Households
% Households
Less than $10,000
85
62.5%
$10,000 to $14,999
0
0.0%
$15,000 to $24,999
13
9.6%
$25,000 to $34,999
38
27.9%
$35,000 to $49,999
0
0.0%
$50,000 to $74,999
0
0.0%
$75,000 to $99,999
0
0.0%
$100,000 to $149,999
0
0.0%
$150,000 to $199,999
0
0.0%
$200,000+
0
0.0%
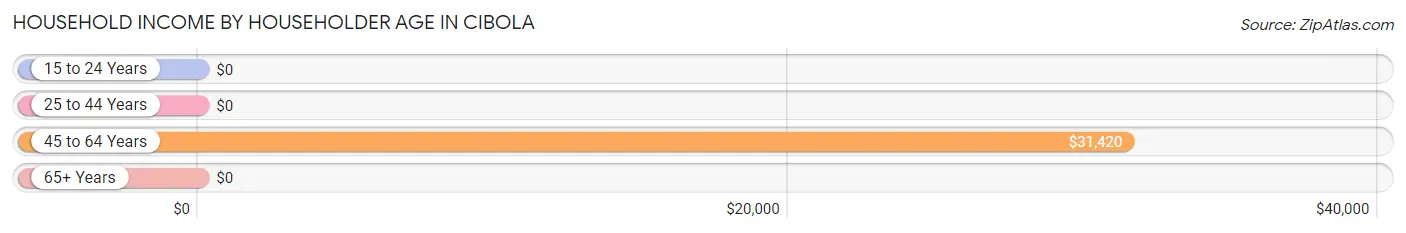
Household Income by Householder Age in Cibola
The median household income in Cibola is $0, with the highest median household income of $31,420 found in the 45 to 64 years age bracket for the primary householder. A total of 51 households (37.5%) fall into this category.
Income Bracket
# Households
Median Income
15 to 24 Years
0 (0.0%)
$0
25 to 44 Years
0 (0.0%)
$0
45 to 64 Years
51 (37.5%)
$31,420
65+ Years
85 (62.5%)
$0
Total
136 (100.0%)
$0
Poverty in Cibola
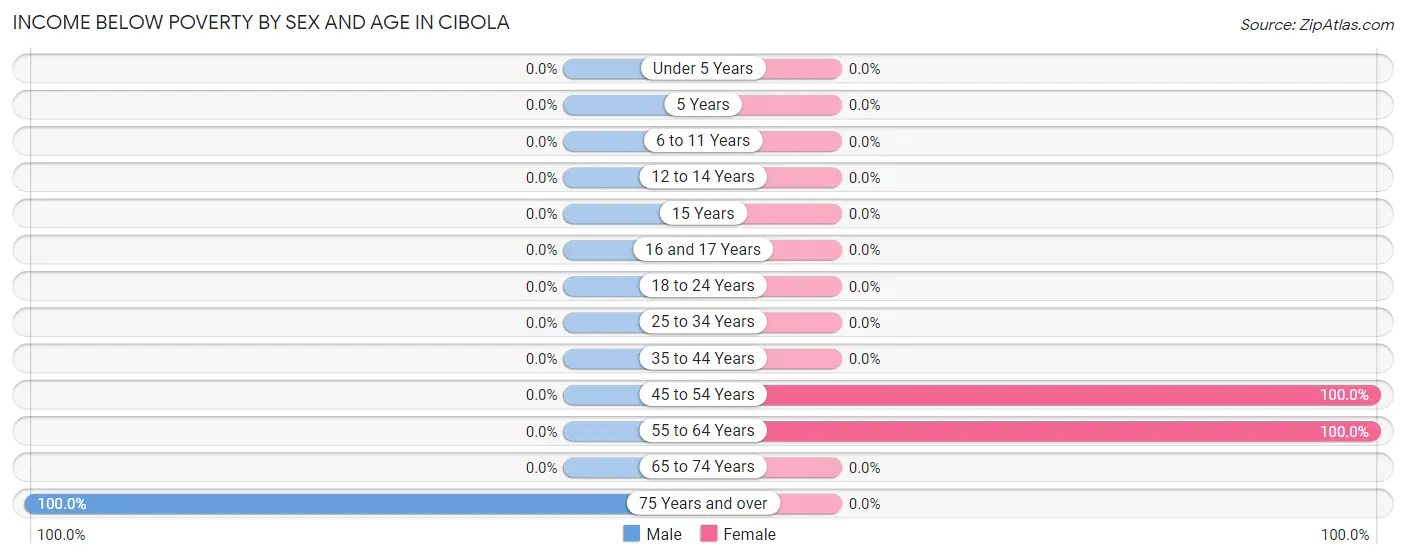
Income Below Poverty by Sex and Age in Cibola
With 62.5% poverty level for males and 100.0% for females among the residents of Cibola, 75 year old and over males and 45 to 54 year old females are the most vulnerable to poverty, with 85 males (100.0%) and 33 females (100.0%) in their respective age groups living below the poverty level.
Age Bracket
Male
Female
Under 5 Years
0 (0.0%)
0 (0.0%)
5 Years
0 (0.0%)
0 (0.0%)
6 to 11 Years
0 (0.0%)
0 (0.0%)
12 to 14 Years
0 (0.0%)
0 (0.0%)
15 Years
0 (0.0%)
0 (0.0%)
16 and 17 Years
0 (0.0%)
0 (0.0%)
18 to 24 Years
0 (0.0%)
0 (0.0%)
25 to 34 Years
0 (0.0%)
0 (0.0%)
35 to 44 Years
0 (0.0%)
0 (0.0%)
45 to 54 Years
0 (0.0%)
33 (100.0%)
55 to 64 Years
0 (0.0%)
2 (100.0%)
65 to 74 Years
0 (0.0%)
0 (0.0%)
75 Years and over
85 (100.0%)
0 (0.0%)
Total
85 (62.5%)
35 (100.0%)
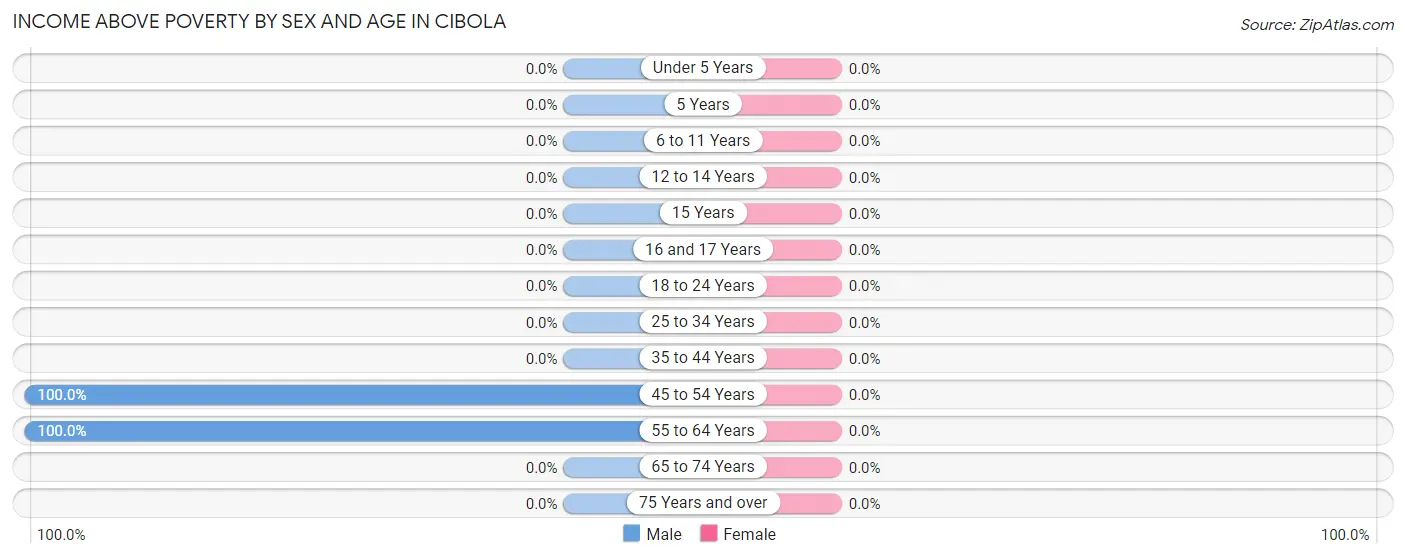
Income Above Poverty by Sex and Age in Cibola
Age Bracket
Male
Female
Under 5 Years
0 (0.0%)
0 (0.0%)
5 Years
0 (0.0%)
0 (0.0%)
6 to 11 Years
0 (0.0%)
0 (0.0%)
12 to 14 Years
0 (0.0%)
0 (0.0%)
15 Years
0 (0.0%)
0 (0.0%)
16 and 17 Years
0 (0.0%)
0 (0.0%)
18 to 24 Years
0 (0.0%)
0 (0.0%)
25 to 34 Years
0 (0.0%)
0 (0.0%)
35 to 44 Years
0 (0.0%)
0 (0.0%)
45 to 54 Years
22 (100.0%)
0 (0.0%)
55 to 64 Years
29 (100.0%)
0 (0.0%)
65 to 74 Years
0 (0.0%)
0 (0.0%)
75 Years and over
0 (0.0%)
0 (0.0%)
Total
51 (37.5%)
0 (0.0%)
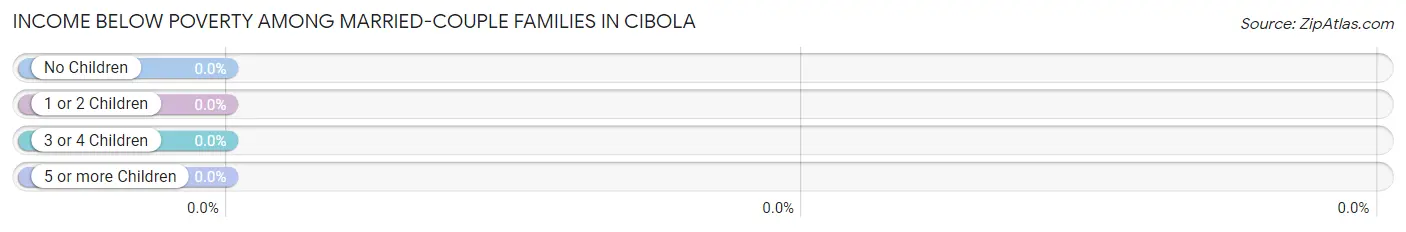
Income Below Poverty Among Married-Couple Families in Cibola
Children
Above Poverty
Below Poverty
No Children
0 (0.0%)
0 (0.0%)
1 or 2 Children
0 (0.0%)
0 (0.0%)
3 or 4 Children
0 (0.0%)
0 (0.0%)
5 or more Children
0 (0.0%)
0 (0.0%)
Total
0 (0.0%)
0 (0.0%)
Income Below Poverty Among Single-Parent Households in Cibola
Children
Single Father
Single Mother
No Children
0 (0.0%)
0 (0.0%)
1 or 2 Children
0 (0.0%)
0 (0.0%)
3 or 4 Children
0 (0.0%)
0 (0.0%)
5 or more Children
0 (0.0%)
0 (0.0%)
Total
0 (0.0%)
0 (0.0%)
Income Below Poverty Among Married-Couple vs Single-Parent Households in Cibola
Children
Married-Couple Families
Single-Parent Households
No Children
0 (0.0%)
0 (0.0%)
1 or 2 Children
0 (0.0%)
0 (0.0%)
3 or 4 Children
0 (0.0%)
0 (0.0%)
5 or more Children
0 (0.0%)
0 (0.0%)
Total
0 (0.0%)
0 (0.0%)
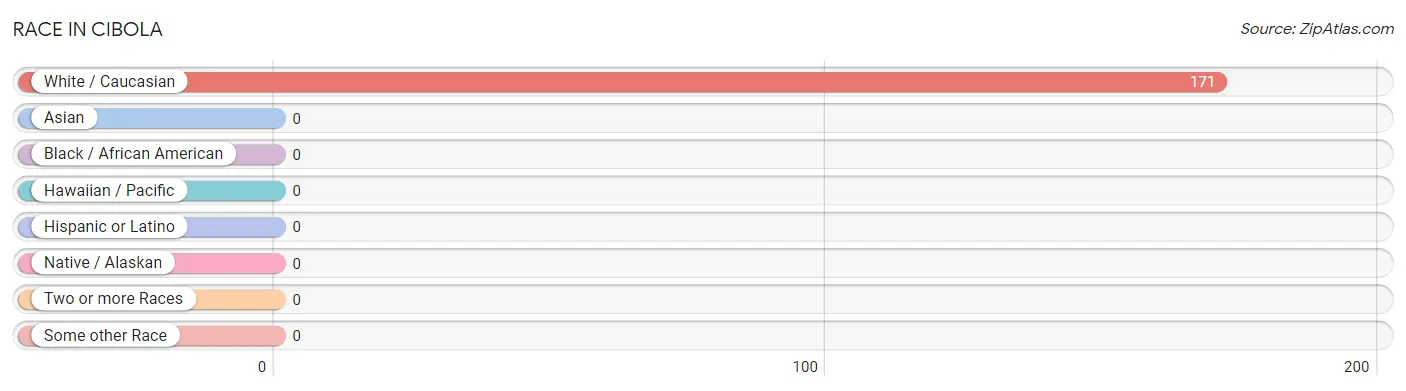
Race in Cibola
The most populous races in Cibola are , and White / Caucasian (171 | 100.0%).
Race
# Population
% Population
Asian
0
0.0%
Black / African American
0
0.0%
Hawaiian / Pacific
0
0.0%
Hispanic or Latino
0
0.0%
Native / Alaskan
0
0.0%
White / Caucasian
171
100.0%
Two or more Races
0
0.0%
Some other Race
0
0.0%
Total
171
100.0%
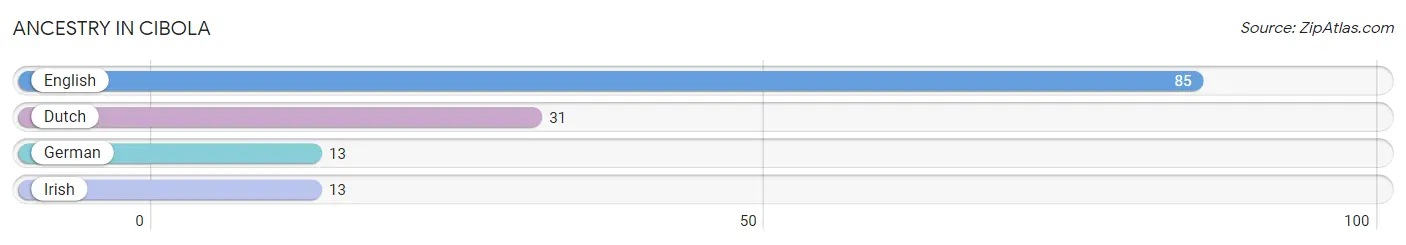
Ancestry in Cibola
The most populous ancestries reported in Cibola are English (85 | 49.7%), Dutch (31 | 18.1%), German (13 | 7.6%), and Irish (13 | 7.6%), together accounting for 83.0% of all Cibola residents.
Ancestry
# Population
% Population
Dutch
31
18.1%
English
85
49.7%
German
13
7.6%
Irish
13
7.6%
View All 4 Rows
Immigrants in Cibola
Immigration Origin
# Population
% Population
View All 0 Rows
Sex and Age in Cibola
Sex and Age in Cibola
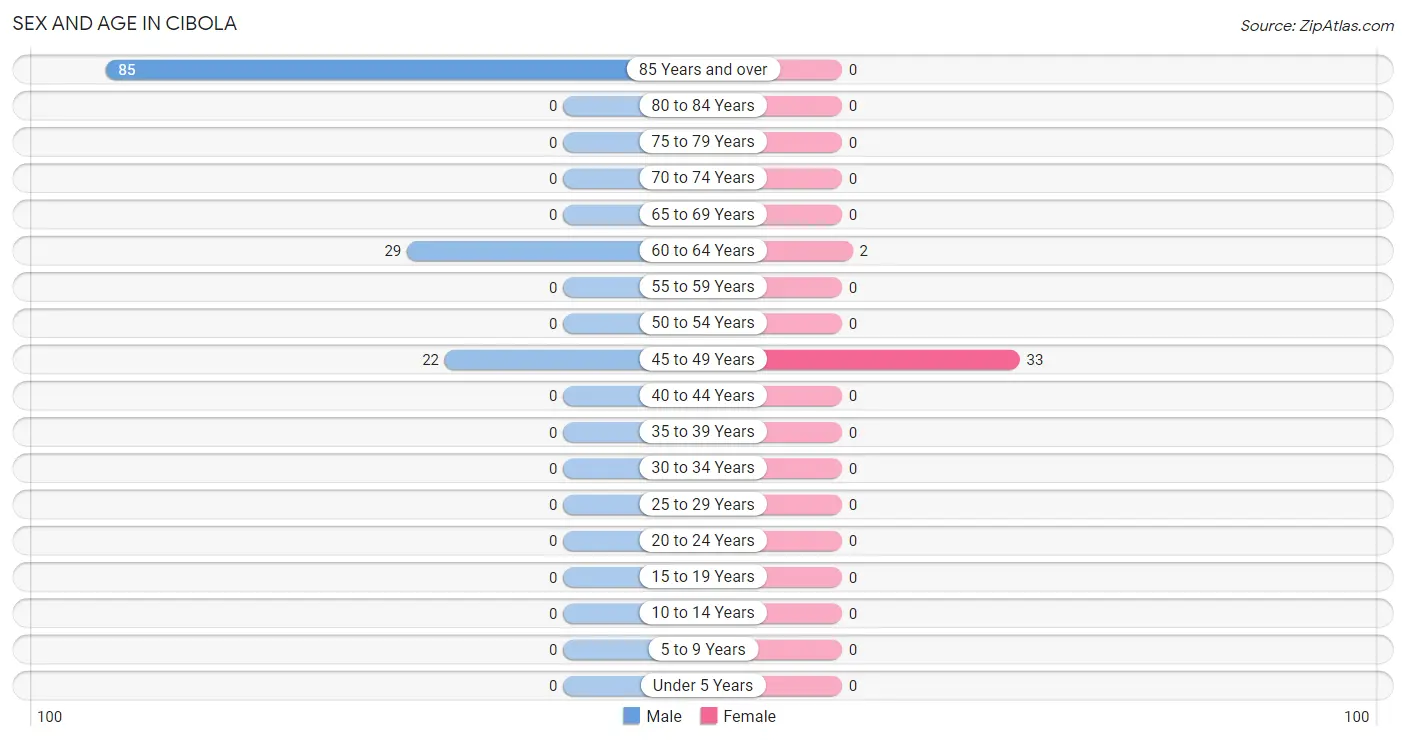
The most populous age groups in Cibola are 85 Years and over (85 | 62.5%) for men and 45 to 49 Years (33 | 94.3%) for women.
Age Bracket
Male
Female
Under 5 Years
0 (0.0%)
0 (0.0%)
5 to 9 Years
0 (0.0%)
0 (0.0%)
10 to 14 Years
0 (0.0%)
0 (0.0%)
15 to 19 Years
0 (0.0%)
0 (0.0%)
20 to 24 Years
0 (0.0%)
0 (0.0%)
25 to 29 Years
0 (0.0%)
0 (0.0%)
30 to 34 Years
0 (0.0%)
0 (0.0%)
35 to 39 Years
0 (0.0%)
0 (0.0%)
40 to 44 Years
0 (0.0%)
0 (0.0%)
45 to 49 Years
22 (16.2%)
33 (94.3%)
50 to 54 Years
0 (0.0%)
0 (0.0%)
55 to 59 Years
0 (0.0%)
0 (0.0%)
60 to 64 Years
29 (21.3%)
2 (5.7%)
65 to 69 Years
0 (0.0%)
0 (0.0%)
70 to 74 Years
0 (0.0%)
0 (0.0%)
75 to 79 Years
0 (0.0%)
0 (0.0%)
80 to 84 Years
0 (0.0%)
0 (0.0%)
85 Years and over
85 (62.5%)
0 (0.0%)
Total
136 (100.0%)
35 (100.0%)
Families and Households in Cibola
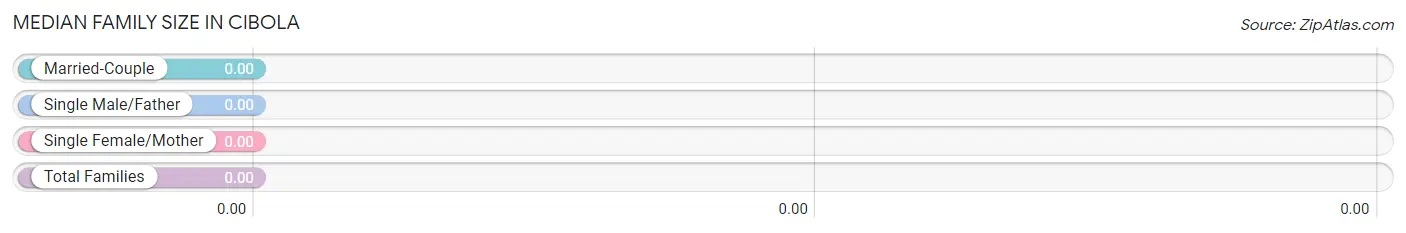
Median Family Size in Cibola
Family Type
# Families
Family Size
Married-Couple
0 (0.0%)
-
Single Male/Father
0 (0.0%)
-
Single Female/Mother
0 (0.0%)
-
Total Families
0 (0.0%)
-
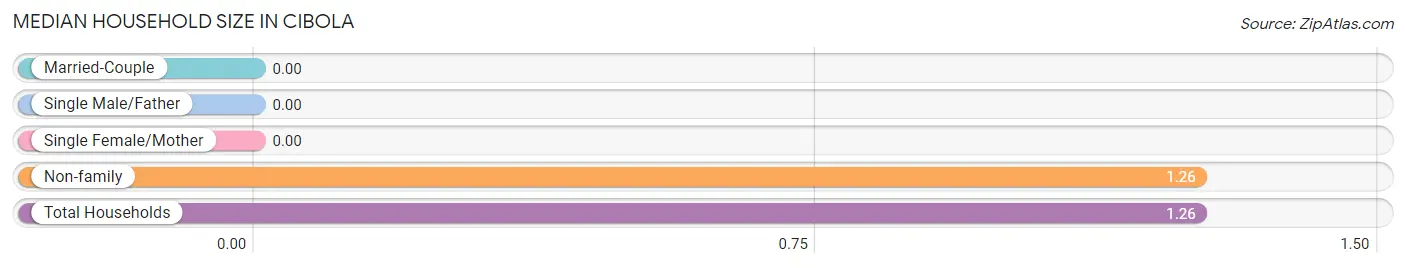
Median Household Size in Cibola
Household Type
# Households
Household Size
Married-Couple
0 (0.0%)
-
Single Male/Father
0 (0.0%)
-
Single Female/Mother
0 (0.0%)
-
Non-family
136 (100.0%)
1.26
Total Households
136 (100.0%)
1.26
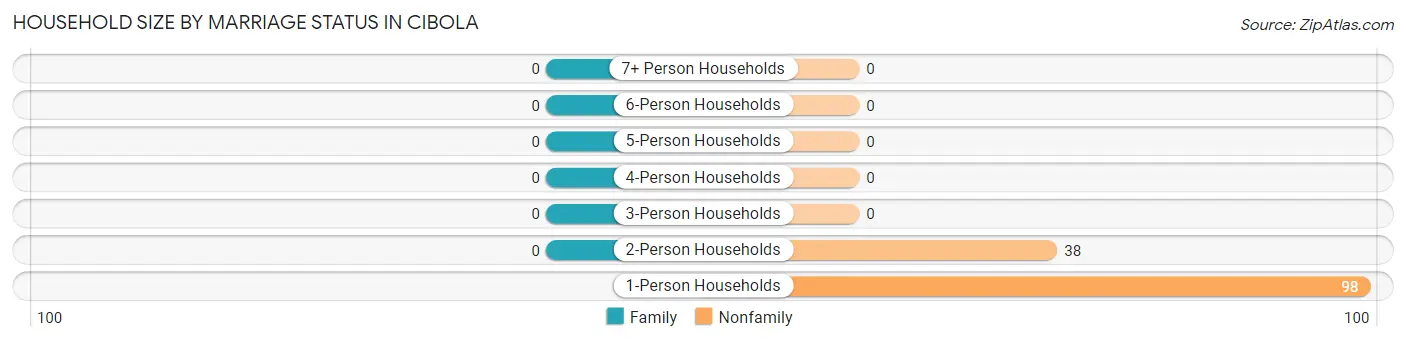
Household Size by Marriage Status in Cibola
Household Size
Family Households
Nonfamily Households
1-Person Households
-
98 (72.1%)
2-Person Households
0 (0.0%)
38 (27.9%)
3-Person Households
0 (0.0%)
0 (0.0%)
4-Person Households
0 (0.0%)
0 (0.0%)
5-Person Households
0 (0.0%)
0 (0.0%)
6-Person Households
0 (0.0%)
0 (0.0%)
7+ Person Households
0 (0.0%)
0 (0.0%)
Total
0 (0.0%)
136 (100.0%)
Female Fertility in Cibola
Fertility by Age in Cibola
Age Bracket
Women with Births
Births / 1,000 Women
15 to 19 years
0 (0.0%)
0.0
20 to 34 years
0 (0.0%)
0.0
35 to 50 years
0 (0.0%)
0.0
Total
0 (0.0%)
0.0
Fertility by Age by Marriage Status in Cibola
Age Bracket
Married
Unmarried
15 to 19 years
0 (0.0%)
0 (0.0%)
20 to 34 years
0 (0.0%)
0 (0.0%)
35 to 50 years
0 (0.0%)
0 (0.0%)
Total
0 (0.0%)
0 (0.0%)
Fertility by Education in Cibola
Educational Attainment
Women with Births
Births / 1,000 Women
Less than High School
0 (0.0%)
0.0
High School Diploma
0 (0.0%)
0.0
College or Associate's Degree
0 (0.0%)
0.0
Bachelor's Degree
0 (0.0%)
0.0
Graduate Degree
0 (0.0%)
0.0
Total
0 (0.0%)
0.0
Fertility by Education by Marriage Status in Cibola
Educational Attainment
Married
Unmarried
Less than High School
0 (0.0%)
0 (0.0%)
High School Diploma
0 (0.0%)
0 (0.0%)
College or Associate's Degree
0 (0.0%)
0 (0.0%)
Bachelor's Degree
0 (0.0%)
0 (0.0%)
Graduate Degree
0 (0.0%)
0 (0.0%)
Total
0 (0.0%)
0 (0.0%)
Employment Characteristics in Cibola
Employment by Class of Employer in Cibola
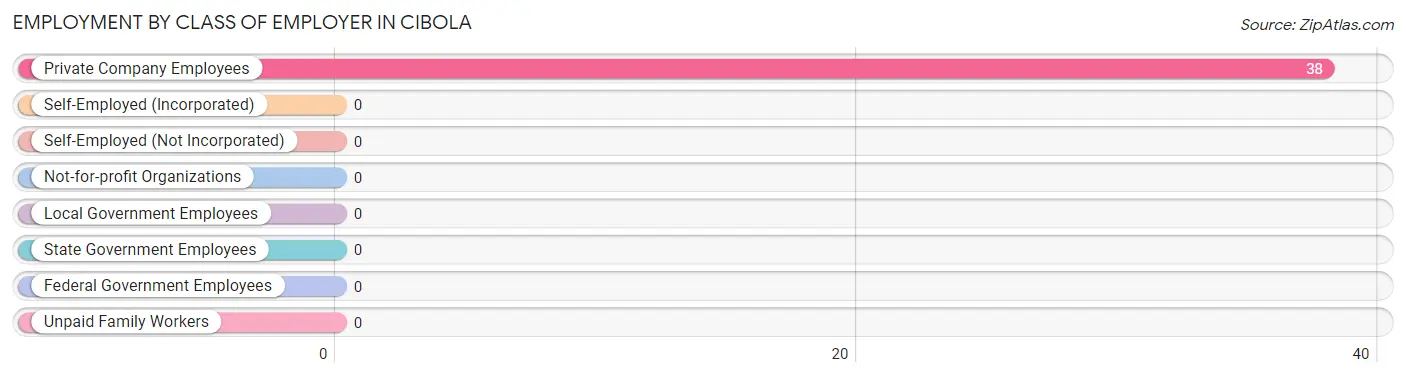
Among the 38 employed individuals in Cibola, , and private company employees (38 | 100.0%) make up the most common classes of employment.
Employer Class
# Employees
% Employees
Private Company Employees
38
100.0%
Self-Employed (Incorporated)
0
0.0%
Self-Employed (Not Incorporated)
0
0.0%
Not-for-profit Organizations
0
0.0%
Local Government Employees
0
0.0%
State Government Employees
0
0.0%
Federal Government Employees
0
0.0%
Unpaid Family Workers
0
0.0%
Total
38
100.0%
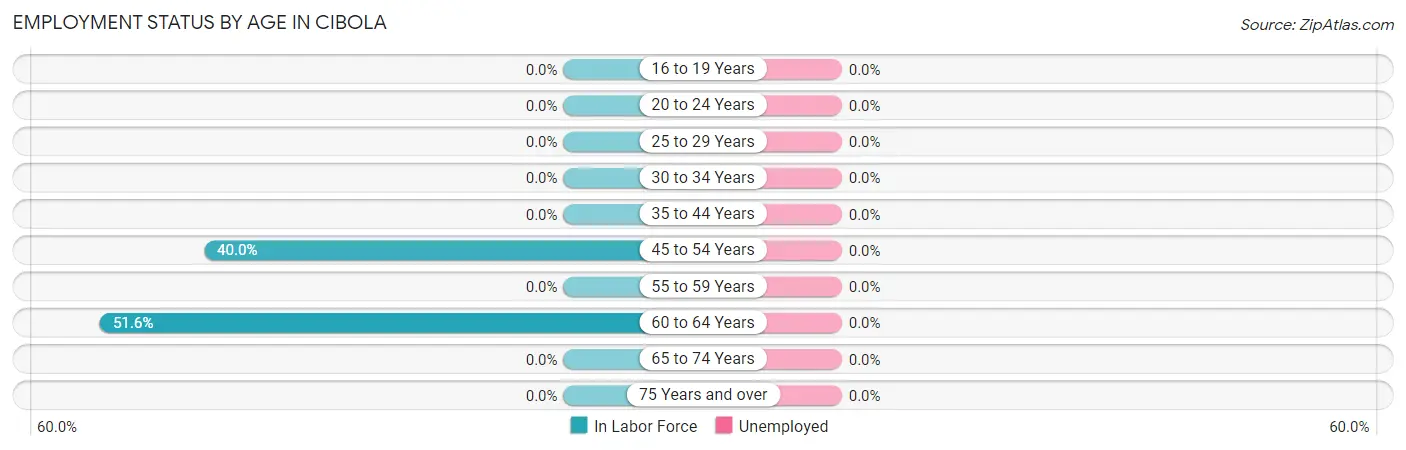
Employment Status by Age in Cibola
Age Bracket
In Labor Force
Unemployed
16 to 19 Years
0 (0.0%)
0 (0.0%)
20 to 24 Years
0 (0.0%)
0 (0.0%)
25 to 29 Years
0 (0.0%)
0 (0.0%)
30 to 34 Years
0 (0.0%)
0 (0.0%)
35 to 44 Years
0 (0.0%)
0 (0.0%)
45 to 54 Years
22 (40.0%)
0 (0.0%)
55 to 59 Years
0 (0.0%)
0 (0.0%)
60 to 64 Years
16 (51.6%)
0 (0.0%)
65 to 74 Years
0 (0.0%)
0 (0.0%)
75 Years and over
0 (0.0%)
0 (0.0%)
Total
38 (22.2%)
0 (0.0%)
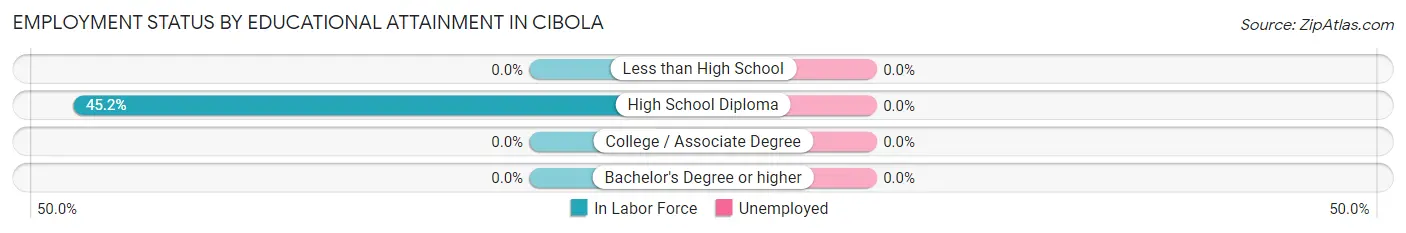
Employment Status by Educational Attainment in Cibola
Educational Attainment
In Labor Force
Unemployed
Less than High School
0 (0.0%)
0 (0.0%)
High School Diploma
38 (45.2%)
0 (0.0%)
College / Associate Degree
0 (0.0%)
0 (0.0%)
Bachelor's Degree or higher
0 (0.0%)
0 (0.0%)
Total
38 (44.2%)
0 (0.0%)
Employment Occupations by Sex in Cibola
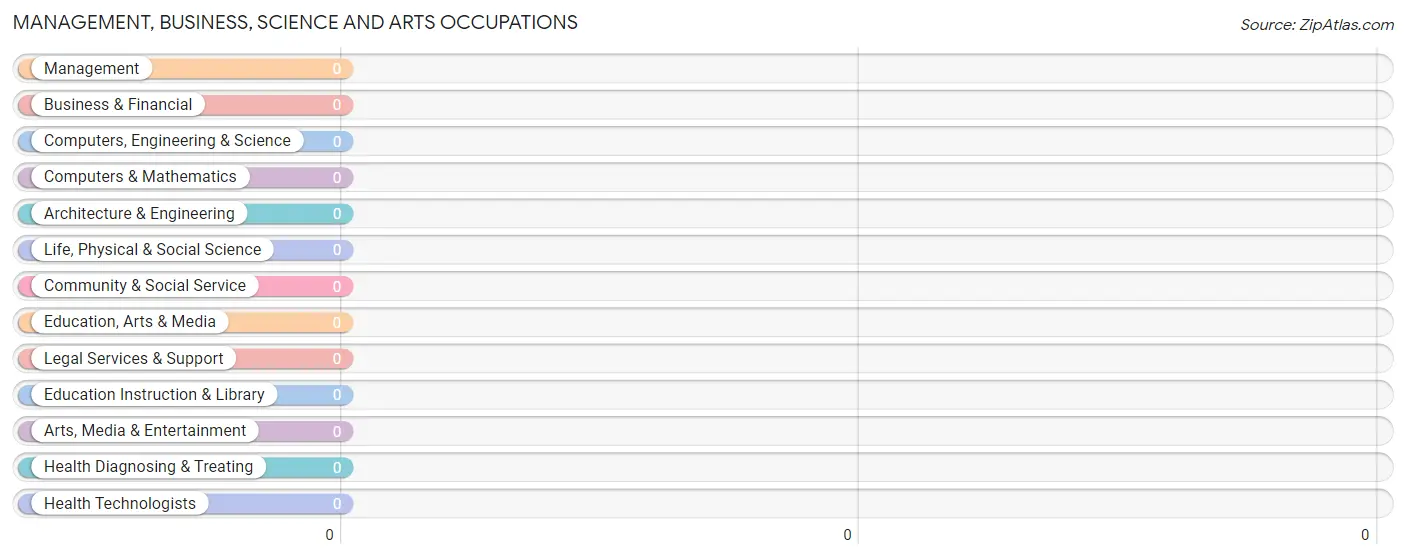
Management, Business, Science and Arts Occupations
Management, Business, Science and Arts Occupations by Sex
Occupation
Male
Female
Management
0 (0.0%)
0 (0.0%)
Business & Financial
0 (0.0%)
0 (0.0%)
Computers, Engineering & Science
0 (0.0%)
0 (0.0%)
Computers & Mathematics
0 (0.0%)
0 (0.0%)
Architecture & Engineering
0 (0.0%)
0 (0.0%)
Life, Physical & Social Science
0 (0.0%)
0 (0.0%)
Community & Social Service
0 (0.0%)
0 (0.0%)
Education, Arts & Media
0 (0.0%)
0 (0.0%)
Legal Services & Support
0 (0.0%)
0 (0.0%)
Education Instruction & Library
0 (0.0%)
0 (0.0%)
Arts, Media & Entertainment
0 (0.0%)
0 (0.0%)
Health Diagnosing & Treating
0 (0.0%)
0 (0.0%)
Health Technologists
0 (0.0%)
0 (0.0%)
Total (Category)
0 (0.0%)
0 (0.0%)
Total (Overall)
38 (100.0%)
0 (0.0%)
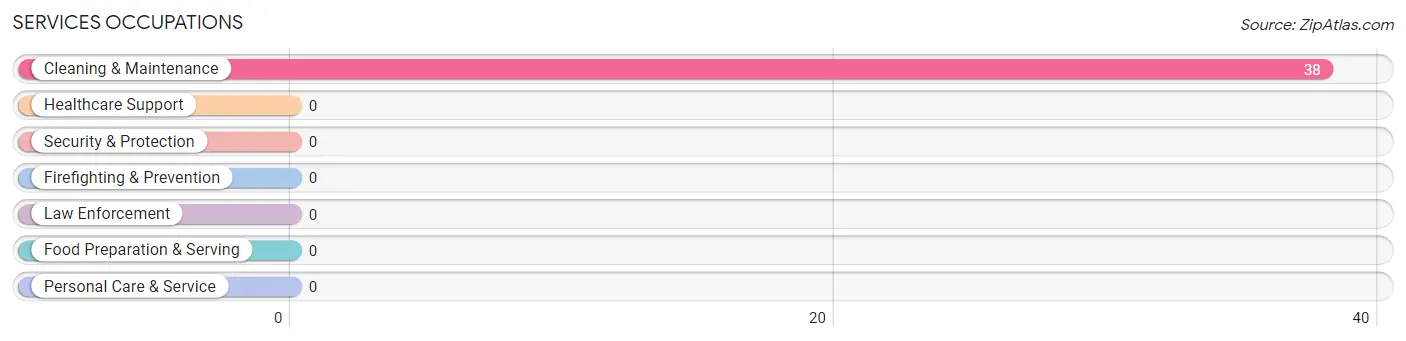
Services Occupations
The most common Services occupations in Cibola are , and Cleaning & Maintenance (38 | 100.0%).
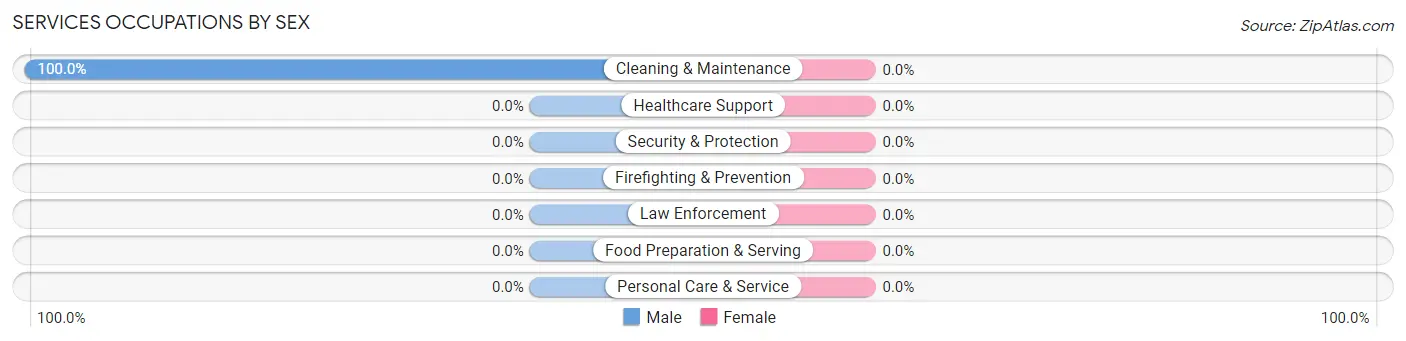
Services Occupations by Sex
Occupation
Male
Female
Healthcare Support
0 (0.0%)
0 (0.0%)
Security & Protection
0 (0.0%)
0 (0.0%)
Firefighting & Prevention
0 (0.0%)
0 (0.0%)
Law Enforcement
0 (0.0%)
0 (0.0%)
Food Preparation & Serving
0 (0.0%)
0 (0.0%)
Cleaning & Maintenance
38 (100.0%)
0 (0.0%)
Personal Care & Service
0 (0.0%)
0 (0.0%)
Total (Category)
38 (100.0%)
0 (0.0%)
Total (Overall)
38 (100.0%)
0 (0.0%)
Sales and Office Occupations
Sales and Office Occupations by Sex
Occupation
Male
Female
Sales & Related
0 (0.0%)
0 (0.0%)
Office & Administration
0 (0.0%)
0 (0.0%)
Total (Category)
0 (0.0%)
0 (0.0%)
Total (Overall)
38 (100.0%)
0 (0.0%)
Natural Resources, Construction and Maintenance Occupations
Natural Resources, Construction and Maintenance Occupations by Sex
Occupation
Male
Female
Farming, Fishing & Forestry
0 (0.0%)
0 (0.0%)
Construction & Extraction
0 (0.0%)
0 (0.0%)
Installation, Maintenance & Repair
0 (0.0%)
0 (0.0%)
Total (Category)
0 (0.0%)
0 (0.0%)
Total (Overall)
38 (100.0%)
0 (0.0%)
Production, Transportation and Moving Occupations
Production, Transportation and Moving Occupations by Sex
Occupation
Male
Female
Production
0 (0.0%)
0 (0.0%)
Transportation
0 (0.0%)
0 (0.0%)
Material Moving
0 (0.0%)
0 (0.0%)
Total (Category)
0 (0.0%)
0 (0.0%)
Total (Overall)
38 (100.0%)
0 (0.0%)
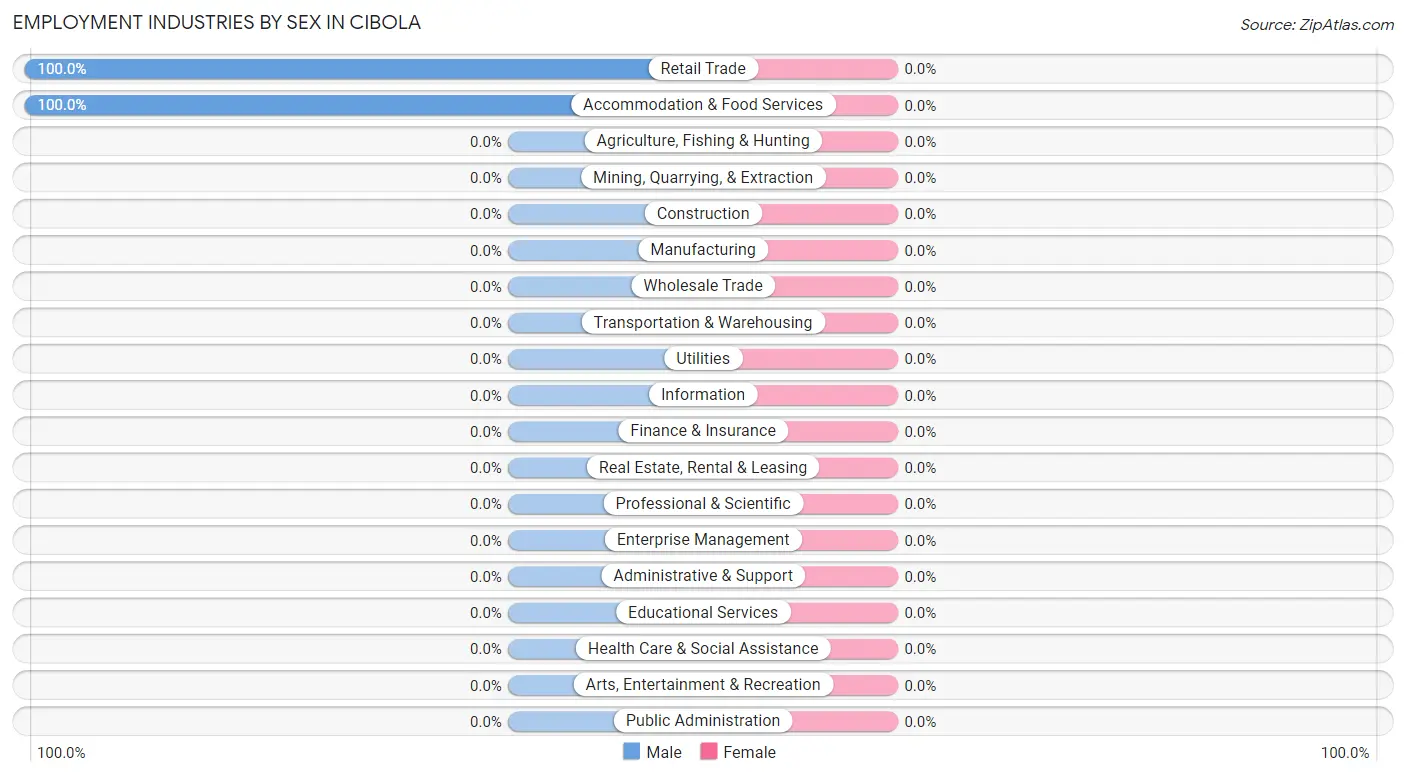
Employment Industries by Sex in Cibola
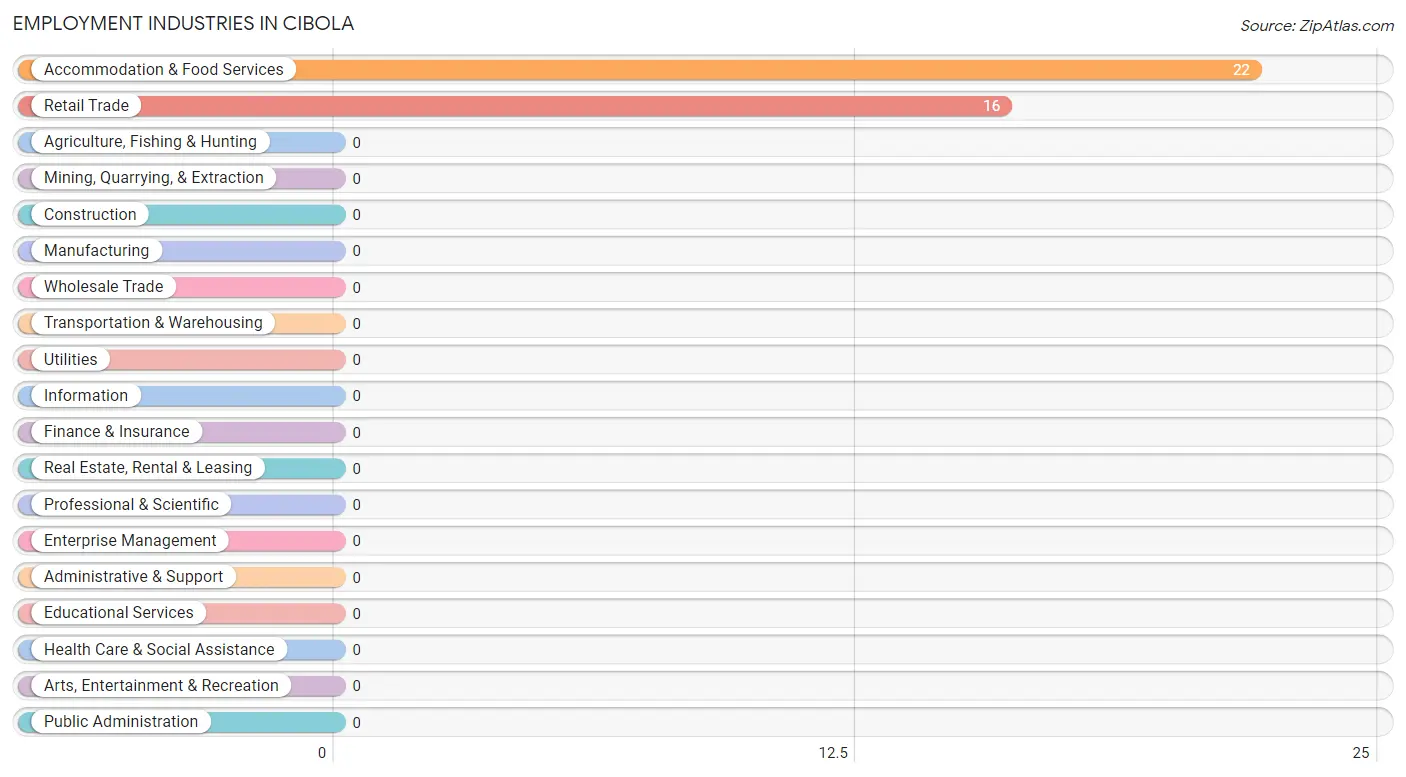
Employment Industries in Cibola
The major employment industries in Cibola include Accommodation & Food Services (22 | 57.9%), and Retail Trade (16 | 42.1%).
Employment Industries by Sex in Cibola
Industry
Male
Female
Agriculture, Fishing & Hunting
0 (0.0%)
0 (0.0%)
Mining, Quarrying, & Extraction
0 (0.0%)
0 (0.0%)
Construction
0 (0.0%)
0 (0.0%)
Manufacturing
0 (0.0%)
0 (0.0%)
Wholesale Trade
0 (0.0%)
0 (0.0%)
Retail Trade
16 (100.0%)
0 (0.0%)
Transportation & Warehousing
0 (0.0%)
0 (0.0%)
Utilities
0 (0.0%)
0 (0.0%)
Information
0 (0.0%)
0 (0.0%)
Finance & Insurance
0 (0.0%)
0 (0.0%)
Real Estate, Rental & Leasing
0 (0.0%)
0 (0.0%)
Professional & Scientific
0 (0.0%)
0 (0.0%)
Enterprise Management
0 (0.0%)
0 (0.0%)
Administrative & Support
0 (0.0%)
0 (0.0%)
Educational Services
0 (0.0%)
0 (0.0%)
Health Care & Social Assistance
0 (0.0%)
0 (0.0%)
Arts, Entertainment & Recreation
0 (0.0%)
0 (0.0%)
Accommodation & Food Services
22 (100.0%)
0 (0.0%)
Public Administration
0 (0.0%)
0 (0.0%)
Total
38 (100.0%)
0 (0.0%)
Education in Cibola
School Enrollment in Cibola
School Level
# Students
% Students
Nursery / Preschool
0
0.0%
Kindergarten
0
0.0%
Elementary School
0
0.0%
Middle School
0
0.0%
High School
0
0.0%
College / Undergraduate
0
0.0%
Graduate / Professional
0
0.0%
Total
0
0.0%
School Enrollment by Age by Funding Source in Cibola
Age Bracket
Public School
Private School
3 to 4 Year Olds
0 (0.0%)
0 (0.0%)
5 to 9 Year Old
0 (0.0%)
0 (0.0%)
10 to 14 Year Olds
0 (0.0%)
0 (0.0%)
15 to 17 Year Olds
0 (0.0%)
0 (0.0%)
18 to 19 Year Olds
0 (0.0%)
0 (0.0%)
20 to 24 Year Olds
0 (0.0%)
0 (0.0%)
25 to 34 Year Olds
0 (0.0%)
0 (0.0%)
35 Years and over
0 (0.0%)
0 (0.0%)
Total
0 (0.0%)
0 (0.0%)
Educational Attainment by Field of Study in Cibola
Field of Study
# Graduates
% Graduates
Computers & Mathematics
0
0.0%
Bio, Nature & Agricultural
0
0.0%
Physical & Health Sciences
0
0.0%
Psychology
0
0.0%
Social Sciences
0
0.0%
Engineering
0
0.0%
Multidisciplinary Studies
0
0.0%
Science & Technology
0
0.0%
Business
0
0.0%
Education
0
0.0%
Literature & Languages
0
0.0%
Liberal Arts & History
0
0.0%
Visual & Performing Arts
0
0.0%
Communications
0
0.0%
Arts & Humanities
0
0.0%
Total
0
0.0%
Transportation & Commute in Cibola
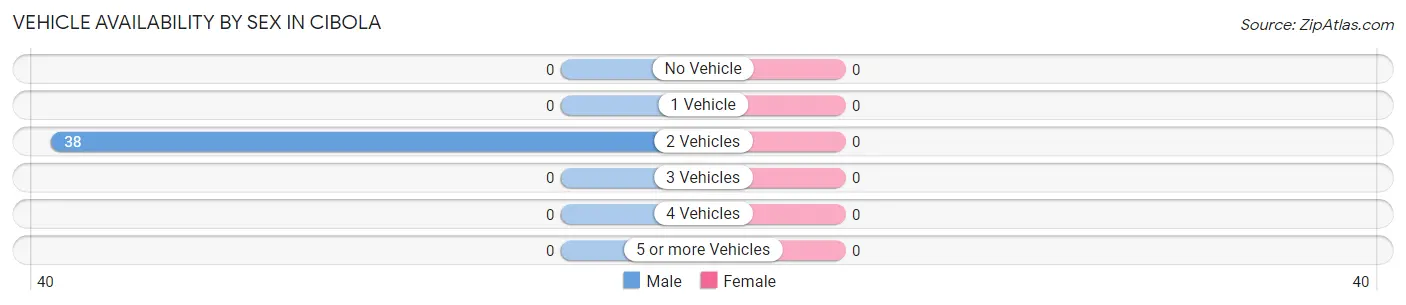
Vehicle Availability by Sex in Cibola
Vehicles Available
Male
Female
No Vehicle
0 (0.0%)
0 (0.0%)
1 Vehicle
0 (0.0%)
0 (0.0%)
2 Vehicles
38 (100.0%)
0 (0.0%)
3 Vehicles
0 (0.0%)
0 (0.0%)
4 Vehicles
0 (0.0%)
0 (0.0%)
5 or more Vehicles
0 (0.0%)
0 (0.0%)
Total
38 (100.0%)
0 (0.0%)
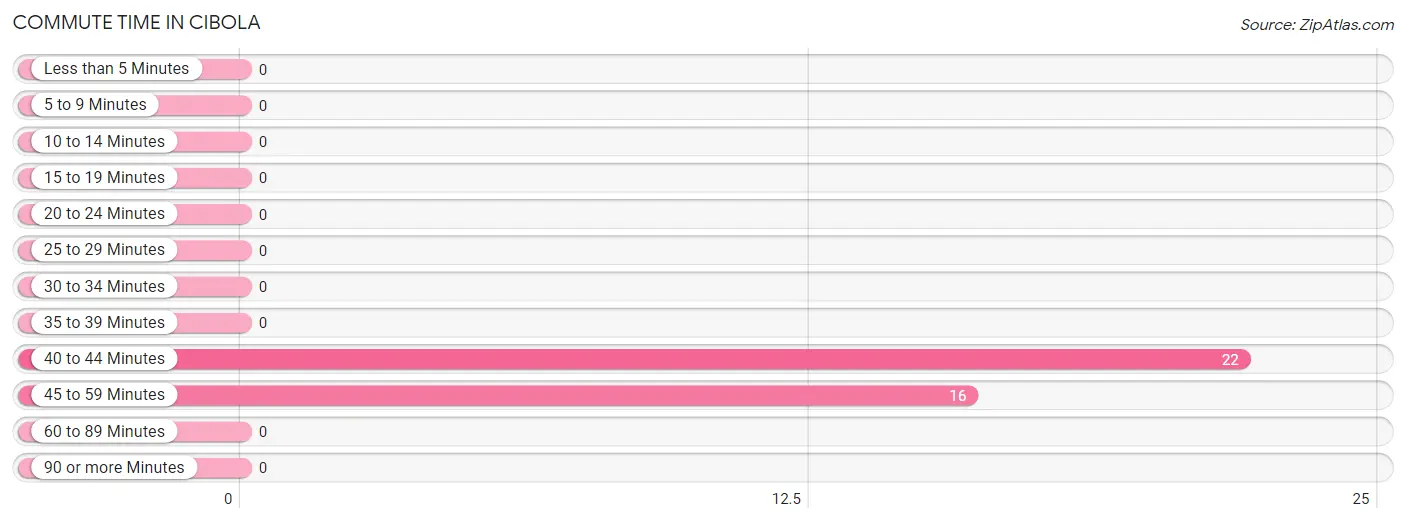
Commute Time in Cibola
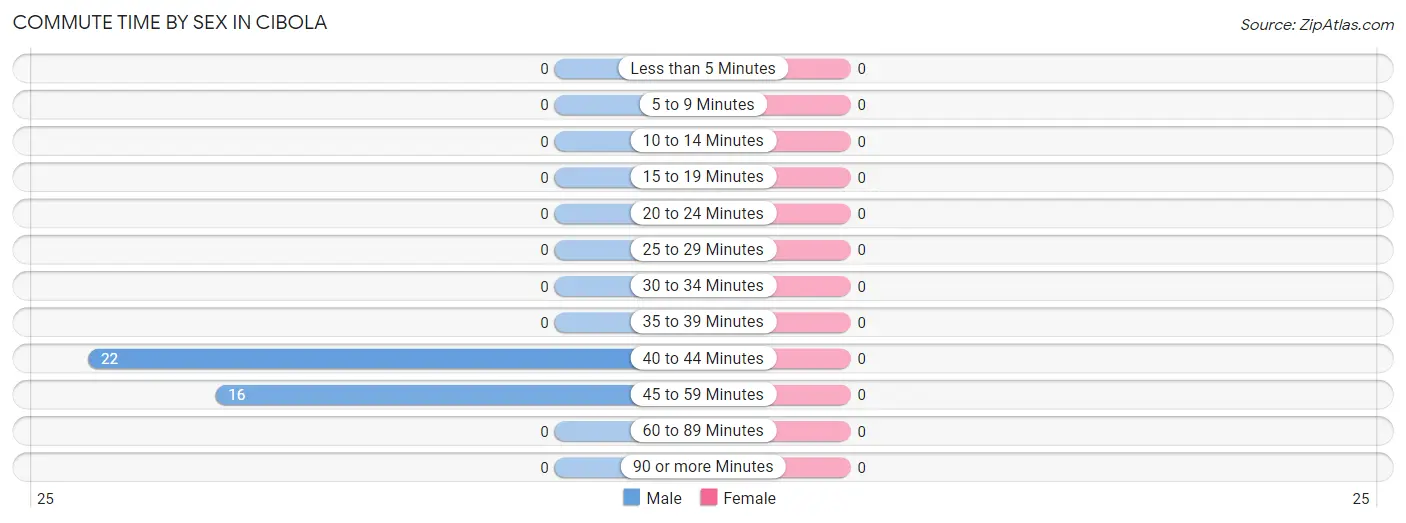
The most frequently occuring commute durations in Cibola are 40 to 44 minutes (22 commuters, 57.9%), 45 to 59 minutes (16 commuters, 42.1%), and less than 5 minutes (0 commuters, 0.0%).
Commute Time
# Commuters
% Commuters
Less than 5 Minutes
0
0.0%
5 to 9 Minutes
0
0.0%
10 to 14 Minutes
0
0.0%
15 to 19 Minutes
0
0.0%
20 to 24 Minutes
0
0.0%
25 to 29 Minutes
0
0.0%
30 to 34 Minutes
0
0.0%
35 to 39 Minutes
0
0.0%
40 to 44 Minutes
22
57.9%
45 to 59 Minutes
16
42.1%
60 to 89 Minutes
0
0.0%
90 or more Minutes
0
0.0%
Commute Time by Sex in Cibola
Commute Time
Male
Female
Less than 5 Minutes
0 (0.0%)
0 (0.0%)
5 to 9 Minutes
0 (0.0%)
0 (0.0%)
10 to 14 Minutes
0 (0.0%)
0 (0.0%)
15 to 19 Minutes
0 (0.0%)
0 (0.0%)
20 to 24 Minutes
0 (0.0%)
0 (0.0%)
25 to 29 Minutes
0 (0.0%)
0 (0.0%)
30 to 34 Minutes
0 (0.0%)
0 (0.0%)
35 to 39 Minutes
0 (0.0%)
0 (0.0%)
40 to 44 Minutes
22 (57.9%)
0 (0.0%)
45 to 59 Minutes
16 (42.1%)
0 (0.0%)
60 to 89 Minutes
0 (0.0%)
0 (0.0%)
90 or more Minutes
0 (0.0%)
0 (0.0%)
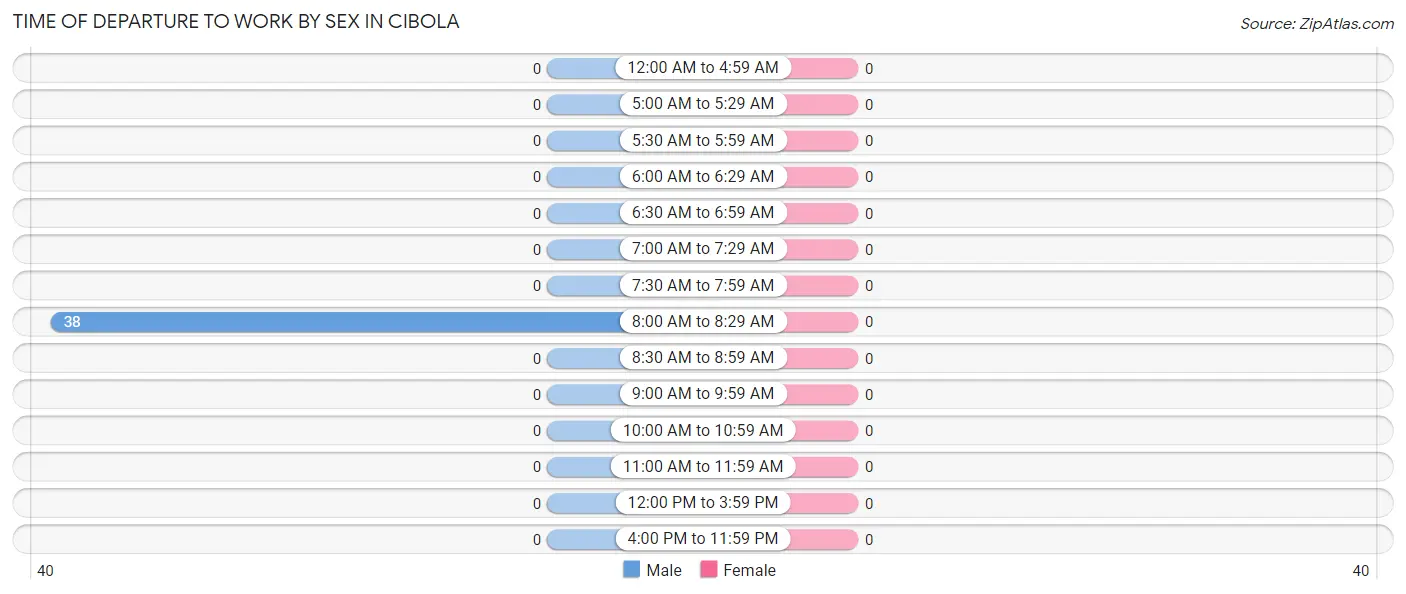
Time of Departure to Work by Sex in Cibola
Time of Departure
Male
Female
12:00 AM to 4:59 AM
0 (0.0%)
0 (0.0%)
5:00 AM to 5:29 AM
0 (0.0%)
0 (0.0%)
5:30 AM to 5:59 AM
0 (0.0%)
0 (0.0%)
6:00 AM to 6:29 AM
0 (0.0%)
0 (0.0%)
6:30 AM to 6:59 AM
0 (0.0%)
0 (0.0%)
7:00 AM to 7:29 AM
0 (0.0%)
0 (0.0%)
7:30 AM to 7:59 AM
0 (0.0%)
0 (0.0%)
8:00 AM to 8:29 AM
38 (100.0%)
0 (0.0%)
8:30 AM to 8:59 AM
0 (0.0%)
0 (0.0%)
9:00 AM to 9:59 AM
0 (0.0%)
0 (0.0%)
10:00 AM to 10:59 AM
0 (0.0%)
0 (0.0%)
11:00 AM to 11:59 AM
0 (0.0%)
0 (0.0%)
12:00 PM to 3:59 PM
0 (0.0%)
0 (0.0%)
4:00 PM to 11:59 PM
0 (0.0%)
0 (0.0%)
Total
38 (100.0%)
0 (0.0%)
Housing Occupancy in Cibola
Occupancy by Ownership in Cibola
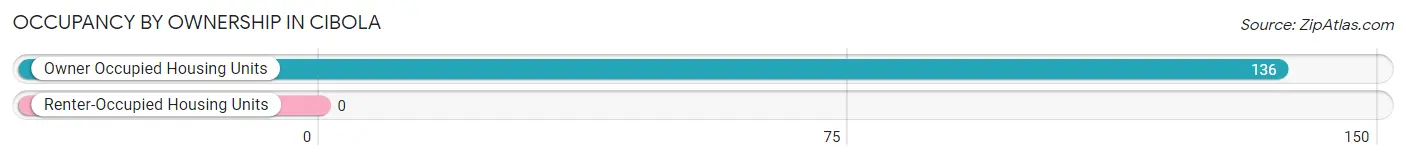
Of the total 136 dwellings in Cibola, owner-occupied units account for 136 (100.0%), while renter-occupied units make up 0 (0.0%).
Occupancy
# Housing Units
% Housing Units
Owner Occupied Housing Units
136
100.0%
Renter-Occupied Housing Units
0
0.0%
Total Occupied Housing Units
136
100.0%
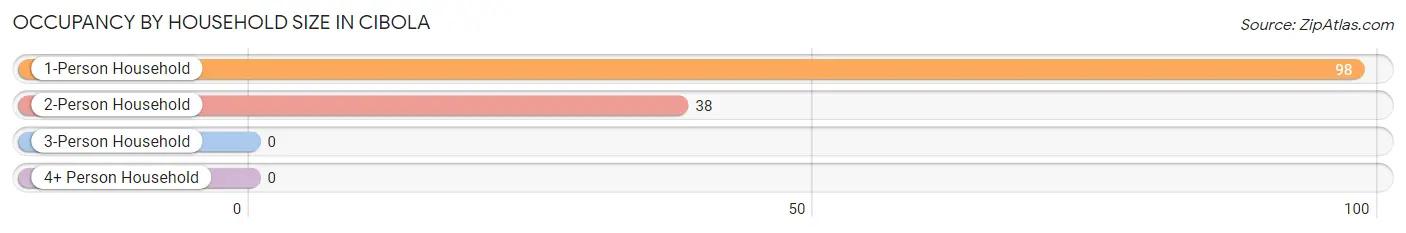
Occupancy by Household Size in Cibola
Household Size
# Housing Units
% Housing Units
1-Person Household
98
72.1%
2-Person Household
38
27.9%
3-Person Household
0
0.0%
4+ Person Household
0
0.0%
Total Housing Units
136
100.0%
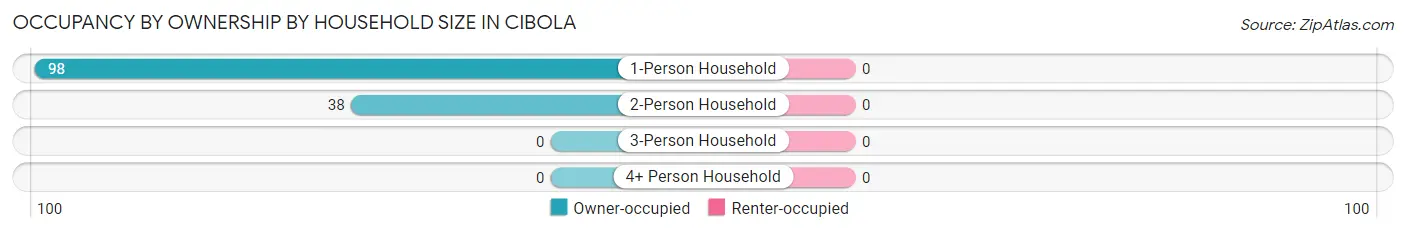
Occupancy by Ownership by Household Size in Cibola
Household Size
Owner-occupied
Renter-occupied
1-Person Household
98 (100.0%)
0 (0.0%)
2-Person Household
38 (100.0%)
0 (0.0%)
3-Person Household
0 (0.0%)
0 (0.0%)
4+ Person Household
0 (0.0%)
0 (0.0%)
Total Housing Units
136 (100.0%)
0 (0.0%)
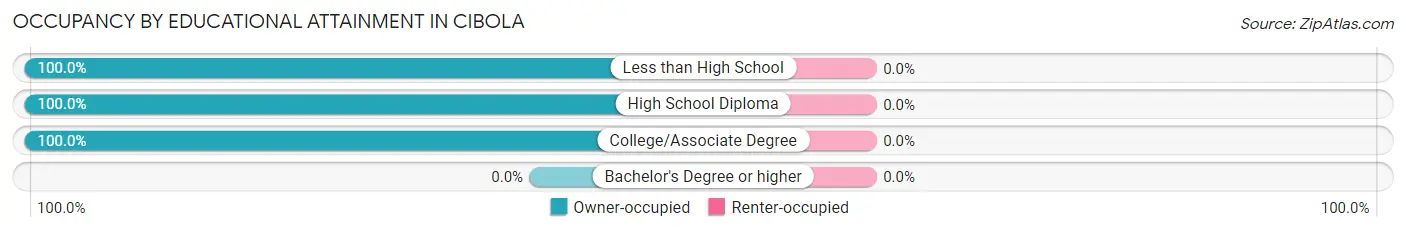
Occupancy by Educational Attainment in Cibola
Household Size
Owner-occupied
Renter-occupied
Less than High School
54 (100.0%)
0 (0.0%)
High School Diploma
51 (100.0%)
0 (0.0%)
College/Associate Degree
31 (100.0%)
0 (0.0%)
Bachelor's Degree or higher
0 (0.0%)
0 (0.0%)
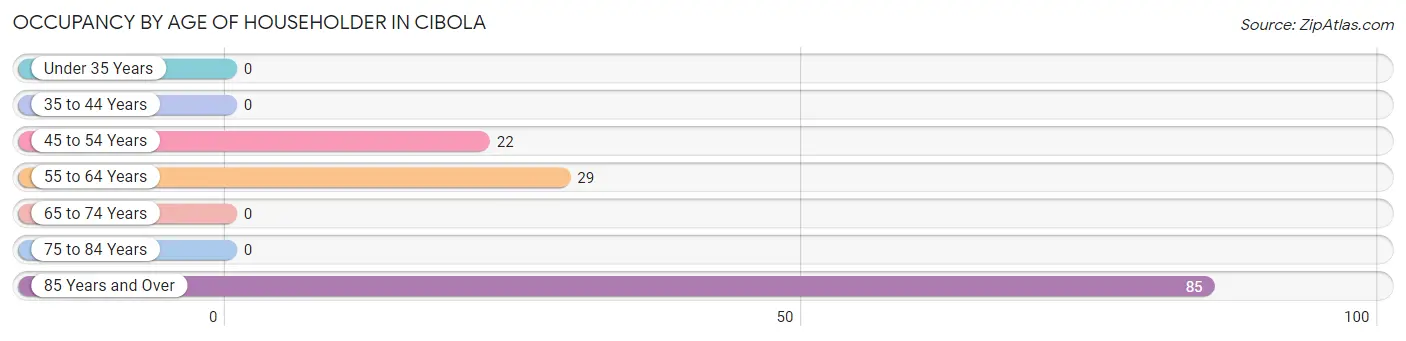
Occupancy by Age of Householder in Cibola
Age Bracket
# Households
% Households
Under 35 Years
0
0.0%
35 to 44 Years
0
0.0%
45 to 54 Years
22
16.2%
55 to 64 Years
29
21.3%
65 to 74 Years
0
0.0%
75 to 84 Years
0
0.0%
85 Years and Over
85
62.5%
Total
136
100.0%
Housing Finances in Cibola
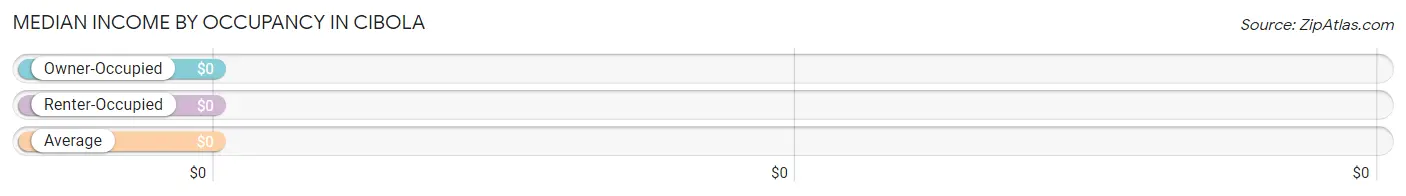
Median Income by Occupancy in Cibola
Occupancy Type
# Households
Median Income
Owner-Occupied
136 (100.0%)
$0
Renter-Occupied
0 (0.0%)
$0
Average
136 (100.0%)
$0
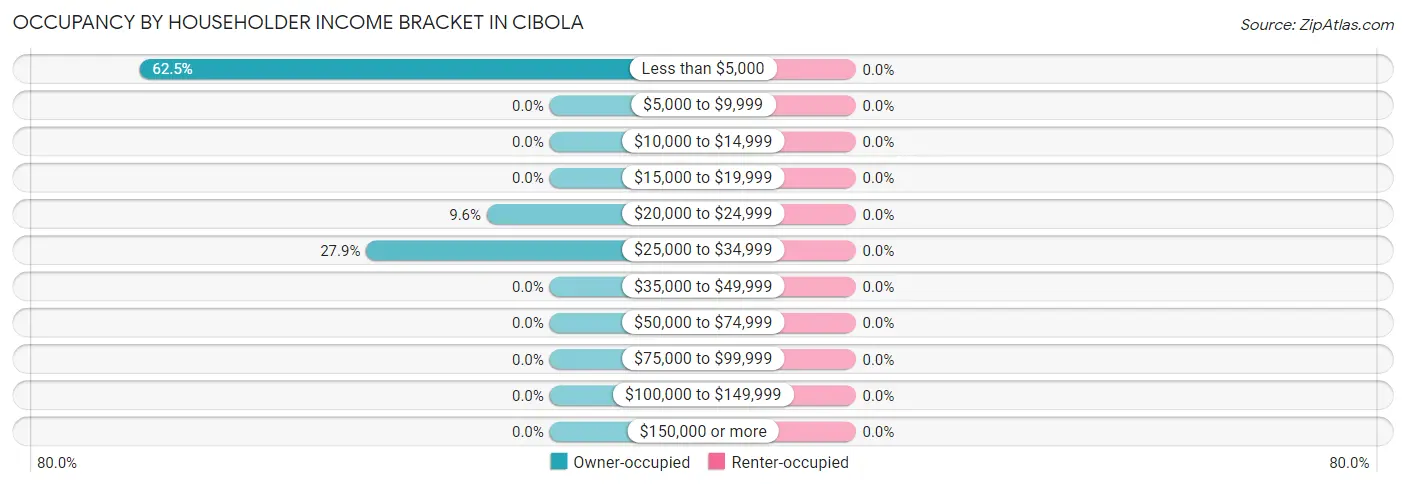
Occupancy by Householder Income Bracket in Cibola
Income Bracket
Owner-occupied
Renter-occupied
Less than $5,000
85 (62.5%)
0 (0.0%)
$5,000 to $9,999
0 (0.0%)
0 (0.0%)
$10,000 to $14,999
0 (0.0%)
0 (0.0%)
$15,000 to $19,999
0 (0.0%)
0 (0.0%)
$20,000 to $24,999
13 (9.6%)
0 (0.0%)
$25,000 to $34,999
38 (27.9%)
0 (0.0%)
$35,000 to $49,999
0 (0.0%)
0 (0.0%)
$50,000 to $74,999
0 (0.0%)
0 (0.0%)
$75,000 to $99,999
0 (0.0%)
0 (0.0%)
$100,000 to $149,999
0 (0.0%)
0 (0.0%)
$150,000 or more
0 (0.0%)
0 (0.0%)
Total
136 (100.0%)
0 (0.0%)
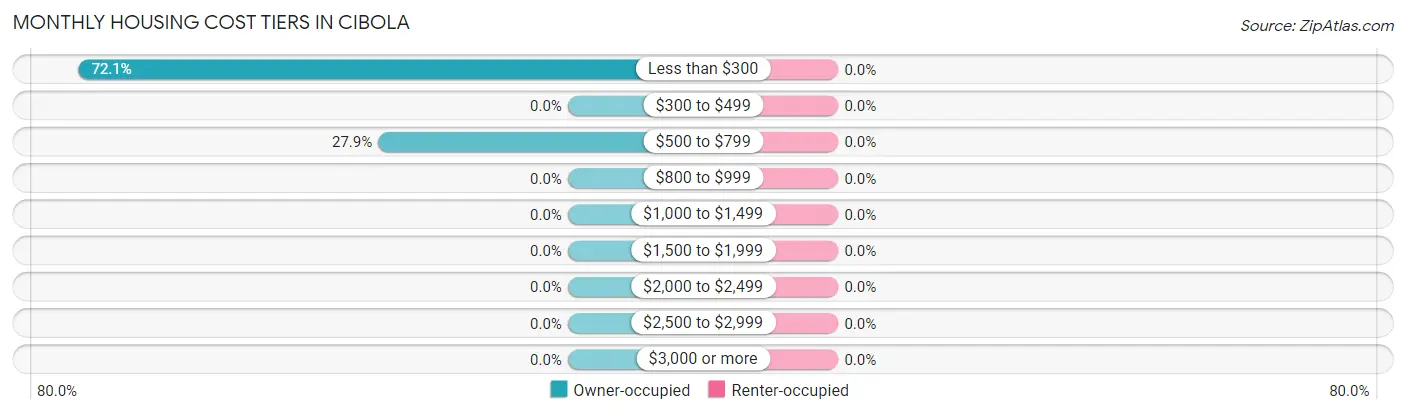
Monthly Housing Cost Tiers in Cibola
Monthly Cost
Owner-occupied
Renter-occupied
Less than $300
98 (72.1%)
0 (0.0%)
$300 to $499
0 (0.0%)
0 (0.0%)
$500 to $799
38 (27.9%)
0 (0.0%)
$800 to $999
0 (0.0%)
0 (0.0%)
$1,000 to $1,499
0 (0.0%)
0 (0.0%)
$1,500 to $1,999
0 (0.0%)
0 (0.0%)
$2,000 to $2,499
0 (0.0%)
0 (0.0%)
$2,500 to $2,999
0 (0.0%)
0 (0.0%)
$3,000 or more
0 (0.0%)
0 (0.0%)
Total
136 (100.0%)
0 (0.0%)
Physical Housing Characteristics in Cibola
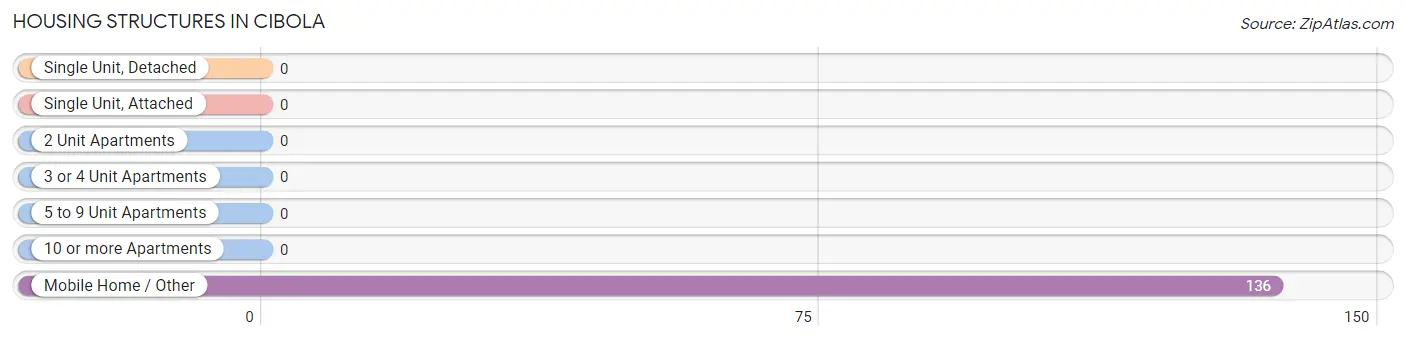
Housing Structures in Cibola
Structure Type
# Housing Units
% Housing Units
Single Unit, Detached
0
0.0%
Single Unit, Attached
0
0.0%
2 Unit Apartments
0
0.0%
3 or 4 Unit Apartments
0
0.0%
5 to 9 Unit Apartments
0
0.0%
10 or more Apartments
0
0.0%
Mobile Home / Other
136
100.0%
Total
136
100.0%
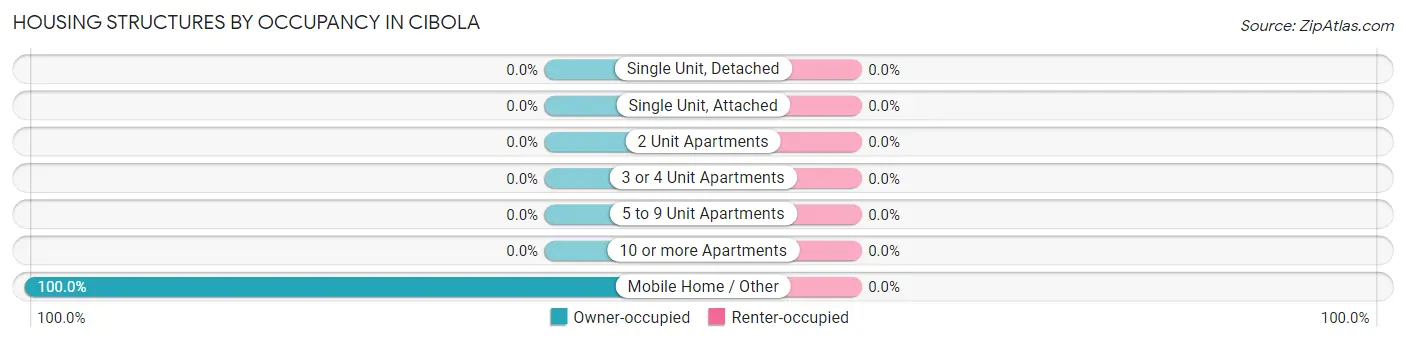
Housing Structures by Occupancy in Cibola
Structure Type
Owner-occupied
Renter-occupied
Single Unit, Detached
0 (0.0%)
0 (0.0%)
Single Unit, Attached
0 (0.0%)
0 (0.0%)
2 Unit Apartments
0 (0.0%)
0 (0.0%)
3 or 4 Unit Apartments
0 (0.0%)
0 (0.0%)
5 to 9 Unit Apartments
0 (0.0%)
0 (0.0%)
10 or more Apartments
0 (0.0%)
0 (0.0%)
Mobile Home / Other
136 (100.0%)
0 (0.0%)
Total
136 (100.0%)
0 (0.0%)
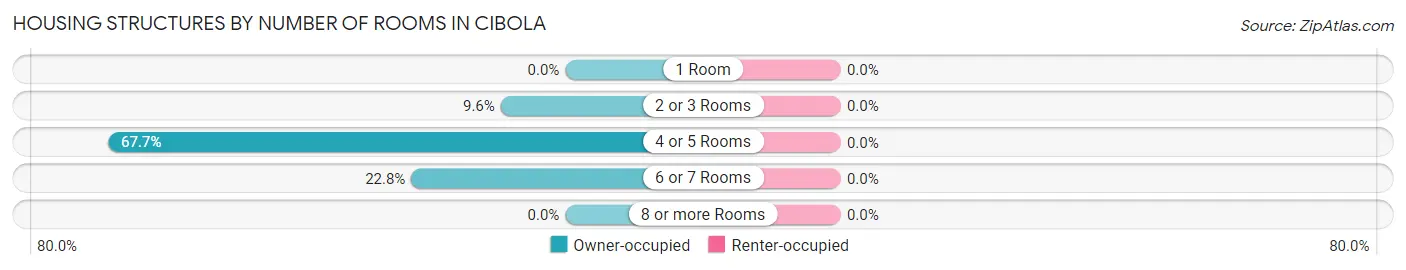
Housing Structures by Number of Rooms in Cibola
Number of Rooms
Owner-occupied
Renter-occupied
1 Room
0 (0.0%)
0 (0.0%)
2 or 3 Rooms
13 (9.6%)
0 (0.0%)
4 or 5 Rooms
92 (67.6%)
0 (0.0%)
6 or 7 Rooms
31 (22.8%)
0 (0.0%)
8 or more Rooms
0 (0.0%)
0 (0.0%)
Total
136 (100.0%)
0 (0.0%)
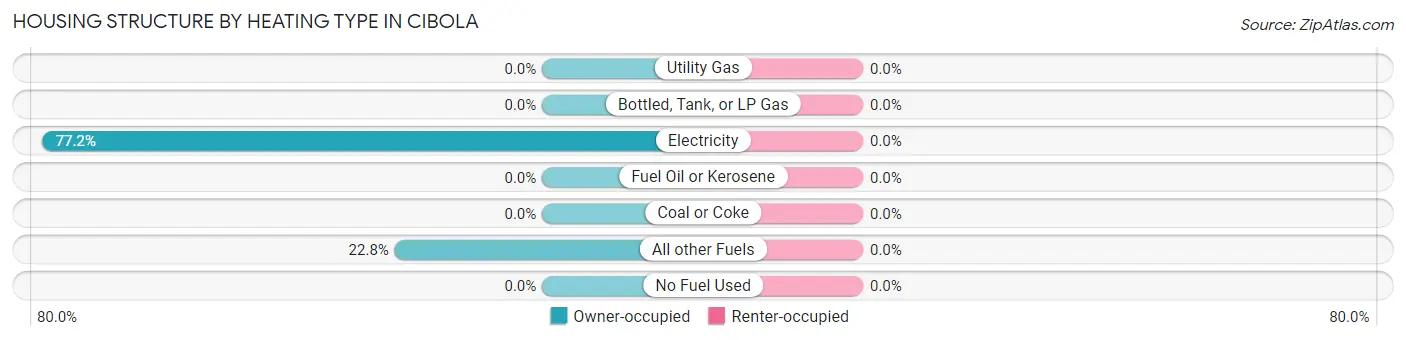
Housing Structure by Heating Type in Cibola
Heating Type
Owner-occupied
Renter-occupied
Utility Gas
0 (0.0%)
0 (0.0%)
Bottled, Tank, or LP Gas
0 (0.0%)
0 (0.0%)
Electricity
105 (77.2%)
0 (0.0%)
Fuel Oil or Kerosene
0 (0.0%)
0 (0.0%)
Coal or Coke
0 (0.0%)
0 (0.0%)
All other Fuels
31 (22.8%)
0 (0.0%)
No Fuel Used
0 (0.0%)
0 (0.0%)
Total
136 (100.0%)
0 (0.0%)
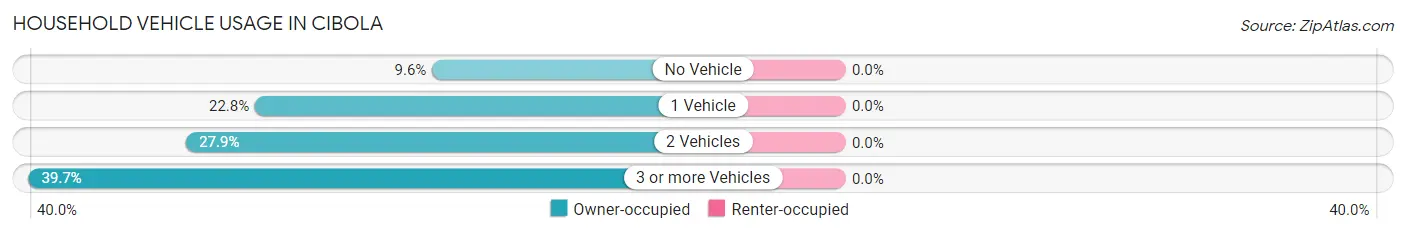
Household Vehicle Usage in Cibola
Vehicles per Household
Owner-occupied
Renter-occupied
No Vehicle
13 (9.6%)
0 (0.0%)
1 Vehicle
31 (22.8%)
0 (0.0%)
2 Vehicles
38 (27.9%)
0 (0.0%)
3 or more Vehicles
54 (39.7%)
0 (0.0%)
Total
136 (100.0%)
0 (0.0%)
Real Estate & Mortgages in Cibola
Real Estate and Mortgage Overview in Cibola
Characteristic
Without Mortgage
With Mortgage
Housing Units
136
0
Median Property Value
$37,200
$0
Median Household Income
-
-
Monthly Housing Costs
-
-
Real Estate Taxes
-
-
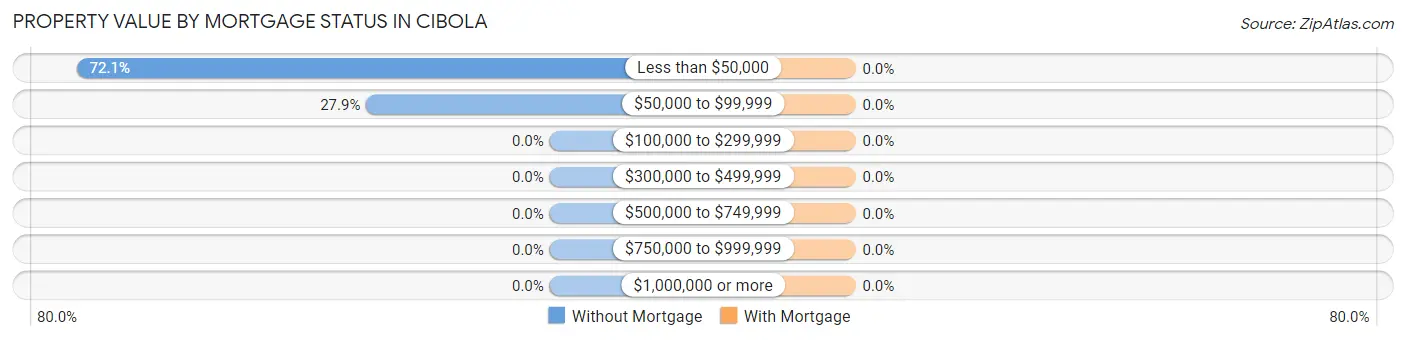
Property Value by Mortgage Status in Cibola
Property Value
Without Mortgage
With Mortgage
Less than $50,000
98 (72.1%)
0 (0.0%)
$50,000 to $99,999
38 (27.9%)
0 (0.0%)
$100,000 to $299,999
0 (0.0%)
0 (0.0%)
$300,000 to $499,999
0 (0.0%)
0 (0.0%)
$500,000 to $749,999
0 (0.0%)
0 (0.0%)
$750,000 to $999,999
0 (0.0%)
0 (0.0%)
$1,000,000 or more
0 (0.0%)
0 (0.0%)
Total
136 (100.0%)
0 (0.0%)
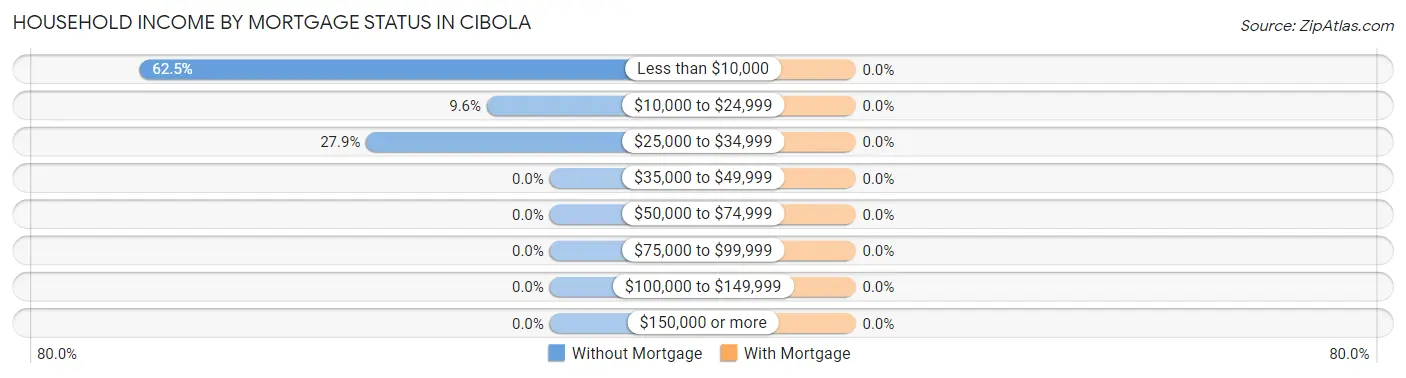
Household Income by Mortgage Status in Cibola
Household Income
Without Mortgage
With Mortgage
Less than $10,000
85 (62.5%)
0 (0.0%)
$10,000 to $24,999
13 (9.6%)
0 (0.0%)
$25,000 to $34,999
38 (27.9%)
0 (0.0%)
$35,000 to $49,999
0 (0.0%)
0 (0.0%)
$50,000 to $74,999
0 (0.0%)
0 (0.0%)
$75,000 to $99,999
0 (0.0%)
0 (0.0%)
$100,000 to $149,999
0 (0.0%)
0 (0.0%)
$150,000 or more
0 (0.0%)
0 (0.0%)
Total
136 (100.0%)
0 (0.0%)
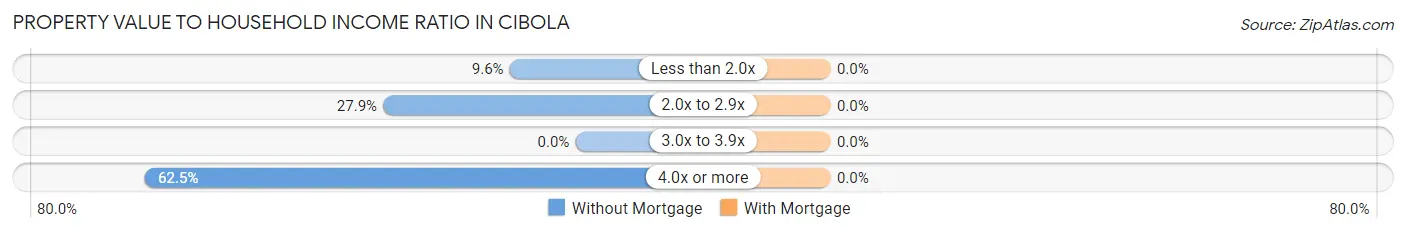
Property Value to Household Income Ratio in Cibola
Value-to-Income Ratio
Without Mortgage
With Mortgage
Less than 2.0x
13 (9.6%)
0 (0.0%)
2.0x to 2.9x
38 (27.9%)
0 (0.0%)
3.0x to 3.9x
0 (0.0%)
0 (0.0%)
4.0x or more
85 (62.5%)
0 (0.0%)
Total
136 (100.0%)
0 (0.0%)
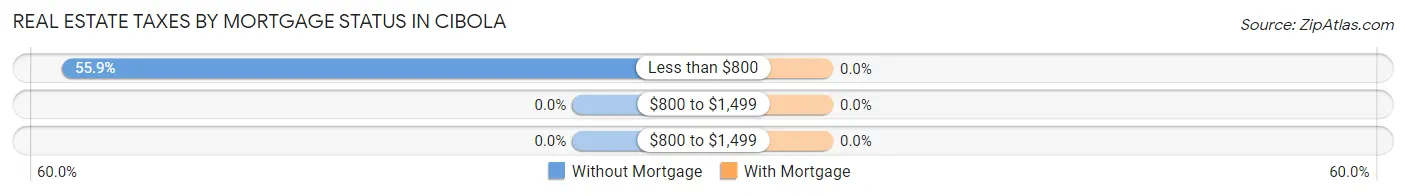
Real Estate Taxes by Mortgage Status in Cibola
Property Taxes
Without Mortgage
With Mortgage
Less than $800
76 (55.9%)
0 (0.0%)
$800 to $1,499
0 (0.0%)
0 (0.0%)
$800 to $1,499
0 (0.0%)
0 (0.0%)
Total
136 (100.0%)
0 (0.0%)
Health & Disability in Cibola
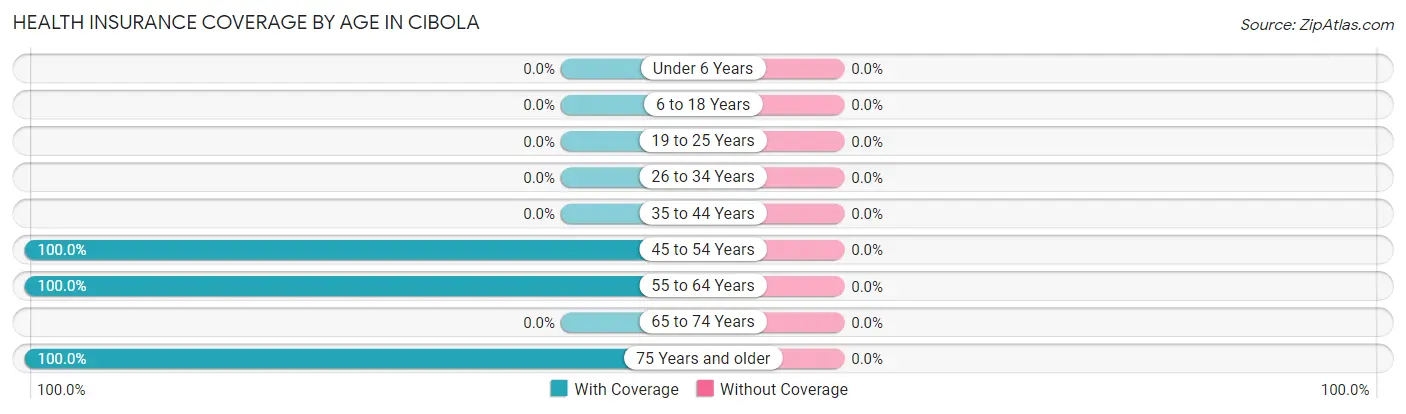
Health Insurance Coverage by Age in Cibola
Age Bracket
With Coverage
Without Coverage
Under 6 Years
0 (0.0%)
0 (0.0%)
6 to 18 Years
0 (0.0%)
0 (0.0%)
19 to 25 Years
0 (0.0%)
0 (0.0%)
26 to 34 Years
0 (0.0%)
0 (0.0%)
35 to 44 Years
0 (0.0%)
0 (0.0%)
45 to 54 Years
55 (100.0%)
0 (0.0%)
55 to 64 Years
31 (100.0%)
0 (0.0%)
65 to 74 Years
0 (0.0%)
0 (0.0%)
75 Years and older
85 (100.0%)
0 (0.0%)
Total
171 (100.0%)
0 (0.0%)
Health Insurance Coverage by Citizenship Status in Cibola
Citizenship Status
With Coverage
Without Coverage
Native Born
0 (0.0%)
0 (0.0%)
Foreign Born, Citizen
0 (0.0%)
0 (0.0%)
Foreign Born, not a Citizen
0 (0.0%)
0 (0.0%)
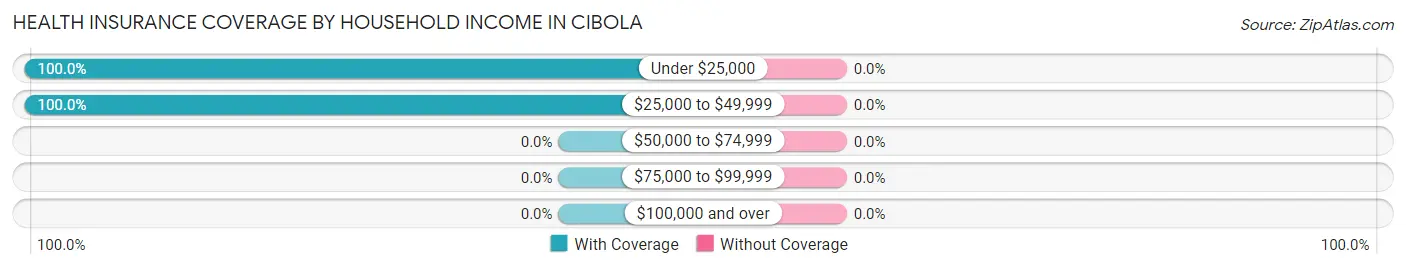
Health Insurance Coverage by Household Income in Cibola
Household Income
With Coverage
Without Coverage
Under $25,000
98 (100.0%)
0 (0.0%)
$25,000 to $49,999
73 (100.0%)
0 (0.0%)
$50,000 to $74,999
0 (0.0%)
0 (0.0%)
$75,000 to $99,999
0 (0.0%)
0 (0.0%)
$100,000 and over
0 (0.0%)
0 (0.0%)
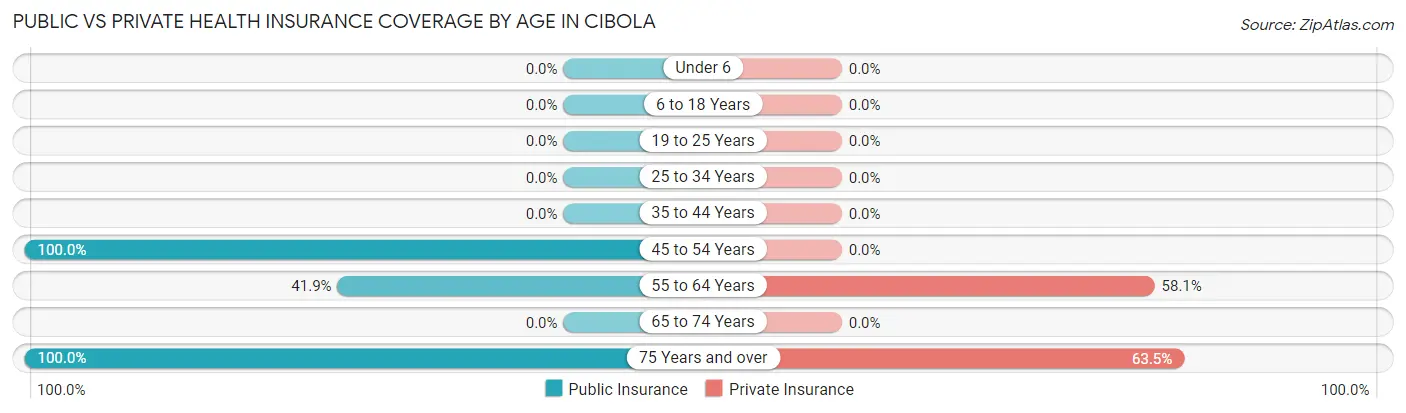
Public vs Private Health Insurance Coverage by Age in Cibola
Age Bracket
Public Insurance
Private Insurance
Under 6
0 (0.0%)
0 (0.0%)
6 to 18 Years
0 (0.0%)
0 (0.0%)
19 to 25 Years
0 (0.0%)
0 (0.0%)
25 to 34 Years
0 (0.0%)
0 (0.0%)
35 to 44 Years
0 (0.0%)
0 (0.0%)
45 to 54 Years
55 (100.0%)
0 (0.0%)
55 to 64 Years
13 (41.9%)
18 (58.1%)
65 to 74 Years
0 (0.0%)
0 (0.0%)
75 Years and over
85 (100.0%)
54 (63.5%)
Total
153 (89.5%)
72 (42.1%)
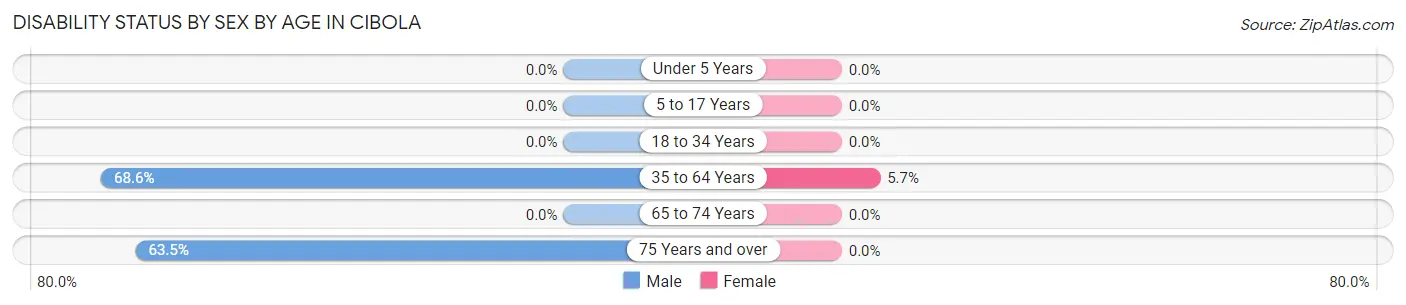
Disability Status by Sex by Age in Cibola
Age Bracket
Male
Female
Under 5 Years
0 (0.0%)
0 (0.0%)
5 to 17 Years
0 (0.0%)
0 (0.0%)
18 to 34 Years
0 (0.0%)
0 (0.0%)
35 to 64 Years
35 (68.6%)
2 (5.7%)
65 to 74 Years
0 (0.0%)
0 (0.0%)
75 Years and over
54 (63.5%)
0 (0.0%)
Disability Class by Sex by Age in Cibola
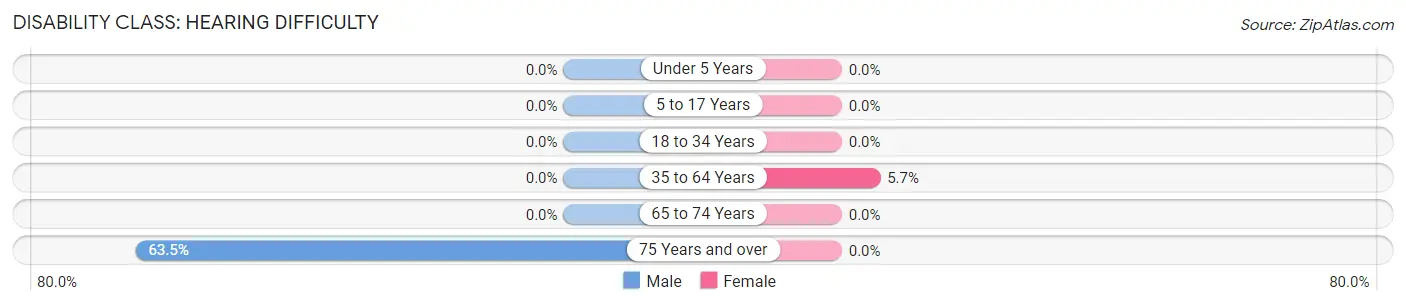
Disability Class: Hearing Difficulty
Age Bracket
Male
Female
Under 5 Years
0 (0.0%)
0 (0.0%)
5 to 17 Years
0 (0.0%)
0 (0.0%)
18 to 34 Years
0 (0.0%)
0 (0.0%)
35 to 64 Years
0 (0.0%)
2 (5.7%)
65 to 74 Years
0 (0.0%)
0 (0.0%)
75 Years and over
54 (63.5%)
0 (0.0%)
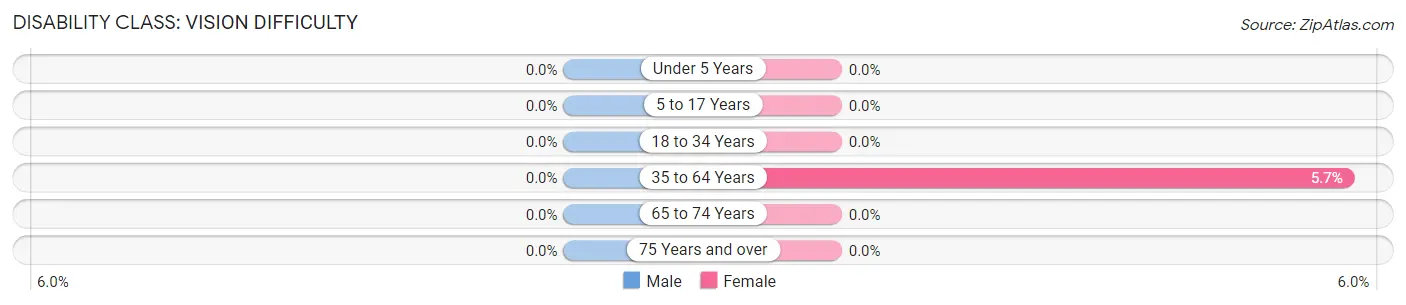
Disability Class: Vision Difficulty
Age Bracket
Male
Female
Under 5 Years
0 (0.0%)
0 (0.0%)
5 to 17 Years
0 (0.0%)
0 (0.0%)
18 to 34 Years
0 (0.0%)
0 (0.0%)
35 to 64 Years
0 (0.0%)
2 (5.7%)
65 to 74 Years
0 (0.0%)
0 (0.0%)
75 Years and over
0 (0.0%)
0 (0.0%)
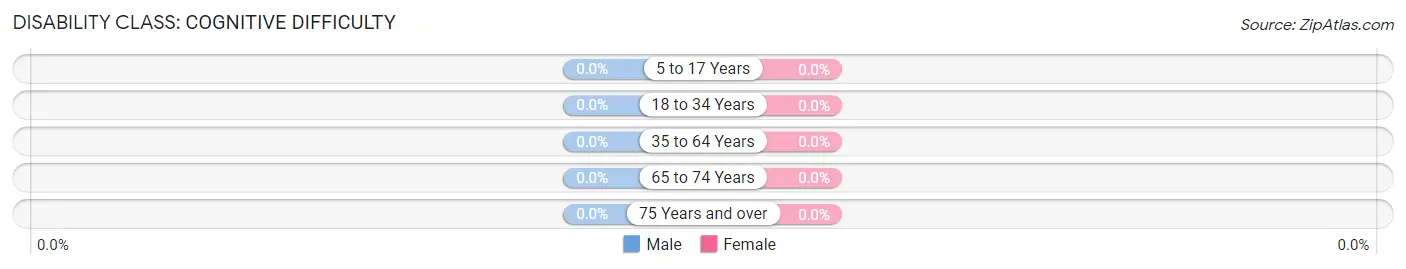
Disability Class: Cognitive Difficulty
Age Bracket
Male
Female
5 to 17 Years
0 (0.0%)
0 (0.0%)
18 to 34 Years
0 (0.0%)
0 (0.0%)
35 to 64 Years
0 (0.0%)
0 (0.0%)
65 to 74 Years
0 (0.0%)
0 (0.0%)
75 Years and over
0 (0.0%)
0 (0.0%)
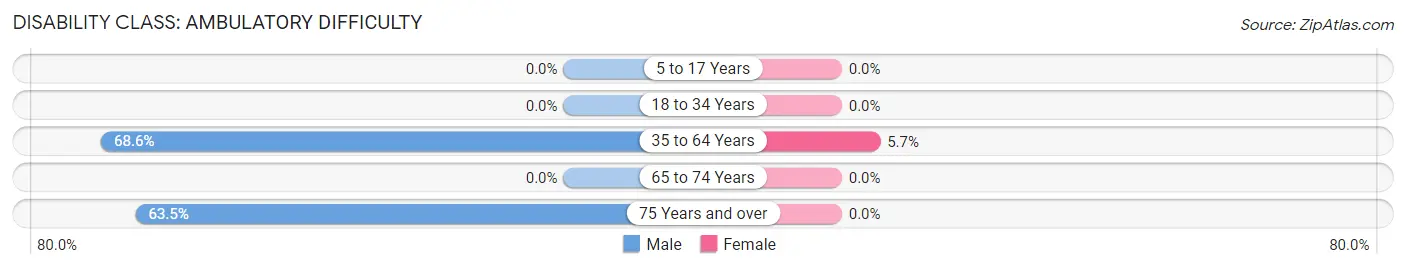
Disability Class: Ambulatory Difficulty
Age Bracket
Male
Female
5 to 17 Years
0 (0.0%)
0 (0.0%)
18 to 34 Years
0 (0.0%)
0 (0.0%)
35 to 64 Years
35 (68.6%)
2 (5.7%)
65 to 74 Years
0 (0.0%)
0 (0.0%)
75 Years and over
54 (63.5%)
0 (0.0%)
Disability Class: Self-Care Difficulty
Age Bracket
Male
Female
5 to 17 Years
0 (0.0%)
0 (0.0%)
18 to 34 Years
0 (0.0%)
0 (0.0%)
35 to 64 Years
0 (0.0%)
0 (0.0%)
65 to 74 Years
0 (0.0%)
0 (0.0%)
75 Years and over
0 (0.0%)
0 (0.0%)
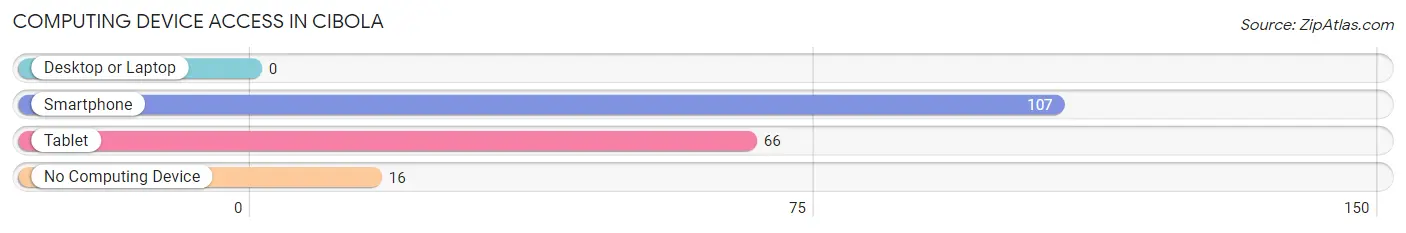
Technology Access in Cibola
Computing Device Access in Cibola
Device Type
# Households
% Households
Desktop or Laptop
0
0.0%
Smartphone
107
78.7%
Tablet
66
48.5%
No Computing Device
16
11.8%
Total
136
100.0%
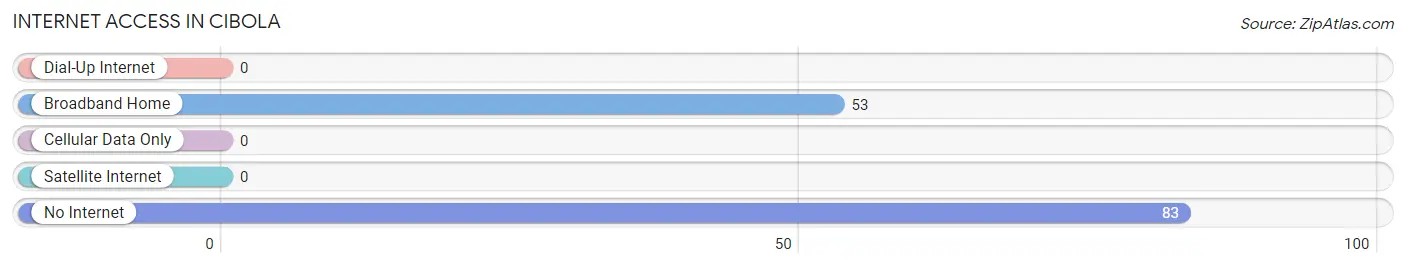
Internet Access in Cibola
Internet Type
# Households
% Households
Dial-Up Internet
0
0.0%
Broadband Home
53
39.0%
Cellular Data Only
0
0.0%
Satellite Internet
0
0.0%
No Internet
83
61.0%
Total
136
100.0%
Cibola Summary
Cibola, Arizona is a small unincorporated community located in the western part of the state, in Yuma County. It is situated along the Colorado River, just south of the California border. The town is home to a population of just over 1,000 people, and is known for its rich history and culture.
History
The area that is now Cibola was first inhabited by the Hualapai and Yavapai Native American tribes. The first Europeans to explore the area were Spanish missionaries, who arrived in the late 1700s. The area was later settled by Mexican ranchers, who established the town of Cibola in the early 1800s. The town was named after the mythical Seven Cities of Gold, which were believed to be located in the area.
In the late 1800s, the town was taken over by the United States government, and the area was used as a military outpost. The town was later abandoned, and the population dwindled to just a few hundred people. In the early 1900s, the town was re-established as a farming community, and the population began to grow again.
Geography
Cibola is located in western Arizona, in Yuma County. It is situated along the Colorado River, just south of the California border. The town is located in a desert climate, with hot summers and mild winters. The area is known for its rugged terrain, with mountains, canyons, and desert landscapes.
Economy
The economy of Cibola is largely based on agriculture. The town is home to several farms, which produce a variety of crops, including cotton, alfalfa, and wheat. The town is also home to a number of small businesses, including restaurants, stores, and other services.
Demographics
As of the 2010 census, the population of Cibola was 1,072. The town is predominantly Hispanic, with a large percentage of the population being of Mexican descent. The median household income in the town is $30,000, and the median age is 33.
Conclusion
Cibola, Arizona is a small unincorporated community located in the western part of the state, in Yuma County. It is situated along the Colorado River, just south of the California border. The town is home to a population of just over 1,000 people, and is known for its rich history and culture. The economy of Cibola is largely based on agriculture, and the town is predominantly Hispanic. Cibola is a unique and vibrant community, and is a great place to visit or live.
Common Questions
What is Per Capita Income in Cibola?
Per Capita income in Cibola is $10,680.
What is Inequality or Gini Index in Cibola?
Inequality or Gini Index in Cibola is 0.52.
What is the Total Population of Cibola?
Total Population of Cibola is 171.
What is the Total Male Population of Cibola?
Total Male Population of Cibola is 136.
What is the Total Female Population of Cibola?
Total Female Population of Cibola is 35.
What is the Ratio of Males per 100 Females in Cibola?
There are 388.57 Males per 100 Females in Cibola.
What is the Ratio of Females per 100 Males in Cibola?
There are 25.74 Females per 100 Males in Cibola.
What is the Median Population Age in Cibola?
Median Population Age in Cibola is 63.0 Years.
What is the Average Household Size in Cibola
Average Household Size in Cibola is 1.3 People.
How Large is the Labor Force in Cibola?
There are 38 People in the Labor Forcein in Cibola.
What is the Percentage of People in the Labor Force in Cibola?
22.2% of People are in the Labor Force in Cibola.
Report Title
Report Link
HTML Copy & Paste Link
Social Media
Copy and paste the folowing code into any webpage where you would like this interactive chart to display