Cities with the Highest Percentage of Households with Income Below $10,000 in Nevada
RELATED REPORTS & OPTIONS
Household Income | $0-10k
Nevada
Compare Cities
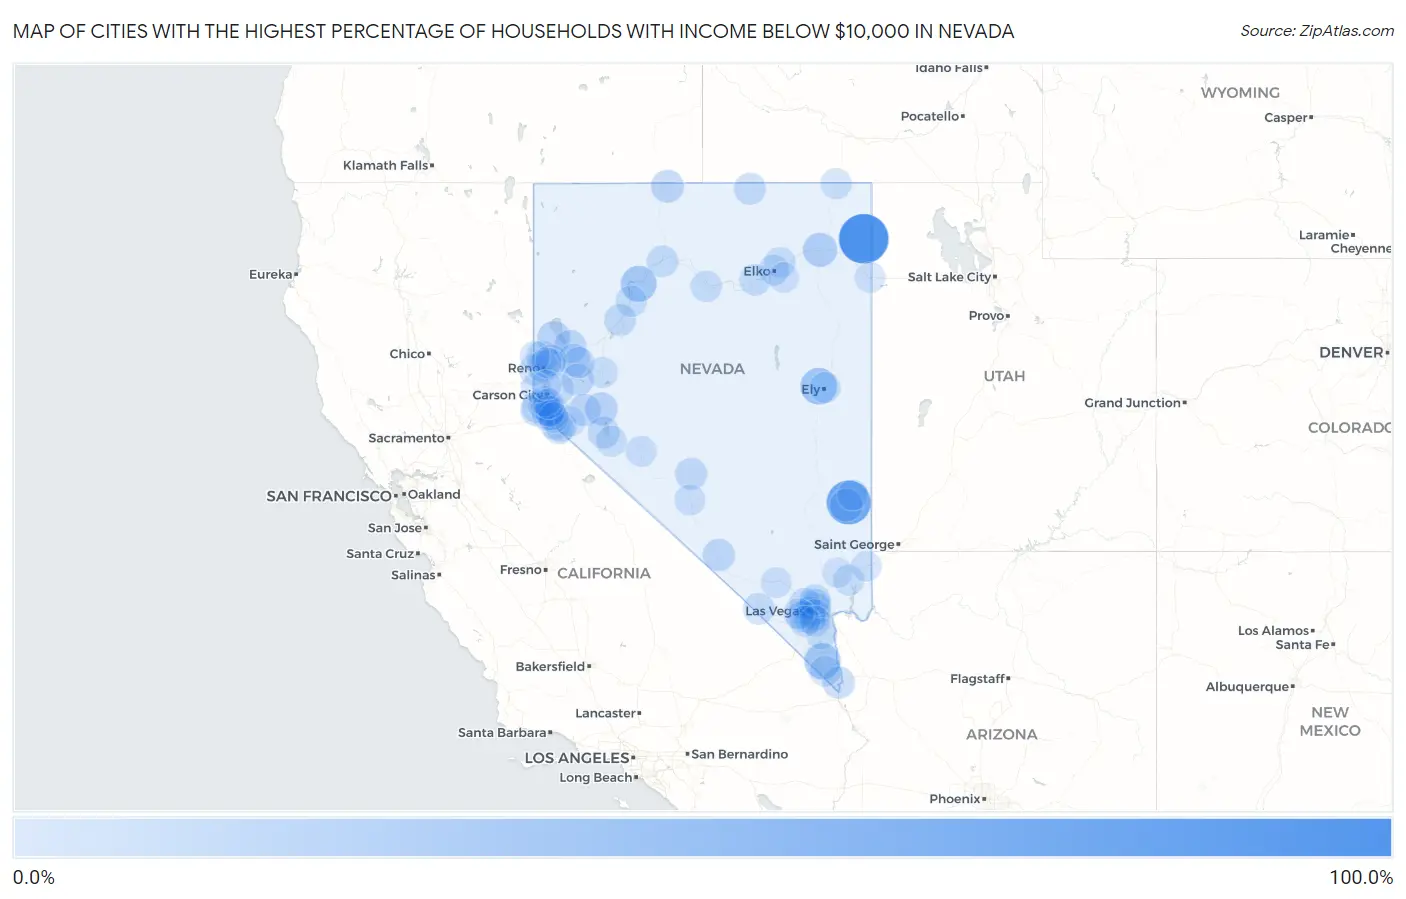
Map of Cities with the Highest Percentage of Households with Income Below $10,000 in Nevada
0.0%
100.0%
Cities with the Highest Percentage of Households with Income Below $10,000 in Nevada
| City | Households with Income < $10k | vs State | vs National | |
| 1. | Montello | 100.0% | 5.4%(+94.6)#1 | 4.9%(+95.1)#26 |
| 2. | Beaverdam | 71.4% | 5.4%(+66.0)#2 | 4.9%(+66.5)#71 |
| 3. | Ruth | 32.5% | 5.4%(+27.1)#3 | 4.9%(+27.6)#471 |
| 4. | Searchlight | 29.8% | 5.4%(+24.4)#4 | 4.9%(+24.9)#563 |
| 5. | Imlay | 28.1% | 5.4%(+22.7)#5 | 4.9%(+23.2)#640 |
| 6. | Wells | 19.8% | 5.4%(+14.4)#6 | 4.9%(+14.9)#1,241 |
| 7. | Caliente | 14.9% | 5.4%(+9.50)#7 | 4.9%(+10.00)#2,121 |
| 8. | Sutcliffe | 14.3% | 5.4%(+8.90)#8 | 4.9%(+9.40)#2,279 |
| 9. | Schurz | 13.0% | 5.4%(+7.60)#9 | 4.9%(+8.10)#2,710 |
| 10. | Fort Mcdermitt | 13.0% | 5.4%(+7.60)#10 | 4.9%(+8.10)#2,722 |
| 11. | Nixon | 12.2% | 5.4%(+6.80)#11 | 4.9%(+7.30)#3,078 |
| 12. | Wadsworth | 11.6% | 5.4%(+6.20)#12 | 4.9%(+6.70)#3,399 |
| 13. | Beatty | 11.1% | 5.4%(+5.70)#13 | 4.9%(+6.20)#3,665 |
| 14. | Silver Springs | 10.7% | 5.4%(+5.30)#14 | 4.9%(+5.80)#3,916 |
| 15. | Amargosa Valley | 10.2% | 5.4%(+4.80)#15 | 4.9%(+5.30)#4,271 |
| 16. | Laughlin | 9.9% | 5.4%(+4.50)#16 | 4.9%(+5.00)#4,442 |
| 17. | Yerington | 9.9% | 5.4%(+4.50)#17 | 4.9%(+5.00)#4,451 |
| 18. | Tonopah | 9.4% | 5.4%(+4.00)#18 | 4.9%(+4.50)#4,863 |
| 19. | Sunrise Manor | 9.3% | 5.4%(+3.90)#19 | 4.9%(+4.40)#4,920 |
| 20. | Lovelock | 9.1% | 5.4%(+3.70)#20 | 4.9%(+4.20)#5,138 |
| 21. | Walker Lake | 8.9% | 5.4%(+3.50)#21 | 4.9%(+4.00)#5,393 |
| 22. | Nellis Afb | 8.6% | 5.4%(+3.20)#22 | 4.9%(+3.70)#5,674 |
| 23. | Owyhee | 8.4% | 5.4%(+3.00)#23 | 4.9%(+3.50)#5,936 |
| 24. | Stateline | 8.4% | 5.4%(+3.00)#24 | 4.9%(+3.50)#5,939 |
| 25. | Paradise | 7.8% | 5.4%(+2.40)#25 | 4.9%(+2.90)#6,584 |
| 26. | Verdi | 7.5% | 5.4%(+2.10)#26 | 4.9%(+2.60)#7,085 |
| 27. | Winnemucca | 7.4% | 5.4%(+2.00)#27 | 4.9%(+2.50)#7,178 |
| 28. | Round Hill Village | 7.3% | 5.4%(+1.90)#28 | 4.9%(+2.40)#7,376 |
| 29. | Winchester | 7.2% | 5.4%(+1.80)#29 | 4.9%(+2.30)#7,442 |
| 30. | Las Vegas | 6.7% | 5.4%(+1.30)#30 | 4.9%(+1.80)#8,232 |
| 31. | Pahrump | 6.5% | 5.4%(+1.10)#31 | 4.9%(+1.60)#8,534 |
| 32. | Whitney | 6.4% | 5.4%(+1.000)#32 | 4.9%(+1.50)#8,719 |
| 33. | Carlin | 6.4% | 5.4%(+1.000)#33 | 4.9%(+1.50)#8,780 |
| 34. | Lemmon Valley | 6.2% | 5.4%(+0.800)#34 | 4.9%(+1.30)#9,125 |
| 35. | Battle Mountain | 6.1% | 5.4%(+0.700)#35 | 4.9%(+1.20)#9,297 |
| 36. | Humboldt River Ranch | 6.1% | 5.4%(+0.700)#36 | 4.9%(+1.20)#9,428 |
| 37. | Spring Valley | 6.0% | 5.4%(+0.600)#37 | 4.9%(+1.10)#9,453 |
| 38. | Double Spring | 5.9% | 5.4%(+0.500)#38 | 4.9%(+1.00)#9,835 |
| 39. | Gardnerville | 5.4% | 5.4%(=0.000)#39 | 4.9%(+0.500)#10,775 |
| 40. | Fish Springs | 5.3% | 5.4%(-0.100)#40 | 4.9%(+0.400)#11,091 |
| 41. | Fernley | 5.2% | 5.4%(-0.200)#41 | 4.9%(+0.300)#11,179 |
| 42. | Osino | 5.2% | 5.4%(-0.200)#42 | 4.9%(+0.300)#11,318 |
| 43. | Boulder City | 5.1% | 5.4%(-0.300)#43 | 4.9%(+0.200)#11,433 |
| 44. | Minden | 5.0% | 5.4%(-0.400)#44 | 4.9%(+0.100)#11,744 |
| 45. | Topaz Ranch Estates | 5.0% | 5.4%(-0.400)#45 | 4.9%(+0.100)#11,781 |
| 46. | North Las Vegas | 4.9% | 5.4%(-0.500)#46 | 4.9%(=0.000)#11,884 |
| 47. | Ely | 4.9% | 5.4%(-0.500)#47 | 4.9%(=0.000)#11,965 |
| 48. | Reno | 4.6% | 5.4%(-0.800)#48 | 4.9%(-0.300)#12,649 |
| 49. | Hawthorne | 4.5% | 5.4%(-0.900)#49 | 4.9%(-0.400)#13,021 |
| 50. | Mina | 4.4% | 5.4%(-1.00)#50 | 4.9%(-0.500)#13,401 |
| 51. | Genoa | 4.3% | 5.4%(-1.10)#51 | 4.9%(-0.600)#13,609 |
| 52. | Spanish Springs | 4.2% | 5.4%(-1.20)#52 | 4.9%(-0.700)#13,760 |
| 53. | Cal Nev Ari | 4.1% | 5.4%(-1.30)#53 | 4.9%(-0.800)#14,251 |
| 54. | Fallon | 4.0% | 5.4%(-1.40)#54 | 4.9%(-0.900)#14,365 |
| 55. | Henderson | 3.9% | 5.4%(-1.50)#55 | 4.9%(-1.00)#14,579 |
| 56. | Carson | 3.9% | 5.4%(-1.50)#56 | 4.9%(-1.00)#14,599 |
| 57. | Moapa Valley | 3.9% | 5.4%(-1.50)#57 | 4.9%(-1.00)#14,659 |
| 58. | Gardnerville Ranchos | 3.8% | 5.4%(-1.60)#58 | 4.9%(-1.10)#14,877 |
| 59. | Goldfield | 3.8% | 5.4%(-1.60)#59 | 4.9%(-1.10)#15,099 |
| 60. | Summerlin South | 3.6% | 5.4%(-1.80)#60 | 4.9%(-1.30)#15,449 |
| 61. | Elko | 3.6% | 5.4%(-1.80)#61 | 4.9%(-1.30)#15,463 |
| 62. | Jackpot | 3.5% | 5.4%(-1.90)#62 | 4.9%(-1.40)#15,924 |
| 63. | Enterprise | 3.4% | 5.4%(-2.00)#63 | 4.9%(-1.50)#16,016 |
| 64. | Topaz Lake | 3.3% | 5.4%(-2.10)#64 | 4.9%(-1.60)#16,638 |
| 65. | Sparks | 2.9% | 5.4%(-2.50)#65 | 4.9%(-2.00)#17,654 |
| 66. | Dayton | 2.9% | 5.4%(-2.50)#66 | 4.9%(-2.00)#17,715 |
| 67. | Panaca | 2.9% | 5.4%(-2.50)#67 | 4.9%(-2.00)#17,858 |
| 68. | Sun Valley | 2.5% | 5.4%(-2.90)#68 | 4.9%(-2.40)#18,997 |
| 69. | Mesquite | 2.5% | 5.4%(-2.90)#69 | 4.9%(-2.40)#18,999 |
| 70. | Ruhenstroth | 2.5% | 5.4%(-2.90)#70 | 4.9%(-2.40)#19,154 |
| 71. | Indian Springs | 2.5% | 5.4%(-2.90)#71 | 4.9%(-2.40)#19,210 |
| 72. | Indian Hills | 2.2% | 5.4%(-3.20)#72 | 4.9%(-2.70)#20,036 |
| 73. | West Wendover | 2.0% | 5.4%(-3.40)#73 | 4.9%(-2.90)#20,688 |
| 74. | Smith Valley | 1.9% | 5.4%(-3.50)#74 | 4.9%(-3.00)#21,110 |
| 75. | Spring Creek | 1.6% | 5.4%(-3.80)#75 | 4.9%(-3.30)#21,871 |
| 76. | East Valley | 1.6% | 5.4%(-3.80)#76 | 4.9%(-3.30)#21,998 |
| 77. | Carter Springs | 1.6% | 5.4%(-3.80)#77 | 4.9%(-3.30)#22,058 |
| 78. | Cold Springs | 1.5% | 5.4%(-3.90)#78 | 4.9%(-3.40)#22,142 |
| 79. | Incline Village | 1.5% | 5.4%(-3.90)#79 | 4.9%(-3.40)#22,149 |
| 80. | Johnson Lane | 1.5% | 5.4%(-3.90)#80 | 4.9%(-3.40)#22,165 |
| 81. | Washoe Valley | 0.60% | 5.4%(-4.80)#81 | 4.9%(-4.30)#24,359 |
| 82. | Moapa Town | 0.40% | 5.4%(-5.00)#82 | 4.9%(-4.50)#24,654 |
1
2Common Questions
What are the Top 10 Cities with the Highest Percentage of Households with Income Below $10,000 in Nevada?
Top 10 Cities with the Highest Percentage of Households with Income Below $10,000 in Nevada are:
#1
100.0%
#2
71.4%
#3
32.5%
#4
29.8%
#5
28.1%
#6
19.8%
#7
14.9%
#8
14.3%
#9
13.0%
#10
13.0%
What city has the Highest Percentage of Households with Income Below $10,000 in Nevada?
Montello has the Highest Percentage of Households with Income Below $10,000 in Nevada with 100.0%.
What is the Percentage of Households with Income Below $10,000 in the State of Nevada?
Percentage of Households with Income Below $10,000 in Nevada is 5.4%.
What is the Percentage of Households with Income Below $10,000 in the United States?
Percentage of Households with Income Below $10,000 in the United States is 4.9%.