Cities with the Highest Percentage of Households with Income Below $10,000 in South Carolina
RELATED REPORTS & OPTIONS
Household Income | $0-10k
South Carolina
Compare Cities
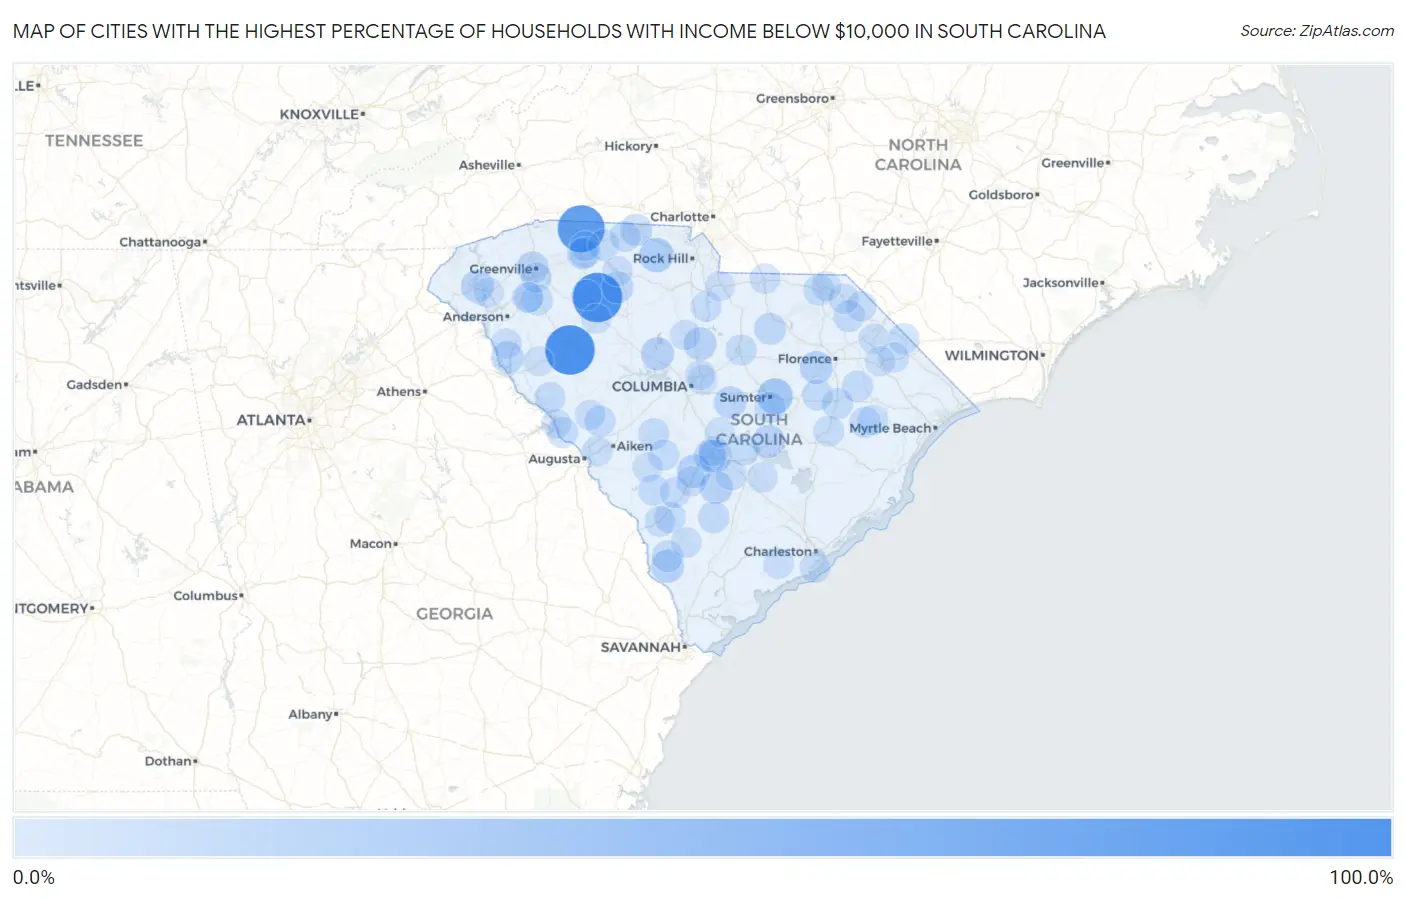
Map of Cities with the Highest Percentage of Households with Income Below $10,000 in South Carolina
0.0%
100.0%
Cities with the Highest Percentage of Households with Income Below $10,000 in South Carolina
| City | Households with Income < $10k | vs State | vs National | |
| 1. | Coronaca | 100.0% | 6.1%(+93.9)#1 | 4.9%(+95.1)#19 |
| 2. | Cross Anchor | 100.0% | 6.1%(+93.9)#2 | 4.9%(+95.1)#23 |
| 3. | Fingerville | 88.8% | 6.1%(+82.7)#3 | 4.9%(+83.9)#43 |
| 4. | Olympia | 43.8% | 6.1%(+37.7)#4 | 4.9%(+38.9)#241 |
| 5. | East Sumter | 36.1% | 6.1%(+30.0)#5 | 4.9%(+31.2)#373 |
| 6. | Centenary | 34.9% | 6.1%(+28.8)#6 | 4.9%(+30.0)#404 |
| 7. | Sharon | 30.5% | 6.1%(+24.4)#7 | 4.9%(+25.6)#533 |
| 8. | Arthurtown | 27.8% | 6.1%(+21.7)#8 | 4.9%(+22.9)#649 |
| 9. | Cope | 26.3% | 6.1%(+20.2)#9 | 4.9%(+21.4)#726 |
| 10. | Peak | 25.0% | 6.1%(+18.9)#10 | 4.9%(+20.1)#794 |
| 11. | Timmonsville | 24.6% | 6.1%(+18.5)#11 | 4.9%(+19.7)#820 |
| 12. | Scotia | 24.5% | 6.1%(+18.4)#12 | 4.9%(+19.6)#832 |
| 13. | Wilkinson Heights | 24.3% | 6.1%(+18.2)#13 | 4.9%(+19.4)#840 |
| 14. | Branchville | 24.3% | 6.1%(+18.2)#14 | 4.9%(+19.4)#841 |
| 15. | Ridgeway | 24.2% | 6.1%(+18.1)#15 | 4.9%(+19.3)#847 |
| 16. | Summerton | 23.9% | 6.1%(+17.8)#16 | 4.9%(+19.0)#867 |
| 17. | Newry | 23.7% | 6.1%(+17.6)#17 | 4.9%(+18.8)#886 |
| 18. | Pauline | 23.6% | 6.1%(+17.5)#18 | 4.9%(+18.7)#888 |
| 19. | Manville | 22.7% | 6.1%(+16.6)#19 | 4.9%(+17.8)#957 |
| 20. | Lowndesville | 22.4% | 6.1%(+16.3)#20 | 4.9%(+17.5)#985 |
| 21. | Eastover | 22.1% | 6.1%(+16.0)#21 | 4.9%(+17.2)#1,008 |
| 22. | Orangeburg | 21.4% | 6.1%(+15.3)#22 | 4.9%(+16.5)#1,065 |
| 23. | Blacksburg | 21.2% | 6.1%(+15.1)#23 | 4.9%(+16.3)#1,091 |
| 24. | City View | 20.5% | 6.1%(+14.4)#24 | 4.9%(+15.6)#1,145 |
| 25. | Adams Run | 20.0% | 6.1%(+13.9)#25 | 4.9%(+15.1)#1,196 |
| 26. | Bethune | 19.8% | 6.1%(+13.7)#26 | 4.9%(+14.9)#1,244 |
| 27. | Buffalo | 19.2% | 6.1%(+13.1)#27 | 4.9%(+14.3)#1,310 |
| 28. | Dovesville | 19.2% | 6.1%(+13.1)#28 | 4.9%(+14.3)#1,311 |
| 29. | Clemson University | 18.2% | 6.1%(+12.1)#29 | 4.9%(+13.3)#1,449 |
| 30. | Williams | 17.9% | 6.1%(+11.8)#30 | 4.9%(+13.0)#1,511 |
| 31. | Ashwood | 17.9% | 6.1%(+11.8)#31 | 4.9%(+13.0)#1,515 |
| 32. | Estill | 17.6% | 6.1%(+11.5)#32 | 4.9%(+12.7)#1,539 |
| 33. | Saxon | 17.3% | 6.1%(+11.2)#33 | 4.9%(+12.4)#1,585 |
| 34. | Ben Avon | 17.1% | 6.1%(+11.0)#34 | 4.9%(+12.2)#1,621 |
| 35. | Arcadia | 16.9% | 6.1%(+10.8)#35 | 4.9%(+12.0)#1,662 |
| 36. | Cowpens | 16.7% | 6.1%(+10.6)#36 | 4.9%(+11.8)#1,708 |
| 37. | Pamplico | 16.7% | 6.1%(+10.6)#37 | 4.9%(+11.8)#1,710 |
| 38. | Lake View | 16.7% | 6.1%(+10.6)#38 | 4.9%(+11.8)#1,714 |
| 39. | Sycamore | 16.7% | 6.1%(+10.6)#39 | 4.9%(+11.8)#1,728 |
| 40. | Blenheim | 16.7% | 6.1%(+10.6)#40 | 4.9%(+11.8)#1,737 |
| 41. | Lake City | 16.4% | 6.1%(+10.3)#41 | 4.9%(+11.5)#1,781 |
| 42. | Cheraw | 16.4% | 6.1%(+10.3)#42 | 4.9%(+11.5)#1,782 |
| 43. | Barnwell | 16.2% | 6.1%(+10.1)#43 | 4.9%(+11.3)#1,815 |
| 44. | Stuckey | 16.2% | 6.1%(+10.1)#44 | 4.9%(+11.3)#1,830 |
| 45. | Lakewood | 16.1% | 6.1%(+10.00)#45 | 4.9%(+11.2)#1,837 |
| 46. | Wagener | 16.1% | 6.1%(+10.00)#46 | 4.9%(+11.2)#1,844 |
| 47. | Camden | 15.9% | 6.1%(+9.80)#47 | 4.9%(+11.0)#1,876 |
| 48. | Trenton | 15.9% | 6.1%(+9.80)#48 | 4.9%(+11.0)#1,888 |
| 49. | Mccormick | 15.8% | 6.1%(+9.70)#49 | 4.9%(+10.9)#1,898 |
| 50. | Springfield | 15.8% | 6.1%(+9.70)#50 | 4.9%(+10.9)#1,908 |
| 51. | Elloree | 15.7% | 6.1%(+9.60)#51 | 4.9%(+10.8)#1,929 |
| 52. | Olanta | 15.7% | 6.1%(+9.60)#52 | 4.9%(+10.8)#1,933 |
| 53. | Ware Place | 15.7% | 6.1%(+9.60)#53 | 4.9%(+10.8)#1,942 |
| 54. | Drayton | 15.6% | 6.1%(+9.50)#54 | 4.9%(+10.7)#1,948 |
| 55. | Clarks Hill | 15.5% | 6.1%(+9.40)#55 | 4.9%(+10.6)#1,986 |
| 56. | West Pelzer | 15.4% | 6.1%(+9.30)#56 | 4.9%(+10.5)#1,997 |
| 57. | Daviston | 15.3% | 6.1%(+9.20)#57 | 4.9%(+10.4)#2,038 |
| 58. | Kingstree | 15.0% | 6.1%(+8.90)#58 | 4.9%(+10.1)#2,082 |
| 59. | Bowman | 15.0% | 6.1%(+8.90)#59 | 4.9%(+10.1)#2,095 |
| 60. | Newtown | 14.9% | 6.1%(+8.80)#60 | 4.9%(+10.00)#2,124 |
| 61. | East Gaffney | 14.5% | 6.1%(+8.40)#61 | 4.9%(+9.60)#2,230 |
| 62. | Great Falls | 14.5% | 6.1%(+8.40)#62 | 4.9%(+9.60)#2,232 |
| 63. | Folly Beach | 14.4% | 6.1%(+8.30)#63 | 4.9%(+9.50)#2,249 |
| 64. | Govan | 14.3% | 6.1%(+8.20)#64 | 4.9%(+9.40)#2,296 |
| 65. | Allendale | 14.1% | 6.1%(+8.00)#65 | 4.9%(+9.20)#2,326 |
| 66. | Edmund | 14.0% | 6.1%(+7.90)#66 | 4.9%(+9.10)#2,363 |
| 67. | Pageland | 13.7% | 6.1%(+7.60)#67 | 4.9%(+8.80)#2,450 |
| 68. | Edgefield | 13.6% | 6.1%(+7.50)#68 | 4.9%(+8.70)#2,478 |
| 69. | Iva | 13.6% | 6.1%(+7.50)#69 | 4.9%(+8.70)#2,484 |
| 70. | Winnsboro | 13.5% | 6.1%(+7.40)#70 | 4.9%(+8.60)#2,511 |
| 71. | Meggett | 13.5% | 6.1%(+7.40)#71 | 4.9%(+8.60)#2,516 |
| 72. | Clio | 13.5% | 6.1%(+7.40)#72 | 4.9%(+8.60)#2,523 |
| 73. | Enoree | 13.5% | 6.1%(+7.40)#73 | 4.9%(+8.60)#2,528 |
| 74. | Bennettsville | 13.4% | 6.1%(+7.30)#74 | 4.9%(+8.50)#2,536 |
| 75. | Gantt | 13.3% | 6.1%(+7.20)#75 | 4.9%(+8.40)#2,566 |
| 76. | Mullins | 13.3% | 6.1%(+7.20)#76 | 4.9%(+8.40)#2,569 |
| 77. | Holly Hill | 13.2% | 6.1%(+7.10)#77 | 4.9%(+8.30)#2,633 |
| 78. | Jonesville | 13.1% | 6.1%(+7.00)#78 | 4.9%(+8.20)#2,675 |
| 79. | Hemingway | 13.0% | 6.1%(+6.90)#79 | 4.9%(+8.10)#2,713 |
| 80. | Latta | 12.9% | 6.1%(+6.80)#80 | 4.9%(+8.00)#2,752 |
| 81. | Varnville | 12.8% | 6.1%(+6.70)#81 | 4.9%(+7.90)#2,787 |
| 82. | Burnettown | 12.7% | 6.1%(+6.60)#82 | 4.9%(+7.80)#2,820 |
| 83. | Abbeville | 12.5% | 6.1%(+6.40)#83 | 4.9%(+7.60)#2,897 |
| 84. | St. Charles | 12.5% | 6.1%(+6.40)#84 | 4.9%(+7.60)#2,943 |
| 85. | Clinton | 12.4% | 6.1%(+6.30)#85 | 4.9%(+7.50)#2,956 |
| 86. | Bamberg | 12.4% | 6.1%(+6.30)#86 | 4.9%(+7.50)#2,966 |
| 87. | Clemson | 12.3% | 6.1%(+6.20)#87 | 4.9%(+7.40)#3,004 |
| 88. | Lancaster | 12.3% | 6.1%(+6.20)#88 | 4.9%(+7.40)#3,006 |
| 89. | Valley Falls | 12.2% | 6.1%(+6.10)#89 | 4.9%(+7.30)#3,047 |
| 90. | Brookdale | 12.2% | 6.1%(+6.10)#90 | 4.9%(+7.30)#3,050 |
| 91. | Whitney | 12.2% | 6.1%(+6.10)#91 | 4.9%(+7.30)#3,051 |
| 92. | Williston | 12.1% | 6.1%(+6.00)#92 | 4.9%(+7.20)#3,105 |
| 93. | Wallace | 12.1% | 6.1%(+6.00)#93 | 4.9%(+7.20)#3,127 |
| 94. | Marion | 12.0% | 6.1%(+5.90)#94 | 4.9%(+7.10)#3,144 |
| 95. | St Matthews | 12.0% | 6.1%(+5.90)#95 | 4.9%(+7.10)#3,156 |
| 96. | Modoc | 12.0% | 6.1%(+5.90)#96 | 4.9%(+7.10)#3,175 |
| 97. | Pelzer | 11.9% | 6.1%(+5.80)#97 | 4.9%(+7.00)#3,221 |
| 98. | Hamer | 11.9% | 6.1%(+5.80)#98 | 4.9%(+7.00)#3,231 |
| 99. | Columbia | 11.8% | 6.1%(+5.70)#99 | 4.9%(+6.90)#3,260 |
| 100. | Dentsville | 11.8% | 6.1%(+5.70)#100 | 4.9%(+6.90)#3,264 |
Common Questions
What are the Top 10 Cities with the Highest Percentage of Households with Income Below $10,000 in South Carolina?
Top 10 Cities with the Highest Percentage of Households with Income Below $10,000 in South Carolina are:
#1
100.0%
#2
100.0%
#3
88.8%
#4
36.1%
#5
30.5%
#6
26.3%
#7
25.0%
#8
24.6%
#9
24.5%
#10
24.3%
What city has the Highest Percentage of Households with Income Below $10,000 in South Carolina?
Coronaca has the Highest Percentage of Households with Income Below $10,000 in South Carolina with 100.0%.
What is the Percentage of Households with Income Below $10,000 in the State of South Carolina?
Percentage of Households with Income Below $10,000 in South Carolina is 6.1%.
What is the Percentage of Households with Income Below $10,000 in the United States?
Percentage of Households with Income Below $10,000 in the United States is 4.9%.