Cities with the Highest Percentage of Households with Income Below $10,000 in Texas
RELATED REPORTS & OPTIONS
Household Income | $0-10k
Texas
Compare Cities
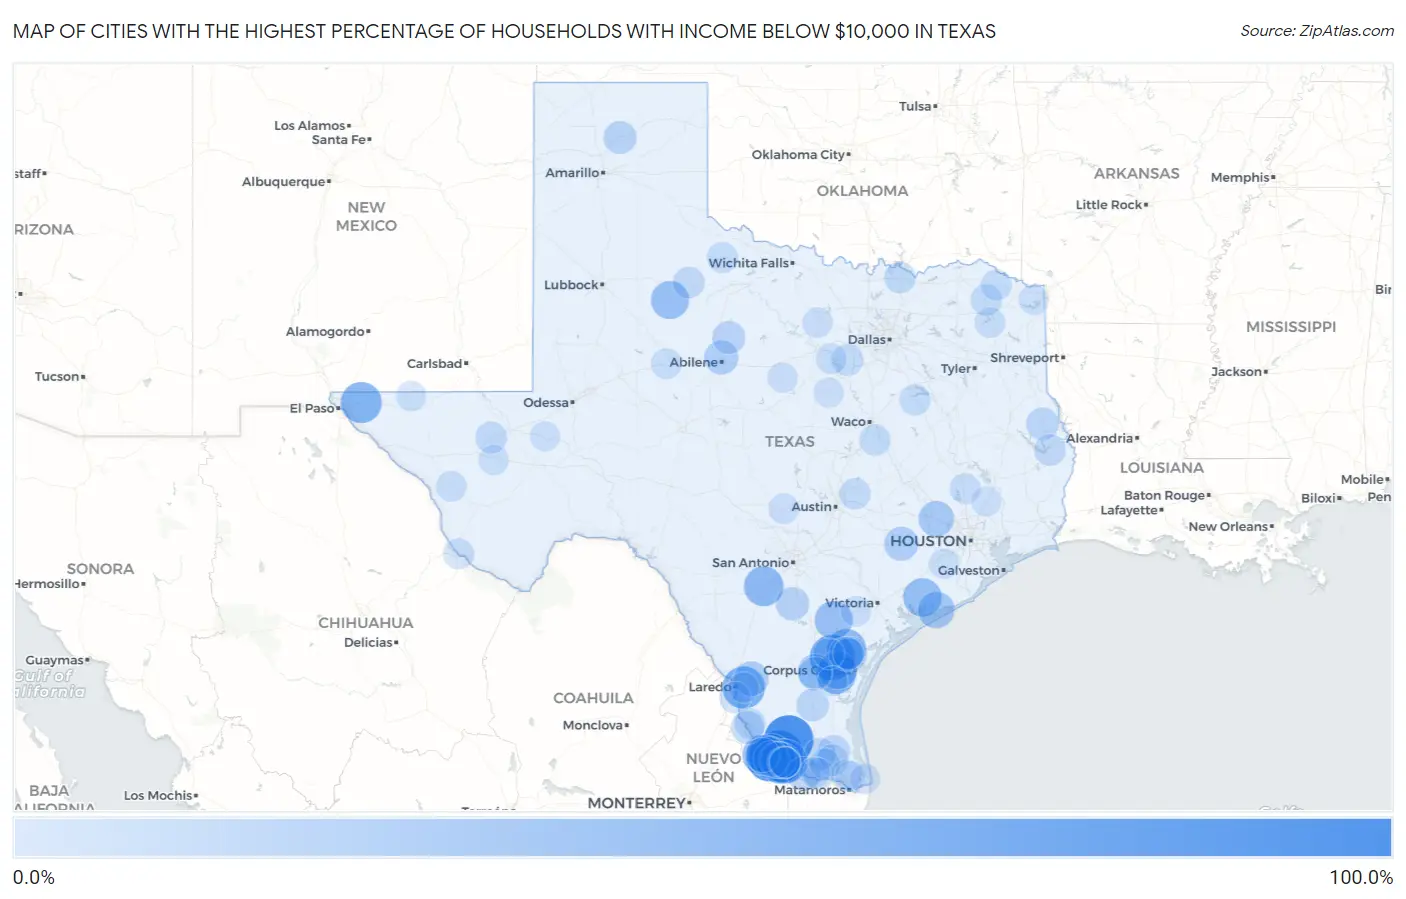
Map of Cities with the Highest Percentage of Households with Income Below $10,000 in Texas
0.0%
100.0%
Cities with the Highest Percentage of Households with Income Below $10,000 in Texas
| City | Households with Income < $10k | vs State | vs National | |
| 1. | Martinez | 100.0% | 5.1%(+94.9)#1 | 4.9%(+95.1)#30 |
| 2. | Santa Anna | 100.0% | 5.1%(+94.9)#2 | 4.9%(+95.1)#38 |
| 3. | Los Alvarez | 91.8% | 5.1%(+86.7)#3 | 4.9%(+86.9)#41 |
| 4. | Sandy Hollow Escondidas | 81.1% | 5.1%(+76.0)#4 | 4.9%(+76.2)#47 |
| 5. | Manuel Garcia | 80.0% | 5.1%(+74.9)#5 | 4.9%(+75.1)#48 |
| 6. | El Socio | 76.2% | 5.1%(+71.1)#6 | 4.9%(+71.3)#54 |
| 7. | San Carlos Ii | 68.6% | 5.1%(+63.5)#7 | 4.9%(+63.7)#74 |
| 8. | Barrera | 66.7% | 5.1%(+61.6)#8 | 4.9%(+61.8)#77 |
| 9. | Butterfield | 63.0% | 5.1%(+57.9)#9 | 4.9%(+58.1)#94 |
| 10. | Garciasville | 60.0% | 5.1%(+54.9)#10 | 4.9%(+55.1)#105 |
| 11. | La Paloma Lost Creek | 59.7% | 5.1%(+54.6)#11 | 4.9%(+54.8)#107 |
| 12. | Ramos | 58.3% | 5.1%(+53.2)#12 | 4.9%(+53.4)#111 |
| 13. | Moore | 57.1% | 5.1%(+52.0)#13 | 4.9%(+52.2)#119 |
| 14. | St Paul | 55.9% | 5.1%(+50.8)#14 | 4.9%(+51.0)#125 |
| 15. | North Escobares | 55.1% | 5.1%(+50.0)#15 | 4.9%(+50.2)#132 |
| 16. | Garceno | 53.6% | 5.1%(+48.5)#16 | 4.9%(+48.7)#140 |
| 17. | Tierra Verde | 52.0% | 5.1%(+46.9)#17 | 4.9%(+47.1)#147 |
| 18. | Blessing | 51.0% | 5.1%(+45.9)#18 | 4.9%(+46.1)#153 |
| 19. | Normanna | 50.0% | 5.1%(+44.9)#20 | 4.9%(+45.1)#171 |
| 20. | Girard | 50.0% | 5.1%(+44.9)#21 | 4.9%(+45.1)#172 |
| 21. | Garza Salinas Ii | 43.7% | 5.1%(+38.6)#22 | 4.9%(+38.8)#242 |
| 22. | Matagorda | 43.7% | 5.1%(+38.6)#23 | 4.9%(+38.8)#243 |
| 23. | Briggs | 43.2% | 5.1%(+38.1)#24 | 4.9%(+38.3)#250 |
| 24. | Camargito | 40.4% | 5.1%(+35.3)#25 | 4.9%(+35.5)#288 |
| 25. | La Escondida | 40.0% | 5.1%(+34.9)#26 | 4.9%(+35.1)#294 |
| 26. | Prairie View | 39.2% | 5.1%(+34.1)#27 | 4.9%(+34.3)#312 |
| 27. | Pendleton | 36.6% | 5.1%(+31.5)#28 | 4.9%(+31.7)#355 |
| 28. | Ranchitos Las Lomas | 35.7% | 5.1%(+30.6)#29 | 4.9%(+30.8)#382 |
| 29. | Rancho Alegre | 34.6% | 5.1%(+29.5)#30 | 4.9%(+29.7)#411 |
| 30. | Fronton Ranchettes | 34.3% | 5.1%(+29.2)#31 | 4.9%(+29.4)#419 |
| 31. | Loma Linda | 33.9% | 5.1%(+28.8)#32 | 4.9%(+29.0)#428 |
| 32. | Glidden | 33.6% | 5.1%(+28.5)#33 | 4.9%(+28.7)#436 |
| 33. | Granjeno | 33.6% | 5.1%(+28.5)#34 | 4.9%(+28.7)#437 |
| 34. | Loma Linda East Cdp Jim Wells County | 33.3% | 5.1%(+28.2)#35 | 4.9%(+28.4)#453 |
| 35. | Impact | 33.3% | 5.1%(+28.2)#36 | 4.9%(+28.4)#460 |
| 36. | Morgan Farm | 33.1% | 5.1%(+28.0)#37 | 4.9%(+28.2)#462 |
| 37. | Alice Acres | 30.6% | 5.1%(+25.5)#38 | 4.9%(+25.7)#527 |
| 38. | Christine | 30.3% | 5.1%(+25.2)#39 | 4.9%(+25.4)#538 |
| 39. | Falcon Mesa | 28.9% | 5.1%(+23.8)#40 | 4.9%(+24.0)#602 |
| 40. | Sanford | 28.6% | 5.1%(+23.5)#41 | 4.9%(+23.7)#617 |
| 41. | Lueders | 28.3% | 5.1%(+23.2)#42 | 4.9%(+23.4)#627 |
| 42. | San Augustine | 26.9% | 5.1%(+21.8)#43 | 4.9%(+22.0)#690 |
| 43. | Falfurrias | 26.6% | 5.1%(+21.5)#44 | 4.9%(+21.7)#700 |
| 44. | Los Angeles | 26.5% | 5.1%(+21.4)#45 | 4.9%(+21.6)#709 |
| 45. | West Alto Bonito | 25.2% | 5.1%(+20.1)#46 | 4.9%(+20.3)#777 |
| 46. | Hargill | 23.9% | 5.1%(+18.8)#47 | 4.9%(+19.0)#866 |
| 47. | Guthrie | 23.4% | 5.1%(+18.3)#48 | 4.9%(+18.5)#901 |
| 48. | Knollwood | 23.3% | 5.1%(+18.2)#49 | 4.9%(+18.4)#908 |
| 49. | Salineno North | 23.1% | 5.1%(+18.0)#50 | 4.9%(+18.2)#932 |
| 50. | Toyah | 23.1% | 5.1%(+18.0)#51 | 4.9%(+18.2)#937 |
| 51. | Salida Del Sol Estates | 22.9% | 5.1%(+17.8)#52 | 4.9%(+18.0)#946 |
| 52. | Browndell | 22.9% | 5.1%(+17.8)#53 | 4.9%(+18.0)#950 |
| 53. | Godley | 22.6% | 5.1%(+17.5)#54 | 4.9%(+17.7)#962 |
| 54. | Talco | 22.6% | 5.1%(+17.5)#55 | 4.9%(+17.7)#963 |
| 55. | Sebastian | 22.4% | 5.1%(+17.3)#56 | 4.9%(+17.5)#981 |
| 56. | El Cenizo | 22.0% | 5.1%(+16.9)#57 | 4.9%(+17.1)#1,013 |
| 57. | Chilton | 21.6% | 5.1%(+16.5)#58 | 4.9%(+16.7)#1,041 |
| 58. | Coupland | 21.6% | 5.1%(+16.5)#59 | 4.9%(+16.7)#1,044 |
| 59. | Streetman | 21.4% | 5.1%(+16.3)#60 | 4.9%(+16.5)#1,071 |
| 60. | Medina | 21.2% | 5.1%(+16.1)#61 | 4.9%(+16.3)#1,089 |
| 61. | Scissors | 20.8% | 5.1%(+15.7)#62 | 4.9%(+15.9)#1,121 |
| 62. | Del Sol | 20.8% | 5.1%(+15.7)#63 | 4.9%(+15.9)#1,126 |
| 63. | Crowell | 20.6% | 5.1%(+15.5)#64 | 4.9%(+15.7)#1,142 |
| 64. | Annona | 20.5% | 5.1%(+15.4)#65 | 4.9%(+15.6)#1,151 |
| 65. | Mikes | 20.2% | 5.1%(+15.1)#66 | 4.9%(+15.3)#1,171 |
| 66. | Sandia | 20.1% | 5.1%(+15.0)#67 | 4.9%(+15.2)#1,187 |
| 67. | Nada | 20.0% | 5.1%(+14.9)#68 | 4.9%(+15.1)#1,203 |
| 68. | Alanreed | 20.0% | 5.1%(+14.9)#69 | 4.9%(+15.1)#1,218 |
| 69. | Chula Vista Cdp Zavala County | 19.9% | 5.1%(+14.8)#70 | 4.9%(+15.0)#1,235 |
| 70. | Presidio | 19.8% | 5.1%(+14.7)#71 | 4.9%(+14.9)#1,237 |
| 71. | New Waverly | 19.7% | 5.1%(+14.6)#72 | 4.9%(+14.8)#1,254 |
| 72. | Green Valley Farms | 19.7% | 5.1%(+14.6)#73 | 4.9%(+14.8)#1,259 |
| 73. | La Villa | 19.3% | 5.1%(+14.2)#74 | 4.9%(+14.4)#1,299 |
| 74. | Oak Trail Shores | 19.1% | 5.1%(+14.0)#75 | 4.9%(+14.2)#1,327 |
| 75. | Loraine | 18.9% | 5.1%(+13.8)#76 | 4.9%(+14.0)#1,363 |
| 76. | Cade Lakes | 18.9% | 5.1%(+13.8)#77 | 4.9%(+14.0)#1,365 |
| 77. | Rocky Mound | 18.8% | 5.1%(+13.7)#78 | 4.9%(+13.9)#1,384 |
| 78. | Valentine | 18.8% | 5.1%(+13.7)#79 | 4.9%(+13.9)#1,386 |
| 79. | South Alamo | 18.4% | 5.1%(+13.3)#80 | 4.9%(+13.5)#1,426 |
| 80. | Indian Lake | 18.4% | 5.1%(+13.3)#81 | 4.9%(+13.5)#1,428 |
| 81. | Goliad | 18.2% | 5.1%(+13.1)#82 | 4.9%(+13.3)#1,452 |
| 82. | Stonewall | 18.2% | 5.1%(+13.1)#83 | 4.9%(+13.3)#1,458 |
| 83. | Perrin | 18.0% | 5.1%(+12.9)#84 | 4.9%(+13.1)#1,493 |
| 84. | Grangerland | 17.9% | 5.1%(+12.8)#85 | 4.9%(+13.0)#1,502 |
| 85. | Gorman | 17.6% | 5.1%(+12.5)#86 | 4.9%(+12.7)#1,543 |
| 86. | Dell City | 17.6% | 5.1%(+12.5)#87 | 4.9%(+12.7)#1,554 |
| 87. | Port Isabel | 17.5% | 5.1%(+12.4)#88 | 4.9%(+12.6)#1,559 |
| 88. | Needville | 17.3% | 5.1%(+12.2)#89 | 4.9%(+12.4)#1,587 |
| 89. | Balmorhea | 17.3% | 5.1%(+12.2)#90 | 4.9%(+12.4)#1,599 |
| 90. | Ranchitos East | 17.3% | 5.1%(+12.2)#91 | 4.9%(+12.4)#1,601 |
| 91. | Lockett | 17.2% | 5.1%(+12.1)#92 | 4.9%(+12.3)#1,614 |
| 92. | Mcleod | 17.1% | 5.1%(+12.0)#93 | 4.9%(+12.2)#1,632 |
| 93. | Iredell | 17.0% | 5.1%(+11.9)#94 | 4.9%(+12.1)#1,649 |
| 94. | Grandfalls | 17.0% | 5.1%(+11.9)#95 | 4.9%(+12.1)#1,651 |
| 95. | North Cleveland | 17.0% | 5.1%(+11.9)#96 | 4.9%(+12.1)#1,652 |
| 96. | Alto Bonito Heights | 16.9% | 5.1%(+11.8)#97 | 4.9%(+12.0)#1,672 |
| 97. | Bishop | 16.8% | 5.1%(+11.7)#98 | 4.9%(+11.9)#1,687 |
| 98. | Redwater | 16.8% | 5.1%(+11.7)#99 | 4.9%(+11.9)#1,691 |
| 99. | South Frydek | 16.7% | 5.1%(+11.6)#100 | 4.9%(+11.8)#1,720 |
| 100. | Chula Vista Cdp Maverick County | 16.6% | 5.1%(+11.5)#101 | 4.9%(+11.7)#1,754 |
Common Questions
What are the Top 10 Cities with the Highest Percentage of Households with Income Below $10,000 in Texas?
Top 10 Cities with the Highest Percentage of Households with Income Below $10,000 in Texas are:
#1
100.0%
#2
100.0%
#3
91.8%
#4
81.1%
#5
80.0%
#6
76.2%
#7
68.6%
#8
66.7%
#9
63.0%
#10
60.0%
What city has the Highest Percentage of Households with Income Below $10,000 in Texas?
Martinez has the Highest Percentage of Households with Income Below $10,000 in Texas with 100.0%.
What is the Percentage of Households with Income Below $10,000 in the State of Texas?
Percentage of Households with Income Below $10,000 in Texas is 5.1%.
What is the Percentage of Households with Income Below $10,000 in the United States?
Percentage of Households with Income Below $10,000 in the United States is 4.9%.