Cities with the Highest Percentage of Households with Income Below $10,000 in Montana
RELATED REPORTS & OPTIONS
Household Income | $0-10k
Montana
Compare Cities
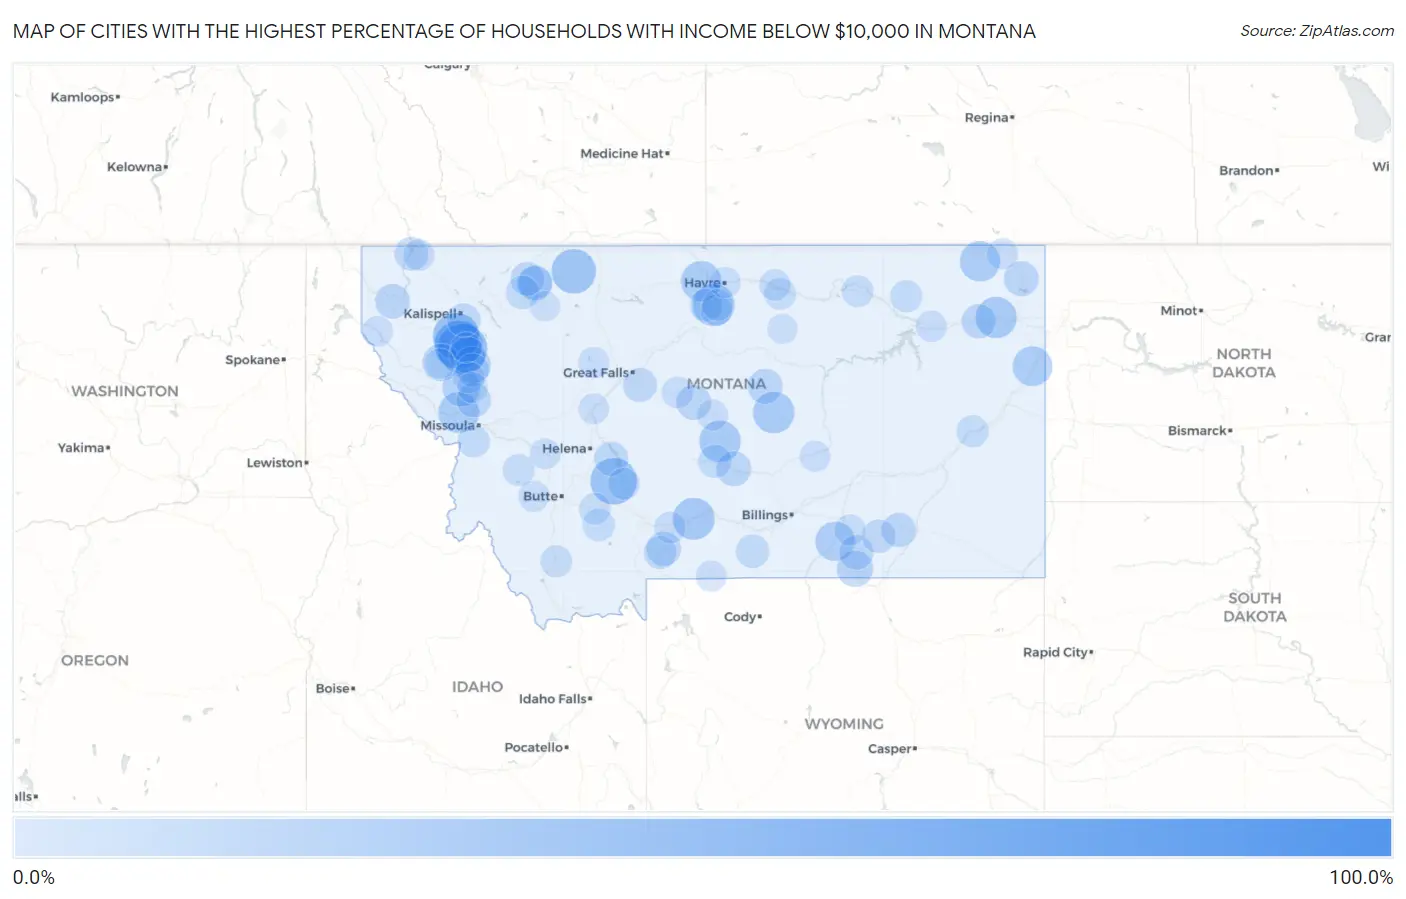
Map of Cities with the Highest Percentage of Households with Income Below $10,000 in Montana
0.0%
100.0%
Cities with the Highest Percentage of Households with Income Below $10,000 in Montana
| City | Households with Income < $10k | vs State | vs National | |
| 1. | St. Mary | 100.0% | 4.6%(+95.4)#1 | 4.9%(+95.1)#2 |
| 2. | Warm Spring Creek | 100.0% | 4.6%(+95.4)#2 | 4.9%(+95.1)#29 |
| 3. | Surprise Creek Colony | 100.0% | 4.6%(+95.4)#3 | 4.9%(+95.1)#32 |
| 4. | Riverview Colony | 83.8% | 4.6%(+79.2)#4 | 4.9%(+78.9)#44 |
| 5. | Eagle Creek Colony | 78.9% | 4.6%(+74.3)#5 | 4.9%(+74.0)#49 |
| 6. | Moccasin | 72.2% | 4.6%(+67.6)#6 | 4.9%(+67.3)#65 |
| 7. | Centerville | 66.7% | 4.6%(+62.1)#7 | 4.9%(+61.8)#82 |
| 8. | Big Stone Colony | 61.5% | 4.6%(+56.9)#8 | 4.9%(+56.6)#99 |
| 9. | New Miami Colony | 55.8% | 4.6%(+51.2)#9 | 4.9%(+50.9)#127 |
| 10. | Birch Creek Colony | 54.5% | 4.6%(+49.9)#10 | 4.9%(+49.6)#135 |
| 11. | Rimini | 51.9% | 4.6%(+47.3)#11 | 4.9%(+47.0)#148 |
| 12. | Big Arm | 48.9% | 4.6%(+44.3)#12 | 4.9%(+44.0)#180 |
| 13. | Elmo | 47.1% | 4.6%(+42.5)#13 | 4.9%(+42.2)#198 |
| 14. | Radersburg | 43.1% | 4.6%(+38.5)#14 | 4.9%(+38.2)#252 |
| 15. | Lake Mary Ronan | 42.9% | 4.6%(+38.3)#15 | 4.9%(+38.0)#258 |
| 16. | Wolf Creek | 42.9% | 4.6%(+38.3)#16 | 4.9%(+38.0)#260 |
| 17. | Santa Rita | 38.9% | 4.6%(+34.3)#17 | 4.9%(+34.0)#319 |
| 18. | Twodot | 37.5% | 4.6%(+32.9)#18 | 4.9%(+32.6)#341 |
| 19. | Acton | 35.0% | 4.6%(+30.4)#19 | 4.9%(+30.1)#402 |
| 20. | Boneau | 33.8% | 4.6%(+29.2)#20 | 4.9%(+28.9)#430 |
| 21. | Springdale | 33.3% | 4.6%(+28.7)#21 | 4.9%(+28.4)#459 |
| 22. | Judith Gap | 32.5% | 4.6%(+27.9)#22 | 4.9%(+27.6)#472 |
| 23. | Grass Range | 32.4% | 4.6%(+27.8)#23 | 4.9%(+27.5)#474 |
| 24. | Brockton | 32.0% | 4.6%(+27.4)#24 | 4.9%(+27.1)#490 |
| 25. | Huson | 30.9% | 4.6%(+26.3)#25 | 4.9%(+26.0)#514 |
| 26. | Flaxville | 30.0% | 4.6%(+25.4)#26 | 4.9%(+25.1)#550 |
| 27. | Kremlin | 30.0% | 4.6%(+25.4)#27 | 4.9%(+25.1)#551 |
| 28. | Crane | 28.8% | 4.6%(+24.2)#28 | 4.9%(+23.9)#608 |
| 29. | St Xavier | 28.1% | 4.6%(+23.5)#29 | 4.9%(+23.2)#639 |
| 30. | Old Agency | 25.0% | 4.6%(+20.4)#30 | 4.9%(+20.1)#793 |
| 31. | Camas | 23.8% | 4.6%(+19.2)#31 | 4.9%(+18.9)#882 |
| 32. | Jeffers | 23.1% | 4.6%(+18.5)#32 | 4.9%(+18.2)#934 |
| 33. | Pablo | 22.9% | 4.6%(+18.3)#33 | 4.9%(+18.0)#948 |
| 34. | Wyola | 21.9% | 4.6%(+17.3)#34 | 4.9%(+17.0)#1,022 |
| 35. | Jette | 21.8% | 4.6%(+17.2)#35 | 4.9%(+16.9)#1,028 |
| 36. | Gildford Colony | 20.0% | 4.6%(+15.4)#36 | 4.9%(+15.1)#1,225 |
| 37. | Floweree | 20.0% | 4.6%(+15.4)#37 | 4.9%(+15.1)#1,228 |
| 38. | Pendroy | 20.0% | 4.6%(+15.4)#38 | 4.9%(+15.1)#1,229 |
| 39. | Roy | 19.2% | 4.6%(+14.6)#39 | 4.9%(+14.3)#1,319 |
| 40. | White Haven | 19.0% | 4.6%(+14.4)#40 | 4.9%(+14.1)#1,336 |
| 41. | Stanford | 19.0% | 4.6%(+14.4)#41 | 4.9%(+14.1)#1,346 |
| 42. | Monarch | 18.8% | 4.6%(+14.2)#42 | 4.9%(+13.9)#1,391 |
| 43. | Shawmut | 18.8% | 4.6%(+14.2)#43 | 4.9%(+13.9)#1,392 |
| 44. | Reserve | 18.8% | 4.6%(+14.2)#44 | 4.9%(+13.9)#1,393 |
| 45. | South Browning | 18.5% | 4.6%(+13.9)#45 | 4.9%(+13.6)#1,414 |
| 46. | Arlee | 18.2% | 4.6%(+13.6)#46 | 4.9%(+13.3)#1,456 |
| 47. | Lodge Grass | 18.1% | 4.6%(+13.5)#47 | 4.9%(+13.2)#1,479 |
| 48. | Lame Deer | 18.0% | 4.6%(+13.4)#48 | 4.9%(+13.1)#1,485 |
| 49. | Emigrant | 18.0% | 4.6%(+13.4)#49 | 4.9%(+13.1)#1,491 |
| 50. | Poplar | 17.8% | 4.6%(+13.2)#50 | 4.9%(+12.9)#1,525 |
| 51. | Browning | 17.7% | 4.6%(+13.1)#51 | 4.9%(+12.8)#1,533 |
| 52. | Winston | 17.6% | 4.6%(+13.0)#52 | 4.9%(+12.7)#1,553 |
| 53. | Stockett | 17.0% | 4.6%(+12.4)#53 | 4.9%(+12.1)#1,655 |
| 54. | Starr School | 16.9% | 4.6%(+12.3)#54 | 4.9%(+12.0)#1,678 |
| 55. | Hogeland | 16.7% | 4.6%(+12.1)#55 | 4.9%(+11.8)#1,745 |
| 56. | Rexford | 16.4% | 4.6%(+11.8)#56 | 4.9%(+11.5)#1,797 |
| 57. | Busby | 16.3% | 4.6%(+11.7)#57 | 4.9%(+11.4)#1,807 |
| 58. | Forest Hill Village | 16.3% | 4.6%(+11.7)#58 | 4.9%(+11.4)#1,811 |
| 59. | Roberts | 16.2% | 4.6%(+11.6)#59 | 4.9%(+11.3)#1,828 |
| 60. | East Glacier Park Village | 16.2% | 4.6%(+11.6)#60 | 4.9%(+11.3)#1,829 |
| 61. | Rapelje | 16.0% | 4.6%(+11.4)#61 | 4.9%(+11.1)#1,871 |
| 62. | Harlowton | 15.8% | 4.6%(+11.2)#62 | 4.9%(+10.9)#1,904 |
| 63. | South Glastonbury | 15.3% | 4.6%(+10.7)#63 | 4.9%(+10.4)#2,037 |
| 64. | Ronan | 15.0% | 4.6%(+10.4)#64 | 4.9%(+10.1)#2,086 |
| 65. | Rocky Boy West | 15.0% | 4.6%(+10.4)#65 | 4.9%(+10.1)#2,089 |
| 66. | Pony | 14.0% | 4.6%(+9.40)#66 | 4.9%(+9.10)#2,381 |
| 67. | Carlton | 13.7% | 4.6%(+9.10)#67 | 4.9%(+8.80)#2,463 |
| 68. | Terry | 13.6% | 4.6%(+9.00)#68 | 4.9%(+8.70)#2,489 |
| 69. | St Marie | 13.4% | 4.6%(+8.80)#69 | 4.9%(+8.50)#2,555 |
| 70. | Dillon | 13.2% | 4.6%(+8.60)#70 | 4.9%(+8.30)#2,626 |
| 71. | Fort Belknap Agency | 13.1% | 4.6%(+8.50)#71 | 4.9%(+8.20)#2,670 |
| 72. | Philipsburg | 12.9% | 4.6%(+8.30)#72 | 4.9%(+8.00)#2,758 |
| 73. | Saco | 12.9% | 4.6%(+8.30)#73 | 4.9%(+8.00)#2,771 |
| 74. | Wineglass | 12.6% | 4.6%(+8.00)#74 | 4.9%(+7.70)#2,885 |
| 75. | Toston | 12.5% | 4.6%(+7.90)#75 | 4.9%(+7.60)#2,933 |
| 76. | Geyser | 12.5% | 4.6%(+7.90)#76 | 4.9%(+7.60)#2,944 |
| 77. | Cardwell | 12.5% | 4.6%(+7.90)#77 | 4.9%(+7.60)#2,949 |
| 78. | Harlem | 12.1% | 4.6%(+7.50)#78 | 4.9%(+7.20)#3,121 |
| 79. | St Pierre | 12.0% | 4.6%(+7.40)#79 | 4.9%(+7.10)#3,178 |
| 80. | Azure | 12.0% | 4.6%(+7.40)#80 | 4.9%(+7.10)#3,181 |
| 81. | Eureka | 11.9% | 4.6%(+7.30)#81 | 4.9%(+7.00)#3,218 |
| 82. | Charlo | 11.9% | 4.6%(+7.30)#82 | 4.9%(+7.00)#3,241 |
| 83. | Crow Agency | 11.8% | 4.6%(+7.20)#83 | 4.9%(+6.90)#3,282 |
| 84. | Hobson | 11.6% | 4.6%(+7.00)#84 | 4.9%(+6.70)#3,417 |
| 85. | Fairfield | 11.5% | 4.6%(+6.90)#85 | 4.9%(+6.60)#3,448 |
| 86. | Frazer | 11.5% | 4.6%(+6.90)#86 | 4.9%(+6.60)#3,458 |
| 87. | Outlook | 11.5% | 4.6%(+6.90)#87 | 4.9%(+6.60)#3,465 |
| 88. | Anaconda Deer Lodge County | 11.4% | 4.6%(+6.80)#88 | 4.9%(+6.50)#3,475 |
| 89. | Havre North | 11.4% | 4.6%(+6.80)#89 | 4.9%(+6.50)#3,507 |
| 90. | Cooke City | 11.1% | 4.6%(+6.50)#90 | 4.9%(+6.20)#3,687 |
| 91. | Musselshell | 11.1% | 4.6%(+6.50)#91 | 4.9%(+6.20)#3,697 |
| 92. | Windham | 11.1% | 4.6%(+6.50)#92 | 4.9%(+6.20)#3,699 |
| 93. | Garrison | 10.8% | 4.6%(+6.20)#93 | 4.9%(+5.90)#3,901 |
| 94. | St Ignatius | 10.7% | 4.6%(+6.10)#94 | 4.9%(+5.80)#3,934 |
| 95. | Noxon | 10.6% | 4.6%(+6.00)#95 | 4.9%(+5.70)#4,021 |
| 96. | Lindisfarne | 10.5% | 4.6%(+5.90)#96 | 4.9%(+5.60)#4,069 |
| 97. | Craig | 10.5% | 4.6%(+5.90)#97 | 4.9%(+5.60)#4,085 |
| 98. | Hot Springs | 9.9% | 4.6%(+5.30)#98 | 4.9%(+5.00)#4,481 |
| 99. | Heart Butte | 9.6% | 4.6%(+5.00)#99 | 4.9%(+4.70)#4,721 |
| 100. | Hays | 9.5% | 4.6%(+4.90)#100 | 4.9%(+4.60)#4,783 |
Common Questions
What are the Top 10 Cities with the Highest Percentage of Households with Income Below $10,000 in Montana?
Top 10 Cities with the Highest Percentage of Households with Income Below $10,000 in Montana are:
#1
48.9%
#2
47.1%
#3
43.1%
#4
42.9%
#5
38.9%
#6
33.8%
#7
33.3%
#8
32.5%
#9
32.4%
#10
32.0%
What city has the Highest Percentage of Households with Income Below $10,000 in Montana?
Big Arm has the Highest Percentage of Households with Income Below $10,000 in Montana with 48.9%.
What is the Percentage of Households with Income Below $10,000 in the State of Montana?
Percentage of Households with Income Below $10,000 in Montana is 4.6%.
What is the Percentage of Households with Income Below $10,000 in the United States?
Percentage of Households with Income Below $10,000 in the United States is 4.9%.