Cities with the Highest Percentage of Households with Income Below $10,000 in Kansas
RELATED REPORTS & OPTIONS
Household Income | $0-10k
Kansas
Compare Cities
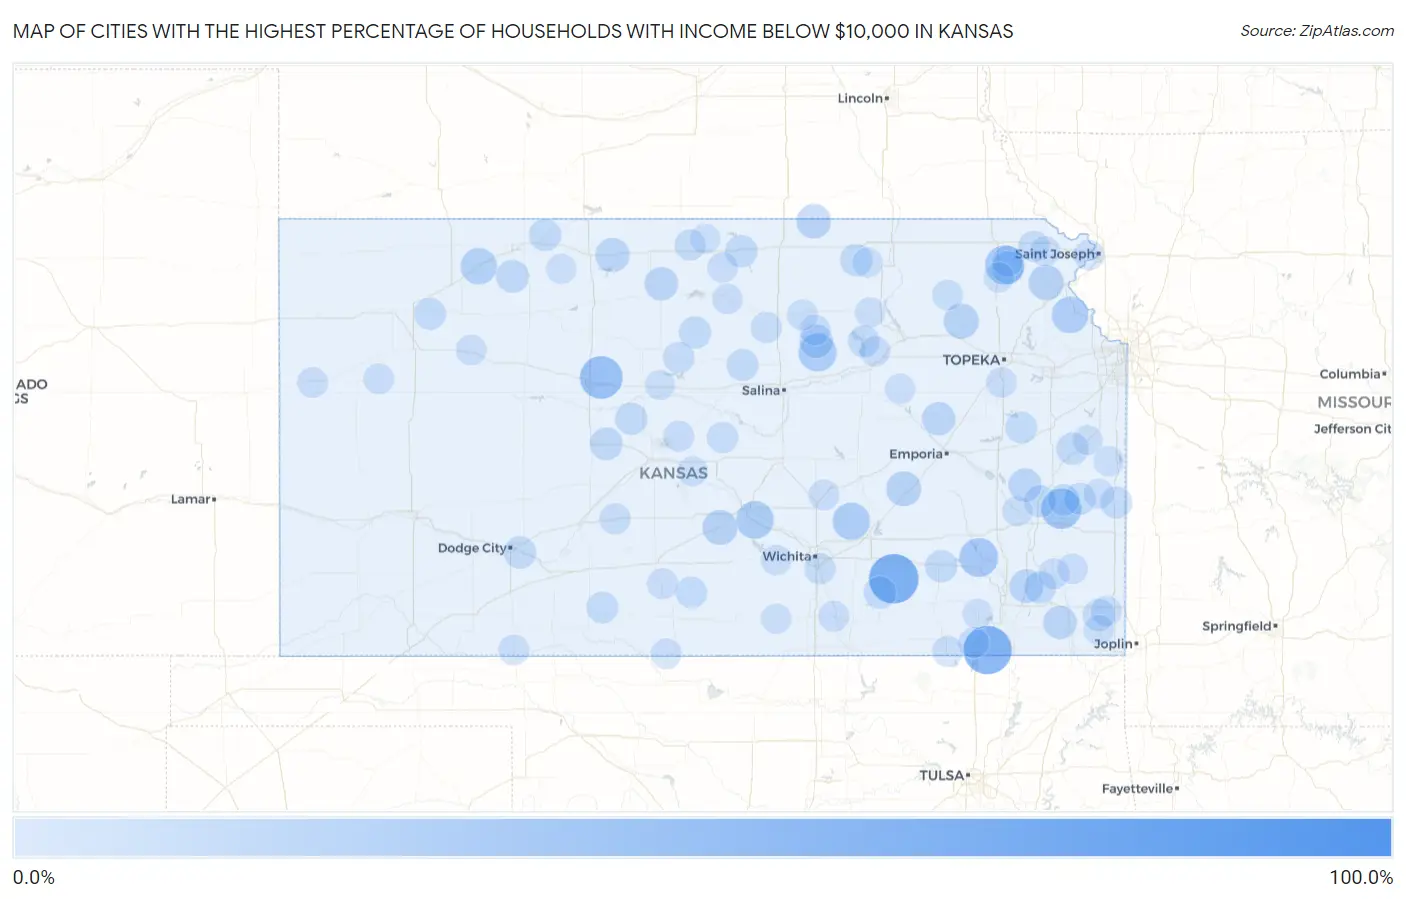
Map of Cities with the Highest Percentage of Households with Income Below $10,000 in Kansas
0.0%
100.0%
Cities with the Highest Percentage of Households with Income Below $10,000 in Kansas
| City | Households with Income < $10k | vs State | vs National | |
| 1. | Beaver | 100.0% | 4.5%(+95.5)#1 | 4.9%(+95.1)#28 |
| 2. | Latham | 64.0% | 4.5%(+59.5)#2 | 4.9%(+59.1)#89 |
| 3. | Tyro | 60.4% | 4.5%(+55.9)#3 | 4.9%(+55.5)#102 |
| 4. | Silverdale | 57.9% | 4.5%(+53.4)#4 | 4.9%(+53.0)#114 |
| 5. | Centropolis | 49.0% | 4.5%(+44.5)#5 | 4.9%(+44.1)#178 |
| 6. | Navarre | 45.1% | 4.5%(+40.6)#6 | 4.9%(+40.2)#223 |
| 7. | Catharine | 44.3% | 4.5%(+39.8)#7 | 4.9%(+39.4)#235 |
| 8. | Mildred | 37.5% | 4.5%(+33.0)#8 | 4.9%(+32.6)#342 |
| 9. | Kickapoo Site 7 | 35.0% | 4.5%(+30.5)#9 | 4.9%(+30.1)#403 |
| 10. | Coyville | 33.3% | 4.5%(+28.8)#10 | 4.9%(+28.4)#452 |
| 11. | Manchester | 31.0% | 4.5%(+26.5)#11 | 4.9%(+26.1)#511 |
| 12. | Murdock | 30.8% | 4.5%(+26.3)#12 | 4.9%(+25.9)#520 |
| 13. | Yoder | 29.6% | 4.5%(+25.1)#13 | 4.9%(+24.7)#574 |
| 14. | Potwin | 28.9% | 4.5%(+24.4)#14 | 4.9%(+24.0)#596 |
| 15. | Easton | 26.7% | 4.5%(+22.2)#15 | 4.9%(+21.8)#698 |
| 16. | Jennings | 26.3% | 4.5%(+21.8)#16 | 4.9%(+21.4)#724 |
| 17. | Neal | 24.0% | 4.5%(+19.5)#17 | 4.9%(+19.1)#864 |
| 18. | Lancaster | 23.0% | 4.5%(+18.5)#18 | 4.9%(+18.1)#944 |
| 19. | Emmett | 22.7% | 4.5%(+18.2)#19 | 4.9%(+17.8)#958 |
| 20. | Arlington | 22.4% | 4.5%(+17.9)#20 | 4.9%(+17.5)#983 |
| 21. | Matfield Green | 22.2% | 4.5%(+17.7)#21 | 4.9%(+17.3)#1,005 |
| 22. | Mahaska | 20.7% | 4.5%(+16.2)#22 | 4.9%(+15.8)#1,140 |
| 23. | Agra | 19.8% | 4.5%(+15.3)#23 | 4.9%(+14.9)#1,247 |
| 24. | Thayer | 19.1% | 4.5%(+14.6)#24 | 4.9%(+14.2)#1,330 |
| 25. | Longford | 18.5% | 4.5%(+14.0)#25 | 4.9%(+13.6)#1,423 |
| 26. | Portis | 18.2% | 4.5%(+13.7)#26 | 4.9%(+13.3)#1,465 |
| 27. | Bushong | 18.2% | 4.5%(+13.7)#27 | 4.9%(+13.3)#1,469 |
| 28. | Labette | 18.2% | 4.5%(+13.7)#28 | 4.9%(+13.3)#1,471 |
| 29. | Westphalia | 17.9% | 4.5%(+13.4)#29 | 4.9%(+13.0)#1,512 |
| 30. | Lenora | 17.0% | 4.5%(+12.5)#30 | 4.9%(+12.1)#1,653 |
| 31. | Timken | 16.7% | 4.5%(+12.2)#31 | 4.9%(+11.8)#1,742 |
| 32. | Kickapoo Tribal Center | 16.0% | 4.5%(+11.5)#32 | 4.9%(+11.1)#1,870 |
| 33. | Lane | 15.7% | 4.5%(+11.2)#33 | 4.9%(+10.8)#1,940 |
| 34. | Almena | 15.5% | 4.5%(+11.0)#34 | 4.9%(+10.6)#1,983 |
| 35. | Greenleaf | 15.5% | 4.5%(+11.0)#35 | 4.9%(+10.6)#1,984 |
| 36. | Galatia | 15.4% | 4.5%(+10.9)#36 | 4.9%(+10.5)#2,019 |
| 37. | Wilroads Gardens | 15.3% | 4.5%(+10.8)#37 | 4.9%(+10.4)#2,029 |
| 38. | Atlanta | 15.3% | 4.5%(+10.8)#38 | 4.9%(+10.4)#2,040 |
| 39. | Hunter | 15.2% | 4.5%(+10.7)#39 | 4.9%(+10.3)#2,057 |
| 40. | Formoso | 15.2% | 4.5%(+10.7)#40 | 4.9%(+10.3)#2,058 |
| 41. | Galesburg | 15.0% | 4.5%(+10.5)#41 | 4.9%(+10.1)#2,105 |
| 42. | Severy | 14.9% | 4.5%(+10.4)#42 | 4.9%(+10.00)#2,134 |
| 43. | Colony | 14.7% | 4.5%(+10.2)#43 | 4.9%(+9.80)#2,190 |
| 44. | Roseland | 14.3% | 4.5%(+9.80)#44 | 4.9%(+9.40)#2,298 |
| 45. | Menlo | 14.3% | 4.5%(+9.80)#45 | 4.9%(+9.40)#2,299 |
| 46. | Prescott | 14.1% | 4.5%(+9.60)#46 | 4.9%(+9.20)#2,343 |
| 47. | Beverly | 14.1% | 4.5%(+9.60)#47 | 4.9%(+9.20)#2,346 |
| 48. | Blue Mound | 14.0% | 4.5%(+9.50)#48 | 4.9%(+9.10)#2,376 |
| 49. | Milford | 13.3% | 4.5%(+8.80)#49 | 4.9%(+8.40)#2,600 |
| 50. | Wilmore | 13.3% | 4.5%(+8.80)#50 | 4.9%(+8.40)#2,621 |
| 51. | Kincaid | 13.2% | 4.5%(+8.70)#51 | 4.9%(+8.30)#2,652 |
| 52. | Quenemo | 13.0% | 4.5%(+8.50)#52 | 4.9%(+8.10)#2,716 |
| 53. | Nashville | 13.0% | 4.5%(+8.50)#53 | 4.9%(+8.10)#2,729 |
| 54. | Lucas | 12.6% | 4.5%(+8.10)#54 | 4.9%(+7.70)#2,869 |
| 55. | Geneseo | 12.2% | 4.5%(+7.70)#55 | 4.9%(+7.30)#3,081 |
| 56. | Oaklawn Sunview | 12.1% | 4.5%(+7.60)#56 | 4.9%(+7.20)#3,104 |
| 57. | Belpre | 12.0% | 4.5%(+7.50)#57 | 4.9%(+7.10)#3,198 |
| 58. | Robinson | 11.7% | 4.5%(+7.20)#58 | 4.9%(+6.80)#3,359 |
| 59. | Delphos | 11.5% | 4.5%(+7.00)#59 | 4.9%(+6.60)#3,459 |
| 60. | Esbon | 11.4% | 4.5%(+6.90)#60 | 4.9%(+6.50)#3,533 |
| 61. | Claflin | 11.3% | 4.5%(+6.80)#61 | 4.9%(+6.40)#3,590 |
| 62. | Oxford | 11.1% | 4.5%(+6.60)#62 | 4.9%(+6.20)#3,660 |
| 63. | Kickapoo Site 1 | 11.1% | 4.5%(+6.60)#63 | 4.9%(+6.20)#3,684 |
| 64. | Havana | 11.1% | 4.5%(+6.60)#64 | 4.9%(+6.20)#3,688 |
| 65. | Chautauqua | 11.1% | 4.5%(+6.60)#65 | 4.9%(+6.20)#3,689 |
| 66. | Oak Hill | 11.1% | 4.5%(+6.60)#66 | 4.9%(+6.20)#3,702 |
| 67. | Erie | 11.0% | 4.5%(+6.50)#67 | 4.9%(+6.10)#3,727 |
| 68. | Sharon Springs | 11.0% | 4.5%(+6.50)#68 | 4.9%(+6.10)#3,735 |
| 69. | Weir | 11.0% | 4.5%(+6.50)#69 | 4.9%(+6.10)#3,738 |
| 70. | Miltonvale | 11.0% | 4.5%(+6.50)#70 | 4.9%(+6.10)#3,748 |
| 71. | Walton | 10.9% | 4.5%(+6.40)#71 | 4.9%(+6.00)#3,818 |
| 72. | Sawyer | 10.9% | 4.5%(+6.40)#72 | 4.9%(+6.00)#3,825 |
| 73. | Onaga | 10.6% | 4.5%(+6.10)#73 | 4.9%(+5.70)#4,011 |
| 74. | Hardtner | 10.5% | 4.5%(+6.00)#74 | 4.9%(+5.60)#4,080 |
| 75. | Russell Springs | 10.5% | 4.5%(+6.00)#75 | 4.9%(+5.60)#4,086 |
| 76. | Wathena | 10.3% | 4.5%(+5.80)#76 | 4.9%(+5.40)#4,174 |
| 77. | Englewood | 10.3% | 4.5%(+5.80)#77 | 4.9%(+5.40)#4,227 |
| 78. | Park | 10.2% | 4.5%(+5.70)#78 | 4.9%(+5.30)#4,298 |
| 79. | Garden Plain | 10.0% | 4.5%(+5.50)#79 | 4.9%(+5.10)#4,393 |
| 80. | Jewell | 10.0% | 4.5%(+5.50)#80 | 4.9%(+5.10)#4,405 |
| 81. | Wakarusa | 10.0% | 4.5%(+5.50)#81 | 4.9%(+5.10)#4,411 |
| 82. | Fort Riley | 9.9% | 4.5%(+5.40)#82 | 4.9%(+5.00)#4,441 |
| 83. | Beloit | 9.9% | 4.5%(+5.40)#83 | 4.9%(+5.00)#4,452 |
| 84. | Walnut | 9.9% | 4.5%(+5.40)#84 | 4.9%(+5.00)#4,507 |
| 85. | Netawaka | 9.8% | 4.5%(+5.30)#85 | 4.9%(+4.90)#4,588 |
| 86. | Milan | 9.8% | 4.5%(+5.30)#86 | 4.9%(+4.90)#4,593 |
| 87. | La Cygne | 9.7% | 4.5%(+5.20)#87 | 4.9%(+4.80)#4,631 |
| 88. | Osawatomie | 9.5% | 4.5%(+5.00)#88 | 4.9%(+4.60)#4,763 |
| 89. | Mound City | 9.5% | 4.5%(+5.00)#89 | 4.9%(+4.60)#4,788 |
| 90. | Dwight | 9.5% | 4.5%(+5.00)#90 | 4.9%(+4.60)#4,808 |
| 91. | Neosho Falls | 9.5% | 4.5%(+5.00)#91 | 4.9%(+4.60)#4,818 |
| 92. | Raymond | 9.4% | 4.5%(+4.90)#92 | 4.9%(+4.50)#4,912 |
| 93. | Logan | 9.2% | 4.5%(+4.70)#93 | 4.9%(+4.30)#5,068 |
| 94. | Barnes | 9.2% | 4.5%(+4.70)#94 | 4.9%(+4.30)#5,091 |
| 95. | Burr Oak | 9.2% | 4.5%(+4.70)#95 | 4.9%(+4.30)#5,093 |
| 96. | Columbus | 9.1% | 4.5%(+4.60)#96 | 4.9%(+4.20)#5,125 |
| 97. | Leonardville | 9.1% | 4.5%(+4.60)#97 | 4.9%(+4.20)#5,157 |
| 98. | Elk City | 9.1% | 4.5%(+4.60)#98 | 4.9%(+4.20)#5,170 |
| 99. | Bunker Hill | 9.1% | 4.5%(+4.60)#99 | 4.9%(+4.20)#5,187 |
| 100. | Leona | 9.1% | 4.5%(+4.60)#100 | 4.9%(+4.20)#5,201 |
Common Questions
What are the Top 10 Cities with the Highest Percentage of Households with Income Below $10,000 in Kansas?
Top 10 Cities with the Highest Percentage of Households with Income Below $10,000 in Kansas are:
#1
64.0%
#2
60.4%
#3
44.3%
#4
37.5%
#5
35.0%
#6
33.3%
#7
31.0%
#8
29.6%
#9
28.9%
#10
26.7%
What city has the Highest Percentage of Households with Income Below $10,000 in Kansas?
Latham has the Highest Percentage of Households with Income Below $10,000 in Kansas with 64.0%.
What is the Percentage of Households with Income Below $10,000 in the State of Kansas?
Percentage of Households with Income Below $10,000 in Kansas is 4.5%.
What is the Percentage of Households with Income Below $10,000 in the United States?
Percentage of Households with Income Below $10,000 in the United States is 4.9%.