Cities with the Highest Percentage of Households with Income Below $10,000 in Iowa
RELATED REPORTS & OPTIONS
Household Income | $0-10k
Iowa
Compare Cities
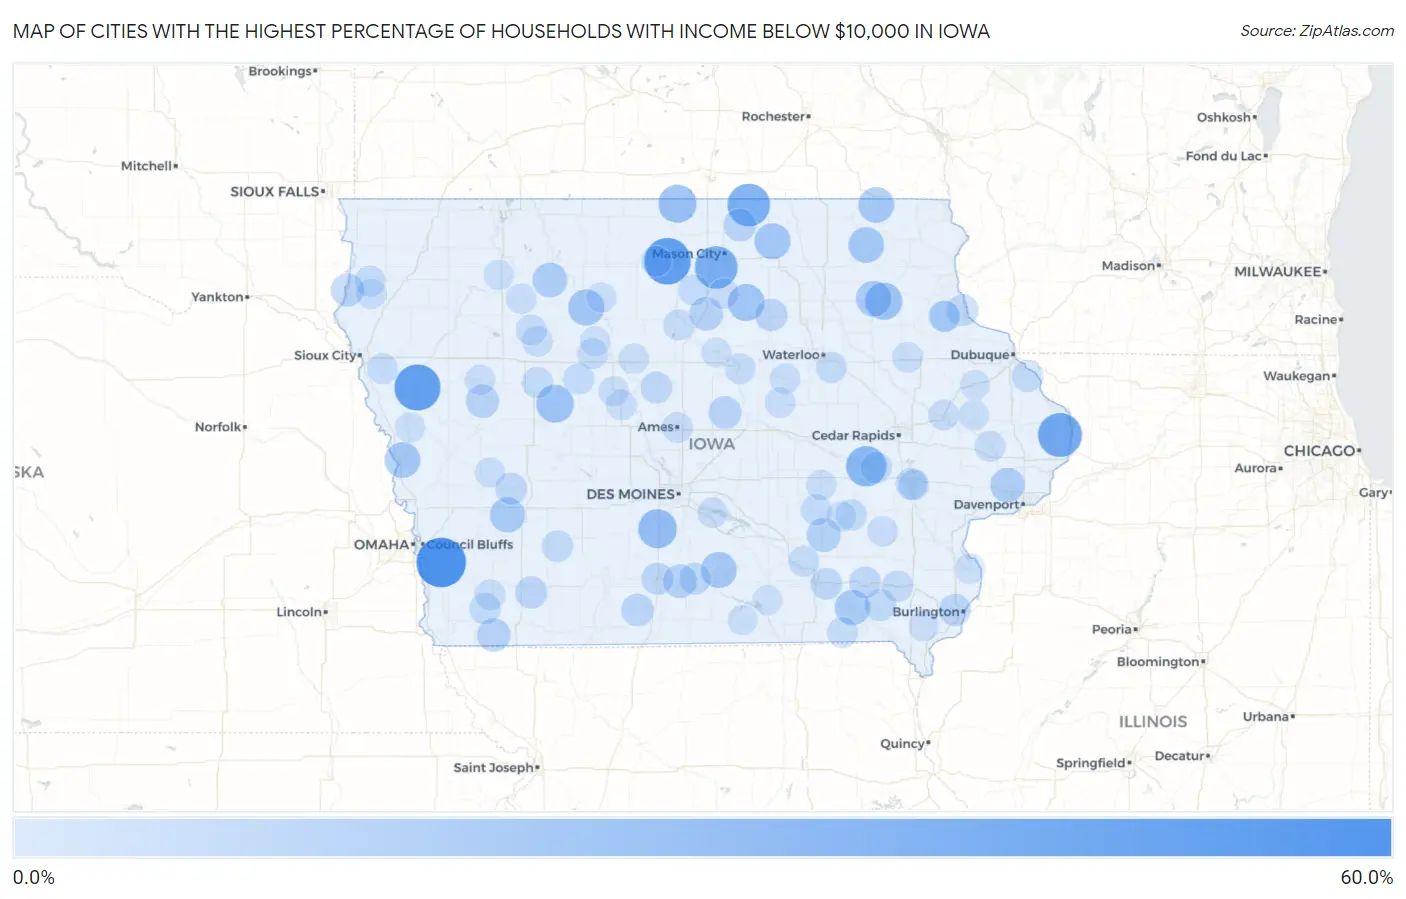
Map of Cities with the Highest Percentage of Households with Income Below $10,000 in Iowa
0.0%
60.0%
Cities with the Highest Percentage of Households with Income Below $10,000 in Iowa
| City | Households with Income < $10k | vs State | vs National | |
| 1. | Mineola | 57.9% | 4.2%(+53.7)#1 | 4.9%(+53.0)#115 |
| 2. | Duncan | 50.0% | 4.2%(+45.8)#2 | 4.9%(+45.1)#166 |
| 3. | Oto | 48.9% | 4.2%(+44.7)#3 | 4.9%(+44.0)#181 |
| 4. | Andover | 43.5% | 4.2%(+39.3)#4 | 4.9%(+38.6)#245 |
| 5. | Otranto | 40.0% | 4.2%(+35.8)#5 | 4.9%(+35.1)#300 |
| 6. | Burchinal | 40.0% | 4.2%(+35.8)#6 | 4.9%(+35.1)#301 |
| 7. | South Amana | 34.0% | 4.2%(+29.8)#7 | 4.9%(+29.1)#427 |
| 8. | Bevington | 30.0% | 4.2%(+25.8)#8 | 4.9%(+25.1)#555 |
| 9. | Scarville | 28.1% | 4.2%(+23.9)#9 | 4.9%(+23.2)#641 |
| 10. | Lanesboro | 27.0% | 4.2%(+22.8)#10 | 4.9%(+22.1)#687 |
| 11. | Wever | 26.8% | 4.2%(+22.6)#11 | 4.9%(+21.9)#696 |
| 12. | Fayette | 25.6% | 4.2%(+21.4)#12 | 4.9%(+20.7)#755 |
| 13. | Aredale | 25.0% | 4.2%(+20.8)#13 | 4.9%(+20.1)#800 |
| 14. | Bradgate | 23.3% | 4.2%(+19.1)#14 | 4.9%(+18.4)#911 |
| 15. | Orchard | 23.1% | 4.2%(+18.9)#15 | 4.9%(+18.2)#928 |
| 16. | Williamson | 22.6% | 4.2%(+18.4)#16 | 4.9%(+17.7)#967 |
| 17. | Burr Oak | 22.2% | 4.2%(+18.0)#17 | 4.9%(+17.3)#998 |
| 18. | Little Sioux | 22.2% | 4.2%(+18.0)#18 | 4.9%(+17.3)#999 |
| 19. | Spillville | 22.1% | 4.2%(+17.9)#19 | 4.9%(+17.2)#1,011 |
| 20. | Randalia | 21.9% | 4.2%(+17.7)#20 | 4.9%(+17.0)#1,024 |
| 21. | Douds | 20.8% | 4.2%(+16.6)#21 | 4.9%(+15.9)#1,127 |
| 22. | Marne | 20.8% | 4.2%(+16.6)#22 | 4.9%(+15.9)#1,129 |
| 23. | Curlew | 20.0% | 4.2%(+15.8)#23 | 4.9%(+15.1)#1,217 |
| 24. | Maysville | 18.8% | 4.2%(+14.6)#24 | 4.9%(+13.9)#1,383 |
| 25. | Delta | 17.9% | 4.2%(+13.7)#25 | 4.9%(+13.0)#1,507 |
| 26. | Woodburn | 16.9% | 4.2%(+12.7)#26 | 4.9%(+12.0)#1,681 |
| 27. | Latimer | 16.8% | 4.2%(+12.6)#27 | 4.9%(+11.9)#1,697 |
| 28. | Coin | 16.5% | 4.2%(+12.3)#28 | 4.9%(+11.6)#1,777 |
| 29. | Kiron | 16.3% | 4.2%(+12.1)#29 | 4.9%(+11.4)#1,809 |
| 30. | Chatsworth | 15.6% | 4.2%(+11.4)#30 | 4.9%(+10.7)#1,962 |
| 31. | St Anthony | 15.0% | 4.2%(+10.8)#31 | 4.9%(+10.1)#2,104 |
| 32. | Grafton | 14.9% | 4.2%(+10.7)#32 | 4.9%(+10.00)#2,133 |
| 33. | Grand River | 14.3% | 4.2%(+10.1)#33 | 4.9%(+9.40)#2,280 |
| 34. | Allison | 14.0% | 4.2%(+9.80)#34 | 4.9%(+9.10)#2,364 |
| 35. | Nodaway | 13.8% | 4.2%(+9.60)#35 | 4.9%(+8.90)#2,445 |
| 36. | Osceola | 13.6% | 4.2%(+9.40)#36 | 4.9%(+8.70)#2,475 |
| 37. | West Burlington | 13.1% | 4.2%(+8.90)#37 | 4.9%(+8.20)#2,661 |
| 38. | Stanhope | 12.9% | 4.2%(+8.70)#38 | 4.9%(+8.00)#2,766 |
| 39. | Stockport | 12.7% | 4.2%(+8.50)#39 | 4.9%(+7.80)#2,837 |
| 40. | Lucas | 12.7% | 4.2%(+8.50)#40 | 4.9%(+7.80)#2,845 |
| 41. | Guttenberg | 12.6% | 4.2%(+8.40)#41 | 4.9%(+7.70)#2,856 |
| 42. | Kimballton | 12.6% | 4.2%(+8.40)#42 | 4.9%(+7.70)#2,877 |
| 43. | Fairfield | 12.5% | 4.2%(+8.30)#43 | 4.9%(+7.60)#2,891 |
| 44. | University Heights | 12.5% | 4.2%(+8.30)#44 | 4.9%(+7.60)#2,911 |
| 45. | Agency | 12.3% | 4.2%(+8.10)#45 | 4.9%(+7.40)#3,033 |
| 46. | St Donatus | 12.2% | 4.2%(+8.00)#46 | 4.9%(+7.30)#3,087 |
| 47. | Homestead | 12.0% | 4.2%(+7.80)#47 | 4.9%(+7.10)#3,191 |
| 48. | Bridgewater | 11.8% | 4.2%(+7.60)#48 | 4.9%(+6.90)#3,309 |
| 49. | South English | 11.6% | 4.2%(+7.40)#49 | 4.9%(+6.70)#3,415 |
| 50. | Essex | 11.5% | 4.2%(+7.30)#50 | 4.9%(+6.60)#3,447 |
| 51. | Rome | 11.4% | 4.2%(+7.20)#51 | 4.9%(+6.50)#3,532 |
| 52. | Meservey | 11.1% | 4.2%(+6.90)#52 | 4.9%(+6.20)#3,672 |
| 53. | Oak Hills | 11.1% | 4.2%(+6.90)#53 | 4.9%(+6.20)#3,682 |
| 54. | Gibson | 11.1% | 4.2%(+6.90)#54 | 4.9%(+6.20)#3,694 |
| 55. | Elkport | 11.1% | 4.2%(+6.90)#55 | 4.9%(+6.20)#3,700 |
| 56. | Yetter | 11.1% | 4.2%(+6.90)#56 | 4.9%(+6.20)#3,701 |
| 57. | Washburn | 10.8% | 4.2%(+6.60)#57 | 4.9%(+5.90)#3,883 |
| 58. | Garber | 10.8% | 4.2%(+6.60)#58 | 4.9%(+5.90)#3,899 |
| 59. | Bronson | 10.7% | 4.2%(+6.50)#59 | 4.9%(+5.80)#3,953 |
| 60. | Kirkville | 10.7% | 4.2%(+6.50)#60 | 4.9%(+5.80)#3,957 |
| 61. | Rinard | 10.7% | 4.2%(+6.50)#61 | 4.9%(+5.80)#3,965 |
| 62. | Ireton | 10.6% | 4.2%(+6.40)#62 | 4.9%(+5.70)#4,012 |
| 63. | Galt | 10.5% | 4.2%(+6.30)#63 | 4.9%(+5.60)#4,083 |
| 64. | Fonda | 10.4% | 4.2%(+6.20)#64 | 4.9%(+5.50)#4,119 |
| 65. | Milton | 10.3% | 4.2%(+6.10)#65 | 4.9%(+5.40)#4,196 |
| 66. | Steamboat Rock | 10.3% | 4.2%(+6.10)#66 | 4.9%(+5.40)#4,213 |
| 67. | Toronto | 10.3% | 4.2%(+6.10)#67 | 4.9%(+5.40)#4,228 |
| 68. | Iowa City | 10.1% | 4.2%(+5.90)#68 | 4.9%(+5.20)#4,301 |
| 69. | Barnum | 10.1% | 4.2%(+5.90)#69 | 4.9%(+5.20)#4,359 |
| 70. | Coburg | 10.0% | 4.2%(+5.80)#70 | 4.9%(+5.10)#4,424 |
| 71. | Varina | 10.0% | 4.2%(+5.80)#71 | 4.9%(+5.10)#4,428 |
| 72. | Ames | 9.9% | 4.2%(+5.70)#72 | 4.9%(+5.00)#4,434 |
| 73. | Anamosa | 9.9% | 4.2%(+5.70)#73 | 4.9%(+5.00)#4,443 |
| 74. | Masonville | 9.8% | 4.2%(+5.60)#74 | 4.9%(+4.90)#4,595 |
| 75. | Sheffield | 9.7% | 4.2%(+5.50)#75 | 4.9%(+4.80)#4,636 |
| 76. | Britt | 9.6% | 4.2%(+5.40)#76 | 4.9%(+4.70)#4,696 |
| 77. | Arthur | 9.6% | 4.2%(+5.40)#77 | 4.9%(+4.70)#4,734 |
| 78. | Morrison | 9.6% | 4.2%(+5.40)#78 | 4.9%(+4.70)#4,744 |
| 79. | West Chester | 9.5% | 4.2%(+5.30)#79 | 4.9%(+4.60)#4,815 |
| 80. | Marathon | 9.4% | 4.2%(+5.20)#80 | 4.9%(+4.50)#4,907 |
| 81. | Craig | 9.4% | 4.2%(+5.20)#81 | 4.9%(+4.50)#4,917 |
| 82. | Guernsey | 9.4% | 4.2%(+5.20)#82 | 4.9%(+4.50)#4,918 |
| 83. | Gladbrook | 9.2% | 4.2%(+5.00)#83 | 4.9%(+4.30)#5,061 |
| 84. | Boxholm | 9.2% | 4.2%(+5.00)#84 | 4.9%(+4.30)#5,092 |
| 85. | Bode | 9.1% | 4.2%(+4.90)#85 | 4.9%(+4.20)#5,162 |
| 86. | Onslow | 9.1% | 4.2%(+4.90)#86 | 4.9%(+4.20)#5,167 |
| 87. | Swan | 9.1% | 4.2%(+4.90)#87 | 4.9%(+4.20)#5,197 |
| 88. | Kirkman | 9.1% | 4.2%(+4.90)#88 | 4.9%(+4.20)#5,198 |
| 89. | Duncombe | 9.0% | 4.2%(+4.80)#89 | 4.9%(+4.10)#5,297 |
| 90. | Harcourt | 9.0% | 4.2%(+4.80)#90 | 4.9%(+4.10)#5,306 |
| 91. | Oakville | 8.9% | 4.2%(+4.70)#91 | 4.9%(+4.00)#5,402 |
| 92. | Rossie | 8.9% | 4.2%(+4.70)#92 | 4.9%(+4.00)#5,409 |
| 93. | Webster | 8.8% | 4.2%(+4.60)#93 | 4.9%(+3.90)#5,519 |
| 94. | Plano | 8.7% | 4.2%(+4.50)#94 | 4.9%(+3.80)#5,642 |
| 95. | Clare | 8.6% | 4.2%(+4.40)#95 | 4.9%(+3.70)#5,741 |
| 96. | Turin | 8.6% | 4.2%(+4.40)#96 | 4.9%(+3.70)#5,744 |
| 97. | Iowa Falls | 8.5% | 4.2%(+4.30)#97 | 4.9%(+3.60)#5,776 |
| 98. | Cascade | 8.5% | 4.2%(+4.30)#98 | 4.9%(+3.60)#5,795 |
| 99. | West Point | 8.5% | 4.2%(+4.30)#99 | 4.9%(+3.60)#5,820 |
| 100. | Moravia | 8.5% | 4.2%(+4.30)#100 | 4.9%(+3.60)#5,834 |
Common Questions
What are the Top 10 Cities with the Highest Percentage of Households with Income Below $10,000 in Iowa?
Top 10 Cities with the Highest Percentage of Households with Income Below $10,000 in Iowa are:
What city has the Highest Percentage of Households with Income Below $10,000 in Iowa?
Mineola has the Highest Percentage of Households with Income Below $10,000 in Iowa with 57.9%.
What is the Percentage of Households with Income Below $10,000 in the State of Iowa?
Percentage of Households with Income Below $10,000 in Iowa is 4.2%.
What is the Percentage of Households with Income Below $10,000 in the United States?
Percentage of Households with Income Below $10,000 in the United States is 4.9%.