Cities with the Highest Percentage of Households with Income Below $10,000 in North Carolina
RELATED REPORTS & OPTIONS
Household Income | $0-10k
North Carolina
Compare Cities
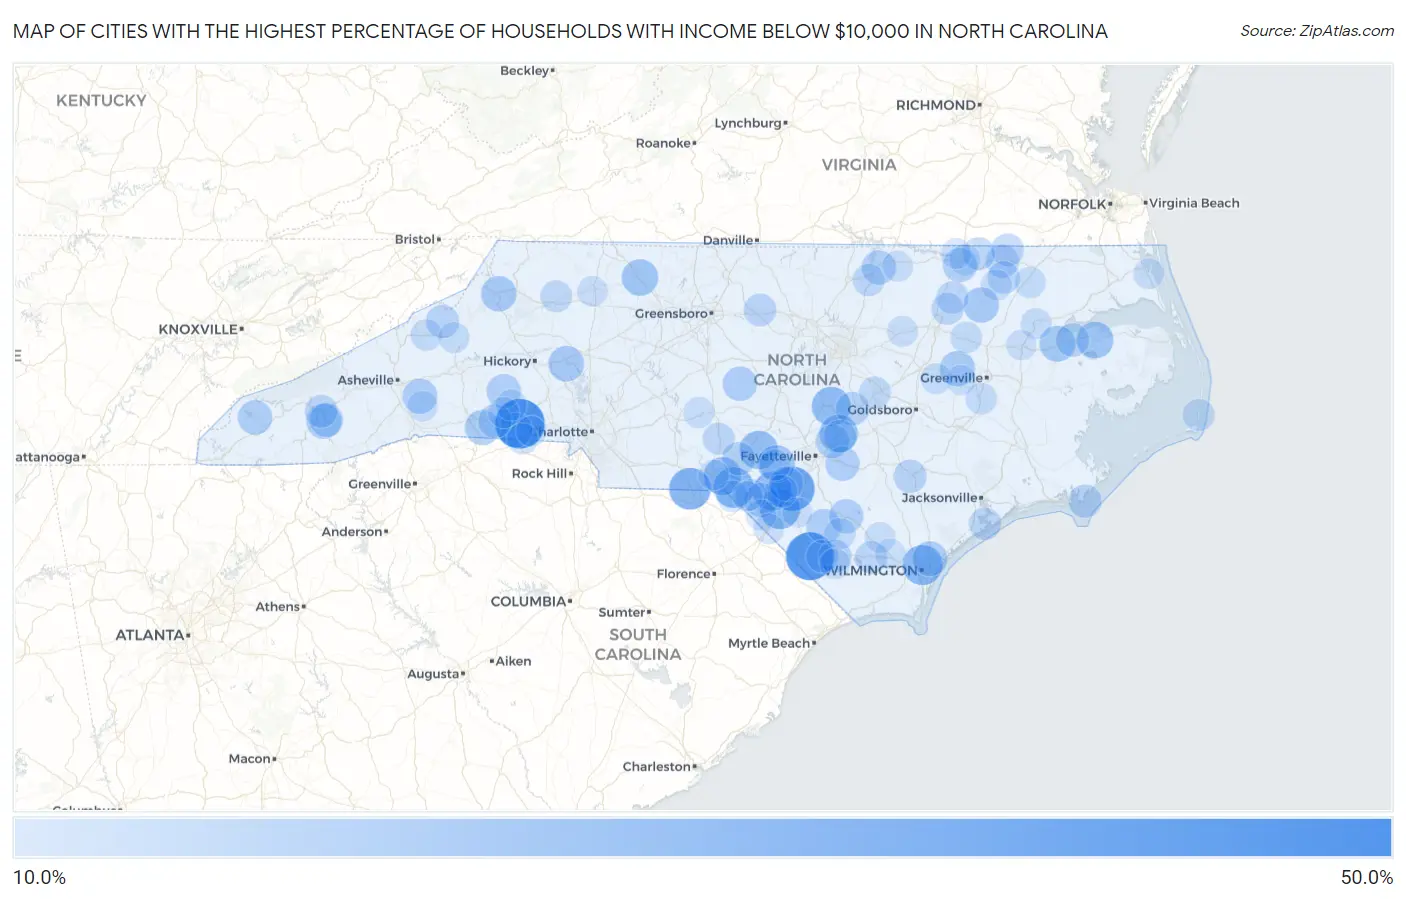
Map of Cities with the Highest Percentage of Households with Income Below $10,000 in North Carolina
0.0%
50.0%
Cities with the Highest Percentage of Households with Income Below $10,000 in North Carolina
| City | Households with Income < $10k | vs State | vs National | |
| 1. | Light Oak | 48.9% | 5.1%(+43.8)#1 | 4.9%(+44.0)#179 |
| 2. | Cerro Gordo | 45.7% | 5.1%(+40.6)#2 | 4.9%(+40.8)#214 |
| 3. | Rennert | 38.7% | 5.1%(+33.6)#3 | 4.9%(+33.8)#322 |
| 4. | Mcfarlan | 33.3% | 5.1%(+28.2)#4 | 4.9%(+28.4)#447 |
| 5. | Pembroke | 30.9% | 5.1%(+25.8)#5 | 4.9%(+26.0)#512 |
| 6. | Old Hundred | 30.8% | 5.1%(+25.7)#6 | 4.9%(+25.9)#518 |
| 7. | Hightsville | 30.3% | 5.1%(+25.2)#7 | 4.9%(+25.4)#535 |
| 8. | Barnardsville | 29.1% | 5.1%(+24.0)#8 | 4.9%(+24.2)#592 |
| 9. | Wakulla | 28.6% | 5.1%(+23.5)#9 | 4.9%(+23.7)#615 |
| 10. | Buies Creek | 28.2% | 5.1%(+23.1)#10 | 4.9%(+23.3)#630 |
| 11. | Ashley Heights | 27.2% | 5.1%(+22.1)#11 | 4.9%(+22.3)#677 |
| 12. | Godwin | 27.0% | 5.1%(+21.9)#12 | 4.9%(+22.1)#685 |
| 13. | Dobbins Heights | 26.3% | 5.1%(+21.2)#13 | 4.9%(+21.4)#722 |
| 14. | Silver City | 24.6% | 5.1%(+19.5)#14 | 4.9%(+19.7)#823 |
| 15. | Creswell | 23.9% | 5.1%(+18.8)#15 | 4.9%(+19.0)#868 |
| 16. | Pinnacle | 23.3% | 5.1%(+18.2)#16 | 4.9%(+18.4)#906 |
| 17. | Plymouth | 22.3% | 5.1%(+17.2)#17 | 4.9%(+17.4)#989 |
| 18. | Catawba | 21.7% | 5.1%(+16.6)#18 | 4.9%(+16.8)#1,035 |
| 19. | Boone | 21.4% | 5.1%(+16.3)#19 | 4.9%(+16.5)#1,064 |
| 20. | Scotland Neck | 21.3% | 5.1%(+16.2)#20 | 4.9%(+16.4)#1,078 |
| 21. | Fountain | 21.0% | 5.1%(+15.9)#21 | 4.9%(+16.1)#1,112 |
| 22. | Patterson Springs | 20.8% | 5.1%(+15.7)#22 | 4.9%(+15.9)#1,124 |
| 23. | Henrietta | 20.7% | 5.1%(+15.6)#23 | 4.9%(+15.8)#1,135 |
| 24. | Gerton | 20.4% | 5.1%(+15.3)#24 | 4.9%(+15.5)#1,158 |
| 25. | Forest Hills | 20.3% | 5.1%(+15.2)#25 | 4.9%(+15.4)#1,165 |
| 26. | Northchase | 20.1% | 5.1%(+15.0)#26 | 4.9%(+15.2)#1,179 |
| 27. | Bladenboro | 19.7% | 5.1%(+14.6)#27 | 4.9%(+14.8)#1,251 |
| 28. | Robbinsville | 19.6% | 5.1%(+14.5)#28 | 4.9%(+14.7)#1,267 |
| 29. | Maxton | 19.4% | 5.1%(+14.3)#29 | 4.9%(+14.5)#1,283 |
| 30. | Bennett | 19.4% | 5.1%(+14.3)#30 | 4.9%(+14.5)#1,292 |
| 31. | Shannon | 19.2% | 5.1%(+14.1)#31 | 4.9%(+14.3)#1,318 |
| 32. | Autryville | 19.2% | 5.1%(+14.1)#32 | 4.9%(+14.3)#1,320 |
| 33. | Elizabethtown | 19.1% | 5.1%(+14.0)#33 | 4.9%(+14.2)#1,326 |
| 34. | South Weldon | 19.0% | 5.1%(+13.9)#34 | 4.9%(+14.1)#1,337 |
| 35. | Casar | 19.0% | 5.1%(+13.9)#35 | 4.9%(+14.1)#1,339 |
| 36. | Middleburg | 18.8% | 5.1%(+13.7)#36 | 4.9%(+13.9)#1,381 |
| 37. | Long Creek | 18.5% | 5.1%(+13.4)#37 | 4.9%(+13.6)#1,422 |
| 38. | Wade | 18.4% | 5.1%(+13.3)#38 | 4.9%(+13.5)#1,430 |
| 39. | Cullowhee | 18.2% | 5.1%(+13.1)#39 | 4.9%(+13.3)#1,448 |
| 40. | Mooresboro | 17.9% | 5.1%(+12.8)#40 | 4.9%(+13.0)#1,510 |
| 41. | Benson | 17.7% | 5.1%(+12.6)#41 | 4.9%(+12.8)#1,531 |
| 42. | Roper | 17.6% | 5.1%(+12.5)#42 | 4.9%(+12.7)#1,548 |
| 43. | Hoffman | 17.4% | 5.1%(+12.3)#43 | 4.9%(+12.5)#1,578 |
| 44. | Magnolia | 17.0% | 5.1%(+11.9)#44 | 4.9%(+12.1)#1,643 |
| 45. | Whiteville | 16.9% | 5.1%(+11.8)#45 | 4.9%(+12.0)#1,660 |
| 46. | Bakersville | 16.8% | 5.1%(+11.7)#46 | 4.9%(+11.9)#1,696 |
| 47. | Marshallberg | 16.8% | 5.1%(+11.7)#47 | 4.9%(+11.9)#1,702 |
| 48. | Conway | 16.7% | 5.1%(+11.6)#48 | 4.9%(+11.8)#1,713 |
| 49. | Sylva | 16.4% | 5.1%(+11.3)#49 | 4.9%(+11.5)#1,786 |
| 50. | Haw River | 16.2% | 5.1%(+11.1)#50 | 4.9%(+11.3)#1,818 |
| 51. | Chadbourn | 16.2% | 5.1%(+11.1)#51 | 4.9%(+11.3)#1,820 |
| 52. | Severn | 16.2% | 5.1%(+11.1)#52 | 4.9%(+11.3)#1,832 |
| 53. | Red Springs | 16.1% | 5.1%(+11.0)#53 | 4.9%(+11.2)#1,838 |
| 54. | Seaboard | 16.0% | 5.1%(+10.9)#54 | 4.9%(+11.1)#1,864 |
| 55. | Woodland | 15.8% | 5.1%(+10.7)#55 | 4.9%(+10.9)#1,906 |
| 56. | Bolton | 15.8% | 5.1%(+10.7)#56 | 4.9%(+10.9)#1,907 |
| 57. | Falcon | 15.8% | 5.1%(+10.7)#57 | 4.9%(+10.9)#1,914 |
| 58. | Enfield | 15.5% | 5.1%(+10.4)#58 | 4.9%(+10.6)#1,974 |
| 59. | Sneads Ferry | 15.4% | 5.1%(+10.3)#59 | 4.9%(+10.5)#1,992 |
| 60. | Whitakers | 15.4% | 5.1%(+10.3)#60 | 4.9%(+10.5)#2,006 |
| 61. | South Henderson | 15.3% | 5.1%(+10.2)#61 | 4.9%(+10.4)#2,028 |
| 62. | Norman | 15.0% | 5.1%(+9.90)#62 | 4.9%(+10.1)#2,102 |
| 63. | Avon | 14.8% | 5.1%(+9.70)#63 | 4.9%(+9.90)#2,161 |
| 64. | Smithfield | 14.7% | 5.1%(+9.60)#64 | 4.9%(+9.80)#2,171 |
| 65. | Nebo | 14.7% | 5.1%(+9.60)#65 | 4.9%(+9.80)#2,180 |
| 66. | Fairplains | 14.6% | 5.1%(+9.50)#66 | 4.9%(+9.70)#2,208 |
| 67. | East Laurinburg | 14.3% | 5.1%(+9.20)#67 | 4.9%(+9.40)#2,274 |
| 68. | Tarboro | 14.2% | 5.1%(+9.10)#68 | 4.9%(+9.30)#2,304 |
| 69. | Burnsville | 14.0% | 5.1%(+8.90)#69 | 4.9%(+9.10)#2,356 |
| 70. | Ayden | 13.8% | 5.1%(+8.70)#70 | 4.9%(+8.90)#2,417 |
| 71. | Gibson | 13.7% | 5.1%(+8.60)#71 | 4.9%(+8.80)#2,459 |
| 72. | Clarkton | 13.6% | 5.1%(+8.50)#72 | 4.9%(+8.70)#2,486 |
| 73. | Ahoskie | 13.5% | 5.1%(+8.40)#73 | 4.9%(+8.60)#2,509 |
| 74. | Garysburg | 13.3% | 5.1%(+8.20)#74 | 4.9%(+8.40)#2,592 |
| 75. | Lawndale | 13.3% | 5.1%(+8.20)#75 | 4.9%(+8.40)#2,595 |
| 76. | Kingstown | 13.2% | 5.1%(+8.10)#76 | 4.9%(+8.30)#2,641 |
| 77. | Raeford | 13.1% | 5.1%(+8.00)#77 | 4.9%(+8.20)#2,657 |
| 78. | Spruce Pine | 13.1% | 5.1%(+8.00)#78 | 4.9%(+8.20)#2,663 |
| 79. | Grover | 13.1% | 5.1%(+8.00)#79 | 4.9%(+8.20)#2,677 |
| 80. | Windsor | 13.0% | 5.1%(+7.90)#80 | 4.9%(+8.10)#2,697 |
| 81. | Stantonsburg | 13.0% | 5.1%(+7.90)#81 | 4.9%(+8.10)#2,711 |
| 82. | Troy | 12.9% | 5.1%(+7.80)#82 | 4.9%(+8.00)#2,743 |
| 83. | Brunswick | 12.9% | 5.1%(+7.80)#83 | 4.9%(+8.00)#2,754 |
| 84. | Rich Square | 12.9% | 5.1%(+7.80)#84 | 4.9%(+8.00)#2,760 |
| 85. | Spring Hope | 12.8% | 5.1%(+7.70)#85 | 4.9%(+7.90)#2,789 |
| 86. | Warrenton | 12.7% | 5.1%(+7.60)#86 | 4.9%(+7.80)#2,830 |
| 87. | Raemon | 12.6% | 5.1%(+7.50)#87 | 4.9%(+7.70)#2,875 |
| 88. | Coinjock | 12.5% | 5.1%(+7.40)#88 | 4.9%(+7.60)#2,925 |
| 89. | Kelly | 12.4% | 5.1%(+7.30)#89 | 4.9%(+7.50)#2,989 |
| 90. | Jonesville | 12.3% | 5.1%(+7.20)#90 | 4.9%(+7.40)#3,014 |
| 91. | Gaston | 12.3% | 5.1%(+7.20)#91 | 4.9%(+7.40)#3,026 |
| 92. | Rowland | 12.2% | 5.1%(+7.10)#92 | 4.9%(+7.30)#3,065 |
| 93. | East Rockingham | 12.1% | 5.1%(+7.00)#93 | 4.9%(+7.20)#3,103 |
| 94. | Edneyville | 12.1% | 5.1%(+7.00)#94 | 4.9%(+7.20)#3,108 |
| 95. | Williamston | 12.0% | 5.1%(+6.90)#95 | 4.9%(+7.10)#3,149 |
| 96. | Kings Mountain | 11.8% | 5.1%(+6.70)#96 | 4.9%(+6.90)#3,266 |
| 97. | Riegelwood | 11.7% | 5.1%(+6.60)#97 | 4.9%(+6.80)#3,342 |
| 98. | Lumberton | 11.4% | 5.1%(+6.30)#98 | 4.9%(+6.50)#3,471 |
| 99. | Laurinburg | 11.4% | 5.1%(+6.30)#99 | 4.9%(+6.50)#3,474 |
| 100. | Farmville | 11.4% | 5.1%(+6.30)#100 | 4.9%(+6.50)#3,480 |
Common Questions
What are the Top 10 Cities with the Highest Percentage of Households with Income Below $10,000 in North Carolina?
Top 10 Cities with the Highest Percentage of Households with Income Below $10,000 in North Carolina are:
#1
48.9%
#2
45.7%
#3
38.7%
#4
33.3%
#5
30.9%
#6
30.8%
#7
30.3%
#8
28.6%
#9
28.2%
#10
27.2%
What city has the Highest Percentage of Households with Income Below $10,000 in North Carolina?
Light Oak has the Highest Percentage of Households with Income Below $10,000 in North Carolina with 48.9%.
What is the Percentage of Households with Income Below $10,000 in the State of North Carolina?
Percentage of Households with Income Below $10,000 in North Carolina is 5.1%.
What is the Percentage of Households with Income Below $10,000 in the United States?
Percentage of Households with Income Below $10,000 in the United States is 4.9%.