Cities with the Highest Percentage of Households with Income Below $10,000 in North Dakota
RELATED REPORTS & OPTIONS
Household Income | $0-10k
North Dakota
Compare Cities
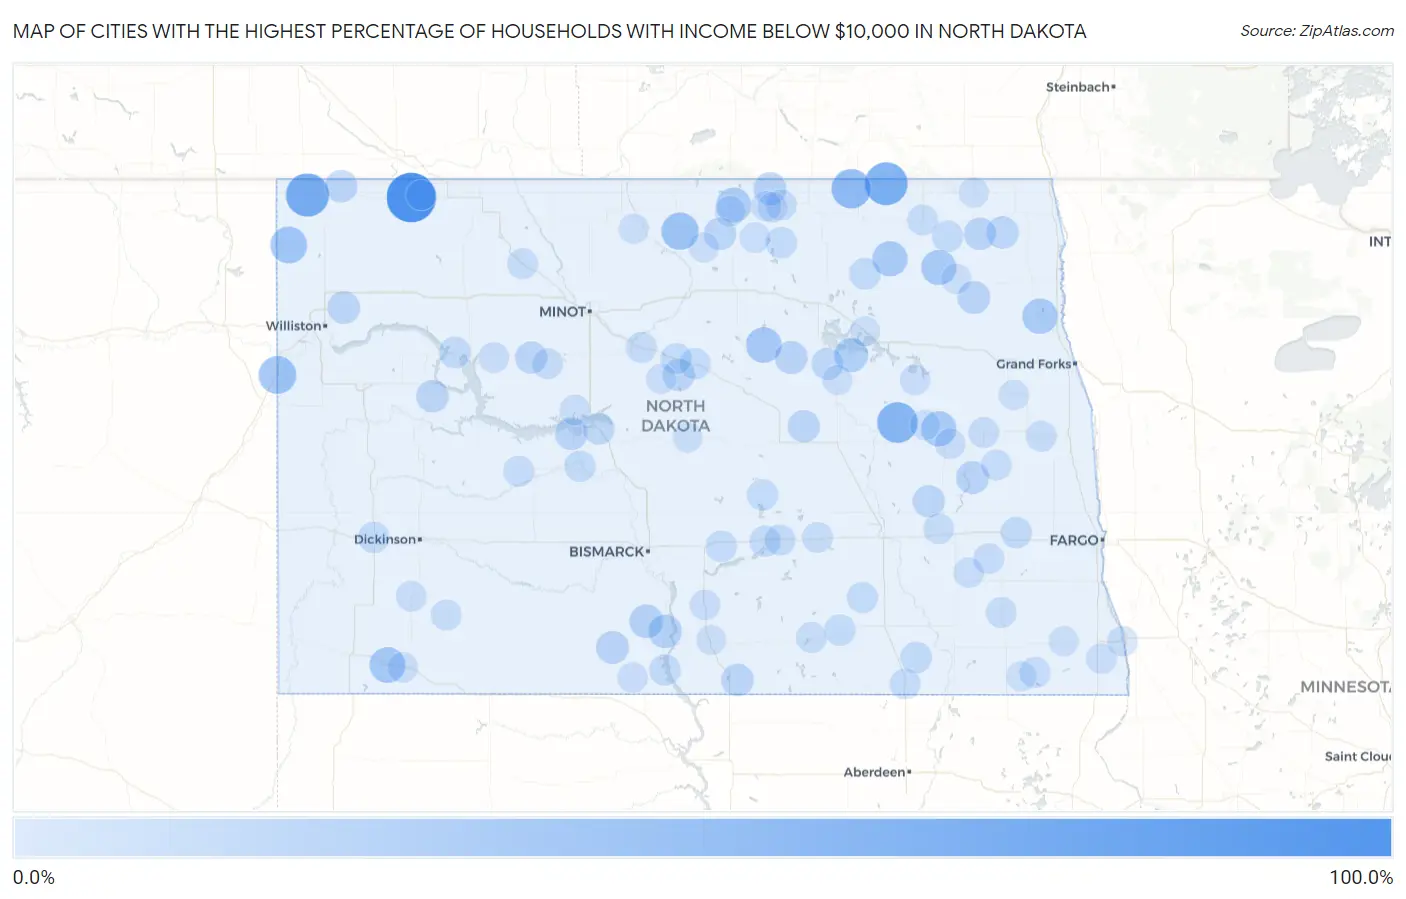
Map of Cities with the Highest Percentage of Households with Income Below $10,000 in North Dakota
0.0%
100.0%
Cities with the Highest Percentage of Households with Income Below $10,000 in North Dakota
| City | Households with Income < $10k | vs State | vs National | |
| 1. | Larson | 100.0% | 4.6%(+95.4)#1 | 4.9%(+95.1)#37 |
| 2. | Fortuna | 68.4% | 4.6%(+63.8)#2 | 4.9%(+63.5)#75 |
| 3. | Hannah | 66.7% | 4.6%(+62.1)#3 | 4.9%(+61.8)#81 |
| 4. | Mchenry | 56.3% | 4.6%(+51.7)#4 | 4.9%(+51.4)#123 |
| 5. | Sarles | 50.0% | 4.6%(+45.4)#5 | 4.9%(+45.1)#174 |
| 6. | East Fairview | 42.0% | 4.6%(+37.4)#6 | 4.9%(+37.1)#264 |
| 7. | Gardena | 40.0% | 4.6%(+35.4)#7 | 4.9%(+35.1)#298 |
| 8. | Grenora | 37.8% | 4.6%(+33.2)#8 | 4.9%(+32.9)#335 |
| 9. | Gascoyne | 33.3% | 4.6%(+28.7)#9 | 4.9%(+28.4)#457 |
| 10. | Esmond | 32.4% | 4.6%(+27.8)#10 | 4.9%(+27.5)#475 |
| 11. | Jessie | 30.8% | 4.6%(+26.2)#11 | 4.9%(+25.9)#521 |
| 12. | Ardoch | 30.8% | 4.6%(+26.2)#12 | 4.9%(+25.9)#523 |
| 13. | Hampden | 30.0% | 4.6%(+25.4)#13 | 4.9%(+25.1)#553 |
| 14. | Fairdale | 30.0% | 4.6%(+25.4)#14 | 4.9%(+25.1)#554 |
| 15. | East Dunseith | 29.1% | 4.6%(+24.5)#15 | 4.9%(+24.2)#591 |
| 16. | Fort Totten | 24.8% | 4.6%(+20.2)#16 | 4.9%(+19.9)#812 |
| 17. | Solen | 23.1% | 4.6%(+18.5)#17 | 4.9%(+18.2)#933 |
| 18. | Cannon Ball | 23.0% | 4.6%(+18.4)#18 | 4.9%(+18.1)#938 |
| 19. | St John | 20.3% | 4.6%(+15.7)#19 | 4.9%(+15.4)#1,166 |
| 20. | Porcupine | 20.0% | 4.6%(+15.4)#20 | 4.9%(+15.1)#1,209 |
| 21. | Luverne | 20.0% | 4.6%(+15.4)#21 | 4.9%(+15.1)#1,219 |
| 22. | Lankin | 19.7% | 4.6%(+15.1)#22 | 4.9%(+14.8)#1,261 |
| 23. | Maddock | 19.5% | 4.6%(+14.9)#23 | 4.9%(+14.6)#1,281 |
| 24. | Hague | 18.6% | 4.6%(+14.0)#24 | 4.9%(+13.7)#1,412 |
| 25. | Mandaree | 18.2% | 4.6%(+13.6)#25 | 4.9%(+13.3)#1,457 |
| 26. | Springbrook | 18.2% | 4.6%(+13.6)#26 | 4.9%(+13.3)#1,470 |
| 27. | Overly | 18.2% | 4.6%(+13.6)#27 | 4.9%(+13.3)#1,472 |
| 28. | Pick City | 17.6% | 4.6%(+13.0)#28 | 4.9%(+12.7)#1,552 |
| 29. | Canton City Hensel | 17.6% | 4.6%(+13.0)#29 | 4.9%(+12.7)#1,555 |
| 30. | Ambrose | 17.6% | 4.6%(+13.0)#30 | 4.9%(+12.7)#1,556 |
| 31. | Mountain | 16.7% | 4.6%(+12.1)#31 | 4.9%(+11.8)#1,727 |
| 32. | Makoti | 16.7% | 4.6%(+12.1)#32 | 4.9%(+11.8)#1,732 |
| 33. | Cathay | 16.7% | 4.6%(+12.1)#33 | 4.9%(+11.8)#1,746 |
| 34. | Kief | 16.7% | 4.6%(+12.1)#34 | 4.9%(+11.8)#1,749 |
| 35. | Leal | 16.7% | 4.6%(+12.1)#35 | 4.9%(+11.8)#1,752 |
| 36. | Oberon | 15.8% | 4.6%(+11.2)#36 | 4.9%(+10.9)#1,916 |
| 37. | Coleharbor | 14.9% | 4.6%(+10.3)#37 | 4.9%(+10.00)#2,138 |
| 38. | Starkweather | 14.3% | 4.6%(+9.70)#38 | 4.9%(+9.40)#2,300 |
| 39. | New Town | 14.2% | 4.6%(+9.60)#39 | 4.9%(+9.30)#2,305 |
| 40. | Fullerton | 13.5% | 4.6%(+8.90)#40 | 4.9%(+8.60)#2,533 |
| 41. | Buffalo | 13.2% | 4.6%(+8.60)#41 | 4.9%(+8.30)#2,648 |
| 42. | Drake | 12.8% | 4.6%(+8.20)#42 | 4.9%(+7.90)#2,805 |
| 43. | Fort Yates | 12.8% | 4.6%(+8.20)#43 | 4.9%(+7.90)#2,808 |
| 44. | Driscoll | 12.5% | 4.6%(+7.90)#44 | 4.9%(+7.60)#2,947 |
| 45. | Fredonia | 12.5% | 4.6%(+7.90)#45 | 4.9%(+7.60)#2,951 |
| 46. | Balfour | 12.5% | 4.6%(+7.90)#46 | 4.9%(+7.60)#2,952 |
| 47. | Mylo | 12.5% | 4.6%(+7.90)#47 | 4.9%(+7.60)#2,953 |
| 48. | Osnabrock | 12.4% | 4.6%(+7.80)#48 | 4.9%(+7.50)#3,000 |
| 49. | Stanton | 12.1% | 4.6%(+7.50)#49 | 4.9%(+7.20)#3,133 |
| 50. | Jud | 12.0% | 4.6%(+7.40)#50 | 4.9%(+7.10)#3,196 |
| 51. | Robinson | 12.0% | 4.6%(+7.40)#51 | 4.9%(+7.10)#3,197 |
| 52. | Belfield | 11.9% | 4.6%(+7.30)#52 | 4.9%(+7.00)#3,233 |
| 53. | Dawson | 11.9% | 4.6%(+7.30)#53 | 4.9%(+7.00)#3,258 |
| 54. | Tappen | 11.3% | 4.6%(+6.70)#54 | 4.9%(+6.40)#3,594 |
| 55. | Zap | 11.1% | 4.6%(+6.50)#55 | 4.9%(+6.20)#3,676 |
| 56. | Fingal | 11.1% | 4.6%(+6.50)#56 | 4.9%(+6.20)#3,680 |
| 57. | Voltaire | 11.1% | 4.6%(+6.50)#57 | 4.9%(+6.20)#3,695 |
| 58. | Cayuga | 11.1% | 4.6%(+6.50)#58 | 4.9%(+6.20)#3,696 |
| 59. | Rolla | 10.5% | 4.6%(+5.90)#59 | 4.9%(+5.60)#4,048 |
| 60. | Ellendale | 10.5% | 4.6%(+5.90)#60 | 4.9%(+5.60)#4,051 |
| 61. | Finley | 10.5% | 4.6%(+5.90)#61 | 4.9%(+5.60)#4,077 |
| 62. | Medina | 10.3% | 4.6%(+5.70)#62 | 4.9%(+5.40)#4,210 |
| 63. | Donnybrook | 10.3% | 4.6%(+5.70)#63 | 4.9%(+5.40)#4,229 |
| 64. | Mayville | 10.2% | 4.6%(+5.60)#64 | 4.9%(+5.30)#4,263 |
| 65. | Langdon | 10.2% | 4.6%(+5.60)#65 | 4.9%(+5.30)#4,267 |
| 66. | Hope | 10.1% | 4.6%(+5.50)#66 | 4.9%(+5.20)#4,358 |
| 67. | Lehr | 10.0% | 4.6%(+5.40)#67 | 4.9%(+5.10)#4,422 |
| 68. | Regent | 9.9% | 4.6%(+5.30)#68 | 4.9%(+5.00)#4,508 |
| 69. | Lisbon | 9.8% | 4.6%(+5.20)#69 | 4.9%(+4.90)#4,541 |
| 70. | Sanborn | 9.8% | 4.6%(+5.20)#70 | 4.9%(+4.90)#4,589 |
| 71. | Ryder | 9.8% | 4.6%(+5.20)#71 | 4.9%(+4.90)#4,591 |
| 72. | New England | 9.7% | 4.6%(+5.10)#72 | 4.9%(+4.80)#4,642 |
| 73. | Parshall | 9.6% | 4.6%(+5.00)#73 | 4.9%(+4.70)#4,707 |
| 74. | Rolette | 9.6% | 4.6%(+5.00)#74 | 4.9%(+4.70)#4,725 |
| 75. | Great Bend | 9.5% | 4.6%(+4.90)#75 | 4.9%(+4.60)#4,833 |
| 76. | Dunseith | 9.4% | 4.6%(+4.80)#76 | 4.9%(+4.50)#4,878 |
| 77. | Selfridge | 9.1% | 4.6%(+4.50)#77 | 4.9%(+4.20)#5,173 |
| 78. | Belcourt | 8.9% | 4.6%(+4.30)#78 | 4.9%(+4.00)#5,359 |
| 79. | Garrison | 8.9% | 4.6%(+4.30)#79 | 4.9%(+4.00)#5,365 |
| 80. | Cooperstown | 8.8% | 4.6%(+4.20)#80 | 4.9%(+3.90)#5,487 |
| 81. | Reeder | 8.7% | 4.6%(+4.10)#81 | 4.9%(+3.80)#5,641 |
| 82. | Wahpeton | 8.6% | 4.6%(+4.00)#82 | 4.9%(+3.70)#5,659 |
| 83. | Hazelton | 8.5% | 4.6%(+3.90)#83 | 4.9%(+3.60)#5,859 |
| 84. | Tolna | 8.3% | 4.6%(+3.70)#84 | 4.9%(+3.40)#6,084 |
| 85. | Kathryn | 8.3% | 4.6%(+3.70)#85 | 4.9%(+3.40)#6,092 |
| 86. | Northwood | 8.1% | 4.6%(+3.50)#86 | 4.9%(+3.20)#6,276 |
| 87. | Green Acres | 8.1% | 4.6%(+3.50)#87 | 4.9%(+3.20)#6,284 |
| 88. | Butte | 8.1% | 4.6%(+3.50)#88 | 4.9%(+3.20)#6,318 |
| 89. | Adams | 8.0% | 4.6%(+3.40)#89 | 4.9%(+3.10)#6,430 |
| 90. | Newburg | 7.9% | 4.6%(+3.30)#90 | 4.9%(+3.00)#6,581 |
| 91. | Binford | 7.8% | 4.6%(+3.20)#91 | 4.9%(+2.90)#6,688 |
| 92. | Willow City | 7.8% | 4.6%(+3.20)#92 | 4.9%(+2.90)#6,697 |
| 93. | Sheyenne | 7.7% | 4.6%(+3.10)#93 | 4.9%(+2.80)#6,810 |
| 94. | Rutland | 7.7% | 4.6%(+3.10)#94 | 4.9%(+2.80)#6,832 |
| 95. | Columbus | 7.7% | 4.6%(+3.10)#95 | 4.9%(+2.80)#6,836 |
| 96. | Linton | 7.6% | 4.6%(+3.00)#96 | 4.9%(+2.70)#6,942 |
| 97. | Devils Lake | 7.5% | 4.6%(+2.90)#97 | 4.9%(+2.60)#7,026 |
| 98. | Walhalla | 7.4% | 4.6%(+2.80)#98 | 4.9%(+2.50)#7,237 |
| 99. | Wyndmere | 7.4% | 4.6%(+2.80)#99 | 4.9%(+2.50)#7,250 |
| 100. | Mcclusky | 7.4% | 4.6%(+2.80)#100 | 4.9%(+2.50)#7,262 |
Common Questions
What are the Top 10 Cities with the Highest Percentage of Households with Income Below $10,000 in North Dakota?
Top 10 Cities with the Highest Percentage of Households with Income Below $10,000 in North Dakota are:
What city has the Highest Percentage of Households with Income Below $10,000 in North Dakota?
Larson has the Highest Percentage of Households with Income Below $10,000 in North Dakota with 100.0%.
What is the Percentage of Households with Income Below $10,000 in the State of North Dakota?
Percentage of Households with Income Below $10,000 in North Dakota is 4.6%.
What is the Percentage of Households with Income Below $10,000 in the United States?
Percentage of Households with Income Below $10,000 in the United States is 4.9%.