Cities with the Highest Percentage of Households with Income Below $10,000 in West Virginia
RELATED REPORTS & OPTIONS
Household Income | $0-10k
West Virginia
Compare Cities
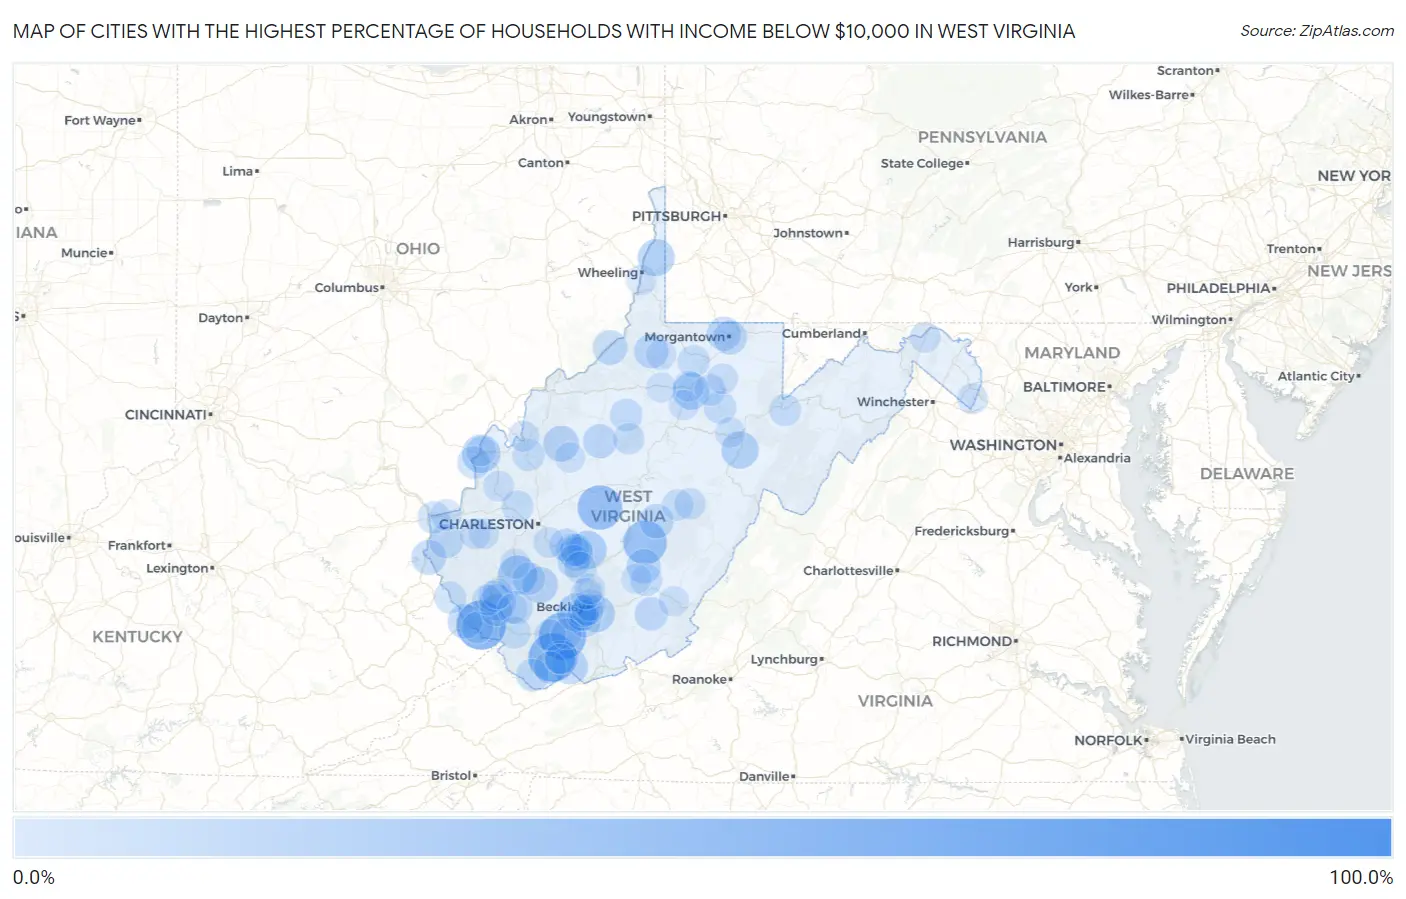
Map of Cities with the Highest Percentage of Households with Income Below $10,000 in West Virginia
0.0%
100.0%
Cities with the Highest Percentage of Households with Income Below $10,000 in West Virginia
| City | Households with Income < $10k | vs State | vs National | |
| 1. | Osage | 100.0% | 6.5%(+93.5)#1 | 4.9%(+95.1)#14 |
| 2. | Baxter | 75.6% | 6.5%(+69.1)#2 | 4.9%(+70.7)#58 |
| 3. | Red Jacket | 57.4% | 6.5%(+50.9)#3 | 4.9%(+52.5)#118 |
| 4. | Dorothy | 55.8% | 6.5%(+49.3)#4 | 4.9%(+50.9)#126 |
| 5. | Kimball | 54.5% | 6.5%(+48.0)#5 | 4.9%(+49.6)#133 |
| 6. | Itmann | 52.3% | 6.5%(+45.8)#6 | 4.9%(+47.4)#144 |
| 7. | Clay | 45.0% | 6.5%(+38.5)#7 | 4.9%(+40.1)#224 |
| 8. | Nettie | 42.9% | 6.5%(+36.4)#8 | 4.9%(+38.0)#254 |
| 9. | Dupont | 32.9% | 6.5%(+26.4)#9 | 4.9%(+28.0)#465 |
| 10. | Greenview | 31.9% | 6.5%(+25.4)#10 | 4.9%(+27.0)#495 |
| 11. | Lester | 29.6% | 6.5%(+23.1)#11 | 4.9%(+24.7)#572 |
| 12. | West Dunbar | 29.5% | 6.5%(+23.0)#12 | 4.9%(+24.6)#578 |
| 13. | Henderson | 29.3% | 6.5%(+22.8)#13 | 4.9%(+24.4)#585 |
| 14. | Gauley Bridge | 28.8% | 6.5%(+22.3)#14 | 4.9%(+23.9)#605 |
| 15. | Beverly | 26.4% | 6.5%(+19.9)#15 | 4.9%(+21.5)#717 |
| 16. | West Liberty | 26.0% | 6.5%(+19.5)#16 | 4.9%(+21.1)#735 |
| 17. | Daniels | 26.0% | 6.5%(+19.5)#17 | 4.9%(+21.1)#736 |
| 18. | Anmoore | 26.0% | 6.5%(+19.5)#18 | 4.9%(+21.1)#737 |
| 19. | Rossmore | 24.2% | 6.5%(+17.7)#19 | 4.9%(+19.3)#849 |
| 20. | Reedy | 23.3% | 6.5%(+16.8)#20 | 4.9%(+18.4)#909 |
| 21. | Maybeury | 23.1% | 6.5%(+16.6)#21 | 4.9%(+18.2)#927 |
| 22. | Twilight | 23.1% | 6.5%(+16.6)#22 | 4.9%(+18.2)#930 |
| 23. | Fort Gay | 20.5% | 6.5%(+14.0)#23 | 4.9%(+15.6)#1,149 |
| 24. | Sistersville | 20.4% | 6.5%(+13.9)#24 | 4.9%(+15.5)#1,154 |
| 25. | Williamson | 20.3% | 6.5%(+13.8)#25 | 4.9%(+15.4)#1,162 |
| 26. | Camden On Gauley | 19.6% | 6.5%(+13.1)#26 | 4.9%(+14.7)#1,271 |
| 27. | Jacksonburg | 19.4% | 6.5%(+12.9)#27 | 4.9%(+14.5)#1,296 |
| 28. | Quinwood | 19.3% | 6.5%(+12.8)#28 | 4.9%(+14.4)#1,306 |
| 29. | Northfork | 19.0% | 6.5%(+12.5)#29 | 4.9%(+14.1)#1,338 |
| 30. | Granville | 18.9% | 6.5%(+12.4)#30 | 4.9%(+14.0)#1,358 |
| 31. | Morgantown | 18.8% | 6.5%(+12.3)#31 | 4.9%(+13.9)#1,369 |
| 32. | Wayne | 18.7% | 6.5%(+12.2)#32 | 4.9%(+13.8)#1,395 |
| 33. | Grantsville | 18.6% | 6.5%(+12.1)#33 | 4.9%(+13.7)#1,409 |
| 34. | Kimberly | 18.5% | 6.5%(+12.0)#34 | 4.9%(+13.6)#1,419 |
| 35. | Cottageville | 17.5% | 6.5%(+11.0)#35 | 4.9%(+12.6)#1,569 |
| 36. | Accoville | 17.1% | 6.5%(+10.6)#36 | 4.9%(+12.2)#1,625 |
| 37. | Alderson | 17.0% | 6.5%(+10.5)#37 | 4.9%(+12.1)#1,642 |
| 38. | Crooked Creek | 16.9% | 6.5%(+10.4)#38 | 4.9%(+12.0)#1,674 |
| 39. | Montgomery | 16.8% | 6.5%(+10.3)#39 | 4.9%(+11.9)#1,689 |
| 40. | Pratt | 16.6% | 6.5%(+10.1)#40 | 4.9%(+11.7)#1,760 |
| 41. | Justice Addition | 16.5% | 6.5%(+10.00)#41 | 4.9%(+11.6)#1,779 |
| 42. | Gallipolis Ferry | 15.7% | 6.5%(+9.20)#42 | 4.9%(+10.8)#1,934 |
| 43. | Van | 15.6% | 6.5%(+9.10)#43 | 4.9%(+10.7)#1,958 |
| 44. | Philippi | 15.5% | 6.5%(+9.00)#44 | 4.9%(+10.6)#1,972 |
| 45. | War | 15.4% | 6.5%(+8.90)#45 | 4.9%(+10.5)#2,005 |
| 46. | Powellton | 15.3% | 6.5%(+8.80)#46 | 4.9%(+10.4)#2,033 |
| 47. | Smithers | 15.0% | 6.5%(+8.50)#47 | 4.9%(+10.1)#2,093 |
| 48. | Auburn | 15.0% | 6.5%(+8.50)#48 | 4.9%(+10.1)#2,107 |
| 49. | Omar | 14.6% | 6.5%(+8.10)#49 | 4.9%(+9.70)#2,217 |
| 50. | Gary | 14.5% | 6.5%(+8.00)#50 | 4.9%(+9.60)#2,234 |
| 51. | Ceredo | 14.3% | 6.5%(+7.80)#51 | 4.9%(+9.40)#2,268 |
| 52. | Worthington | 14.3% | 6.5%(+7.80)#52 | 4.9%(+9.40)#2,288 |
| 53. | Ripley | 14.0% | 6.5%(+7.50)#53 | 4.9%(+9.10)#2,352 |
| 54. | Kermit | 14.0% | 6.5%(+7.50)#54 | 4.9%(+9.10)#2,377 |
| 55. | Davis | 13.9% | 6.5%(+7.40)#55 | 4.9%(+9.00)#2,394 |
| 56. | Malden | 13.8% | 6.5%(+7.30)#56 | 4.9%(+8.90)#2,436 |
| 57. | Justice | 13.8% | 6.5%(+7.30)#57 | 4.9%(+8.90)#2,439 |
| 58. | Coal City | 13.7% | 6.5%(+7.20)#58 | 4.9%(+8.80)#2,456 |
| 59. | Rupert | 13.6% | 6.5%(+7.10)#59 | 4.9%(+8.70)#2,483 |
| 60. | Sophia | 13.5% | 6.5%(+7.00)#60 | 4.9%(+8.60)#2,515 |
| 61. | Matewan | 13.4% | 6.5%(+6.90)#61 | 4.9%(+8.50)#2,553 |
| 62. | Poca | 13.3% | 6.5%(+6.80)#62 | 4.9%(+8.40)#2,582 |
| 63. | Page | 13.3% | 6.5%(+6.80)#63 | 4.9%(+8.40)#2,608 |
| 64. | Crab Orchard | 13.0% | 6.5%(+6.50)#64 | 4.9%(+8.10)#2,702 |
| 65. | Beckley | 12.9% | 6.5%(+6.40)#65 | 4.9%(+8.00)#2,733 |
| 66. | Newark | 12.6% | 6.5%(+6.10)#66 | 4.9%(+7.70)#2,872 |
| 67. | Macarthur | 12.5% | 6.5%(+6.00)#67 | 4.9%(+7.60)#2,910 |
| 68. | Flemington | 12.5% | 6.5%(+6.00)#68 | 4.9%(+7.60)#2,927 |
| 69. | Bradley | 12.4% | 6.5%(+5.90)#69 | 4.9%(+7.50)#2,972 |
| 70. | Glenville | 12.4% | 6.5%(+5.90)#70 | 4.9%(+7.50)#2,977 |
| 71. | Pineville | 12.3% | 6.5%(+5.80)#71 | 4.9%(+7.40)#3,031 |
| 72. | Huntington | 12.2% | 6.5%(+5.70)#72 | 4.9%(+7.30)#3,042 |
| 73. | Addison Webster Springs | 12.2% | 6.5%(+5.70)#73 | 4.9%(+7.30)#3,066 |
| 74. | Bergoo | 12.2% | 6.5%(+5.70)#74 | 4.9%(+7.30)#3,092 |
| 75. | Mount Gay Shamrock | 11.6% | 6.5%(+5.10)#75 | 4.9%(+6.70)#3,386 |
| 76. | Despard | 11.4% | 6.5%(+4.90)#76 | 4.9%(+6.50)#3,503 |
| 77. | Ravenswood | 11.3% | 6.5%(+4.80)#77 | 4.9%(+6.40)#3,553 |
| 78. | Mullens | 11.2% | 6.5%(+4.70)#78 | 4.9%(+6.30)#3,615 |
| 79. | West Hamlin | 11.2% | 6.5%(+4.70)#79 | 4.9%(+6.30)#3,626 |
| 80. | Shannondale | 11.0% | 6.5%(+4.50)#80 | 4.9%(+6.10)#3,718 |
| 81. | Mount Hope | 11.0% | 6.5%(+4.50)#81 | 4.9%(+6.10)#3,730 |
| 82. | Holden | 10.7% | 6.5%(+4.20)#82 | 4.9%(+5.80)#3,943 |
| 83. | Buffalo | 10.6% | 6.5%(+4.10)#83 | 4.9%(+5.70)#4,000 |
| 84. | Chesapeake | 10.4% | 6.5%(+3.90)#84 | 4.9%(+5.50)#4,108 |
| 85. | Bath Berkeley Springs | 10.4% | 6.5%(+3.90)#85 | 4.9%(+5.50)#4,115 |
| 86. | Grafton | 10.3% | 6.5%(+3.80)#86 | 4.9%(+5.40)#4,153 |
| 87. | West Logan | 10.2% | 6.5%(+3.70)#87 | 4.9%(+5.30)#4,288 |
| 88. | Benwood | 9.9% | 6.5%(+3.40)#88 | 4.9%(+5.00)#4,467 |
| 89. | Lost Creek | 9.9% | 6.5%(+3.40)#89 | 4.9%(+5.00)#4,491 |
| 90. | Junior | 9.9% | 6.5%(+3.40)#90 | 4.9%(+5.00)#4,492 |
| 91. | Lewisburg | 9.8% | 6.5%(+3.30)#91 | 4.9%(+4.90)#4,528 |
| 92. | Salem | 9.8% | 6.5%(+3.30)#92 | 4.9%(+4.90)#4,544 |
| 93. | Rainelle | 9.8% | 6.5%(+3.30)#93 | 4.9%(+4.90)#4,550 |
| 94. | Hamlin | 9.7% | 6.5%(+3.20)#94 | 4.9%(+4.80)#4,632 |
| 95. | Kistler | 9.6% | 6.5%(+3.10)#95 | 4.9%(+4.70)#4,732 |
| 96. | Keystone | 9.5% | 6.5%(+3.00)#96 | 4.9%(+4.60)#4,827 |
| 97. | Smithfield | 9.4% | 6.5%(+2.90)#97 | 4.9%(+4.50)#4,910 |
| 98. | Spencer | 9.3% | 6.5%(+2.80)#98 | 4.9%(+4.40)#4,946 |
| 99. | Danville | 9.3% | 6.5%(+2.80)#99 | 4.9%(+4.40)#4,976 |
| 100. | Point Pleasant | 9.2% | 6.5%(+2.70)#100 | 4.9%(+4.30)#5,026 |
Common Questions
What are the Top 10 Cities with the Highest Percentage of Households with Income Below $10,000 in West Virginia?
Top 10 Cities with the Highest Percentage of Households with Income Below $10,000 in West Virginia are:
#1
57.4%
#2
54.5%
#3
52.3%
#4
45.0%
#5
42.9%
#6
31.9%
#7
29.6%
#8
29.3%
#9
28.8%
#10
26.4%
What city has the Highest Percentage of Households with Income Below $10,000 in West Virginia?
Red Jacket has the Highest Percentage of Households with Income Below $10,000 in West Virginia with 57.4%.
What is the Percentage of Households with Income Below $10,000 in the State of West Virginia?
Percentage of Households with Income Below $10,000 in West Virginia is 6.5%.
What is the Percentage of Households with Income Below $10,000 in the United States?
Percentage of Households with Income Below $10,000 in the United States is 4.9%.