Cities with the Highest Percentage of Households with Income Below $10,000 in California
RELATED REPORTS & OPTIONS
Household Income | $0-10k
California
Compare Cities
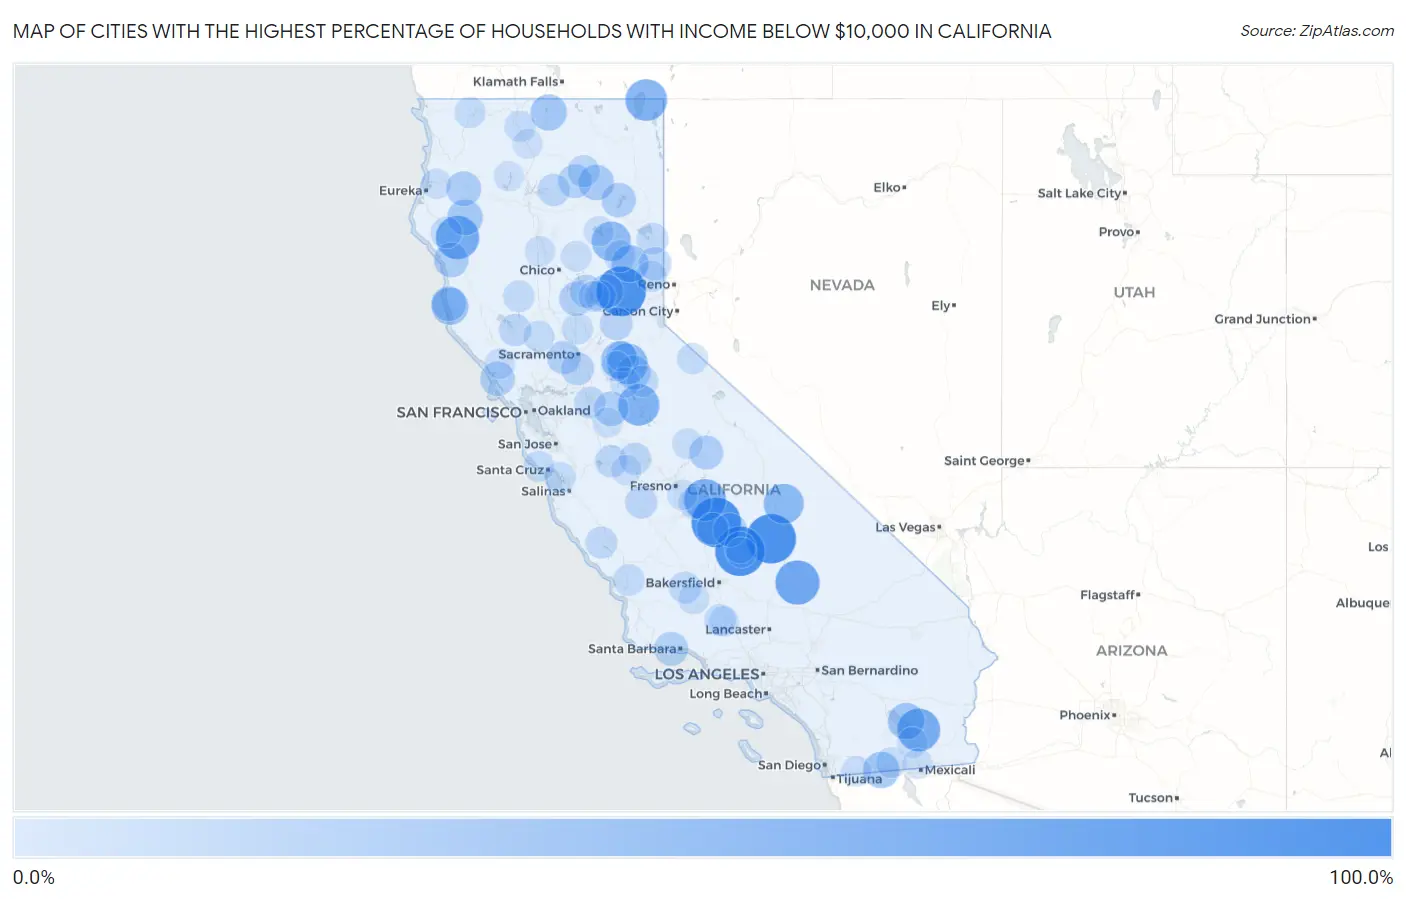
Map of Cities with the Highest Percentage of Households with Income Below $10,000 in California
0.0%
100.0%
Cities with the Highest Percentage of Households with Income Below $10,000 in California
| City | Households with Income < $10k | vs State | vs National | |
| 1. | Kennedy Meadows | 100.0% | 4.4%(+95.6)#1 | 4.9%(+95.1)#8 |
| 2. | El Rancho | 100.0% | 4.4%(+95.6)#2 | 4.9%(+95.1)#9 |
| 3. | Mcclenney Tract | 100.0% | 4.4%(+95.6)#3 | 4.9%(+95.1)#27 |
| 4. | Graniteville | 100.0% | 4.4%(+95.6)#4 | 4.9%(+95.1)#31 |
| 5. | Johannesburg | 76.0% | 4.4%(+71.6)#5 | 4.9%(+71.1)#55 |
| 6. | Alderpoint | 72.3% | 4.4%(+67.9)#6 | 4.9%(+67.4)#64 |
| 7. | Niland | 70.4% | 4.4%(+66.0)#7 | 4.9%(+65.5)#73 |
| 8. | East Orosi | 66.7% | 4.4%(+62.3)#8 | 4.9%(+61.8)#76 |
| 9. | New Pine Creek | 64.7% | 4.4%(+60.3)#9 | 4.9%(+59.8)#86 |
| 10. | Chinese Camp | 63.2% | 4.4%(+58.8)#10 | 4.9%(+58.3)#93 |
| 11. | Volcano | 59.0% | 4.4%(+54.6)#11 | 4.9%(+54.1)#109 |
| 12. | Keeler | 57.1% | 4.4%(+52.7)#12 | 4.9%(+52.2)#120 |
| 13. | Crescent Mills | 54.2% | 4.4%(+49.8)#13 | 4.9%(+49.3)#136 |
| 14. | Dales | 48.0% | 4.4%(+43.6)#14 | 4.9%(+43.1)#186 |
| 15. | Fiddletown | 47.8% | 4.4%(+43.4)#15 | 4.9%(+42.9)#189 |
| 16. | Mohawk Vista | 44.4% | 4.4%(+40.0)#16 | 4.9%(+39.5)#231 |
| 17. | Albion | 44.3% | 4.4%(+39.9)#17 | 4.9%(+39.4)#234 |
| 18. | Foresta | 44.2% | 4.4%(+39.8)#18 | 4.9%(+39.3)#239 |
| 19. | Bombay Beach | 43.2% | 4.4%(+38.8)#19 | 4.9%(+38.3)#249 |
| 20. | Jacumba | 41.4% | 4.4%(+37.0)#20 | 4.9%(+36.5)#273 |
| 21. | Macdoel | 41.2% | 4.4%(+36.8)#21 | 4.9%(+36.3)#278 |
| 22. | Mad River | 38.4% | 4.4%(+34.0)#22 | 4.9%(+33.5)#325 |
| 23. | Little Valley | 37.5% | 4.4%(+33.1)#23 | 4.9%(+32.6)#343 |
| 24. | Burnt Ranch | 35.2% | 4.4%(+30.8)#24 | 4.9%(+30.3)#396 |
| 25. | Little River | 34.7% | 4.4%(+30.3)#25 | 4.9%(+29.8)#410 |
| 26. | Leggett | 34.2% | 4.4%(+29.8)#26 | 4.9%(+29.3)#422 |
| 27. | Valley Home | 33.7% | 4.4%(+29.3)#27 | 4.9%(+28.8)#435 |
| 28. | Tomales | 33.3% | 4.4%(+28.9)#28 | 4.9%(+28.4)#444 |
| 29. | Rail Road Flat | 33.3% | 4.4%(+28.9)#29 | 4.9%(+28.4)#449 |
| 30. | Spaulding | 33.1% | 4.4%(+28.7)#30 | 4.9%(+28.2)#463 |
| 31. | Honcut | 32.3% | 4.4%(+27.9)#31 | 4.9%(+27.4)#478 |
| 32. | Pike | 32.1% | 4.4%(+27.7)#32 | 4.9%(+27.2)#487 |
| 33. | Big Creek | 31.4% | 4.4%(+27.0)#33 | 4.9%(+26.5)#501 |
| 34. | Isla Vista | 31.2% | 4.4%(+26.8)#34 | 4.9%(+26.3)#506 |
| 35. | Springville | 29.9% | 4.4%(+25.5)#35 | 4.9%(+25.0)#560 |
| 36. | Cassel | 29.9% | 4.4%(+25.5)#36 | 4.9%(+25.0)#561 |
| 37. | University Of California Davis | 29.5% | 4.4%(+25.1)#37 | 4.9%(+24.6)#575 |
| 38. | Rackerby | 27.8% | 4.4%(+23.4)#38 | 4.9%(+22.9)#653 |
| 39. | Hood | 27.5% | 4.4%(+23.1)#39 | 4.9%(+22.6)#664 |
| 40. | Kep'el | 27.3% | 4.4%(+22.9)#40 | 4.9%(+22.4)#675 |
| 41. | Chilcoot Vinton | 26.8% | 4.4%(+22.4)#41 | 4.9%(+21.9)#695 |
| 42. | Foresthill | 26.6% | 4.4%(+22.2)#42 | 4.9%(+21.7)#702 |
| 43. | Delft Colony | 25.3% | 4.4%(+20.9)#43 | 4.9%(+20.4)#768 |
| 44. | Salyer | 24.9% | 4.4%(+20.5)#44 | 4.9%(+20.0)#810 |
| 45. | Volta | 24.5% | 4.4%(+20.1)#45 | 4.9%(+19.6)#830 |
| 46. | Round Mountain | 24.2% | 4.4%(+19.8)#46 | 4.9%(+19.3)#848 |
| 47. | Lower Lake | 24.0% | 4.4%(+19.6)#47 | 4.9%(+19.1)#860 |
| 48. | La Grange | 23.9% | 4.4%(+19.5)#48 | 4.9%(+19.0)#869 |
| 49. | Mcarthur | 23.8% | 4.4%(+19.4)#49 | 4.9%(+18.9)#876 |
| 50. | Three Rocks | 23.8% | 4.4%(+19.4)#50 | 4.9%(+18.9)#879 |
| 51. | El Nido | 23.5% | 4.4%(+19.1)#51 | 4.9%(+18.6)#892 |
| 52. | Plainview | 23.1% | 4.4%(+18.7)#52 | 4.9%(+18.2)#923 |
| 53. | Lockwood | 22.6% | 4.4%(+18.2)#53 | 4.9%(+17.7)#966 |
| 54. | Patton Village | 22.5% | 4.4%(+18.1)#54 | 4.9%(+17.6)#971 |
| 55. | Mckittrick | 22.2% | 4.4%(+17.8)#55 | 4.9%(+17.3)#1,001 |
| 56. | Greenhorn | 21.6% | 4.4%(+17.2)#56 | 4.9%(+16.7)#1,049 |
| 57. | Taft Mosswood | 21.5% | 4.4%(+17.1)#57 | 4.9%(+16.6)#1,056 |
| 58. | North San Juan | 21.1% | 4.4%(+16.7)#58 | 4.9%(+16.2)#1,103 |
| 59. | Lake Of The Woods | 21.0% | 4.4%(+16.6)#59 | 4.9%(+16.1)#1,108 |
| 60. | Miranda | 21.0% | 4.4%(+16.6)#60 | 4.9%(+16.1)#1,110 |
| 61. | Garden Farms | 21.0% | 4.4%(+16.6)#61 | 4.9%(+16.1)#1,111 |
| 62. | Pine Flat | 20.6% | 4.4%(+16.2)#62 | 4.9%(+15.7)#1,143 |
| 63. | Avery | 20.5% | 4.4%(+16.1)#63 | 4.9%(+15.6)#1,150 |
| 64. | Stonyford | 20.5% | 4.4%(+16.1)#64 | 4.9%(+15.6)#1,152 |
| 65. | Knights Ferry | 20.0% | 4.4%(+15.6)#65 | 4.9%(+15.1)#1,214 |
| 66. | Grenada | 19.8% | 4.4%(+15.4)#66 | 4.9%(+14.9)#1,245 |
| 67. | Happy Camp | 19.7% | 4.4%(+15.3)#67 | 4.9%(+14.8)#1,256 |
| 68. | Pajaro Dunes | 19.6% | 4.4%(+15.2)#68 | 4.9%(+14.7)#1,274 |
| 69. | Trowbridge | 19.4% | 4.4%(+15.0)#69 | 4.9%(+14.5)#1,294 |
| 70. | Sierra Brooks | 19.3% | 4.4%(+14.9)#70 | 4.9%(+14.4)#1,303 |
| 71. | Davenport | 18.9% | 4.4%(+14.5)#71 | 4.9%(+14.0)#1,362 |
| 72. | Walker | 18.8% | 4.4%(+14.4)#72 | 4.9%(+13.9)#1,377 |
| 73. | Guinda | 18.8% | 4.4%(+14.4)#73 | 4.9%(+13.9)#1,382 |
| 74. | South Taft | 18.2% | 4.4%(+13.8)#74 | 4.9%(+13.3)#1,451 |
| 75. | Ocotillo | 18.1% | 4.4%(+13.7)#75 | 4.9%(+13.2)#1,481 |
| 76. | Bass Lake | 18.0% | 4.4%(+13.6)#76 | 4.9%(+13.1)#1,492 |
| 77. | Westmorland | 17.9% | 4.4%(+13.5)#77 | 4.9%(+13.0)#1,498 |
| 78. | Dobbins | 17.9% | 4.4%(+13.5)#78 | 4.9%(+13.0)#1,505 |
| 79. | Stirling City | 17.3% | 4.4%(+12.9)#79 | 4.9%(+12.4)#1,597 |
| 80. | Potrero | 17.1% | 4.4%(+12.7)#80 | 4.9%(+12.2)#1,627 |
| 81. | Richfield | 17.1% | 4.4%(+12.7)#81 | 4.9%(+12.2)#1,634 |
| 82. | Ridgecrest Heights | 17.0% | 4.4%(+12.6)#82 | 4.9%(+12.1)#1,648 |
| 83. | East Bakersfield | 16.8% | 4.4%(+12.4)#83 | 4.9%(+11.9)#1,685 |
| 84. | Spring Valley Cdp Lake County | 16.6% | 4.4%(+12.2)#84 | 4.9%(+11.7)#1,757 |
| 85. | Frazier Park | 16.5% | 4.4%(+12.1)#85 | 4.9%(+11.6)#1,763 |
| 86. | Blue Lake | 16.5% | 4.4%(+12.1)#86 | 4.9%(+11.6)#1,768 |
| 87. | Graton | 16.4% | 4.4%(+12.0)#87 | 4.9%(+11.5)#1,788 |
| 88. | River Pines | 16.4% | 4.4%(+12.0)#88 | 4.9%(+11.5)#1,792 |
| 89. | Fowler | 16.0% | 4.4%(+11.6)#89 | 4.9%(+11.1)#1,859 |
| 90. | San Andreas | 15.8% | 4.4%(+11.4)#90 | 4.9%(+10.9)#1,897 |
| 91. | South Dos Palos | 15.7% | 4.4%(+11.3)#91 | 4.9%(+10.8)#1,926 |
| 92. | Lake Almanor Country Club | 15.7% | 4.4%(+11.3)#92 | 4.9%(+10.8)#1,936 |
| 93. | Heber | 15.6% | 4.4%(+11.2)#93 | 4.9%(+10.7)#1,943 |
| 94. | Trinity Center | 15.6% | 4.4%(+11.2)#94 | 4.9%(+10.7)#1,955 |
| 95. | Panorama Heights | 15.6% | 4.4%(+11.2)#95 | 4.9%(+10.7)#1,964 |
| 96. | Johnson Park | 15.5% | 4.4%(+11.1)#96 | 4.9%(+10.6)#1,981 |
| 97. | Weed | 15.3% | 4.4%(+10.9)#97 | 4.9%(+10.4)#2,024 |
| 98. | Airport | 15.3% | 4.4%(+10.9)#98 | 4.9%(+10.4)#2,027 |
| 99. | Dixon Lane Meadow Creek | 15.0% | 4.4%(+10.6)#99 | 4.9%(+10.1)#2,083 |
| 100. | Amador City | 15.0% | 4.4%(+10.6)#100 | 4.9%(+10.1)#2,100 |
Common Questions
What are the Top 10 Cities with the Highest Percentage of Households with Income Below $10,000 in California?
Top 10 Cities with the Highest Percentage of Households with Income Below $10,000 in California are:
#1
100.0%
#2
100.0%
#3
100.0%
#4
100.0%
#5
76.0%
#6
72.3%
#7
70.4%
#8
66.7%
#9
64.7%
#10
63.2%
What city has the Highest Percentage of Households with Income Below $10,000 in California?
Kennedy Meadows has the Highest Percentage of Households with Income Below $10,000 in California with 100.0%.
What is the Percentage of Households with Income Below $10,000 in the State of California?
Percentage of Households with Income Below $10,000 in California is 4.4%.
What is the Percentage of Households with Income Below $10,000 in the United States?
Percentage of Households with Income Below $10,000 in the United States is 4.9%.