Cities with the Highest Percentage of Households with Income Below $10,000 in Minnesota
RELATED REPORTS & OPTIONS
Household Income | $0-10k
Minnesota
Compare Cities
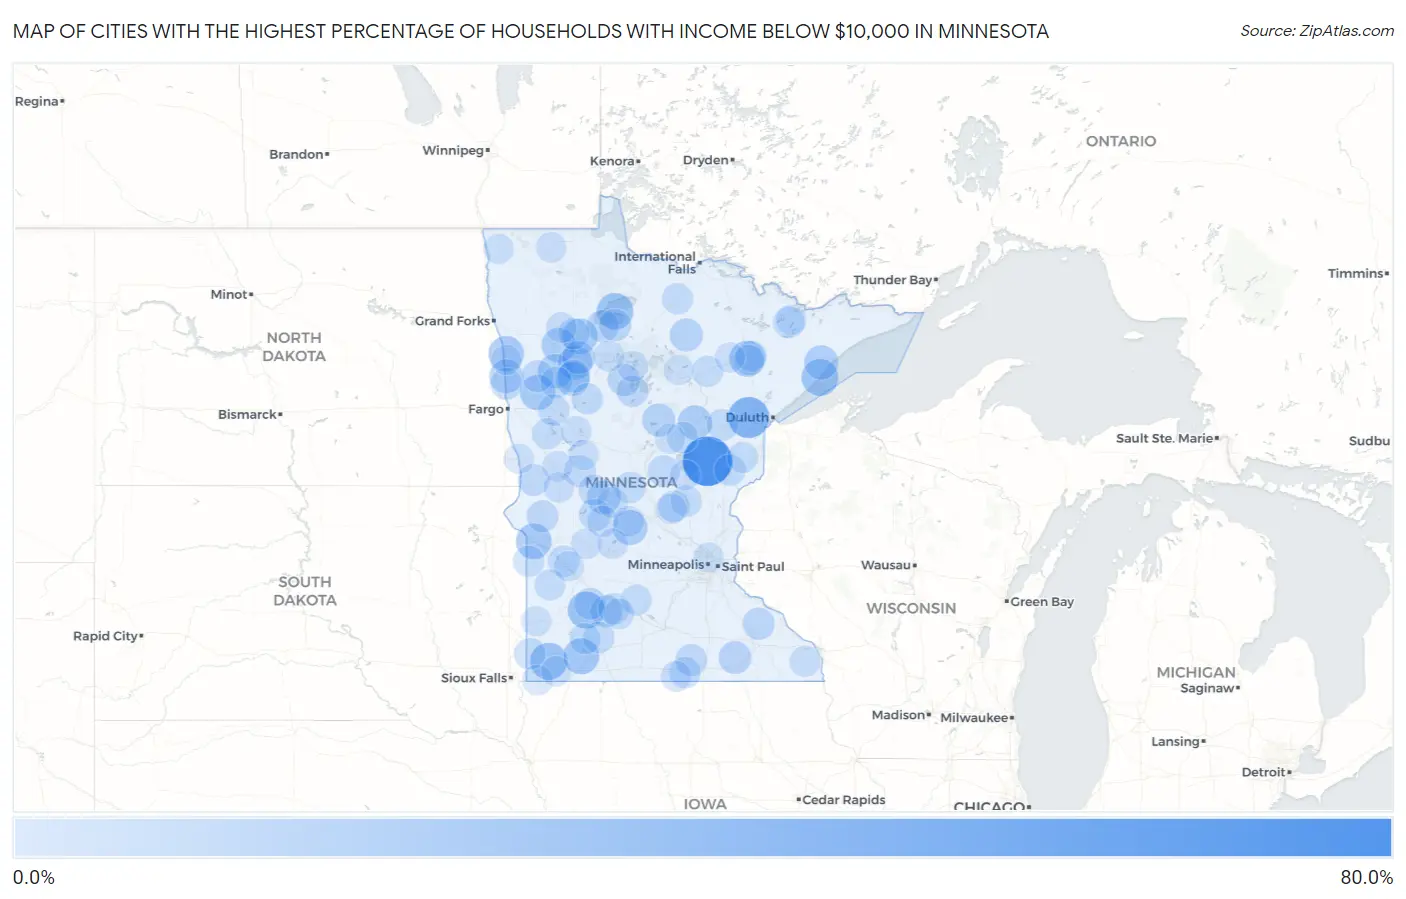
Map of Cities with the Highest Percentage of Households with Income Below $10,000 in Minnesota
0.0%
80.0%
Cities with the Highest Percentage of Households with Income Below $10,000 in Minnesota
| City | Households with Income < $10k | vs State | vs National | |
| 1. | Mcgrath | 64.3% | 3.6%(+60.7)#1 | 4.9%(+59.4)#88 |
| 2. | Mahnomen | 39.5% | 3.6%(+35.9)#2 | 4.9%(+34.6)#309 |
| 3. | Lucan | 27.9% | 3.6%(+24.3)#3 | 4.9%(+23.0)#648 |
| 4. | Kenneth | 27.8% | 3.6%(+24.2)#4 | 4.9%(+22.9)#654 |
| 5. | Beaver Bay | 27.3% | 3.6%(+23.7)#5 | 4.9%(+22.4)#673 |
| 6. | Ponemah | 26.5% | 3.6%(+22.9)#6 | 4.9%(+21.6)#707 |
| 7. | Leonidas | 25.0% | 3.6%(+21.4)#7 | 4.9%(+20.1)#799 |
| 8. | Kinbrae | 25.0% | 3.6%(+21.4)#8 | 4.9%(+20.1)#807 |
| 9. | Odessa | 23.8% | 3.6%(+20.2)#9 | 4.9%(+18.9)#881 |
| 10. | Nielsville | 23.5% | 3.6%(+19.9)#10 | 4.9%(+18.6)#897 |
| 11. | Gonvick | 23.0% | 3.6%(+19.4)#11 | 4.9%(+18.1)#945 |
| 12. | Ulen | 22.5% | 3.6%(+18.9)#12 | 4.9%(+17.6)#972 |
| 13. | Roscoe | 21.6% | 3.6%(+18.0)#13 | 4.9%(+16.7)#1,050 |
| 14. | Mcintosh | 20.4% | 3.6%(+16.8)#14 | 4.9%(+15.5)#1,156 |
| 15. | Palisade | 20.3% | 3.6%(+16.7)#15 | 4.9%(+15.4)#1,167 |
| 16. | Riverland | 20.0% | 3.6%(+16.4)#16 | 4.9%(+15.1)#1,201 |
| 17. | Pine Bend | 20.0% | 3.6%(+16.4)#17 | 4.9%(+15.1)#1,223 |
| 18. | Finland | 19.8% | 3.6%(+16.2)#18 | 4.9%(+14.9)#1,248 |
| 19. | Knife River | 19.1% | 3.6%(+15.5)#19 | 4.9%(+14.2)#1,331 |
| 20. | Twin Lakes | 19.0% | 3.6%(+15.4)#20 | 4.9%(+14.1)#1,348 |
| 21. | Hendrum | 18.8% | 3.6%(+15.2)#21 | 4.9%(+13.9)#1,385 |
| 22. | West Union | 18.8% | 3.6%(+15.2)#22 | 4.9%(+13.9)#1,389 |
| 23. | Bigfork | 17.2% | 3.6%(+13.6)#23 | 4.9%(+12.3)#1,613 |
| 24. | Manhattan Beach | 16.7% | 3.6%(+13.1)#24 | 4.9%(+11.8)#1,748 |
| 25. | Ebro | 16.1% | 3.6%(+12.5)#25 | 4.9%(+11.2)#1,854 |
| 26. | Sargeant | 15.8% | 3.6%(+12.2)#26 | 4.9%(+10.9)#1,915 |
| 27. | Naytahwaush | 15.3% | 3.6%(+11.7)#27 | 4.9%(+10.4)#2,032 |
| 28. | Little Rock | 14.8% | 3.6%(+11.2)#28 | 4.9%(+9.90)#2,154 |
| 29. | Redby | 14.6% | 3.6%(+11.0)#29 | 4.9%(+9.70)#2,211 |
| 30. | Clements | 14.3% | 3.6%(+10.7)#30 | 4.9%(+9.40)#2,284 |
| 31. | Laporte | 14.3% | 3.6%(+10.7)#31 | 4.9%(+9.40)#2,295 |
| 32. | Hammond | 14.0% | 3.6%(+10.4)#32 | 4.9%(+9.10)#2,380 |
| 33. | Sedan | 13.6% | 3.6%(+10.00)#33 | 4.9%(+8.70)#2,502 |
| 34. | Chokio | 13.5% | 3.6%(+9.90)#34 | 4.9%(+8.60)#2,529 |
| 35. | Freeborn | 13.4% | 3.6%(+9.80)#35 | 4.9%(+8.50)#2,559 |
| 36. | Seaforth | 13.3% | 3.6%(+9.70)#36 | 4.9%(+8.40)#2,612 |
| 37. | Urbank | 13.3% | 3.6%(+9.70)#37 | 4.9%(+8.40)#2,620 |
| 38. | Twin Valley | 13.1% | 3.6%(+9.50)#38 | 4.9%(+8.20)#2,676 |
| 39. | Walker | 13.0% | 3.6%(+9.40)#39 | 4.9%(+8.10)#2,708 |
| 40. | Harding | 13.0% | 3.6%(+9.40)#40 | 4.9%(+8.10)#2,726 |
| 41. | Perley | 13.0% | 3.6%(+9.40)#41 | 4.9%(+8.10)#2,727 |
| 42. | Tintah | 12.9% | 3.6%(+9.30)#42 | 4.9%(+8.00)#2,774 |
| 43. | Waubun | 12.8% | 3.6%(+9.20)#43 | 4.9%(+7.90)#2,800 |
| 44. | Wright | 12.8% | 3.6%(+9.20)#44 | 4.9%(+7.90)#2,809 |
| 45. | Jeffers | 12.5% | 3.6%(+8.90)#45 | 4.9%(+7.60)#2,924 |
| 46. | Ronneby | 12.5% | 3.6%(+8.90)#46 | 4.9%(+7.60)#2,948 |
| 47. | Sandstone | 12.4% | 3.6%(+8.80)#47 | 4.9%(+7.50)#2,969 |
| 48. | Watson | 12.4% | 3.6%(+8.80)#48 | 4.9%(+7.50)#2,999 |
| 49. | Ely | 12.2% | 3.6%(+8.60)#49 | 4.9%(+7.30)#3,054 |
| 50. | Audubon | 12.2% | 3.6%(+8.60)#50 | 4.9%(+7.30)#3,077 |
| 51. | Swanville | 12.2% | 3.6%(+8.60)#51 | 4.9%(+7.30)#3,083 |
| 52. | Jasper | 12.1% | 3.6%(+8.50)#52 | 4.9%(+7.20)#3,131 |
| 53. | Walters | 12.1% | 3.6%(+8.50)#53 | 4.9%(+7.20)#3,138 |
| 54. | Aitkin | 12.0% | 3.6%(+8.40)#54 | 4.9%(+7.10)#3,154 |
| 55. | Pine Point | 12.0% | 3.6%(+8.40)#55 | 4.9%(+7.10)#3,185 |
| 56. | Calumet | 11.8% | 3.6%(+8.20)#56 | 4.9%(+6.90)#3,302 |
| 57. | Big Falls | 11.8% | 3.6%(+8.20)#57 | 4.9%(+6.90)#3,307 |
| 58. | Gully | 11.8% | 3.6%(+8.20)#58 | 4.9%(+6.90)#3,313 |
| 59. | Morgan | 11.7% | 3.6%(+8.10)#59 | 4.9%(+6.80)#3,336 |
| 60. | Marietta | 11.7% | 3.6%(+8.10)#60 | 4.9%(+6.80)#3,360 |
| 61. | Milaca | 11.4% | 3.6%(+7.80)#61 | 4.9%(+6.50)#3,485 |
| 62. | Pelican Rapids | 11.4% | 3.6%(+7.80)#62 | 4.9%(+6.50)#3,491 |
| 63. | Westbrook | 11.3% | 3.6%(+7.70)#63 | 4.9%(+6.40)#3,574 |
| 64. | Gibbon | 11.1% | 3.6%(+7.50)#64 | 4.9%(+6.20)#3,661 |
| 65. | St Leo | 11.1% | 3.6%(+7.50)#65 | 4.9%(+6.20)#3,677 |
| 66. | Bruno | 11.1% | 3.6%(+7.50)#66 | 4.9%(+6.20)#3,693 |
| 67. | Cass Lake | 11.0% | 3.6%(+7.40)#67 | 4.9%(+6.10)#3,745 |
| 68. | Houston | 10.9% | 3.6%(+7.30)#68 | 4.9%(+6.00)#3,797 |
| 69. | Brooten | 10.9% | 3.6%(+7.30)#69 | 4.9%(+6.00)#3,807 |
| 70. | Virginia | 10.5% | 3.6%(+6.90)#70 | 4.9%(+5.60)#4,034 |
| 71. | Nelson | 10.4% | 3.6%(+6.80)#71 | 4.9%(+5.50)#4,133 |
| 72. | Oklee | 10.3% | 3.6%(+6.70)#72 | 4.9%(+5.40)#4,202 |
| 73. | Evan | 10.3% | 3.6%(+6.70)#73 | 4.9%(+5.40)#4,230 |
| 74. | Sauk Centre | 10.1% | 3.6%(+6.50)#74 | 4.9%(+5.20)#4,318 |
| 75. | Wilton | 10.1% | 3.6%(+6.50)#75 | 4.9%(+5.20)#4,360 |
| 76. | Perham | 10.0% | 3.6%(+6.40)#76 | 4.9%(+5.10)#4,380 |
| 77. | Eveleth | 10.0% | 3.6%(+6.40)#77 | 4.9%(+5.10)#4,381 |
| 78. | Bricelyn | 10.0% | 3.6%(+6.40)#78 | 4.9%(+5.10)#4,408 |
| 79. | St Martin | 9.9% | 3.6%(+6.30)#79 | 4.9%(+5.00)#4,496 |
| 80. | Murdock | 9.9% | 3.6%(+6.30)#80 | 4.9%(+5.00)#4,499 |
| 81. | Dalton | 9.8% | 3.6%(+6.20)#81 | 4.9%(+4.90)#4,581 |
| 82. | Spicer | 9.6% | 3.6%(+6.00)#82 | 4.9%(+4.70)#4,708 |
| 83. | Onamia | 9.6% | 3.6%(+6.00)#83 | 4.9%(+4.70)#4,715 |
| 84. | Foley | 9.5% | 3.6%(+5.90)#84 | 4.9%(+4.60)#4,767 |
| 85. | Steen | 9.5% | 3.6%(+5.90)#85 | 4.9%(+4.60)#4,826 |
| 86. | Barrett | 9.4% | 3.6%(+5.80)#86 | 4.9%(+4.50)#4,900 |
| 87. | Badger | 9.3% | 3.6%(+5.70)#87 | 4.9%(+4.40)#4,987 |
| 88. | Adrian | 9.2% | 3.6%(+5.60)#88 | 4.9%(+4.30)#5,055 |
| 89. | Hallock | 9.2% | 3.6%(+5.60)#89 | 4.9%(+4.30)#5,065 |
| 90. | Montevideo | 9.1% | 3.6%(+5.50)#90 | 4.9%(+4.20)#5,115 |
| 91. | Winton | 9.1% | 3.6%(+5.50)#91 | 4.9%(+4.20)#5,189 |
| 92. | Hubbard | 9.1% | 3.6%(+5.50)#92 | 4.9%(+4.20)#5,204 |
| 93. | Chisholm | 9.0% | 3.6%(+5.40)#93 | 4.9%(+4.10)#5,229 |
| 94. | Breckenridge | 9.0% | 3.6%(+5.40)#94 | 4.9%(+4.10)#5,239 |
| 95. | Henning | 9.0% | 3.6%(+5.40)#95 | 4.9%(+4.10)#5,282 |
| 96. | Lake Benton | 9.0% | 3.6%(+5.40)#96 | 4.9%(+4.10)#5,284 |
| 97. | Hilltop | 8.8% | 3.6%(+5.20)#97 | 4.9%(+3.90)#5,480 |
| 98. | Deer River | 8.8% | 3.6%(+5.20)#98 | 4.9%(+3.90)#5,481 |
| 99. | Shelly | 8.8% | 3.6%(+5.20)#99 | 4.9%(+3.90)#5,515 |
| 100. | Cuyuna | 8.7% | 3.6%(+5.10)#100 | 4.9%(+3.80)#5,627 |
Common Questions
What are the Top 10 Cities with the Highest Percentage of Households with Income Below $10,000 in Minnesota?
Top 10 Cities with the Highest Percentage of Households with Income Below $10,000 in Minnesota are:
#1
64.3%
#2
39.5%
#3
27.9%
#4
27.8%
#5
27.3%
#6
26.5%
#7
25.0%
#8
25.0%
#9
23.8%
#10
23.5%
What city has the Highest Percentage of Households with Income Below $10,000 in Minnesota?
McGrath has the Highest Percentage of Households with Income Below $10,000 in Minnesota with 64.3%.
What is the Percentage of Households with Income Below $10,000 in the State of Minnesota?
Percentage of Households with Income Below $10,000 in Minnesota is 3.6%.
What is the Percentage of Households with Income Below $10,000 in the United States?
Percentage of Households with Income Below $10,000 in the United States is 4.9%.