Lafitte, LA Map & Demographics
Lafitte Map
Lafitte Overview
$40,005
PER CAPITA INCOME
$90,938
AVG FAMILY INCOME
$66,250
AVG HOUSEHOLD INCOME
0.54
INEQUALITY / GINI INDEX
558
TOTAL POPULATION
348
MALE POPULATION
210
FEMALE POPULATION
165.71
MALES / 100 FEMALES
60.34
FEMALES / 100 MALES
41.4
MEDIAN AGE
3.6
AVG FAMILY SIZE
3.0
AVG HOUSEHOLD SIZE
205
LABOR FORCE [ PEOPLE ]
44.4%
PERCENT IN LABOR FORCE
13.2%
UNEMPLOYMENT RATE
Lafitte Zip Codes
Lafitte Area Codes
Income in Lafitte
Income Overview in Lafitte
Per Capita Income in Lafitte is $40,005, while median incomes of families and households are $90,938 and $66,250 respectively.
| Characteristic | Number | Measure |
| Per Capita Income | 558 | $40,005 |
| Median Family Income | 138 | $90,938 |
| Mean Family Income | 138 | $135,284 |
| Median Household Income | 184 | $66,250 |
| Mean Household Income | 184 | $124,352 |
| Income Deficit | 138 | $0 |
| Wage / Income Gap (%) | 558 | 0.00% |
| Wage / Income Gap ($) | 558 | 100.00¢ per $1 |
| Gini / Inequality Index | 558 | 0.54 |
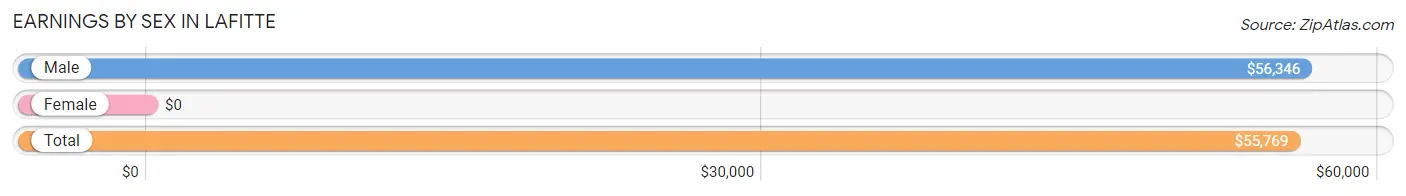
Earnings by Sex in Lafitte
| Sex | Number | Average Earnings |
| Male | 172 (74.8%) | $56,346 |
| Female | 58 (25.2%) | $0 |
| Total | 230 (100.0%) | $55,769 |
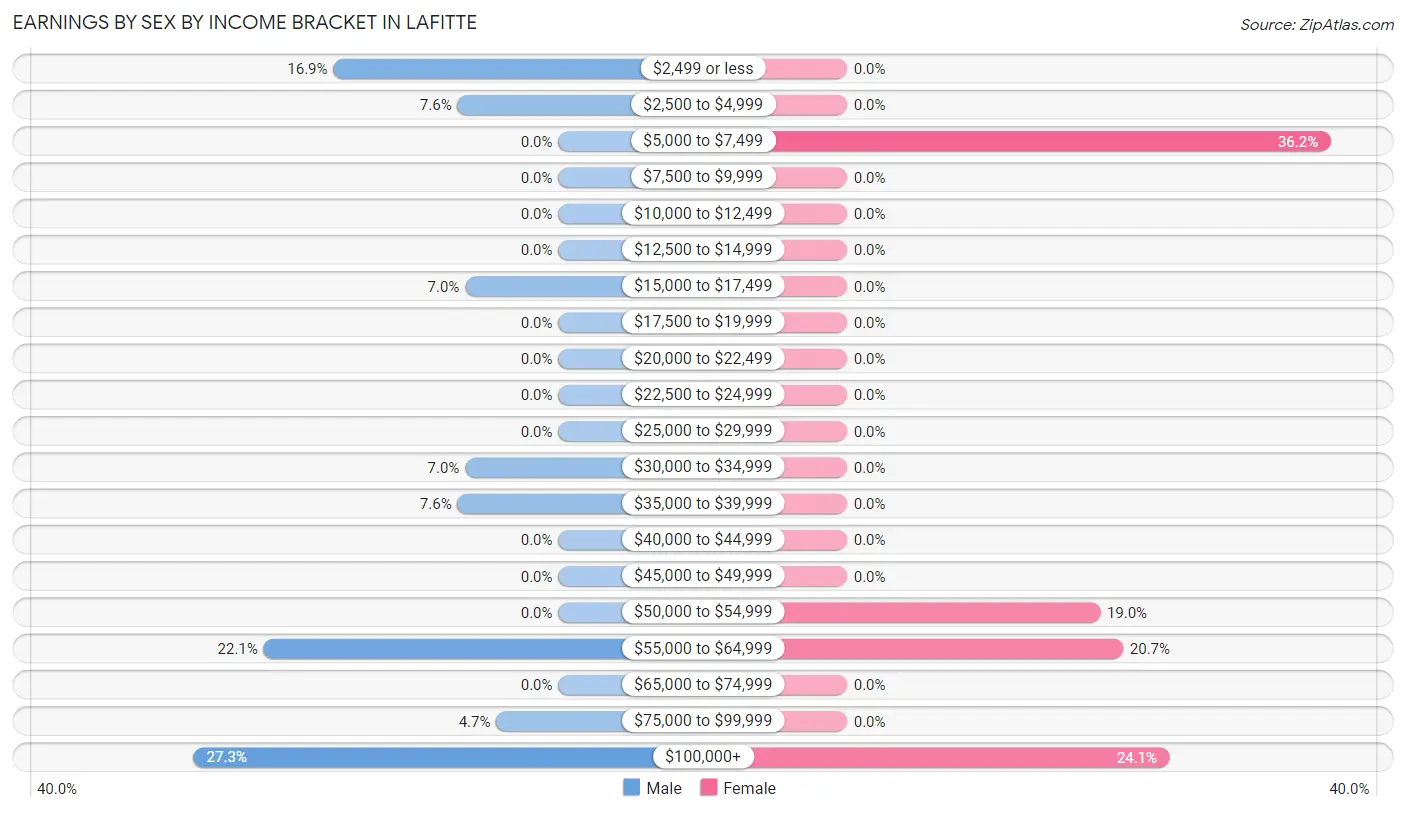
Earnings by Sex by Income Bracket in Lafitte
The most common earnings brackets in Lafitte are $100,000+ for men (47 | 27.3%) and $5,000 to $7,499 for women (21 | 36.2%).
| Income | Male | Female |
| $2,499 or less | 29 (16.9%) | 0 (0.0%) |
| $2,500 to $4,999 | 13 (7.6%) | 0 (0.0%) |
| $5,000 to $7,499 | 0 (0.0%) | 21 (36.2%) |
| $7,500 to $9,999 | 0 (0.0%) | 0 (0.0%) |
| $10,000 to $12,499 | 0 (0.0%) | 0 (0.0%) |
| $12,500 to $14,999 | 0 (0.0%) | 0 (0.0%) |
| $15,000 to $17,499 | 12 (7.0%) | 0 (0.0%) |
| $17,500 to $19,999 | 0 (0.0%) | 0 (0.0%) |
| $20,000 to $22,499 | 0 (0.0%) | 0 (0.0%) |
| $22,500 to $24,999 | 0 (0.0%) | 0 (0.0%) |
| $25,000 to $29,999 | 0 (0.0%) | 0 (0.0%) |
| $30,000 to $34,999 | 12 (7.0%) | 0 (0.0%) |
| $35,000 to $39,999 | 13 (7.6%) | 0 (0.0%) |
| $40,000 to $44,999 | 0 (0.0%) | 0 (0.0%) |
| $45,000 to $49,999 | 0 (0.0%) | 0 (0.0%) |
| $50,000 to $54,999 | 0 (0.0%) | 11 (19.0%) |
| $55,000 to $64,999 | 38 (22.1%) | 12 (20.7%) |
| $65,000 to $74,999 | 0 (0.0%) | 0 (0.0%) |
| $75,000 to $99,999 | 8 (4.6%) | 0 (0.0%) |
| $100,000+ | 47 (27.3%) | 14 (24.1%) |
| Total | 172 (100.0%) | 58 (100.0%) |
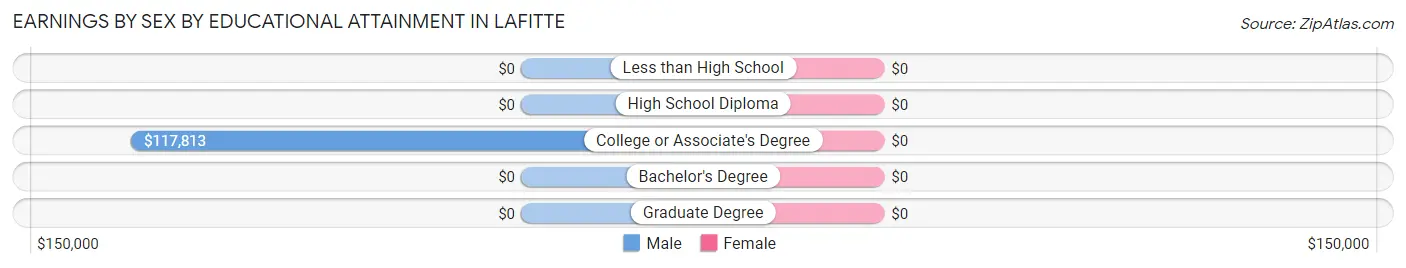
Earnings by Sex by Educational Attainment in Lafitte
| Educational Attainment | Male Income | Female Income |
| Less than High School | - | - |
| High School Diploma | - | - |
| College or Associate's Degree | $117,813 | $0 |
| Bachelor's Degree | - | - |
| Graduate Degree | - | - |
| Total | $90,781 | $0 |
Family Income in Lafitte
Family Income Brackets in Lafitte
According to the Lafitte family income data, there are 41 families falling into the $35,000 to $49,999 income range, which is the most common income bracket and makes up 29.7% of all families.
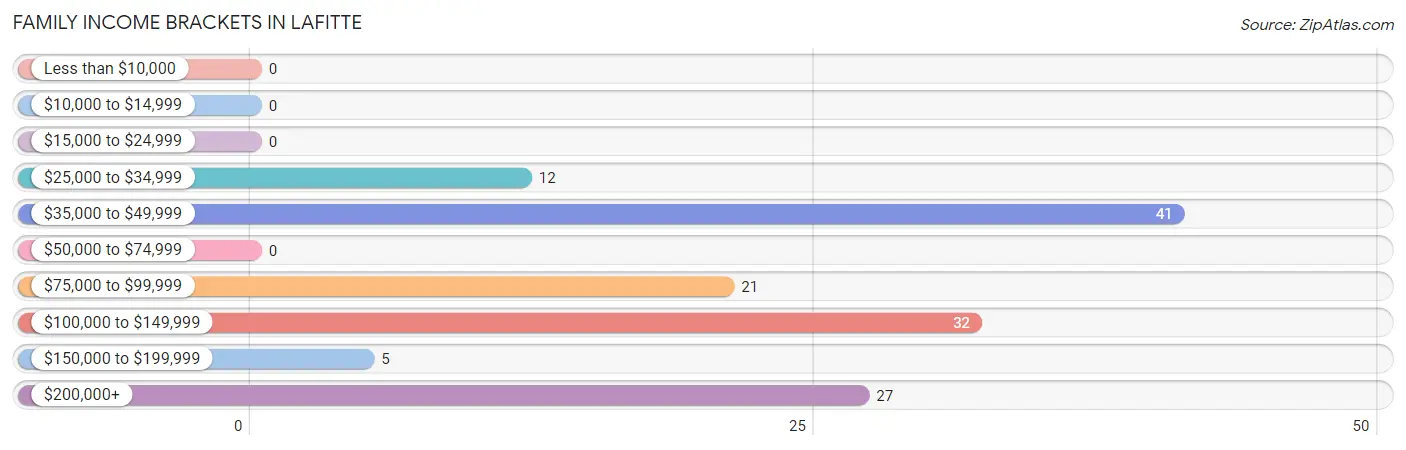
| Income Bracket | # Families | % Families |
| Less than $10,000 | 0 | 0.0% |
| $10,000 to $14,999 | 0 | 0.0% |
| $15,000 to $24,999 | 0 | 0.0% |
| $25,000 to $34,999 | 12 | 8.7% |
| $35,000 to $49,999 | 41 | 29.7% |
| $50,000 to $74,999 | 0 | 0.0% |
| $75,000 to $99,999 | 21 | 15.2% |
| $100,000 to $149,999 | 32 | 23.2% |
| $150,000 to $199,999 | 5 | 3.6% |
| $200,000+ | 27 | 19.6% |
Family Income by Famaliy Size in Lafitte
3-person families (39 | 28.3%) account for the highest median family income in Lafitte with $46,146 per family, while 3-person families (39 | 28.3%) have the highest median income of $15,382 per family member.
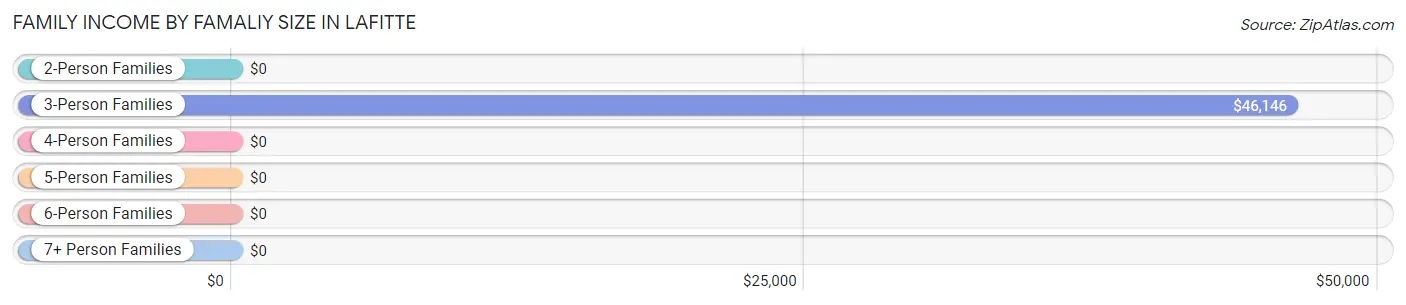
| Income Bracket | # Families | Median Income |
| 2-Person Families | 39 (28.3%) | $0 |
| 3-Person Families | 39 (28.3%) | $46,146 |
| 4-Person Families | 32 (23.2%) | $0 |
| 5-Person Families | 13 (9.4%) | $0 |
| 6-Person Families | 15 (10.9%) | $0 |
| 7+ Person Families | 0 (0.0%) | $0 |
| Total | 138 (100.0%) | $90,938 |
Family Income by Number of Earners in Lafitte
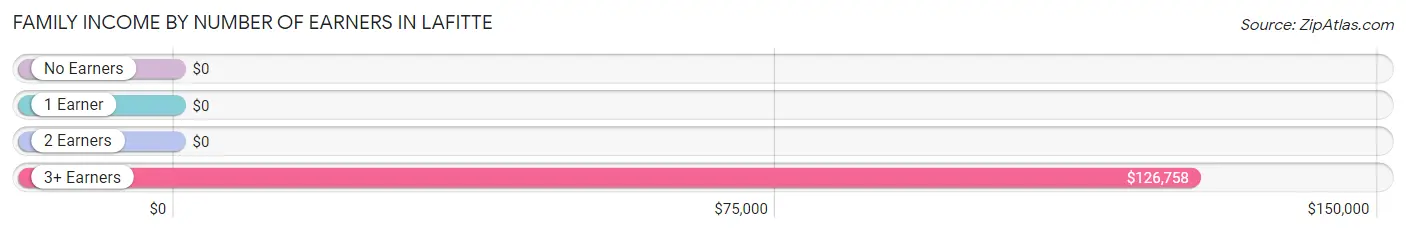
| Number of Earners | # Families | Median Income |
| No Earners | 26 (18.8%) | $0 |
| 1 Earner | 53 (38.4%) | $0 |
| 2 Earners | 14 (10.1%) | $0 |
| 3+ Earners | 45 (32.6%) | $126,758 |
| Total | 138 (100.0%) | $90,938 |
Household Income in Lafitte
Household Income Brackets in Lafitte
With 53 households falling in the category, the $35,000 to $49,999 income range is the most frequent in Lafitte, accounting for 28.8% of all households.
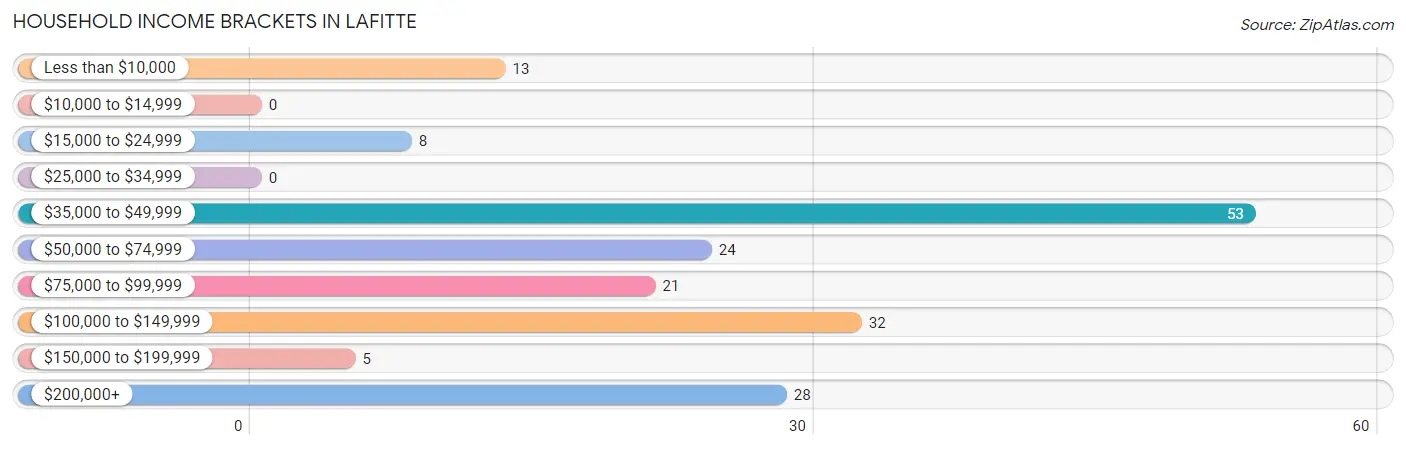
| Income Bracket | # Households | % Households |
| Less than $10,000 | 13 | 7.1% |
| $10,000 to $14,999 | 0 | 0.0% |
| $15,000 to $24,999 | 8 | 4.3% |
| $25,000 to $34,999 | 0 | 0.0% |
| $35,000 to $49,999 | 53 | 28.8% |
| $50,000 to $74,999 | 24 | 13.0% |
| $75,000 to $99,999 | 21 | 11.4% |
| $100,000 to $149,999 | 32 | 17.4% |
| $150,000 to $199,999 | 5 | 2.7% |
| $200,000+ | 28 | 15.2% |
Household Income by Householder Age in Lafitte
The median household income in Lafitte is $66,250, with the highest median household income of $126,758 found in the 25 to 44 years age bracket for the primary householder. A total of 45 households (24.5%) fall into this category. Meanwhile, the 15 to 24 years age bracket for the primary householder has the lowest median household income of $0, with 12 households (6.5%) in this group.
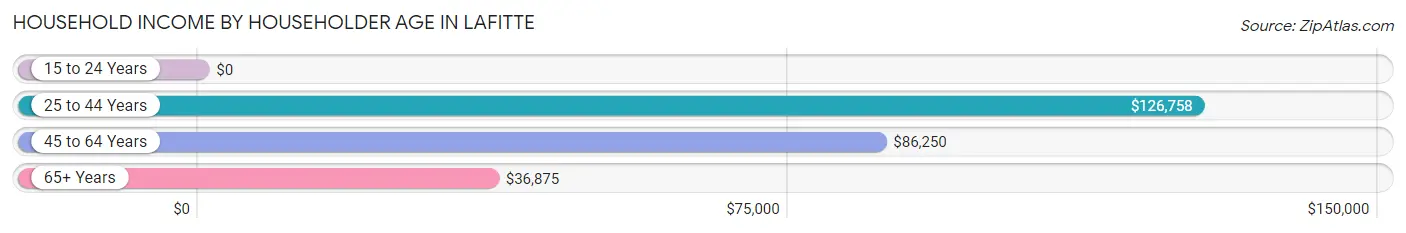
| Income Bracket | # Households | Median Income |
| 15 to 24 Years | 12 (6.5%) | $0 |
| 25 to 44 Years | 45 (24.5%) | $126,758 |
| 45 to 64 Years | 67 (36.4%) | $86,250 |
| 65+ Years | 60 (32.6%) | $36,875 |
| Total | 184 (100.0%) | $66,250 |
Poverty in Lafitte
Income Below Poverty by Sex and Age in Lafitte
With 15.2% poverty level for males and 36.2% for females among the residents of Lafitte, 12 to 14 year old males and 6 to 11 year old females are the most vulnerable to poverty, with 26 males (68.4%) and 16 females (100.0%) in their respective age groups living below the poverty level.
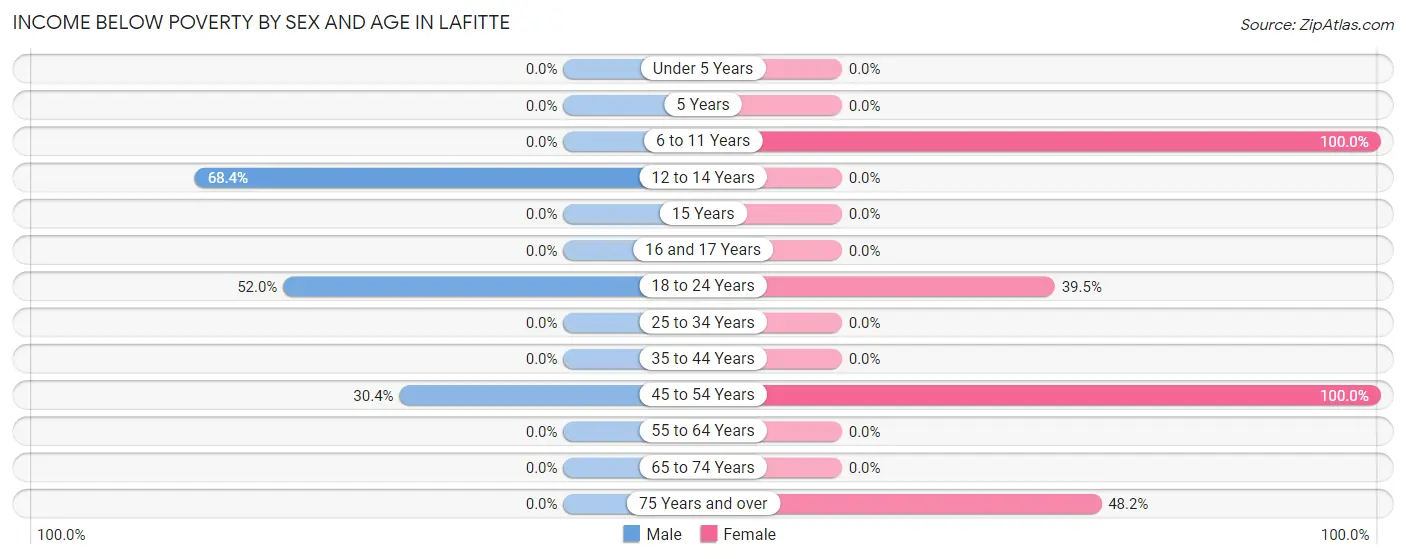
| Age Bracket | Male | Female |
| Under 5 Years | 0 (0.0%) | 0 (0.0%) |
| 5 Years | 0 (0.0%) | 0 (0.0%) |
| 6 to 11 Years | 0 (0.0%) | 16 (100.0%) |
| 12 to 14 Years | 26 (68.4%) | 0 (0.0%) |
| 15 Years | 0 (0.0%) | 0 (0.0%) |
| 16 and 17 Years | 0 (0.0%) | 0 (0.0%) |
| 18 to 24 Years | 13 (52.0%) | 17 (39.5%) |
| 25 to 34 Years | 0 (0.0%) | 0 (0.0%) |
| 35 to 44 Years | 0 (0.0%) | 0 (0.0%) |
| 45 to 54 Years | 14 (30.4%) | 30 (100.0%) |
| 55 to 64 Years | 0 (0.0%) | 0 (0.0%) |
| 65 to 74 Years | 0 (0.0%) | 0 (0.0%) |
| 75 Years and over | 0 (0.0%) | 13 (48.1%) |
| Total | 53 (15.2%) | 76 (36.2%) |
Income Above Poverty by Sex and Age in Lafitte
According to the poverty statistics in Lafitte, males aged under 5 years and females aged 25 to 34 years are the age groups that are most secure financially, with 100.0% of males and 100.0% of females in these age groups living above the poverty line.
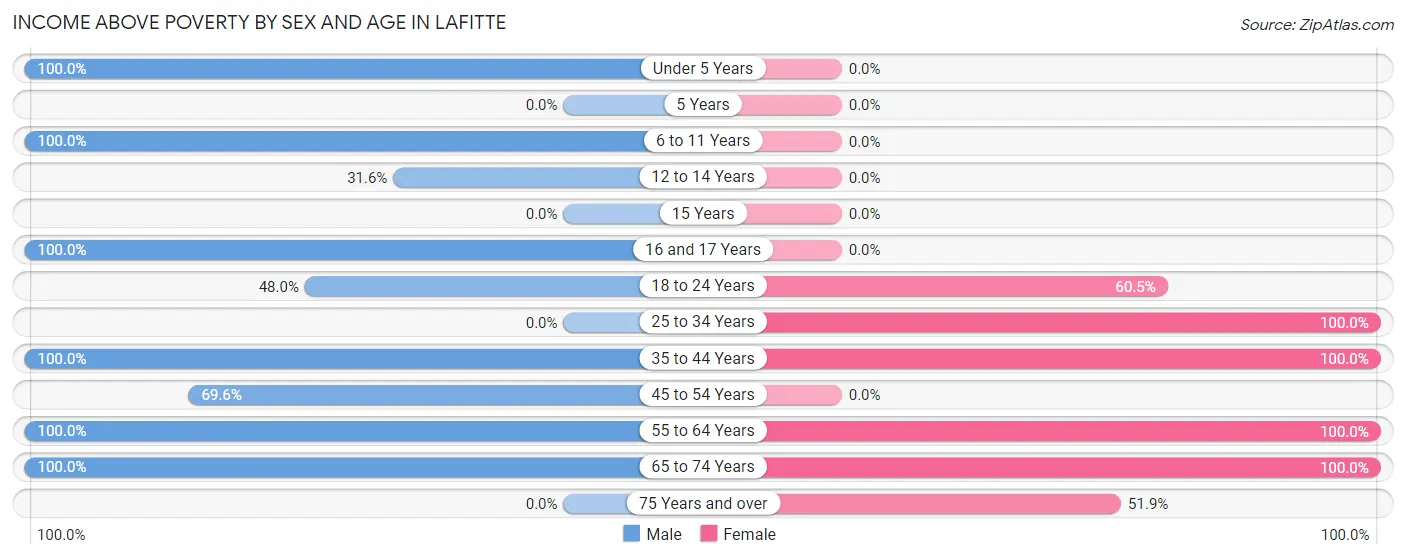
| Age Bracket | Male | Female |
| Under 5 Years | 12 (100.0%) | 0 (0.0%) |
| 5 Years | 0 (0.0%) | 0 (0.0%) |
| 6 to 11 Years | 30 (100.0%) | 0 (0.0%) |
| 12 to 14 Years | 12 (31.6%) | 0 (0.0%) |
| 15 Years | 0 (0.0%) | 0 (0.0%) |
| 16 and 17 Years | 58 (100.0%) | 0 (0.0%) |
| 18 to 24 Years | 12 (48.0%) | 26 (60.5%) |
| 25 to 34 Years | 0 (0.0%) | 21 (100.0%) |
| 35 to 44 Years | 42 (100.0%) | 23 (100.0%) |
| 45 to 54 Years | 32 (69.6%) | 0 (0.0%) |
| 55 to 64 Years | 43 (100.0%) | 36 (100.0%) |
| 65 to 74 Years | 54 (100.0%) | 14 (100.0%) |
| 75 Years and over | 0 (0.0%) | 14 (51.8%) |
| Total | 295 (84.8%) | 134 (63.8%) |
Income Below Poverty Among Married-Couple Families in Lafitte
The poverty statistics for married-couple families in Lafitte show that 12.4% or 15 of the total 121 families live below the poverty line. Families with 1 or 2 children have the highest poverty rate of 20.8%, comprising of 15 families. On the other hand, families with no children have the lowest poverty rate of 0.0%, which includes 0 families.
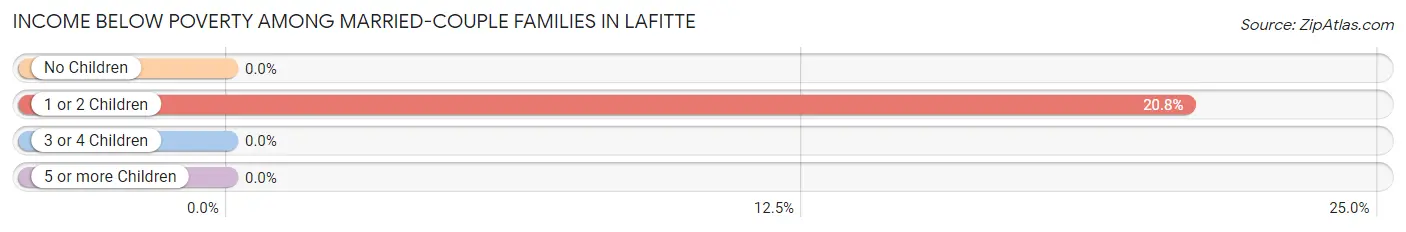
| Children | Above Poverty | Below Poverty |
| No Children | 36 (100.0%) | 0 (0.0%) |
| 1 or 2 Children | 57 (79.2%) | 15 (20.8%) |
| 3 or 4 Children | 13 (100.0%) | 0 (0.0%) |
| 5 or more Children | 0 (0.0%) | 0 (0.0%) |
| Total | 106 (87.6%) | 15 (12.4%) |
Income Below Poverty Among Single-Parent Households in Lafitte
| Children | Single Father | Single Mother |
| No Children | 0 (0.0%) | 0 (0.0%) |
| 1 or 2 Children | 0 (0.0%) | 0 (0.0%) |
| 3 or 4 Children | 0 (0.0%) | 0 (0.0%) |
| 5 or more Children | 0 (0.0%) | 0 (0.0%) |
| Total | 0 (0.0%) | 0 (0.0%) |
Income Below Poverty Among Married-Couple vs Single-Parent Households in Lafitte
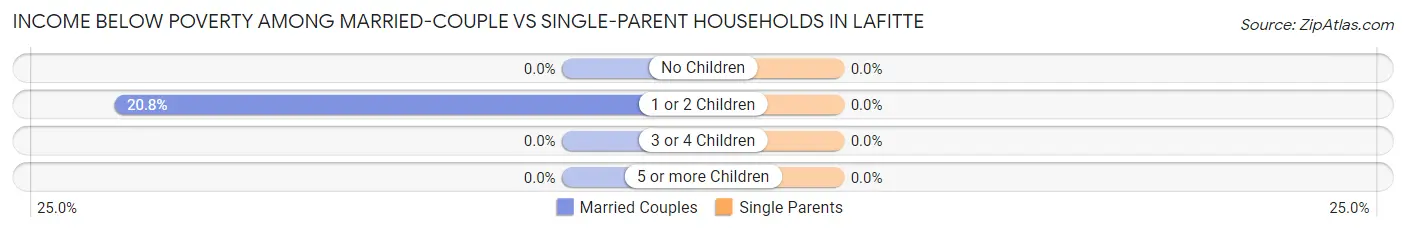
| Children | Married-Couple Families | Single-Parent Households |
| No Children | 0 (0.0%) | 0 (0.0%) |
| 1 or 2 Children | 15 (20.8%) | 0 (0.0%) |
| 3 or 4 Children | 0 (0.0%) | 0 (0.0%) |
| 5 or more Children | 0 (0.0%) | 0 (0.0%) |
| Total | 15 (12.4%) | 0 (0.0%) |
Race in Lafitte
The most populous races in Lafitte are White / Caucasian (466 | 83.5%), and Two or more Races (92 | 16.5%).
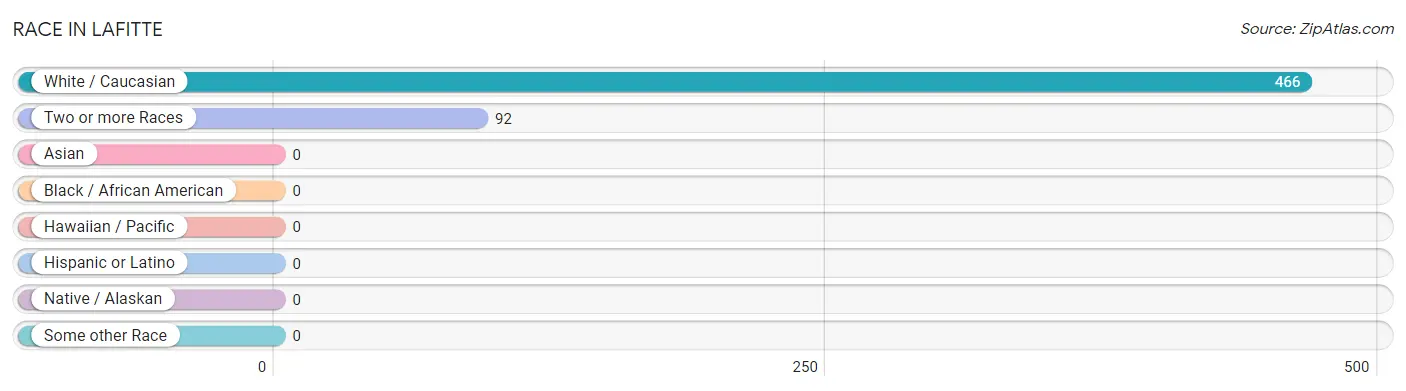
| Race | # Population | % Population |
| Asian | 0 | 0.0% |
| Black / African American | 0 | 0.0% |
| Hawaiian / Pacific | 0 | 0.0% |
| Hispanic or Latino | 0 | 0.0% |
| Native / Alaskan | 0 | 0.0% |
| White / Caucasian | 466 | 83.5% |
| Two or more Races | 92 | 16.5% |
| Some other Race | 0 | 0.0% |
| Total | 558 | 100.0% |
Ancestry in Lafitte
The most populous ancestries reported in Lafitte are French (104 | 18.6%), Korean (87 | 15.6%), American (33 | 5.9%), Belgian (29 | 5.2%), and English (27 | 4.8%), together accounting for 50.2% of all Lafitte residents.
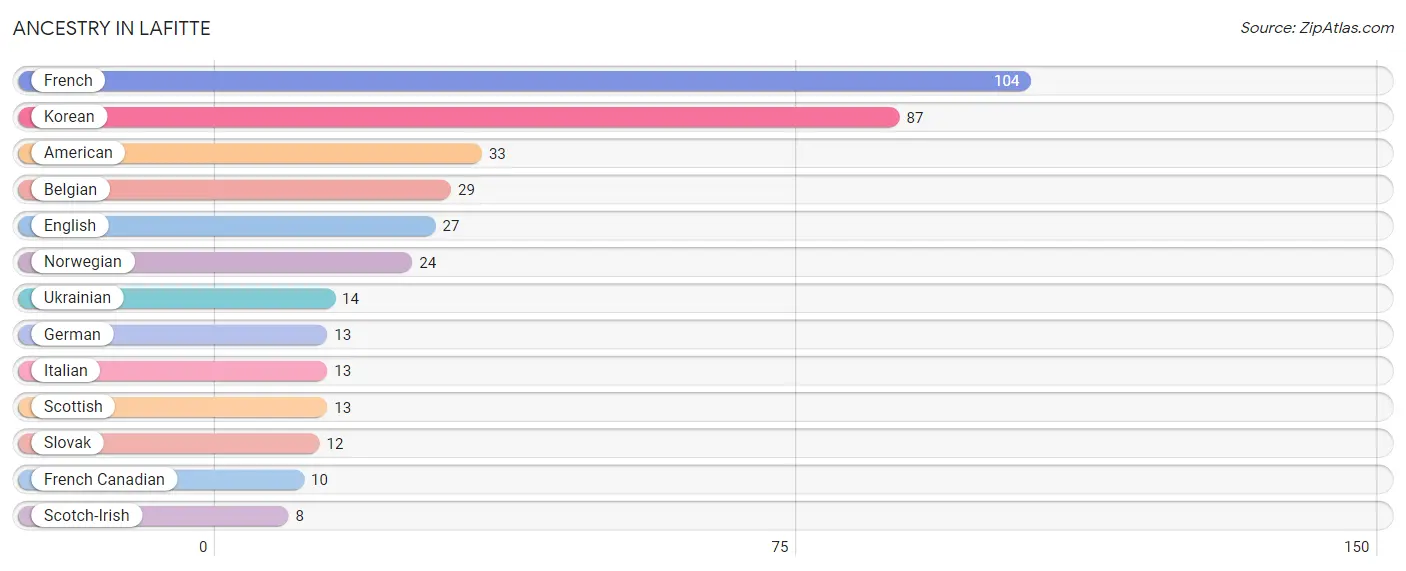
| Ancestry | # Population | % Population |
| American | 33 | 5.9% |
| Belgian | 29 | 5.2% |
| English | 27 | 4.8% |
| French | 104 | 18.6% |
| French Canadian | 10 | 1.8% |
| German | 13 | 2.3% |
| Italian | 13 | 2.3% |
| Korean | 87 | 15.6% |
| Norwegian | 24 | 4.3% |
| Scotch-Irish | 8 | 1.4% |
| Scottish | 13 | 2.3% |
| Slovak | 12 | 2.1% |
| Ukrainian | 14 | 2.5% | View All 13 Rows |
Immigrants in Lafitte

| Immigration Origin | # Population | % Population | View All 0 Rows |
Sex and Age in Lafitte
Sex and Age in Lafitte
The most populous age groups in Lafitte are 15 to 19 Years (58 | 16.7%) for men and 20 to 24 Years (43 | 20.5%) for women.
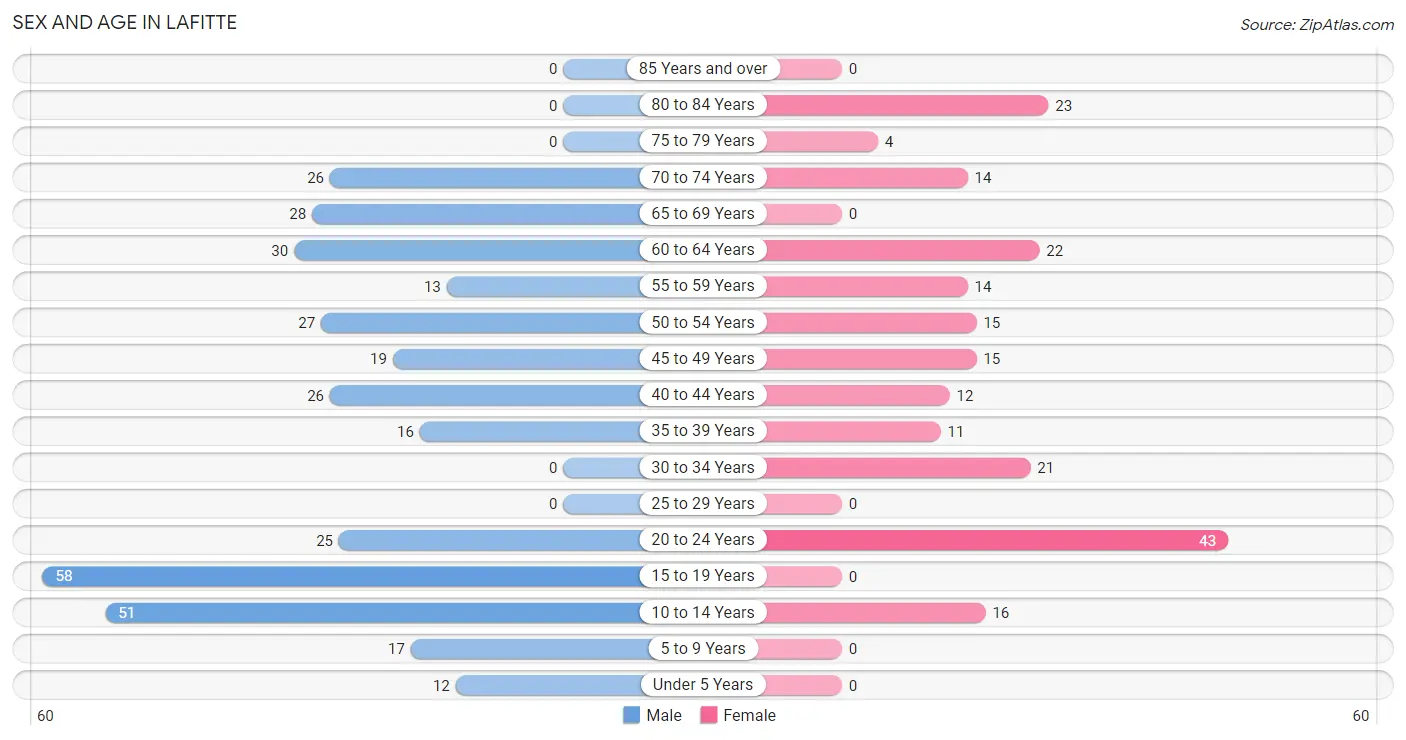
| Age Bracket | Male | Female |
| Under 5 Years | 12 (3.5%) | 0 (0.0%) |
| 5 to 9 Years | 17 (4.9%) | 0 (0.0%) |
| 10 to 14 Years | 51 (14.7%) | 16 (7.6%) |
| 15 to 19 Years | 58 (16.7%) | 0 (0.0%) |
| 20 to 24 Years | 25 (7.2%) | 43 (20.5%) |
| 25 to 29 Years | 0 (0.0%) | 0 (0.0%) |
| 30 to 34 Years | 0 (0.0%) | 21 (10.0%) |
| 35 to 39 Years | 16 (4.6%) | 11 (5.2%) |
| 40 to 44 Years | 26 (7.5%) | 12 (5.7%) |
| 45 to 49 Years | 19 (5.5%) | 15 (7.1%) |
| 50 to 54 Years | 27 (7.8%) | 15 (7.1%) |
| 55 to 59 Years | 13 (3.7%) | 14 (6.7%) |
| 60 to 64 Years | 30 (8.6%) | 22 (10.5%) |
| 65 to 69 Years | 28 (8.1%) | 0 (0.0%) |
| 70 to 74 Years | 26 (7.5%) | 14 (6.7%) |
| 75 to 79 Years | 0 (0.0%) | 4 (1.9%) |
| 80 to 84 Years | 0 (0.0%) | 23 (11.0%) |
| 85 Years and over | 0 (0.0%) | 0 (0.0%) |
| Total | 348 (100.0%) | 210 (100.0%) |
Families and Households in Lafitte
Median Family Size in Lafitte
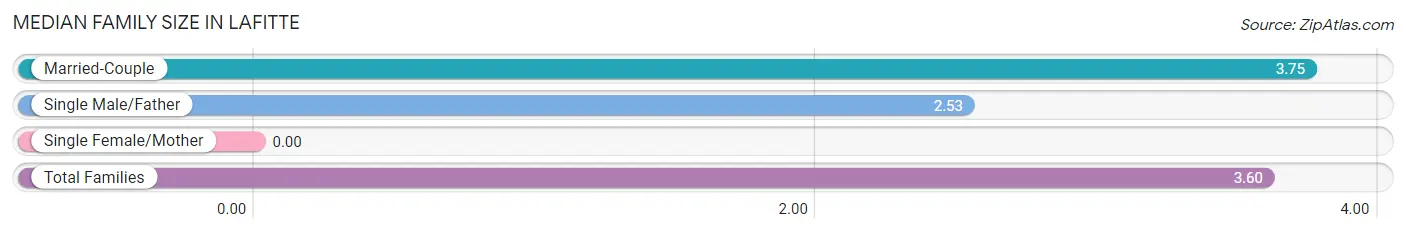
| Family Type | # Families | Family Size |
| Married-Couple | 121 (87.7%) | 3.75 |
| Single Male/Father | 17 (12.3%) | 2.53 |
| Single Female/Mother | 0 (0.0%) | - |
| Total Families | 138 (100.0%) | 3.60 |
Median Household Size in Lafitte

| Household Type | # Households | Household Size |
| Married-Couple | 121 (65.8%) | 3.75 |
| Single Male/Father | 17 (9.2%) | 3.41 |
| Single Female/Mother | 0 (0.0%) | - |
| Non-family | 46 (25.0%) | - |
| Total Households | 184 (100.0%) | 3.03 |
Household Size by Marriage Status in Lafitte
Out of a total of 184 households in Lafitte, 138 (75.0%) are family households, while 46 (25.0%) are nonfamily households. The most numerous type of family households are 3-person households, comprising 51, and the most common type of nonfamily households are 1-person households, comprising 46.
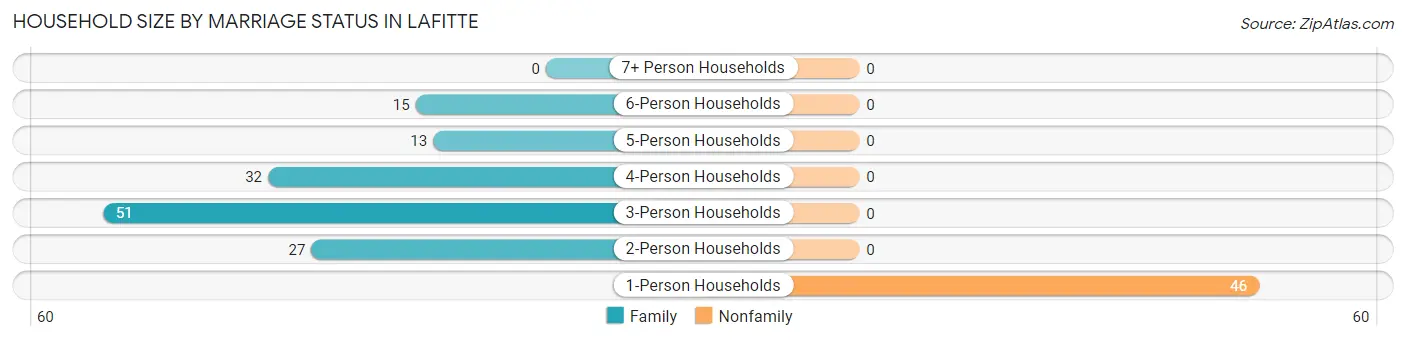
| Household Size | Family Households | Nonfamily Households |
| 1-Person Households | - | 46 (25.0%) |
| 2-Person Households | 27 (14.7%) | 0 (0.0%) |
| 3-Person Households | 51 (27.7%) | 0 (0.0%) |
| 4-Person Households | 32 (17.4%) | 0 (0.0%) |
| 5-Person Households | 13 (7.1%) | 0 (0.0%) |
| 6-Person Households | 15 (8.2%) | 0 (0.0%) |
| 7+ Person Households | 0 (0.0%) | 0 (0.0%) |
| Total | 138 (75.0%) | 46 (25.0%) |
Female Fertility in Lafitte
Fertility by Age in Lafitte
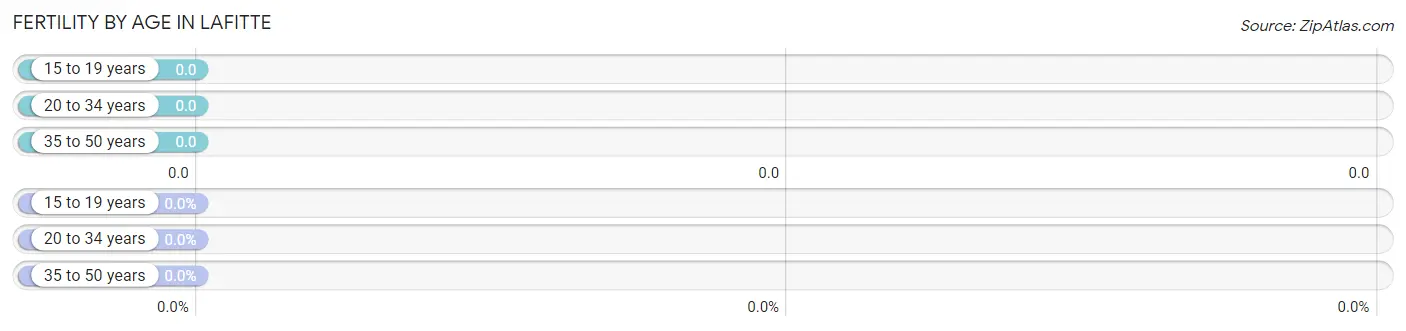
| Age Bracket | Women with Births | Births / 1,000 Women |
| 15 to 19 years | 0 (0.0%) | 0.0 |
| 20 to 34 years | 0 (0.0%) | 0.0 |
| 35 to 50 years | 0 (0.0%) | 0.0 |
| Total | 0 (0.0%) | 0.0 |
Fertility by Age by Marriage Status in Lafitte
| Age Bracket | Married | Unmarried |
| 15 to 19 years | 0 (0.0%) | 0 (0.0%) |
| 20 to 34 years | 0 (0.0%) | 0 (0.0%) |
| 35 to 50 years | 0 (0.0%) | 0 (0.0%) |
| Total | 0 (0.0%) | 0 (0.0%) |
Fertility by Education in Lafitte
| Educational Attainment | Women with Births | Births / 1,000 Women |
| Less than High School | 0 (0.0%) | 0.0 |
| High School Diploma | 0 (0.0%) | 0.0 |
| College or Associate's Degree | 0 (0.0%) | 0.0 |
| Bachelor's Degree | 0 (0.0%) | 0.0 |
| Graduate Degree | 0 (0.0%) | 0.0 |
| Total | 0 (0.0%) | 0.0 |
Fertility by Education by Marriage Status in Lafitte
| Educational Attainment | Married | Unmarried |
| Less than High School | 0 (0.0%) | 0 (0.0%) |
| High School Diploma | 0 (0.0%) | 0 (0.0%) |
| College or Associate's Degree | 0 (0.0%) | 0 (0.0%) |
| Bachelor's Degree | 0 (0.0%) | 0 (0.0%) |
| Graduate Degree | 0 (0.0%) | 0 (0.0%) |
| Total | 0 (0.0%) | 0 (0.0%) |
Employment Characteristics in Lafitte
Employment by Class of Employer in Lafitte
Among the 178 employed individuals in Lafitte, private company employees (114 | 64.0%), self-employed (incorporated) (31 | 17.4%), and self-employed (not incorporated) (22 | 12.4%) make up the most common classes of employment.
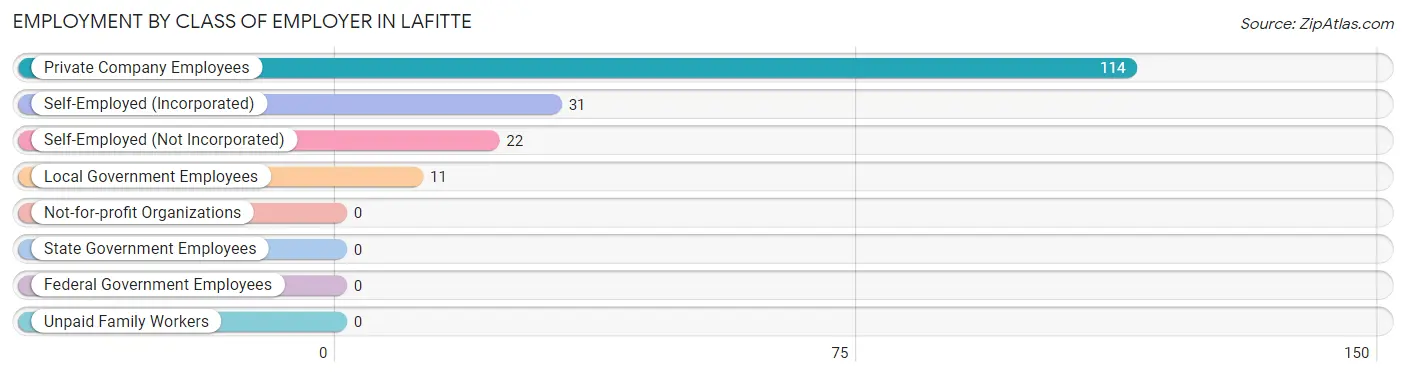
| Employer Class | # Employees | % Employees |
| Private Company Employees | 114 | 64.0% |
| Self-Employed (Incorporated) | 31 | 17.4% |
| Self-Employed (Not Incorporated) | 22 | 12.4% |
| Not-for-profit Organizations | 0 | 0.0% |
| Local Government Employees | 11 | 6.2% |
| State Government Employees | 0 | 0.0% |
| Federal Government Employees | 0 | 0.0% |
| Unpaid Family Workers | 0 | 0.0% |
| Total | 178 | 100.0% |
Employment Status by Age in Lafitte
According to the labor force statistics for Lafitte, out of the total population over 16 years of age (462), 44.4% or 205 individuals are in the labor force, with 13.2% or 27 of them unemployed. The age group with the highest labor force participation rate is 30 to 34 years, with 100.0% or 21 individuals in the labor force. Within the labor force, the 20 to 24 years age range has the highest percentage of unemployed individuals, with 35.9% or 14 of them being unemployed.
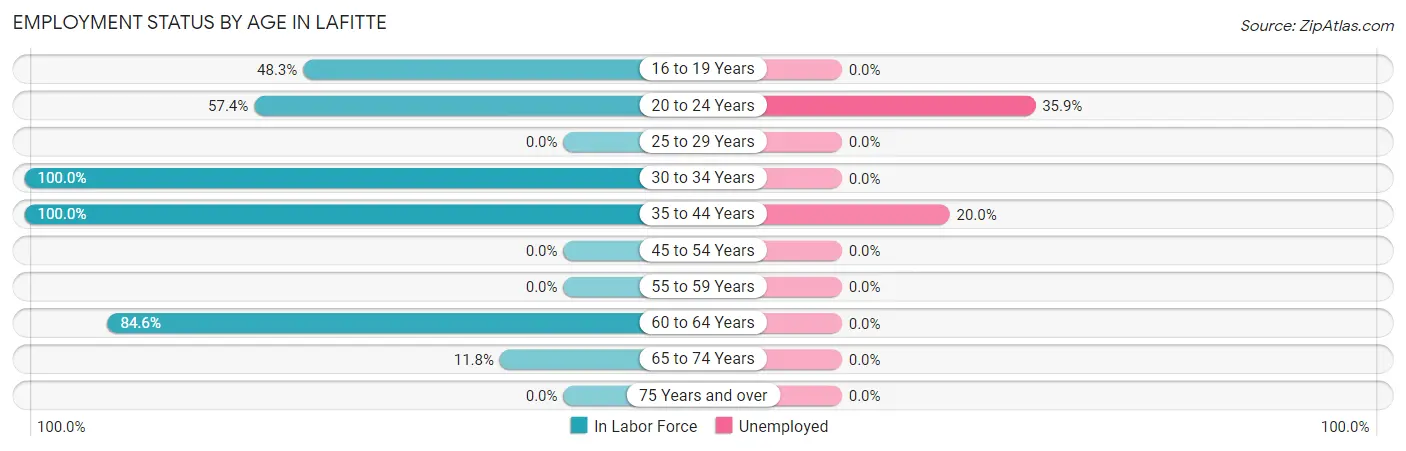
| Age Bracket | In Labor Force | Unemployed |
| 16 to 19 Years | 28 (48.3%) | 0 (0.0%) |
| 20 to 24 Years | 39 (57.4%) | 14 (35.9%) |
| 25 to 29 Years | 0 (0.0%) | 0 (0.0%) |
| 30 to 34 Years | 21 (100.0%) | 0 (0.0%) |
| 35 to 44 Years | 65 (100.0%) | 13 (20.0%) |
| 45 to 54 Years | 0 (0.0%) | 0 (0.0%) |
| 55 to 59 Years | 0 (0.0%) | 0 (0.0%) |
| 60 to 64 Years | 44 (84.6%) | 0 (0.0%) |
| 65 to 74 Years | 8 (11.8%) | 0 (0.0%) |
| 75 Years and over | 0 (0.0%) | 0 (0.0%) |
| Total | 205 (44.4%) | 27 (13.2%) |
Employment Status by Educational Attainment in Lafitte
According to labor force statistics for Lafitte, 53.9% of individuals (130) out of the total population between 25 and 64 years of age (241) are in the labor force, with 10.0% or 13 of them being unemployed. The group with the highest labor force participation rate are those with the educational attainment of bachelor's degree or higher, with 76.6% or 49 individuals in the labor force. Within the labor force, individuals with high school diploma education have the highest percentage of unemployment, with 48.1% or 13 of them being unemployed.
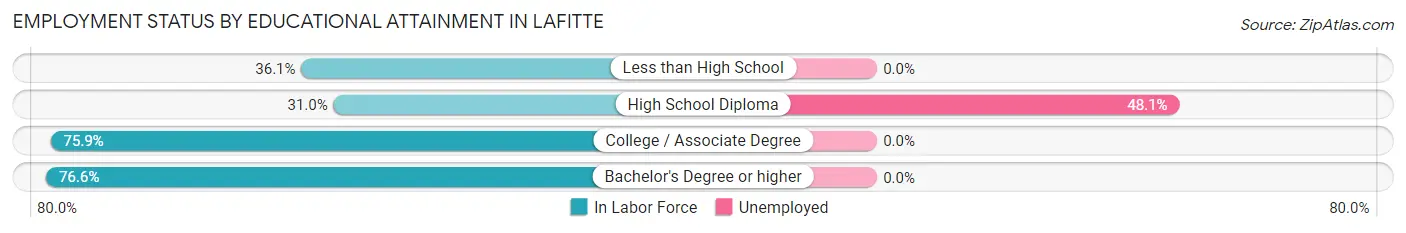
| Educational Attainment | In Labor Force | Unemployed |
| Less than High School | 13 (36.1%) | 0 (0.0%) |
| High School Diploma | 27 (31.0%) | 42 (48.1%) |
| College / Associate Degree | 41 (75.9%) | 0 (0.0%) |
| Bachelor's Degree or higher | 49 (76.6%) | 0 (0.0%) |
| Total | 130 (53.9%) | 24 (10.0%) |
Employment Occupations by Sex in Lafitte
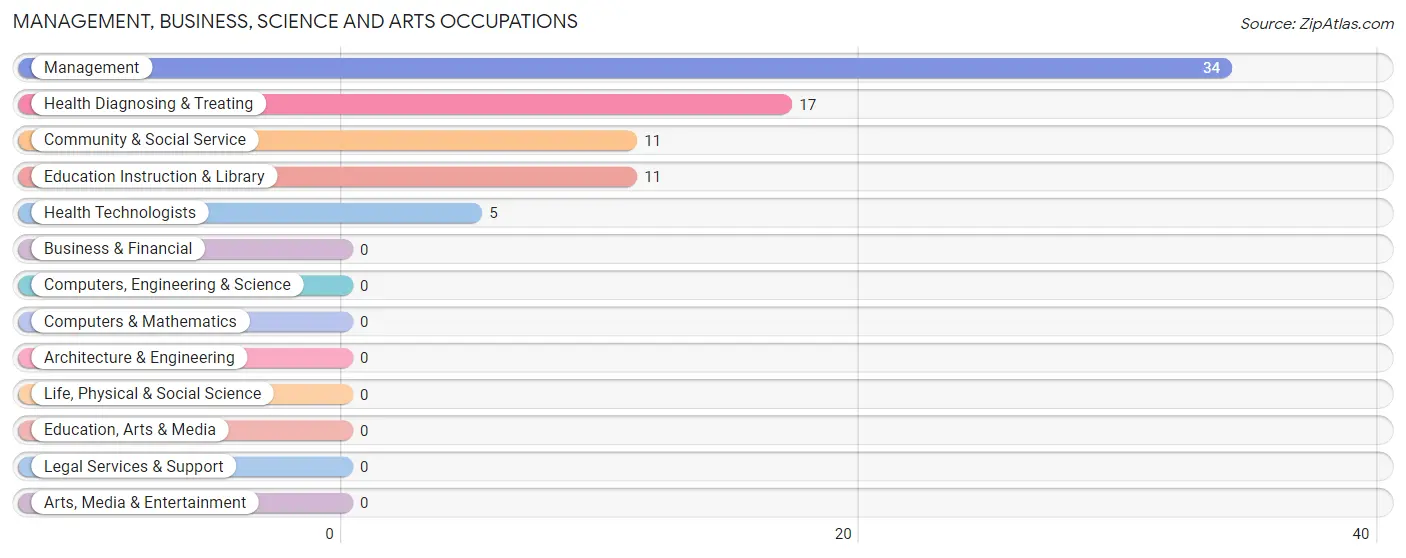
Management, Business, Science and Arts Occupations
The most common Management, Business, Science and Arts occupations in Lafitte are Management (34 | 19.1%), Health Diagnosing & Treating (17 | 9.6%), Community & Social Service (11 | 6.2%), Education Instruction & Library (11 | 6.2%), and Health Technologists (5 | 2.8%).
Management, Business, Science and Arts Occupations by Sex
Within the Management, Business, Science and Arts occupations in Lafitte, the most male-oriented occupations are Health Technologists (100.0%), Management (58.8%), and Health Diagnosing & Treating (29.4%), while the most female-oriented occupations are Community & Social Service (100.0%), Education Instruction & Library (100.0%), and Health Diagnosing & Treating (70.6%).
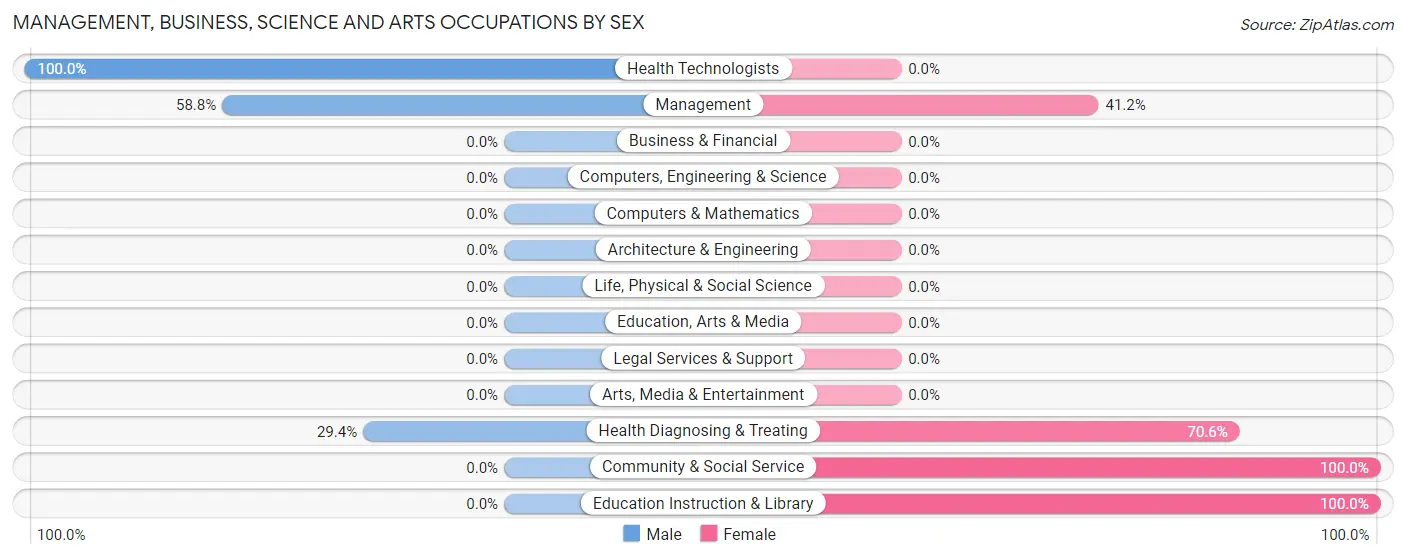
| Occupation | Male | Female |
| Management | 20 (58.8%) | 14 (41.2%) |
| Business & Financial | 0 (0.0%) | 0 (0.0%) |
| Computers, Engineering & Science | 0 (0.0%) | 0 (0.0%) |
| Computers & Mathematics | 0 (0.0%) | 0 (0.0%) |
| Architecture & Engineering | 0 (0.0%) | 0 (0.0%) |
| Life, Physical & Social Science | 0 (0.0%) | 0 (0.0%) |
| Community & Social Service | 0 (0.0%) | 11 (100.0%) |
| Education, Arts & Media | 0 (0.0%) | 0 (0.0%) |
| Legal Services & Support | 0 (0.0%) | 0 (0.0%) |
| Education Instruction & Library | 0 (0.0%) | 11 (100.0%) |
| Arts, Media & Entertainment | 0 (0.0%) | 0 (0.0%) |
| Health Diagnosing & Treating | 5 (29.4%) | 12 (70.6%) |
| Health Technologists | 5 (100.0%) | 0 (0.0%) |
| Total (Category) | 25 (40.3%) | 37 (59.7%) |
| Total (Overall) | 120 (67.4%) | 58 (32.6%) |
Services Occupations
The most common Services occupations in Lafitte are , and Personal Care & Service (15 | 8.4%).
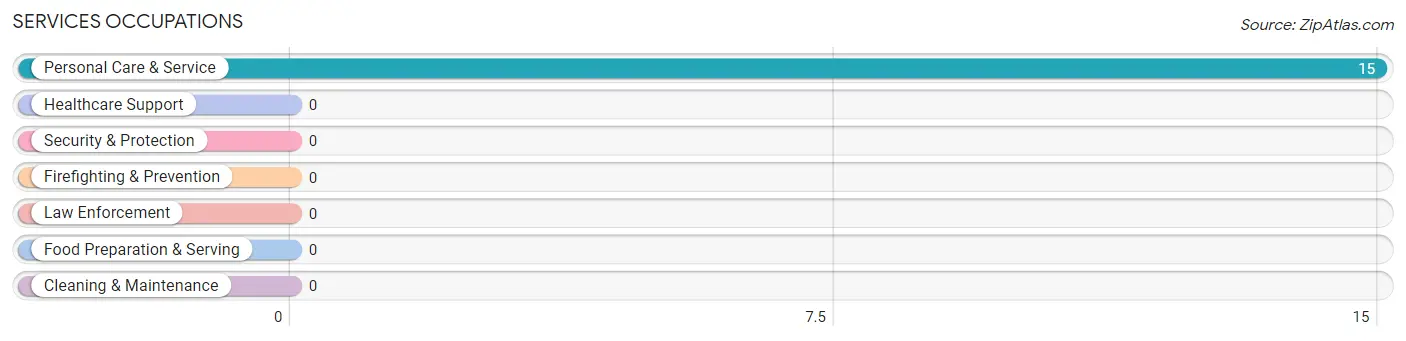
Services Occupations by Sex
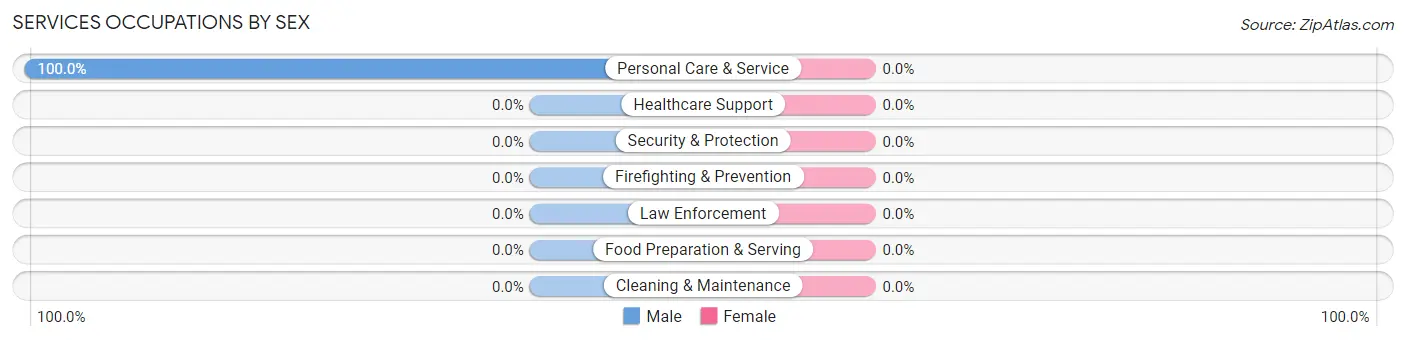
| Occupation | Male | Female |
| Healthcare Support | 0 (0.0%) | 0 (0.0%) |
| Security & Protection | 0 (0.0%) | 0 (0.0%) |
| Firefighting & Prevention | 0 (0.0%) | 0 (0.0%) |
| Law Enforcement | 0 (0.0%) | 0 (0.0%) |
| Food Preparation & Serving | 0 (0.0%) | 0 (0.0%) |
| Cleaning & Maintenance | 0 (0.0%) | 0 (0.0%) |
| Personal Care & Service | 15 (100.0%) | 0 (0.0%) |
| Total (Category) | 15 (100.0%) | 0 (0.0%) |
| Total (Overall) | 120 (67.4%) | 58 (32.6%) |
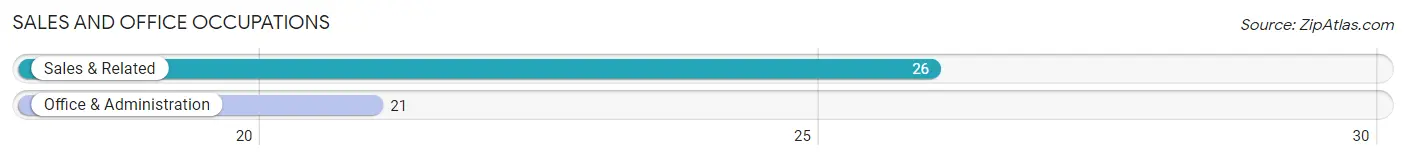
Sales and Office Occupations
The most common Sales and Office occupations in Lafitte are Sales & Related (26 | 14.6%), and Office & Administration (21 | 11.8%).
Sales and Office Occupations by Sex
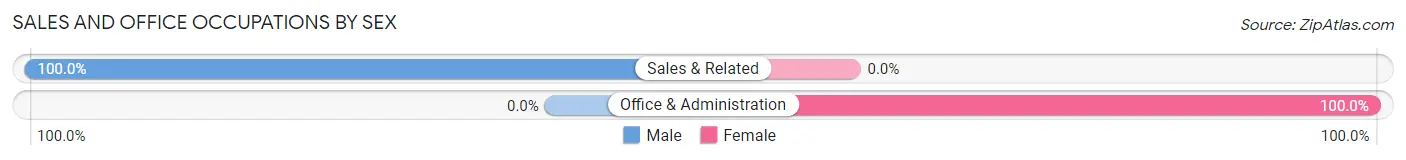
| Occupation | Male | Female |
| Sales & Related | 26 (100.0%) | 0 (0.0%) |
| Office & Administration | 0 (0.0%) | 21 (100.0%) |
| Total (Category) | 26 (55.3%) | 21 (44.7%) |
| Total (Overall) | 120 (67.4%) | 58 (32.6%) |
Natural Resources, Construction and Maintenance Occupations
The most common Natural Resources, Construction and Maintenance occupations in Lafitte are , and Construction & Extraction (41 | 23.0%).
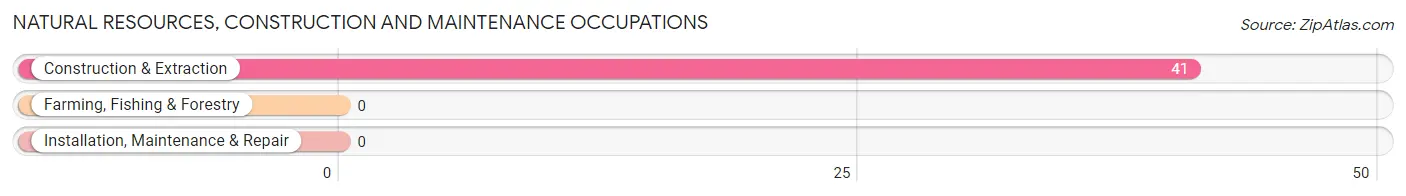
Natural Resources, Construction and Maintenance Occupations by Sex
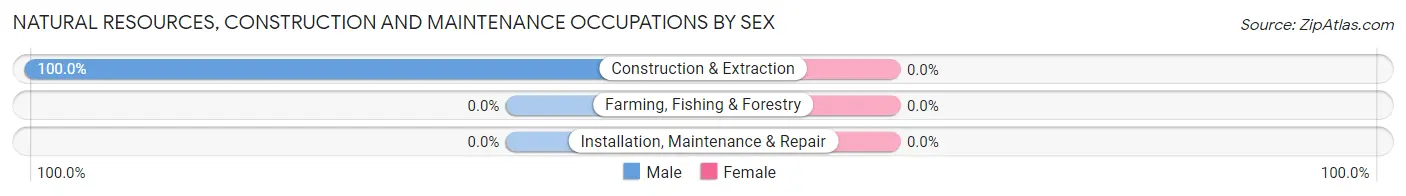
| Occupation | Male | Female |
| Farming, Fishing & Forestry | 0 (0.0%) | 0 (0.0%) |
| Construction & Extraction | 41 (100.0%) | 0 (0.0%) |
| Installation, Maintenance & Repair | 0 (0.0%) | 0 (0.0%) |
| Total (Category) | 41 (100.0%) | 0 (0.0%) |
| Total (Overall) | 120 (67.4%) | 58 (32.6%) |
Production, Transportation and Moving Occupations
The most common Production, Transportation and Moving occupations in Lafitte are , and Production (13 | 7.3%).
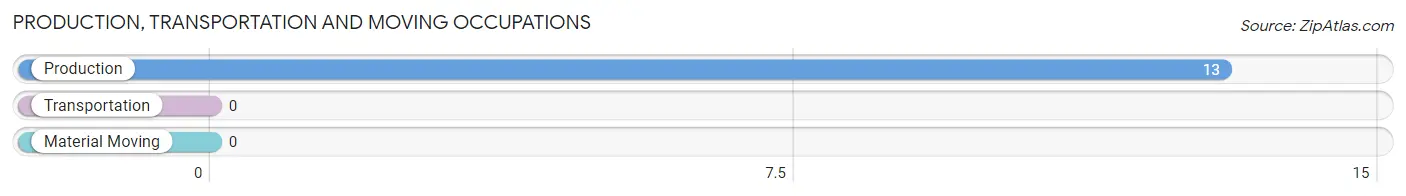
Production, Transportation and Moving Occupations by Sex
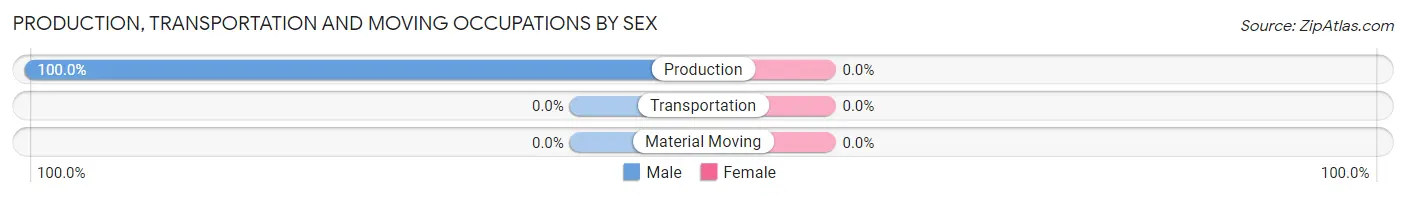
| Occupation | Male | Female |
| Production | 13 (100.0%) | 0 (0.0%) |
| Transportation | 0 (0.0%) | 0 (0.0%) |
| Material Moving | 0 (0.0%) | 0 (0.0%) |
| Total (Category) | 13 (100.0%) | 0 (0.0%) |
| Total (Overall) | 120 (67.4%) | 58 (32.6%) |
Employment Industries by Sex in Lafitte
Employment Industries in Lafitte
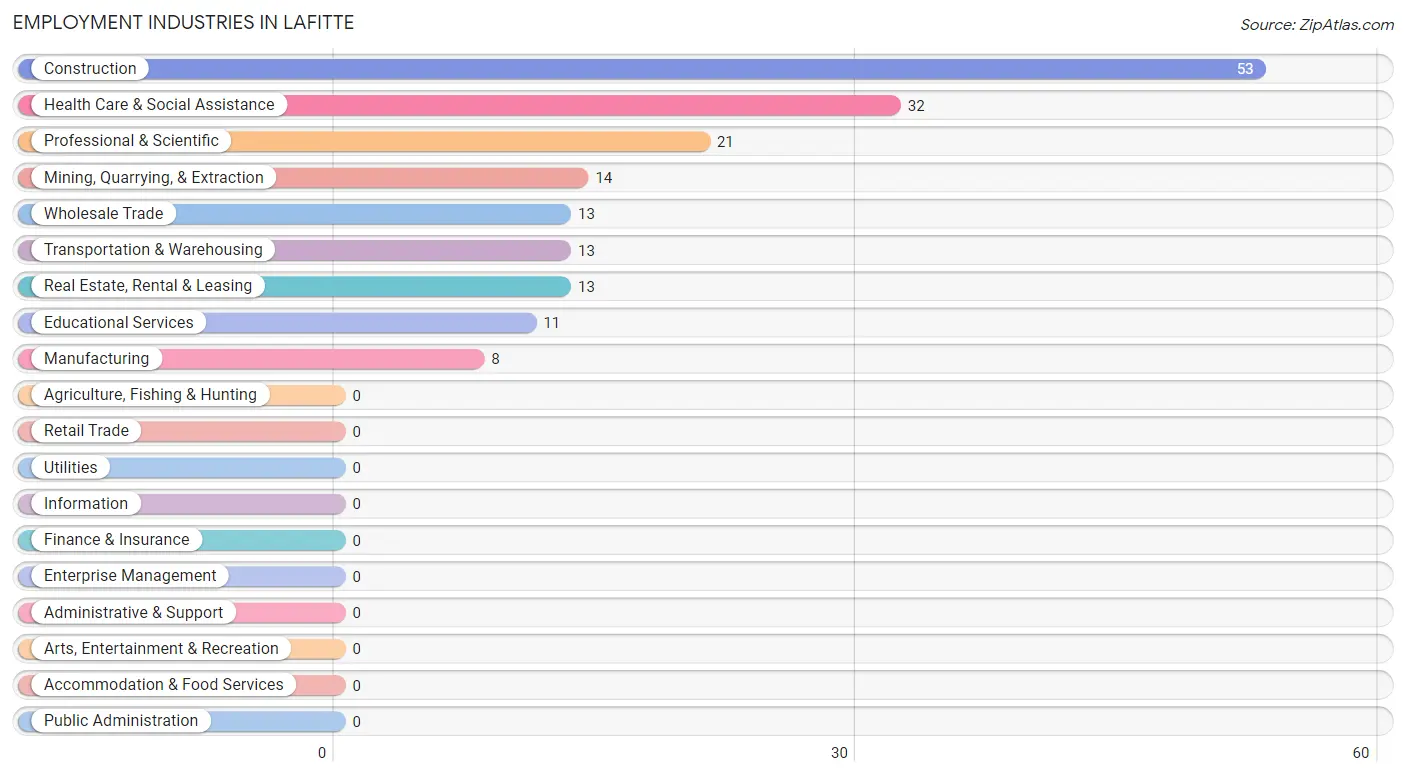
The major employment industries in Lafitte include Construction (53 | 29.8%), Health Care & Social Assistance (32 | 18.0%), Professional & Scientific (21 | 11.8%), Mining, Quarrying, & Extraction (14 | 7.9%), and Wholesale Trade (13 | 7.3%).
Employment Industries by Sex in Lafitte
The Lafitte industries that see more men than women are Construction (100.0%), Manufacturing (100.0%), and Wholesale Trade (100.0%), whereas the industries that tend to have a higher number of women are Mining, Quarrying, & Extraction (100.0%), Professional & Scientific (100.0%), and Educational Services (100.0%).
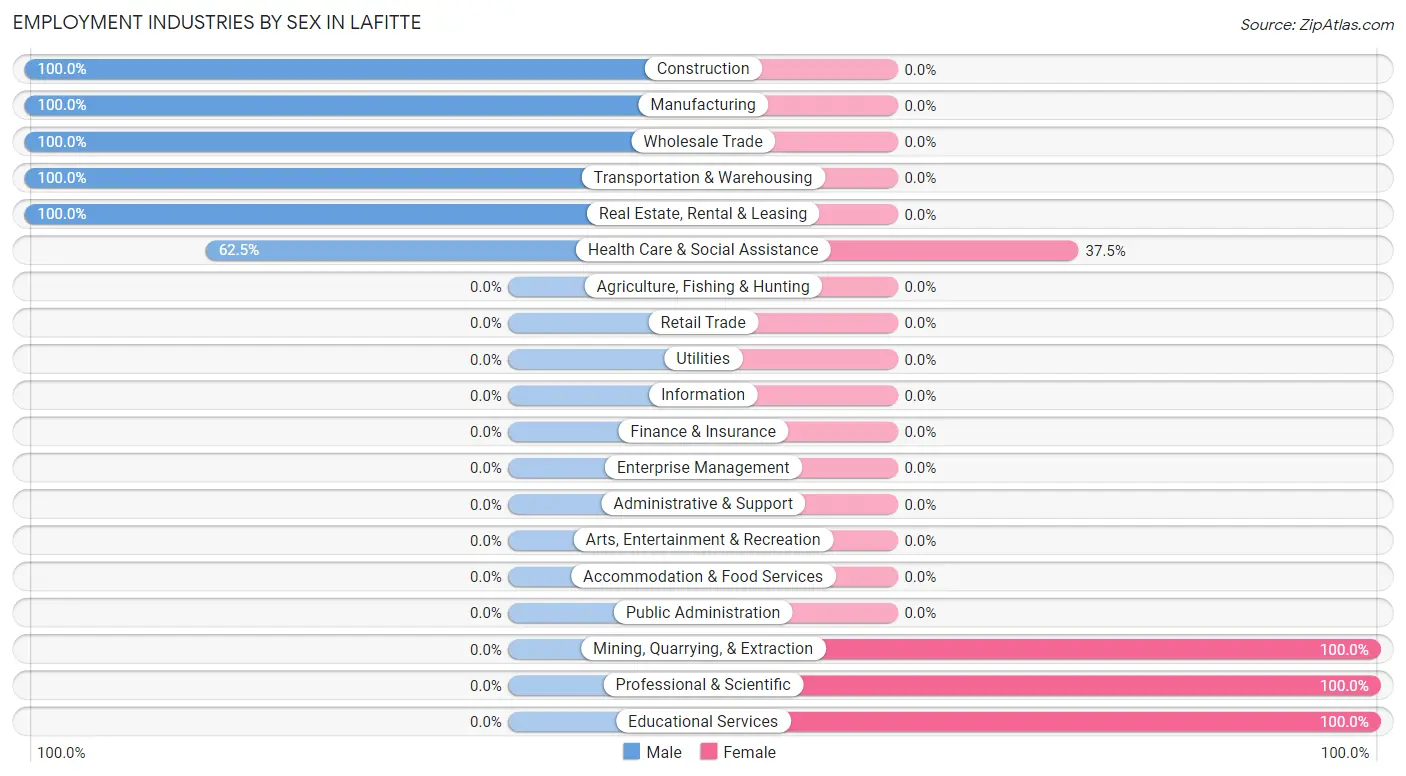
| Industry | Male | Female |
| Agriculture, Fishing & Hunting | 0 (0.0%) | 0 (0.0%) |
| Mining, Quarrying, & Extraction | 0 (0.0%) | 14 (100.0%) |
| Construction | 53 (100.0%) | 0 (0.0%) |
| Manufacturing | 8 (100.0%) | 0 (0.0%) |
| Wholesale Trade | 13 (100.0%) | 0 (0.0%) |
| Retail Trade | 0 (0.0%) | 0 (0.0%) |
| Transportation & Warehousing | 13 (100.0%) | 0 (0.0%) |
| Utilities | 0 (0.0%) | 0 (0.0%) |
| Information | 0 (0.0%) | 0 (0.0%) |
| Finance & Insurance | 0 (0.0%) | 0 (0.0%) |
| Real Estate, Rental & Leasing | 13 (100.0%) | 0 (0.0%) |
| Professional & Scientific | 0 (0.0%) | 21 (100.0%) |
| Enterprise Management | 0 (0.0%) | 0 (0.0%) |
| Administrative & Support | 0 (0.0%) | 0 (0.0%) |
| Educational Services | 0 (0.0%) | 11 (100.0%) |
| Health Care & Social Assistance | 20 (62.5%) | 12 (37.5%) |
| Arts, Entertainment & Recreation | 0 (0.0%) | 0 (0.0%) |
| Accommodation & Food Services | 0 (0.0%) | 0 (0.0%) |
| Public Administration | 0 (0.0%) | 0 (0.0%) |
| Total | 120 (67.4%) | 58 (32.6%) |
Education in Lafitte
School Enrollment in Lafitte
The most common levels of schooling among the 154 students in Lafitte are middle school (67 | 43.5%), high school (58 | 37.7%), and elementary school (17 | 11.0%).
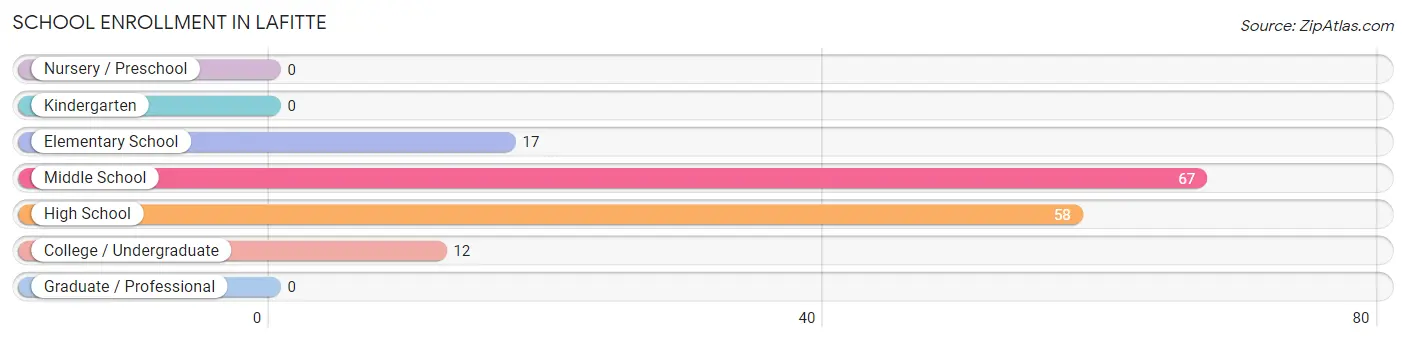
| School Level | # Students | % Students |
| Nursery / Preschool | 0 | 0.0% |
| Kindergarten | 0 | 0.0% |
| Elementary School | 17 | 11.0% |
| Middle School | 67 | 43.5% |
| High School | 58 | 37.7% |
| College / Undergraduate | 12 | 7.8% |
| Graduate / Professional | 0 | 0.0% |
| Total | 154 | 100.0% |
School Enrollment by Age by Funding Source in Lafitte
Out of a total of 154 students who are enrolled in schools in Lafitte, 15 (9.7%) attend a private institution, while the remaining 139 (90.3%) are enrolled in public schools. The age group of 15 to 17 year olds has the highest likelihood of being enrolled in private schools, with 15 (25.9% in the age bracket) enrolled. Conversely, the age group of 5 to 9 year old has the lowest likelihood of being enrolled in a private school, with 17 (100.0% in the age bracket) attending a public institution.
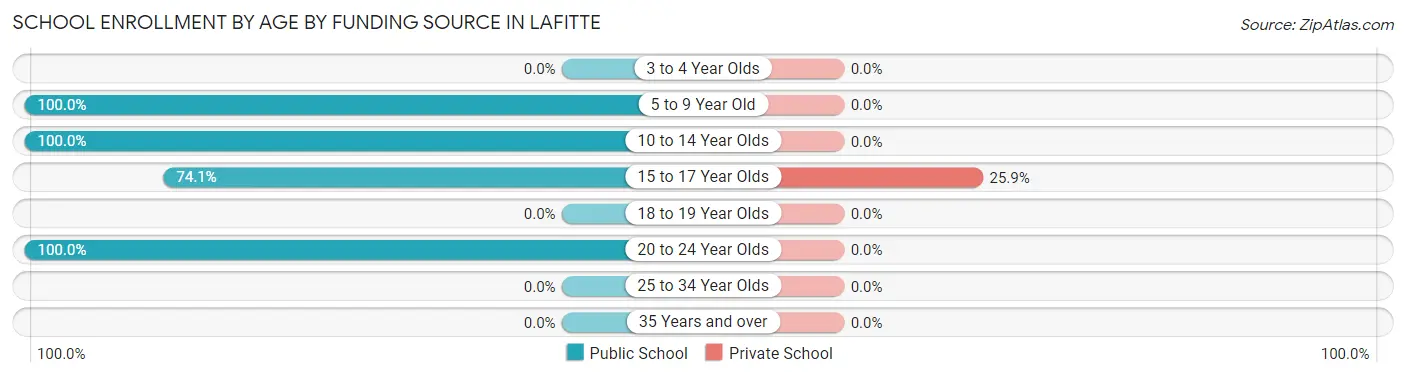
| Age Bracket | Public School | Private School |
| 3 to 4 Year Olds | 0 (0.0%) | 0 (0.0%) |
| 5 to 9 Year Old | 17 (100.0%) | 0 (0.0%) |
| 10 to 14 Year Olds | 67 (100.0%) | 0 (0.0%) |
| 15 to 17 Year Olds | 43 (74.1%) | 15 (25.9%) |
| 18 to 19 Year Olds | 0 (0.0%) | 0 (0.0%) |
| 20 to 24 Year Olds | 12 (100.0%) | 0 (0.0%) |
| 25 to 34 Year Olds | 0 (0.0%) | 0 (0.0%) |
| 35 Years and over | 0 (0.0%) | 0 (0.0%) |
| Total | 139 (90.3%) | 15 (9.7%) |
Educational Attainment by Field of Study in Lafitte
Science & technology (33 | 43.4%), business (15 | 19.7%), social sciences (12 | 15.8%), education (11 | 14.5%), and psychology (5 | 6.6%) are the most common fields of study among 76 individuals in Lafitte who have obtained a bachelor's degree or higher.
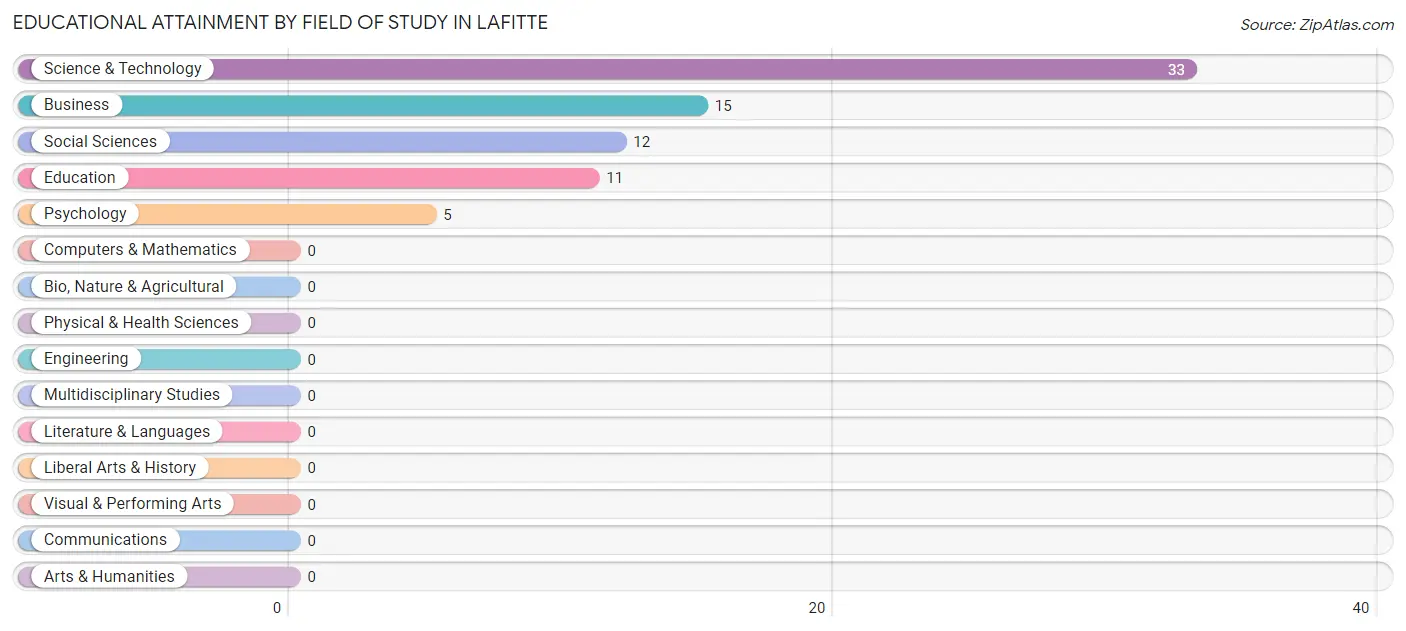
| Field of Study | # Graduates | % Graduates |
| Computers & Mathematics | 0 | 0.0% |
| Bio, Nature & Agricultural | 0 | 0.0% |
| Physical & Health Sciences | 0 | 0.0% |
| Psychology | 5 | 6.6% |
| Social Sciences | 12 | 15.8% |
| Engineering | 0 | 0.0% |
| Multidisciplinary Studies | 0 | 0.0% |
| Science & Technology | 33 | 43.4% |
| Business | 15 | 19.7% |
| Education | 11 | 14.5% |
| Literature & Languages | 0 | 0.0% |
| Liberal Arts & History | 0 | 0.0% |
| Visual & Performing Arts | 0 | 0.0% |
| Communications | 0 | 0.0% |
| Arts & Humanities | 0 | 0.0% |
| Total | 76 | 100.0% |
Transportation & Commute in Lafitte
Vehicle Availability by Sex in Lafitte
The most prevalent vehicle ownership categories in Lafitte are males with 2 vehicles (56, accounting for 46.7%) and females with 2 vehicles (35, making up 96.6%).
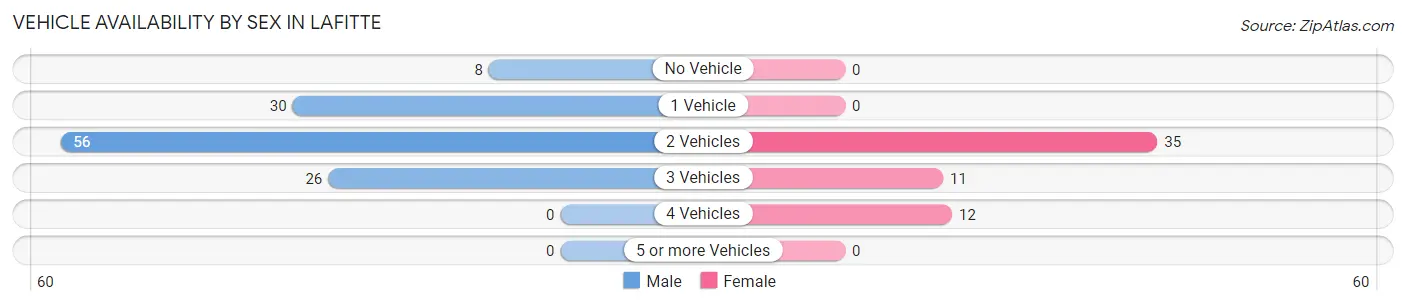
| Vehicles Available | Male | Female |
| No Vehicle | 8 (6.7%) | 0 (0.0%) |
| 1 Vehicle | 30 (25.0%) | 0 (0.0%) |
| 2 Vehicles | 56 (46.7%) | 35 (60.3%) |
| 3 Vehicles | 26 (21.7%) | 11 (19.0%) |
| 4 Vehicles | 0 (0.0%) | 12 (20.7%) |
| 5 or more Vehicles | 0 (0.0%) | 0 (0.0%) |
| Total | 120 (100.0%) | 58 (100.0%) |
Commute Time in Lafitte
The most frequently occuring commute durations in Lafitte are 40 to 44 minutes (25 commuters, 15.9%), 30 to 34 minutes (23 commuters, 14.6%), and 20 to 24 minutes (20 commuters, 12.7%).
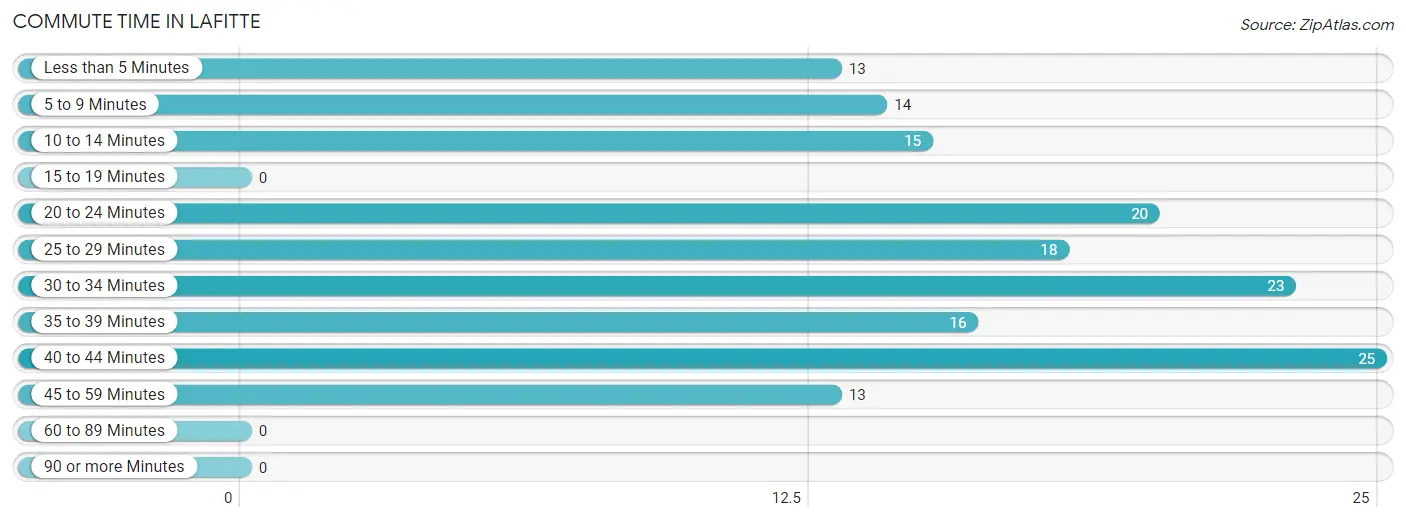
| Commute Time | # Commuters | % Commuters |
| Less than 5 Minutes | 13 | 8.3% |
| 5 to 9 Minutes | 14 | 8.9% |
| 10 to 14 Minutes | 15 | 9.6% |
| 15 to 19 Minutes | 0 | 0.0% |
| 20 to 24 Minutes | 20 | 12.7% |
| 25 to 29 Minutes | 18 | 11.5% |
| 30 to 34 Minutes | 23 | 14.6% |
| 35 to 39 Minutes | 16 | 10.2% |
| 40 to 44 Minutes | 25 | 15.9% |
| 45 to 59 Minutes | 13 | 8.3% |
| 60 to 89 Minutes | 0 | 0.0% |
| 90 or more Minutes | 0 | 0.0% |
Commute Time by Sex in Lafitte
The most common commute times in Lafitte are 40 to 44 minutes (25 commuters, 20.8%) for males and 5 to 9 minutes (14 commuters, 37.8%) for females.
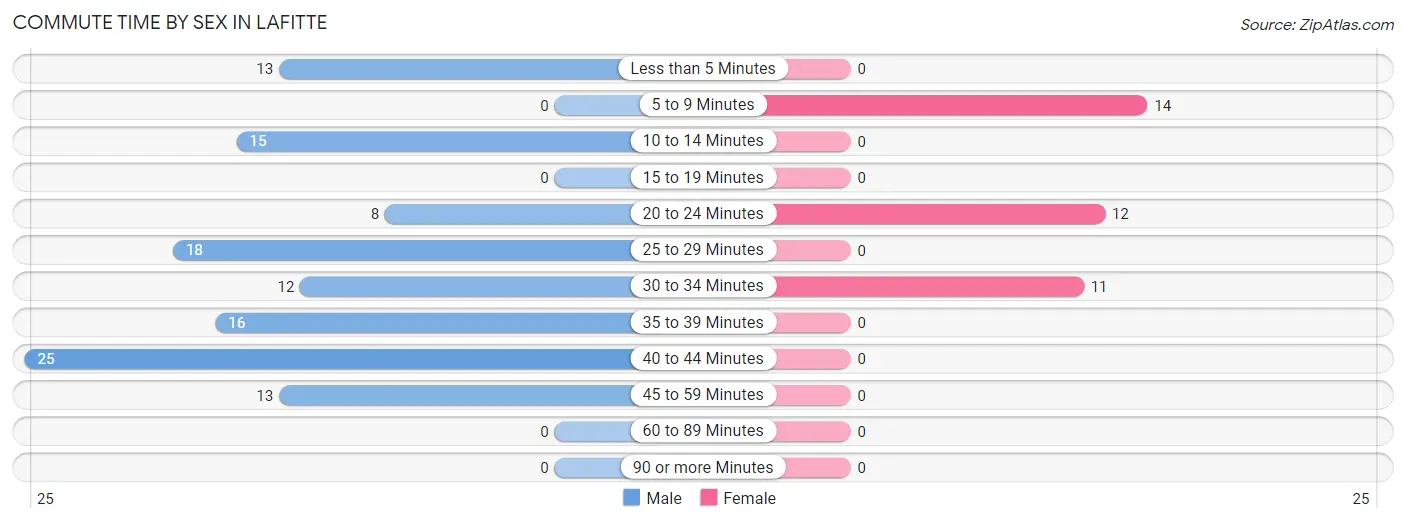
| Commute Time | Male | Female |
| Less than 5 Minutes | 13 (10.8%) | 0 (0.0%) |
| 5 to 9 Minutes | 0 (0.0%) | 14 (37.8%) |
| 10 to 14 Minutes | 15 (12.5%) | 0 (0.0%) |
| 15 to 19 Minutes | 0 (0.0%) | 0 (0.0%) |
| 20 to 24 Minutes | 8 (6.7%) | 12 (32.4%) |
| 25 to 29 Minutes | 18 (15.0%) | 0 (0.0%) |
| 30 to 34 Minutes | 12 (10.0%) | 11 (29.7%) |
| 35 to 39 Minutes | 16 (13.3%) | 0 (0.0%) |
| 40 to 44 Minutes | 25 (20.8%) | 0 (0.0%) |
| 45 to 59 Minutes | 13 (10.8%) | 0 (0.0%) |
| 60 to 89 Minutes | 0 (0.0%) | 0 (0.0%) |
| 90 or more Minutes | 0 (0.0%) | 0 (0.0%) |
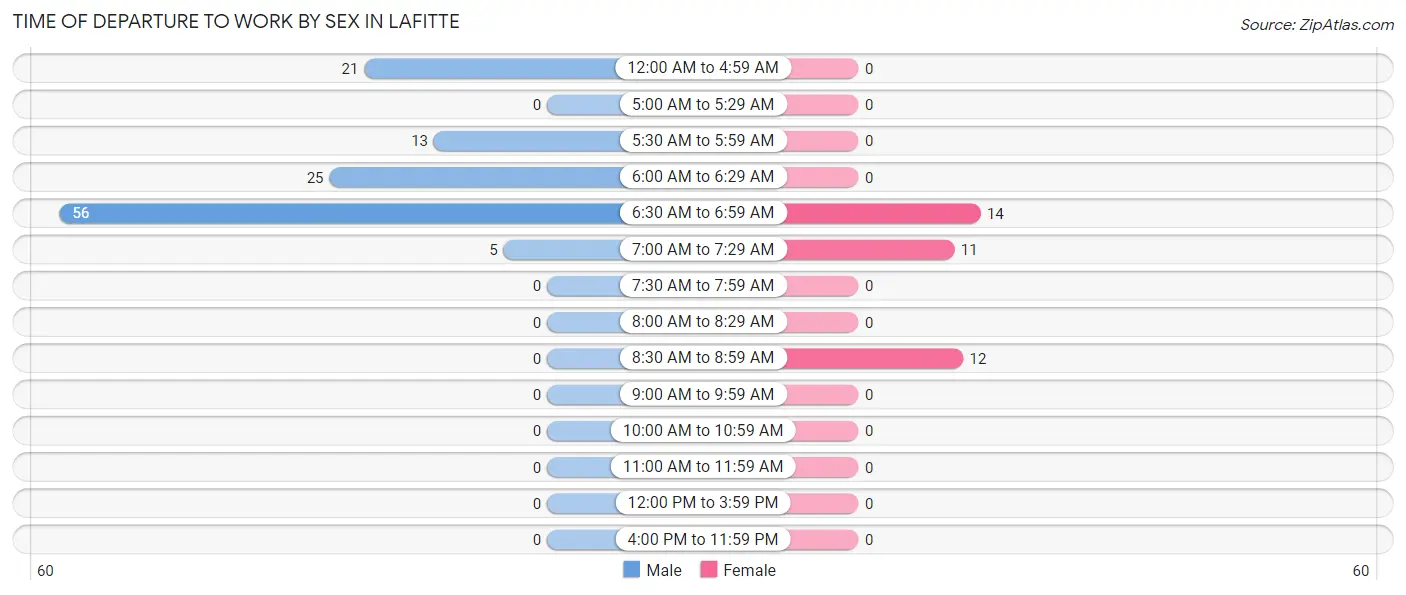
Time of Departure to Work by Sex in Lafitte
The most frequent times of departure to work in Lafitte are 6:30 AM to 6:59 AM (56, 46.7%) for males and 6:30 AM to 6:59 AM (14, 37.8%) for females.
| Time of Departure | Male | Female |
| 12:00 AM to 4:59 AM | 21 (17.5%) | 0 (0.0%) |
| 5:00 AM to 5:29 AM | 0 (0.0%) | 0 (0.0%) |
| 5:30 AM to 5:59 AM | 13 (10.8%) | 0 (0.0%) |
| 6:00 AM to 6:29 AM | 25 (20.8%) | 0 (0.0%) |
| 6:30 AM to 6:59 AM | 56 (46.7%) | 14 (37.8%) |
| 7:00 AM to 7:29 AM | 5 (4.2%) | 11 (29.7%) |
| 7:30 AM to 7:59 AM | 0 (0.0%) | 0 (0.0%) |
| 8:00 AM to 8:29 AM | 0 (0.0%) | 0 (0.0%) |
| 8:30 AM to 8:59 AM | 0 (0.0%) | 12 (32.4%) |
| 9:00 AM to 9:59 AM | 0 (0.0%) | 0 (0.0%) |
| 10:00 AM to 10:59 AM | 0 (0.0%) | 0 (0.0%) |
| 11:00 AM to 11:59 AM | 0 (0.0%) | 0 (0.0%) |
| 12:00 PM to 3:59 PM | 0 (0.0%) | 0 (0.0%) |
| 4:00 PM to 11:59 PM | 0 (0.0%) | 0 (0.0%) |
| Total | 120 (100.0%) | 37 (100.0%) |
Housing Occupancy in Lafitte
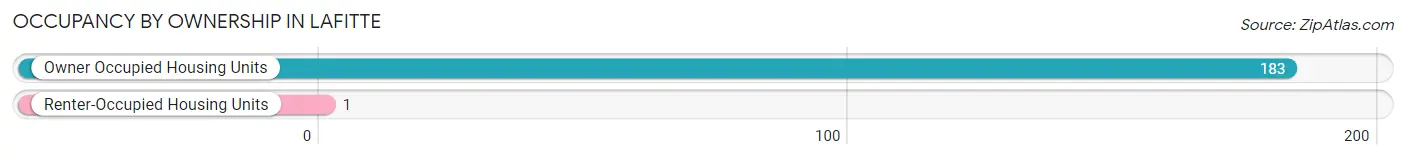
Occupancy by Ownership in Lafitte
Of the total 184 dwellings in Lafitte, owner-occupied units account for 183 (99.5%), while renter-occupied units make up 1 (0.5%).
| Occupancy | # Housing Units | % Housing Units |
| Owner Occupied Housing Units | 183 | 99.5% |
| Renter-Occupied Housing Units | 1 | 0.5% |
| Total Occupied Housing Units | 184 | 100.0% |
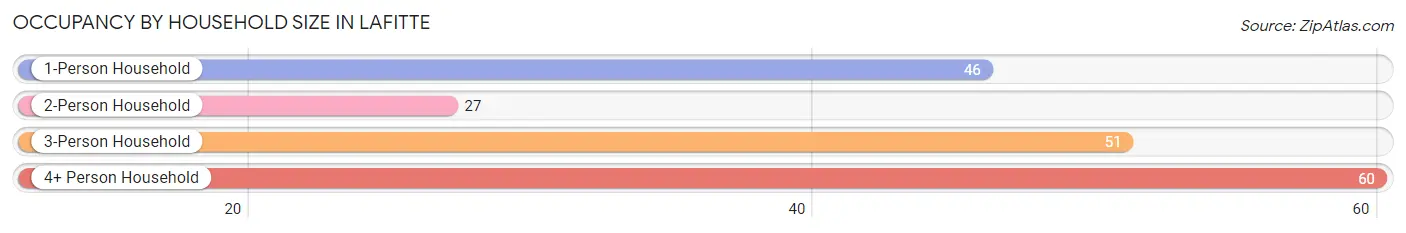
Occupancy by Household Size in Lafitte
| Household Size | # Housing Units | % Housing Units |
| 1-Person Household | 46 | 25.0% |
| 2-Person Household | 27 | 14.7% |
| 3-Person Household | 51 | 27.7% |
| 4+ Person Household | 60 | 32.6% |
| Total Housing Units | 184 | 100.0% |
Occupancy by Ownership by Household Size in Lafitte
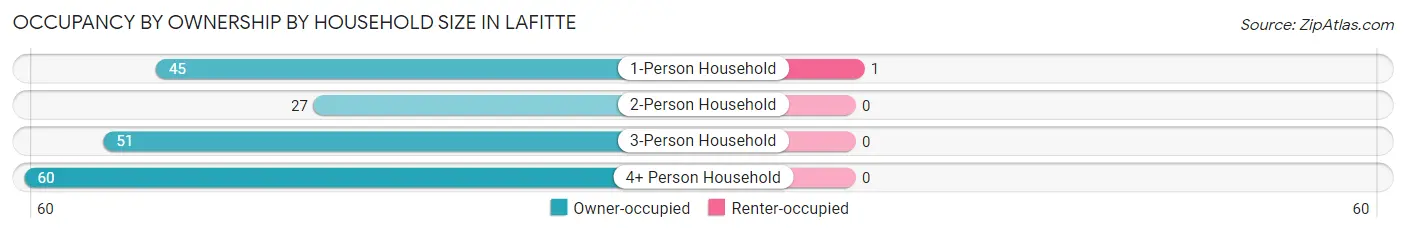
| Household Size | Owner-occupied | Renter-occupied |
| 1-Person Household | 45 (97.8%) | 1 (2.2%) |
| 2-Person Household | 27 (100.0%) | 0 (0.0%) |
| 3-Person Household | 51 (100.0%) | 0 (0.0%) |
| 4+ Person Household | 60 (100.0%) | 0 (0.0%) |
| Total Housing Units | 183 (99.5%) | 1 (0.5%) |
Occupancy by Educational Attainment in Lafitte
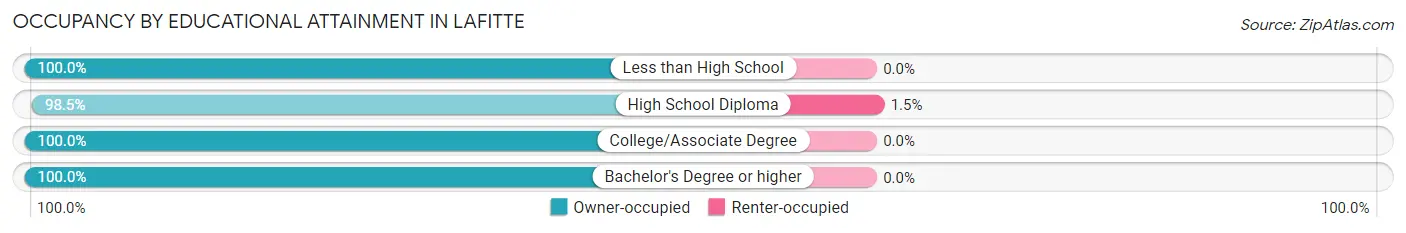
| Household Size | Owner-occupied | Renter-occupied |
| Less than High School | 8 (100.0%) | 0 (0.0%) |
| High School Diploma | 66 (98.5%) | 1 (1.5%) |
| College/Associate Degree | 45 (100.0%) | 0 (0.0%) |
| Bachelor's Degree or higher | 64 (100.0%) | 0 (0.0%) |
Occupancy by Age of Householder in Lafitte
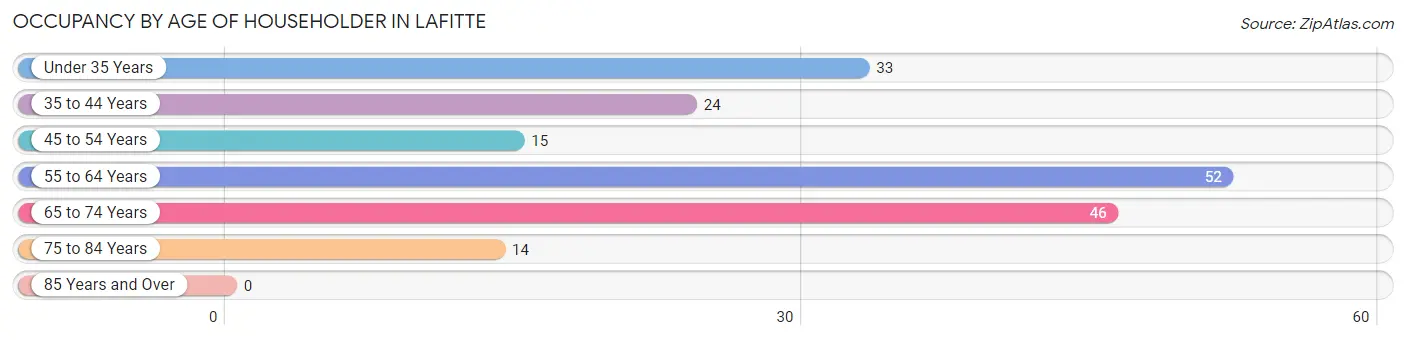
| Age Bracket | # Households | % Households |
| Under 35 Years | 33 | 17.9% |
| 35 to 44 Years | 24 | 13.0% |
| 45 to 54 Years | 15 | 8.2% |
| 55 to 64 Years | 52 | 28.3% |
| 65 to 74 Years | 46 | 25.0% |
| 75 to 84 Years | 14 | 7.6% |
| 85 Years and Over | 0 | 0.0% |
| Total | 184 | 100.0% |
Housing Finances in Lafitte
Median Income by Occupancy in Lafitte
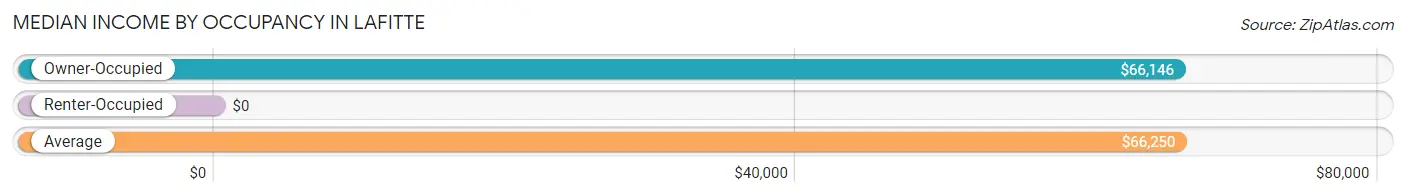
| Occupancy Type | # Households | Median Income |
| Owner-Occupied | 183 (99.5%) | $66,146 |
| Renter-Occupied | 1 (0.5%) | $0 |
| Average | 184 (100.0%) | $66,250 |
Occupancy by Householder Income Bracket in Lafitte
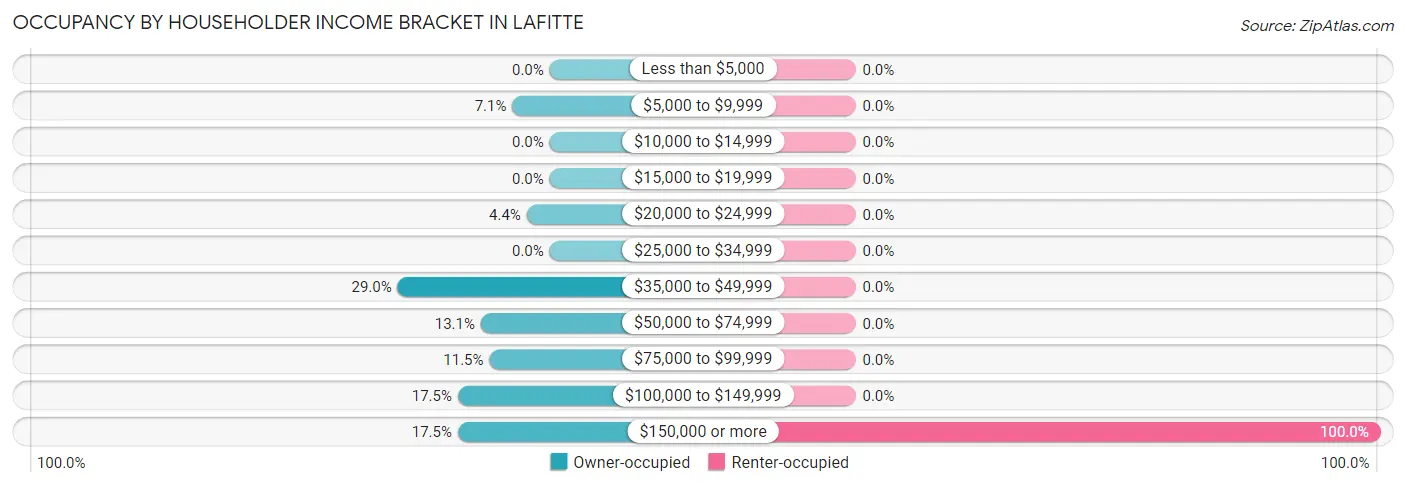
| Income Bracket | Owner-occupied | Renter-occupied |
| Less than $5,000 | 0 (0.0%) | 0 (0.0%) |
| $5,000 to $9,999 | 13 (7.1%) | 0 (0.0%) |
| $10,000 to $14,999 | 0 (0.0%) | 0 (0.0%) |
| $15,000 to $19,999 | 0 (0.0%) | 0 (0.0%) |
| $20,000 to $24,999 | 8 (4.4%) | 0 (0.0%) |
| $25,000 to $34,999 | 0 (0.0%) | 0 (0.0%) |
| $35,000 to $49,999 | 53 (29.0%) | 0 (0.0%) |
| $50,000 to $74,999 | 24 (13.1%) | 0 (0.0%) |
| $75,000 to $99,999 | 21 (11.5%) | 0 (0.0%) |
| $100,000 to $149,999 | 32 (17.5%) | 0 (0.0%) |
| $150,000 or more | 32 (17.5%) | 1 (100.0%) |
| Total | 183 (100.0%) | 1 (100.0%) |
Monthly Housing Cost Tiers in Lafitte
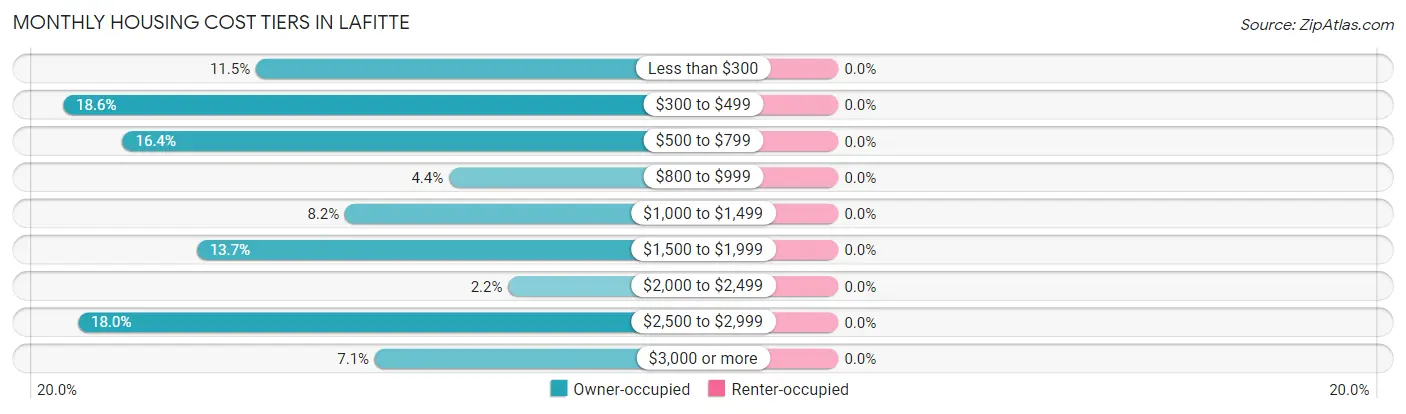
| Monthly Cost | Owner-occupied | Renter-occupied |
| Less than $300 | 21 (11.5%) | 0 (0.0%) |
| $300 to $499 | 34 (18.6%) | 0 (0.0%) |
| $500 to $799 | 30 (16.4%) | 0 (0.0%) |
| $800 to $999 | 8 (4.4%) | 0 (0.0%) |
| $1,000 to $1,499 | 15 (8.2%) | 0 (0.0%) |
| $1,500 to $1,999 | 25 (13.7%) | 0 (0.0%) |
| $2,000 to $2,499 | 4 (2.2%) | 0 (0.0%) |
| $2,500 to $2,999 | 33 (18.0%) | 0 (0.0%) |
| $3,000 or more | 13 (7.1%) | 0 (0.0%) |
| Total | 183 (100.0%) | 1 (100.0%) |
Physical Housing Characteristics in Lafitte
Housing Structures in Lafitte
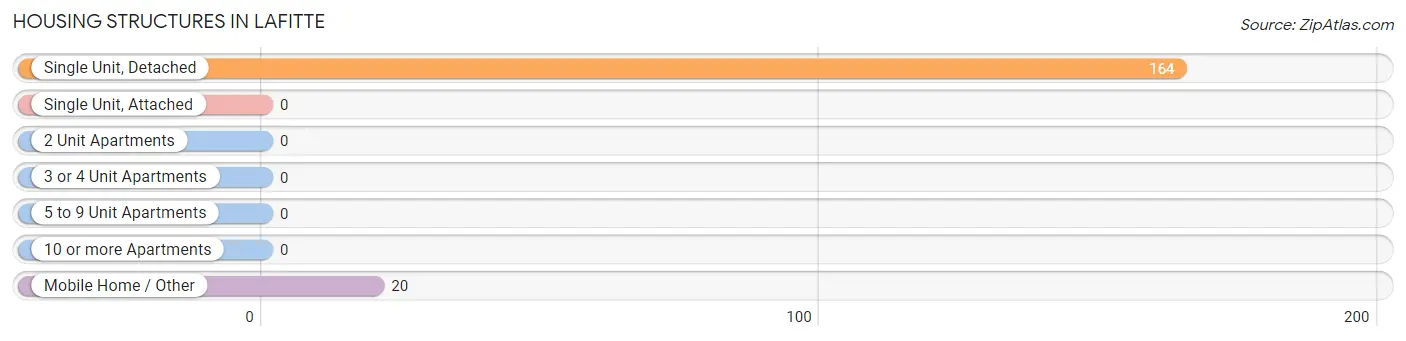
| Structure Type | # Housing Units | % Housing Units |
| Single Unit, Detached | 164 | 89.1% |
| Single Unit, Attached | 0 | 0.0% |
| 2 Unit Apartments | 0 | 0.0% |
| 3 or 4 Unit Apartments | 0 | 0.0% |
| 5 to 9 Unit Apartments | 0 | 0.0% |
| 10 or more Apartments | 0 | 0.0% |
| Mobile Home / Other | 20 | 10.9% |
| Total | 184 | 100.0% |
Housing Structures by Occupancy in Lafitte
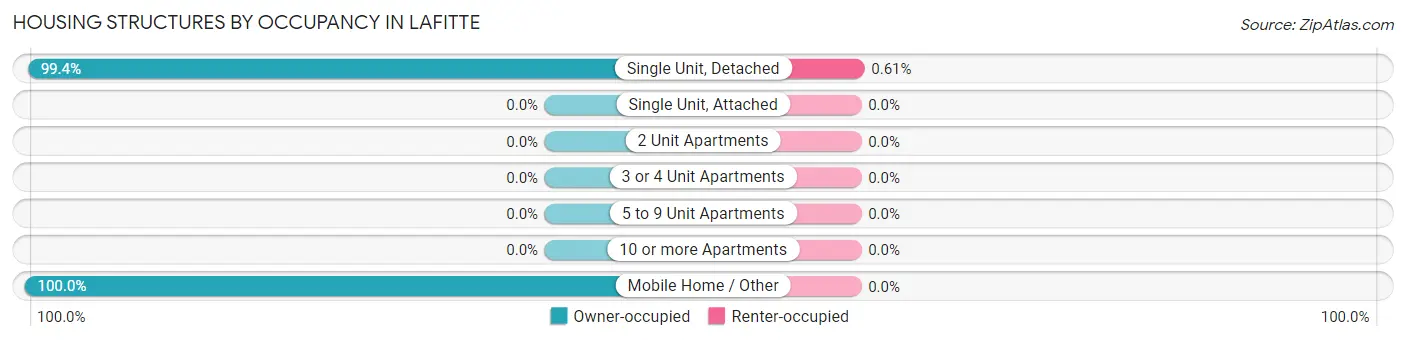
| Structure Type | Owner-occupied | Renter-occupied |
| Single Unit, Detached | 163 (99.4%) | 1 (0.6%) |
| Single Unit, Attached | 0 (0.0%) | 0 (0.0%) |
| 2 Unit Apartments | 0 (0.0%) | 0 (0.0%) |
| 3 or 4 Unit Apartments | 0 (0.0%) | 0 (0.0%) |
| 5 to 9 Unit Apartments | 0 (0.0%) | 0 (0.0%) |
| 10 or more Apartments | 0 (0.0%) | 0 (0.0%) |
| Mobile Home / Other | 20 (100.0%) | 0 (0.0%) |
| Total | 183 (99.5%) | 1 (0.5%) |
Housing Structures by Number of Rooms in Lafitte
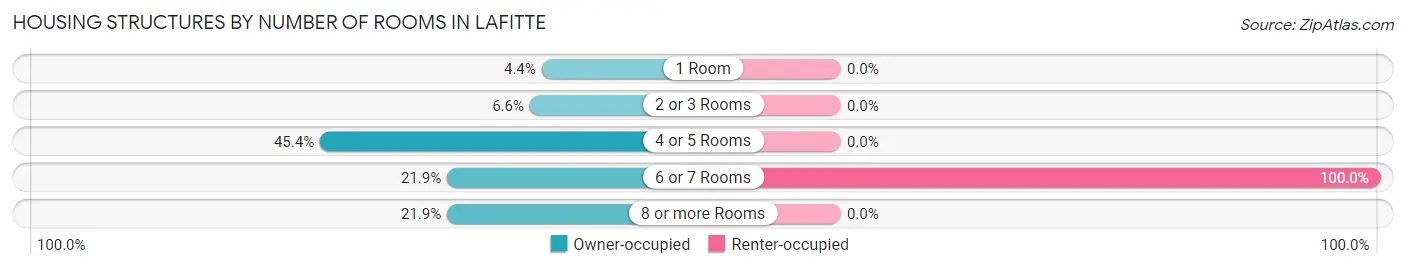
| Number of Rooms | Owner-occupied | Renter-occupied |
| 1 Room | 8 (4.4%) | 0 (0.0%) |
| 2 or 3 Rooms | 12 (6.6%) | 0 (0.0%) |
| 4 or 5 Rooms | 83 (45.4%) | 0 (0.0%) |
| 6 or 7 Rooms | 40 (21.9%) | 1 (100.0%) |
| 8 or more Rooms | 40 (21.9%) | 0 (0.0%) |
| Total | 183 (100.0%) | 1 (100.0%) |
Housing Structure by Heating Type in Lafitte
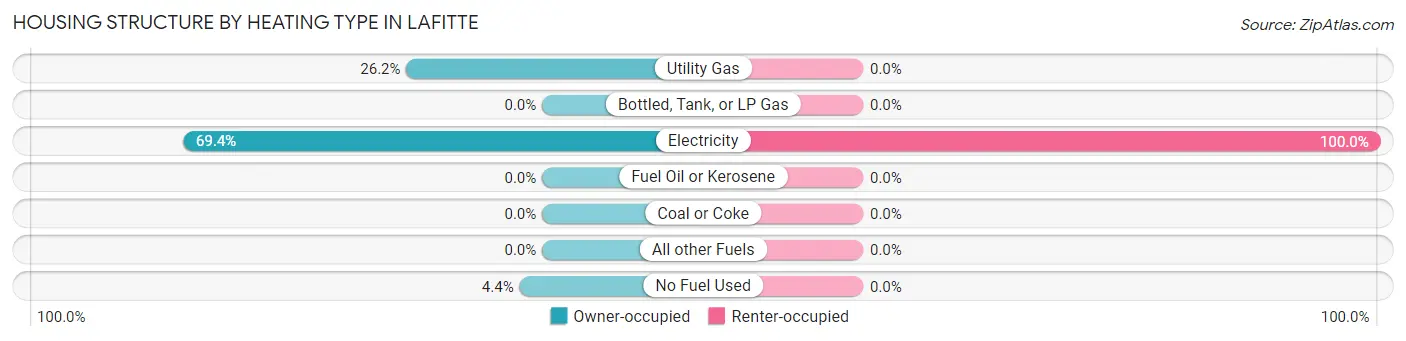
| Heating Type | Owner-occupied | Renter-occupied |
| Utility Gas | 48 (26.2%) | 0 (0.0%) |
| Bottled, Tank, or LP Gas | 0 (0.0%) | 0 (0.0%) |
| Electricity | 127 (69.4%) | 1 (100.0%) |
| Fuel Oil or Kerosene | 0 (0.0%) | 0 (0.0%) |
| Coal or Coke | 0 (0.0%) | 0 (0.0%) |
| All other Fuels | 0 (0.0%) | 0 (0.0%) |
| No Fuel Used | 8 (4.4%) | 0 (0.0%) |
| Total | 183 (100.0%) | 1 (100.0%) |
Household Vehicle Usage in Lafitte
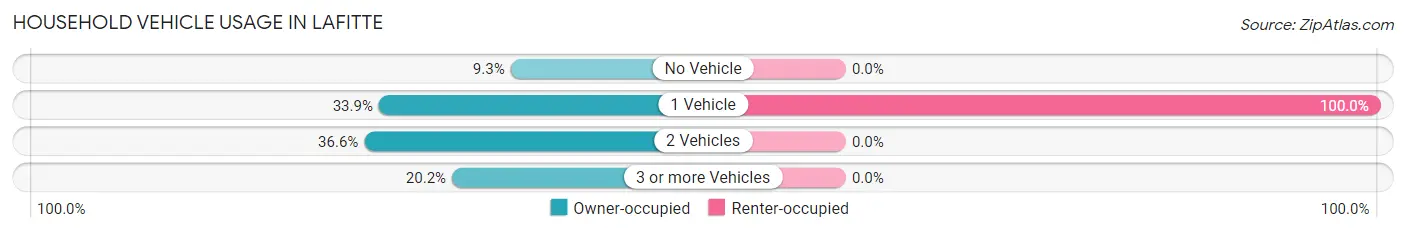
| Vehicles per Household | Owner-occupied | Renter-occupied |
| No Vehicle | 17 (9.3%) | 0 (0.0%) |
| 1 Vehicle | 62 (33.9%) | 1 (100.0%) |
| 2 Vehicles | 67 (36.6%) | 0 (0.0%) |
| 3 or more Vehicles | 37 (20.2%) | 0 (0.0%) |
| Total | 183 (100.0%) | 1 (100.0%) |
Real Estate & Mortgages in Lafitte
Real Estate and Mortgage Overview in Lafitte
| Characteristic | Without Mortgage | With Mortgage |
| Housing Units | 100 | 83 |
| Median Property Value | $218,800 | $334,000 |
| Median Household Income | $51,250 | $13 |
| Monthly Housing Costs | $477 | $13 |
| Real Estate Taxes | - | - |
Property Value by Mortgage Status in Lafitte
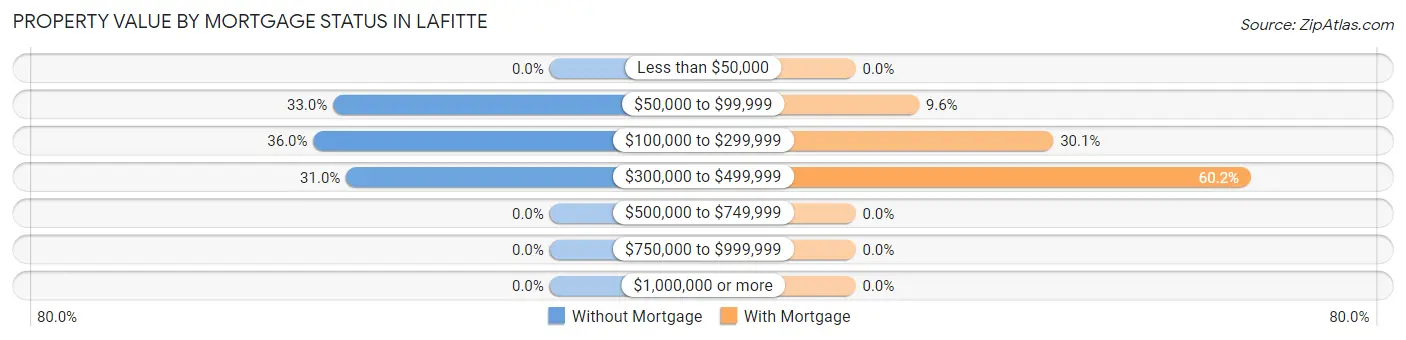
| Property Value | Without Mortgage | With Mortgage |
| Less than $50,000 | 0 (0.0%) | 0 (0.0%) |
| $50,000 to $99,999 | 33 (33.0%) | 8 (9.6%) |
| $100,000 to $299,999 | 36 (36.0%) | 25 (30.1%) |
| $300,000 to $499,999 | 31 (31.0%) | 50 (60.2%) |
| $500,000 to $749,999 | 0 (0.0%) | 0 (0.0%) |
| $750,000 to $999,999 | 0 (0.0%) | 0 (0.0%) |
| $1,000,000 or more | 0 (0.0%) | 0 (0.0%) |
| Total | 100 (100.0%) | 83 (100.0%) |
Household Income by Mortgage Status in Lafitte
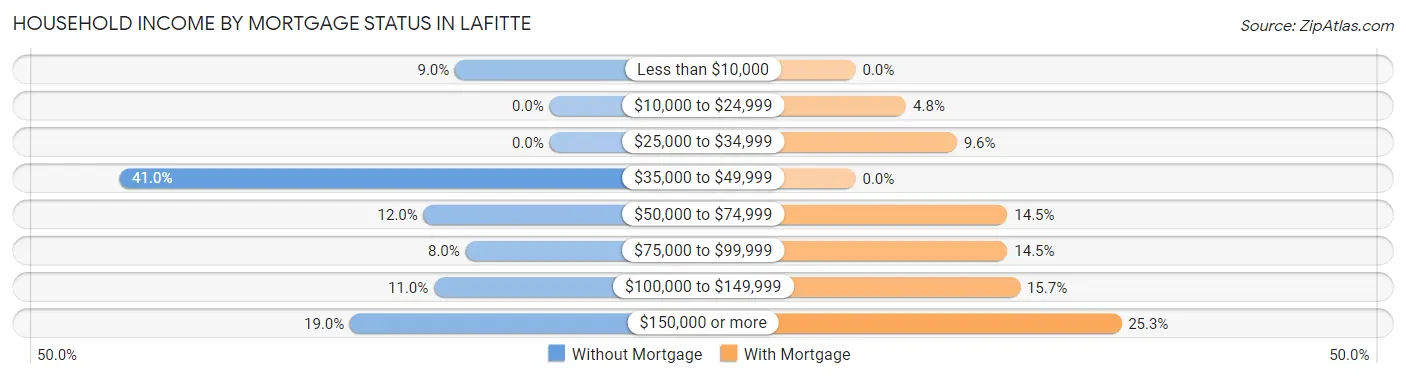
| Household Income | Without Mortgage | With Mortgage |
| Less than $10,000 | 9 (9.0%) | 0 (0.0%) |
| $10,000 to $24,999 | 0 (0.0%) | 4 (4.8%) |
| $25,000 to $34,999 | 0 (0.0%) | 8 (9.6%) |
| $35,000 to $49,999 | 41 (41.0%) | 0 (0.0%) |
| $50,000 to $74,999 | 12 (12.0%) | 12 (14.5%) |
| $75,000 to $99,999 | 8 (8.0%) | 12 (14.5%) |
| $100,000 to $149,999 | 11 (11.0%) | 13 (15.7%) |
| $150,000 or more | 19 (19.0%) | 21 (25.3%) |
| Total | 100 (100.0%) | 83 (100.0%) |
Property Value to Household Income Ratio in Lafitte
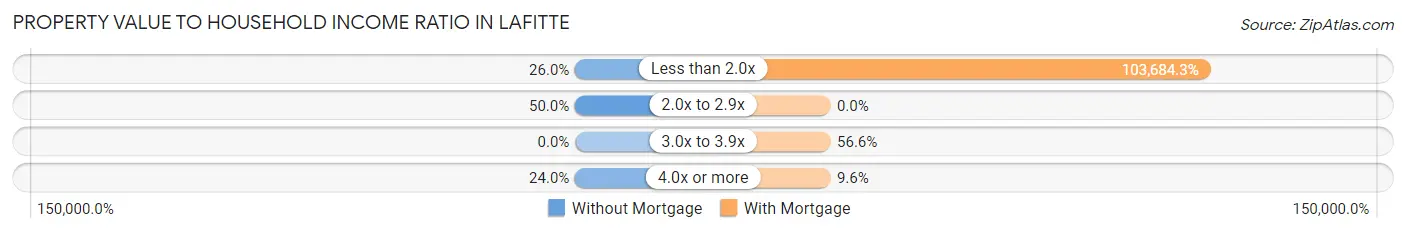
| Value-to-Income Ratio | Without Mortgage | With Mortgage |
| Less than 2.0x | 26 (26.0%) | 86,058 (103,684.3%) |
| 2.0x to 2.9x | 50 (50.0%) | 0 (0.0%) |
| 3.0x to 3.9x | 0 (0.0%) | 47 (56.6%) |
| 4.0x or more | 24 (24.0%) | 8 (9.6%) |
| Total | 100 (100.0%) | 83 (100.0%) |
Real Estate Taxes by Mortgage Status in Lafitte
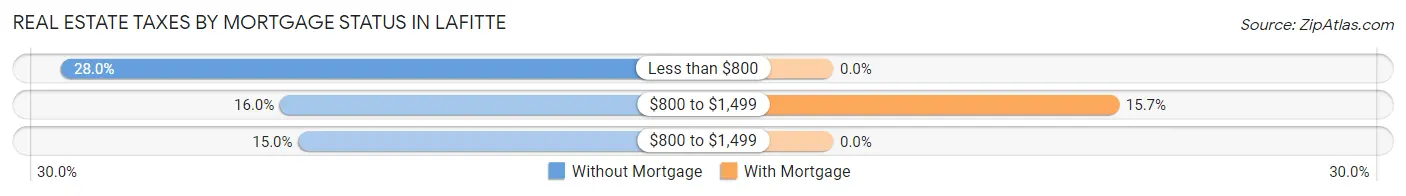
| Property Taxes | Without Mortgage | With Mortgage |
| Less than $800 | 28 (28.0%) | 0 (0.0%) |
| $800 to $1,499 | 16 (16.0%) | 13 (15.7%) |
| $800 to $1,499 | 15 (15.0%) | 0 (0.0%) |
| Total | 100 (100.0%) | 83 (100.0%) |
Health & Disability in Lafitte
Health Insurance Coverage by Age in Lafitte
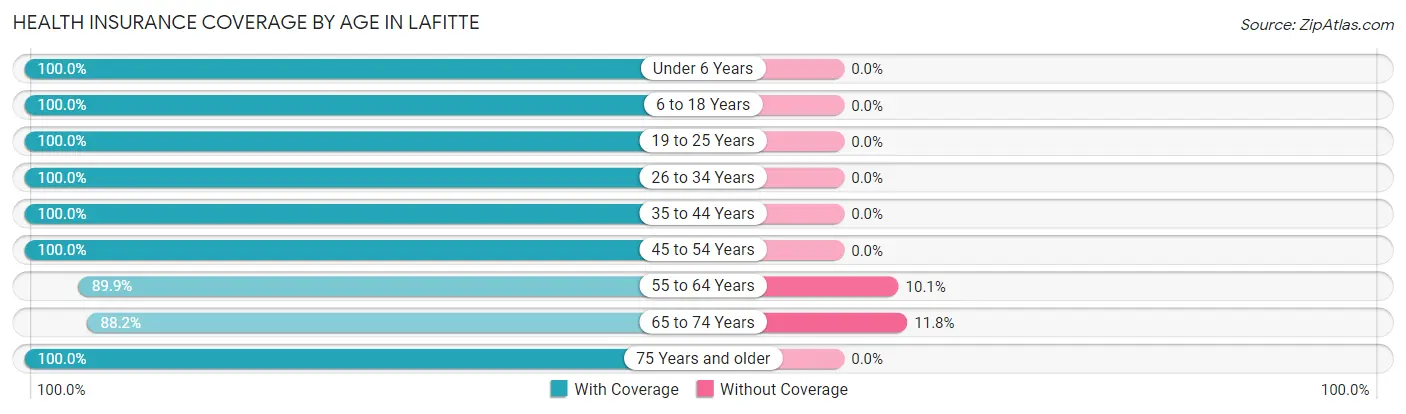
| Age Bracket | With Coverage | Without Coverage |
| Under 6 Years | 12 (100.0%) | 0 (0.0%) |
| 6 to 18 Years | 142 (100.0%) | 0 (0.0%) |
| 19 to 25 Years | 68 (100.0%) | 0 (0.0%) |
| 26 to 34 Years | 21 (100.0%) | 0 (0.0%) |
| 35 to 44 Years | 65 (100.0%) | 0 (0.0%) |
| 45 to 54 Years | 76 (100.0%) | 0 (0.0%) |
| 55 to 64 Years | 71 (89.9%) | 8 (10.1%) |
| 65 to 74 Years | 60 (88.2%) | 8 (11.8%) |
| 75 Years and older | 27 (100.0%) | 0 (0.0%) |
| Total | 542 (97.1%) | 16 (2.9%) |
Health Insurance Coverage by Citizenship Status in Lafitte
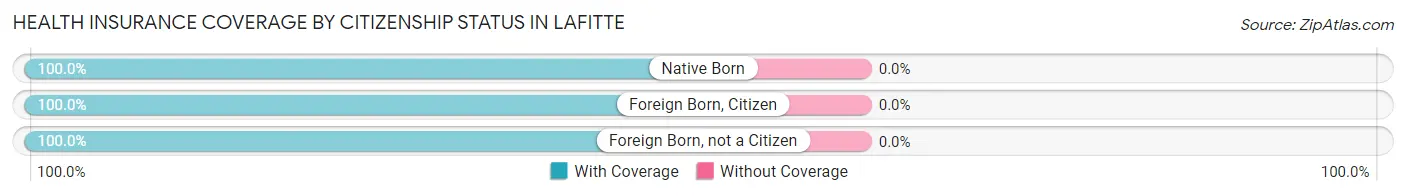
| Citizenship Status | With Coverage | Without Coverage |
| Native Born | 12 (100.0%) | 0 (0.0%) |
| Foreign Born, Citizen | 142 (100.0%) | 0 (0.0%) |
| Foreign Born, not a Citizen | 68 (100.0%) | 0 (0.0%) |
Health Insurance Coverage by Household Income in Lafitte
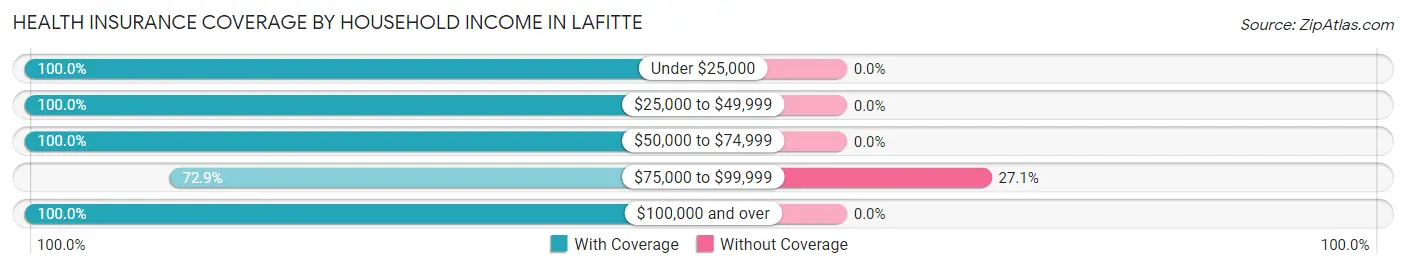
| Household Income | With Coverage | Without Coverage |
| Under $25,000 | 21 (100.0%) | 0 (0.0%) |
| $25,000 to $49,999 | 224 (100.0%) | 0 (0.0%) |
| $50,000 to $74,999 | 24 (100.0%) | 0 (0.0%) |
| $75,000 to $99,999 | 43 (72.9%) | 16 (27.1%) |
| $100,000 and over | 230 (100.0%) | 0 (0.0%) |
Public vs Private Health Insurance Coverage by Age in Lafitte
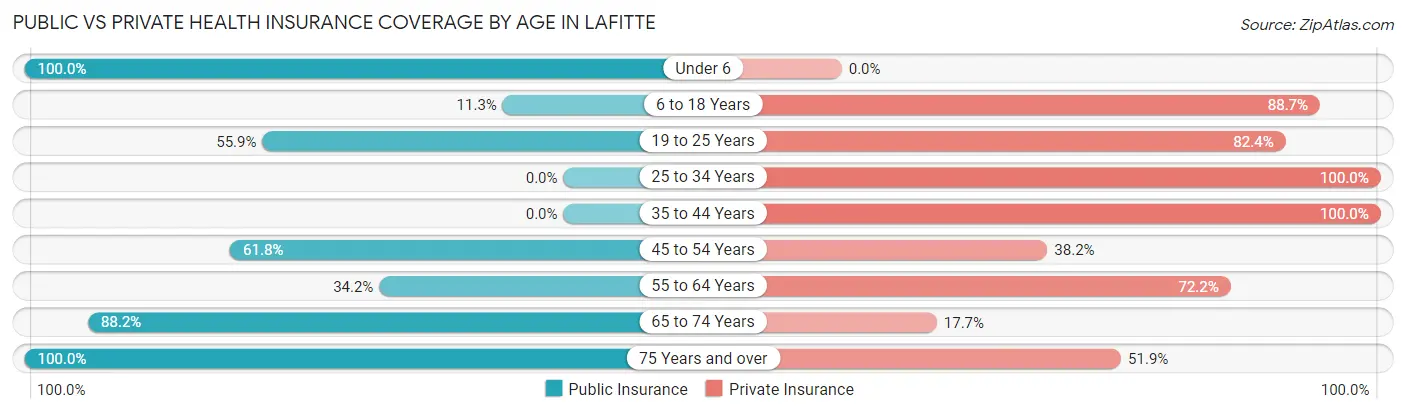
| Age Bracket | Public Insurance | Private Insurance |
| Under 6 | 12 (100.0%) | 0 (0.0%) |
| 6 to 18 Years | 16 (11.3%) | 126 (88.7%) |
| 19 to 25 Years | 38 (55.9%) | 56 (82.4%) |
| 25 to 34 Years | 0 (0.0%) | 21 (100.0%) |
| 35 to 44 Years | 0 (0.0%) | 65 (100.0%) |
| 45 to 54 Years | 47 (61.8%) | 29 (38.2%) |
| 55 to 64 Years | 27 (34.2%) | 57 (72.2%) |
| 65 to 74 Years | 60 (88.2%) | 12 (17.6%) |
| 75 Years and over | 27 (100.0%) | 14 (51.8%) |
| Total | 227 (40.7%) | 380 (68.1%) |
Disability Status by Sex by Age in Lafitte
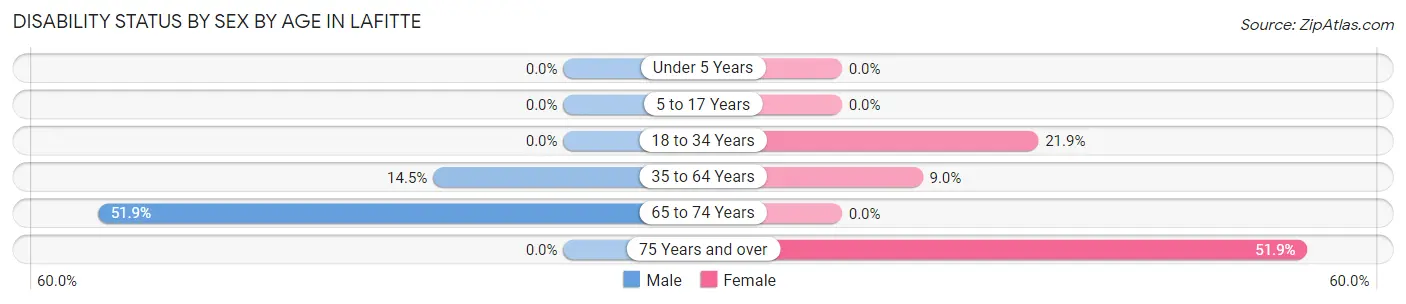
| Age Bracket | Male | Female |
| Under 5 Years | 0 (0.0%) | 0 (0.0%) |
| 5 to 17 Years | 0 (0.0%) | 0 (0.0%) |
| 18 to 34 Years | 0 (0.0%) | 14 (21.9%) |
| 35 to 64 Years | 19 (14.5%) | 8 (9.0%) |
| 65 to 74 Years | 28 (51.8%) | 0 (0.0%) |
| 75 Years and over | 0 (0.0%) | 14 (51.8%) |
Disability Class by Sex by Age in Lafitte
Disability Class: Hearing Difficulty
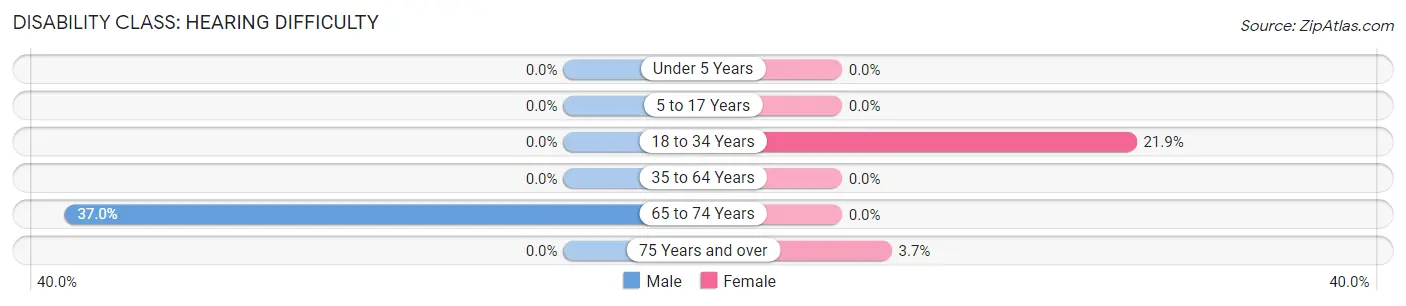
| Age Bracket | Male | Female |
| Under 5 Years | 0 (0.0%) | 0 (0.0%) |
| 5 to 17 Years | 0 (0.0%) | 0 (0.0%) |
| 18 to 34 Years | 0 (0.0%) | 14 (21.9%) |
| 35 to 64 Years | 0 (0.0%) | 0 (0.0%) |
| 65 to 74 Years | 20 (37.0%) | 0 (0.0%) |
| 75 Years and over | 0 (0.0%) | 1 (3.7%) |
Disability Class: Vision Difficulty
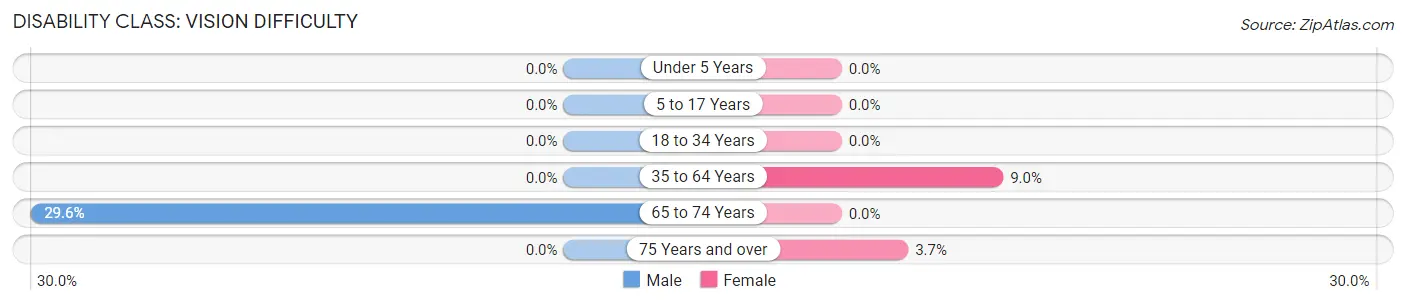
| Age Bracket | Male | Female |
| Under 5 Years | 0 (0.0%) | 0 (0.0%) |
| 5 to 17 Years | 0 (0.0%) | 0 (0.0%) |
| 18 to 34 Years | 0 (0.0%) | 0 (0.0%) |
| 35 to 64 Years | 0 (0.0%) | 8 (9.0%) |
| 65 to 74 Years | 16 (29.6%) | 0 (0.0%) |
| 75 Years and over | 0 (0.0%) | 1 (3.7%) |
Disability Class: Cognitive Difficulty
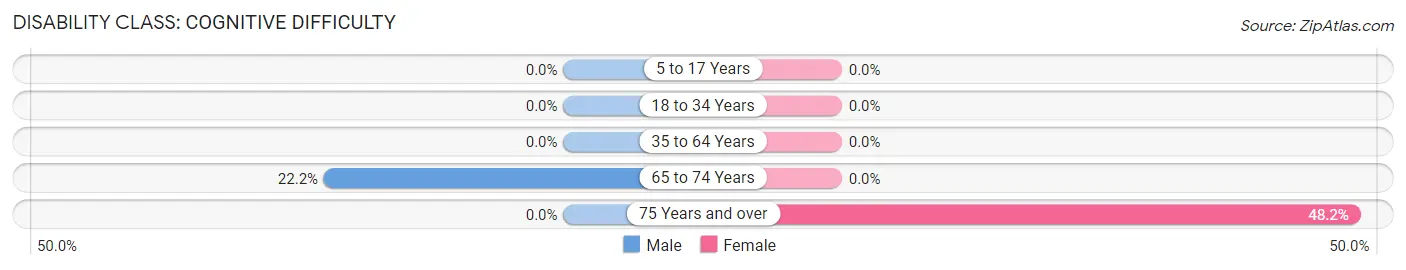
| Age Bracket | Male | Female |
| 5 to 17 Years | 0 (0.0%) | 0 (0.0%) |
| 18 to 34 Years | 0 (0.0%) | 0 (0.0%) |
| 35 to 64 Years | 0 (0.0%) | 0 (0.0%) |
| 65 to 74 Years | 12 (22.2%) | 0 (0.0%) |
| 75 Years and over | 0 (0.0%) | 13 (48.1%) |
Disability Class: Ambulatory Difficulty
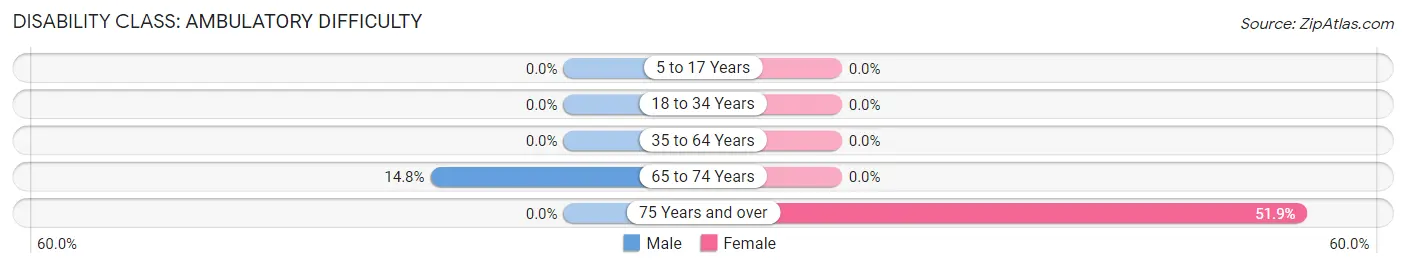
| Age Bracket | Male | Female |
| 5 to 17 Years | 0 (0.0%) | 0 (0.0%) |
| 18 to 34 Years | 0 (0.0%) | 0 (0.0%) |
| 35 to 64 Years | 0 (0.0%) | 0 (0.0%) |
| 65 to 74 Years | 8 (14.8%) | 0 (0.0%) |
| 75 Years and over | 0 (0.0%) | 14 (51.8%) |
Disability Class: Self-Care Difficulty
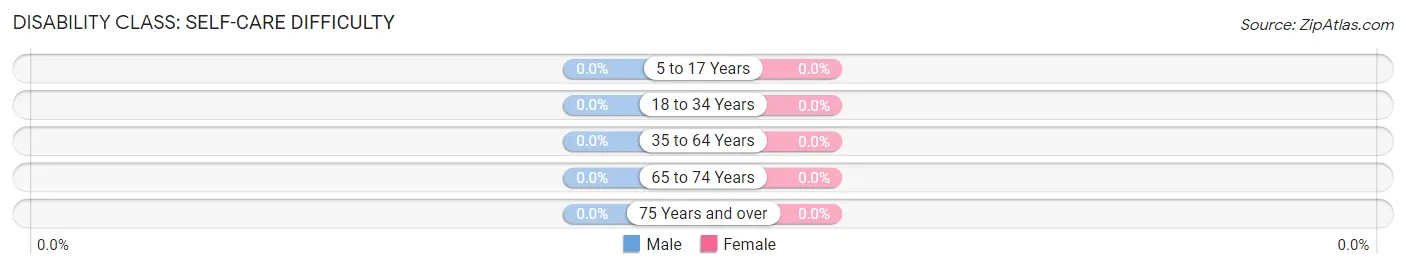
| Age Bracket | Male | Female |
| 5 to 17 Years | 0 (0.0%) | 0 (0.0%) |
| 18 to 34 Years | 0 (0.0%) | 0 (0.0%) |
| 35 to 64 Years | 0 (0.0%) | 0 (0.0%) |
| 65 to 74 Years | 0 (0.0%) | 0 (0.0%) |
| 75 Years and over | 0 (0.0%) | 0 (0.0%) |
Technology Access in Lafitte
Computing Device Access in Lafitte
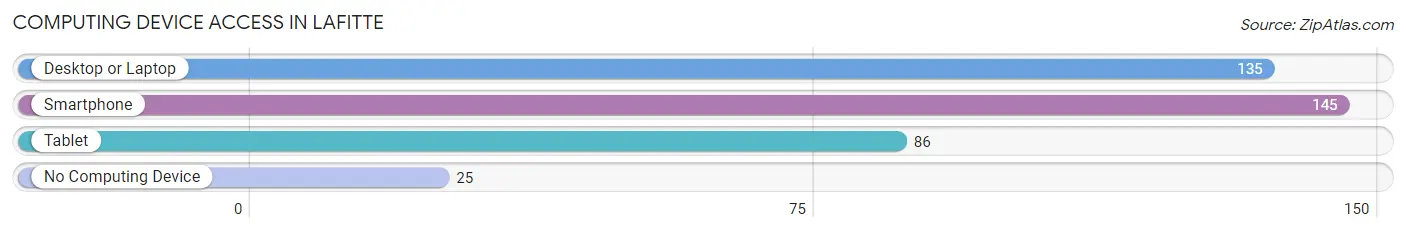
| Device Type | # Households | % Households |
| Desktop or Laptop | 135 | 73.4% |
| Smartphone | 145 | 78.8% |
| Tablet | 86 | 46.7% |
| No Computing Device | 25 | 13.6% |
| Total | 184 | 100.0% |
Internet Access in Lafitte
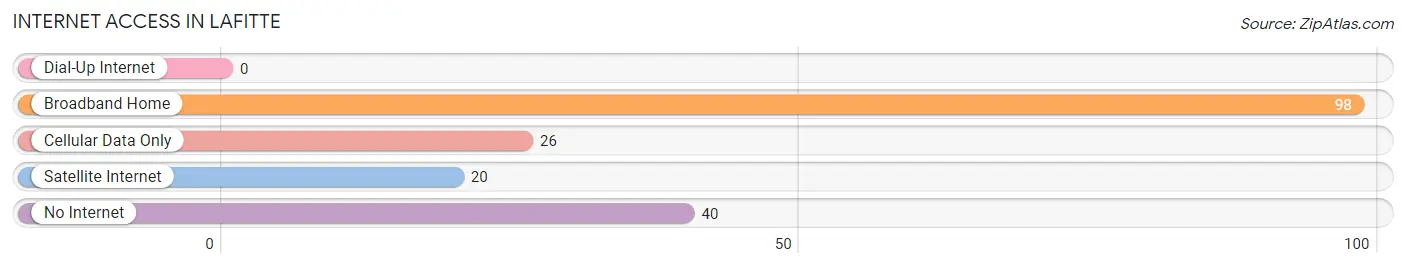
| Internet Type | # Households | % Households |
| Dial-Up Internet | 0 | 0.0% |
| Broadband Home | 98 | 53.3% |
| Cellular Data Only | 26 | 14.1% |
| Satellite Internet | 20 | 10.9% |
| No Internet | 40 | 21.7% |
| Total | 184 | 100.0% |
Lafitte Summary
Lafitte is a small unincorporated community located in Jefferson Parish, Louisiana, United States. It is situated along the banks of Bayou Barataria, a tributary of the Mississippi River. The community is named after the famous French pirate Jean Lafitte, who is said to have used the area as a base of operations.
History
The area that is now Lafitte has been inhabited for thousands of years. Native American tribes such as the Chitimacha, Houma, and Choctaw lived in the area prior to European settlement. The first Europeans to settle in the area were French colonists, who arrived in the late 17th century. The area was part of the French colony of Louisiana until it was ceded to Spain in 1763.
In the early 19th century, the area was settled by Jean Lafitte and his band of pirates. Lafitte used the area as a base of operations for his smuggling and piracy activities. He was eventually forced to leave the area in 1814, when the United States Navy attacked his base.
In the late 19th century, the area was settled by fishermen and farmers. The community of Lafitte was officially established in 1891.
Geography
Lafitte is located in southeastern Louisiana, in Jefferson Parish. It is situated along the banks of Bayou Barataria, a tributary of the Mississippi River. The community is located about 25 miles south of New Orleans.
The climate in Lafitte is humid subtropical, with hot, humid summers and mild winters. The average annual temperature is 68°F (20°C). The average annual precipitation is 62 inches (157 cm).
Economy
The economy of Lafitte is largely based on fishing and tourism. The area is known for its seafood, particularly shrimp, oysters, and crabs. The area is also popular with tourists, who come to enjoy the area’s natural beauty and outdoor activities.
Demographics
As of the 2010 census, the population of Lafitte was 1,521. The racial makeup of the community was 79.3% White, 17.2% African American, 0.7% Native American, 0.3% Asian, 0.1% Pacific Islander, and 2.4% from other races. Hispanic or Latino of any race were 3.2% of the population.
The median household income in Lafitte was $41,250, and the median family income was $48,750. About 17.2% of families and 20.2% of the population were below the poverty line, including 28.3% of those under age 18 and 11.2% of those age 65 or over.
Conclusion
Lafitte is a small unincorporated community located in Jefferson Parish, Louisiana. It is situated along the banks of Bayou Barataria, a tributary of the Mississippi River. The area has a long history, dating back to the Native American tribes who lived in the area prior to European settlement. The area was later settled by Jean Lafitte and his band of pirates, and later by fishermen and farmers. The economy of Lafitte is largely based on fishing and tourism. The population of Lafitte was 1,521 as of the 2010 census. The median household income in Lafitte was $41,250, and the median family income was $48,750.
Common Questions
What is Per Capita Income in Lafitte?
Per Capita income in Lafitte is $40,005.
What is the Median Family Income in Lafitte?
Median Family Income in Lafitte is $90,938.
What is the Median Household income in Lafitte?
Median Household Income in Lafitte is $66,250.
What is Inequality or Gini Index in Lafitte?
Inequality or Gini Index in Lafitte is 0.54.
What is the Total Population of Lafitte?
Total Population of Lafitte is 558.
What is the Total Male Population of Lafitte?
Total Male Population of Lafitte is 348.
What is the Total Female Population of Lafitte?
Total Female Population of Lafitte is 210.
What is the Ratio of Males per 100 Females in Lafitte?
There are 165.71 Males per 100 Females in Lafitte.
What is the Ratio of Females per 100 Males in Lafitte?
There are 60.34 Females per 100 Males in Lafitte.
What is the Median Population Age in Lafitte?
Median Population Age in Lafitte is 41.4 Years.
What is the Average Family Size in Lafitte
Average Family Size in Lafitte is 3.6 People.
What is the Average Household Size in Lafitte
Average Household Size in Lafitte is 3.0 People.
How Large is the Labor Force in Lafitte?
There are 205 People in the Labor Forcein in Lafitte.
What is the Percentage of People in the Labor Force in Lafitte?
44.4% of People are in the Labor Force in Lafitte.
What is the Unemployment Rate in Lafitte?
Unemployment Rate in Lafitte is 13.2%.