Beersheba Springs, TN Map & Demographics
Beersheba Springs Map
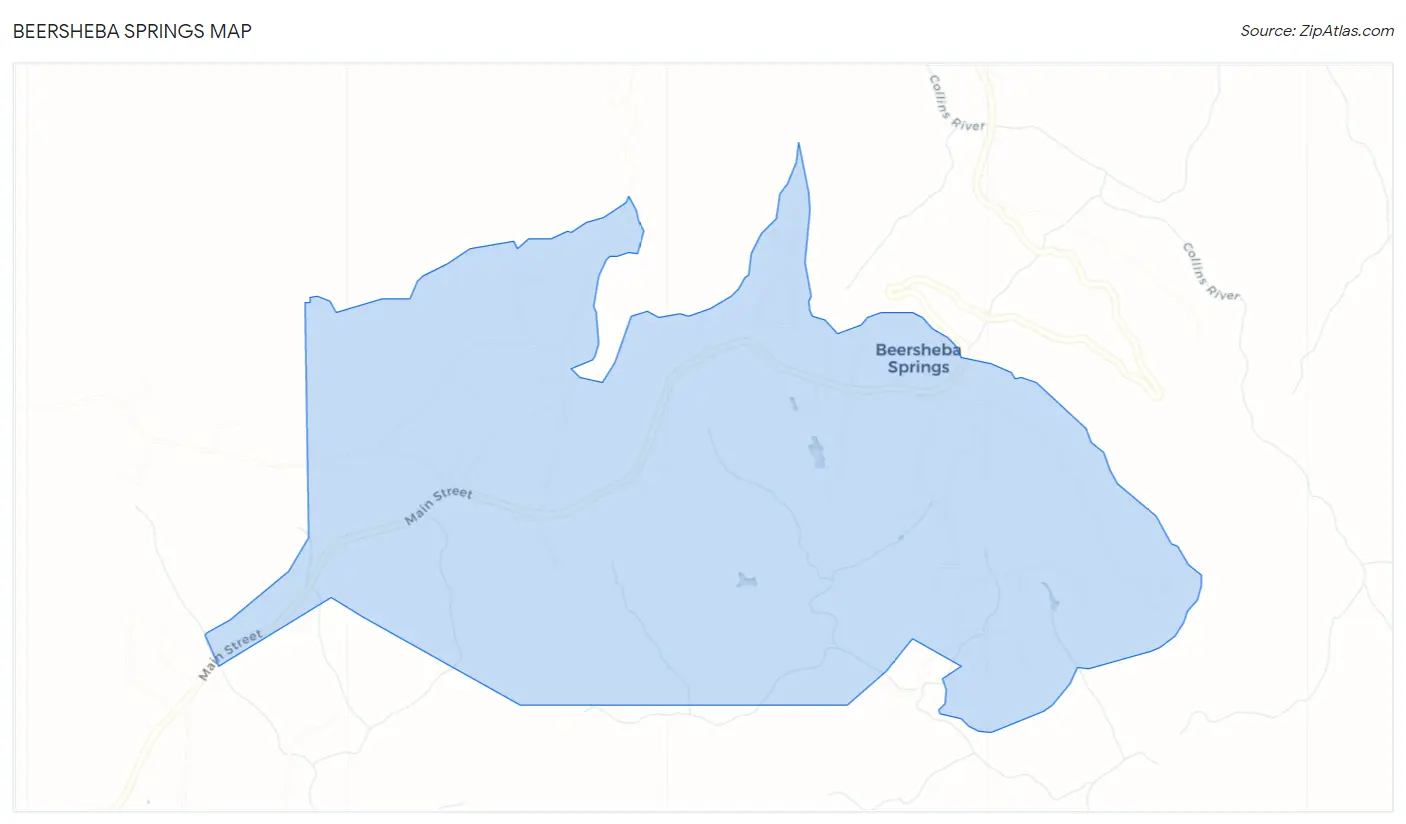
Beersheba Springs Overview
$24,320
PER CAPITA INCOME
$70,435
AVG FAMILY INCOME
$67,500
AVG HOUSEHOLD INCOME
18.9%
WAGE / INCOME GAP [ % ]
81.1¢/ $1
WAGE / INCOME GAP [ $ ]
0.33
INEQUALITY / GINI INDEX
538
TOTAL POPULATION
268
MALE POPULATION
270
FEMALE POPULATION
99.26
MALES / 100 FEMALES
100.75
FEMALES / 100 MALES
45.7
MEDIAN AGE
3.0
AVG FAMILY SIZE
2.8
AVG HOUSEHOLD SIZE
266
LABOR FORCE [ PEOPLE ]
57.2%
PERCENT IN LABOR FORCE
1.5%
UNEMPLOYMENT RATE
Beersheba Springs Zip Codes
Beersheba Springs Area Codes
Income in Beersheba Springs
Income Overview in Beersheba Springs
Per Capita Income in Beersheba Springs is $24,320, while median incomes of families and households are $70,435 and $67,500 respectively.
| Characteristic | Number | Measure |
| Per Capita Income | 538 | $24,320 |
| Median Family Income | 166 | $70,435 |
| Mean Family Income | 166 | $67,849 |
| Median Household Income | 194 | $67,500 |
| Mean Household Income | 194 | $61,062 |
| Income Deficit | 166 | $0 |
| Wage / Income Gap (%) | 538 | 18.88% |
| Wage / Income Gap ($) | 538 | 81.12¢ per $1 |
| Gini / Inequality Index | 538 | 0.33 |
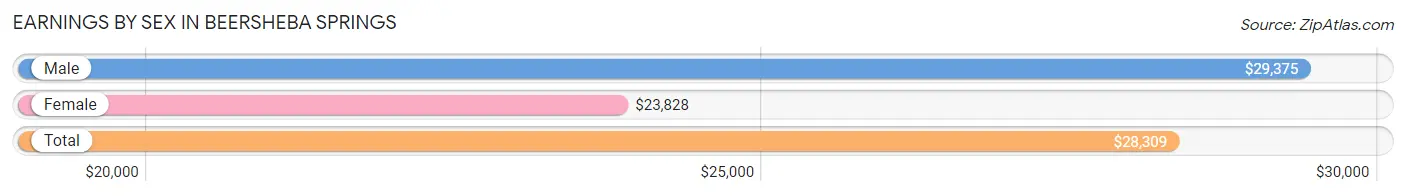
Earnings by Sex in Beersheba Springs
Average Earnings in Beersheba Springs are $28,309, $29,375 for men and $23,828 for women, a difference of 18.9%.
| Sex | Number | Average Earnings |
| Male | 161 (57.5%) | $29,375 |
| Female | 119 (42.5%) | $23,828 |
| Total | 280 (100.0%) | $28,309 |
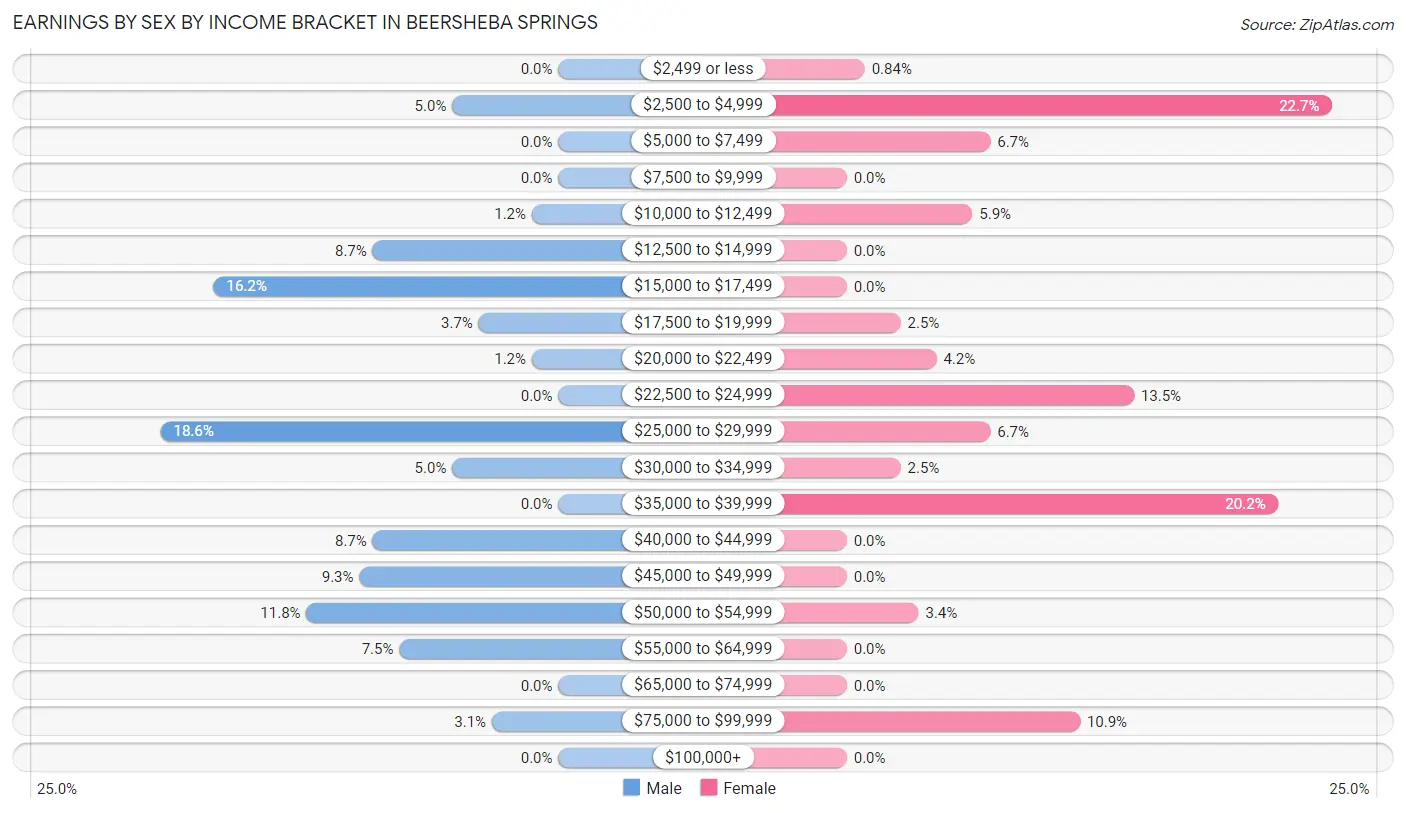
Earnings by Sex by Income Bracket in Beersheba Springs
The most common earnings brackets in Beersheba Springs are $25,000 to $29,999 for men (30 | 18.6%) and $2,500 to $4,999 for women (27 | 22.7%).
| Income | Male | Female |
| $2,499 or less | 0 (0.0%) | 1 (0.8%) |
| $2,500 to $4,999 | 8 (5.0%) | 27 (22.7%) |
| $5,000 to $7,499 | 0 (0.0%) | 8 (6.7%) |
| $7,500 to $9,999 | 0 (0.0%) | 0 (0.0%) |
| $10,000 to $12,499 | 2 (1.2%) | 7 (5.9%) |
| $12,500 to $14,999 | 14 (8.7%) | 0 (0.0%) |
| $15,000 to $17,499 | 26 (16.2%) | 0 (0.0%) |
| $17,500 to $19,999 | 6 (3.7%) | 3 (2.5%) |
| $20,000 to $22,499 | 2 (1.2%) | 5 (4.2%) |
| $22,500 to $24,999 | 0 (0.0%) | 16 (13.5%) |
| $25,000 to $29,999 | 30 (18.6%) | 8 (6.7%) |
| $30,000 to $34,999 | 8 (5.0%) | 3 (2.5%) |
| $35,000 to $39,999 | 0 (0.0%) | 24 (20.2%) |
| $40,000 to $44,999 | 14 (8.7%) | 0 (0.0%) |
| $45,000 to $49,999 | 15 (9.3%) | 0 (0.0%) |
| $50,000 to $54,999 | 19 (11.8%) | 4 (3.4%) |
| $55,000 to $64,999 | 12 (7.4%) | 0 (0.0%) |
| $65,000 to $74,999 | 0 (0.0%) | 0 (0.0%) |
| $75,000 to $99,999 | 5 (3.1%) | 13 (10.9%) |
| $100,000+ | 0 (0.0%) | 0 (0.0%) |
| Total | 161 (100.0%) | 119 (100.0%) |
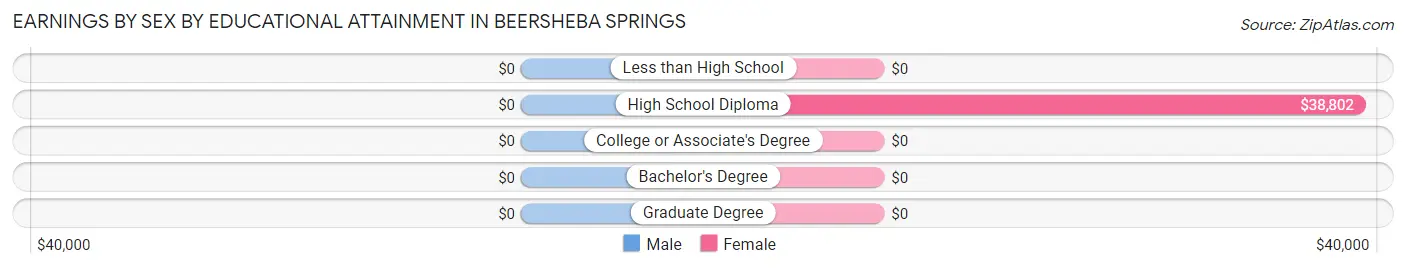
Earnings by Sex by Educational Attainment in Beersheba Springs
| Educational Attainment | Male Income | Female Income |
| Less than High School | - | - |
| High School Diploma | - | - |
| College or Associate's Degree | - | - |
| Bachelor's Degree | - | - |
| Graduate Degree | - | - |
| Total | $29,565 | $25,313 |
Family Income in Beersheba Springs
Family Income Brackets in Beersheba Springs
According to the Beersheba Springs family income data, there are 85 families falling into the $50,000 to $74,999 income range, which is the most common income bracket and makes up 51.2% of all families.
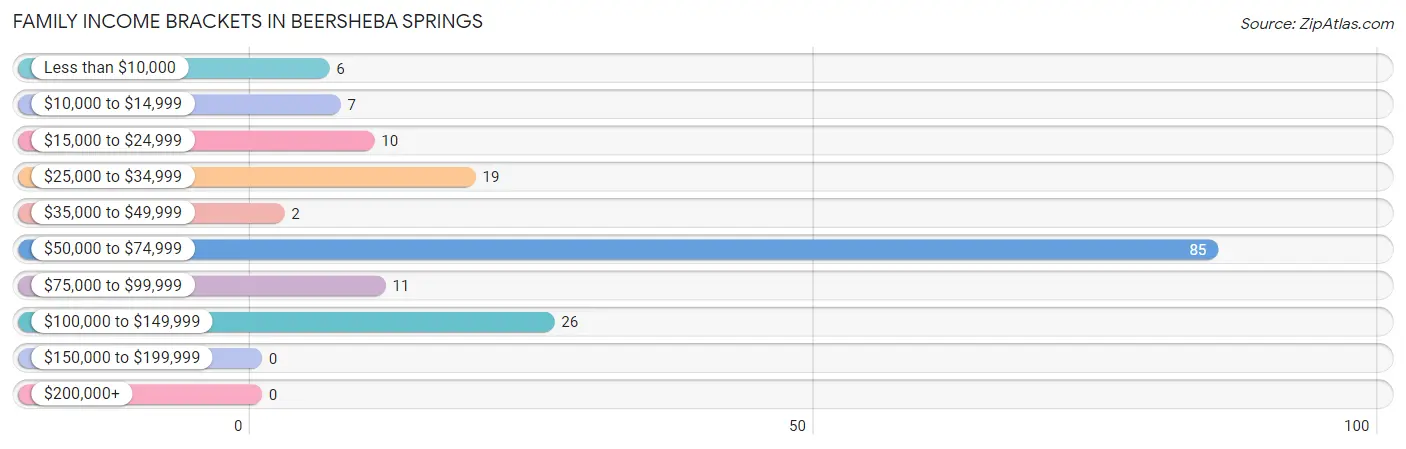
| Income Bracket | # Families | % Families |
| Less than $10,000 | 6 | 3.6% |
| $10,000 to $14,999 | 7 | 4.2% |
| $15,000 to $24,999 | 10 | 6.0% |
| $25,000 to $34,999 | 19 | 11.4% |
| $35,000 to $49,999 | 2 | 1.2% |
| $50,000 to $74,999 | 85 | 51.2% |
| $75,000 to $99,999 | 11 | 6.6% |
| $100,000 to $149,999 | 26 | 15.7% |
| $150,000 to $199,999 | 0 | 0.0% |
| $200,000+ | 0 | 0.0% |
Family Income by Famaliy Size in Beersheba Springs
4-person families (24 | 14.5%) account for the highest median family income in Beersheba Springs with $109,063 per family, while 2-person families (110 | 66.3%) have the highest median income of $35,163 per family member.
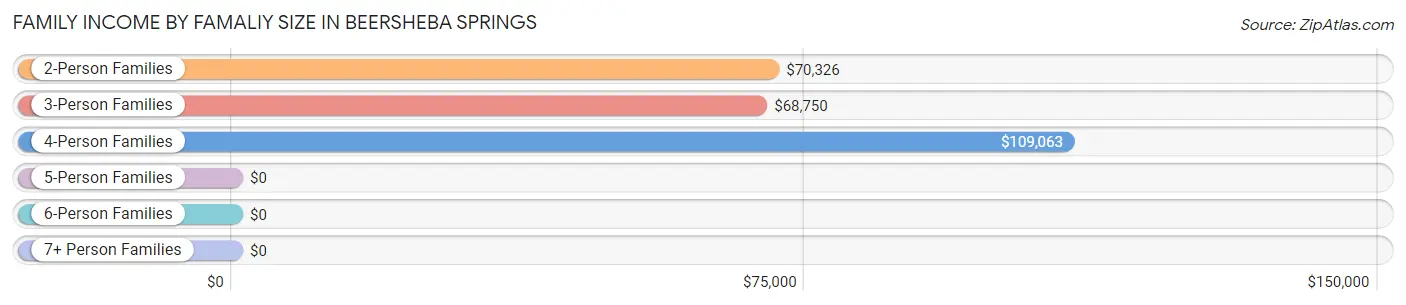
| Income Bracket | # Families | Median Income |
| 2-Person Families | 110 (66.3%) | $70,326 |
| 3-Person Families | 22 (13.3%) | $68,750 |
| 4-Person Families | 24 (14.5%) | $109,063 |
| 5-Person Families | 8 (4.8%) | $0 |
| 6-Person Families | 2 (1.2%) | $0 |
| 7+ Person Families | 0 (0.0%) | $0 |
| Total | 166 (100.0%) | $70,435 |
Family Income by Number of Earners in Beersheba Springs
The median family income in Beersheba Springs is $70,435, with families comprising 3+ earners (28) having the highest median family income of $99,167, while families with 1 earner (42) have the lowest median family income of $34,688, accounting for 16.9% and 25.3% of families, respectively.
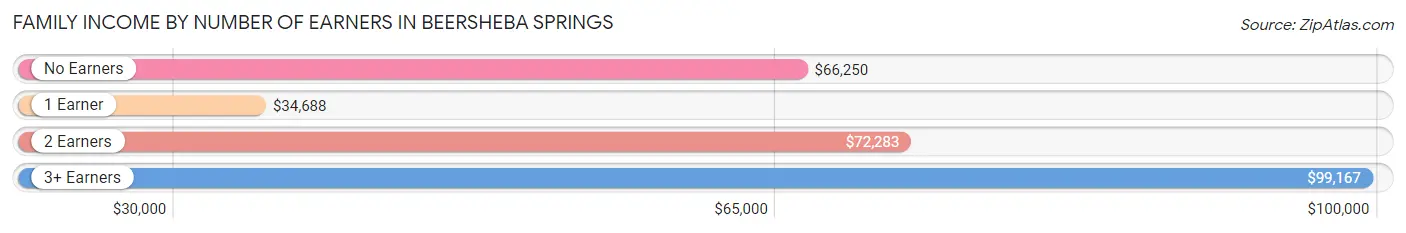
| Number of Earners | # Families | Median Income |
| No Earners | 38 (22.9%) | $66,250 |
| 1 Earner | 42 (25.3%) | $34,688 |
| 2 Earners | 58 (34.9%) | $72,283 |
| 3+ Earners | 28 (16.9%) | $99,167 |
| Total | 166 (100.0%) | $70,435 |
Household Income in Beersheba Springs
Household Income Brackets in Beersheba Springs
With 85 households falling in the category, the $50,000 to $74,999 income range is the most frequent in Beersheba Springs, accounting for 43.8% of all households.
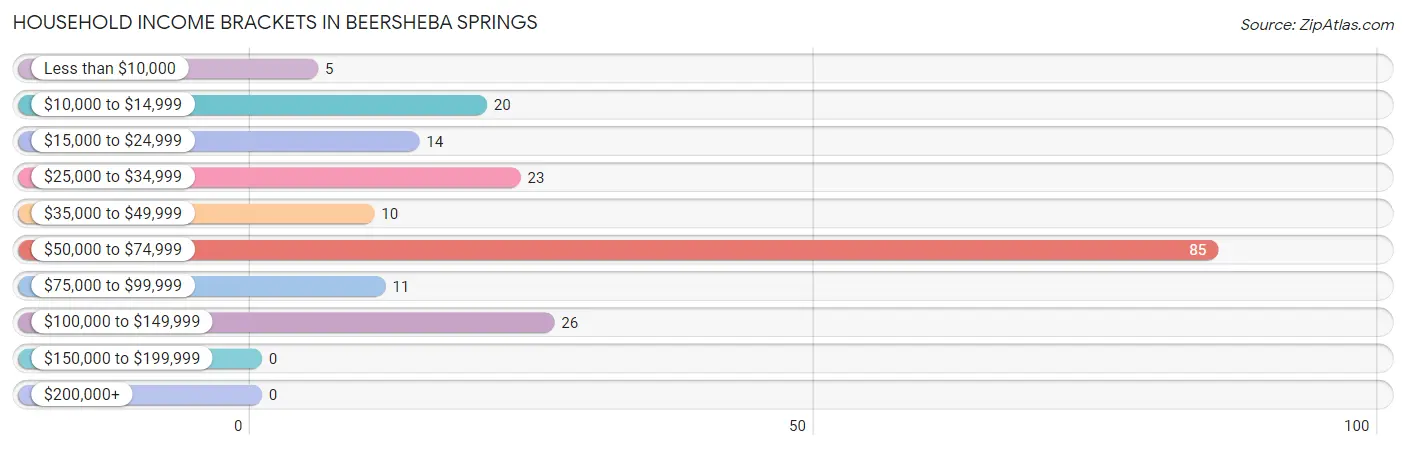
| Income Bracket | # Households | % Households |
| Less than $10,000 | 5 | 2.6% |
| $10,000 to $14,999 | 20 | 10.3% |
| $15,000 to $24,999 | 14 | 7.2% |
| $25,000 to $34,999 | 23 | 11.9% |
| $35,000 to $49,999 | 10 | 5.2% |
| $50,000 to $74,999 | 85 | 43.8% |
| $75,000 to $99,999 | 11 | 5.7% |
| $100,000 to $149,999 | 26 | 13.4% |
| $150,000 to $199,999 | 0 | 0.0% |
| $200,000+ | 0 | 0.0% |
Household Income by Householder Age in Beersheba Springs
The median household income in Beersheba Springs is $67,500, with the highest median household income of $71,033 found in the 45 to 64 years age bracket for the primary householder. A total of 87 households (44.9%) fall into this category. Meanwhile, the 15 to 24 years age bracket for the primary householder has the lowest median household income of $0, with 1 households (0.5%) in this group.
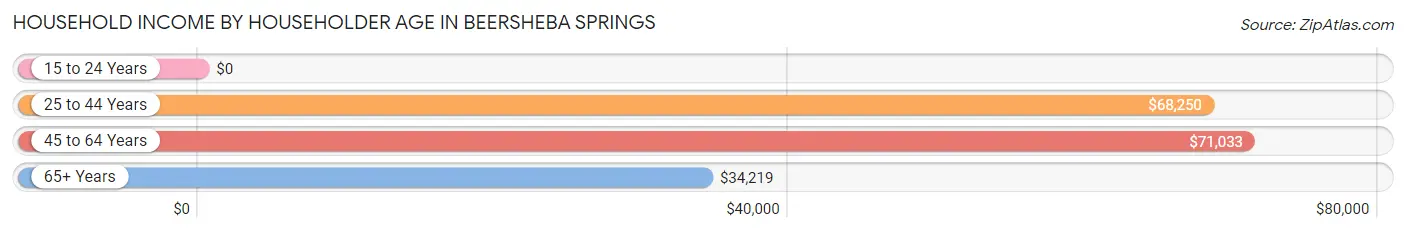
| Income Bracket | # Households | Median Income |
| 15 to 24 Years | 1 (0.5%) | $0 |
| 25 to 44 Years | 44 (22.7%) | $68,250 |
| 45 to 64 Years | 87 (44.9%) | $71,033 |
| 65+ Years | 62 (32.0%) | $34,219 |
| Total | 194 (100.0%) | $67,500 |
Poverty in Beersheba Springs
Income Below Poverty by Sex and Age in Beersheba Springs
With 14.5% poverty level for males and 24.8% for females among the residents of Beersheba Springs, 12 to 14 year old males and 6 to 11 year old females are the most vulnerable to poverty, with 7 males (100.0%) and 7 females (63.6%) in their respective age groups living below the poverty level.
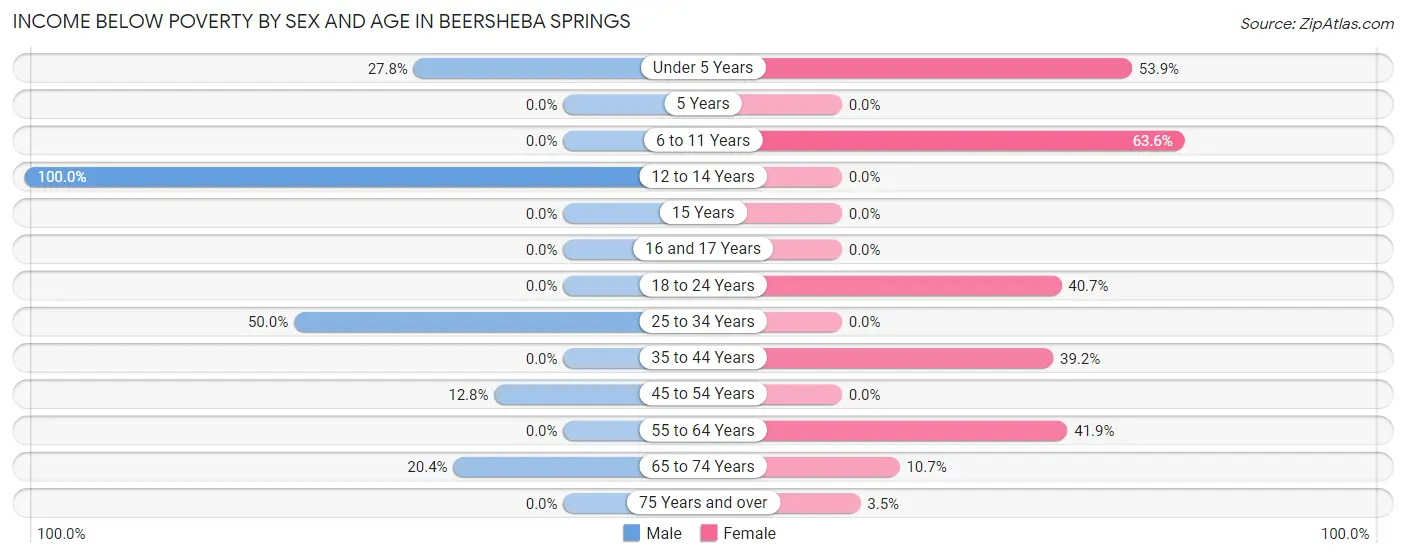
| Age Bracket | Male | Female |
| Under 5 Years | 5 (27.8%) | 7 (53.8%) |
| 5 Years | 0 (0.0%) | 0 (0.0%) |
| 6 to 11 Years | 0 (0.0%) | 7 (63.6%) |
| 12 to 14 Years | 7 (100.0%) | 0 (0.0%) |
| 15 Years | 0 (0.0%) | 0 (0.0%) |
| 16 and 17 Years | 0 (0.0%) | 0 (0.0%) |
| 18 to 24 Years | 0 (0.0%) | 11 (40.7%) |
| 25 to 34 Years | 7 (50.0%) | 0 (0.0%) |
| 35 to 44 Years | 0 (0.0%) | 20 (39.2%) |
| 45 to 54 Years | 10 (12.8%) | 0 (0.0%) |
| 55 to 64 Years | 0 (0.0%) | 18 (41.9%) |
| 65 to 74 Years | 10 (20.4%) | 3 (10.7%) |
| 75 Years and over | 0 (0.0%) | 1 (3.5%) |
| Total | 39 (14.5%) | 67 (24.8%) |
Income Above Poverty by Sex and Age in Beersheba Springs
According to the poverty statistics in Beersheba Springs, males aged 6 to 11 years and females aged 12 to 14 years are the age groups that are most secure financially, with 100.0% of males and 100.0% of females in these age groups living above the poverty line.
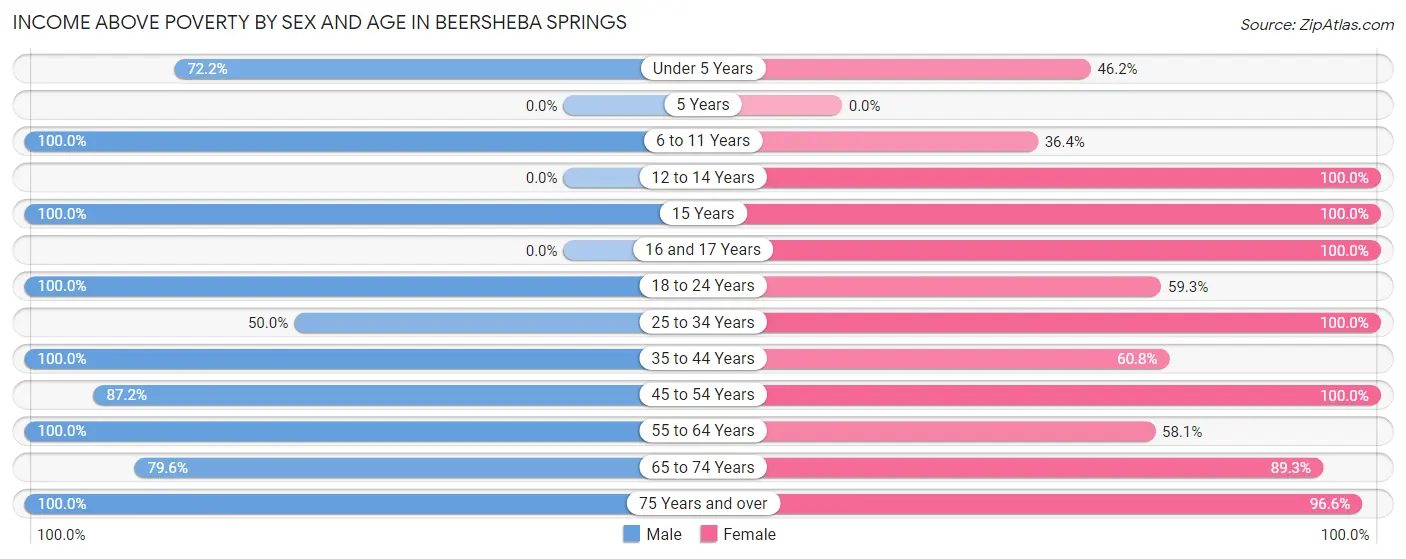
| Age Bracket | Male | Female |
| Under 5 Years | 13 (72.2%) | 6 (46.2%) |
| 5 Years | 0 (0.0%) | 0 (0.0%) |
| 6 to 11 Years | 15 (100.0%) | 4 (36.4%) |
| 12 to 14 Years | 0 (0.0%) | 1 (100.0%) |
| 15 Years | 3 (100.0%) | 5 (100.0%) |
| 16 and 17 Years | 0 (0.0%) | 5 (100.0%) |
| 18 to 24 Years | 35 (100.0%) | 16 (59.3%) |
| 25 to 34 Years | 7 (50.0%) | 11 (100.0%) |
| 35 to 44 Years | 36 (100.0%) | 31 (60.8%) |
| 45 to 54 Years | 68 (87.2%) | 46 (100.0%) |
| 55 to 64 Years | 4 (100.0%) | 25 (58.1%) |
| 65 to 74 Years | 39 (79.6%) | 25 (89.3%) |
| 75 Years and over | 9 (100.0%) | 28 (96.6%) |
| Total | 229 (85.5%) | 203 (75.2%) |
Income Below Poverty Among Married-Couple Families in Beersheba Springs
The poverty statistics for married-couple families in Beersheba Springs show that 10.2% or 15 of the total 147 families live below the poverty line. Families with no children have the highest poverty rate of 11.7%, comprising of 15 families. On the other hand, families with 1 or 2 children have the lowest poverty rate of 0.0%, which includes 0 families.
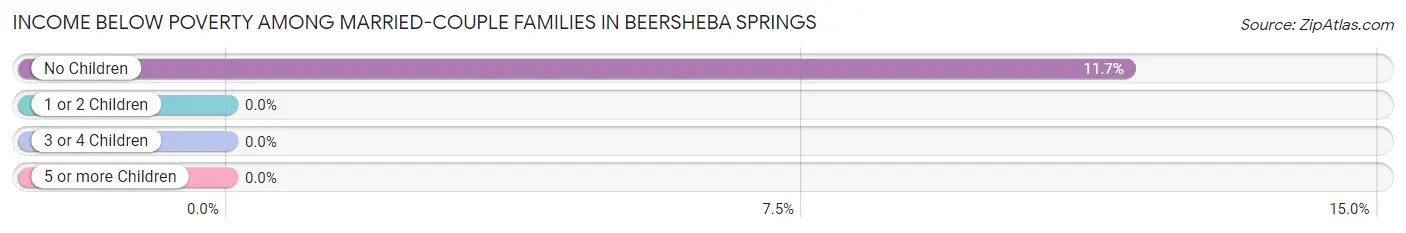
| Children | Above Poverty | Below Poverty |
| No Children | 113 (88.3%) | 15 (11.7%) |
| 1 or 2 Children | 17 (100.0%) | 0 (0.0%) |
| 3 or 4 Children | 2 (100.0%) | 0 (0.0%) |
| 5 or more Children | 0 (0.0%) | 0 (0.0%) |
| Total | 132 (89.8%) | 15 (10.2%) |
Income Below Poverty Among Single-Parent Households in Beersheba Springs
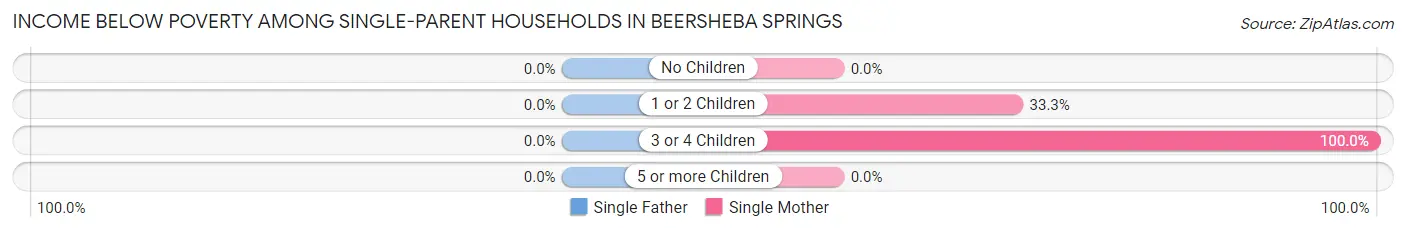
| Children | Single Father | Single Mother |
| No Children | 0 (0.0%) | 0 (0.0%) |
| 1 or 2 Children | 0 (0.0%) | 1 (33.3%) |
| 3 or 4 Children | 0 (0.0%) | 7 (100.0%) |
| 5 or more Children | 0 (0.0%) | 0 (0.0%) |
| Total | 0 (0.0%) | 8 (61.5%) |
Income Below Poverty Among Married-Couple vs Single-Parent Households in Beersheba Springs
The poverty data for Beersheba Springs shows that 15 of the married-couple family households (10.2%) and 8 of the single-parent households (42.1%) are living below the poverty level. Within the married-couple family households, those with no children have the highest poverty rate, with 15 households (11.7%) falling below the poverty line. Among the single-parent households, those with 3 or 4 children have the highest poverty rate, with 7 household (100.0%) living below poverty.
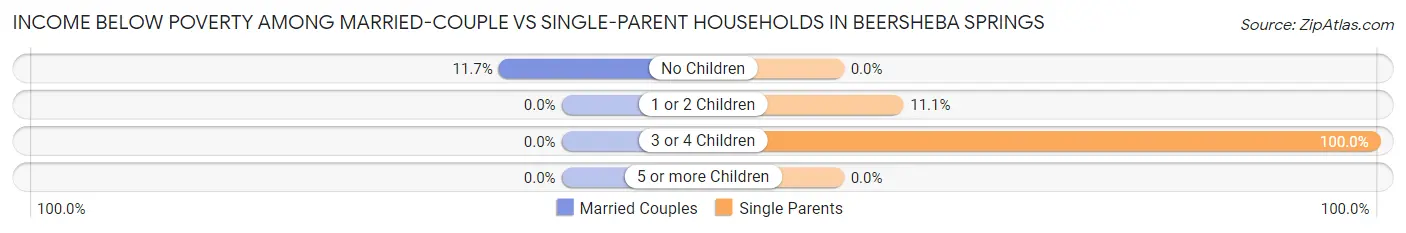
| Children | Married-Couple Families | Single-Parent Households |
| No Children | 15 (11.7%) | 0 (0.0%) |
| 1 or 2 Children | 0 (0.0%) | 1 (11.1%) |
| 3 or 4 Children | 0 (0.0%) | 7 (100.0%) |
| 5 or more Children | 0 (0.0%) | 0 (0.0%) |
| Total | 15 (10.2%) | 8 (42.1%) |
Race in Beersheba Springs
The most populous races in Beersheba Springs are White / Caucasian (489 | 90.9%), Two or more Races (49 | 9.1%), and Hispanic or Latino (17 | 3.2%).
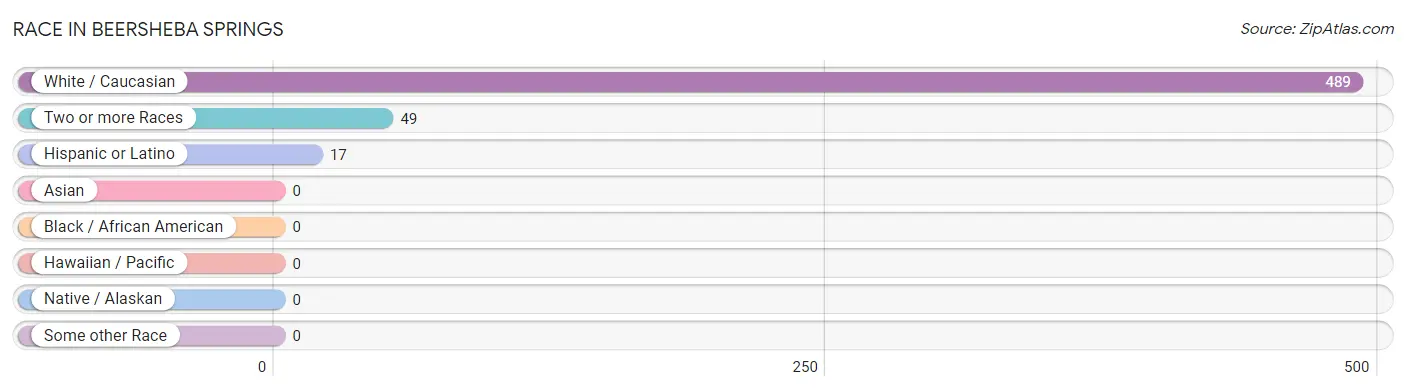
| Race | # Population | % Population |
| Asian | 0 | 0.0% |
| Black / African American | 0 | 0.0% |
| Hawaiian / Pacific | 0 | 0.0% |
| Hispanic or Latino | 17 | 3.2% |
| Native / Alaskan | 0 | 0.0% |
| White / Caucasian | 489 | 90.9% |
| Two or more Races | 49 | 9.1% |
| Some other Race | 0 | 0.0% |
| Total | 538 | 100.0% |
Ancestry in Beersheba Springs
The most populous ancestries reported in Beersheba Springs are German (78 | 14.5%), Irish (67 | 12.4%), American (62 | 11.5%), Cherokee (43 | 8.0%), and English (43 | 8.0%), together accounting for 54.4% of all Beersheba Springs residents.
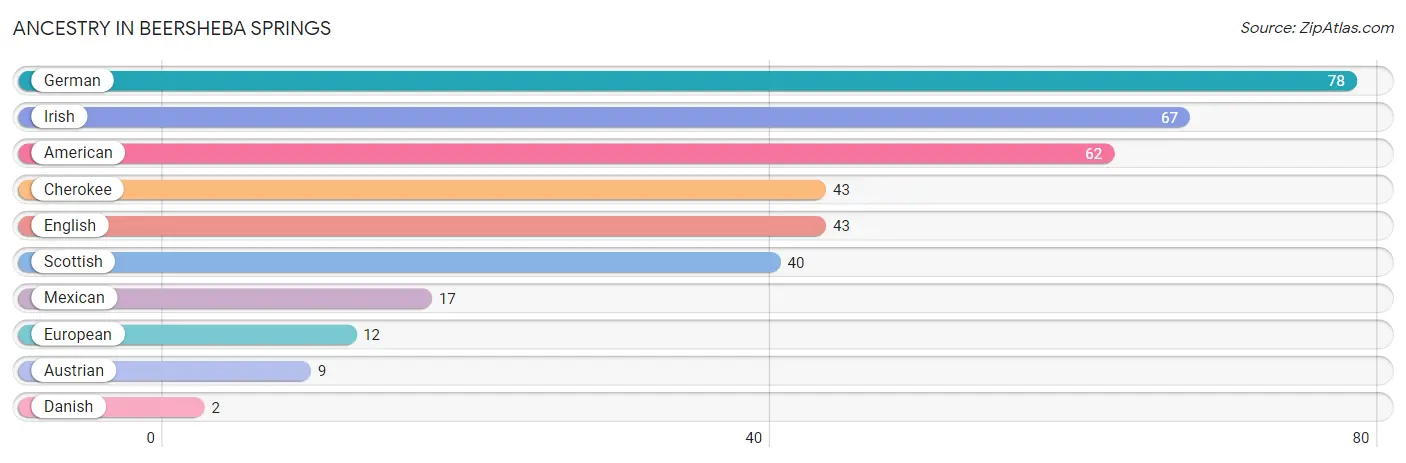
| Ancestry | # Population | % Population |
| American | 62 | 11.5% |
| Austrian | 9 | 1.7% |
| Cherokee | 43 | 8.0% |
| Danish | 2 | 0.4% |
| English | 43 | 8.0% |
| European | 12 | 2.2% |
| German | 78 | 14.5% |
| Irish | 67 | 12.4% |
| Mexican | 17 | 3.2% |
| Scottish | 40 | 7.4% | View All 10 Rows |
Immigrants in Beersheba Springs

| Immigration Origin | # Population | % Population | View All 0 Rows |
Sex and Age in Beersheba Springs
Sex and Age in Beersheba Springs
The most populous age groups in Beersheba Springs are 45 to 49 Years (76 | 28.4%) for men and 35 to 39 Years (26 | 9.6%) for women.
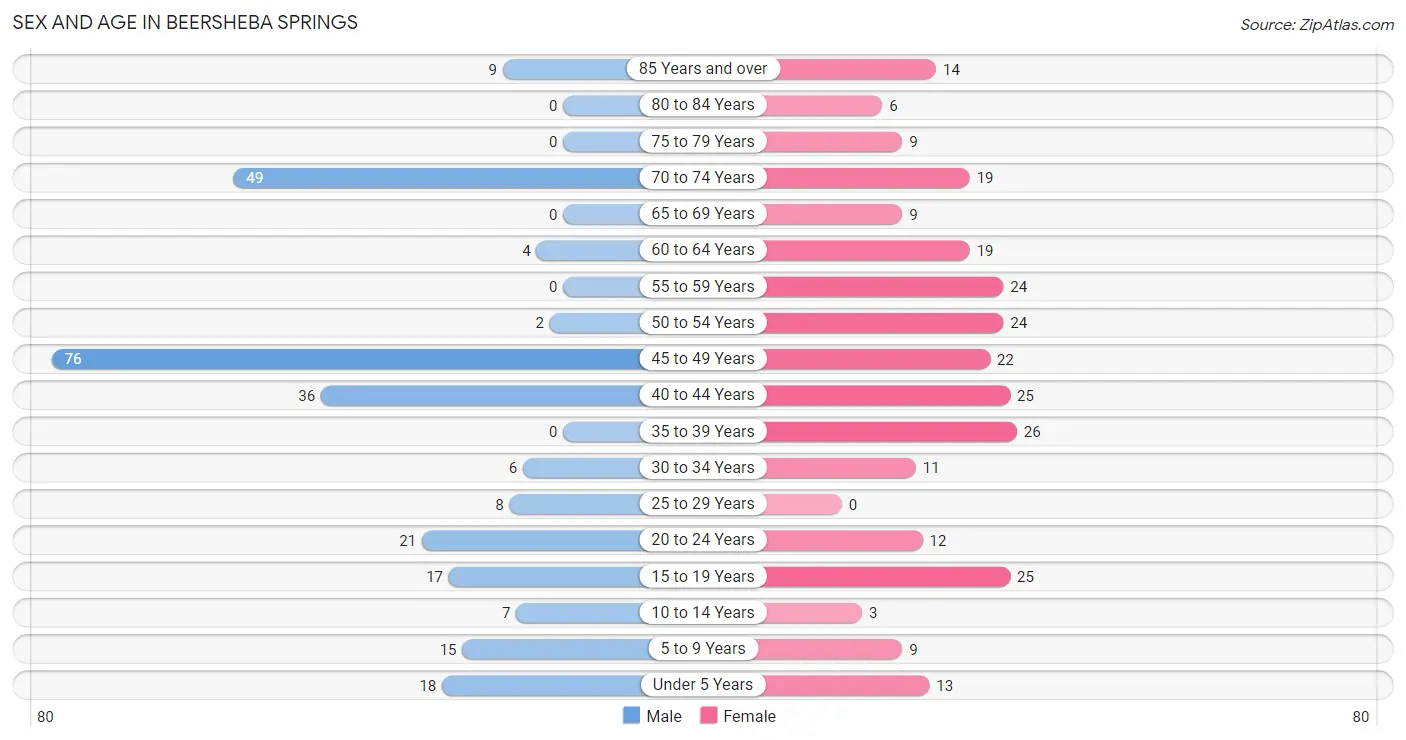
| Age Bracket | Male | Female |
| Under 5 Years | 18 (6.7%) | 13 (4.8%) |
| 5 to 9 Years | 15 (5.6%) | 9 (3.3%) |
| 10 to 14 Years | 7 (2.6%) | 3 (1.1%) |
| 15 to 19 Years | 17 (6.3%) | 25 (9.3%) |
| 20 to 24 Years | 21 (7.8%) | 12 (4.4%) |
| 25 to 29 Years | 8 (3.0%) | 0 (0.0%) |
| 30 to 34 Years | 6 (2.2%) | 11 (4.1%) |
| 35 to 39 Years | 0 (0.0%) | 26 (9.6%) |
| 40 to 44 Years | 36 (13.4%) | 25 (9.3%) |
| 45 to 49 Years | 76 (28.4%) | 22 (8.2%) |
| 50 to 54 Years | 2 (0.7%) | 24 (8.9%) |
| 55 to 59 Years | 0 (0.0%) | 24 (8.9%) |
| 60 to 64 Years | 4 (1.5%) | 19 (7.0%) |
| 65 to 69 Years | 0 (0.0%) | 9 (3.3%) |
| 70 to 74 Years | 49 (18.3%) | 19 (7.0%) |
| 75 to 79 Years | 0 (0.0%) | 9 (3.3%) |
| 80 to 84 Years | 0 (0.0%) | 6 (2.2%) |
| 85 Years and over | 9 (3.4%) | 14 (5.2%) |
| Total | 268 (100.0%) | 270 (100.0%) |
Families and Households in Beersheba Springs
Median Family Size in Beersheba Springs
The median family size in Beersheba Springs is 2.96 persons per family, with single female/mother families (13 | 7.8%) accounting for the largest median family size of 3.92 persons per family. On the other hand, married-couple families (147 | 88.5%) represent the smallest median family size with 2.88 persons per family.
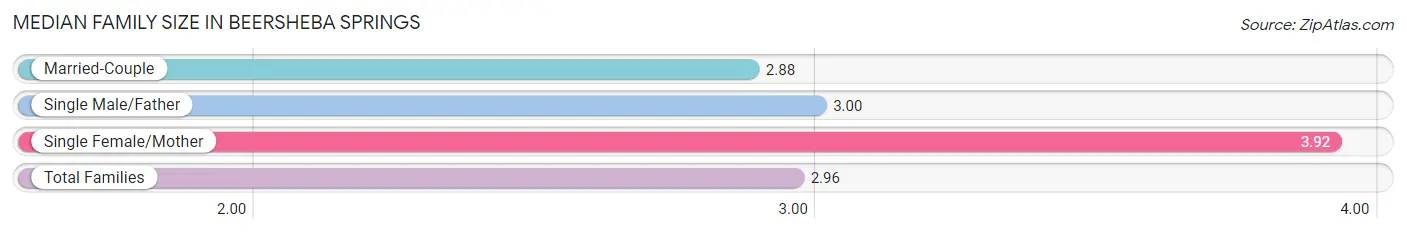
| Family Type | # Families | Family Size |
| Married-Couple | 147 (88.5%) | 2.88 |
| Single Male/Father | 6 (3.6%) | 3.00 |
| Single Female/Mother | 13 (7.8%) | 3.92 |
| Total Families | 166 (100.0%) | 2.96 |
Median Household Size in Beersheba Springs
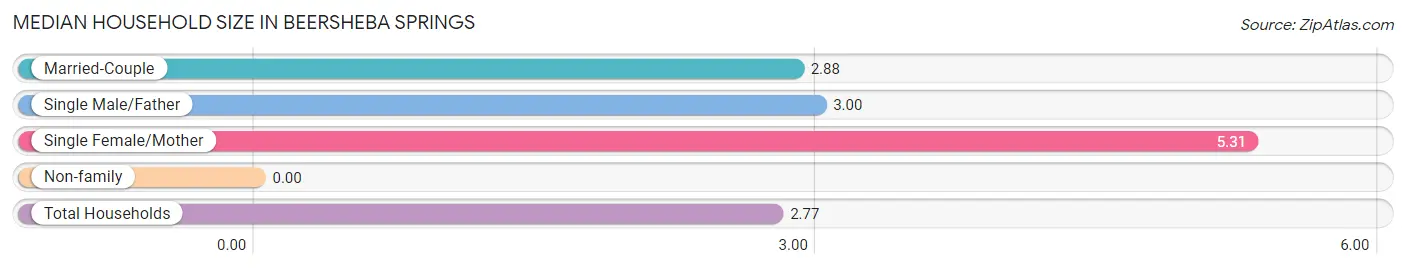
| Household Type | # Households | Household Size |
| Married-Couple | 147 (75.8%) | 2.88 |
| Single Male/Father | 6 (3.1%) | 3.00 |
| Single Female/Mother | 13 (6.7%) | 5.31 |
| Non-family | 28 (14.4%) | - |
| Total Households | 194 (100.0%) | 2.77 |
Household Size by Marriage Status in Beersheba Springs
Out of a total of 194 households in Beersheba Springs, 166 (85.6%) are family households, while 28 (14.4%) are nonfamily households. The most numerous type of family households are 2-person households, comprising 109, and the most common type of nonfamily households are 1-person households, comprising 28.
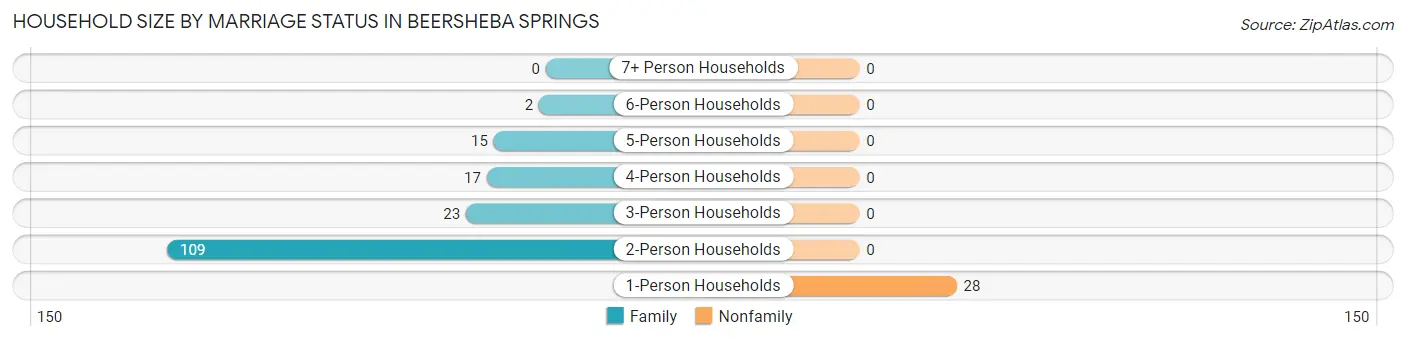
| Household Size | Family Households | Nonfamily Households |
| 1-Person Households | - | 28 (14.4%) |
| 2-Person Households | 109 (56.2%) | 0 (0.0%) |
| 3-Person Households | 23 (11.9%) | 0 (0.0%) |
| 4-Person Households | 17 (8.8%) | 0 (0.0%) |
| 5-Person Households | 15 (7.7%) | 0 (0.0%) |
| 6-Person Households | 2 (1.0%) | 0 (0.0%) |
| 7+ Person Households | 0 (0.0%) | 0 (0.0%) |
| Total | 166 (85.6%) | 28 (14.4%) |
Female Fertility in Beersheba Springs
Fertility by Age in Beersheba Springs
| Age Bracket | Women with Births | Births / 1,000 Women |
| 15 to 19 years | 0 (0.0%) | 0.0 |
| 20 to 34 years | 0 (0.0%) | 0.0 |
| 35 to 50 years | 0 (0.0%) | 0.0 |
| Total | 0 (0.0%) | 0.0 |
Fertility by Age by Marriage Status in Beersheba Springs
| Age Bracket | Married | Unmarried |
| 15 to 19 years | 0 (0.0%) | 0 (0.0%) |
| 20 to 34 years | 0 (0.0%) | 0 (0.0%) |
| 35 to 50 years | 0 (0.0%) | 0 (0.0%) |
| Total | 0 (0.0%) | 0 (0.0%) |
Fertility by Education in Beersheba Springs
| Educational Attainment | Women with Births | Births / 1,000 Women |
| Less than High School | 0 (0.0%) | 0.0 |
| High School Diploma | 0 (0.0%) | 0.0 |
| College or Associate's Degree | 0 (0.0%) | 0.0 |
| Bachelor's Degree | 0 (0.0%) | 0.0 |
| Graduate Degree | 0 (0.0%) | 0.0 |
| Total | 0 (0.0%) | 0.0 |
Fertility by Education by Marriage Status in Beersheba Springs
| Educational Attainment | Married | Unmarried |
| Less than High School | 0 (0.0%) | 0 (0.0%) |
| High School Diploma | 0 (0.0%) | 0 (0.0%) |
| College or Associate's Degree | 0 (0.0%) | 0 (0.0%) |
| Bachelor's Degree | 0 (0.0%) | 0 (0.0%) |
| Graduate Degree | 0 (0.0%) | 0 (0.0%) |
| Total | 0 (0.0%) | 0 (0.0%) |
Employment Characteristics in Beersheba Springs
Employment by Class of Employer in Beersheba Springs
Among the 262 employed individuals in Beersheba Springs, private company employees (151 | 57.6%), self-employed (not incorporated) (49 | 18.7%), and local government employees (26 | 9.9%) make up the most common classes of employment.
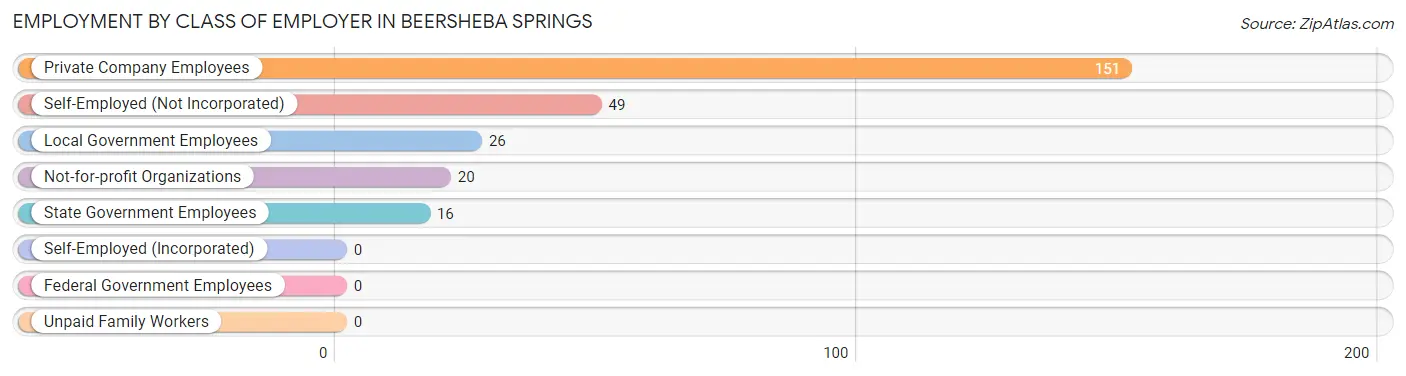
| Employer Class | # Employees | % Employees |
| Private Company Employees | 151 | 57.6% |
| Self-Employed (Incorporated) | 0 | 0.0% |
| Self-Employed (Not Incorporated) | 49 | 18.7% |
| Not-for-profit Organizations | 20 | 7.6% |
| Local Government Employees | 26 | 9.9% |
| State Government Employees | 16 | 6.1% |
| Federal Government Employees | 0 | 0.0% |
| Unpaid Family Workers | 0 | 0.0% |
| Total | 262 | 100.0% |
Employment Status by Age in Beersheba Springs
According to the labor force statistics for Beersheba Springs, out of the total population over 16 years of age (465), 57.2% or 266 individuals are in the labor force, with 1.5% or 4 of them unemployed. The age group with the highest labor force participation rate is 25 to 29 years, with 100.0% or 8 individuals in the labor force. Within the labor force, the 45 to 54 years age range has the highest percentage of unemployed individuals, with 4.1% or 4 of them being unemployed.
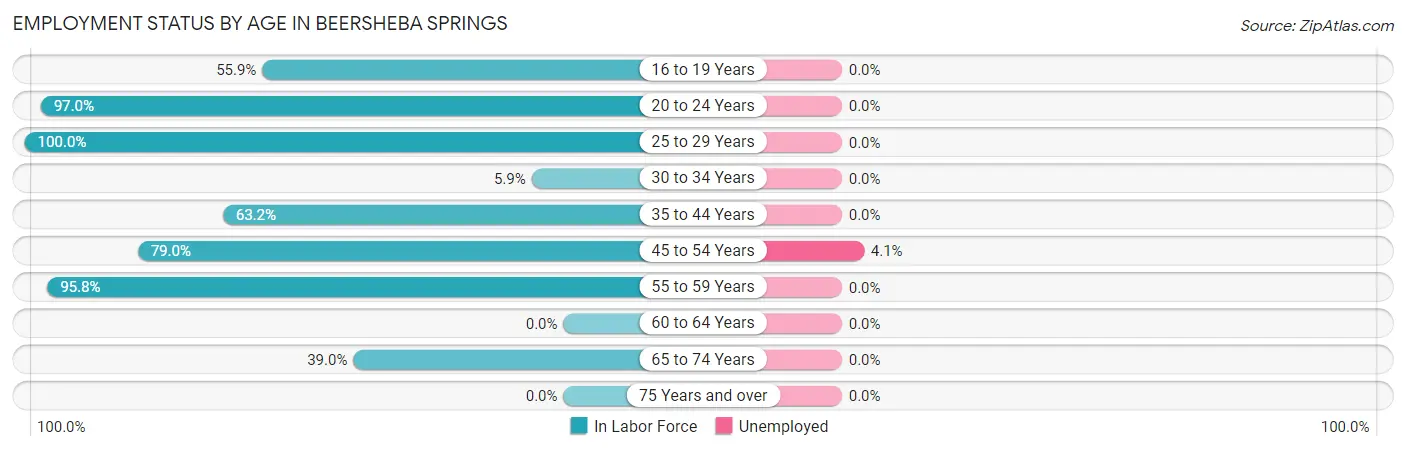
| Age Bracket | In Labor Force | Unemployed |
| 16 to 19 Years | 19 (55.9%) | 0 (0.0%) |
| 20 to 24 Years | 32 (97.0%) | 0 (0.0%) |
| 25 to 29 Years | 8 (100.0%) | 0 (0.0%) |
| 30 to 34 Years | 1 (5.9%) | 0 (0.0%) |
| 35 to 44 Years | 55 (63.2%) | 0 (0.0%) |
| 45 to 54 Years | 98 (79.0%) | 4 (4.1%) |
| 55 to 59 Years | 23 (95.8%) | 0 (0.0%) |
| 60 to 64 Years | 0 (0.0%) | 0 (0.0%) |
| 65 to 74 Years | 30 (39.0%) | 0 (0.0%) |
| 75 Years and over | 0 (0.0%) | 0 (0.0%) |
| Total | 266 (57.2%) | 4 (1.5%) |
Employment Status by Educational Attainment in Beersheba Springs
According to labor force statistics for Beersheba Springs, 65.4% of individuals (185) out of the total population between 25 and 64 years of age (283) are in the labor force, with 2.2% or 4 of them being unemployed. The group with the highest labor force participation rate are those with the educational attainment of bachelor's degree or higher, with 100.0% or 9 individuals in the labor force. Within the labor force, individuals with college / associate degree education have the highest percentage of unemployment, with 10.3% or 4 of them being unemployed.
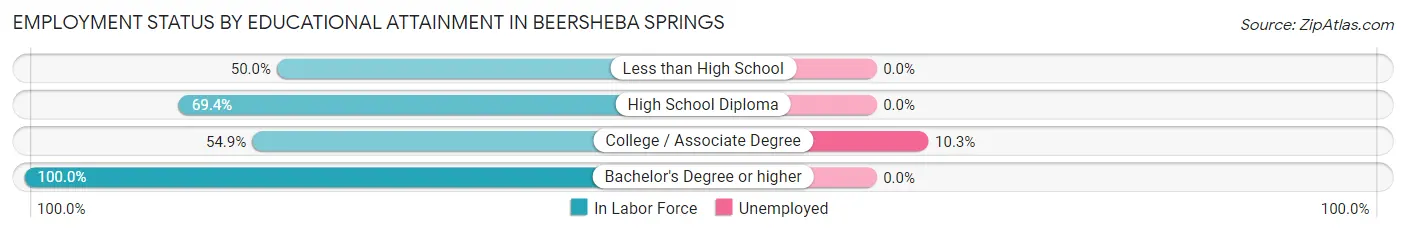
| Educational Attainment | In Labor Force | Unemployed |
| Less than High School | 10 (50.0%) | 0 (0.0%) |
| High School Diploma | 127 (69.4%) | 0 (0.0%) |
| College / Associate Degree | 39 (54.9%) | 7 (10.3%) |
| Bachelor's Degree or higher | 9 (100.0%) | 0 (0.0%) |
| Total | 185 (65.4%) | 6 (2.2%) |
Employment Occupations by Sex in Beersheba Springs
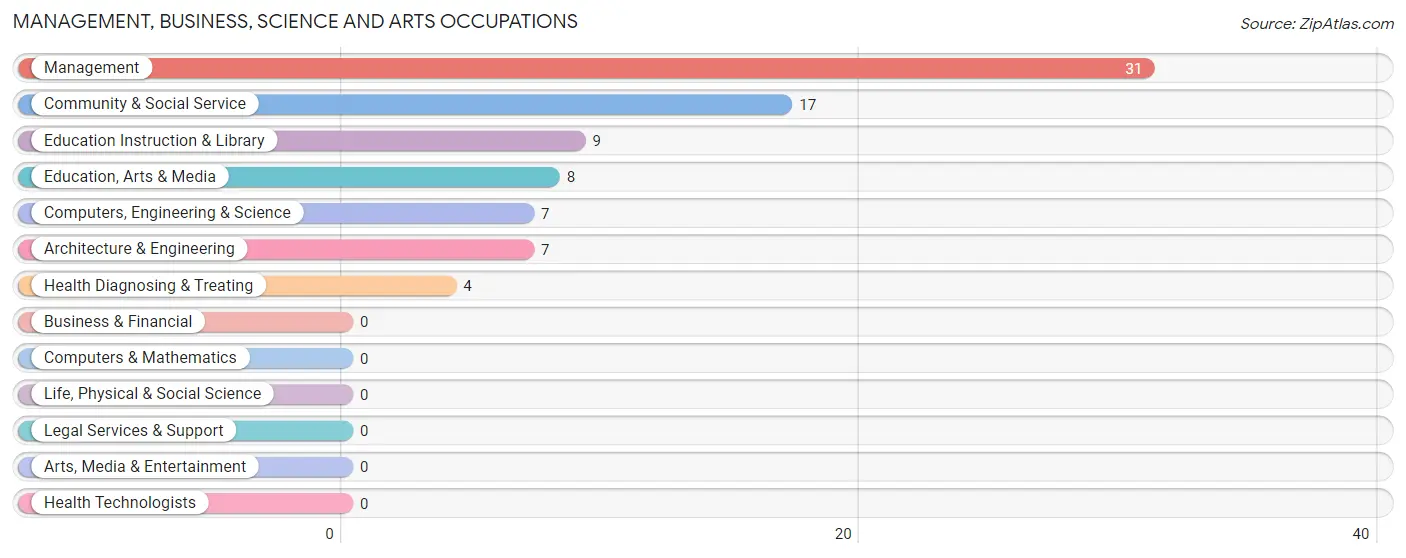
Management, Business, Science and Arts Occupations
The most common Management, Business, Science and Arts occupations in Beersheba Springs are Management (31 | 11.8%), Community & Social Service (17 | 6.5%), Education Instruction & Library (9 | 3.4%), Education, Arts & Media (8 | 3.0%), and Computers, Engineering & Science (7 | 2.7%).
Management, Business, Science and Arts Occupations by Sex
Within the Management, Business, Science and Arts occupations in Beersheba Springs, the most male-oriented occupations are Computers, Engineering & Science (100.0%), Architecture & Engineering (100.0%), and Management (58.1%), while the most female-oriented occupations are Education, Arts & Media (100.0%), Health Diagnosing & Treating (100.0%), and Community & Social Service (88.2%).
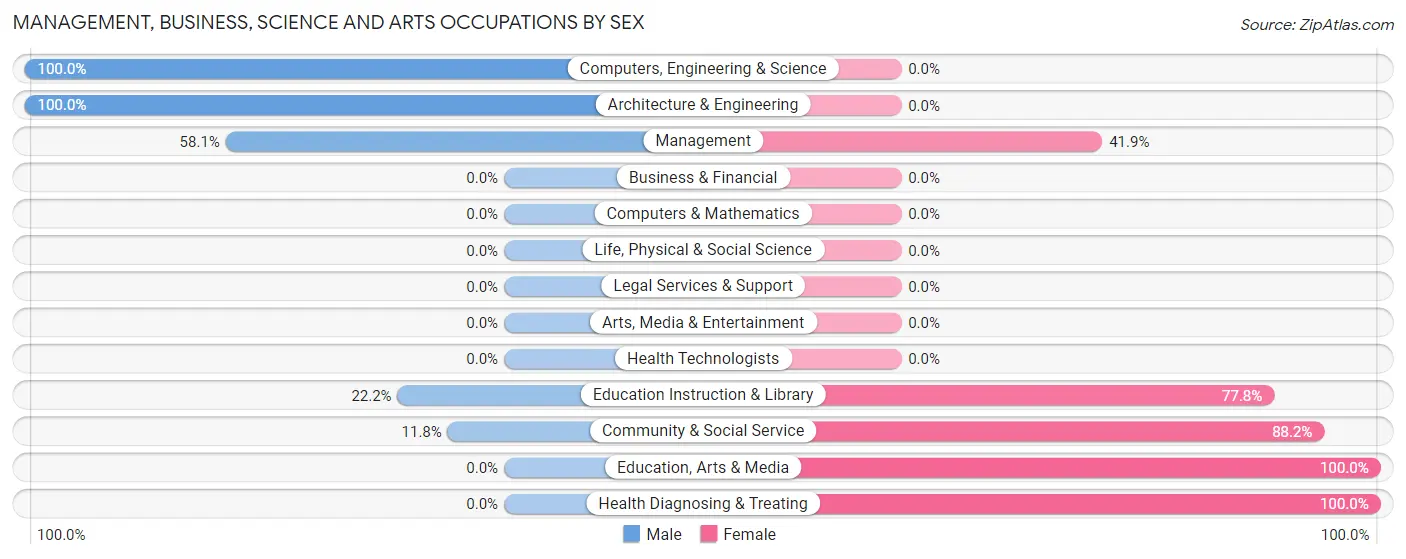
| Occupation | Male | Female |
| Management | 18 (58.1%) | 13 (41.9%) |
| Business & Financial | 0 (0.0%) | 0 (0.0%) |
| Computers, Engineering & Science | 7 (100.0%) | 0 (0.0%) |
| Computers & Mathematics | 0 (0.0%) | 0 (0.0%) |
| Architecture & Engineering | 7 (100.0%) | 0 (0.0%) |
| Life, Physical & Social Science | 0 (0.0%) | 0 (0.0%) |
| Community & Social Service | 2 (11.8%) | 15 (88.2%) |
| Education, Arts & Media | 0 (0.0%) | 8 (100.0%) |
| Legal Services & Support | 0 (0.0%) | 0 (0.0%) |
| Education Instruction & Library | 2 (22.2%) | 7 (77.8%) |
| Arts, Media & Entertainment | 0 (0.0%) | 0 (0.0%) |
| Health Diagnosing & Treating | 0 (0.0%) | 4 (100.0%) |
| Health Technologists | 0 (0.0%) | 0 (0.0%) |
| Total (Category) | 27 (45.8%) | 32 (54.2%) |
| Total (Overall) | 155 (59.2%) | 107 (40.8%) |
Services Occupations
The most common Services occupations in Beersheba Springs are Healthcare Support (15 | 5.7%), Cleaning & Maintenance (9 | 3.4%), Security & Protection (8 | 3.0%), and Firefighting & Prevention (8 | 3.0%).
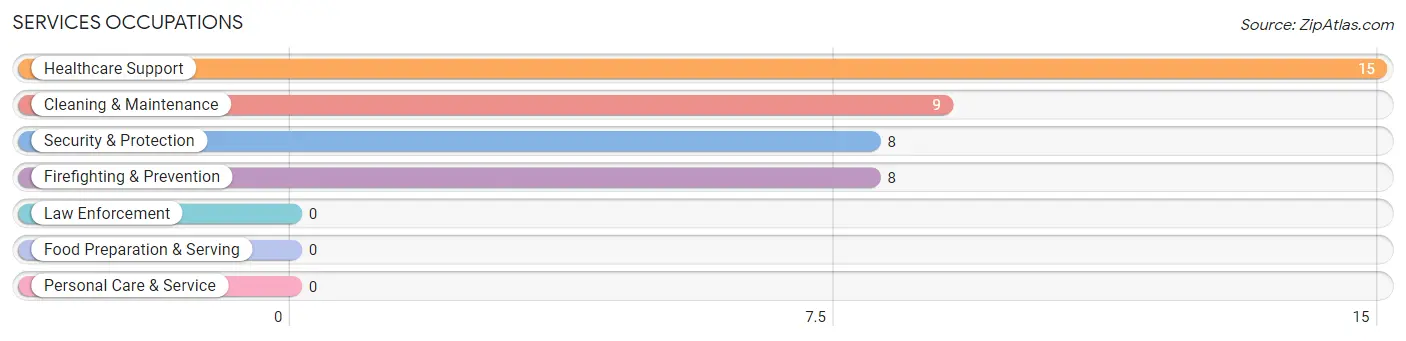
Services Occupations by Sex
Within the Services occupations in Beersheba Springs, the most male-oriented occupations are Security & Protection (100.0%), Firefighting & Prevention (100.0%), and Cleaning & Maintenance (22.2%), while the most female-oriented occupations are Healthcare Support (100.0%), and Cleaning & Maintenance (77.8%).
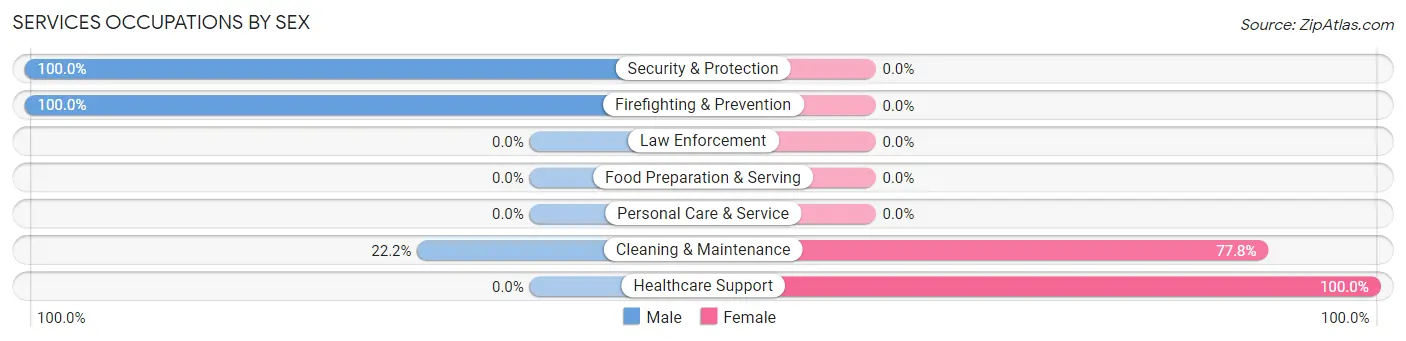
| Occupation | Male | Female |
| Healthcare Support | 0 (0.0%) | 15 (100.0%) |
| Security & Protection | 8 (100.0%) | 0 (0.0%) |
| Firefighting & Prevention | 8 (100.0%) | 0 (0.0%) |
| Law Enforcement | 0 (0.0%) | 0 (0.0%) |
| Food Preparation & Serving | 0 (0.0%) | 0 (0.0%) |
| Cleaning & Maintenance | 2 (22.2%) | 7 (77.8%) |
| Personal Care & Service | 0 (0.0%) | 0 (0.0%) |
| Total (Category) | 10 (31.2%) | 22 (68.8%) |
| Total (Overall) | 155 (59.2%) | 107 (40.8%) |
Sales and Office Occupations
The most common Sales and Office occupations in Beersheba Springs are Sales & Related (22 | 8.4%), and Office & Administration (8 | 3.0%).
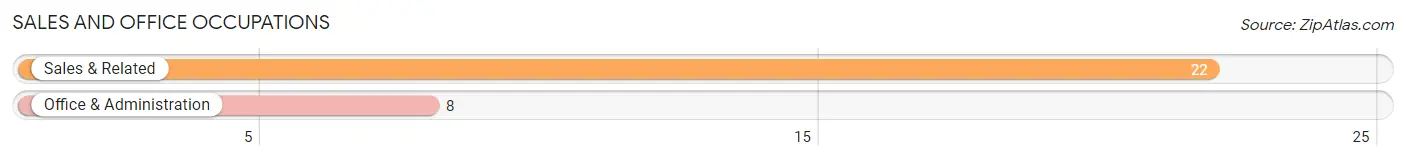
Sales and Office Occupations by Sex
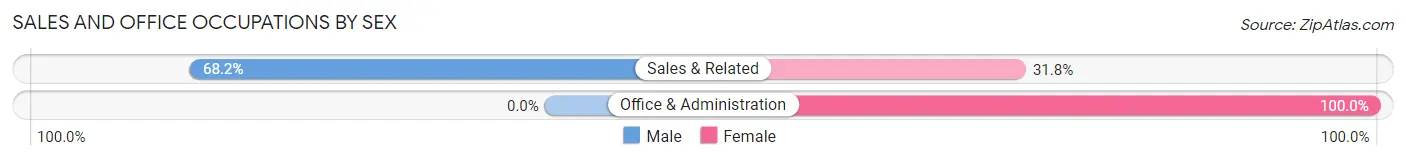
| Occupation | Male | Female |
| Sales & Related | 15 (68.2%) | 7 (31.8%) |
| Office & Administration | 0 (0.0%) | 8 (100.0%) |
| Total (Category) | 15 (50.0%) | 15 (50.0%) |
| Total (Overall) | 155 (59.2%) | 107 (40.8%) |
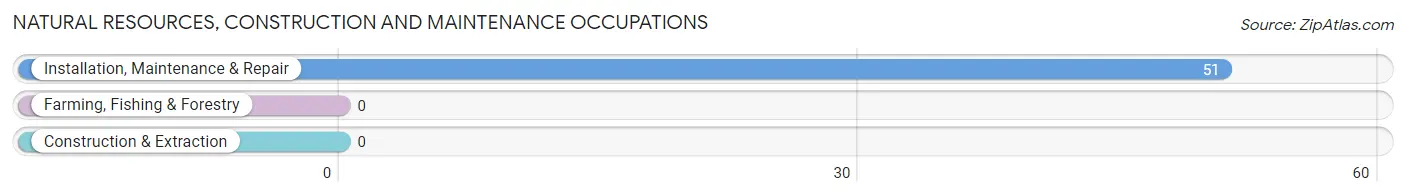
Natural Resources, Construction and Maintenance Occupations
The most common Natural Resources, Construction and Maintenance occupations in Beersheba Springs are , and Installation, Maintenance & Repair (51 | 19.5%).
Natural Resources, Construction and Maintenance Occupations by Sex
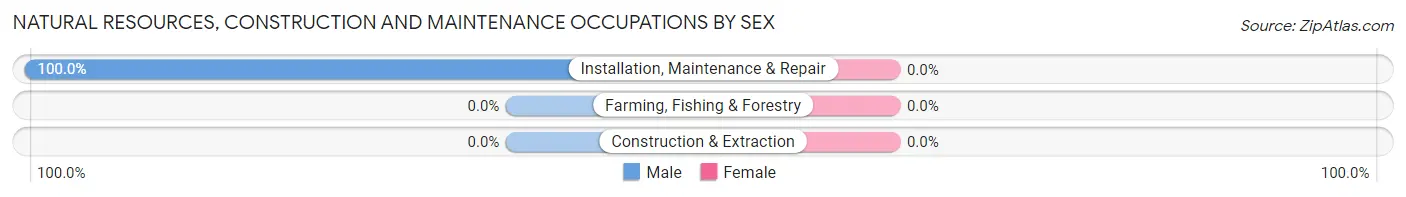
| Occupation | Male | Female |
| Farming, Fishing & Forestry | 0 (0.0%) | 0 (0.0%) |
| Construction & Extraction | 0 (0.0%) | 0 (0.0%) |
| Installation, Maintenance & Repair | 51 (100.0%) | 0 (0.0%) |
| Total (Category) | 51 (100.0%) | 0 (0.0%) |
| Total (Overall) | 155 (59.2%) | 107 (40.8%) |
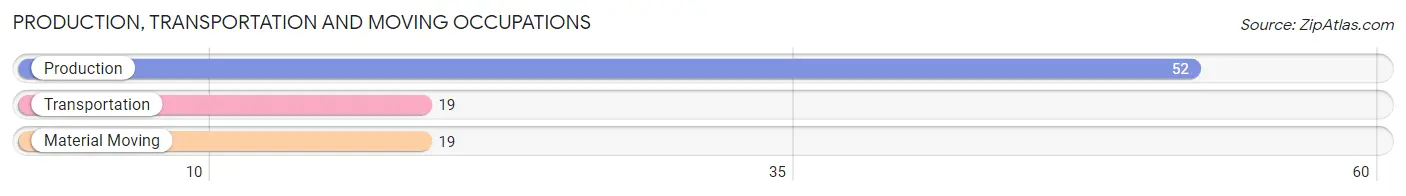
Production, Transportation and Moving Occupations
The most common Production, Transportation and Moving occupations in Beersheba Springs are Production (52 | 19.9%), Transportation (19 | 7.2%), and Material Moving (19 | 7.2%).
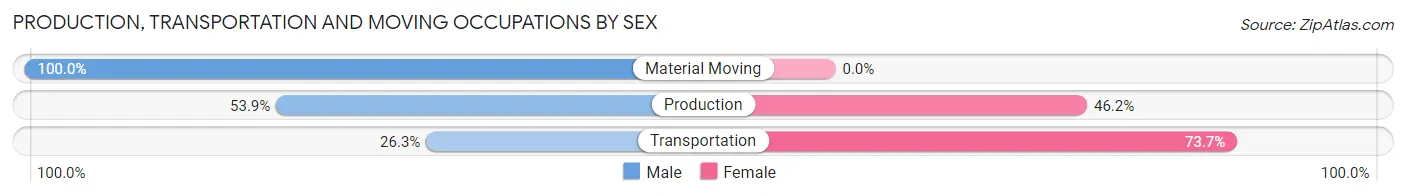
Production, Transportation and Moving Occupations by Sex
| Occupation | Male | Female |
| Production | 28 (53.8%) | 24 (46.2%) |
| Transportation | 5 (26.3%) | 14 (73.7%) |
| Material Moving | 19 (100.0%) | 0 (0.0%) |
| Total (Category) | 52 (57.8%) | 38 (42.2%) |
| Total (Overall) | 155 (59.2%) | 107 (40.8%) |
Employment Industries by Sex in Beersheba Springs
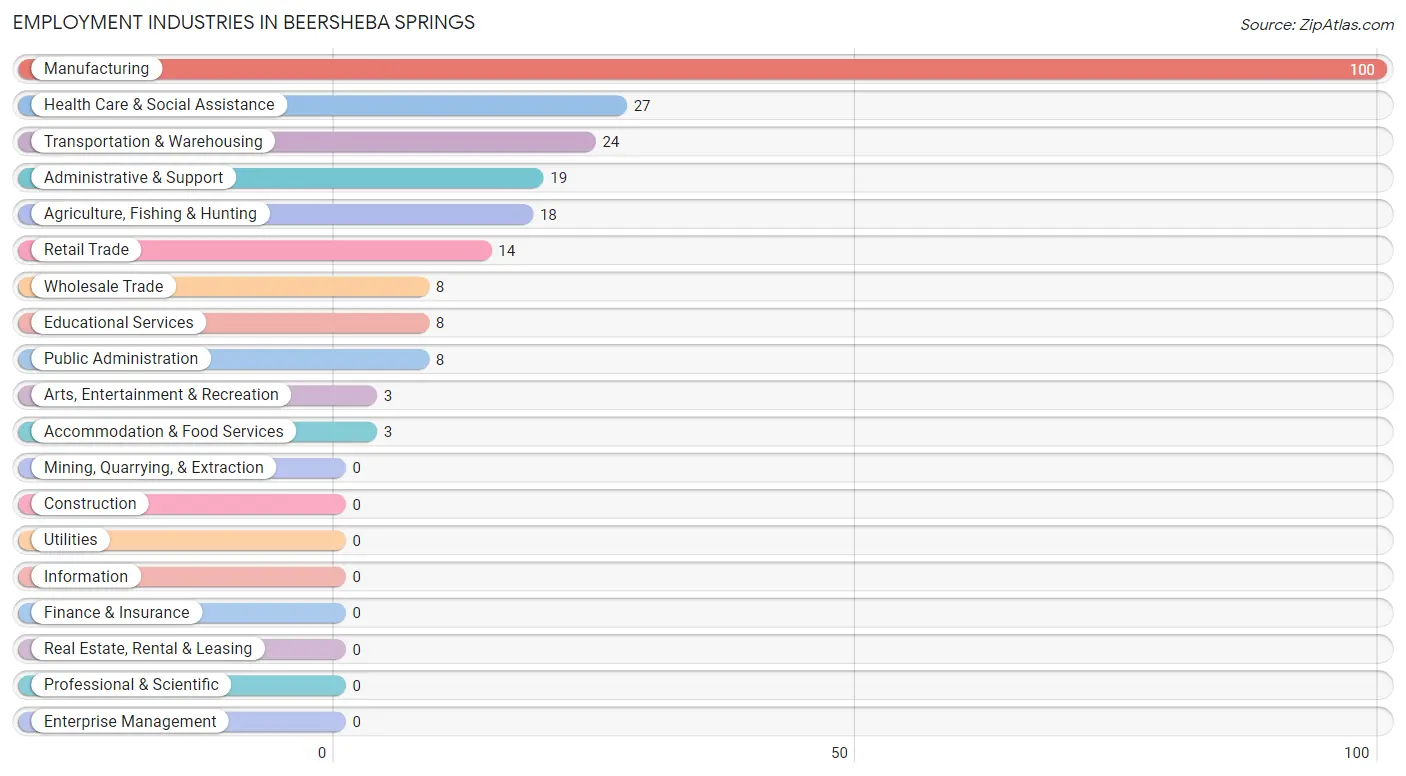
Employment Industries in Beersheba Springs
The major employment industries in Beersheba Springs include Manufacturing (100 | 38.2%), Health Care & Social Assistance (27 | 10.3%), Transportation & Warehousing (24 | 9.2%), Administrative & Support (19 | 7.2%), and Agriculture, Fishing & Hunting (18 | 6.9%).
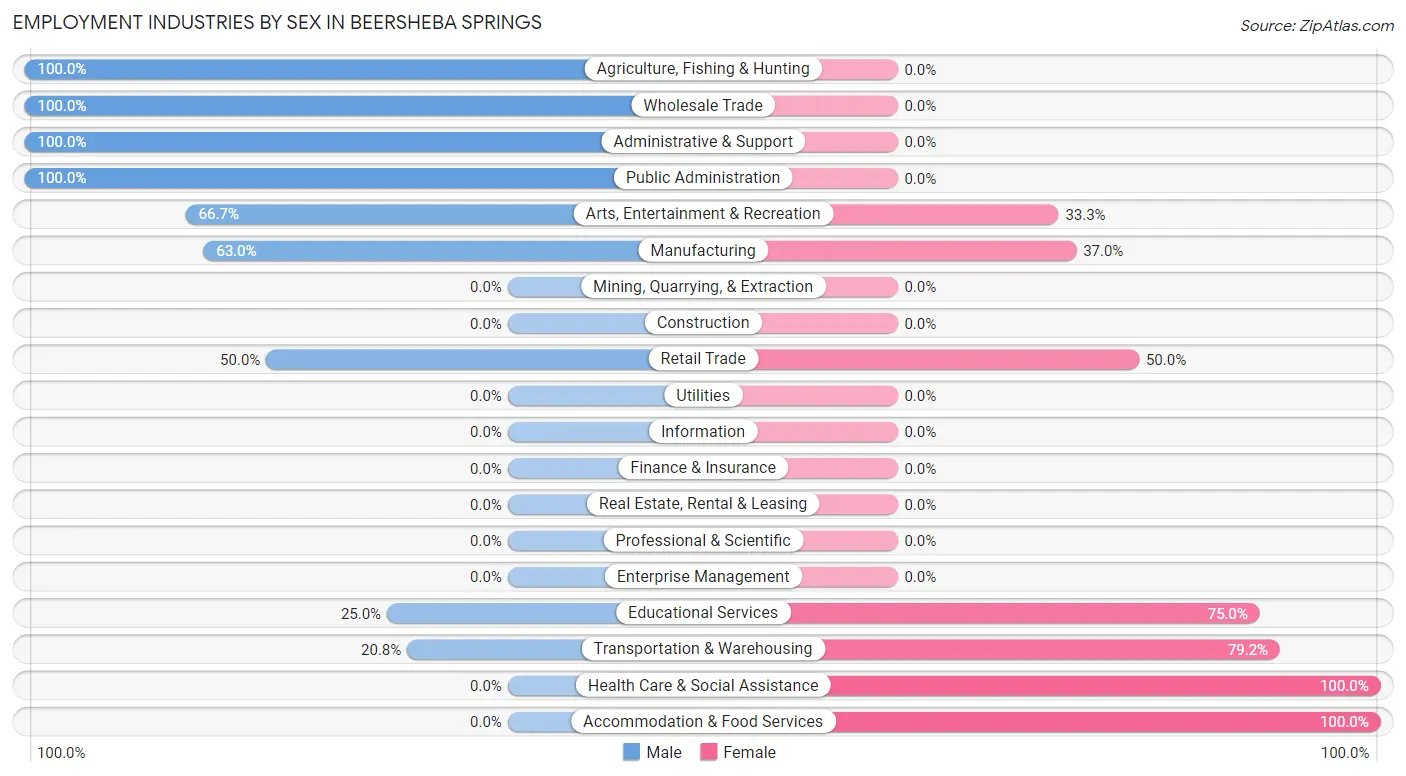
Employment Industries by Sex in Beersheba Springs
The Beersheba Springs industries that see more men than women are Agriculture, Fishing & Hunting (100.0%), Wholesale Trade (100.0%), and Administrative & Support (100.0%), whereas the industries that tend to have a higher number of women are Health Care & Social Assistance (100.0%), Accommodation & Food Services (100.0%), and Transportation & Warehousing (79.2%).
| Industry | Male | Female |
| Agriculture, Fishing & Hunting | 18 (100.0%) | 0 (0.0%) |
| Mining, Quarrying, & Extraction | 0 (0.0%) | 0 (0.0%) |
| Construction | 0 (0.0%) | 0 (0.0%) |
| Manufacturing | 63 (63.0%) | 37 (37.0%) |
| Wholesale Trade | 8 (100.0%) | 0 (0.0%) |
| Retail Trade | 7 (50.0%) | 7 (50.0%) |
| Transportation & Warehousing | 5 (20.8%) | 19 (79.2%) |
| Utilities | 0 (0.0%) | 0 (0.0%) |
| Information | 0 (0.0%) | 0 (0.0%) |
| Finance & Insurance | 0 (0.0%) | 0 (0.0%) |
| Real Estate, Rental & Leasing | 0 (0.0%) | 0 (0.0%) |
| Professional & Scientific | 0 (0.0%) | 0 (0.0%) |
| Enterprise Management | 0 (0.0%) | 0 (0.0%) |
| Administrative & Support | 19 (100.0%) | 0 (0.0%) |
| Educational Services | 2 (25.0%) | 6 (75.0%) |
| Health Care & Social Assistance | 0 (0.0%) | 27 (100.0%) |
| Arts, Entertainment & Recreation | 2 (66.7%) | 1 (33.3%) |
| Accommodation & Food Services | 0 (0.0%) | 3 (100.0%) |
| Public Administration | 8 (100.0%) | 0 (0.0%) |
| Total | 155 (59.2%) | 107 (40.8%) |
Education in Beersheba Springs
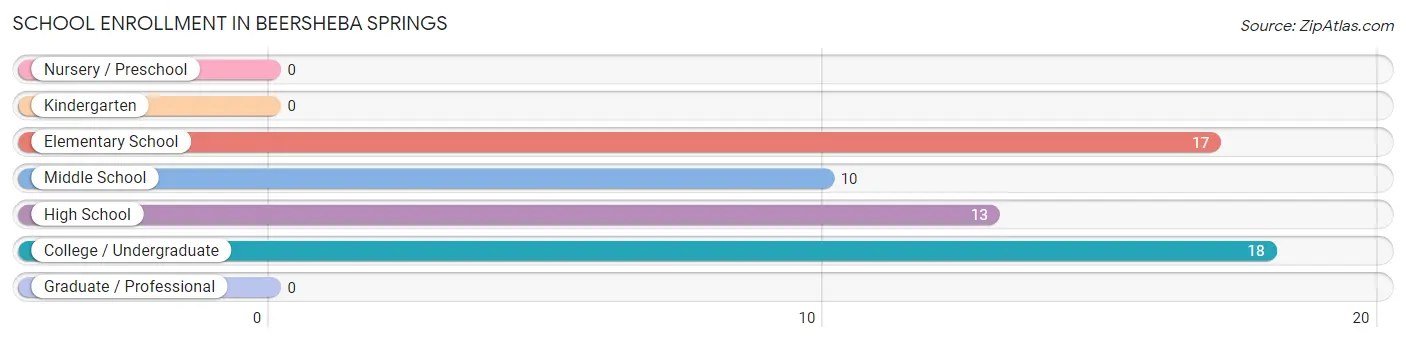
School Enrollment in Beersheba Springs
The most common levels of schooling among the 58 students in Beersheba Springs are college / undergraduate (18 | 31.0%), elementary school (17 | 29.3%), and high school (13 | 22.4%).
| School Level | # Students | % Students |
| Nursery / Preschool | 0 | 0.0% |
| Kindergarten | 0 | 0.0% |
| Elementary School | 17 | 29.3% |
| Middle School | 10 | 17.2% |
| High School | 13 | 22.4% |
| College / Undergraduate | 18 | 31.0% |
| Graduate / Professional | 0 | 0.0% |
| Total | 58 | 100.0% |
School Enrollment by Age by Funding Source in Beersheba Springs
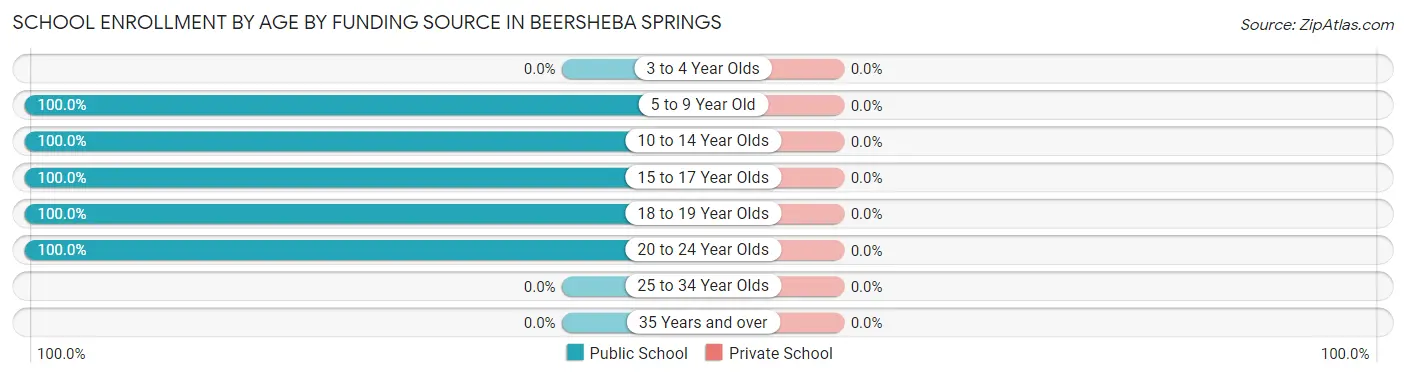
| Age Bracket | Public School | Private School |
| 3 to 4 Year Olds | 0 (0.0%) | 0 (0.0%) |
| 5 to 9 Year Old | 17 (100.0%) | 0 (0.0%) |
| 10 to 14 Year Olds | 10 (100.0%) | 0 (0.0%) |
| 15 to 17 Year Olds | 13 (100.0%) | 0 (0.0%) |
| 18 to 19 Year Olds | 10 (100.0%) | 0 (0.0%) |
| 20 to 24 Year Olds | 8 (100.0%) | 0 (0.0%) |
| 25 to 34 Year Olds | 0 (0.0%) | 0 (0.0%) |
| 35 Years and over | 0 (0.0%) | 0 (0.0%) |
| Total | 58 (100.0%) | 0 (0.0%) |
Educational Attainment by Field of Study in Beersheba Springs
Engineering (9 | 50.0%), computers & mathematics (7 | 38.9%), and arts & humanities (2 | 11.1%) are the most common fields of study among 18 individuals in Beersheba Springs who have obtained a bachelor's degree or higher.
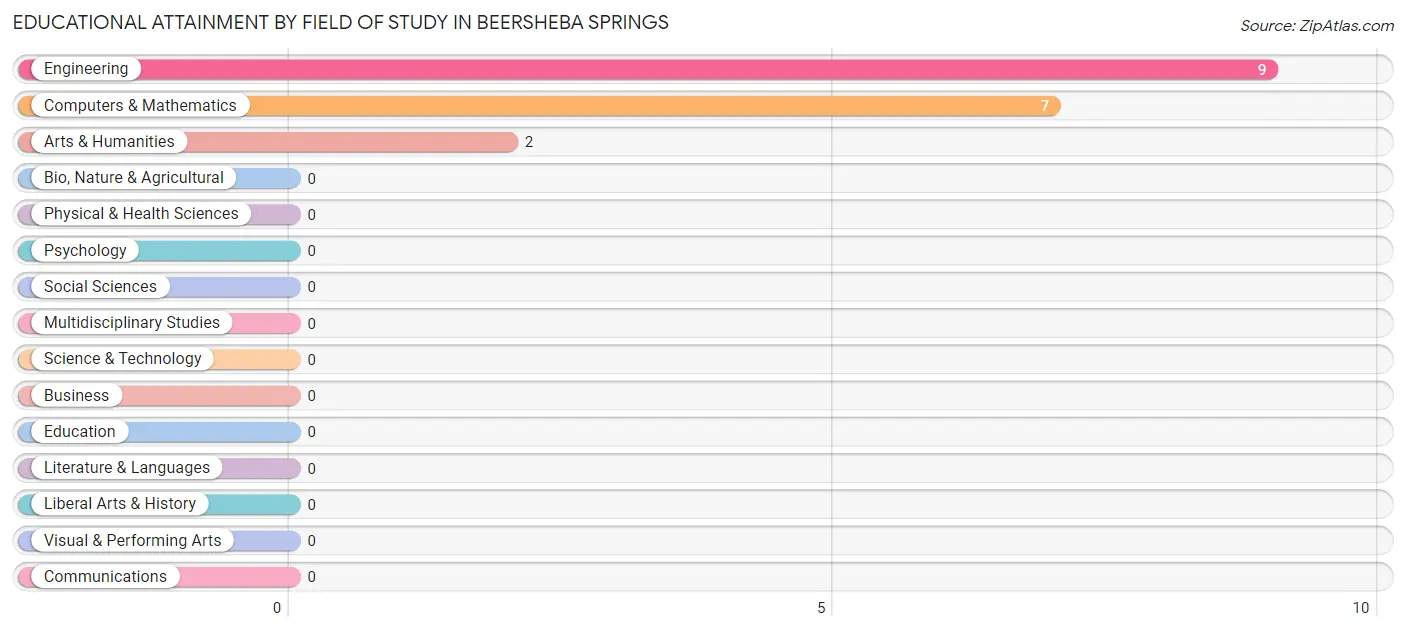
| Field of Study | # Graduates | % Graduates |
| Computers & Mathematics | 7 | 38.9% |
| Bio, Nature & Agricultural | 0 | 0.0% |
| Physical & Health Sciences | 0 | 0.0% |
| Psychology | 0 | 0.0% |
| Social Sciences | 0 | 0.0% |
| Engineering | 9 | 50.0% |
| Multidisciplinary Studies | 0 | 0.0% |
| Science & Technology | 0 | 0.0% |
| Business | 0 | 0.0% |
| Education | 0 | 0.0% |
| Literature & Languages | 0 | 0.0% |
| Liberal Arts & History | 0 | 0.0% |
| Visual & Performing Arts | 0 | 0.0% |
| Communications | 0 | 0.0% |
| Arts & Humanities | 2 | 11.1% |
| Total | 18 | 100.0% |
Transportation & Commute in Beersheba Springs
Vehicle Availability by Sex in Beersheba Springs
The most prevalent vehicle ownership categories in Beersheba Springs are males with 3 vehicles (49, accounting for 31.6%) and females with 3 vehicles (50, making up 45.8%).
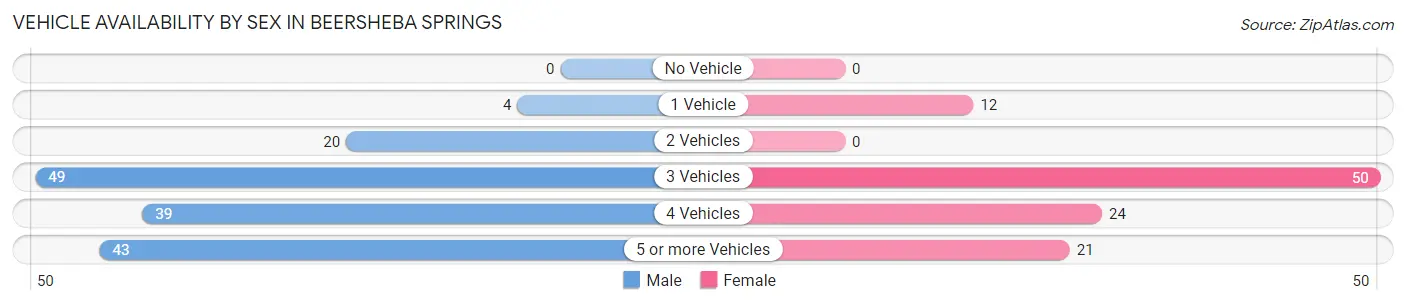
| Vehicles Available | Male | Female |
| No Vehicle | 0 (0.0%) | 0 (0.0%) |
| 1 Vehicle | 4 (2.6%) | 12 (11.2%) |
| 2 Vehicles | 20 (12.9%) | 0 (0.0%) |
| 3 Vehicles | 49 (31.6%) | 50 (46.7%) |
| 4 Vehicles | 39 (25.2%) | 24 (22.4%) |
| 5 or more Vehicles | 43 (27.7%) | 21 (19.6%) |
| Total | 155 (100.0%) | 107 (100.0%) |
Commute Time in Beersheba Springs
The most frequently occuring commute durations in Beersheba Springs are 45 to 59 minutes (59 commuters, 23.1%), 35 to 39 minutes (35 commuters, 13.7%), and 10 to 14 minutes (31 commuters, 12.2%).
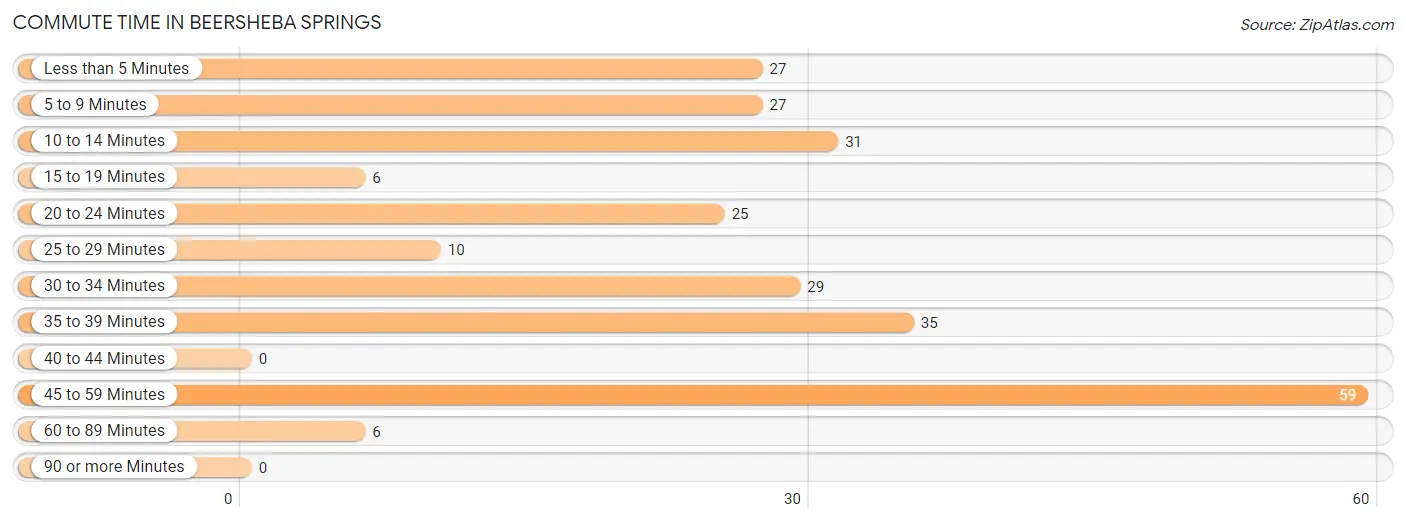
| Commute Time | # Commuters | % Commuters |
| Less than 5 Minutes | 27 | 10.6% |
| 5 to 9 Minutes | 27 | 10.6% |
| 10 to 14 Minutes | 31 | 12.2% |
| 15 to 19 Minutes | 6 | 2.4% |
| 20 to 24 Minutes | 25 | 9.8% |
| 25 to 29 Minutes | 10 | 3.9% |
| 30 to 34 Minutes | 29 | 11.4% |
| 35 to 39 Minutes | 35 | 13.7% |
| 40 to 44 Minutes | 0 | 0.0% |
| 45 to 59 Minutes | 59 | 23.1% |
| 60 to 89 Minutes | 6 | 2.4% |
| 90 or more Minutes | 0 | 0.0% |
Commute Time by Sex in Beersheba Springs
The most common commute times in Beersheba Springs are 45 to 59 minutes (52 commuters, 33.6%) for males and 35 to 39 minutes (26 commuters, 26.0%) for females.
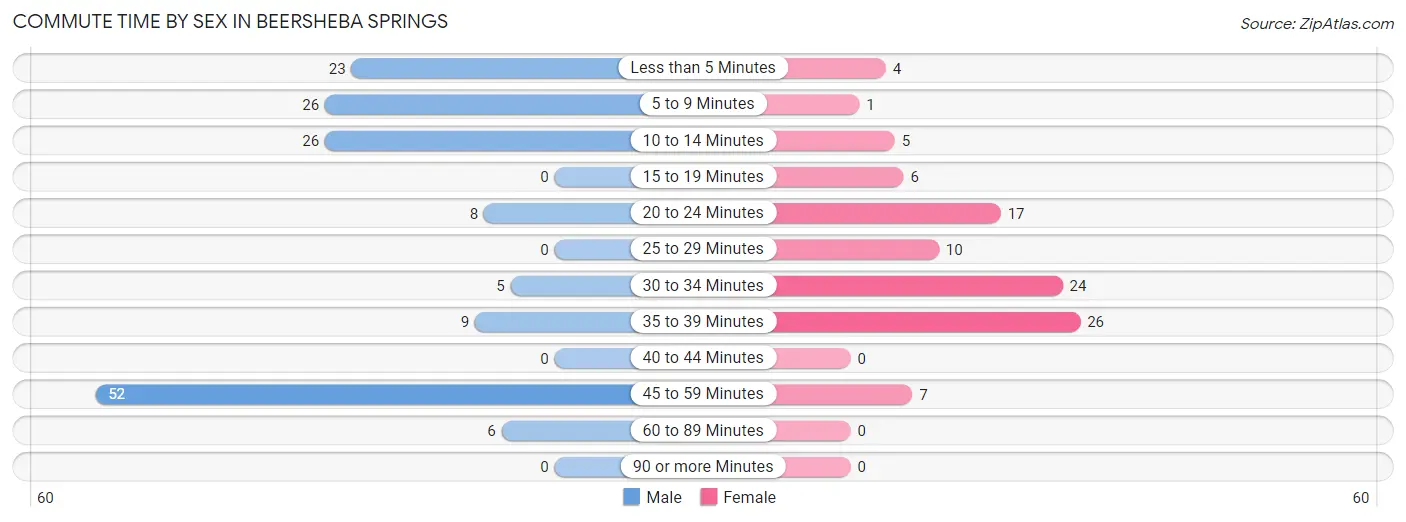
| Commute Time | Male | Female |
| Less than 5 Minutes | 23 (14.8%) | 4 (4.0%) |
| 5 to 9 Minutes | 26 (16.8%) | 1 (1.0%) |
| 10 to 14 Minutes | 26 (16.8%) | 5 (5.0%) |
| 15 to 19 Minutes | 0 (0.0%) | 6 (6.0%) |
| 20 to 24 Minutes | 8 (5.2%) | 17 (17.0%) |
| 25 to 29 Minutes | 0 (0.0%) | 10 (10.0%) |
| 30 to 34 Minutes | 5 (3.2%) | 24 (24.0%) |
| 35 to 39 Minutes | 9 (5.8%) | 26 (26.0%) |
| 40 to 44 Minutes | 0 (0.0%) | 0 (0.0%) |
| 45 to 59 Minutes | 52 (33.6%) | 7 (7.0%) |
| 60 to 89 Minutes | 6 (3.9%) | 0 (0.0%) |
| 90 or more Minutes | 0 (0.0%) | 0 (0.0%) |
Time of Departure to Work by Sex in Beersheba Springs
The most frequent times of departure to work in Beersheba Springs are 12:00 AM to 4:59 AM (39, 25.2%) for males and 6:00 AM to 6:29 AM (28, 28.0%) for females.
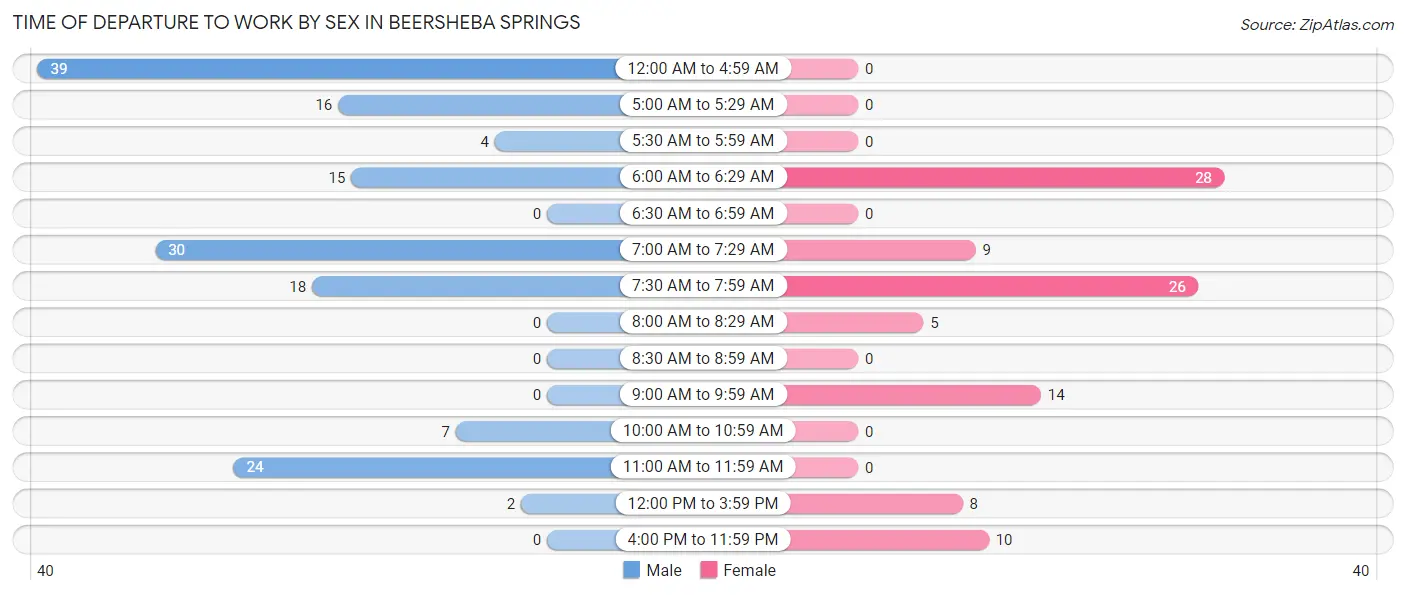
| Time of Departure | Male | Female |
| 12:00 AM to 4:59 AM | 39 (25.2%) | 0 (0.0%) |
| 5:00 AM to 5:29 AM | 16 (10.3%) | 0 (0.0%) |
| 5:30 AM to 5:59 AM | 4 (2.6%) | 0 (0.0%) |
| 6:00 AM to 6:29 AM | 15 (9.7%) | 28 (28.0%) |
| 6:30 AM to 6:59 AM | 0 (0.0%) | 0 (0.0%) |
| 7:00 AM to 7:29 AM | 30 (19.4%) | 9 (9.0%) |
| 7:30 AM to 7:59 AM | 18 (11.6%) | 26 (26.0%) |
| 8:00 AM to 8:29 AM | 0 (0.0%) | 5 (5.0%) |
| 8:30 AM to 8:59 AM | 0 (0.0%) | 0 (0.0%) |
| 9:00 AM to 9:59 AM | 0 (0.0%) | 14 (14.0%) |
| 10:00 AM to 10:59 AM | 7 (4.5%) | 0 (0.0%) |
| 11:00 AM to 11:59 AM | 24 (15.5%) | 0 (0.0%) |
| 12:00 PM to 3:59 PM | 2 (1.3%) | 8 (8.0%) |
| 4:00 PM to 11:59 PM | 0 (0.0%) | 10 (10.0%) |
| Total | 155 (100.0%) | 100 (100.0%) |
Housing Occupancy in Beersheba Springs
Occupancy by Ownership in Beersheba Springs
Of the total 194 dwellings in Beersheba Springs, owner-occupied units account for 193 (99.5%), while renter-occupied units make up 1 (0.5%).
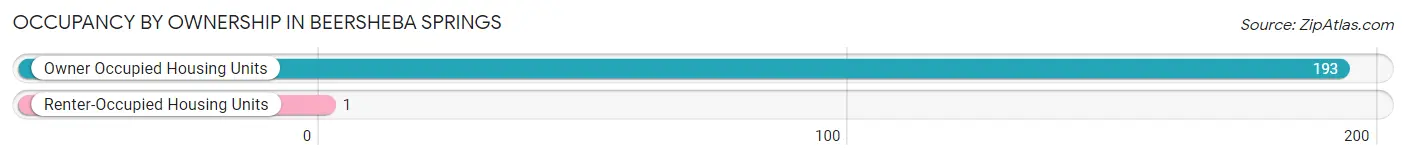
| Occupancy | # Housing Units | % Housing Units |
| Owner Occupied Housing Units | 193 | 99.5% |
| Renter-Occupied Housing Units | 1 | 0.5% |
| Total Occupied Housing Units | 194 | 100.0% |
Occupancy by Household Size in Beersheba Springs
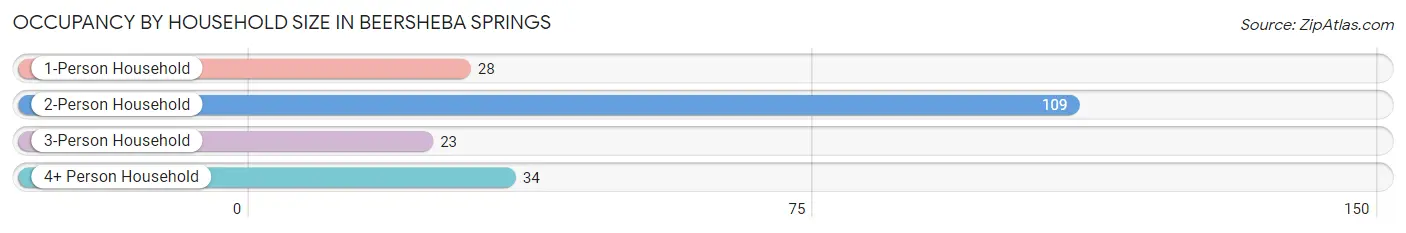
| Household Size | # Housing Units | % Housing Units |
| 1-Person Household | 28 | 14.4% |
| 2-Person Household | 109 | 56.2% |
| 3-Person Household | 23 | 11.9% |
| 4+ Person Household | 34 | 17.5% |
| Total Housing Units | 194 | 100.0% |
Occupancy by Ownership by Household Size in Beersheba Springs
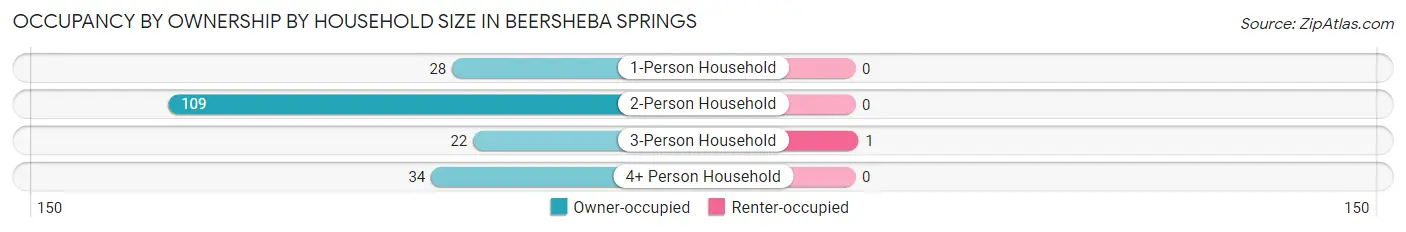
| Household Size | Owner-occupied | Renter-occupied |
| 1-Person Household | 28 (100.0%) | 0 (0.0%) |
| 2-Person Household | 109 (100.0%) | 0 (0.0%) |
| 3-Person Household | 22 (95.7%) | 1 (4.3%) |
| 4+ Person Household | 34 (100.0%) | 0 (0.0%) |
| Total Housing Units | 193 (99.5%) | 1 (0.5%) |
Occupancy by Educational Attainment in Beersheba Springs
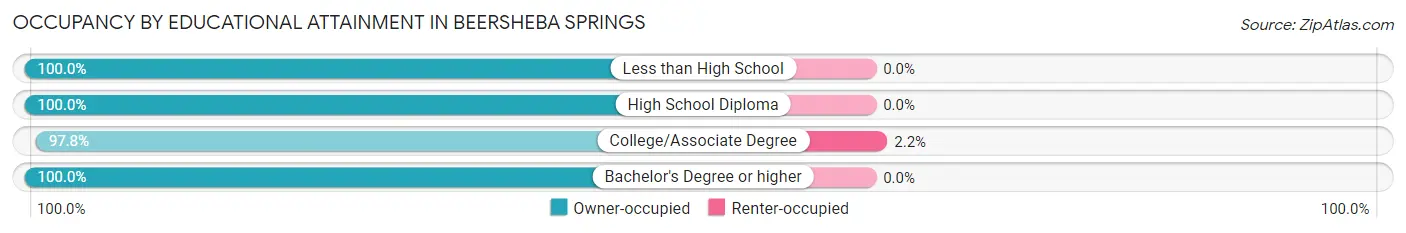
| Household Size | Owner-occupied | Renter-occupied |
| Less than High School | 56 (100.0%) | 0 (0.0%) |
| High School Diploma | 75 (100.0%) | 0 (0.0%) |
| College/Associate Degree | 44 (97.8%) | 1 (2.2%) |
| Bachelor's Degree or higher | 18 (100.0%) | 0 (0.0%) |
Occupancy by Age of Householder in Beersheba Springs
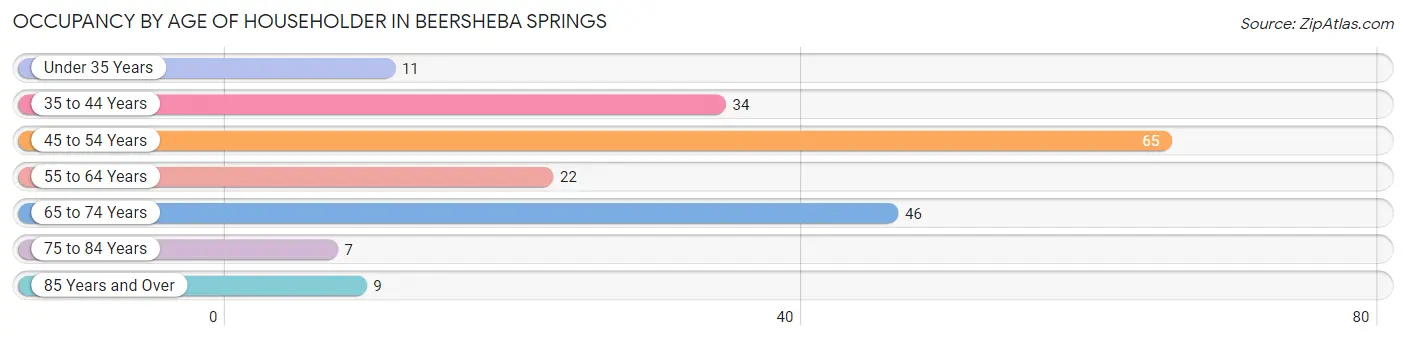
| Age Bracket | # Households | % Households |
| Under 35 Years | 11 | 5.7% |
| 35 to 44 Years | 34 | 17.5% |
| 45 to 54 Years | 65 | 33.5% |
| 55 to 64 Years | 22 | 11.3% |
| 65 to 74 Years | 46 | 23.7% |
| 75 to 84 Years | 7 | 3.6% |
| 85 Years and Over | 9 | 4.6% |
| Total | 194 | 100.0% |
Housing Finances in Beersheba Springs
Median Income by Occupancy in Beersheba Springs
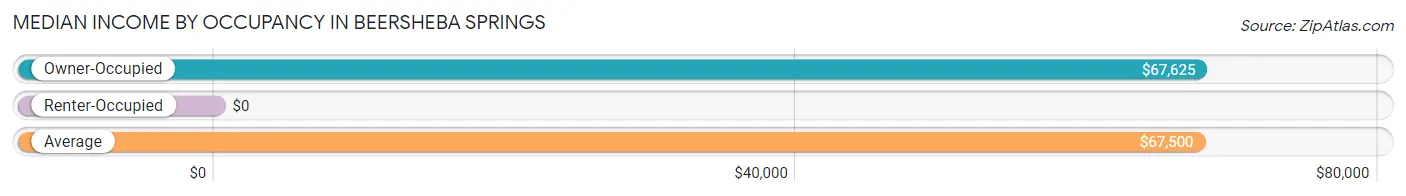
| Occupancy Type | # Households | Median Income |
| Owner-Occupied | 193 (99.5%) | $67,625 |
| Renter-Occupied | 1 (0.5%) | $0 |
| Average | 194 (100.0%) | $67,500 |
Occupancy by Householder Income Bracket in Beersheba Springs
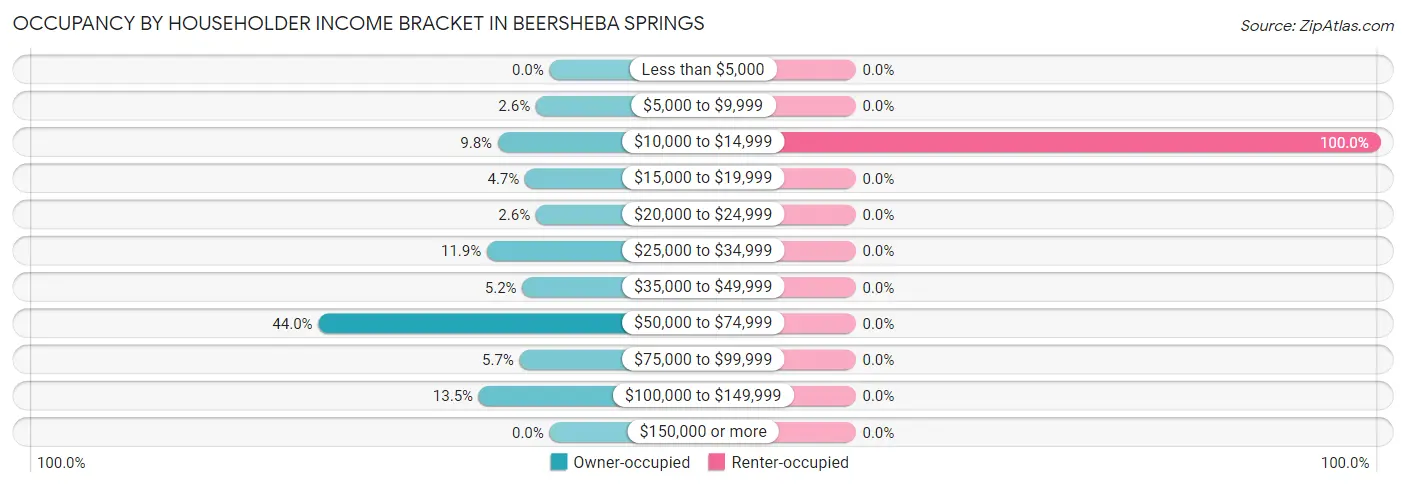
| Income Bracket | Owner-occupied | Renter-occupied |
| Less than $5,000 | 0 (0.0%) | 0 (0.0%) |
| $5,000 to $9,999 | 5 (2.6%) | 0 (0.0%) |
| $10,000 to $14,999 | 19 (9.8%) | 1 (100.0%) |
| $15,000 to $19,999 | 9 (4.7%) | 0 (0.0%) |
| $20,000 to $24,999 | 5 (2.6%) | 0 (0.0%) |
| $25,000 to $34,999 | 23 (11.9%) | 0 (0.0%) |
| $35,000 to $49,999 | 10 (5.2%) | 0 (0.0%) |
| $50,000 to $74,999 | 85 (44.0%) | 0 (0.0%) |
| $75,000 to $99,999 | 11 (5.7%) | 0 (0.0%) |
| $100,000 to $149,999 | 26 (13.5%) | 0 (0.0%) |
| $150,000 or more | 0 (0.0%) | 0 (0.0%) |
| Total | 193 (100.0%) | 1 (100.0%) |
Monthly Housing Cost Tiers in Beersheba Springs
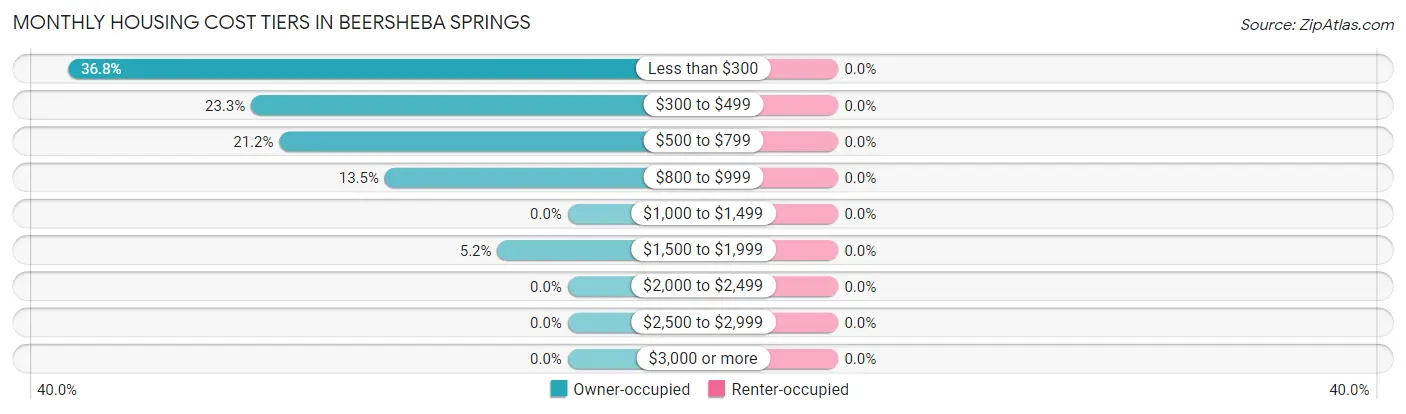
| Monthly Cost | Owner-occupied | Renter-occupied |
| Less than $300 | 71 (36.8%) | 0 (0.0%) |
| $300 to $499 | 45 (23.3%) | 0 (0.0%) |
| $500 to $799 | 41 (21.2%) | 0 (0.0%) |
| $800 to $999 | 26 (13.5%) | 0 (0.0%) |
| $1,000 to $1,499 | 0 (0.0%) | 0 (0.0%) |
| $1,500 to $1,999 | 10 (5.2%) | 0 (0.0%) |
| $2,000 to $2,499 | 0 (0.0%) | 0 (0.0%) |
| $2,500 to $2,999 | 0 (0.0%) | 0 (0.0%) |
| $3,000 or more | 0 (0.0%) | 0 (0.0%) |
| Total | 193 (100.0%) | 1 (100.0%) |
Physical Housing Characteristics in Beersheba Springs
Housing Structures in Beersheba Springs
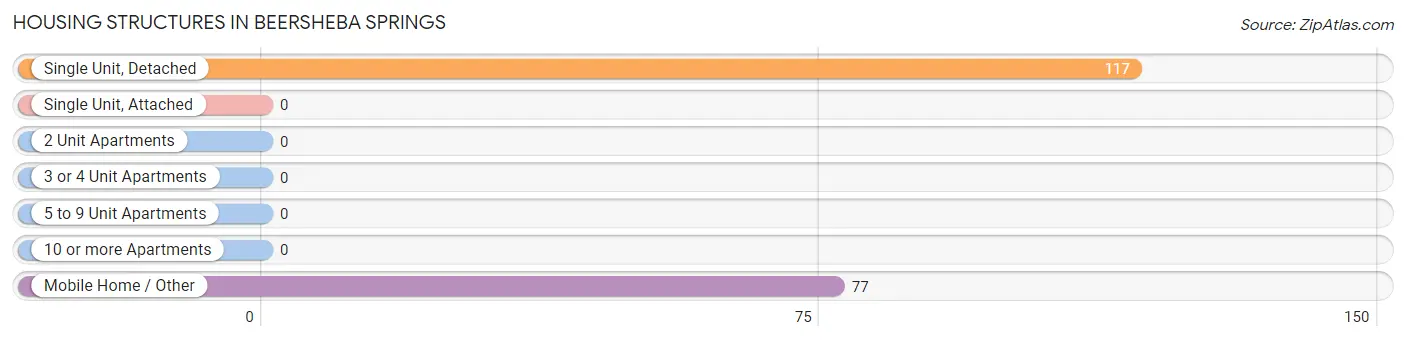
| Structure Type | # Housing Units | % Housing Units |
| Single Unit, Detached | 117 | 60.3% |
| Single Unit, Attached | 0 | 0.0% |
| 2 Unit Apartments | 0 | 0.0% |
| 3 or 4 Unit Apartments | 0 | 0.0% |
| 5 to 9 Unit Apartments | 0 | 0.0% |
| 10 or more Apartments | 0 | 0.0% |
| Mobile Home / Other | 77 | 39.7% |
| Total | 194 | 100.0% |
Housing Structures by Occupancy in Beersheba Springs
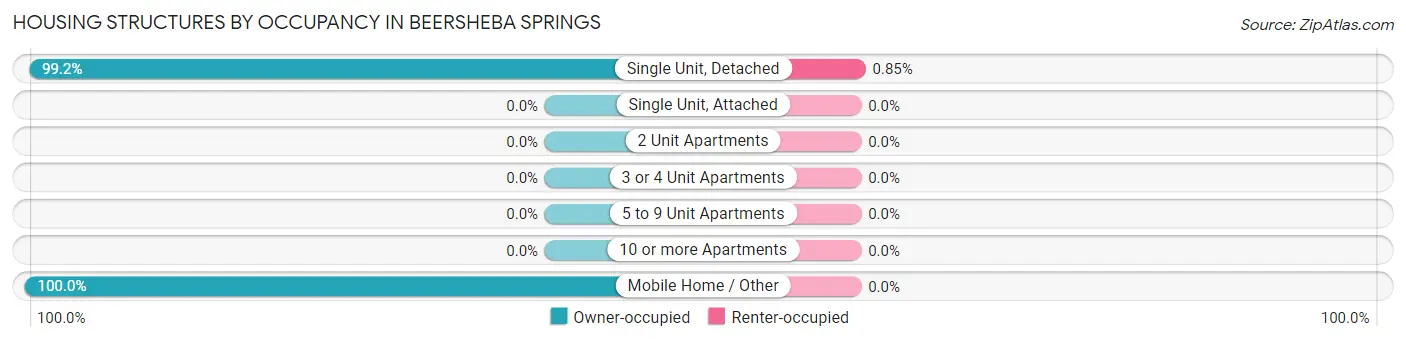
| Structure Type | Owner-occupied | Renter-occupied |
| Single Unit, Detached | 116 (99.2%) | 1 (0.9%) |
| Single Unit, Attached | 0 (0.0%) | 0 (0.0%) |
| 2 Unit Apartments | 0 (0.0%) | 0 (0.0%) |
| 3 or 4 Unit Apartments | 0 (0.0%) | 0 (0.0%) |
| 5 to 9 Unit Apartments | 0 (0.0%) | 0 (0.0%) |
| 10 or more Apartments | 0 (0.0%) | 0 (0.0%) |
| Mobile Home / Other | 77 (100.0%) | 0 (0.0%) |
| Total | 193 (99.5%) | 1 (0.5%) |
Housing Structures by Number of Rooms in Beersheba Springs
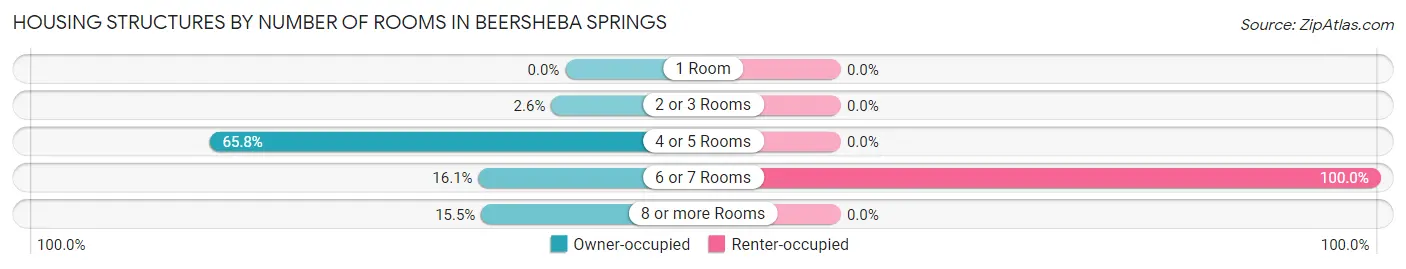
| Number of Rooms | Owner-occupied | Renter-occupied |
| 1 Room | 0 (0.0%) | 0 (0.0%) |
| 2 or 3 Rooms | 5 (2.6%) | 0 (0.0%) |
| 4 or 5 Rooms | 127 (65.8%) | 0 (0.0%) |
| 6 or 7 Rooms | 31 (16.1%) | 1 (100.0%) |
| 8 or more Rooms | 30 (15.5%) | 0 (0.0%) |
| Total | 193 (100.0%) | 1 (100.0%) |
Housing Structure by Heating Type in Beersheba Springs
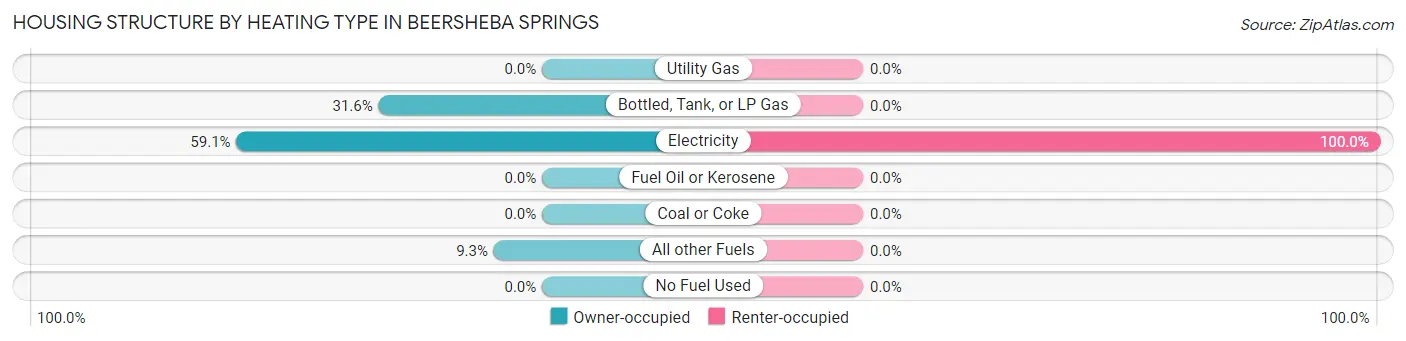
| Heating Type | Owner-occupied | Renter-occupied |
| Utility Gas | 0 (0.0%) | 0 (0.0%) |
| Bottled, Tank, or LP Gas | 61 (31.6%) | 0 (0.0%) |
| Electricity | 114 (59.1%) | 1 (100.0%) |
| Fuel Oil or Kerosene | 0 (0.0%) | 0 (0.0%) |
| Coal or Coke | 0 (0.0%) | 0 (0.0%) |
| All other Fuels | 18 (9.3%) | 0 (0.0%) |
| No Fuel Used | 0 (0.0%) | 0 (0.0%) |
| Total | 193 (100.0%) | 1 (100.0%) |
Household Vehicle Usage in Beersheba Springs
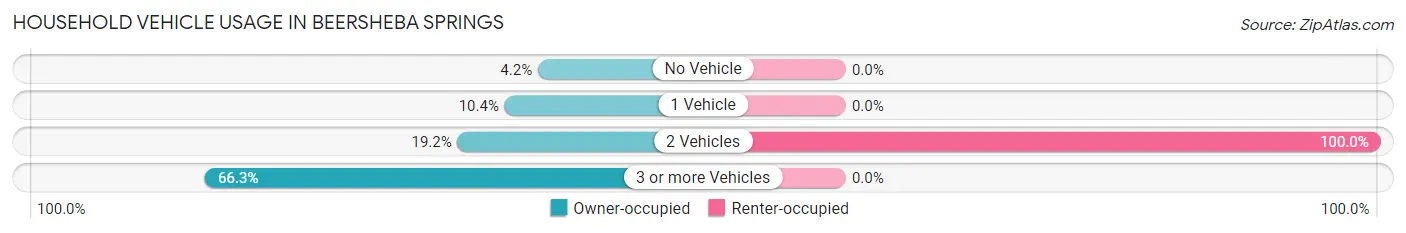
| Vehicles per Household | Owner-occupied | Renter-occupied |
| No Vehicle | 8 (4.2%) | 0 (0.0%) |
| 1 Vehicle | 20 (10.4%) | 0 (0.0%) |
| 2 Vehicles | 37 (19.2%) | 1 (100.0%) |
| 3 or more Vehicles | 128 (66.3%) | 0 (0.0%) |
| Total | 193 (100.0%) | 1 (100.0%) |
Real Estate & Mortgages in Beersheba Springs
Real Estate and Mortgage Overview in Beersheba Springs
| Characteristic | Without Mortgage | With Mortgage |
| Housing Units | 119 | 74 |
| Median Property Value | - | - |
| Median Household Income | $57,292 | $0 |
| Monthly Housing Costs | $289 | $0 |
| Real Estate Taxes | $370 | $0 |
Property Value by Mortgage Status in Beersheba Springs
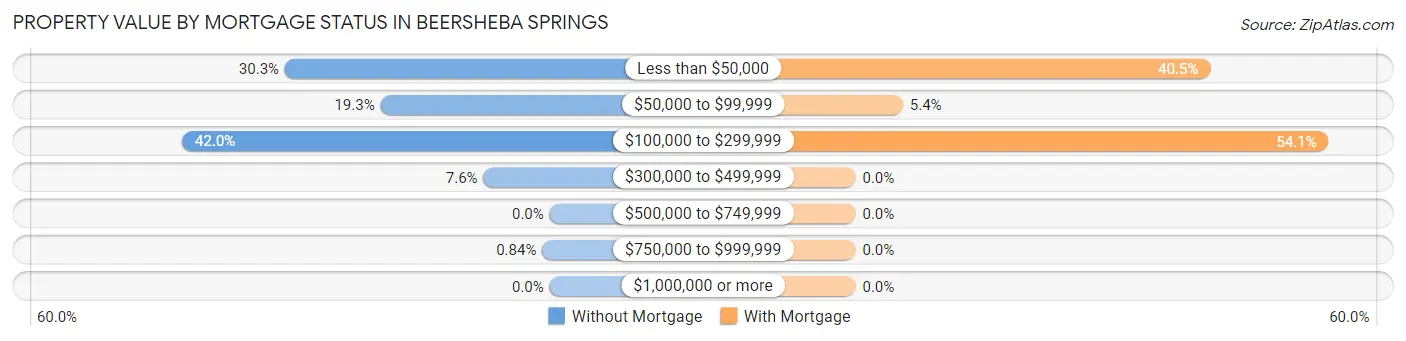
| Property Value | Without Mortgage | With Mortgage |
| Less than $50,000 | 36 (30.2%) | 30 (40.5%) |
| $50,000 to $99,999 | 23 (19.3%) | 4 (5.4%) |
| $100,000 to $299,999 | 50 (42.0%) | 40 (54.0%) |
| $300,000 to $499,999 | 9 (7.6%) | 0 (0.0%) |
| $500,000 to $749,999 | 0 (0.0%) | 0 (0.0%) |
| $750,000 to $999,999 | 1 (0.8%) | 0 (0.0%) |
| $1,000,000 or more | 0 (0.0%) | 0 (0.0%) |
| Total | 119 (100.0%) | 74 (100.0%) |
Household Income by Mortgage Status in Beersheba Springs
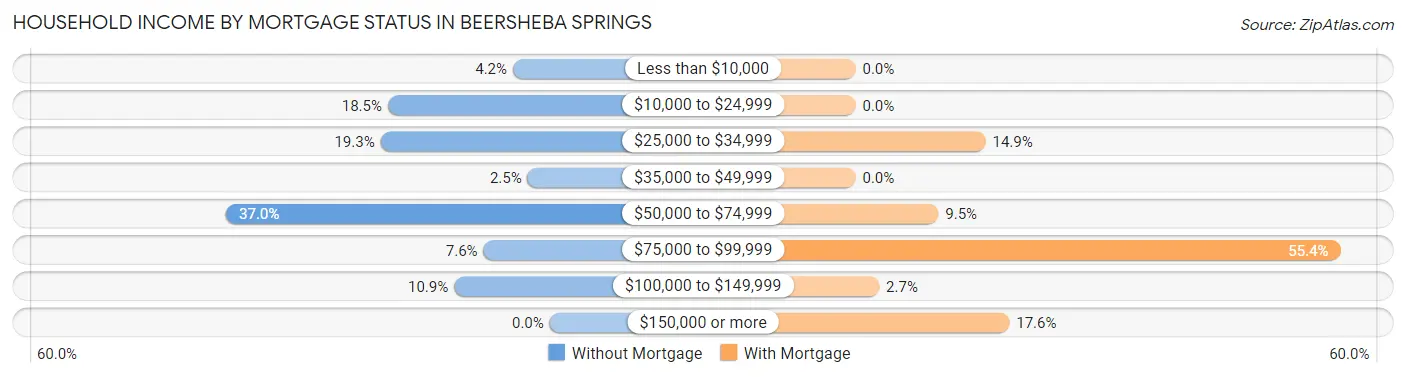
| Household Income | Without Mortgage | With Mortgage |
| Less than $10,000 | 5 (4.2%) | 0 (0.0%) |
| $10,000 to $24,999 | 22 (18.5%) | 0 (0.0%) |
| $25,000 to $34,999 | 23 (19.3%) | 11 (14.9%) |
| $35,000 to $49,999 | 3 (2.5%) | 0 (0.0%) |
| $50,000 to $74,999 | 44 (37.0%) | 7 (9.5%) |
| $75,000 to $99,999 | 9 (7.6%) | 41 (55.4%) |
| $100,000 to $149,999 | 13 (10.9%) | 2 (2.7%) |
| $150,000 or more | 0 (0.0%) | 13 (17.6%) |
| Total | 119 (100.0%) | 74 (100.0%) |
Property Value to Household Income Ratio in Beersheba Springs
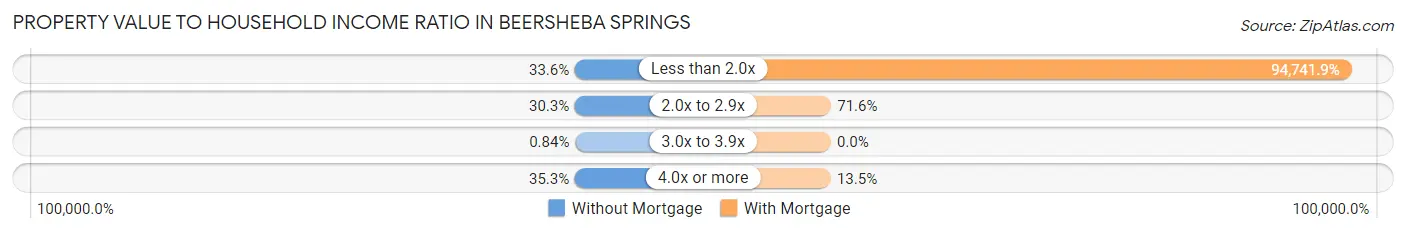
| Value-to-Income Ratio | Without Mortgage | With Mortgage |
| Less than 2.0x | 40 (33.6%) | 70,109 (94,741.9%) |
| 2.0x to 2.9x | 36 (30.2%) | 53 (71.6%) |
| 3.0x to 3.9x | 1 (0.8%) | 0 (0.0%) |
| 4.0x or more | 42 (35.3%) | 10 (13.5%) |
| Total | 119 (100.0%) | 74 (100.0%) |
Real Estate Taxes by Mortgage Status in Beersheba Springs
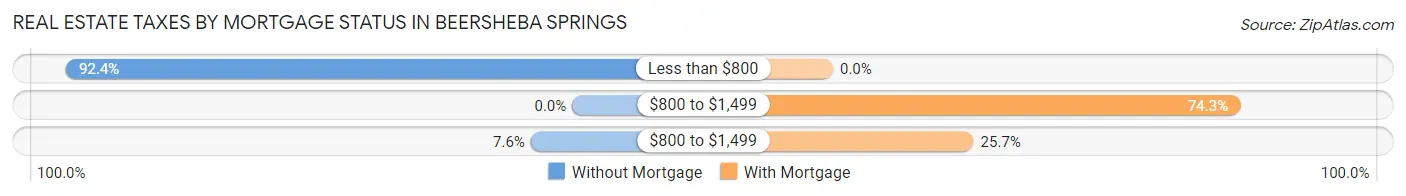
| Property Taxes | Without Mortgage | With Mortgage |
| Less than $800 | 110 (92.4%) | 0 (0.0%) |
| $800 to $1,499 | 0 (0.0%) | 55 (74.3%) |
| $800 to $1,499 | 9 (7.6%) | 19 (25.7%) |
| Total | 119 (100.0%) | 74 (100.0%) |
Health & Disability in Beersheba Springs
Health Insurance Coverage by Age in Beersheba Springs
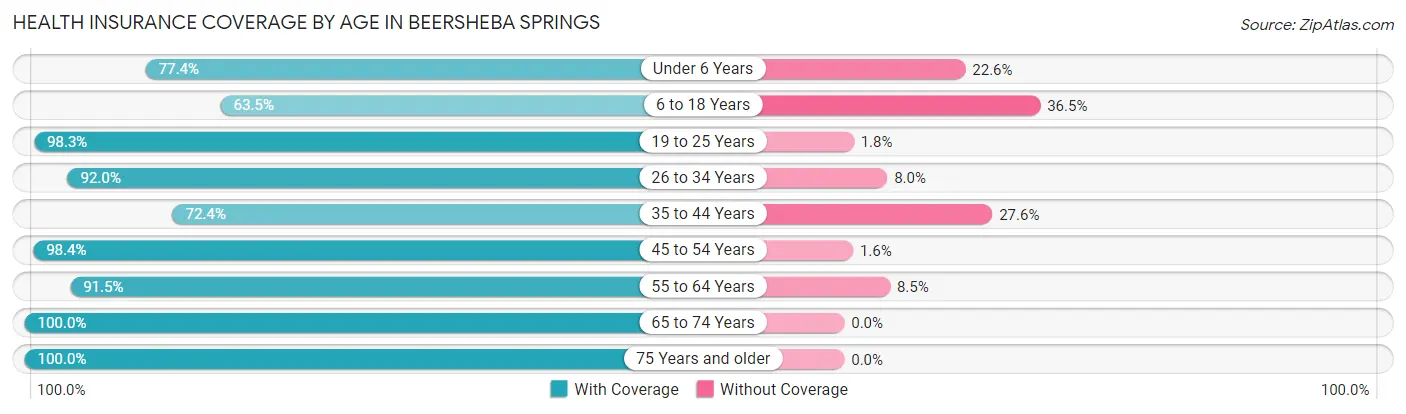
| Age Bracket | With Coverage | Without Coverage |
| Under 6 Years | 24 (77.4%) | 7 (22.6%) |
| 6 to 18 Years | 33 (63.5%) | 19 (36.5%) |
| 19 to 25 Years | 56 (98.3%) | 1 (1.8%) |
| 26 to 34 Years | 23 (92.0%) | 2 (8.0%) |
| 35 to 44 Years | 63 (72.4%) | 24 (27.6%) |
| 45 to 54 Years | 122 (98.4%) | 2 (1.6%) |
| 55 to 64 Years | 43 (91.5%) | 4 (8.5%) |
| 65 to 74 Years | 77 (100.0%) | 0 (0.0%) |
| 75 Years and older | 38 (100.0%) | 0 (0.0%) |
| Total | 479 (89.0%) | 59 (11.0%) |
Health Insurance Coverage by Citizenship Status in Beersheba Springs
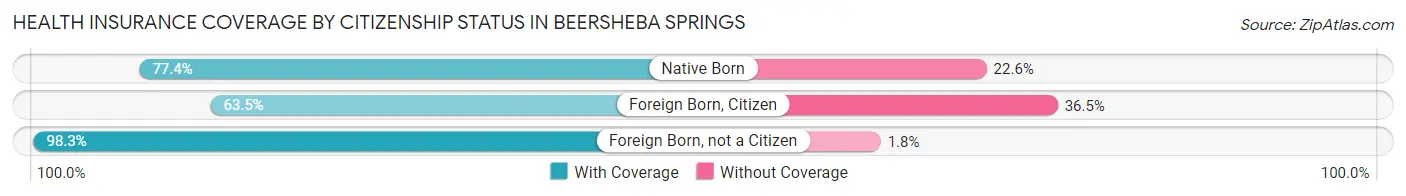
| Citizenship Status | With Coverage | Without Coverage |
| Native Born | 24 (77.4%) | 7 (22.6%) |
| Foreign Born, Citizen | 33 (63.5%) | 19 (36.5%) |
| Foreign Born, not a Citizen | 56 (98.3%) | 1 (1.8%) |
Health Insurance Coverage by Household Income in Beersheba Springs
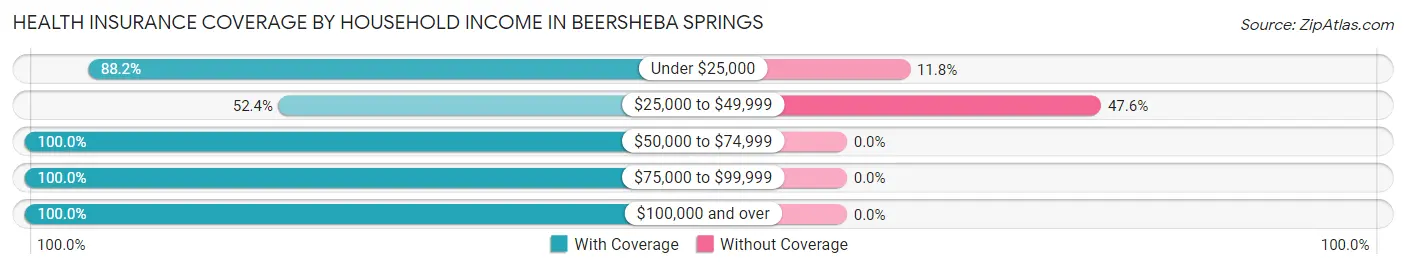
| Household Income | With Coverage | Without Coverage |
| Under $25,000 | 67 (88.2%) | 9 (11.8%) |
| $25,000 to $49,999 | 55 (52.4%) | 50 (47.6%) |
| $50,000 to $74,999 | 202 (100.0%) | 0 (0.0%) |
| $75,000 to $99,999 | 39 (100.0%) | 0 (0.0%) |
| $100,000 and over | 116 (100.0%) | 0 (0.0%) |
Public vs Private Health Insurance Coverage by Age in Beersheba Springs
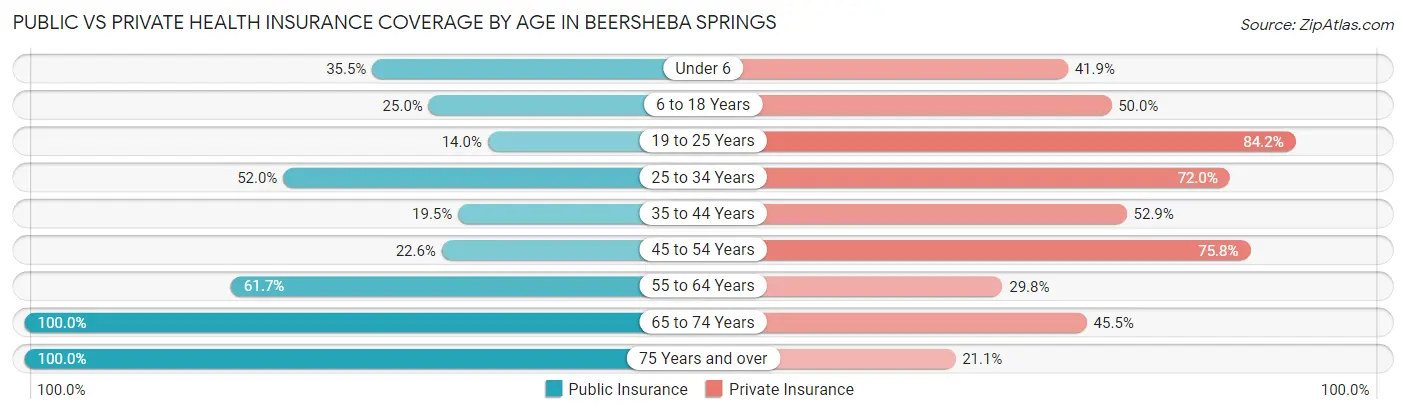
| Age Bracket | Public Insurance | Private Insurance |
| Under 6 | 11 (35.5%) | 13 (41.9%) |
| 6 to 18 Years | 13 (25.0%) | 26 (50.0%) |
| 19 to 25 Years | 8 (14.0%) | 48 (84.2%) |
| 25 to 34 Years | 13 (52.0%) | 18 (72.0%) |
| 35 to 44 Years | 17 (19.5%) | 46 (52.9%) |
| 45 to 54 Years | 28 (22.6%) | 94 (75.8%) |
| 55 to 64 Years | 29 (61.7%) | 14 (29.8%) |
| 65 to 74 Years | 77 (100.0%) | 35 (45.5%) |
| 75 Years and over | 38 (100.0%) | 8 (21.0%) |
| Total | 234 (43.5%) | 302 (56.1%) |
Disability Status by Sex by Age in Beersheba Springs
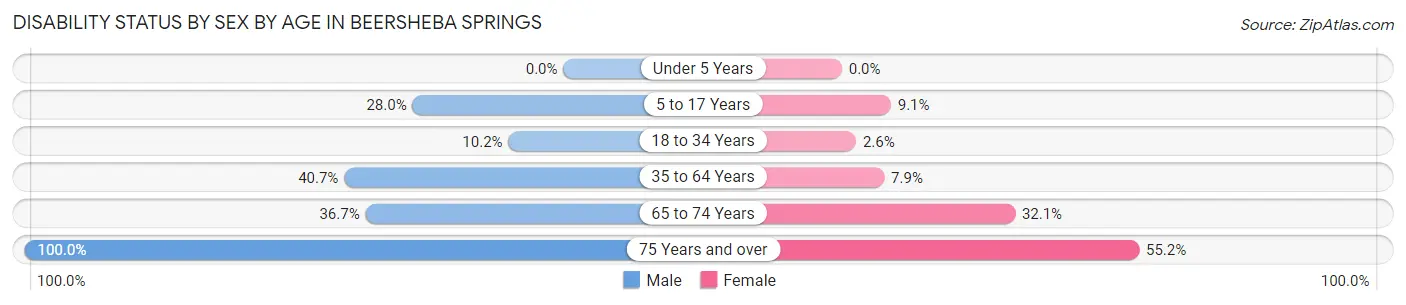
| Age Bracket | Male | Female |
| Under 5 Years | 0 (0.0%) | 0 (0.0%) |
| 5 to 17 Years | 7 (28.0%) | 2 (9.1%) |
| 18 to 34 Years | 5 (10.2%) | 1 (2.6%) |
| 35 to 64 Years | 48 (40.7%) | 11 (7.9%) |
| 65 to 74 Years | 18 (36.7%) | 9 (32.1%) |
| 75 Years and over | 9 (100.0%) | 16 (55.2%) |
Disability Class by Sex by Age in Beersheba Springs
Disability Class: Hearing Difficulty
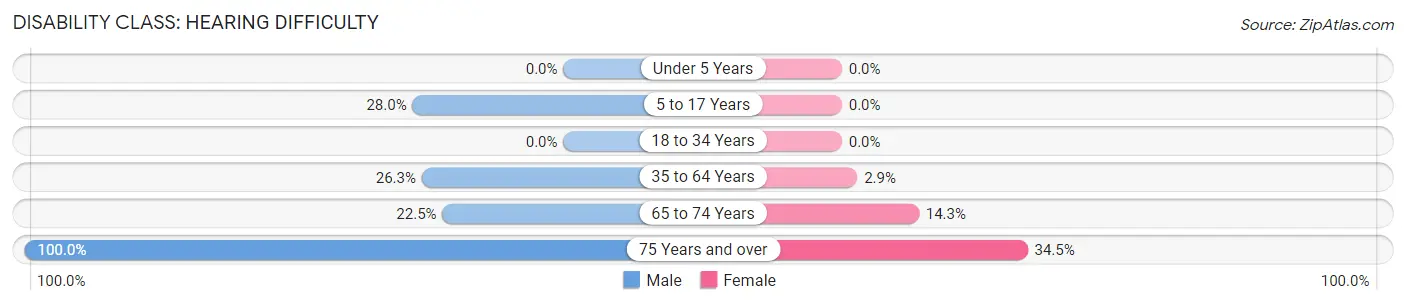
| Age Bracket | Male | Female |
| Under 5 Years | 0 (0.0%) | 0 (0.0%) |
| 5 to 17 Years | 7 (28.0%) | 0 (0.0%) |
| 18 to 34 Years | 0 (0.0%) | 0 (0.0%) |
| 35 to 64 Years | 31 (26.3%) | 4 (2.9%) |
| 65 to 74 Years | 11 (22.5%) | 4 (14.3%) |
| 75 Years and over | 9 (100.0%) | 10 (34.5%) |
Disability Class: Vision Difficulty
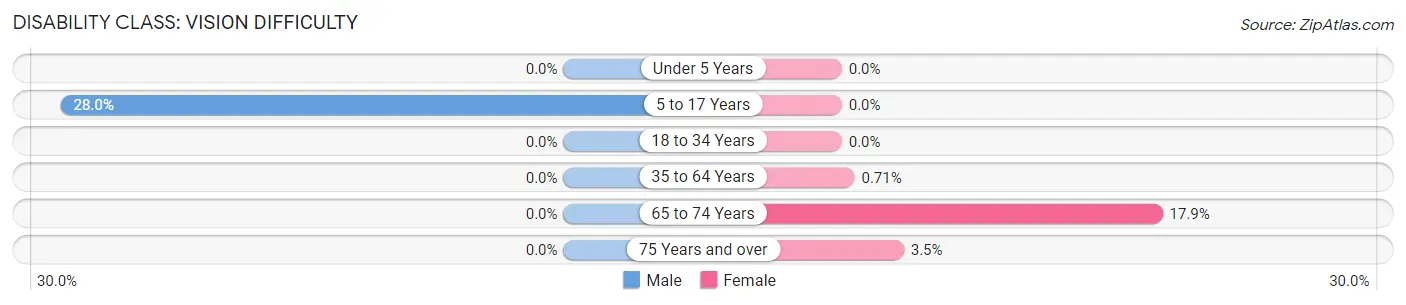
| Age Bracket | Male | Female |
| Under 5 Years | 0 (0.0%) | 0 (0.0%) |
| 5 to 17 Years | 7 (28.0%) | 0 (0.0%) |
| 18 to 34 Years | 0 (0.0%) | 0 (0.0%) |
| 35 to 64 Years | 0 (0.0%) | 1 (0.7%) |
| 65 to 74 Years | 0 (0.0%) | 5 (17.9%) |
| 75 Years and over | 0 (0.0%) | 1 (3.5%) |
Disability Class: Cognitive Difficulty
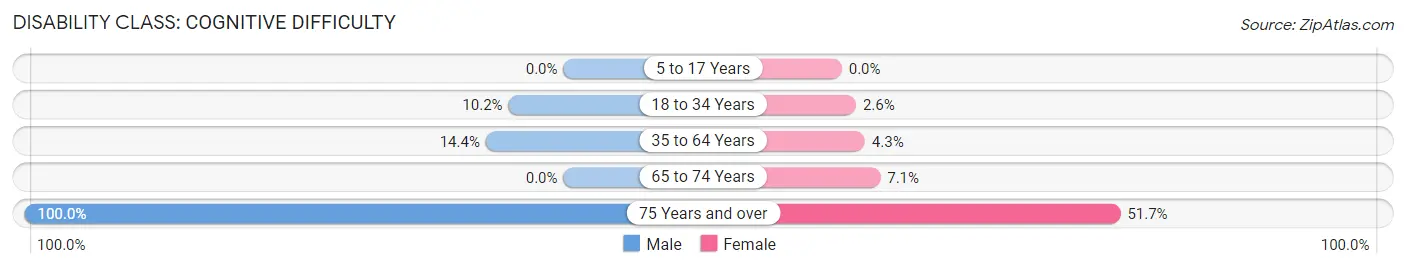
| Age Bracket | Male | Female |
| 5 to 17 Years | 0 (0.0%) | 0 (0.0%) |
| 18 to 34 Years | 5 (10.2%) | 1 (2.6%) |
| 35 to 64 Years | 17 (14.4%) | 6 (4.3%) |
| 65 to 74 Years | 0 (0.0%) | 2 (7.1%) |
| 75 Years and over | 9 (100.0%) | 15 (51.7%) |
Disability Class: Ambulatory Difficulty
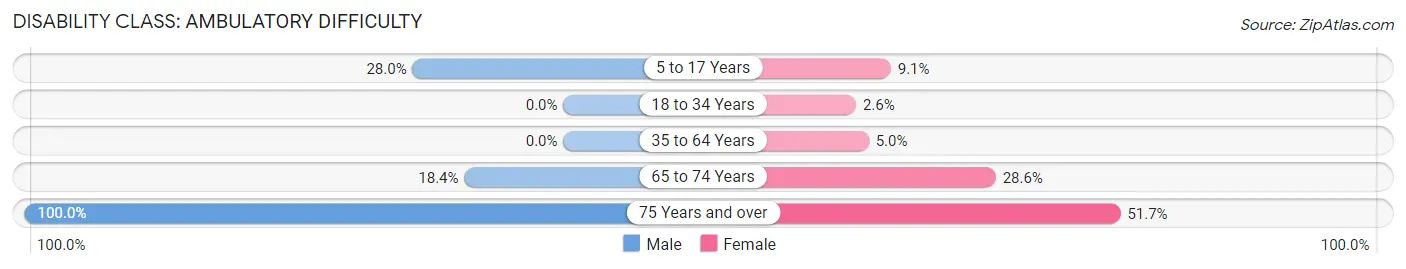
| Age Bracket | Male | Female |
| 5 to 17 Years | 7 (28.0%) | 2 (9.1%) |
| 18 to 34 Years | 0 (0.0%) | 1 (2.6%) |
| 35 to 64 Years | 0 (0.0%) | 7 (5.0%) |
| 65 to 74 Years | 9 (18.4%) | 8 (28.6%) |
| 75 Years and over | 9 (100.0%) | 15 (51.7%) |
Disability Class: Self-Care Difficulty
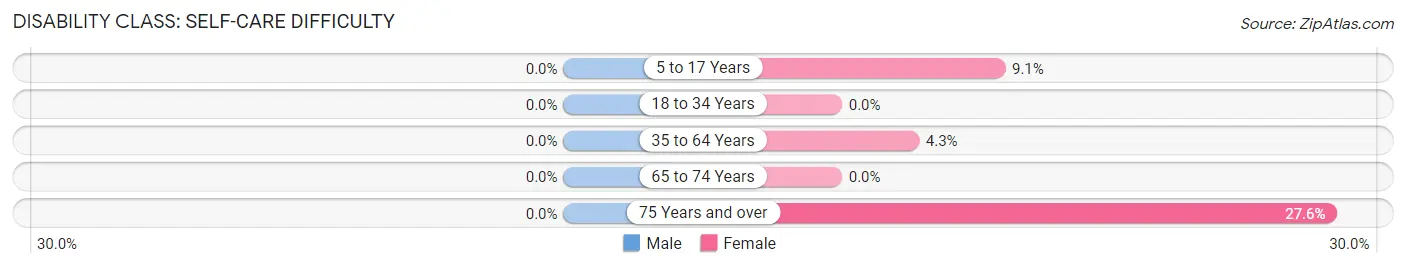
| Age Bracket | Male | Female |
| 5 to 17 Years | 0 (0.0%) | 2 (9.1%) |
| 18 to 34 Years | 0 (0.0%) | 0 (0.0%) |
| 35 to 64 Years | 0 (0.0%) | 6 (4.3%) |
| 65 to 74 Years | 0 (0.0%) | 0 (0.0%) |
| 75 Years and over | 0 (0.0%) | 8 (27.6%) |
Technology Access in Beersheba Springs
Computing Device Access in Beersheba Springs
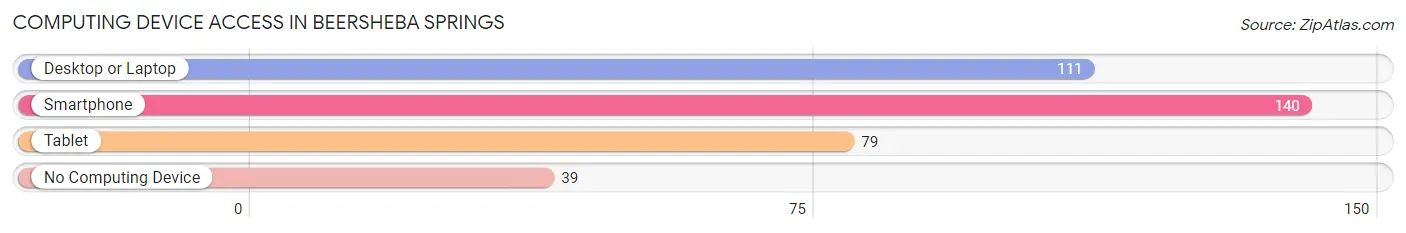
| Device Type | # Households | % Households |
| Desktop or Laptop | 111 | 57.2% |
| Smartphone | 140 | 72.2% |
| Tablet | 79 | 40.7% |
| No Computing Device | 39 | 20.1% |
| Total | 194 | 100.0% |
Internet Access in Beersheba Springs
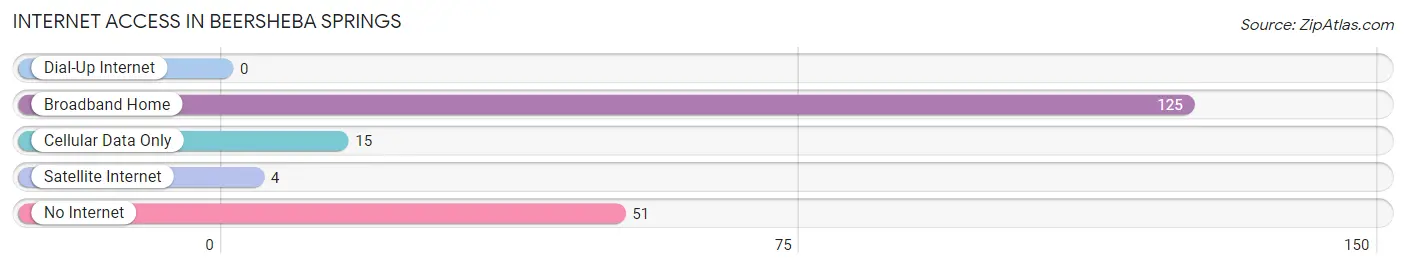
| Internet Type | # Households | % Households |
| Dial-Up Internet | 0 | 0.0% |
| Broadband Home | 125 | 64.4% |
| Cellular Data Only | 15 | 7.7% |
| Satellite Internet | 4 | 2.1% |
| No Internet | 51 | 26.3% |
| Total | 194 | 100.0% |
Beersheba Springs Summary
Beersheba Springs is a small unincorporated community located in Grundy County, Tennessee. It is situated in the foothills of the Cumberland Plateau, approximately 50 miles southeast of Nashville. The town is named after the nearby Beersheba Springs, which is a natural mineral spring that has been used for centuries by Native Americans and early settlers for its healing properties.
History
Beersheba Springs has a long and rich history. The area was first inhabited by Native Americans, who used the mineral springs for their healing properties. The first European settlers arrived in the area in the late 1700s, and the town was officially established in 1820. The town was named after the nearby Beersheba Springs, which was named after the biblical city of Beersheba.
In the early 1800s, Beersheba Springs became a popular destination for travelers and settlers. The town was known for its mineral springs, which were believed to have healing properties. The town also became a popular destination for religious retreats and revivals. In 1845, the Beersheba Springs Hotel was built, and it quickly became a popular destination for visitors.
In the late 1800s, Beersheba Springs became a popular destination for wealthy tourists. The town was known for its luxurious hotels, spas, and mineral springs. The town also became a popular destination for artists, writers, and musicians. In the early 1900s, the town was home to several famous writers, including Robert Frost and William Faulkner.
Geography
Beersheba Springs is located in Grundy County, Tennessee. It is situated in the foothills of the Cumberland Plateau, approximately 50 miles southeast of Nashville. The town is surrounded by rolling hills and lush forests. The nearby Beersheba Springs is a natural mineral spring that has been used for centuries by Native Americans and early settlers for its healing properties.
Economy
Beersheba Springs is a small, rural community with a limited economy. The town is home to several small businesses, including a general store, a gas station, and a few restaurants. The town is also home to several bed and breakfasts, which attract visitors from all over the country.
Demographics
As of the 2010 census, Beersheba Springs had a population of 545. The racial makeup of the town was 97.3% White, 0.7% African American, 0.2% Native American, 0.2% Asian, and 1.6% from other races. The median household income was $30,000, and the median age was 44. The town is home to a large number of retirees, and the population is largely rural.
Common Questions
What is Per Capita Income in Beersheba Springs?
Per Capita income in Beersheba Springs is $24,320.
What is the Median Family Income in Beersheba Springs?
Median Family Income in Beersheba Springs is $70,435.
What is the Median Household income in Beersheba Springs?
Median Household Income in Beersheba Springs is $67,500.
What is Income or Wage Gap in Beersheba Springs?
Income or Wage Gap in Beersheba Springs is 18.9%.
Women in Beersheba Springs earn 81.1 cents for every dollar earned by a man.
What is Inequality or Gini Index in Beersheba Springs?
Inequality or Gini Index in Beersheba Springs is 0.33.
What is the Total Population of Beersheba Springs?
Total Population of Beersheba Springs is 538.
What is the Total Male Population of Beersheba Springs?
Total Male Population of Beersheba Springs is 268.
What is the Total Female Population of Beersheba Springs?
Total Female Population of Beersheba Springs is 270.
What is the Ratio of Males per 100 Females in Beersheba Springs?
There are 99.26 Males per 100 Females in Beersheba Springs.
What is the Ratio of Females per 100 Males in Beersheba Springs?
There are 100.75 Females per 100 Males in Beersheba Springs.
What is the Median Population Age in Beersheba Springs?
Median Population Age in Beersheba Springs is 45.7 Years.
What is the Average Family Size in Beersheba Springs
Average Family Size in Beersheba Springs is 3.0 People.
What is the Average Household Size in Beersheba Springs
Average Household Size in Beersheba Springs is 2.8 People.
How Large is the Labor Force in Beersheba Springs?
There are 266 People in the Labor Forcein in Beersheba Springs.
What is the Percentage of People in the Labor Force in Beersheba Springs?
57.2% of People are in the Labor Force in Beersheba Springs.
What is the Unemployment Rate in Beersheba Springs?
Unemployment Rate in Beersheba Springs is 1.5%.