Annabella, UT Map & Demographics
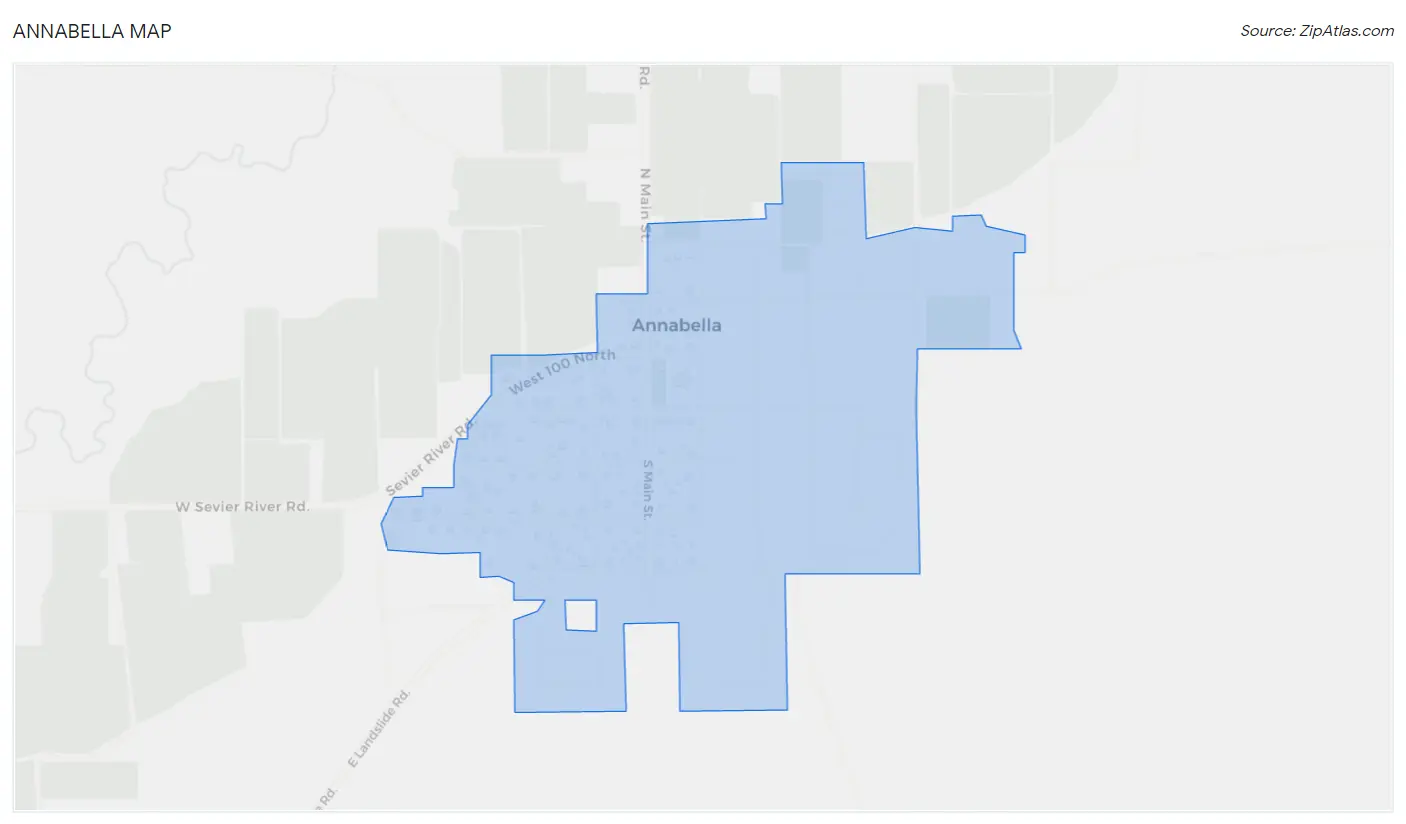
Annabella Map
Annabella Overview
$31,110
PER CAPITA INCOME
$91,563
AVG FAMILY INCOME
$72,500
AVG HOUSEHOLD INCOME
0.35
INEQUALITY / GINI INDEX
766
TOTAL POPULATION
392
MALE POPULATION
374
FEMALE POPULATION
104.81
MALES / 100 FEMALES
95.41
FEMALES / 100 MALES
39.9
MEDIAN AGE
3.3
AVG FAMILY SIZE
2.8
AVG HOUSEHOLD SIZE
325
LABOR FORCE [ PEOPLE ]
57.3%
PERCENT IN LABOR FORCE
Annabella Zip Codes
Annabella Area Codes
Income in Annabella
Income Overview in Annabella
Per Capita Income in Annabella is $31,110, while median incomes of families and households are $91,563 and $72,500 respectively.
| Characteristic | Number | Measure |
| Per Capita Income | 766 | $31,110 |
| Median Family Income | 216 | $91,563 |
| Mean Family Income | 216 | $96,514 |
| Median Household Income | 272 | $72,500 |
| Mean Household Income | 272 | $88,325 |
| Income Deficit | 216 | $0 |
| Wage / Income Gap (%) | 766 | 0.00% |
| Wage / Income Gap ($) | 766 | 100.00¢ per $1 |
| Gini / Inequality Index | 766 | 0.35 |
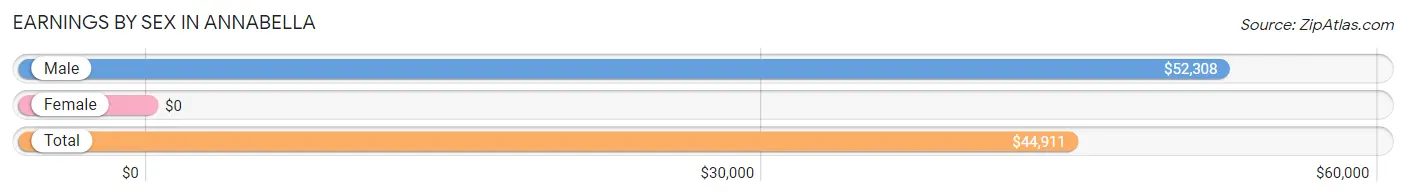
Earnings by Sex in Annabella
| Sex | Number | Average Earnings |
| Male | 220 (65.3%) | $52,308 |
| Female | 117 (34.7%) | $0 |
| Total | 337 (100.0%) | $44,911 |
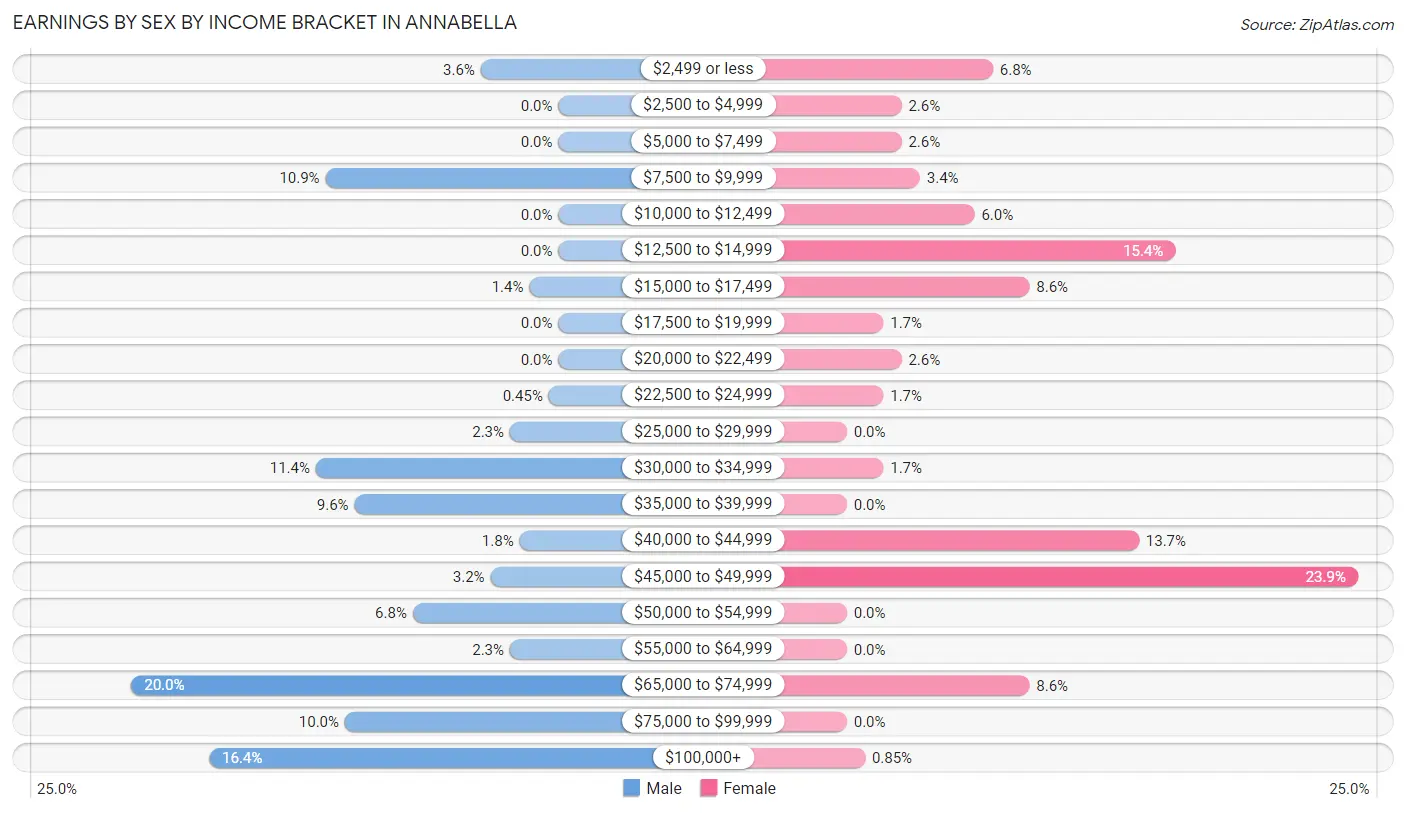
Earnings by Sex by Income Bracket in Annabella
The most common earnings brackets in Annabella are $65,000 to $74,999 for men (44 | 20.0%) and $45,000 to $49,999 for women (28 | 23.9%).
| Income | Male | Female |
| $2,499 or less | 8 (3.6%) | 8 (6.8%) |
| $2,500 to $4,999 | 0 (0.0%) | 3 (2.6%) |
| $5,000 to $7,499 | 0 (0.0%) | 3 (2.6%) |
| $7,500 to $9,999 | 24 (10.9%) | 4 (3.4%) |
| $10,000 to $12,499 | 0 (0.0%) | 7 (6.0%) |
| $12,500 to $14,999 | 0 (0.0%) | 18 (15.4%) |
| $15,000 to $17,499 | 3 (1.4%) | 10 (8.6%) |
| $17,500 to $19,999 | 0 (0.0%) | 2 (1.7%) |
| $20,000 to $22,499 | 0 (0.0%) | 3 (2.6%) |
| $22,500 to $24,999 | 1 (0.4%) | 2 (1.7%) |
| $25,000 to $29,999 | 5 (2.3%) | 0 (0.0%) |
| $30,000 to $34,999 | 25 (11.4%) | 2 (1.7%) |
| $35,000 to $39,999 | 21 (9.6%) | 0 (0.0%) |
| $40,000 to $44,999 | 4 (1.8%) | 16 (13.7%) |
| $45,000 to $49,999 | 7 (3.2%) | 28 (23.9%) |
| $50,000 to $54,999 | 15 (6.8%) | 0 (0.0%) |
| $55,000 to $64,999 | 5 (2.3%) | 0 (0.0%) |
| $65,000 to $74,999 | 44 (20.0%) | 10 (8.6%) |
| $75,000 to $99,999 | 22 (10.0%) | 0 (0.0%) |
| $100,000+ | 36 (16.4%) | 1 (0.9%) |
| Total | 220 (100.0%) | 117 (100.0%) |
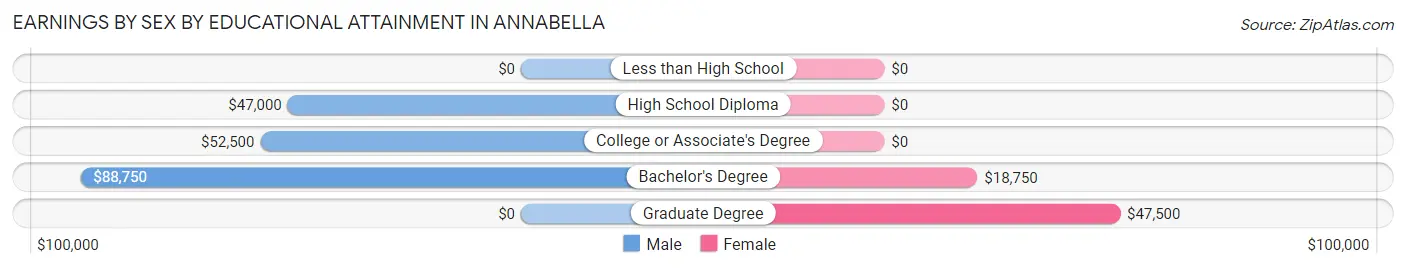
Earnings by Sex by Educational Attainment in Annabella
Average earnings in Annabella are $66,750 for men and $42,589 for women, a difference of 36.2%. Men with an educational attainment of bachelor's degree enjoy the highest average annual earnings of $88,750, while those with high school diploma education earn the least with $47,000. Women with an educational attainment of graduate degree earn the most with the average annual earnings of $47,500, while those with bachelor's degree education have the smallest earnings of $18,750.
| Educational Attainment | Male Income | Female Income |
| Less than High School | - | - |
| High School Diploma | $47,000 | $0 |
| College or Associate's Degree | $52,500 | $0 |
| Bachelor's Degree | $88,750 | $18,750 |
| Graduate Degree | - | - |
| Total | $66,750 | $42,589 |
Family Income in Annabella
Family Income Brackets in Annabella
According to the Annabella family income data, there are 61 families falling into the $100,000 to $149,999 income range, which is the most common income bracket and makes up 28.2% of all families.
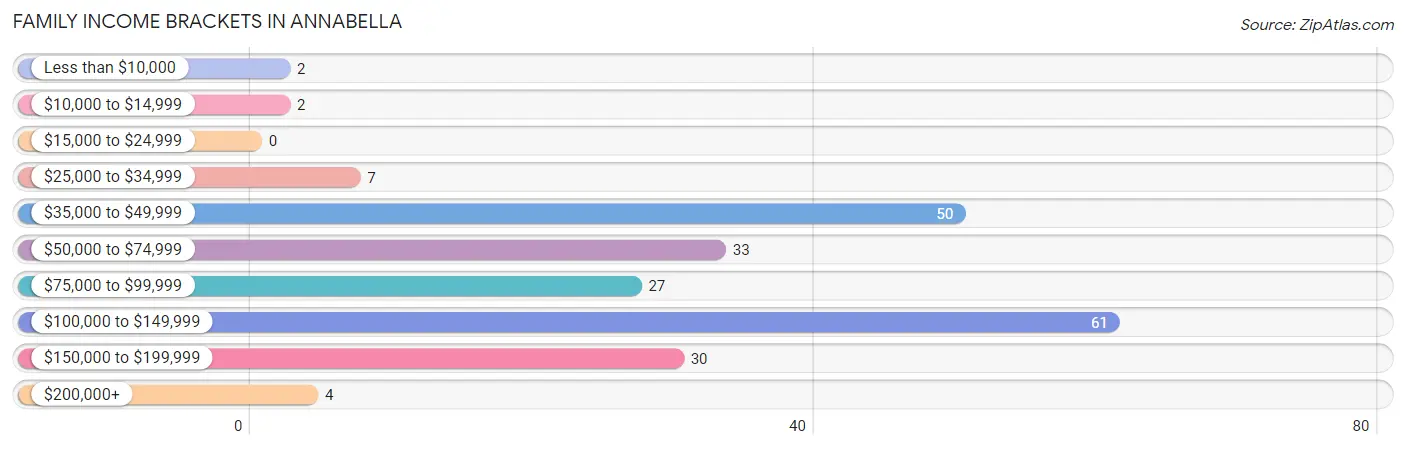
| Income Bracket | # Families | % Families |
| Less than $10,000 | 2 | 0.9% |
| $10,000 to $14,999 | 2 | 0.9% |
| $15,000 to $24,999 | 0 | 0.0% |
| $25,000 to $34,999 | 7 | 3.2% |
| $35,000 to $49,999 | 50 | 23.1% |
| $50,000 to $74,999 | 33 | 15.3% |
| $75,000 to $99,999 | 27 | 12.5% |
| $100,000 to $149,999 | 61 | 28.2% |
| $150,000 to $199,999 | 30 | 13.9% |
| $200,000+ | 4 | 1.9% |
Family Income by Famaliy Size in Annabella
6-person families (23 | 10.6%) account for the highest median family income in Annabella with $142,917 per family, while 2-person families (80 | 37.0%) have the highest median income of $32,500 per family member.
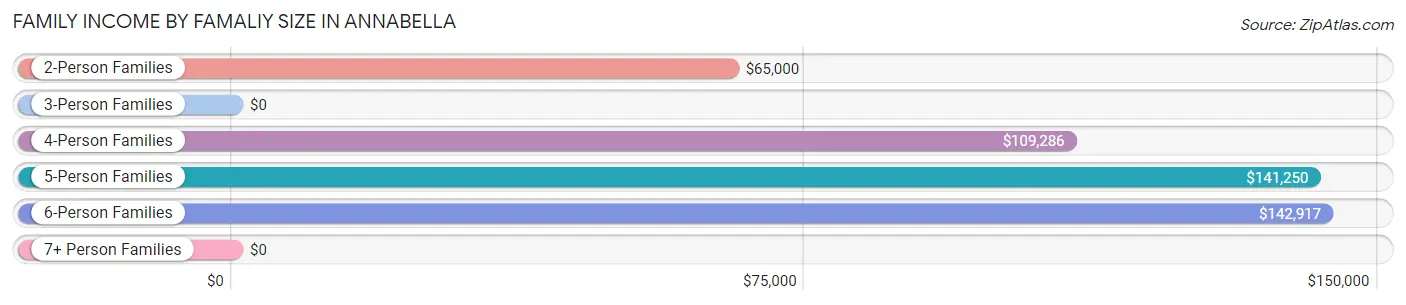
| Income Bracket | # Families | Median Income |
| 2-Person Families | 80 (37.0%) | $65,000 |
| 3-Person Families | 58 (26.9%) | $0 |
| 4-Person Families | 28 (13.0%) | $109,286 |
| 5-Person Families | 22 (10.2%) | $141,250 |
| 6-Person Families | 23 (10.6%) | $142,917 |
| 7+ Person Families | 5 (2.3%) | $0 |
| Total | 216 (100.0%) | $91,563 |
Family Income by Number of Earners in Annabella
The median family income in Annabella is $91,563, with families comprising 3+ earners (34) having the highest median family income of $140,938, while families with 1 earner (86) have the lowest median family income of $57,500, accounting for 15.7% and 39.8% of families, respectively.
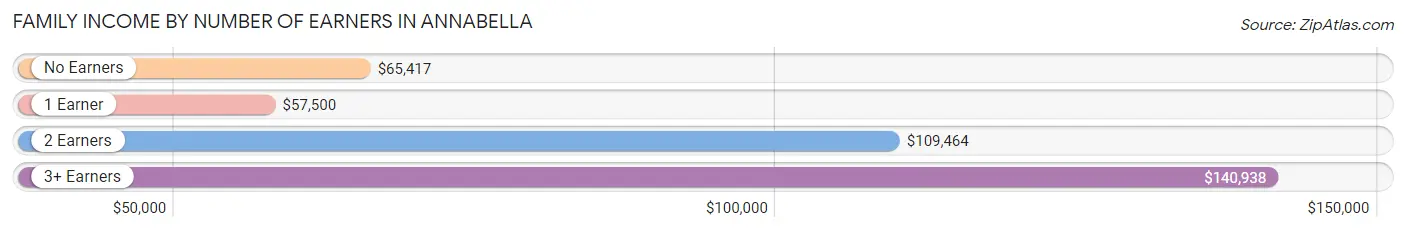
| Number of Earners | # Families | Median Income |
| No Earners | 39 (18.1%) | $65,417 |
| 1 Earner | 86 (39.8%) | $57,500 |
| 2 Earners | 57 (26.4%) | $109,464 |
| 3+ Earners | 34 (15.7%) | $140,938 |
| Total | 216 (100.0%) | $91,563 |
Household Income in Annabella
Household Income Brackets in Annabella
With 62 households falling in the category, the $100,000 to $149,999 income range is the most frequent in Annabella, accounting for 22.8% of all households. In contrast, only 2 households (0.7%) fall into the $10,000 to $14,999 income bracket, making it the least populous group.
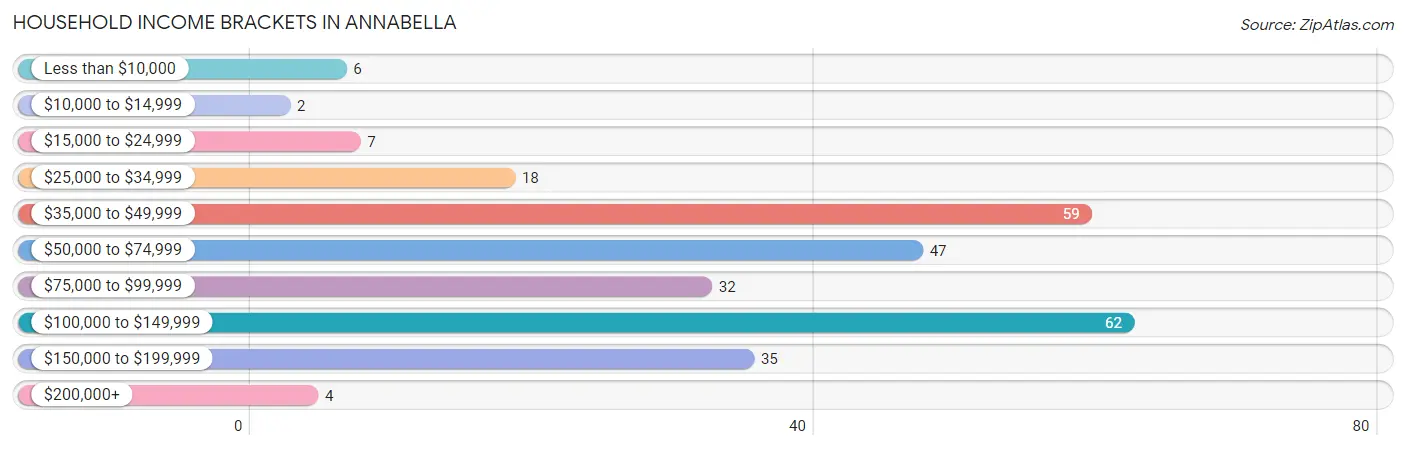
| Income Bracket | # Households | % Households |
| Less than $10,000 | 6 | 2.2% |
| $10,000 to $14,999 | 2 | 0.7% |
| $15,000 to $24,999 | 7 | 2.6% |
| $25,000 to $34,999 | 18 | 6.6% |
| $35,000 to $49,999 | 59 | 21.7% |
| $50,000 to $74,999 | 47 | 17.3% |
| $75,000 to $99,999 | 32 | 11.8% |
| $100,000 to $149,999 | 62 | 22.8% |
| $150,000 to $199,999 | 35 | 12.9% |
| $200,000+ | 4 | 1.5% |
Household Income by Householder Age in Annabella
The median household income in Annabella is $72,500, with the highest median household income of $105,313 found in the 45 to 64 years age bracket for the primary householder. A total of 99 households (36.4%) fall into this category.
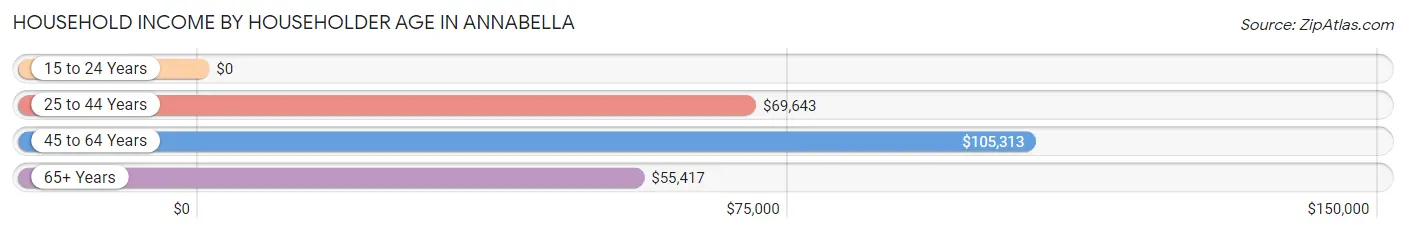
| Income Bracket | # Households | Median Income |
| 15 to 24 Years | 0 (0.0%) | $0 |
| 25 to 44 Years | 96 (35.3%) | $69,643 |
| 45 to 64 Years | 99 (36.4%) | $105,313 |
| 65+ Years | 77 (28.3%) | $55,417 |
| Total | 272 (100.0%) | $72,500 |
Poverty in Annabella
Income Below Poverty by Sex and Age in Annabella
With 1.8% poverty level for males and 1.1% for females among the residents of Annabella, 55 to 64 year old males and 55 to 64 year old females are the most vulnerable to poverty, with 6 males (15.4%) and 2 females (6.7%) in their respective age groups living below the poverty level.
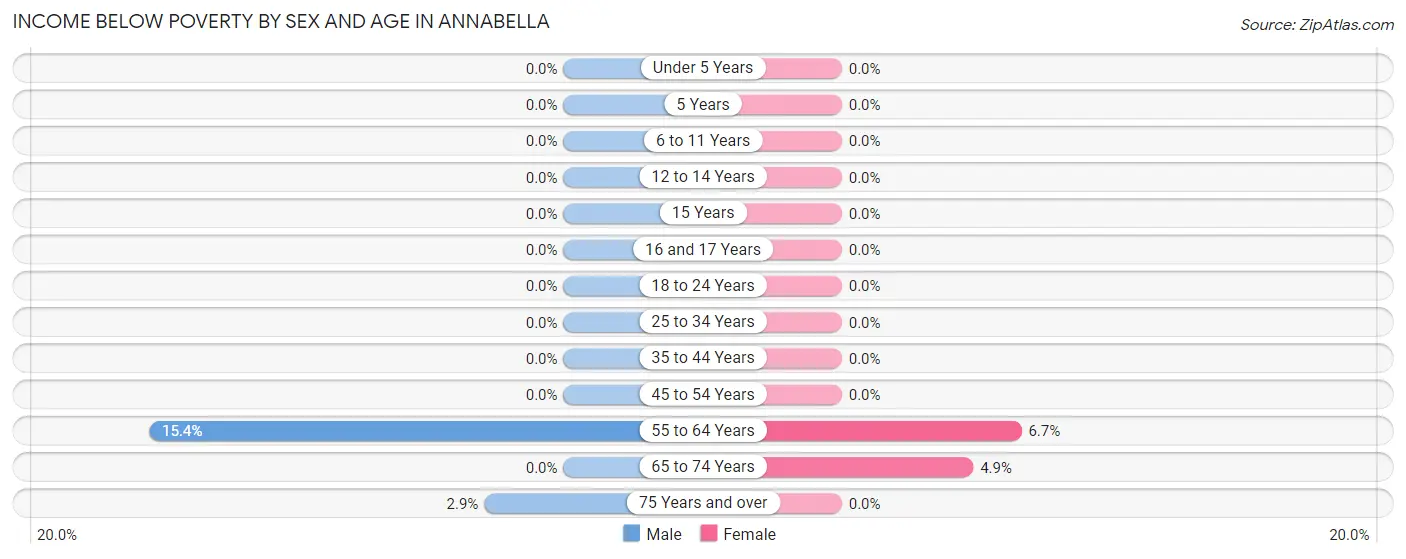
| Age Bracket | Male | Female |
| Under 5 Years | 0 (0.0%) | 0 (0.0%) |
| 5 Years | 0 (0.0%) | 0 (0.0%) |
| 6 to 11 Years | 0 (0.0%) | 0 (0.0%) |
| 12 to 14 Years | 0 (0.0%) | 0 (0.0%) |
| 15 Years | 0 (0.0%) | 0 (0.0%) |
| 16 and 17 Years | 0 (0.0%) | 0 (0.0%) |
| 18 to 24 Years | 0 (0.0%) | 0 (0.0%) |
| 25 to 34 Years | 0 (0.0%) | 0 (0.0%) |
| 35 to 44 Years | 0 (0.0%) | 0 (0.0%) |
| 45 to 54 Years | 0 (0.0%) | 0 (0.0%) |
| 55 to 64 Years | 6 (15.4%) | 2 (6.7%) |
| 65 to 74 Years | 0 (0.0%) | 2 (4.9%) |
| 75 Years and over | 1 (2.9%) | 0 (0.0%) |
| Total | 7 (1.8%) | 4 (1.1%) |
Income Above Poverty by Sex and Age in Annabella
According to the poverty statistics in Annabella, males aged under 5 years and females aged under 5 years are the age groups that are most secure financially, with 100.0% of males and 100.0% of females in these age groups living above the poverty line.
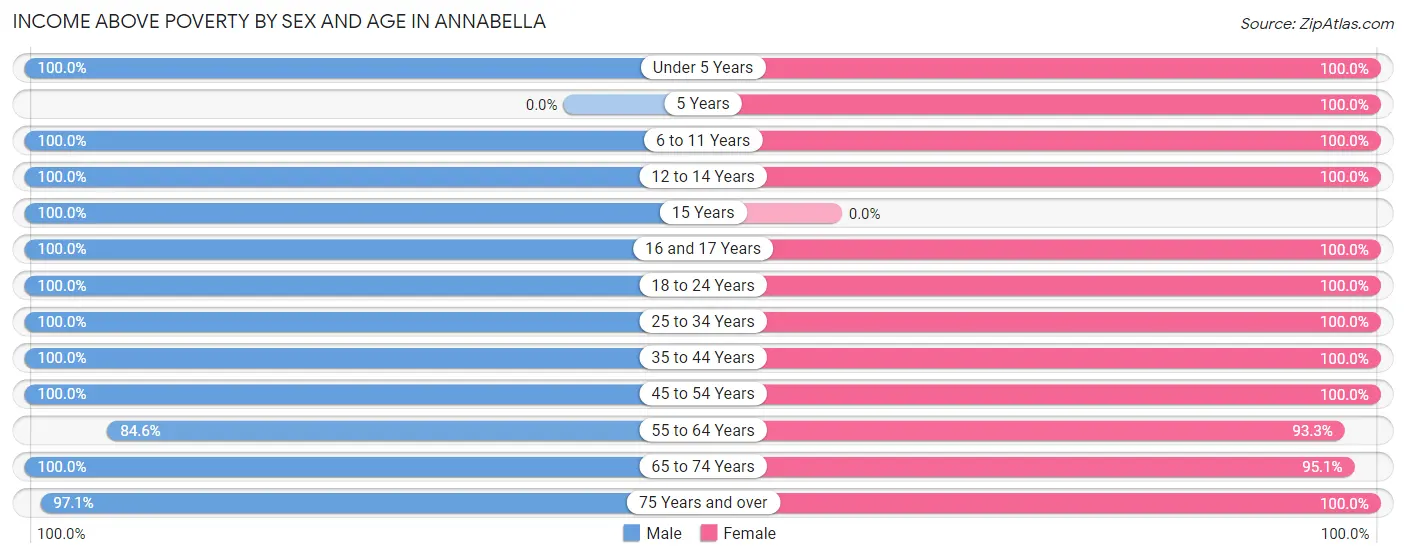
| Age Bracket | Male | Female |
| Under 5 Years | 18 (100.0%) | 26 (100.0%) |
| 5 Years | 0 (0.0%) | 2 (100.0%) |
| 6 to 11 Years | 21 (100.0%) | 67 (100.0%) |
| 12 to 14 Years | 30 (100.0%) | 21 (100.0%) |
| 15 Years | 14 (100.0%) | 0 (0.0%) |
| 16 and 17 Years | 27 (100.0%) | 13 (100.0%) |
| 18 to 24 Years | 18 (100.0%) | 11 (100.0%) |
| 25 to 34 Years | 41 (100.0%) | 31 (100.0%) |
| 35 to 44 Years | 47 (100.0%) | 67 (100.0%) |
| 45 to 54 Years | 68 (100.0%) | 44 (100.0%) |
| 55 to 64 Years | 33 (84.6%) | 28 (93.3%) |
| 65 to 74 Years | 35 (100.0%) | 39 (95.1%) |
| 75 Years and over | 33 (97.1%) | 21 (100.0%) |
| Total | 385 (98.2%) | 370 (98.9%) |
Income Below Poverty Among Married-Couple Families in Annabella
The poverty statistics for married-couple families in Annabella show that 2.0% or 4 of the total 204 families live below the poverty line. Families with no children have the highest poverty rate of 4.9%, comprising of 4 families. On the other hand, families with 1 or 2 children have the lowest poverty rate of 0.0%, which includes 0 families.
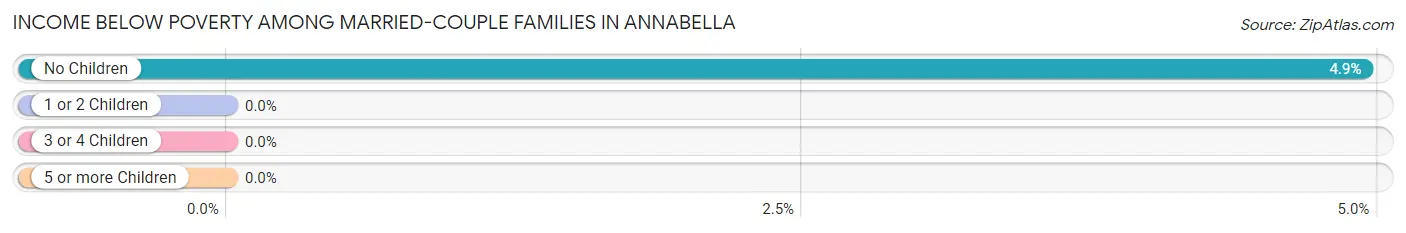
| Children | Above Poverty | Below Poverty |
| No Children | 77 (95.1%) | 4 (4.9%) |
| 1 or 2 Children | 82 (100.0%) | 0 (0.0%) |
| 3 or 4 Children | 41 (100.0%) | 0 (0.0%) |
| 5 or more Children | 0 (0.0%) | 0 (0.0%) |
| Total | 200 (98.0%) | 4 (2.0%) |
Income Below Poverty Among Single-Parent Households in Annabella
| Children | Single Father | Single Mother |
| No Children | 0 (0.0%) | 0 (0.0%) |
| 1 or 2 Children | 0 (0.0%) | 0 (0.0%) |
| 3 or 4 Children | 0 (0.0%) | 0 (0.0%) |
| 5 or more Children | 0 (0.0%) | 0 (0.0%) |
| Total | 0 (0.0%) | 0 (0.0%) |
Income Below Poverty Among Married-Couple vs Single-Parent Households in Annabella
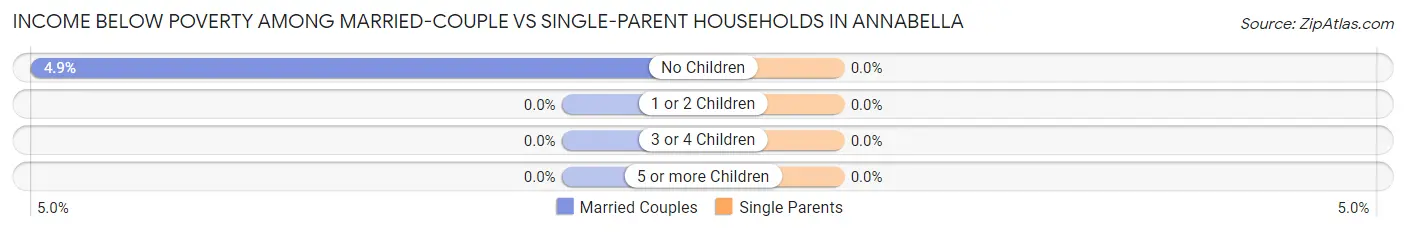
| Children | Married-Couple Families | Single-Parent Households |
| No Children | 4 (4.9%) | 0 (0.0%) |
| 1 or 2 Children | 0 (0.0%) | 0 (0.0%) |
| 3 or 4 Children | 0 (0.0%) | 0 (0.0%) |
| 5 or more Children | 0 (0.0%) | 0 (0.0%) |
| Total | 4 (2.0%) | 0 (0.0%) |
Race in Annabella
The most populous races in Annabella are White / Caucasian (735 | 96.0%), Two or more Races (22 | 2.9%), and Native / Alaskan (9 | 1.2%).
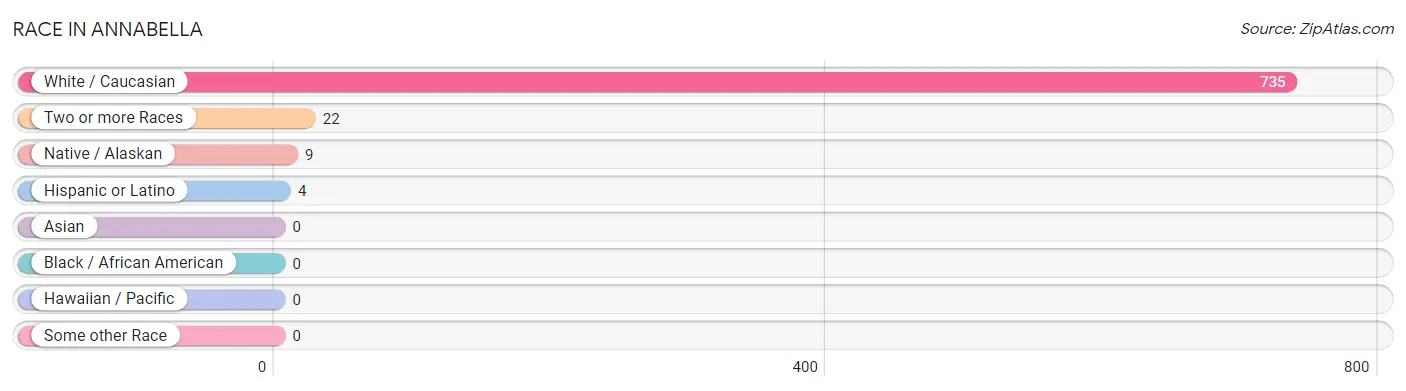
| Race | # Population | % Population |
| Asian | 0 | 0.0% |
| Black / African American | 0 | 0.0% |
| Hawaiian / Pacific | 0 | 0.0% |
| Hispanic or Latino | 4 | 0.5% |
| Native / Alaskan | 9 | 1.2% |
| White / Caucasian | 735 | 96.0% |
| Two or more Races | 22 | 2.9% |
| Some other Race | 0 | 0.0% |
| Total | 766 | 100.0% |
Ancestry in Annabella
The most populous ancestries reported in Annabella are English (361 | 47.1%), Danish (84 | 11.0%), Irish (61 | 8.0%), French (54 | 7.0%), and German (29 | 3.8%), together accounting for 76.9% of all Annabella residents.
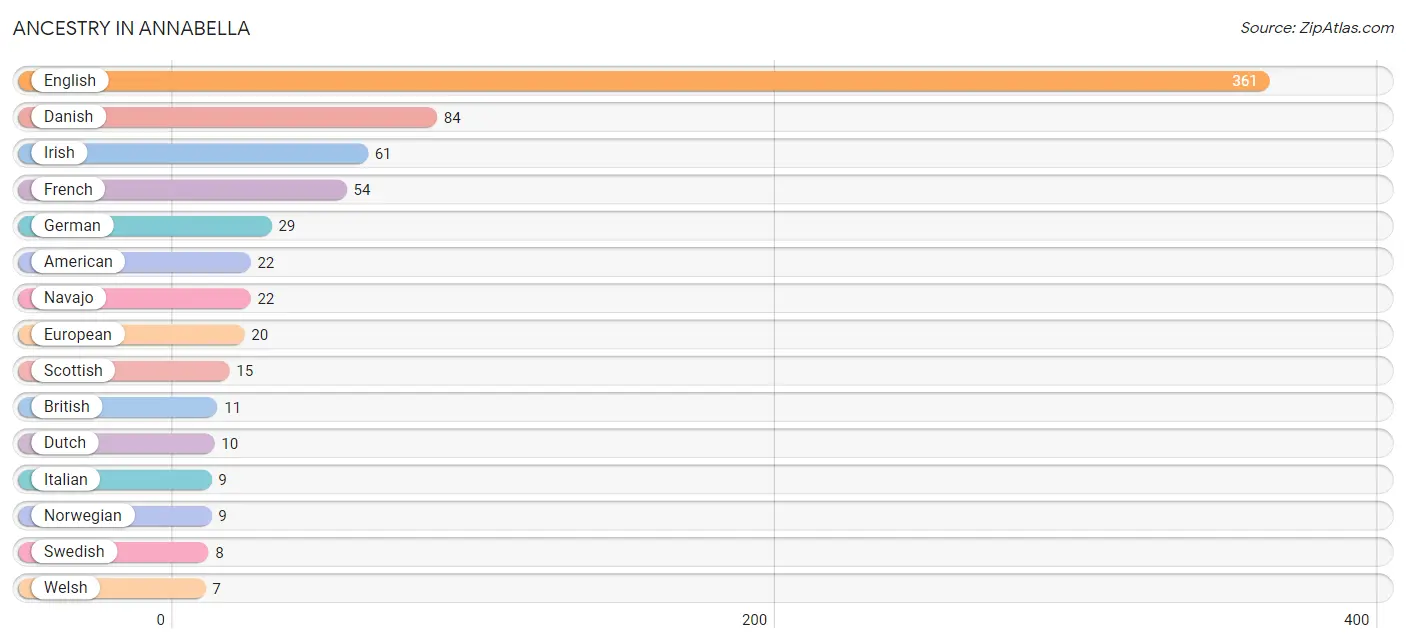
| Ancestry | # Population | % Population |
| American | 22 | 2.9% |
| Belgian | 3 | 0.4% |
| British | 11 | 1.4% |
| Danish | 84 | 11.0% |
| Dutch | 10 | 1.3% |
| English | 361 | 47.1% |
| European | 20 | 2.6% |
| French | 54 | 7.0% |
| French Canadian | 4 | 0.5% |
| German | 29 | 3.8% |
| Irish | 61 | 8.0% |
| Italian | 9 | 1.2% |
| Mexican | 1 | 0.1% |
| Navajo | 22 | 2.9% |
| Northern European | 2 | 0.3% |
| Norwegian | 9 | 1.2% |
| Puerto Rican | 3 | 0.4% |
| Scandinavian | 3 | 0.4% |
| Scottish | 15 | 2.0% |
| Swedish | 8 | 1.0% |
| Welsh | 7 | 0.9% | View All 21 Rows |
Immigrants in Annabella

| Immigration Origin | # Population | % Population | View All 0 Rows |
Sex and Age in Annabella
Sex and Age in Annabella
The most populous age groups in Annabella are 15 to 19 Years (58 | 14.8%) for men and 10 to 14 Years (69 | 18.4%) for women.
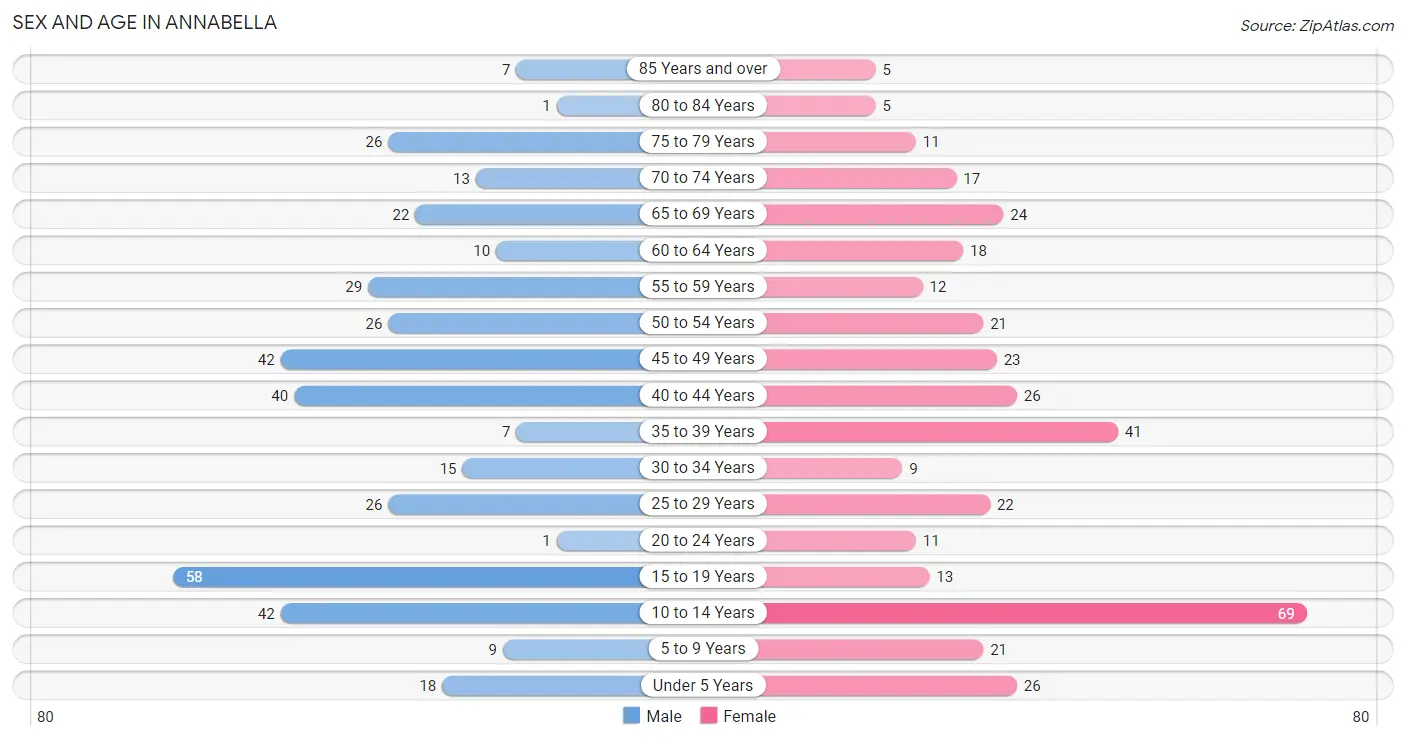
| Age Bracket | Male | Female |
| Under 5 Years | 18 (4.6%) | 26 (7.0%) |
| 5 to 9 Years | 9 (2.3%) | 21 (5.6%) |
| 10 to 14 Years | 42 (10.7%) | 69 (18.4%) |
| 15 to 19 Years | 58 (14.8%) | 13 (3.5%) |
| 20 to 24 Years | 1 (0.3%) | 11 (2.9%) |
| 25 to 29 Years | 26 (6.6%) | 22 (5.9%) |
| 30 to 34 Years | 15 (3.8%) | 9 (2.4%) |
| 35 to 39 Years | 7 (1.8%) | 41 (11.0%) |
| 40 to 44 Years | 40 (10.2%) | 26 (7.0%) |
| 45 to 49 Years | 42 (10.7%) | 23 (6.1%) |
| 50 to 54 Years | 26 (6.6%) | 21 (5.6%) |
| 55 to 59 Years | 29 (7.4%) | 12 (3.2%) |
| 60 to 64 Years | 10 (2.5%) | 18 (4.8%) |
| 65 to 69 Years | 22 (5.6%) | 24 (6.4%) |
| 70 to 74 Years | 13 (3.3%) | 17 (4.5%) |
| 75 to 79 Years | 26 (6.6%) | 11 (2.9%) |
| 80 to 84 Years | 1 (0.3%) | 5 (1.3%) |
| 85 Years and over | 7 (1.8%) | 5 (1.3%) |
| Total | 392 (100.0%) | 374 (100.0%) |
Families and Households in Annabella
Median Family Size in Annabella
The median family size in Annabella is 3.28 persons per family, with single female/mother families (4 | 1.8%) accounting for the largest median family size of 3.75 persons per family. On the other hand, single male/father families (8 | 3.7%) represent the smallest median family size with 2.13 persons per family.
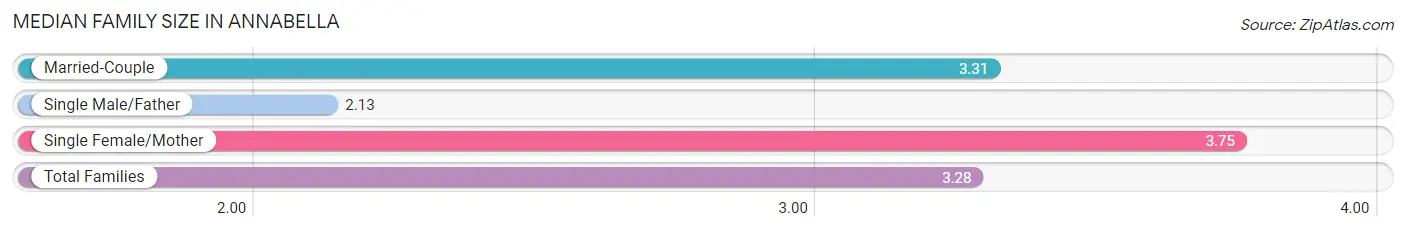
| Family Type | # Families | Family Size |
| Married-Couple | 204 (94.4%) | 3.31 |
| Single Male/Father | 8 (3.7%) | 2.13 |
| Single Female/Mother | 4 (1.8%) | 3.75 |
| Total Families | 216 (100.0%) | 3.28 |
Median Household Size in Annabella
The median household size in Annabella is 2.82 persons per household, with single female/mother households (4 | 1.5%) accounting for the largest median household size of 3.75 persons per household. non-family households (56 | 20.6%) represent the smallest median household size with 1.04 persons per household.
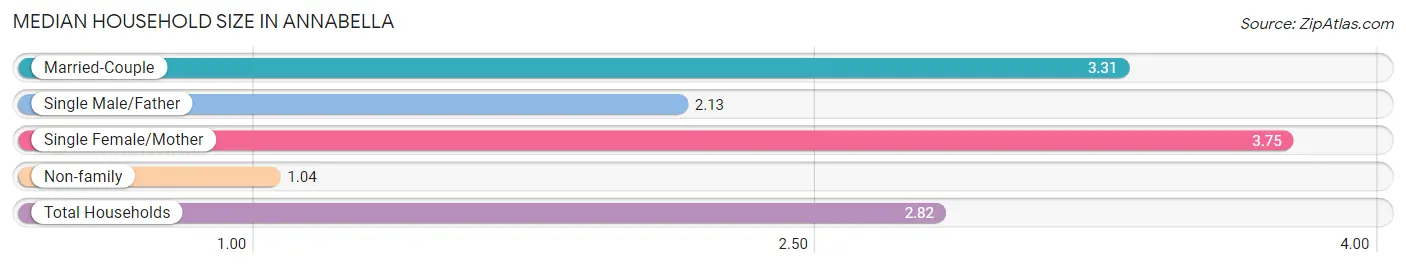
| Household Type | # Households | Household Size |
| Married-Couple | 204 (75.0%) | 3.31 |
| Single Male/Father | 8 (2.9%) | 2.13 |
| Single Female/Mother | 4 (1.5%) | 3.75 |
| Non-family | 56 (20.6%) | 1.04 |
| Total Households | 272 (100.0%) | 2.82 |
Household Size by Marriage Status in Annabella
Out of a total of 272 households in Annabella, 216 (79.4%) are family households, while 56 (20.6%) are nonfamily households. The most numerous type of family households are 2-person households, comprising 80, and the most common type of nonfamily households are 1-person households, comprising 54.
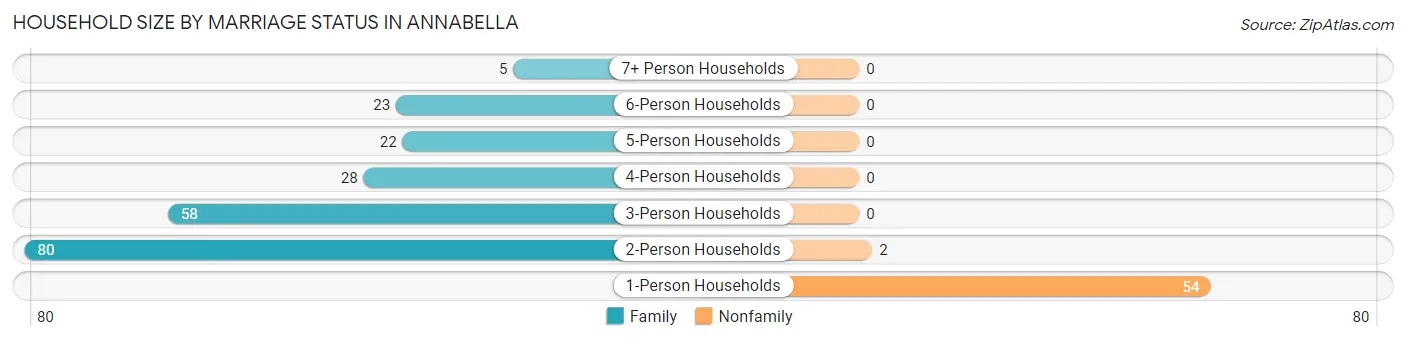
| Household Size | Family Households | Nonfamily Households |
| 1-Person Households | - | 54 (19.9%) |
| 2-Person Households | 80 (29.4%) | 2 (0.7%) |
| 3-Person Households | 58 (21.3%) | 0 (0.0%) |
| 4-Person Households | 28 (10.3%) | 0 (0.0%) |
| 5-Person Households | 22 (8.1%) | 0 (0.0%) |
| 6-Person Households | 23 (8.5%) | 0 (0.0%) |
| 7+ Person Households | 5 (1.8%) | 0 (0.0%) |
| Total | 216 (79.4%) | 56 (20.6%) |
Female Fertility in Annabella
Fertility by Age in Annabella
Average fertility rate in Annabella is 81.0 births per 1,000 women. Women in the age bracket of 20 to 34 years have the highest fertility rate with 286.0 births per 1,000 women. Women in the age bracket of 20 to 34 years acount for 100.0% of all women with births.
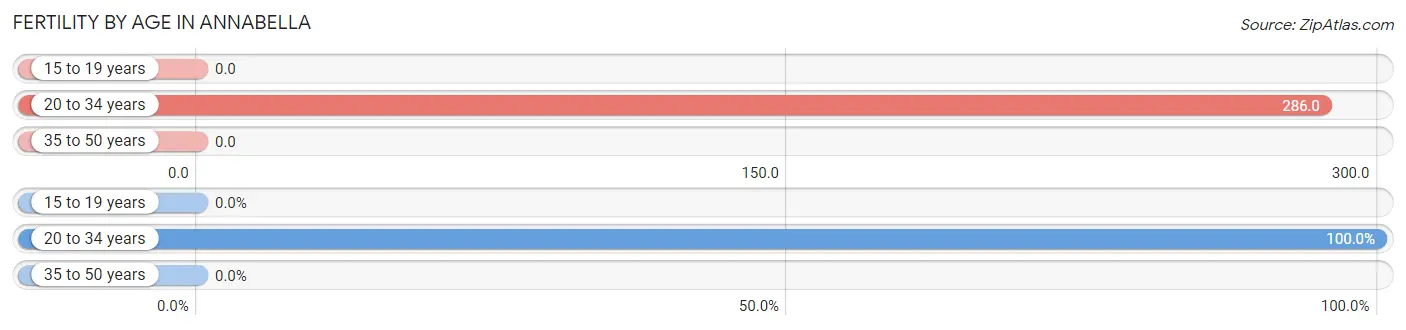
| Age Bracket | Women with Births | Births / 1,000 Women |
| 15 to 19 years | 0 (0.0%) | 0.0 |
| 20 to 34 years | 12 (100.0%) | 286.0 |
| 35 to 50 years | 0 (0.0%) | 0.0 |
| Total | 12 (100.0%) | 81.0 |
Fertility by Age by Marriage Status in Annabella
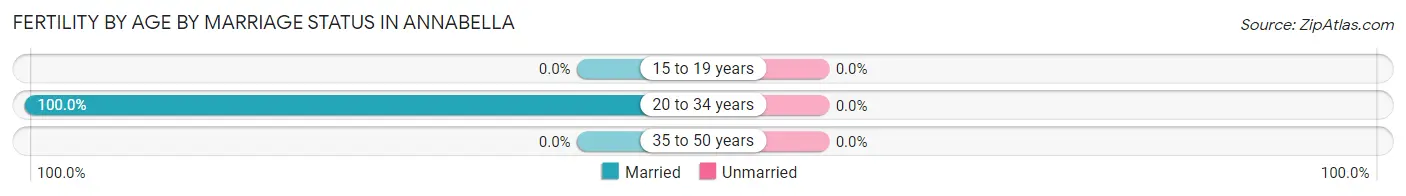
| Age Bracket | Married | Unmarried |
| 15 to 19 years | 0 (0.0%) | 0 (0.0%) |
| 20 to 34 years | 12 (100.0%) | 0 (0.0%) |
| 35 to 50 years | 0 (0.0%) | 0 (0.0%) |
| Total | 12 (100.0%) | 0 (0.0%) |
Fertility by Education in Annabella
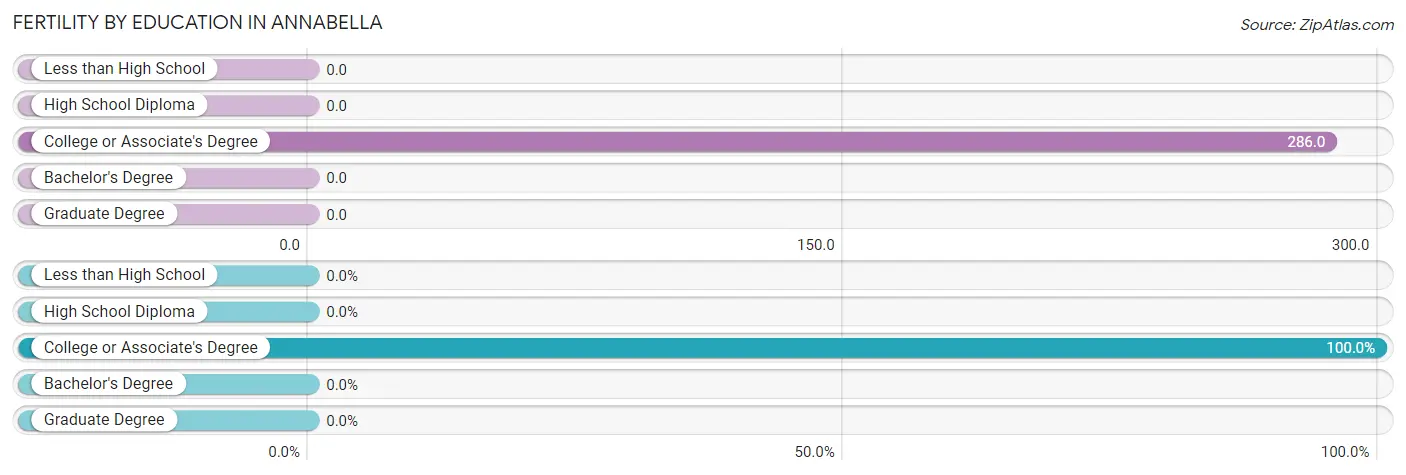
| Educational Attainment | Women with Births | Births / 1,000 Women |
| Less than High School | 0 (0.0%) | 0.0 |
| High School Diploma | 0 (0.0%) | 0.0 |
| College or Associate's Degree | 12 (100.0%) | 286.0 |
| Bachelor's Degree | 0 (0.0%) | 0.0 |
| Graduate Degree | 0 (0.0%) | 0.0 |
| Total | 12 (100.0%) | 81.0 |
Fertility by Education by Marriage Status in Annabella
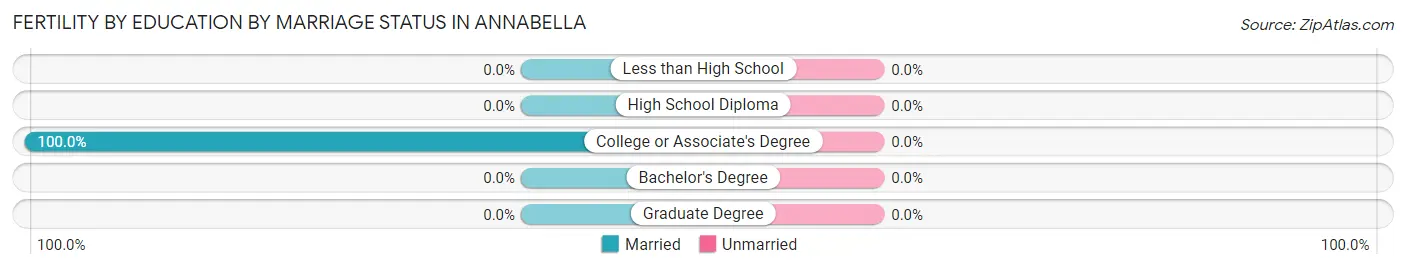
| Educational Attainment | Married | Unmarried |
| Less than High School | 0 (0.0%) | 0 (0.0%) |
| High School Diploma | 0 (0.0%) | 0 (0.0%) |
| College or Associate's Degree | 12 (100.0%) | 0 (0.0%) |
| Bachelor's Degree | 0 (0.0%) | 0 (0.0%) |
| Graduate Degree | 0 (0.0%) | 0 (0.0%) |
| Total | 12 (100.0%) | 0 (0.0%) |
Employment Characteristics in Annabella
Employment by Class of Employer in Annabella
Among the 322 employed individuals in Annabella, private company employees (179 | 55.6%), state government employees (62 | 19.3%), and local government employees (29 | 9.0%) make up the most common classes of employment.
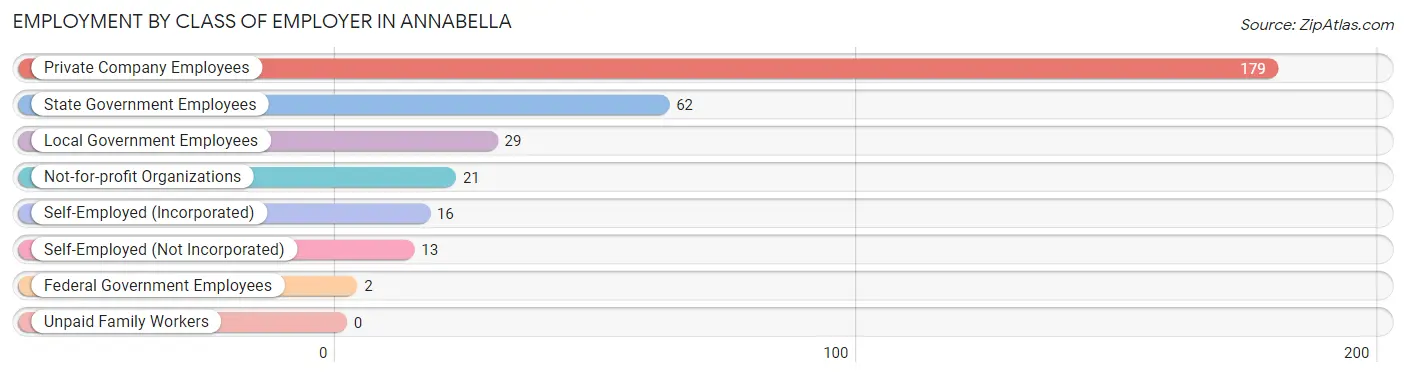
| Employer Class | # Employees | % Employees |
| Private Company Employees | 179 | 55.6% |
| Self-Employed (Incorporated) | 16 | 5.0% |
| Self-Employed (Not Incorporated) | 13 | 4.0% |
| Not-for-profit Organizations | 21 | 6.5% |
| Local Government Employees | 29 | 9.0% |
| State Government Employees | 62 | 19.3% |
| Federal Government Employees | 2 | 0.6% |
| Unpaid Family Workers | 0 | 0.0% |
| Total | 322 | 100.0% |
Employment Status by Age in Annabella
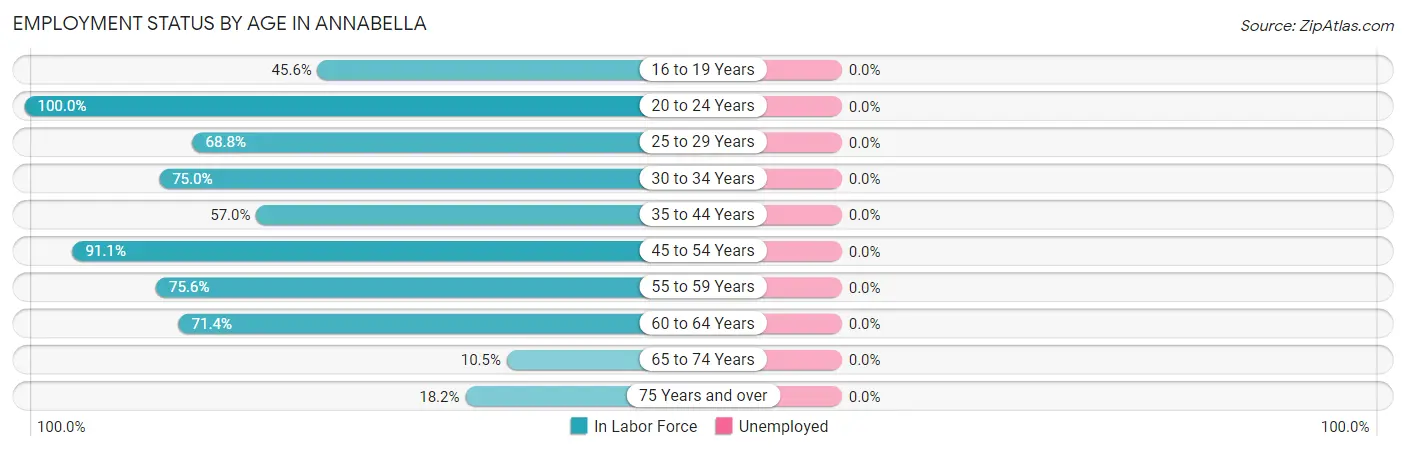
| Age Bracket | In Labor Force | Unemployed |
| 16 to 19 Years | 26 (45.6%) | 0 (0.0%) |
| 20 to 24 Years | 12 (100.0%) | 0 (0.0%) |
| 25 to 29 Years | 33 (68.8%) | 0 (0.0%) |
| 30 to 34 Years | 18 (75.0%) | 0 (0.0%) |
| 35 to 44 Years | 65 (57.0%) | 0 (0.0%) |
| 45 to 54 Years | 102 (91.1%) | 0 (0.0%) |
| 55 to 59 Years | 31 (75.6%) | 0 (0.0%) |
| 60 to 64 Years | 20 (71.4%) | 0 (0.0%) |
| 65 to 74 Years | 8 (10.5%) | 0 (0.0%) |
| 75 Years and over | 10 (18.2%) | 0 (0.0%) |
| Total | 325 (57.3%) | 0 (0.0%) |
Employment Status by Educational Attainment in Annabella
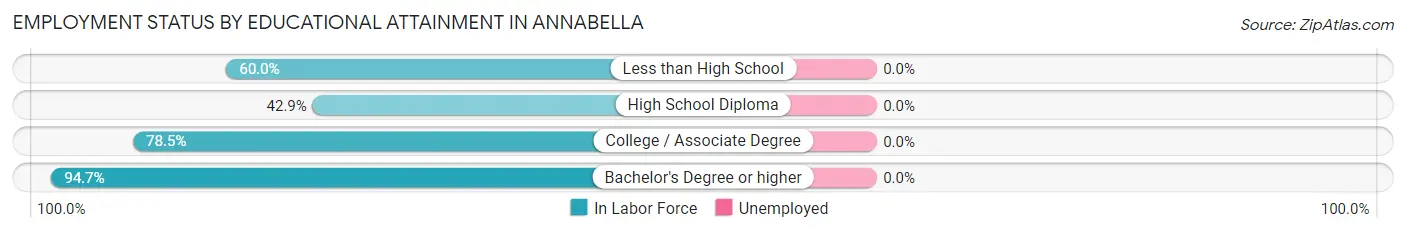
| Educational Attainment | In Labor Force | Unemployed |
| Less than High School | 6 (60.0%) | 0 (0.0%) |
| High School Diploma | 39 (42.9%) | 0 (0.0%) |
| College / Associate Degree | 135 (78.5%) | 0 (0.0%) |
| Bachelor's Degree or higher | 89 (94.7%) | 0 (0.0%) |
| Total | 269 (73.3%) | 0 (0.0%) |
Employment Occupations by Sex in Annabella
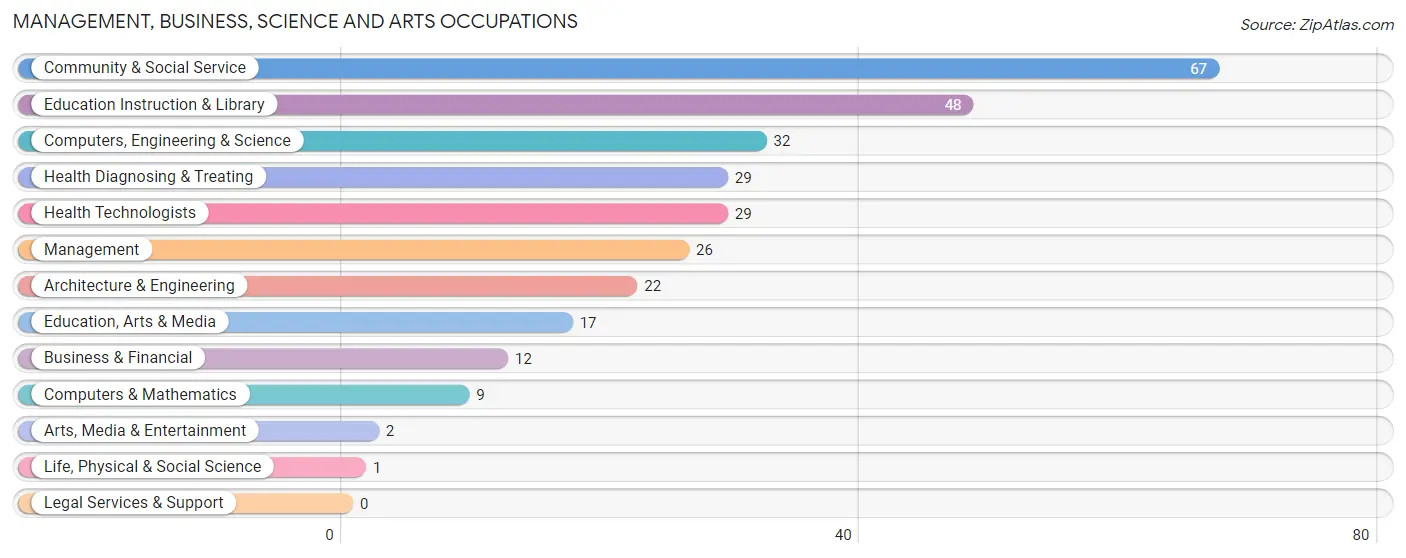
Management, Business, Science and Arts Occupations
The most common Management, Business, Science and Arts occupations in Annabella are Community & Social Service (67 | 20.6%), Education Instruction & Library (48 | 14.8%), Computers, Engineering & Science (32 | 9.9%), Health Diagnosing & Treating (29 | 8.9%), and Health Technologists (29 | 8.9%).
Management, Business, Science and Arts Occupations by Sex
Within the Management, Business, Science and Arts occupations in Annabella, the most male-oriented occupations are Management (100.0%), Computers, Engineering & Science (100.0%), and Computers & Mathematics (100.0%), while the most female-oriented occupations are Education, Arts & Media (100.0%), Arts, Media & Entertainment (100.0%), and Community & Social Service (86.6%).
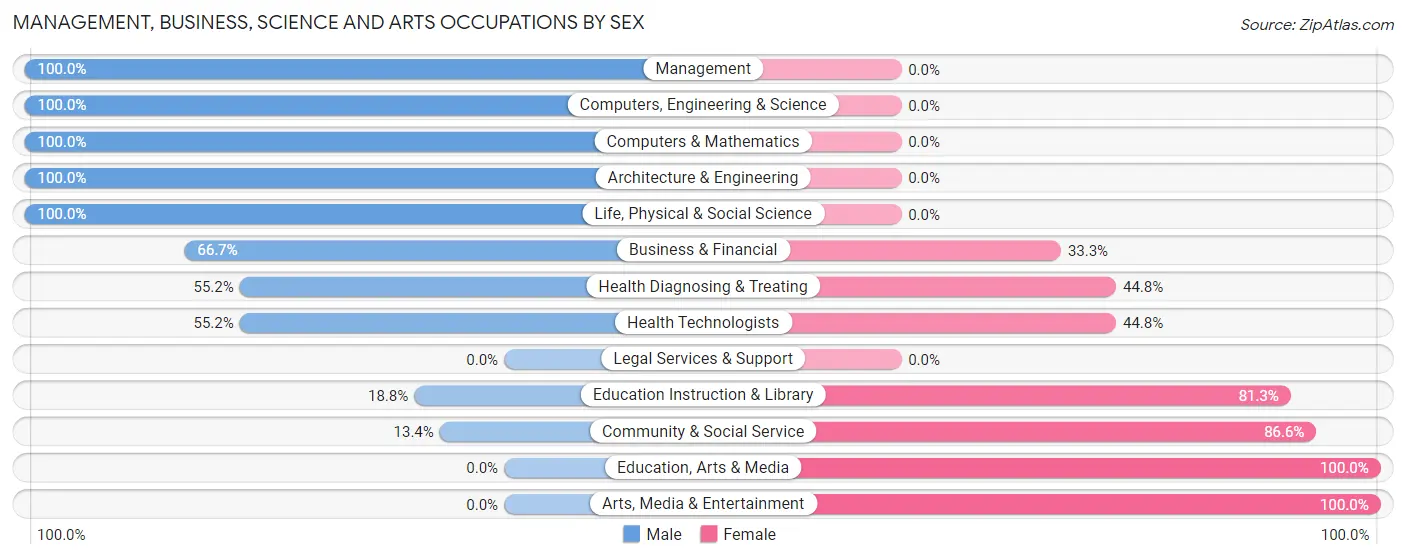
| Occupation | Male | Female |
| Management | 26 (100.0%) | 0 (0.0%) |
| Business & Financial | 8 (66.7%) | 4 (33.3%) |
| Computers, Engineering & Science | 32 (100.0%) | 0 (0.0%) |
| Computers & Mathematics | 9 (100.0%) | 0 (0.0%) |
| Architecture & Engineering | 22 (100.0%) | 0 (0.0%) |
| Life, Physical & Social Science | 1 (100.0%) | 0 (0.0%) |
| Community & Social Service | 9 (13.4%) | 58 (86.6%) |
| Education, Arts & Media | 0 (0.0%) | 17 (100.0%) |
| Legal Services & Support | 0 (0.0%) | 0 (0.0%) |
| Education Instruction & Library | 9 (18.8%) | 39 (81.2%) |
| Arts, Media & Entertainment | 0 (0.0%) | 2 (100.0%) |
| Health Diagnosing & Treating | 16 (55.2%) | 13 (44.8%) |
| Health Technologists | 16 (55.2%) | 13 (44.8%) |
| Total (Category) | 91 (54.8%) | 75 (45.2%) |
| Total (Overall) | 214 (65.8%) | 111 (34.2%) |
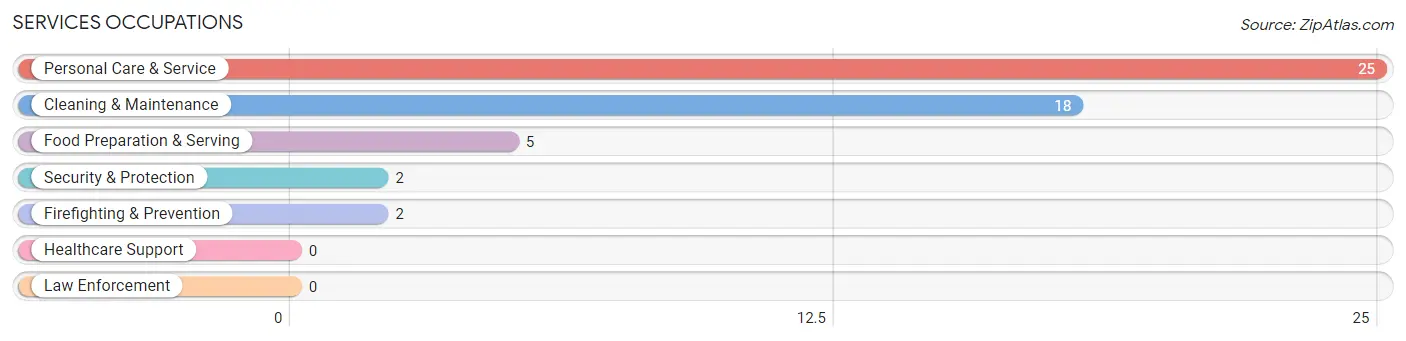
Services Occupations
The most common Services occupations in Annabella are Personal Care & Service (25 | 7.7%), Cleaning & Maintenance (18 | 5.5%), Food Preparation & Serving (5 | 1.5%), Security & Protection (2 | 0.6%), and Firefighting & Prevention (2 | 0.6%).
Services Occupations by Sex
Within the Services occupations in Annabella, the most male-oriented occupations are Security & Protection (100.0%), Firefighting & Prevention (100.0%), and Cleaning & Maintenance (94.4%), while the most female-oriented occupations are Food Preparation & Serving (100.0%), Personal Care & Service (20.0%), and Cleaning & Maintenance (5.6%).
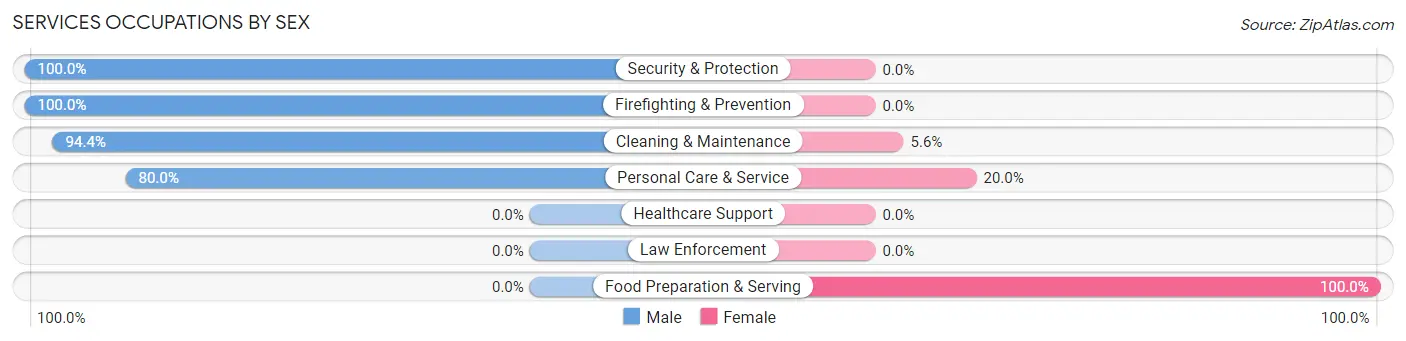
| Occupation | Male | Female |
| Healthcare Support | 0 (0.0%) | 0 (0.0%) |
| Security & Protection | 2 (100.0%) | 0 (0.0%) |
| Firefighting & Prevention | 2 (100.0%) | 0 (0.0%) |
| Law Enforcement | 0 (0.0%) | 0 (0.0%) |
| Food Preparation & Serving | 0 (0.0%) | 5 (100.0%) |
| Cleaning & Maintenance | 17 (94.4%) | 1 (5.6%) |
| Personal Care & Service | 20 (80.0%) | 5 (20.0%) |
| Total (Category) | 39 (78.0%) | 11 (22.0%) |
| Total (Overall) | 214 (65.8%) | 111 (34.2%) |
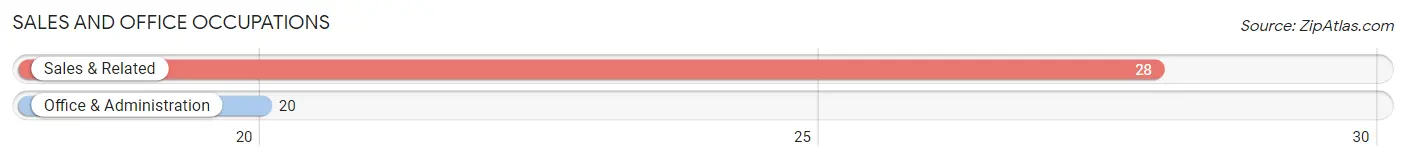
Sales and Office Occupations
The most common Sales and Office occupations in Annabella are Sales & Related (28 | 8.6%), and Office & Administration (20 | 6.1%).
Sales and Office Occupations by Sex
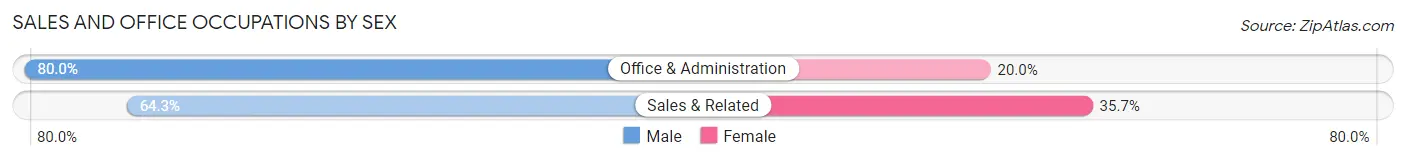
| Occupation | Male | Female |
| Sales & Related | 18 (64.3%) | 10 (35.7%) |
| Office & Administration | 16 (80.0%) | 4 (20.0%) |
| Total (Category) | 34 (70.8%) | 14 (29.2%) |
| Total (Overall) | 214 (65.8%) | 111 (34.2%) |
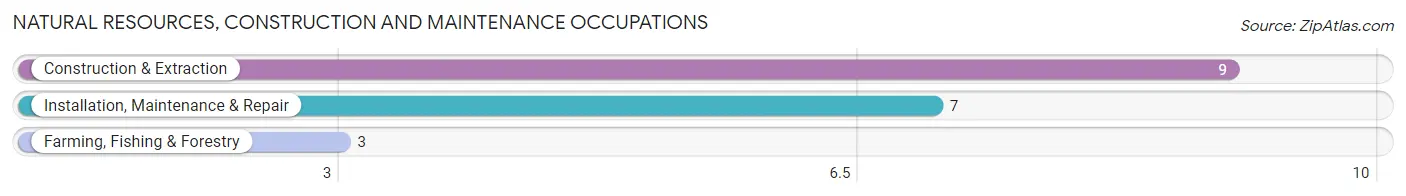
Natural Resources, Construction and Maintenance Occupations
The most common Natural Resources, Construction and Maintenance occupations in Annabella are Construction & Extraction (9 | 2.8%), Installation, Maintenance & Repair (7 | 2.1%), and Farming, Fishing & Forestry (3 | 0.9%).
Natural Resources, Construction and Maintenance Occupations by Sex
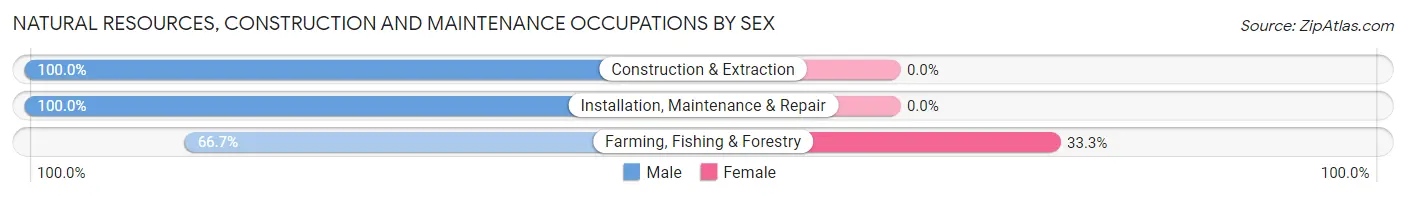
| Occupation | Male | Female |
| Farming, Fishing & Forestry | 2 (66.7%) | 1 (33.3%) |
| Construction & Extraction | 9 (100.0%) | 0 (0.0%) |
| Installation, Maintenance & Repair | 7 (100.0%) | 0 (0.0%) |
| Total (Category) | 18 (94.7%) | 1 (5.3%) |
| Total (Overall) | 214 (65.8%) | 111 (34.2%) |
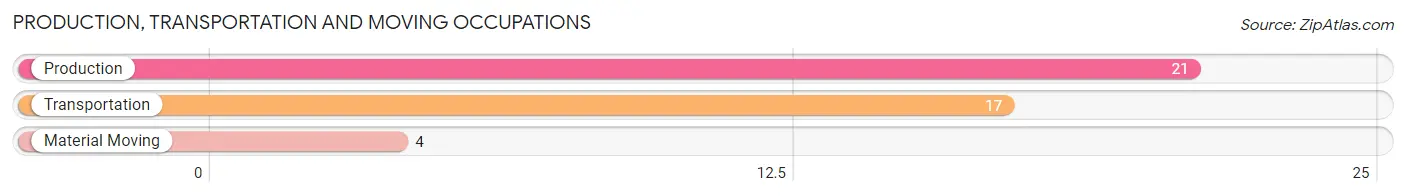
Production, Transportation and Moving Occupations
The most common Production, Transportation and Moving occupations in Annabella are Production (21 | 6.5%), Transportation (17 | 5.2%), and Material Moving (4 | 1.2%).
Production, Transportation and Moving Occupations by Sex
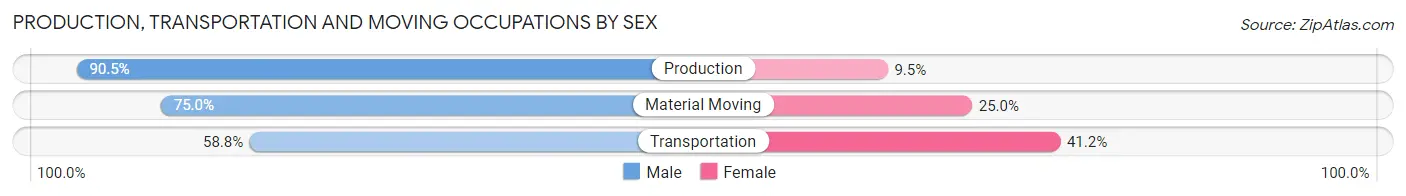
| Occupation | Male | Female |
| Production | 19 (90.5%) | 2 (9.5%) |
| Transportation | 10 (58.8%) | 7 (41.2%) |
| Material Moving | 3 (75.0%) | 1 (25.0%) |
| Total (Category) | 32 (76.2%) | 10 (23.8%) |
| Total (Overall) | 214 (65.8%) | 111 (34.2%) |
Employment Industries by Sex in Annabella
Employment Industries in Annabella
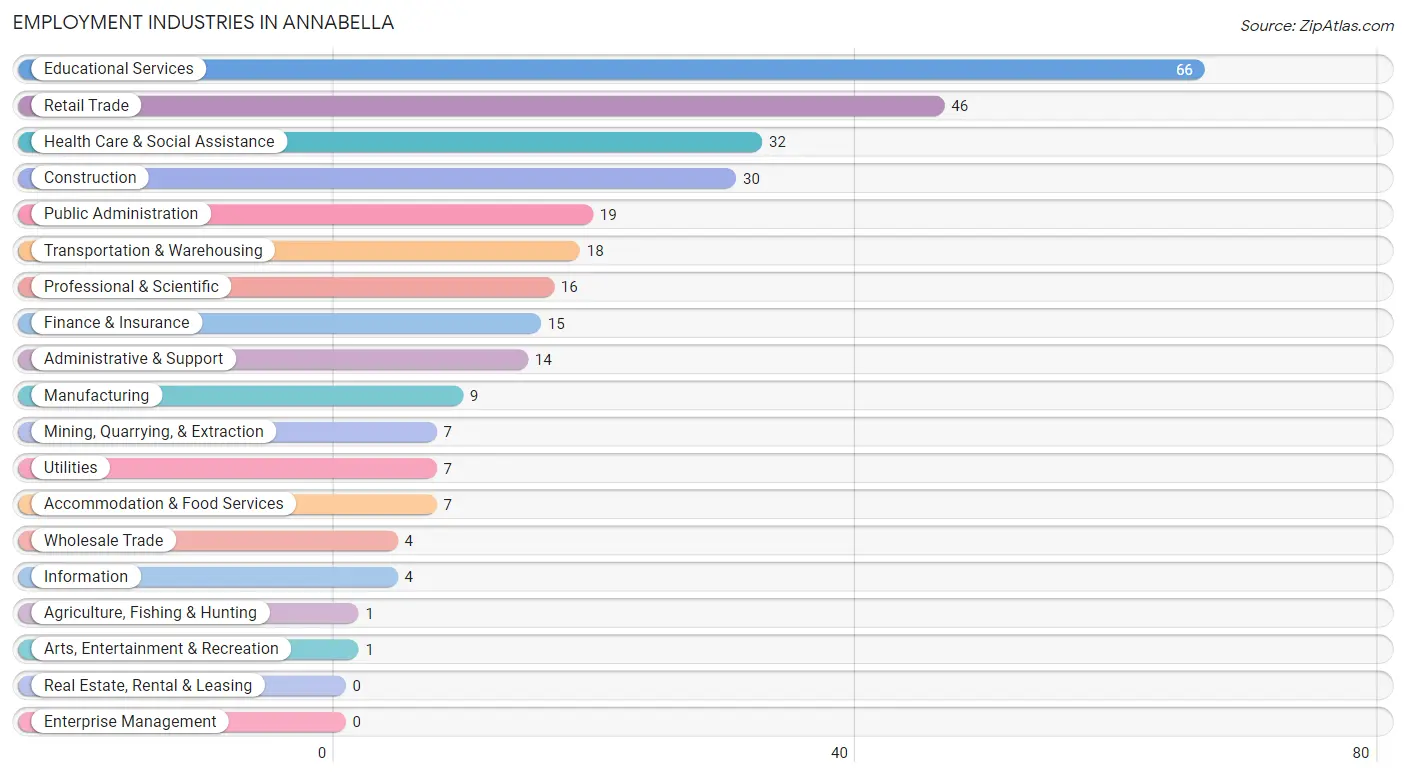
The major employment industries in Annabella include Educational Services (66 | 20.3%), Retail Trade (46 | 14.1%), Health Care & Social Assistance (32 | 9.9%), Construction (30 | 9.2%), and Public Administration (19 | 5.9%).
Employment Industries by Sex in Annabella
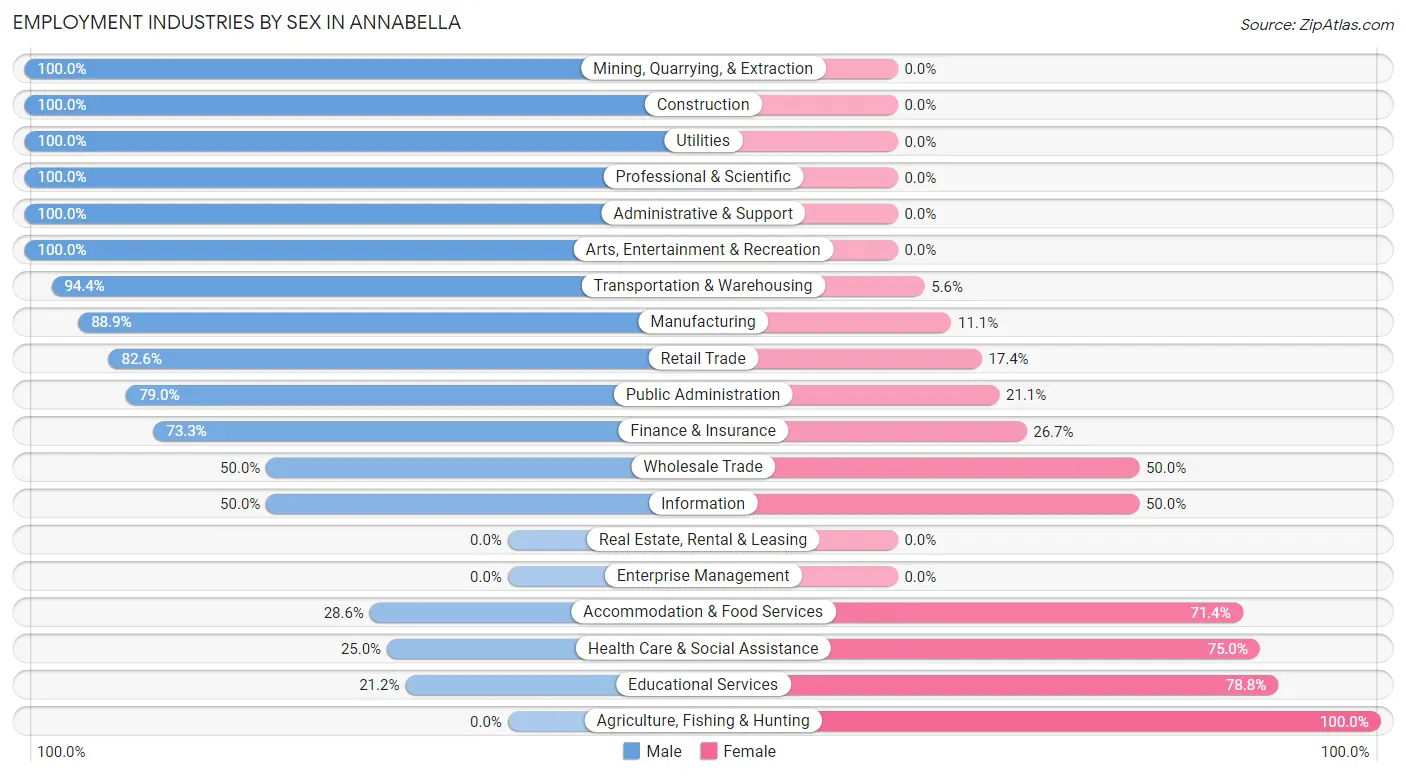
The Annabella industries that see more men than women are Mining, Quarrying, & Extraction (100.0%), Construction (100.0%), and Utilities (100.0%), whereas the industries that tend to have a higher number of women are Agriculture, Fishing & Hunting (100.0%), Educational Services (78.8%), and Health Care & Social Assistance (75.0%).
| Industry | Male | Female |
| Agriculture, Fishing & Hunting | 0 (0.0%) | 1 (100.0%) |
| Mining, Quarrying, & Extraction | 7 (100.0%) | 0 (0.0%) |
| Construction | 30 (100.0%) | 0 (0.0%) |
| Manufacturing | 8 (88.9%) | 1 (11.1%) |
| Wholesale Trade | 2 (50.0%) | 2 (50.0%) |
| Retail Trade | 38 (82.6%) | 8 (17.4%) |
| Transportation & Warehousing | 17 (94.4%) | 1 (5.6%) |
| Utilities | 7 (100.0%) | 0 (0.0%) |
| Information | 2 (50.0%) | 2 (50.0%) |
| Finance & Insurance | 11 (73.3%) | 4 (26.7%) |
| Real Estate, Rental & Leasing | 0 (0.0%) | 0 (0.0%) |
| Professional & Scientific | 16 (100.0%) | 0 (0.0%) |
| Enterprise Management | 0 (0.0%) | 0 (0.0%) |
| Administrative & Support | 14 (100.0%) | 0 (0.0%) |
| Educational Services | 14 (21.2%) | 52 (78.8%) |
| Health Care & Social Assistance | 8 (25.0%) | 24 (75.0%) |
| Arts, Entertainment & Recreation | 1 (100.0%) | 0 (0.0%) |
| Accommodation & Food Services | 2 (28.6%) | 5 (71.4%) |
| Public Administration | 15 (78.9%) | 4 (21.0%) |
| Total | 214 (65.8%) | 111 (34.2%) |
Education in Annabella
School Enrollment in Annabella
The most common levels of schooling among the 218 students in Annabella are high school (75 | 34.4%), elementary school (59 | 27.1%), and middle school (57 | 26.2%).
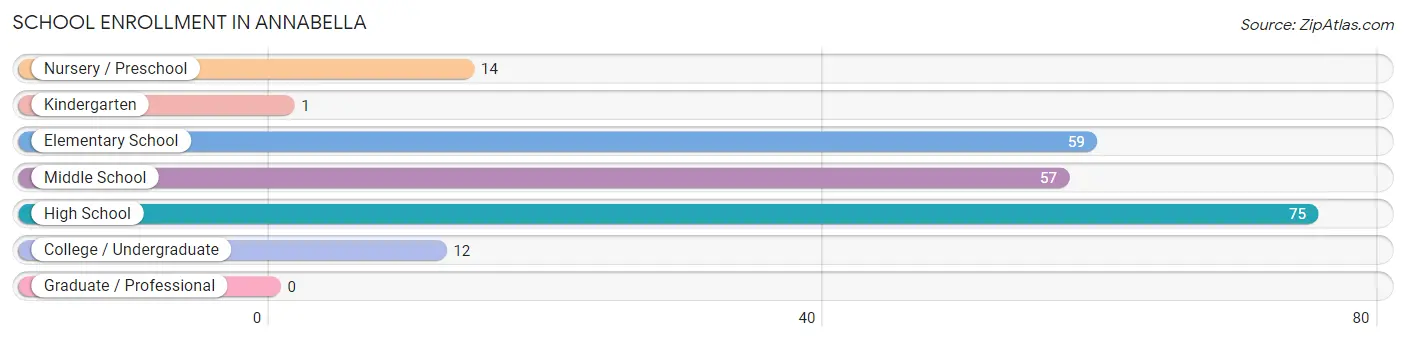
| School Level | # Students | % Students |
| Nursery / Preschool | 14 | 6.4% |
| Kindergarten | 1 | 0.5% |
| Elementary School | 59 | 27.1% |
| Middle School | 57 | 26.2% |
| High School | 75 | 34.4% |
| College / Undergraduate | 12 | 5.5% |
| Graduate / Professional | 0 | 0.0% |
| Total | 218 | 100.0% |
School Enrollment by Age by Funding Source in Annabella
Out of a total of 218 students who are enrolled in schools in Annabella, 3 (1.4%) attend a private institution, while the remaining 215 (98.6%) are enrolled in public schools. The age group of 35 years and over has the highest likelihood of being enrolled in private schools, with 2 (66.7% in the age bracket) enrolled. Conversely, the age group of 5 to 9 year old has the lowest likelihood of being enrolled in a private school, with 27 (100.0% in the age bracket) attending a public institution.
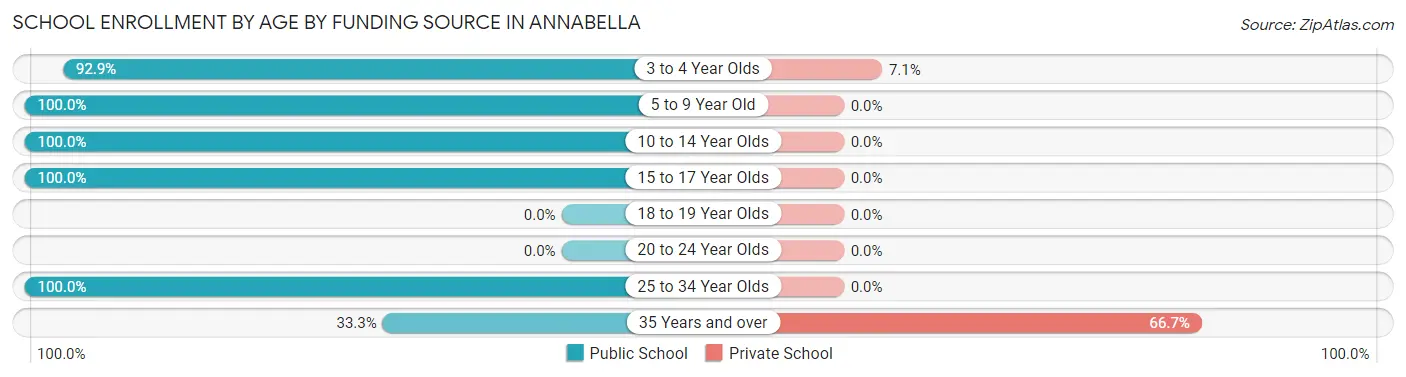
| Age Bracket | Public School | Private School |
| 3 to 4 Year Olds | 13 (92.9%) | 1 (7.1%) |
| 5 to 9 Year Old | 27 (100.0%) | 0 (0.0%) |
| 10 to 14 Year Olds | 111 (100.0%) | 0 (0.0%) |
| 15 to 17 Year Olds | 54 (100.0%) | 0 (0.0%) |
| 18 to 19 Year Olds | 0 (0.0%) | 0 (0.0%) |
| 20 to 24 Year Olds | 0 (0.0%) | 0 (0.0%) |
| 25 to 34 Year Olds | 9 (100.0%) | 0 (0.0%) |
| 35 Years and over | 1 (33.3%) | 2 (66.7%) |
| Total | 215 (98.6%) | 3 (1.4%) |
Educational Attainment by Field of Study in Annabella
Education (54 | 42.5%), engineering (19 | 15.0%), business (19 | 15.0%), bio, nature & agricultural (15 | 11.8%), and science & technology (9 | 7.1%) are the most common fields of study among 127 individuals in Annabella who have obtained a bachelor's degree or higher.
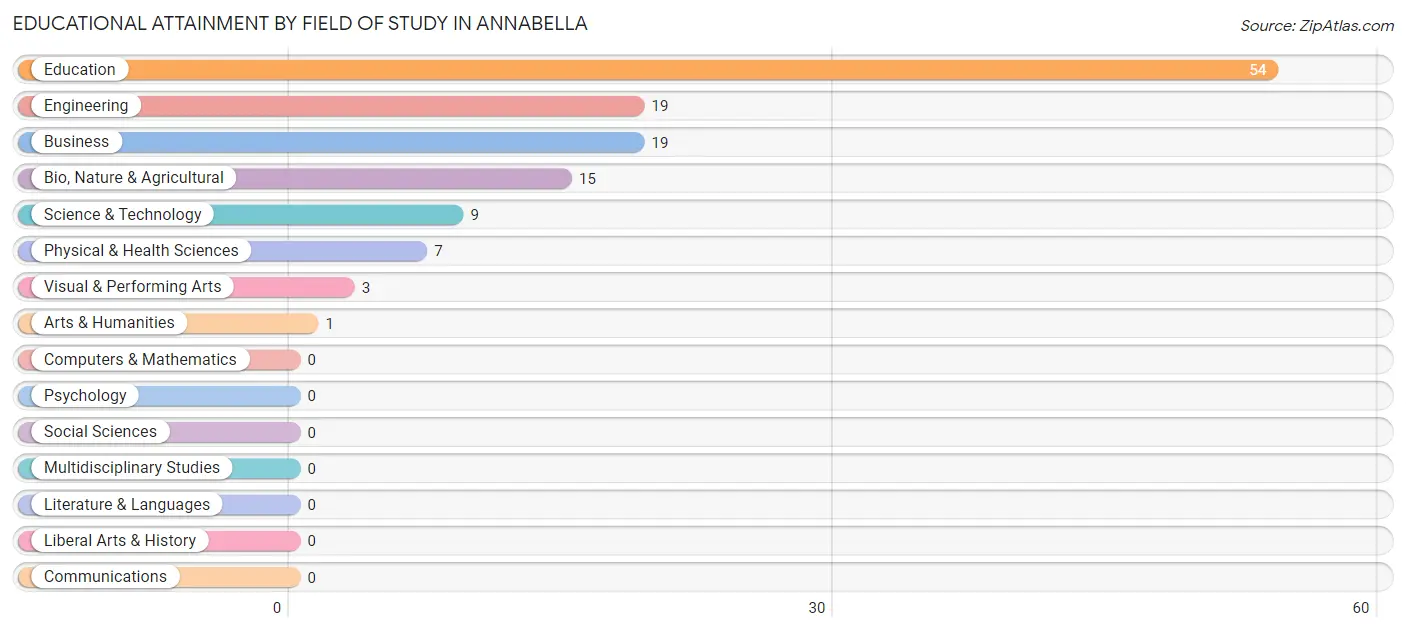
| Field of Study | # Graduates | % Graduates |
| Computers & Mathematics | 0 | 0.0% |
| Bio, Nature & Agricultural | 15 | 11.8% |
| Physical & Health Sciences | 7 | 5.5% |
| Psychology | 0 | 0.0% |
| Social Sciences | 0 | 0.0% |
| Engineering | 19 | 15.0% |
| Multidisciplinary Studies | 0 | 0.0% |
| Science & Technology | 9 | 7.1% |
| Business | 19 | 15.0% |
| Education | 54 | 42.5% |
| Literature & Languages | 0 | 0.0% |
| Liberal Arts & History | 0 | 0.0% |
| Visual & Performing Arts | 3 | 2.4% |
| Communications | 0 | 0.0% |
| Arts & Humanities | 1 | 0.8% |
| Total | 127 | 100.0% |
Transportation & Commute in Annabella
Vehicle Availability by Sex in Annabella
The most prevalent vehicle ownership categories in Annabella are males with 4 vehicles (86, accounting for 40.8%) and females with 4 vehicles (33, making up 77.5%).
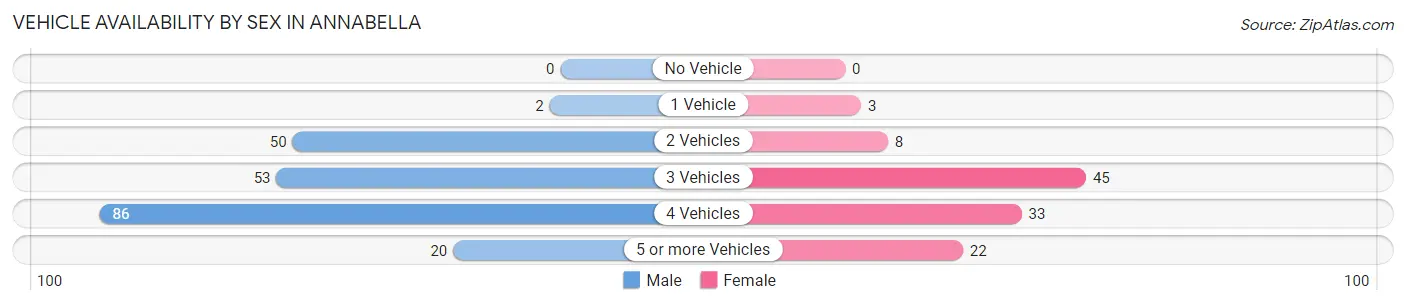
| Vehicles Available | Male | Female |
| No Vehicle | 0 (0.0%) | 0 (0.0%) |
| 1 Vehicle | 2 (0.9%) | 3 (2.7%) |
| 2 Vehicles | 50 (23.7%) | 8 (7.2%) |
| 3 Vehicles | 53 (25.1%) | 45 (40.5%) |
| 4 Vehicles | 86 (40.8%) | 33 (29.7%) |
| 5 or more Vehicles | 20 (9.5%) | 22 (19.8%) |
| Total | 211 (100.0%) | 111 (100.0%) |
Commute Time in Annabella
The most frequently occuring commute durations in Annabella are 10 to 14 minutes (170 commuters, 58.8%), 5 to 9 minutes (34 commuters, 11.8%), and 15 to 19 minutes (30 commuters, 10.4%).
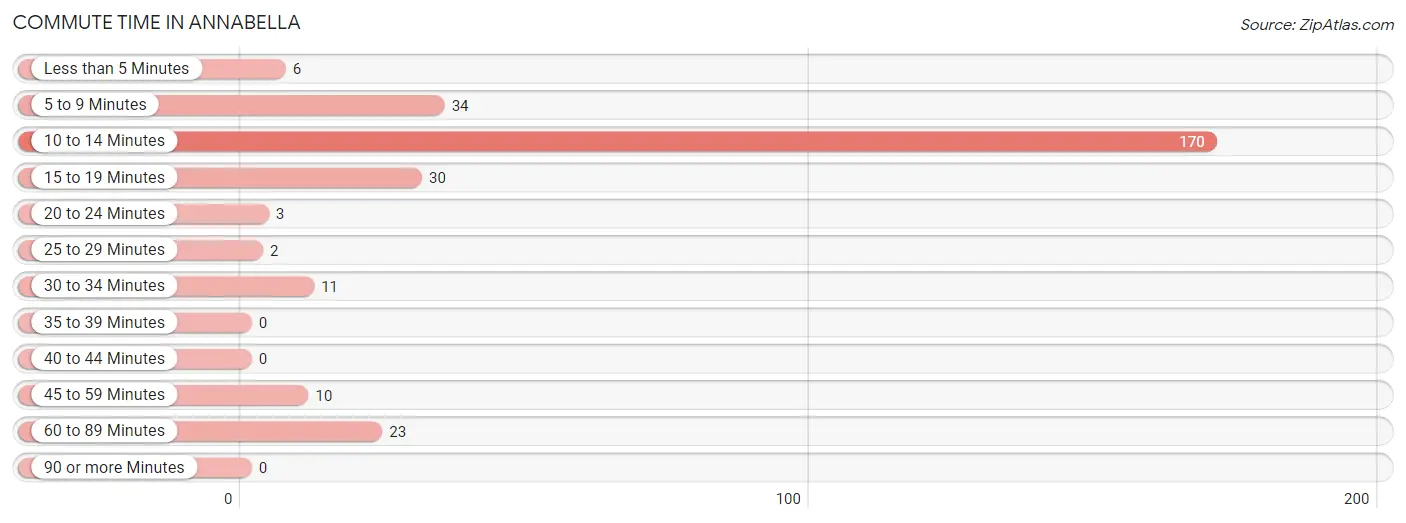
| Commute Time | # Commuters | % Commuters |
| Less than 5 Minutes | 6 | 2.1% |
| 5 to 9 Minutes | 34 | 11.8% |
| 10 to 14 Minutes | 170 | 58.8% |
| 15 to 19 Minutes | 30 | 10.4% |
| 20 to 24 Minutes | 3 | 1.0% |
| 25 to 29 Minutes | 2 | 0.7% |
| 30 to 34 Minutes | 11 | 3.8% |
| 35 to 39 Minutes | 0 | 0.0% |
| 40 to 44 Minutes | 0 | 0.0% |
| 45 to 59 Minutes | 10 | 3.5% |
| 60 to 89 Minutes | 23 | 8.0% |
| 90 or more Minutes | 0 | 0.0% |
Commute Time by Sex in Annabella
The most common commute times in Annabella are 10 to 14 minutes (101 commuters, 52.1%) for males and 10 to 14 minutes (69 commuters, 72.6%) for females.
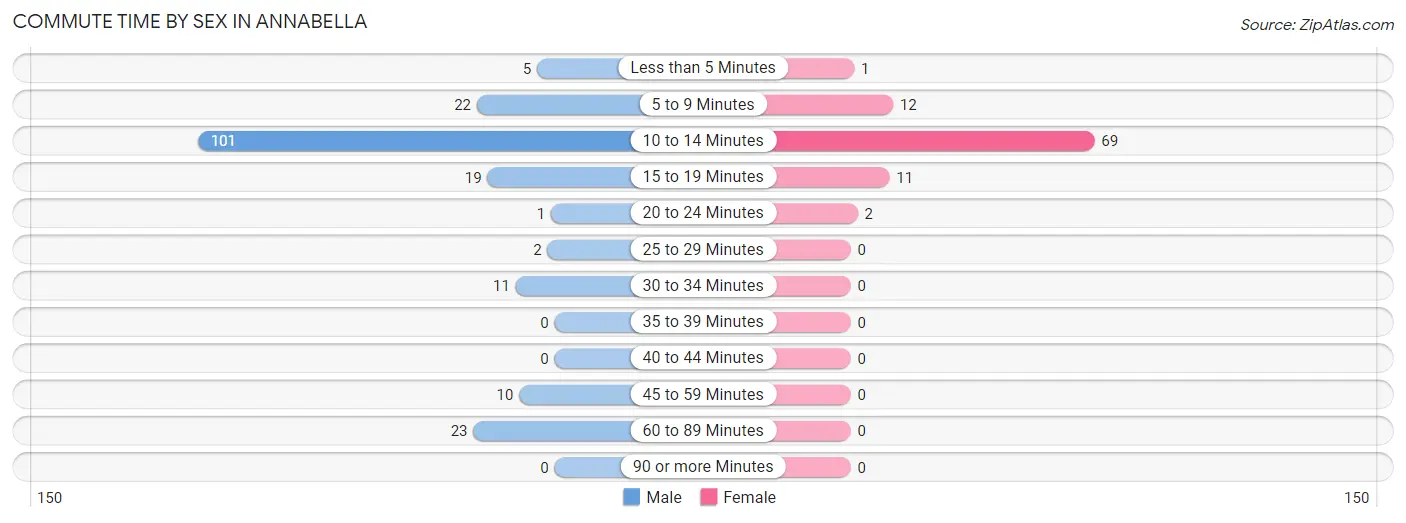
| Commute Time | Male | Female |
| Less than 5 Minutes | 5 (2.6%) | 1 (1.1%) |
| 5 to 9 Minutes | 22 (11.3%) | 12 (12.6%) |
| 10 to 14 Minutes | 101 (52.1%) | 69 (72.6%) |
| 15 to 19 Minutes | 19 (9.8%) | 11 (11.6%) |
| 20 to 24 Minutes | 1 (0.5%) | 2 (2.1%) |
| 25 to 29 Minutes | 2 (1.0%) | 0 (0.0%) |
| 30 to 34 Minutes | 11 (5.7%) | 0 (0.0%) |
| 35 to 39 Minutes | 0 (0.0%) | 0 (0.0%) |
| 40 to 44 Minutes | 0 (0.0%) | 0 (0.0%) |
| 45 to 59 Minutes | 10 (5.1%) | 0 (0.0%) |
| 60 to 89 Minutes | 23 (11.9%) | 0 (0.0%) |
| 90 or more Minutes | 0 (0.0%) | 0 (0.0%) |
Time of Departure to Work by Sex in Annabella
The most frequent times of departure to work in Annabella are 7:00 AM to 7:29 AM (52, 26.8%) for males and 7:00 AM to 7:29 AM (48, 50.5%) for females.
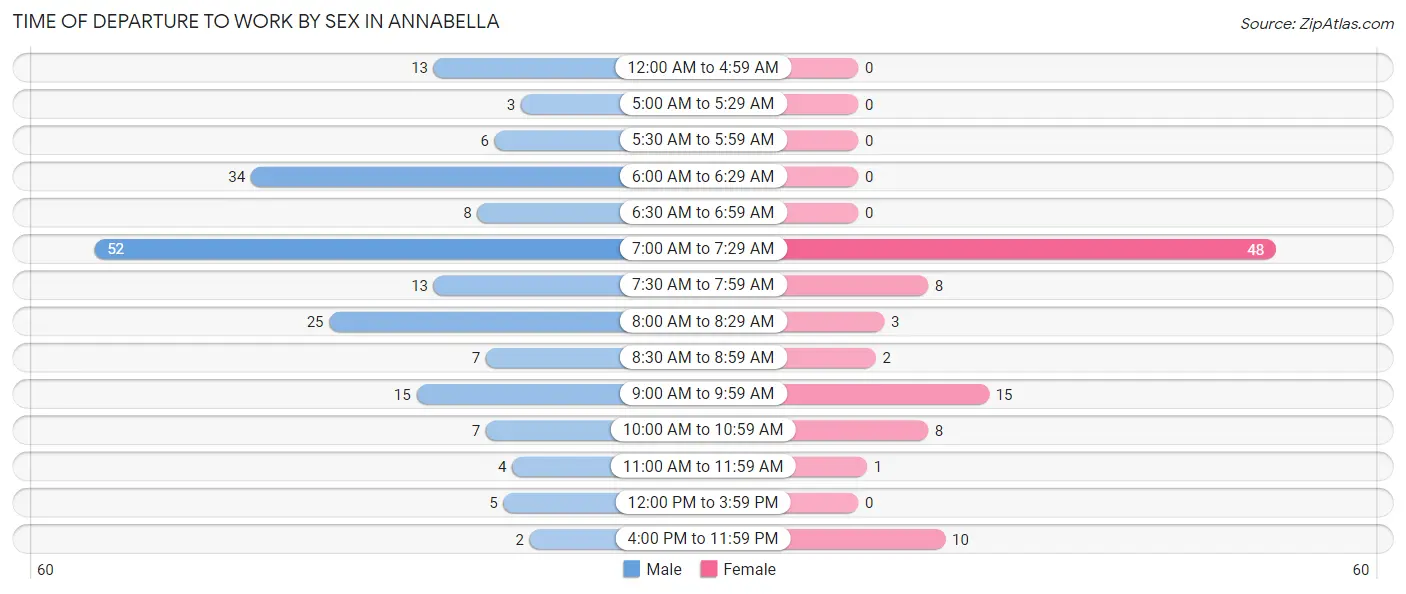
| Time of Departure | Male | Female |
| 12:00 AM to 4:59 AM | 13 (6.7%) | 0 (0.0%) |
| 5:00 AM to 5:29 AM | 3 (1.5%) | 0 (0.0%) |
| 5:30 AM to 5:59 AM | 6 (3.1%) | 0 (0.0%) |
| 6:00 AM to 6:29 AM | 34 (17.5%) | 0 (0.0%) |
| 6:30 AM to 6:59 AM | 8 (4.1%) | 0 (0.0%) |
| 7:00 AM to 7:29 AM | 52 (26.8%) | 48 (50.5%) |
| 7:30 AM to 7:59 AM | 13 (6.7%) | 8 (8.4%) |
| 8:00 AM to 8:29 AM | 25 (12.9%) | 3 (3.2%) |
| 8:30 AM to 8:59 AM | 7 (3.6%) | 2 (2.1%) |
| 9:00 AM to 9:59 AM | 15 (7.7%) | 15 (15.8%) |
| 10:00 AM to 10:59 AM | 7 (3.6%) | 8 (8.4%) |
| 11:00 AM to 11:59 AM | 4 (2.1%) | 1 (1.1%) |
| 12:00 PM to 3:59 PM | 5 (2.6%) | 0 (0.0%) |
| 4:00 PM to 11:59 PM | 2 (1.0%) | 10 (10.5%) |
| Total | 194 (100.0%) | 95 (100.0%) |
Housing Occupancy in Annabella
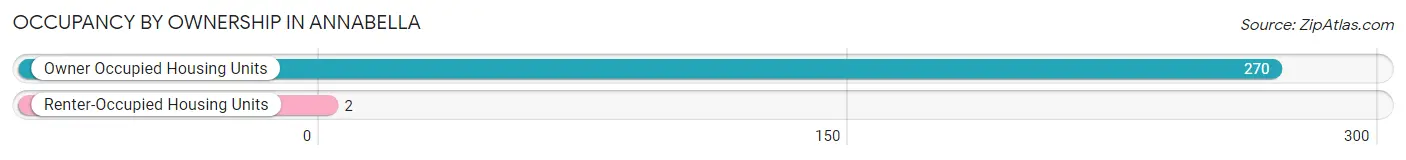
Occupancy by Ownership in Annabella
Of the total 272 dwellings in Annabella, owner-occupied units account for 270 (99.3%), while renter-occupied units make up 2 (0.7%).
| Occupancy | # Housing Units | % Housing Units |
| Owner Occupied Housing Units | 270 | 99.3% |
| Renter-Occupied Housing Units | 2 | 0.7% |
| Total Occupied Housing Units | 272 | 100.0% |
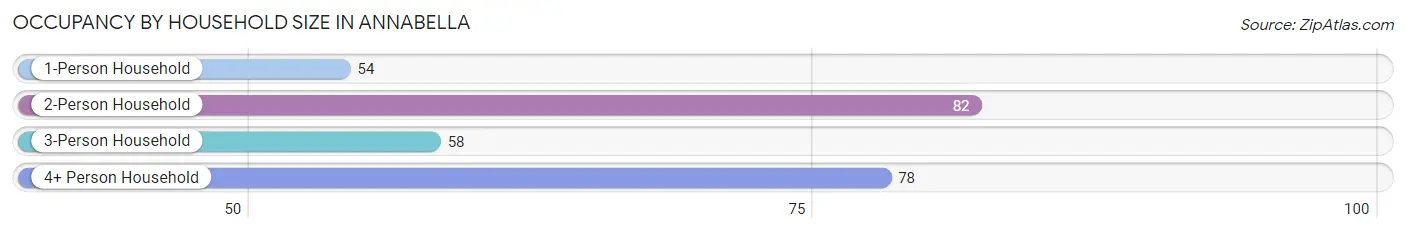
Occupancy by Household Size in Annabella
| Household Size | # Housing Units | % Housing Units |
| 1-Person Household | 54 | 19.9% |
| 2-Person Household | 82 | 30.1% |
| 3-Person Household | 58 | 21.3% |
| 4+ Person Household | 78 | 28.7% |
| Total Housing Units | 272 | 100.0% |
Occupancy by Ownership by Household Size in Annabella
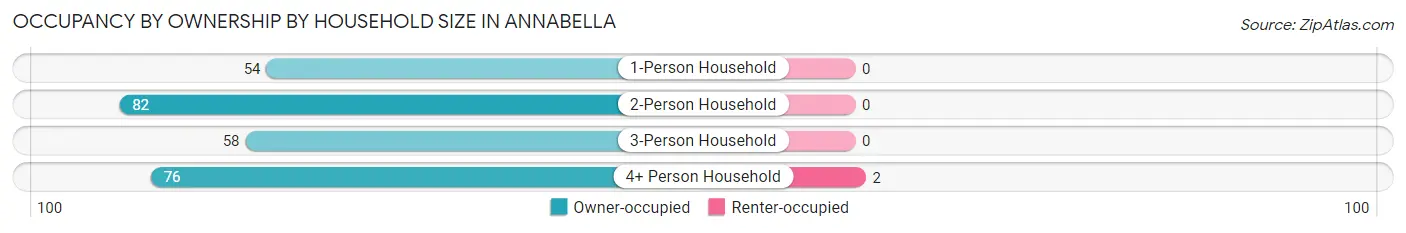
| Household Size | Owner-occupied | Renter-occupied |
| 1-Person Household | 54 (100.0%) | 0 (0.0%) |
| 2-Person Household | 82 (100.0%) | 0 (0.0%) |
| 3-Person Household | 58 (100.0%) | 0 (0.0%) |
| 4+ Person Household | 76 (97.4%) | 2 (2.6%) |
| Total Housing Units | 270 (99.3%) | 2 (0.7%) |
Occupancy by Educational Attainment in Annabella
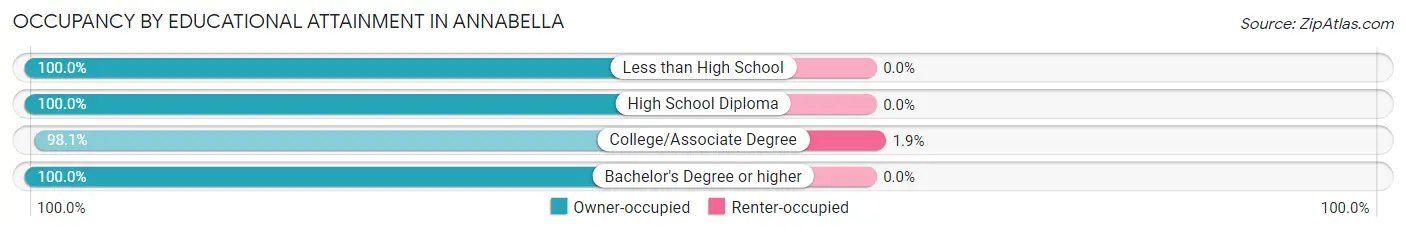
| Household Size | Owner-occupied | Renter-occupied |
| Less than High School | 8 (100.0%) | 0 (0.0%) |
| High School Diploma | 75 (100.0%) | 0 (0.0%) |
| College/Associate Degree | 103 (98.1%) | 2 (1.9%) |
| Bachelor's Degree or higher | 84 (100.0%) | 0 (0.0%) |
Occupancy by Age of Householder in Annabella
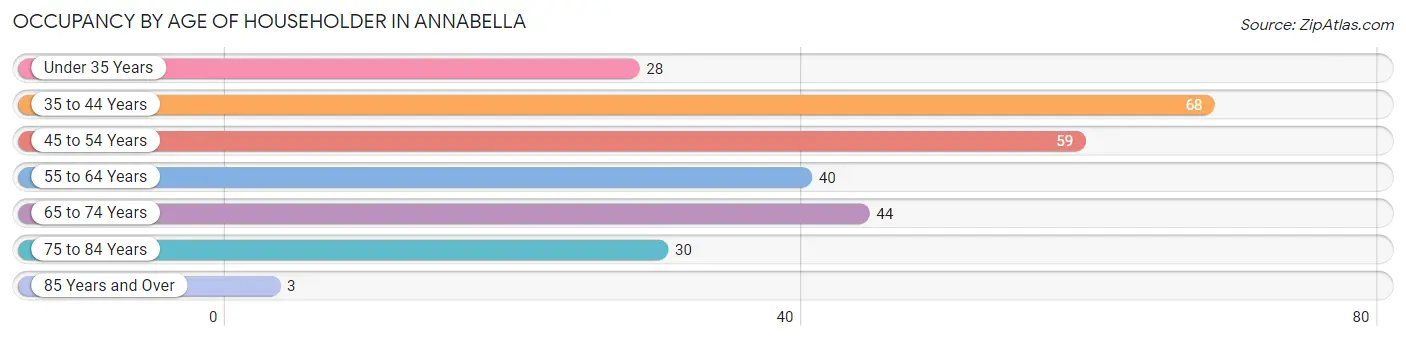
| Age Bracket | # Households | % Households |
| Under 35 Years | 28 | 10.3% |
| 35 to 44 Years | 68 | 25.0% |
| 45 to 54 Years | 59 | 21.7% |
| 55 to 64 Years | 40 | 14.7% |
| 65 to 74 Years | 44 | 16.2% |
| 75 to 84 Years | 30 | 11.0% |
| 85 Years and Over | 3 | 1.1% |
| Total | 272 | 100.0% |
Housing Finances in Annabella
Median Income by Occupancy in Annabella
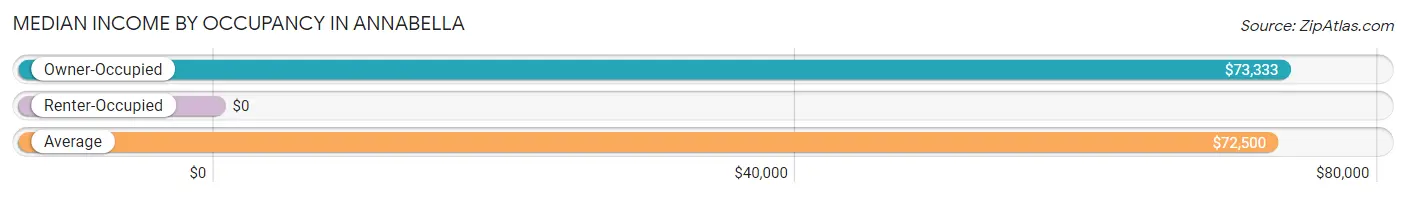
| Occupancy Type | # Households | Median Income |
| Owner-Occupied | 270 (99.3%) | $73,333 |
| Renter-Occupied | 2 (0.7%) | $0 |
| Average | 272 (100.0%) | $72,500 |
Occupancy by Householder Income Bracket in Annabella
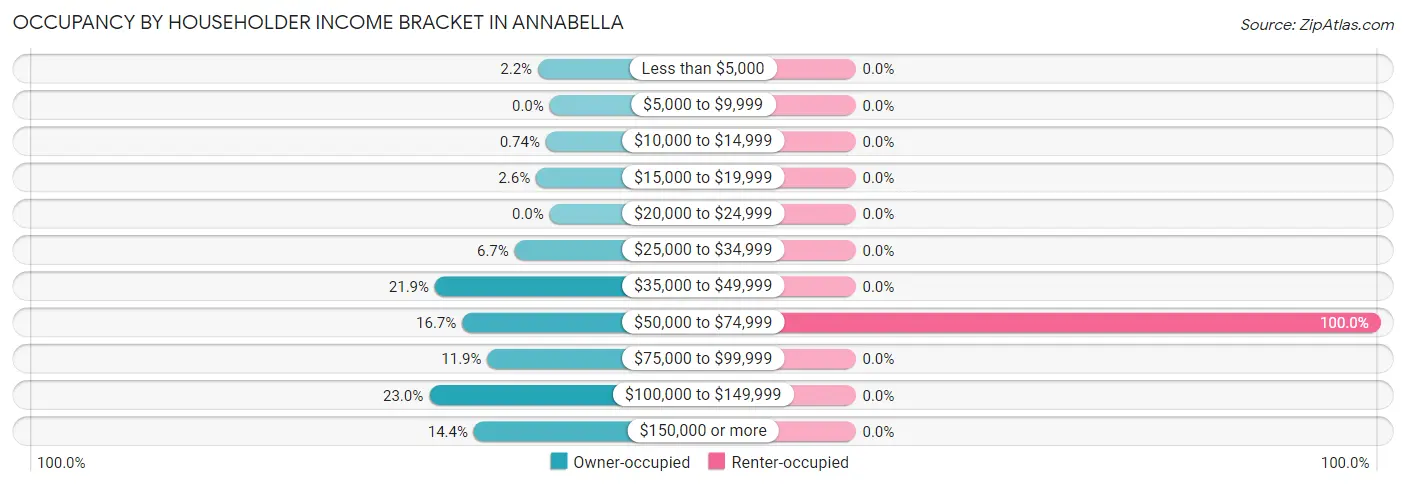
| Income Bracket | Owner-occupied | Renter-occupied |
| Less than $5,000 | 6 (2.2%) | 0 (0.0%) |
| $5,000 to $9,999 | 0 (0.0%) | 0 (0.0%) |
| $10,000 to $14,999 | 2 (0.7%) | 0 (0.0%) |
| $15,000 to $19,999 | 7 (2.6%) | 0 (0.0%) |
| $20,000 to $24,999 | 0 (0.0%) | 0 (0.0%) |
| $25,000 to $34,999 | 18 (6.7%) | 0 (0.0%) |
| $35,000 to $49,999 | 59 (21.8%) | 0 (0.0%) |
| $50,000 to $74,999 | 45 (16.7%) | 2 (100.0%) |
| $75,000 to $99,999 | 32 (11.8%) | 0 (0.0%) |
| $100,000 to $149,999 | 62 (23.0%) | 0 (0.0%) |
| $150,000 or more | 39 (14.4%) | 0 (0.0%) |
| Total | 270 (100.0%) | 2 (100.0%) |
Monthly Housing Cost Tiers in Annabella
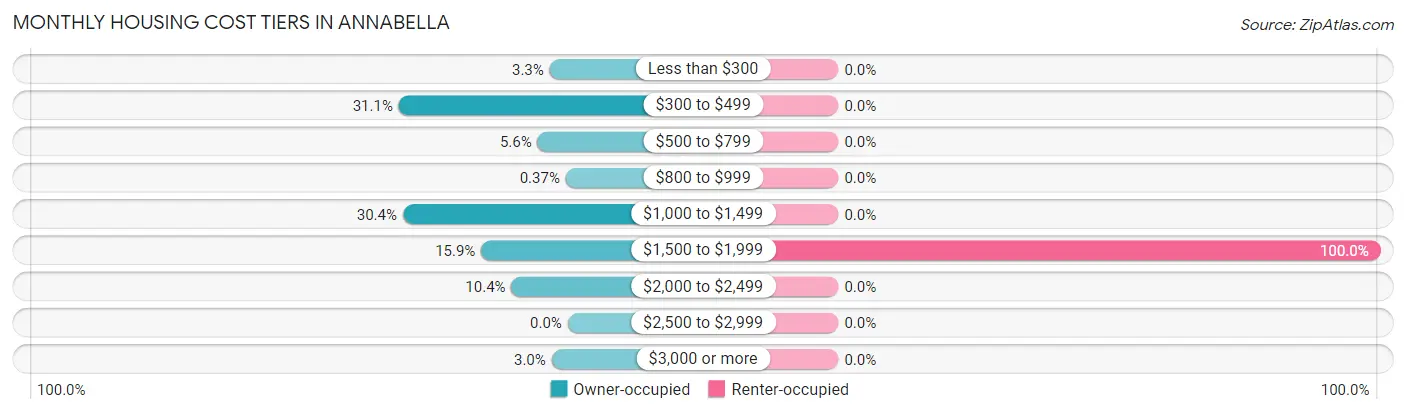
| Monthly Cost | Owner-occupied | Renter-occupied |
| Less than $300 | 9 (3.3%) | 0 (0.0%) |
| $300 to $499 | 84 (31.1%) | 0 (0.0%) |
| $500 to $799 | 15 (5.6%) | 0 (0.0%) |
| $800 to $999 | 1 (0.4%) | 0 (0.0%) |
| $1,000 to $1,499 | 82 (30.4%) | 0 (0.0%) |
| $1,500 to $1,999 | 43 (15.9%) | 2 (100.0%) |
| $2,000 to $2,499 | 28 (10.4%) | 0 (0.0%) |
| $2,500 to $2,999 | 0 (0.0%) | 0 (0.0%) |
| $3,000 or more | 8 (3.0%) | 0 (0.0%) |
| Total | 270 (100.0%) | 2 (100.0%) |
Physical Housing Characteristics in Annabella
Housing Structures in Annabella
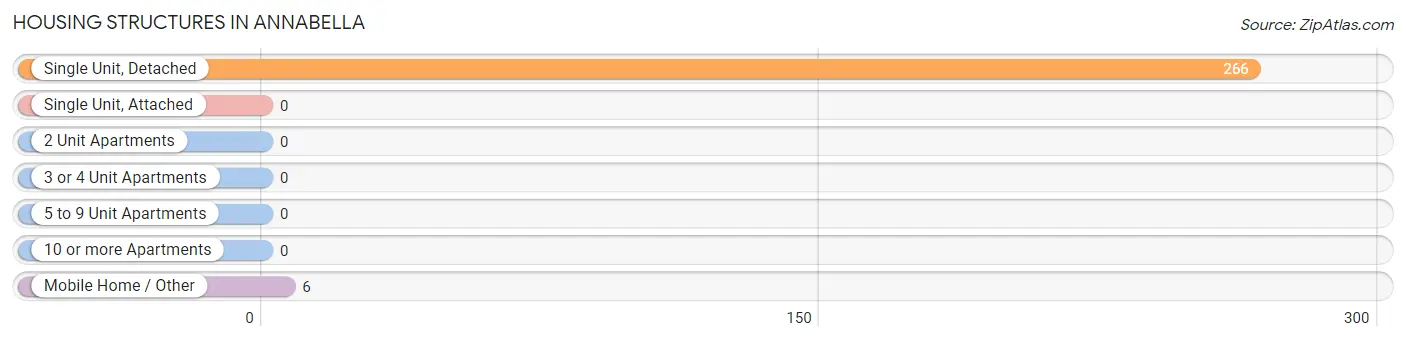
| Structure Type | # Housing Units | % Housing Units |
| Single Unit, Detached | 266 | 97.8% |
| Single Unit, Attached | 0 | 0.0% |
| 2 Unit Apartments | 0 | 0.0% |
| 3 or 4 Unit Apartments | 0 | 0.0% |
| 5 to 9 Unit Apartments | 0 | 0.0% |
| 10 or more Apartments | 0 | 0.0% |
| Mobile Home / Other | 6 | 2.2% |
| Total | 272 | 100.0% |
Housing Structures by Occupancy in Annabella
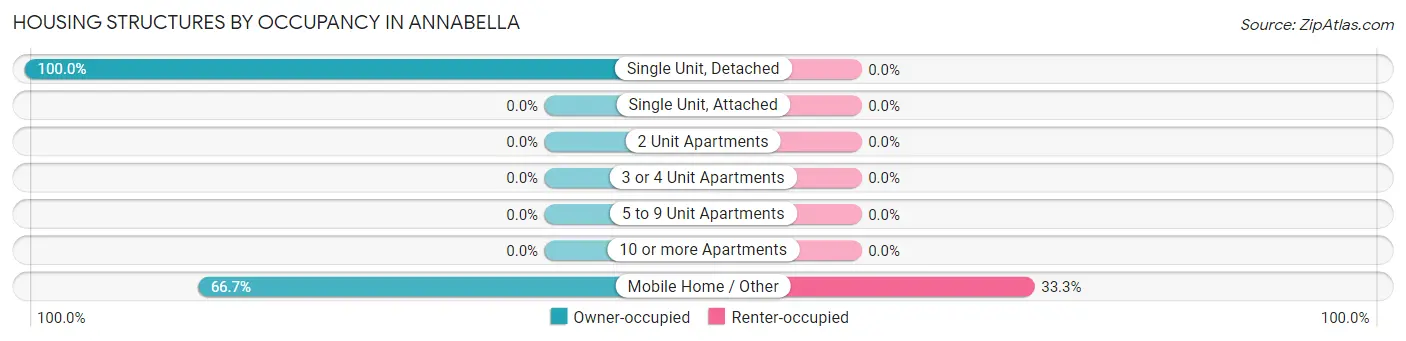
| Structure Type | Owner-occupied | Renter-occupied |
| Single Unit, Detached | 266 (100.0%) | 0 (0.0%) |
| Single Unit, Attached | 0 (0.0%) | 0 (0.0%) |
| 2 Unit Apartments | 0 (0.0%) | 0 (0.0%) |
| 3 or 4 Unit Apartments | 0 (0.0%) | 0 (0.0%) |
| 5 to 9 Unit Apartments | 0 (0.0%) | 0 (0.0%) |
| 10 or more Apartments | 0 (0.0%) | 0 (0.0%) |
| Mobile Home / Other | 4 (66.7%) | 2 (33.3%) |
| Total | 270 (99.3%) | 2 (0.7%) |
Housing Structures by Number of Rooms in Annabella
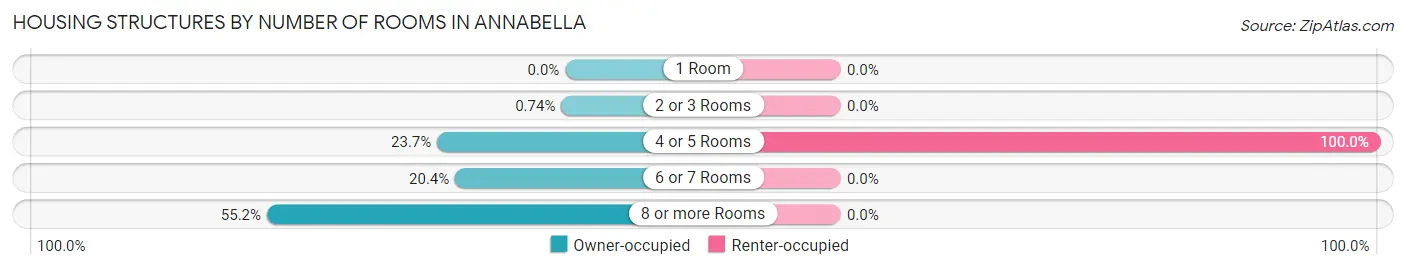
| Number of Rooms | Owner-occupied | Renter-occupied |
| 1 Room | 0 (0.0%) | 0 (0.0%) |
| 2 or 3 Rooms | 2 (0.7%) | 0 (0.0%) |
| 4 or 5 Rooms | 64 (23.7%) | 2 (100.0%) |
| 6 or 7 Rooms | 55 (20.4%) | 0 (0.0%) |
| 8 or more Rooms | 149 (55.2%) | 0 (0.0%) |
| Total | 270 (100.0%) | 2 (100.0%) |
Housing Structure by Heating Type in Annabella
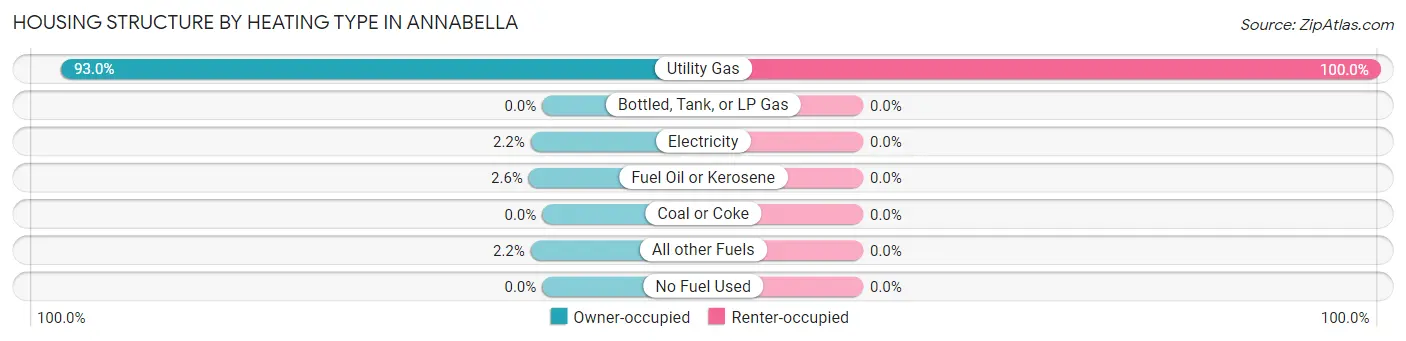
| Heating Type | Owner-occupied | Renter-occupied |
| Utility Gas | 251 (93.0%) | 2 (100.0%) |
| Bottled, Tank, or LP Gas | 0 (0.0%) | 0 (0.0%) |
| Electricity | 6 (2.2%) | 0 (0.0%) |
| Fuel Oil or Kerosene | 7 (2.6%) | 0 (0.0%) |
| Coal or Coke | 0 (0.0%) | 0 (0.0%) |
| All other Fuels | 6 (2.2%) | 0 (0.0%) |
| No Fuel Used | 0 (0.0%) | 0 (0.0%) |
| Total | 270 (100.0%) | 2 (100.0%) |
Household Vehicle Usage in Annabella
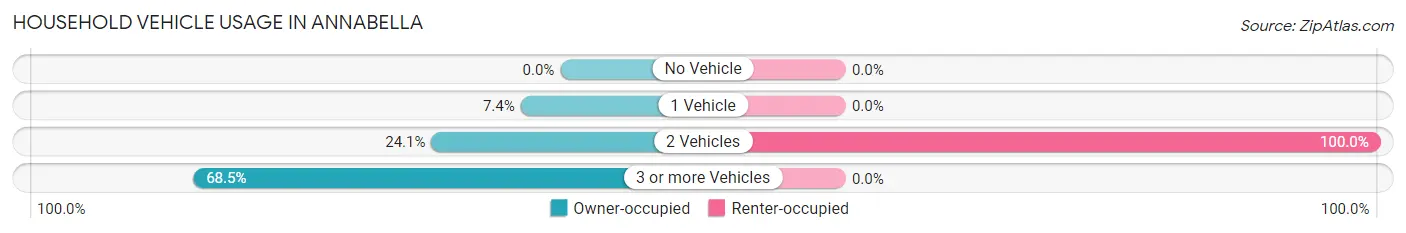
| Vehicles per Household | Owner-occupied | Renter-occupied |
| No Vehicle | 0 (0.0%) | 0 (0.0%) |
| 1 Vehicle | 20 (7.4%) | 0 (0.0%) |
| 2 Vehicles | 65 (24.1%) | 2 (100.0%) |
| 3 or more Vehicles | 185 (68.5%) | 0 (0.0%) |
| Total | 270 (100.0%) | 2 (100.0%) |
Real Estate & Mortgages in Annabella
Real Estate and Mortgage Overview in Annabella
| Characteristic | Without Mortgage | With Mortgage |
| Housing Units | 108 | 162 |
| Median Property Value | $292,500 | $288,900 |
| Median Household Income | $70,556 | $31 |
| Monthly Housing Costs | $393 | $8 |
| Real Estate Taxes | $1,591 | $8 |
Property Value by Mortgage Status in Annabella
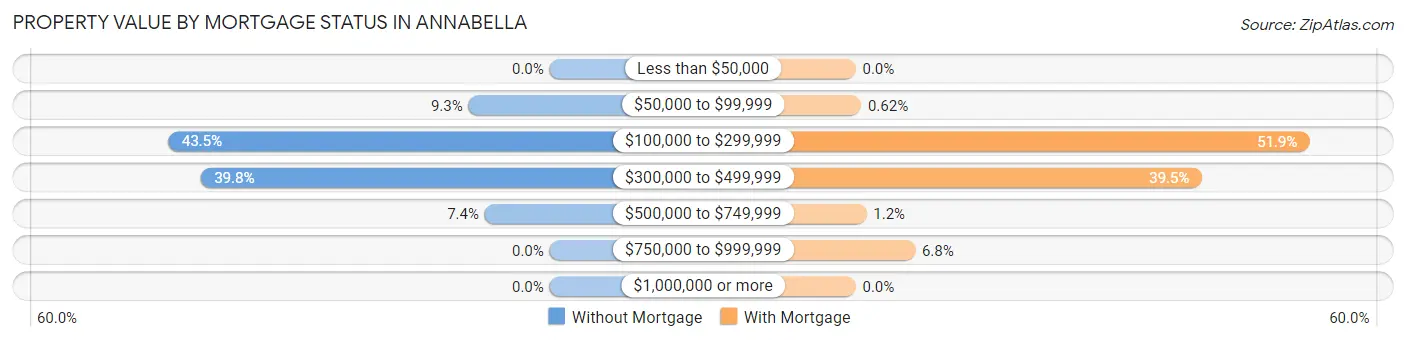
| Property Value | Without Mortgage | With Mortgage |
| Less than $50,000 | 0 (0.0%) | 0 (0.0%) |
| $50,000 to $99,999 | 10 (9.3%) | 1 (0.6%) |
| $100,000 to $299,999 | 47 (43.5%) | 84 (51.8%) |
| $300,000 to $499,999 | 43 (39.8%) | 64 (39.5%) |
| $500,000 to $749,999 | 8 (7.4%) | 2 (1.2%) |
| $750,000 to $999,999 | 0 (0.0%) | 11 (6.8%) |
| $1,000,000 or more | 0 (0.0%) | 0 (0.0%) |
| Total | 108 (100.0%) | 162 (100.0%) |
Household Income by Mortgage Status in Annabella
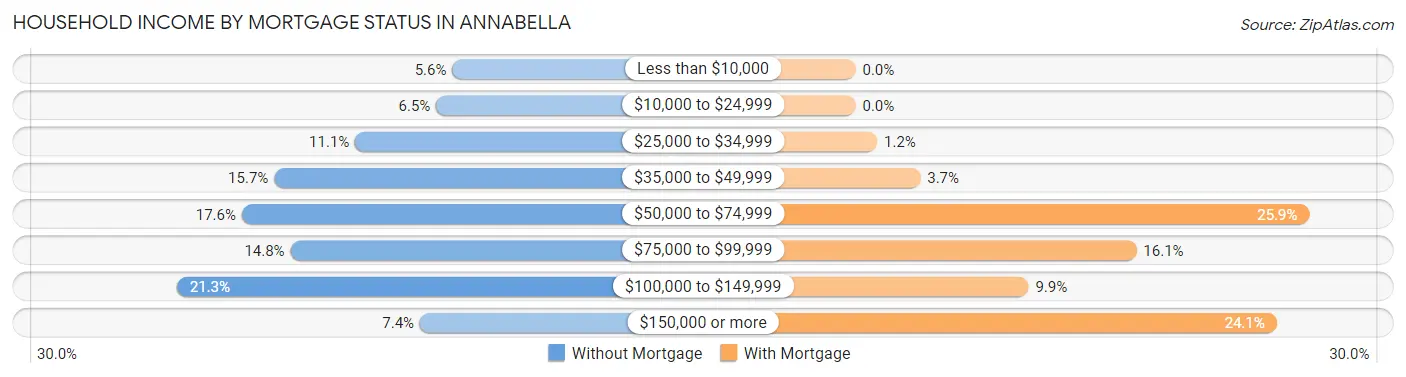
| Household Income | Without Mortgage | With Mortgage |
| Less than $10,000 | 6 (5.6%) | 0 (0.0%) |
| $10,000 to $24,999 | 7 (6.5%) | 0 (0.0%) |
| $25,000 to $34,999 | 12 (11.1%) | 2 (1.2%) |
| $35,000 to $49,999 | 17 (15.7%) | 6 (3.7%) |
| $50,000 to $74,999 | 19 (17.6%) | 42 (25.9%) |
| $75,000 to $99,999 | 16 (14.8%) | 26 (16.1%) |
| $100,000 to $149,999 | 23 (21.3%) | 16 (9.9%) |
| $150,000 or more | 8 (7.4%) | 39 (24.1%) |
| Total | 108 (100.0%) | 162 (100.0%) |
Property Value to Household Income Ratio in Annabella
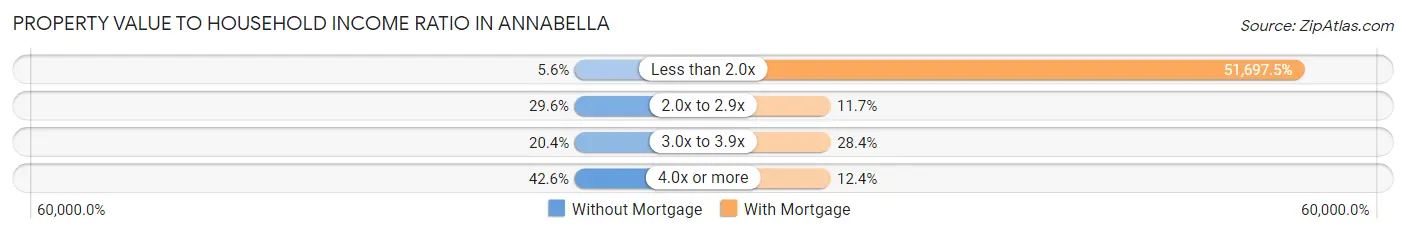
| Value-to-Income Ratio | Without Mortgage | With Mortgage |
| Less than 2.0x | 6 (5.6%) | 83,750 (51,697.5%) |
| 2.0x to 2.9x | 32 (29.6%) | 19 (11.7%) |
| 3.0x to 3.9x | 22 (20.4%) | 46 (28.4%) |
| 4.0x or more | 46 (42.6%) | 20 (12.3%) |
| Total | 108 (100.0%) | 162 (100.0%) |
Real Estate Taxes by Mortgage Status in Annabella
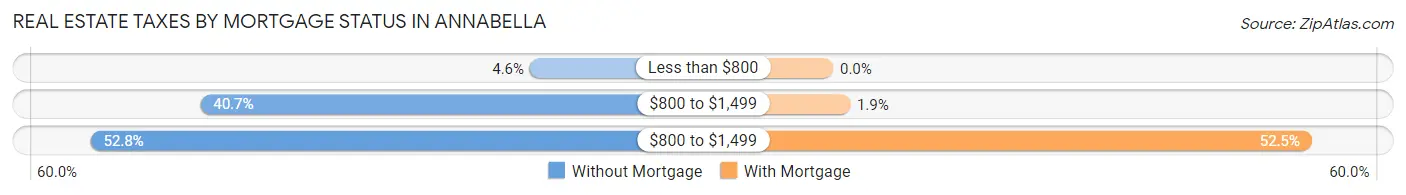
| Property Taxes | Without Mortgage | With Mortgage |
| Less than $800 | 5 (4.6%) | 0 (0.0%) |
| $800 to $1,499 | 44 (40.7%) | 3 (1.8%) |
| $800 to $1,499 | 57 (52.8%) | 85 (52.5%) |
| Total | 108 (100.0%) | 162 (100.0%) |
Health & Disability in Annabella
Health Insurance Coverage by Age in Annabella
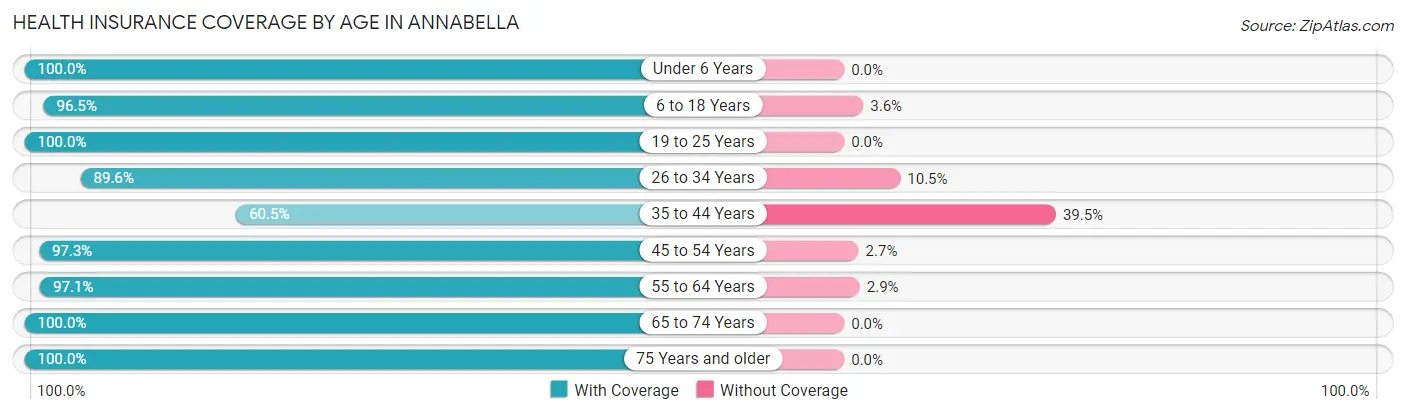
| Age Bracket | With Coverage | Without Coverage |
| Under 6 Years | 46 (100.0%) | 0 (0.0%) |
| 6 to 18 Years | 190 (96.5%) | 7 (3.5%) |
| 19 to 25 Years | 30 (100.0%) | 0 (0.0%) |
| 26 to 34 Years | 60 (89.5%) | 7 (10.4%) |
| 35 to 44 Years | 69 (60.5%) | 45 (39.5%) |
| 45 to 54 Years | 109 (97.3%) | 3 (2.7%) |
| 55 to 64 Years | 67 (97.1%) | 2 (2.9%) |
| 65 to 74 Years | 76 (100.0%) | 0 (0.0%) |
| 75 Years and older | 55 (100.0%) | 0 (0.0%) |
| Total | 702 (91.6%) | 64 (8.4%) |
Health Insurance Coverage by Citizenship Status in Annabella
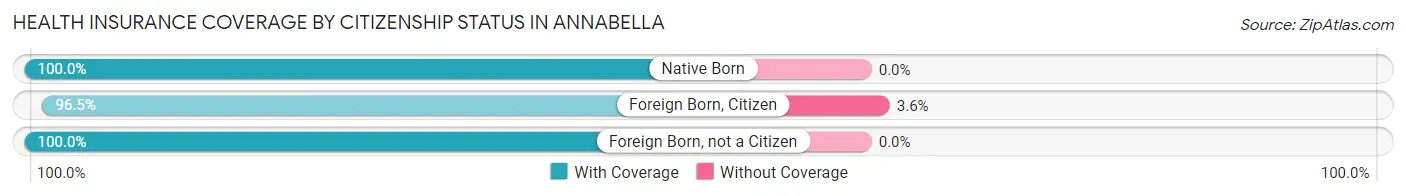
| Citizenship Status | With Coverage | Without Coverage |
| Native Born | 46 (100.0%) | 0 (0.0%) |
| Foreign Born, Citizen | 190 (96.5%) | 7 (3.5%) |
| Foreign Born, not a Citizen | 30 (100.0%) | 0 (0.0%) |
Health Insurance Coverage by Household Income in Annabella
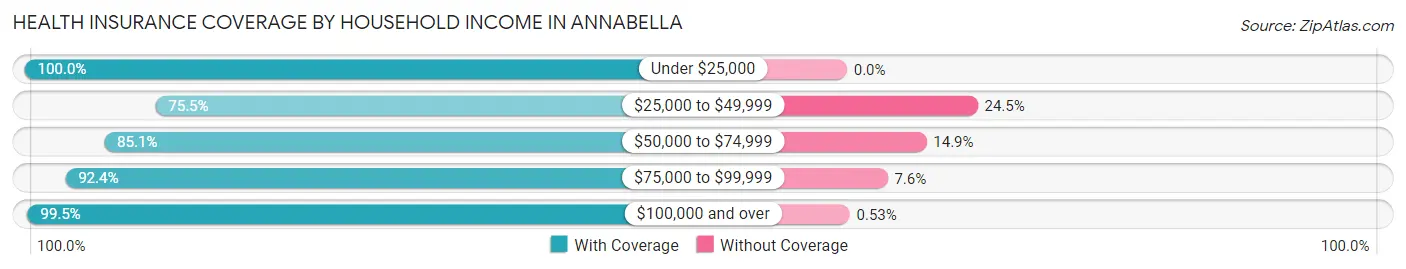
| Household Income | With Coverage | Without Coverage |
| Under $25,000 | 18 (100.0%) | 0 (0.0%) |
| $25,000 to $49,999 | 114 (75.5%) | 37 (24.5%) |
| $50,000 to $74,999 | 97 (85.1%) | 17 (14.9%) |
| $75,000 to $99,999 | 97 (92.4%) | 8 (7.6%) |
| $100,000 and over | 376 (99.5%) | 2 (0.5%) |
Public vs Private Health Insurance Coverage by Age in Annabella
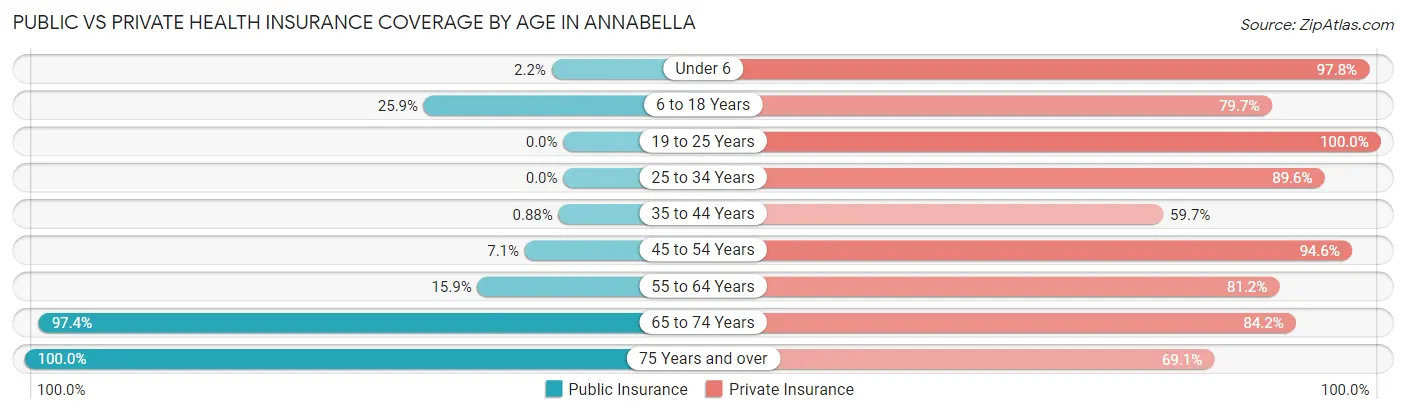
| Age Bracket | Public Insurance | Private Insurance |
| Under 6 | 1 (2.2%) | 45 (97.8%) |
| 6 to 18 Years | 51 (25.9%) | 157 (79.7%) |
| 19 to 25 Years | 0 (0.0%) | 30 (100.0%) |
| 25 to 34 Years | 0 (0.0%) | 60 (89.5%) |
| 35 to 44 Years | 1 (0.9%) | 68 (59.7%) |
| 45 to 54 Years | 8 (7.1%) | 106 (94.6%) |
| 55 to 64 Years | 11 (15.9%) | 56 (81.2%) |
| 65 to 74 Years | 74 (97.4%) | 64 (84.2%) |
| 75 Years and over | 55 (100.0%) | 38 (69.1%) |
| Total | 201 (26.2%) | 624 (81.5%) |
Disability Status by Sex by Age in Annabella
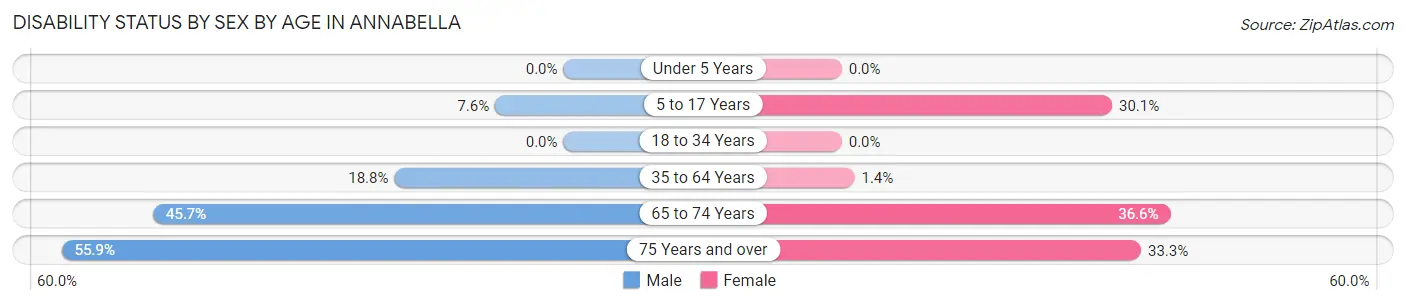
| Age Bracket | Male | Female |
| Under 5 Years | 0 (0.0%) | 0 (0.0%) |
| 5 to 17 Years | 7 (7.6%) | 31 (30.1%) |
| 18 to 34 Years | 0 (0.0%) | 0 (0.0%) |
| 35 to 64 Years | 29 (18.8%) | 2 (1.4%) |
| 65 to 74 Years | 16 (45.7%) | 15 (36.6%) |
| 75 Years and over | 19 (55.9%) | 7 (33.3%) |
Disability Class by Sex by Age in Annabella
Disability Class: Hearing Difficulty
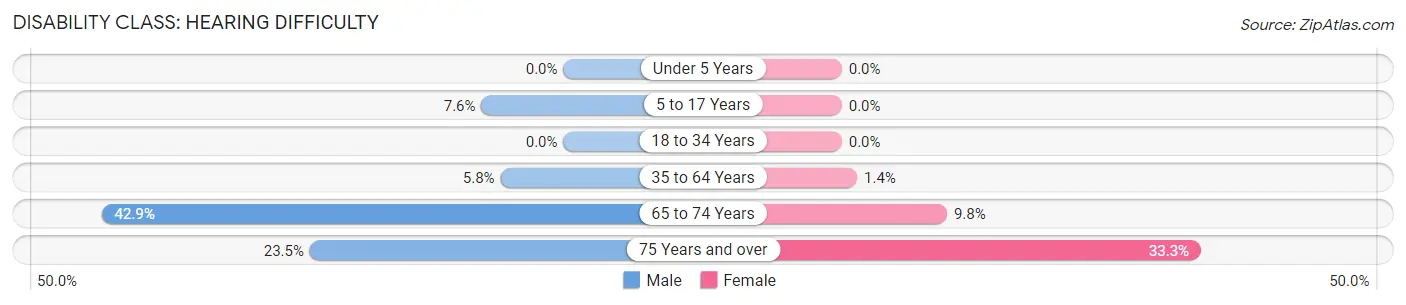
| Age Bracket | Male | Female |
| Under 5 Years | 0 (0.0%) | 0 (0.0%) |
| 5 to 17 Years | 7 (7.6%) | 0 (0.0%) |
| 18 to 34 Years | 0 (0.0%) | 0 (0.0%) |
| 35 to 64 Years | 9 (5.8%) | 2 (1.4%) |
| 65 to 74 Years | 15 (42.9%) | 4 (9.8%) |
| 75 Years and over | 8 (23.5%) | 7 (33.3%) |
Disability Class: Vision Difficulty
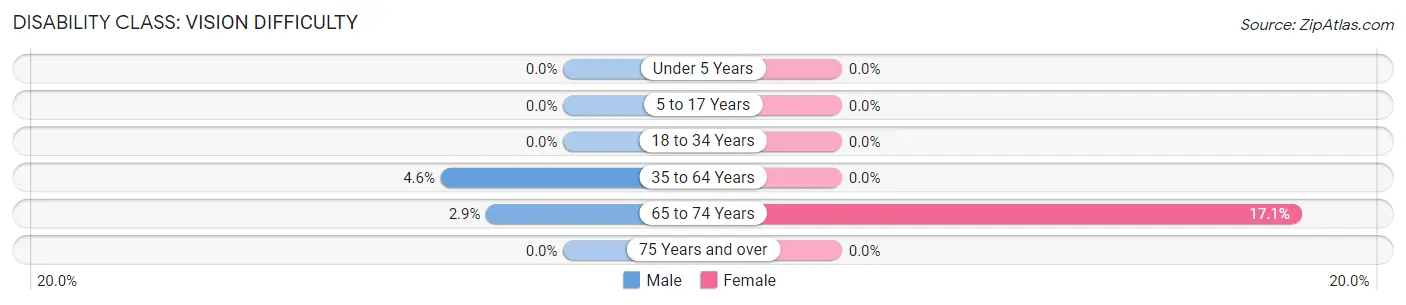
| Age Bracket | Male | Female |
| Under 5 Years | 0 (0.0%) | 0 (0.0%) |
| 5 to 17 Years | 0 (0.0%) | 0 (0.0%) |
| 18 to 34 Years | 0 (0.0%) | 0 (0.0%) |
| 35 to 64 Years | 7 (4.5%) | 0 (0.0%) |
| 65 to 74 Years | 1 (2.9%) | 7 (17.1%) |
| 75 Years and over | 0 (0.0%) | 0 (0.0%) |
Disability Class: Cognitive Difficulty
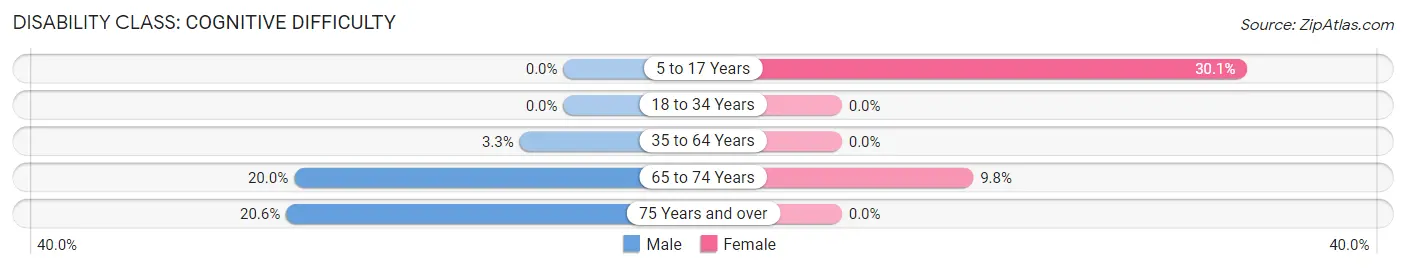
| Age Bracket | Male | Female |
| 5 to 17 Years | 0 (0.0%) | 31 (30.1%) |
| 18 to 34 Years | 0 (0.0%) | 0 (0.0%) |
| 35 to 64 Years | 5 (3.3%) | 0 (0.0%) |
| 65 to 74 Years | 7 (20.0%) | 4 (9.8%) |
| 75 Years and over | 7 (20.6%) | 0 (0.0%) |
Disability Class: Ambulatory Difficulty
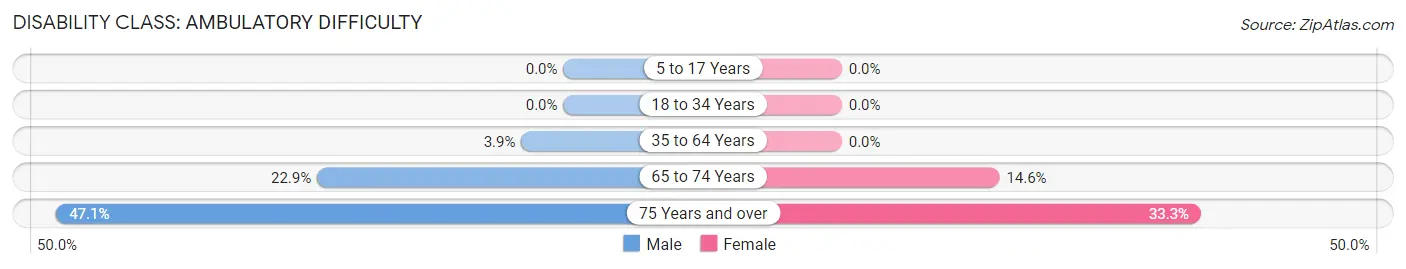
| Age Bracket | Male | Female |
| 5 to 17 Years | 0 (0.0%) | 0 (0.0%) |
| 18 to 34 Years | 0 (0.0%) | 0 (0.0%) |
| 35 to 64 Years | 6 (3.9%) | 0 (0.0%) |
| 65 to 74 Years | 8 (22.9%) | 6 (14.6%) |
| 75 Years and over | 16 (47.1%) | 7 (33.3%) |
Disability Class: Self-Care Difficulty
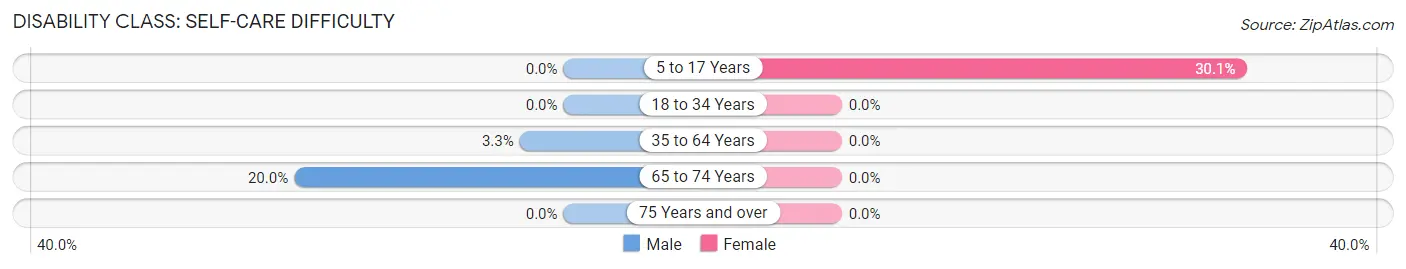
| Age Bracket | Male | Female |
| 5 to 17 Years | 0 (0.0%) | 31 (30.1%) |
| 18 to 34 Years | 0 (0.0%) | 0 (0.0%) |
| 35 to 64 Years | 5 (3.3%) | 0 (0.0%) |
| 65 to 74 Years | 7 (20.0%) | 0 (0.0%) |
| 75 Years and over | 0 (0.0%) | 0 (0.0%) |
Technology Access in Annabella
Computing Device Access in Annabella
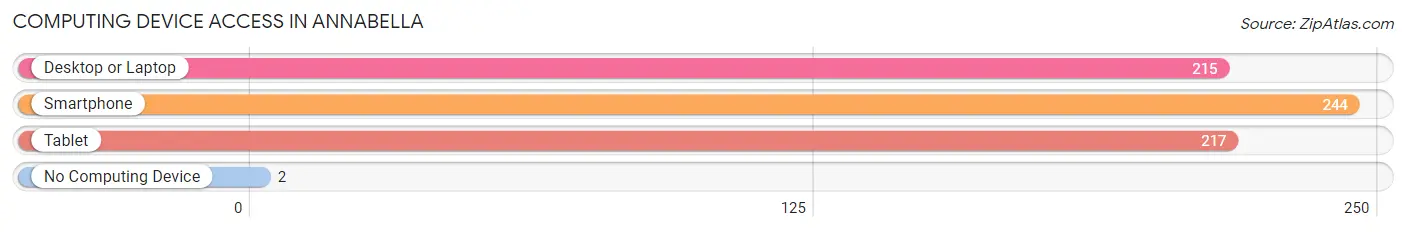
| Device Type | # Households | % Households |
| Desktop or Laptop | 215 | 79.0% |
| Smartphone | 244 | 89.7% |
| Tablet | 217 | 79.8% |
| No Computing Device | 2 | 0.7% |
| Total | 272 | 100.0% |
Internet Access in Annabella
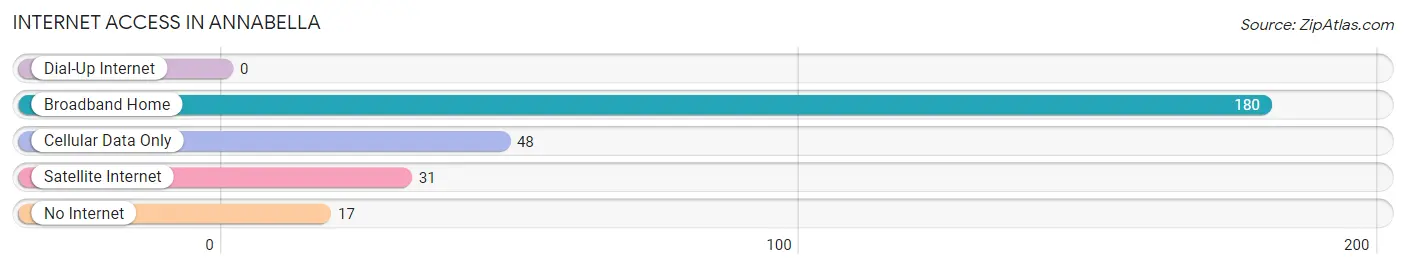
| Internet Type | # Households | % Households |
| Dial-Up Internet | 0 | 0.0% |
| Broadband Home | 180 | 66.2% |
| Cellular Data Only | 48 | 17.6% |
| Satellite Internet | 31 | 11.4% |
| No Internet | 17 | 6.2% |
| Total | 272 | 100.0% |
Annabella Summary
Annabella is a small town located in Sevier County, Utah. It is situated in the heart of the Sevier Valley, about 20 miles south of Richfield and about 30 miles north of the Utah-Arizona border. The town was founded in 1876 by a group of Mormon settlers and has a population of approximately 500 people.
History
Annabella was founded in 1876 by a group of Mormon settlers who were sent to the area by Brigham Young. The settlers were sent to the area to establish a settlement and to help build the Sevier Valley irrigation system. The settlers named the town after Annabella Young, the daughter of Brigham Young.
The town was originally a farming community, with the main crops being wheat, corn, and hay. The town also had a few small businesses, such as a general store, a blacksmith shop, and a post office.
In the early 1900s, the town began to grow and prosper. The town was connected to the outside world by the railroad, which allowed for the transportation of goods and people. The town also had a school, a church, and a few other businesses.
Geography
Annabella is located in the heart of the Sevier Valley, about 20 miles south of Richfield and about 30 miles north of the Utah-Arizona border. The town is situated at an elevation of 4,890 feet and is surrounded by mountains and hills. The town is located in a semi-arid climate, with hot summers and cold winters.
The town is located near the Sevier River, which provides the town with irrigation water for farming. The town is also located near the Fishlake National Forest, which provides recreational opportunities for the residents of Annabella.
Economy
The economy of Annabella is largely based on agriculture. The main crops grown in the area are wheat, corn, and hay. The town also has a few small businesses, such as a general store, a blacksmith shop, and a post office.
The town is also home to a few small manufacturing companies, such as a furniture factory and a woodworking shop. The town also has a few restaurants and a few small hotels.
Demographics
As of the 2010 census, the population of Annabella was 498. The racial makeup of the town was 97.2% White, 0.2% African American, 0.4% Native American, 0.2% Asian, 0.2% Pacific Islander, 0.8% from other races, and 1.2% from two or more races. Hispanic or Latino of any race were 2.2% of the population.
The median income for a household in Annabella was $37,500, and the median income for a family was $41,250. The per capita income for the town was $17,845. About 10.2% of families and 11.2% of the population were below the poverty line, including 14.2% of those under age 18 and 8.2% of those age 65 or over.
Common Questions
What is Per Capita Income in Annabella?
Per Capita income in Annabella is $31,110.
What is the Median Family Income in Annabella?
Median Family Income in Annabella is $91,563.
What is the Median Household income in Annabella?
Median Household Income in Annabella is $72,500.
What is Inequality or Gini Index in Annabella?
Inequality or Gini Index in Annabella is 0.35.
What is the Total Population of Annabella?
Total Population of Annabella is 766.
What is the Total Male Population of Annabella?
Total Male Population of Annabella is 392.
What is the Total Female Population of Annabella?
Total Female Population of Annabella is 374.
What is the Ratio of Males per 100 Females in Annabella?
There are 104.81 Males per 100 Females in Annabella.
What is the Ratio of Females per 100 Males in Annabella?
There are 95.41 Females per 100 Males in Annabella.
What is the Median Population Age in Annabella?
Median Population Age in Annabella is 39.9 Years.
What is the Average Family Size in Annabella
Average Family Size in Annabella is 3.3 People.
What is the Average Household Size in Annabella
Average Household Size in Annabella is 2.8 People.
How Large is the Labor Force in Annabella?
There are 325 People in the Labor Forcein in Annabella.
What is the Percentage of People in the Labor Force in Annabella?
57.3% of People are in the Labor Force in Annabella.