Rio Verde, AZ Map & Demographics
Rio Verde Map
Rio Verde Overview
$94,118
PER CAPITA INCOME
$149,196
AVG FAMILY INCOME
$135,457
AVG HOUSEHOLD INCOME
0.45
INEQUALITY / GINI INDEX
2,422
TOTAL POPULATION
1,161
MALE POPULATION
1,261
FEMALE POPULATION
92.07
MALES / 100 FEMALES
108.61
FEMALES / 100 MALES
71.6
MEDIAN AGE
2.0
AVG FAMILY SIZE
1.8
AVG HOUSEHOLD SIZE
683
LABOR FORCE [ PEOPLE ]
28.2%
PERCENT IN LABOR FORCE
Rio Verde Zip Codes
Rio Verde Area Codes
Income in Rio Verde
Income Overview in Rio Verde
Per Capita Income in Rio Verde is $94,118, while median incomes of families and households are $149,196 and $135,457 respectively.
| Characteristic | Number | Measure |
| Per Capita Income | 2,422 | $94,118 |
| Median Family Income | 1,057 | $149,196 |
| Mean Family Income | 1,057 | $192,120 |
| Median Household Income | 1,369 | $135,457 |
| Mean Household Income | 1,369 | $169,906 |
| Income Deficit | 1,057 | $0 |
| Wage / Income Gap (%) | 2,422 | 0.00% |
| Wage / Income Gap ($) | 2,422 | 100.00¢ per $1 |
| Gini / Inequality Index | 2,422 | 0.45 |
Earnings by Sex in Rio Verde
| Sex | Number | Average Earnings |
| Male | 410 (53.0%) | $0 |
| Female | 363 (47.0%) | $0 |
| Total | 773 (100.0%) | $0 |
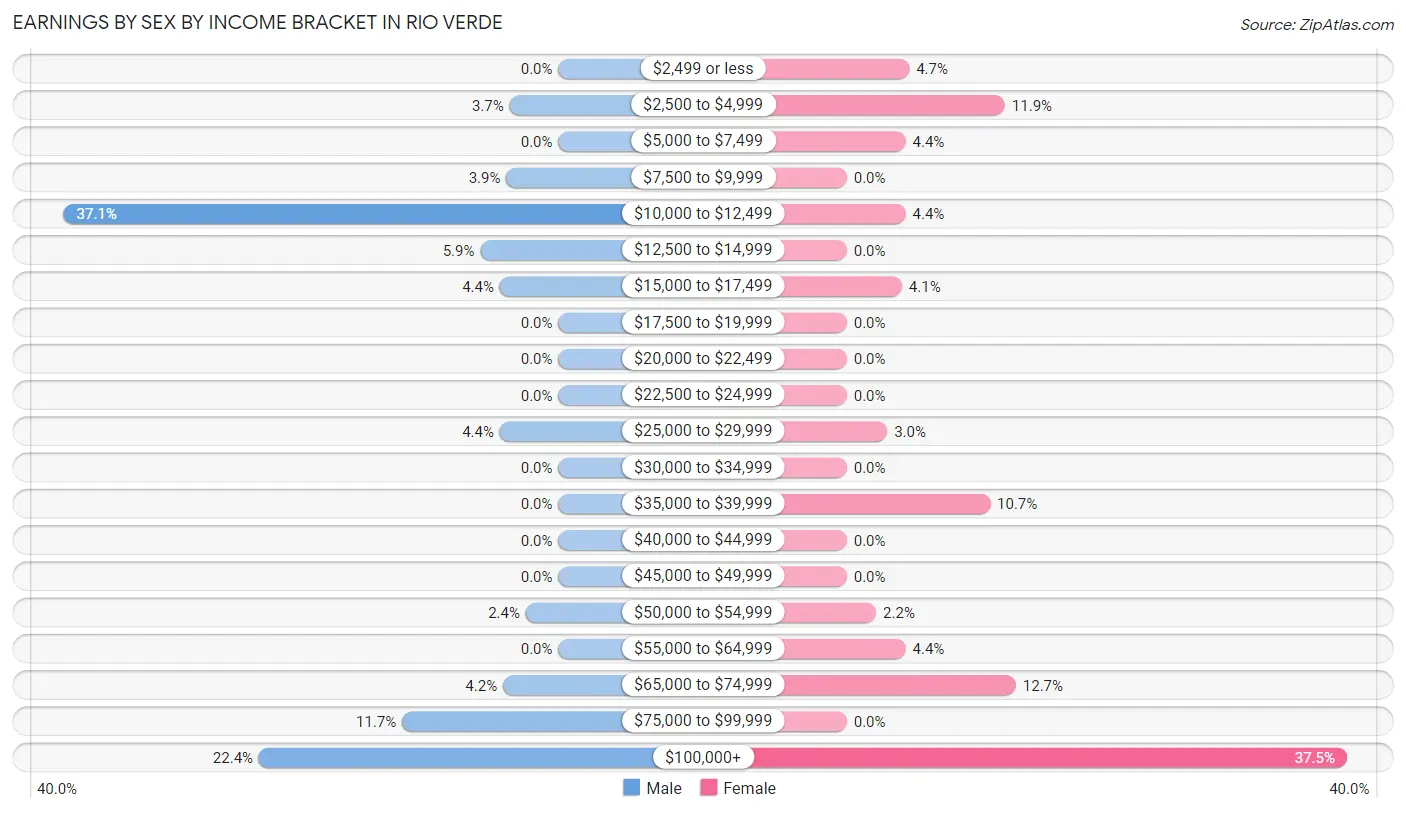
Earnings by Sex by Income Bracket in Rio Verde
The most common earnings brackets in Rio Verde are $10,000 to $12,499 for men (152 | 37.1%) and $100,000+ for women (136 | 37.5%).
| Income | Male | Female |
| $2,499 or less | 0 (0.0%) | 17 (4.7%) |
| $2,500 to $4,999 | 15 (3.7%) | 43 (11.8%) |
| $5,000 to $7,499 | 0 (0.0%) | 16 (4.4%) |
| $7,500 to $9,999 | 16 (3.9%) | 0 (0.0%) |
| $10,000 to $12,499 | 152 (37.1%) | 16 (4.4%) |
| $12,500 to $14,999 | 24 (5.9%) | 0 (0.0%) |
| $15,000 to $17,499 | 18 (4.4%) | 15 (4.1%) |
| $17,500 to $19,999 | 0 (0.0%) | 0 (0.0%) |
| $20,000 to $22,499 | 0 (0.0%) | 0 (0.0%) |
| $22,500 to $24,999 | 0 (0.0%) | 0 (0.0%) |
| $25,000 to $29,999 | 18 (4.4%) | 11 (3.0%) |
| $30,000 to $34,999 | 0 (0.0%) | 0 (0.0%) |
| $35,000 to $39,999 | 0 (0.0%) | 39 (10.7%) |
| $40,000 to $44,999 | 0 (0.0%) | 0 (0.0%) |
| $45,000 to $49,999 | 0 (0.0%) | 0 (0.0%) |
| $50,000 to $54,999 | 10 (2.4%) | 8 (2.2%) |
| $55,000 to $64,999 | 0 (0.0%) | 16 (4.4%) |
| $65,000 to $74,999 | 17 (4.2%) | 46 (12.7%) |
| $75,000 to $99,999 | 48 (11.7%) | 0 (0.0%) |
| $100,000+ | 92 (22.4%) | 136 (37.5%) |
| Total | 410 (100.0%) | 363 (100.0%) |
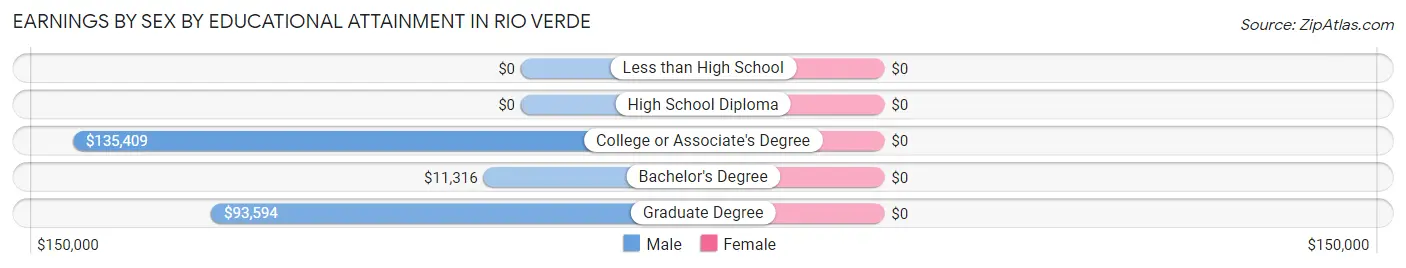
Earnings by Sex by Educational Attainment in Rio Verde
| Educational Attainment | Male Income | Female Income |
| Less than High School | - | - |
| High School Diploma | - | - |
| College or Associate's Degree | $135,409 | $0 |
| Bachelor's Degree | $11,316 | $0 |
| Graduate Degree | $93,594 | $0 |
| Total | - | - |
Family Income in Rio Verde
Family Income Brackets in Rio Verde
According to the Rio Verde family income data, there are 348 families falling into the $200,000+ income range, which is the most common income bracket and makes up 32.9% of all families.
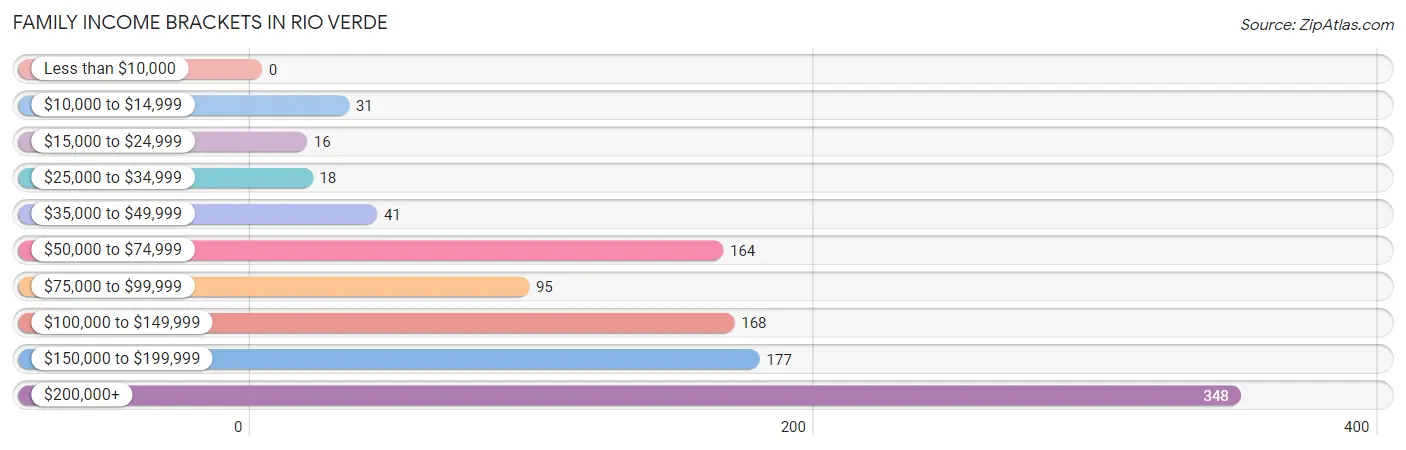
| Income Bracket | # Families | % Families |
| Less than $10,000 | 0 | 0.0% |
| $10,000 to $14,999 | 31 | 2.9% |
| $15,000 to $24,999 | 16 | 1.5% |
| $25,000 to $34,999 | 18 | 1.7% |
| $35,000 to $49,999 | 41 | 3.9% |
| $50,000 to $74,999 | 164 | 15.5% |
| $75,000 to $99,999 | 95 | 9.0% |
| $100,000 to $149,999 | 168 | 15.9% |
| $150,000 to $199,999 | 177 | 16.7% |
| $200,000+ | 348 | 32.9% |
Family Income by Famaliy Size in Rio Verde
2-person families (1,048 | 99.2%) account for the highest median family income in Rio Verde with $152,500 per family, while 2-person families (1,048 | 99.2%) have the highest median income of $76,250 per family member.
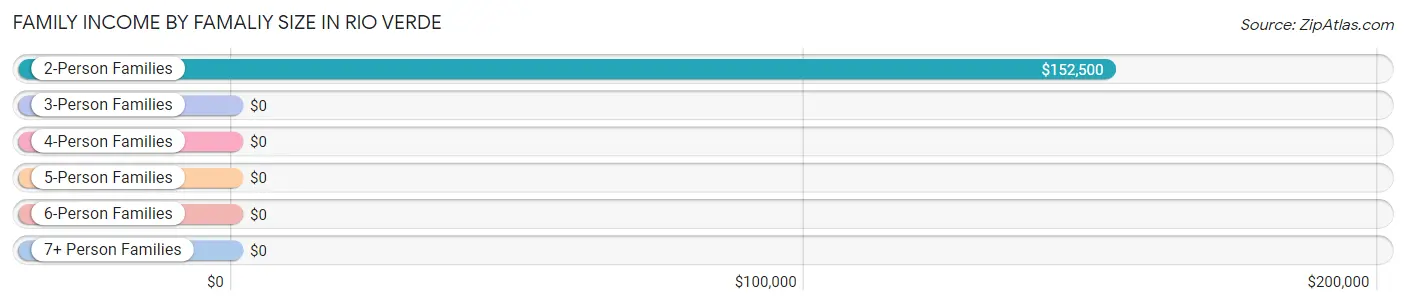
| Income Bracket | # Families | Median Income |
| 2-Person Families | 1,048 (99.2%) | $152,500 |
| 3-Person Families | 9 (0.9%) | $0 |
| 4-Person Families | 0 (0.0%) | $0 |
| 5-Person Families | 0 (0.0%) | $0 |
| 6-Person Families | 0 (0.0%) | $0 |
| 7+ Person Families | 0 (0.0%) | $0 |
| Total | 1,057 (100.0%) | $149,196 |
Family Income by Number of Earners in Rio Verde
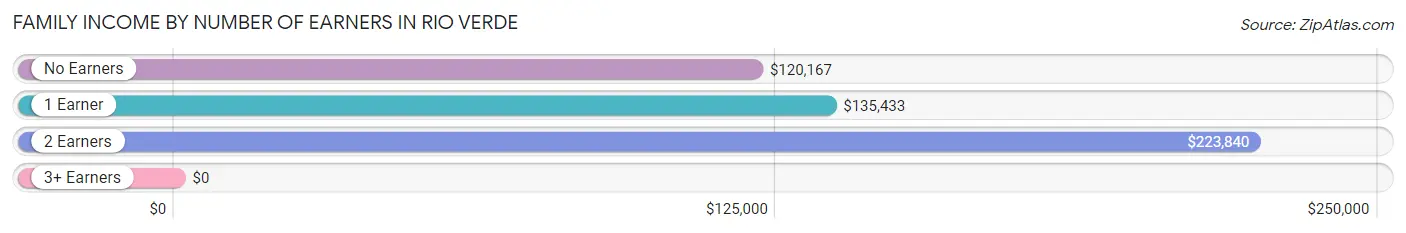
| Number of Earners | # Families | Median Income |
| No Earners | 568 (53.7%) | $120,167 |
| 1 Earner | 218 (20.6%) | $135,433 |
| 2 Earners | 271 (25.6%) | $223,840 |
| 3+ Earners | 0 (0.0%) | $0 |
| Total | 1,057 (100.0%) | $149,196 |
Household Income in Rio Verde
Household Income Brackets in Rio Verde
With 374 households falling in the category, the $200,000+ income range is the most frequent in Rio Verde, accounting for 27.3% of all households. In contrast, only 18 households (1.3%) fall into the less than $10,000 income bracket, making it the least populous group.
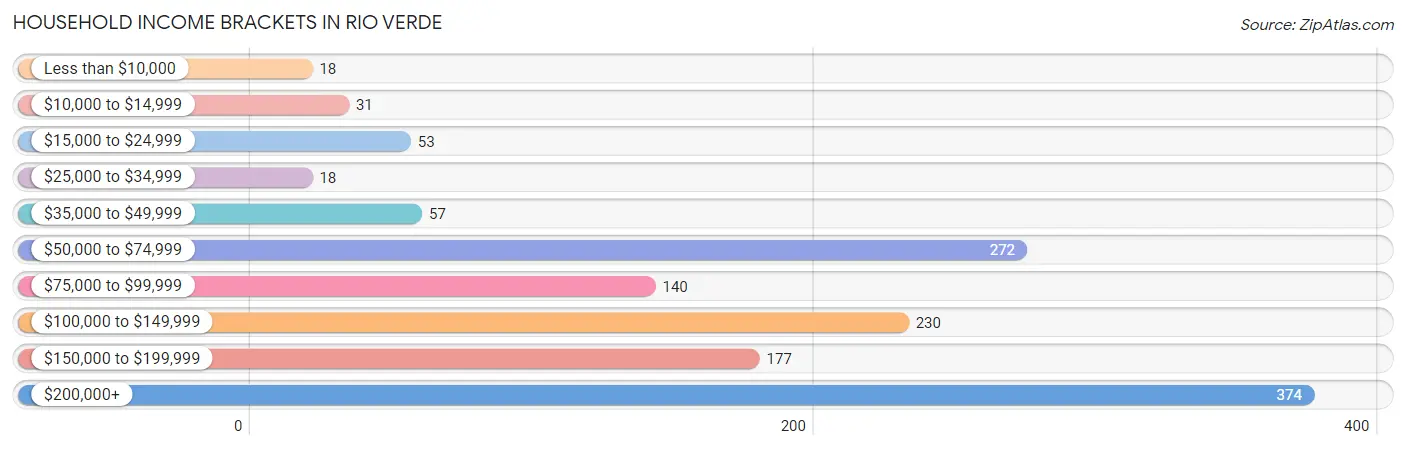
| Income Bracket | # Households | % Households |
| Less than $10,000 | 18 | 1.3% |
| $10,000 to $14,999 | 31 | 2.3% |
| $15,000 to $24,999 | 53 | 3.9% |
| $25,000 to $34,999 | 18 | 1.3% |
| $35,000 to $49,999 | 57 | 4.2% |
| $50,000 to $74,999 | 272 | 19.9% |
| $75,000 to $99,999 | 140 | 10.2% |
| $100,000 to $149,999 | 230 | 16.8% |
| $150,000 to $199,999 | 177 | 12.9% |
| $200,000+ | 374 | 27.3% |
Household Income by Householder Age in Rio Verde
The median household income in Rio Verde is $135,457, with the highest median household income of $137,428 found in the 45 to 64 years age bracket for the primary householder. A total of 205 households (15.0%) fall into this category.
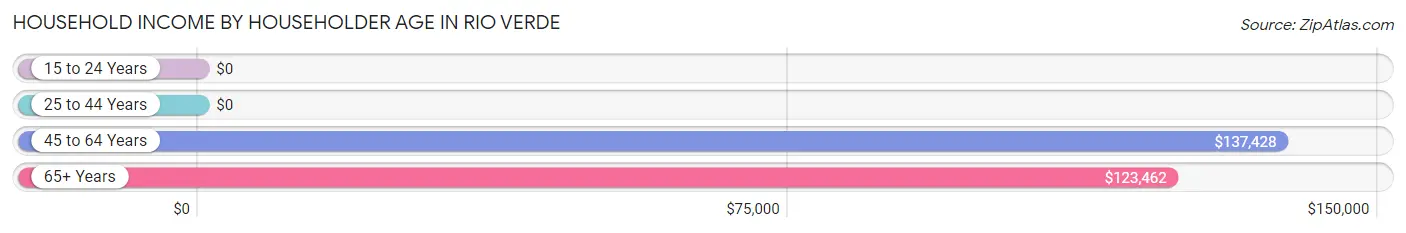
| Income Bracket | # Households | Median Income |
| 15 to 24 Years | 0 (0.0%) | $0 |
| 25 to 44 Years | 0 (0.0%) | $0 |
| 45 to 64 Years | 205 (15.0%) | $137,428 |
| 65+ Years | 1,164 (85.0%) | $123,462 |
| Total | 1,369 (100.0%) | $135,457 |
Poverty in Rio Verde
Income Below Poverty by Sex and Age in Rio Verde
With 2.8% poverty level for males and 4.1% for females among the residents of Rio Verde, 75 year old and over males and 25 to 34 year old females are the most vulnerable to poverty, with 32 males (6.9%) and 18 females (100.0%) in their respective age groups living below the poverty level.
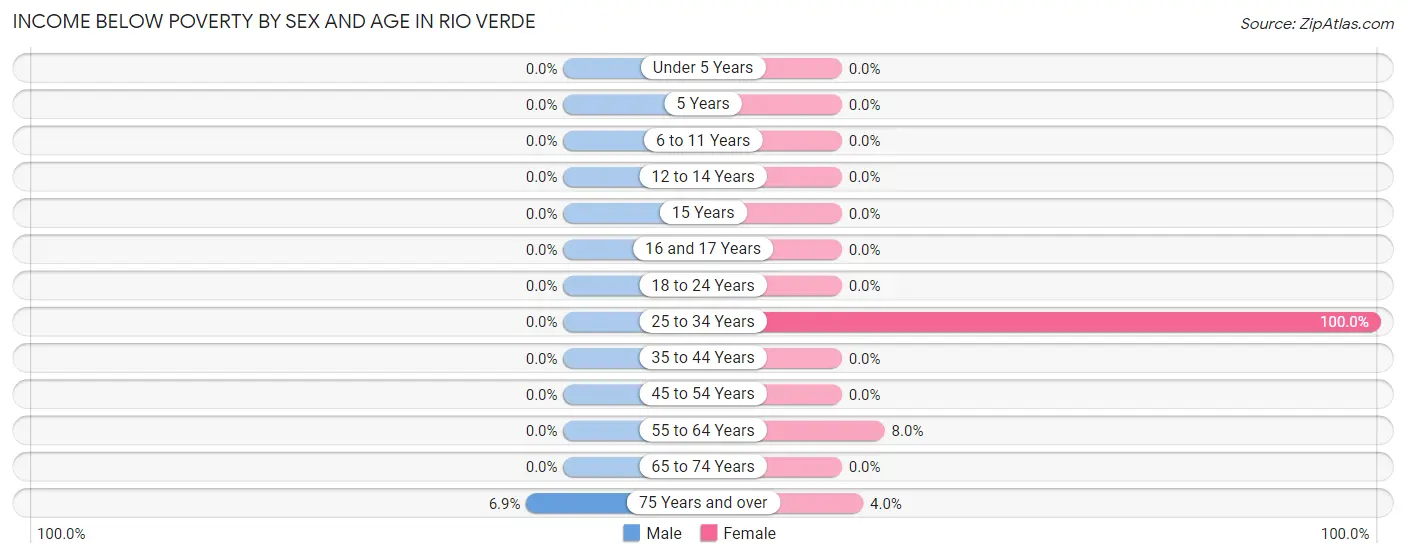
| Age Bracket | Male | Female |
| Under 5 Years | 0 (0.0%) | 0 (0.0%) |
| 5 Years | 0 (0.0%) | 0 (0.0%) |
| 6 to 11 Years | 0 (0.0%) | 0 (0.0%) |
| 12 to 14 Years | 0 (0.0%) | 0 (0.0%) |
| 15 Years | 0 (0.0%) | 0 (0.0%) |
| 16 and 17 Years | 0 (0.0%) | 0 (0.0%) |
| 18 to 24 Years | 0 (0.0%) | 0 (0.0%) |
| 25 to 34 Years | 0 (0.0%) | 18 (100.0%) |
| 35 to 44 Years | 0 (0.0%) | 0 (0.0%) |
| 45 to 54 Years | 0 (0.0%) | 0 (0.0%) |
| 55 to 64 Years | 0 (0.0%) | 18 (8.0%) |
| 65 to 74 Years | 0 (0.0%) | 0 (0.0%) |
| 75 Years and over | 32 (6.9%) | 16 (4.0%) |
| Total | 32 (2.8%) | 52 (4.1%) |
Income Above Poverty by Sex and Age in Rio Verde
According to the poverty statistics in Rio Verde, males aged 55 to 64 years and females aged 45 to 54 years are the age groups that are most secure financially, with 100.0% of males and 100.0% of females in these age groups living above the poverty line.
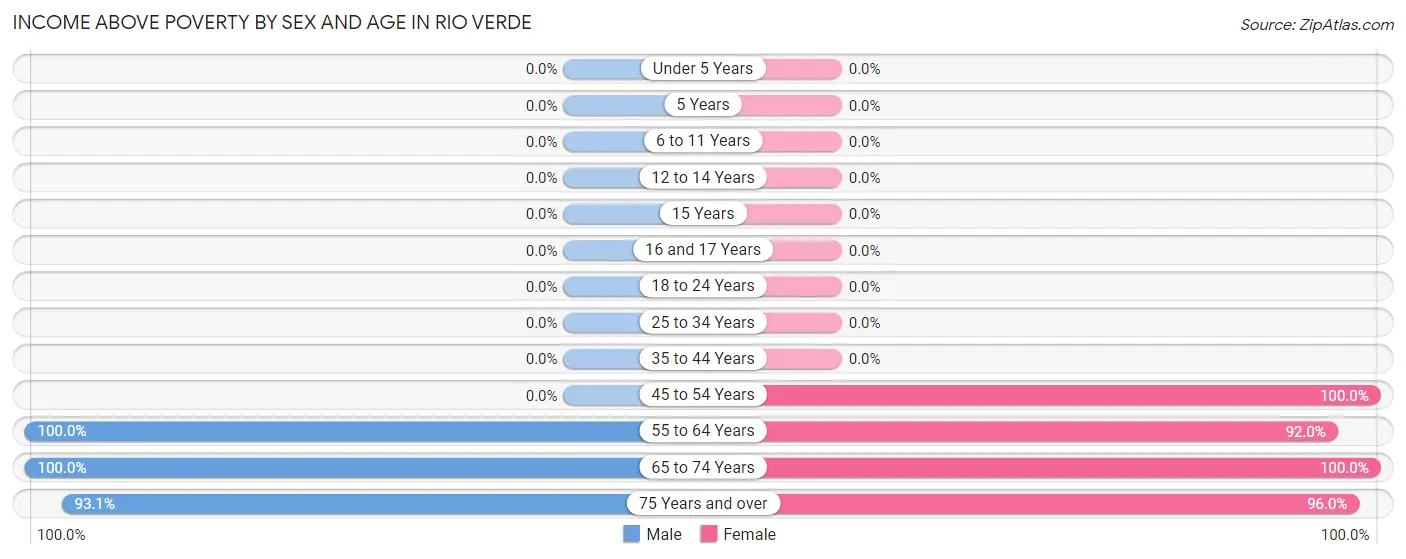
| Age Bracket | Male | Female |
| Under 5 Years | 0 (0.0%) | 0 (0.0%) |
| 5 Years | 0 (0.0%) | 0 (0.0%) |
| 6 to 11 Years | 0 (0.0%) | 0 (0.0%) |
| 12 to 14 Years | 0 (0.0%) | 0 (0.0%) |
| 15 Years | 0 (0.0%) | 0 (0.0%) |
| 16 and 17 Years | 0 (0.0%) | 0 (0.0%) |
| 18 to 24 Years | 0 (0.0%) | 0 (0.0%) |
| 25 to 34 Years | 0 (0.0%) | 0 (0.0%) |
| 35 to 44 Years | 0 (0.0%) | 0 (0.0%) |
| 45 to 54 Years | 0 (0.0%) | 63 (100.0%) |
| 55 to 64 Years | 191 (100.0%) | 208 (92.0%) |
| 65 to 74 Years | 504 (100.0%) | 550 (100.0%) |
| 75 Years and over | 434 (93.1%) | 388 (96.0%) |
| Total | 1,129 (97.2%) | 1,209 (95.9%) |
Income Below Poverty Among Married-Couple Families in Rio Verde
The poverty statistics for married-couple families in Rio Verde show that 1.6% or 16 of the total 1,026 families live below the poverty line. Families with no children have the highest poverty rate of 1.6%, comprising of 16 families. On the other hand, families with no children have the lowest poverty rate of 1.6%, which includes 16 families.
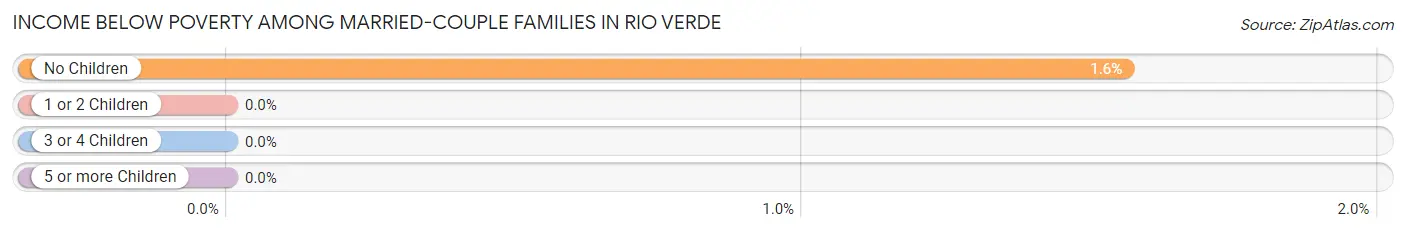
| Children | Above Poverty | Below Poverty |
| No Children | 1,010 (98.4%) | 16 (1.6%) |
| 1 or 2 Children | 0 (0.0%) | 0 (0.0%) |
| 3 or 4 Children | 0 (0.0%) | 0 (0.0%) |
| 5 or more Children | 0 (0.0%) | 0 (0.0%) |
| Total | 1,010 (98.4%) | 16 (1.6%) |
Income Below Poverty Among Single-Parent Households in Rio Verde
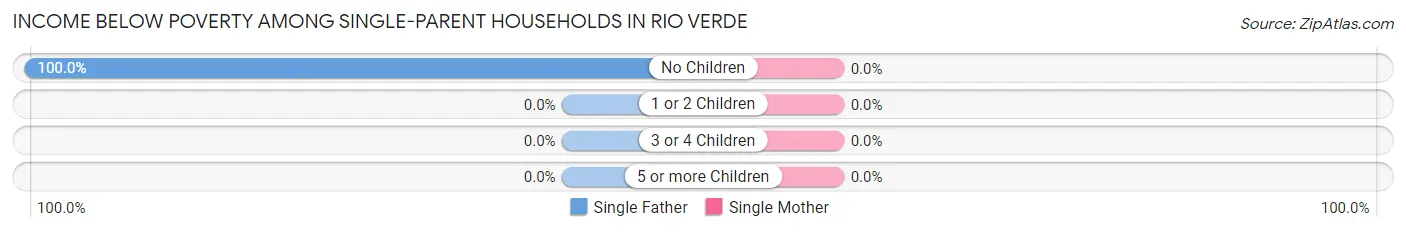
| Children | Single Father | Single Mother |
| No Children | 15 (100.0%) | 0 (0.0%) |
| 1 or 2 Children | 0 (0.0%) | 0 (0.0%) |
| 3 or 4 Children | 0 (0.0%) | 0 (0.0%) |
| 5 or more Children | 0 (0.0%) | 0 (0.0%) |
| Total | 15 (100.0%) | 0 (0.0%) |
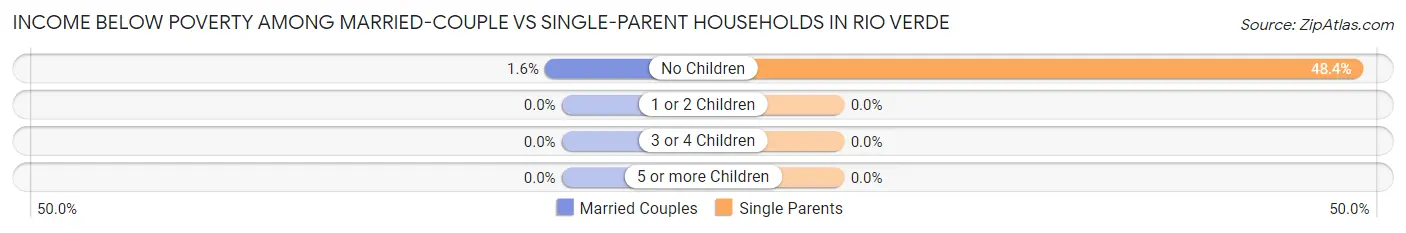
Income Below Poverty Among Married-Couple vs Single-Parent Households in Rio Verde
The poverty data for Rio Verde shows that 16 of the married-couple family households (1.6%) and 15 of the single-parent households (48.4%) are living below the poverty level. Within the married-couple family households, those with no children have the highest poverty rate, with 16 households (1.6%) falling below the poverty line. Among the single-parent households, those with no children have the highest poverty rate, with 15 household (48.4%) living below poverty.
| Children | Married-Couple Families | Single-Parent Households |
| No Children | 16 (1.6%) | 15 (48.4%) |
| 1 or 2 Children | 0 (0.0%) | 0 (0.0%) |
| 3 or 4 Children | 0 (0.0%) | 0 (0.0%) |
| 5 or more Children | 0 (0.0%) | 0 (0.0%) |
| Total | 16 (1.6%) | 15 (48.4%) |
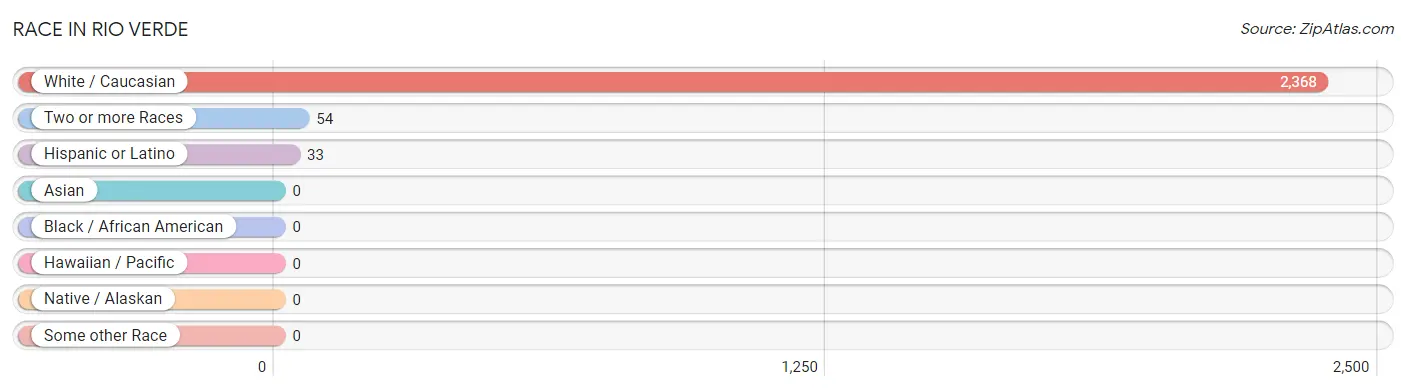
Race in Rio Verde
The most populous races in Rio Verde are White / Caucasian (2,368 | 97.8%), Two or more Races (54 | 2.2%), and Hispanic or Latino (33 | 1.4%).
| Race | # Population | % Population |
| Asian | 0 | 0.0% |
| Black / African American | 0 | 0.0% |
| Hawaiian / Pacific | 0 | 0.0% |
| Hispanic or Latino | 33 | 1.4% |
| Native / Alaskan | 0 | 0.0% |
| White / Caucasian | 2,368 | 97.8% |
| Two or more Races | 54 | 2.2% |
| Some other Race | 0 | 0.0% |
| Total | 2,422 | 100.0% |
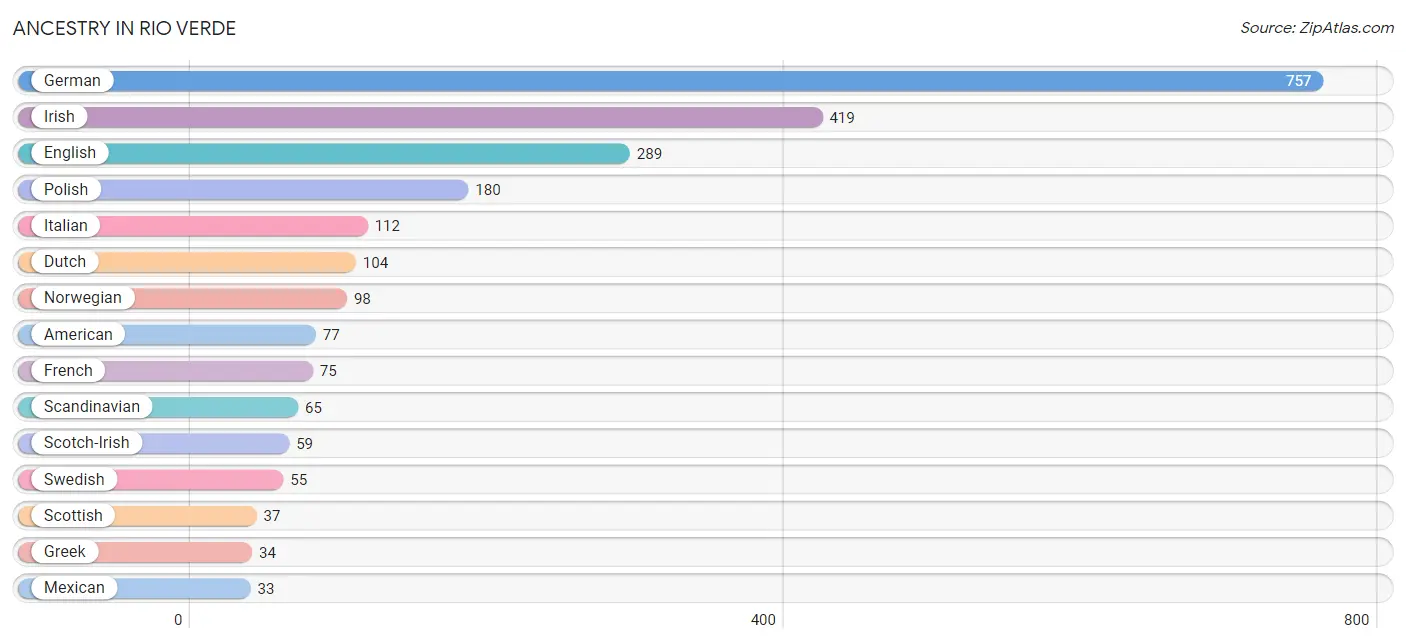
Ancestry in Rio Verde
The most populous ancestries reported in Rio Verde are German (757 | 31.3%), Irish (419 | 17.3%), English (289 | 11.9%), Polish (180 | 7.4%), and Italian (112 | 4.6%), together accounting for 72.5% of all Rio Verde residents.
| Ancestry | # Population | % Population |
| American | 77 | 3.2% |
| Austrian | 9 | 0.4% |
| British | 17 | 0.7% |
| Czech | 10 | 0.4% |
| Czechoslovakian | 25 | 1.0% |
| Danish | 27 | 1.1% |
| Dutch | 104 | 4.3% |
| Eastern European | 16 | 0.7% |
| English | 289 | 11.9% |
| Finnish | 16 | 0.7% |
| French | 75 | 3.1% |
| French Canadian | 15 | 0.6% |
| German | 757 | 31.3% |
| Greek | 34 | 1.4% |
| Hungarian | 10 | 0.4% |
| Irish | 419 | 17.3% |
| Italian | 112 | 4.6% |
| Lithuanian | 15 | 0.6% |
| Mexican | 33 | 1.4% |
| Northern European | 16 | 0.7% |
| Norwegian | 98 | 4.1% |
| Polish | 180 | 7.4% |
| Scandinavian | 65 | 2.7% |
| Scotch-Irish | 59 | 2.4% |
| Scottish | 37 | 1.5% |
| Sri Lankan | 11 | 0.4% |
| Swedish | 55 | 2.3% |
| Swiss | 25 | 1.0% |
| Welsh | 25 | 1.0% |
| Yugoslavian | 15 | 0.6% | View All 30 Rows |
Immigrants in Rio Verde
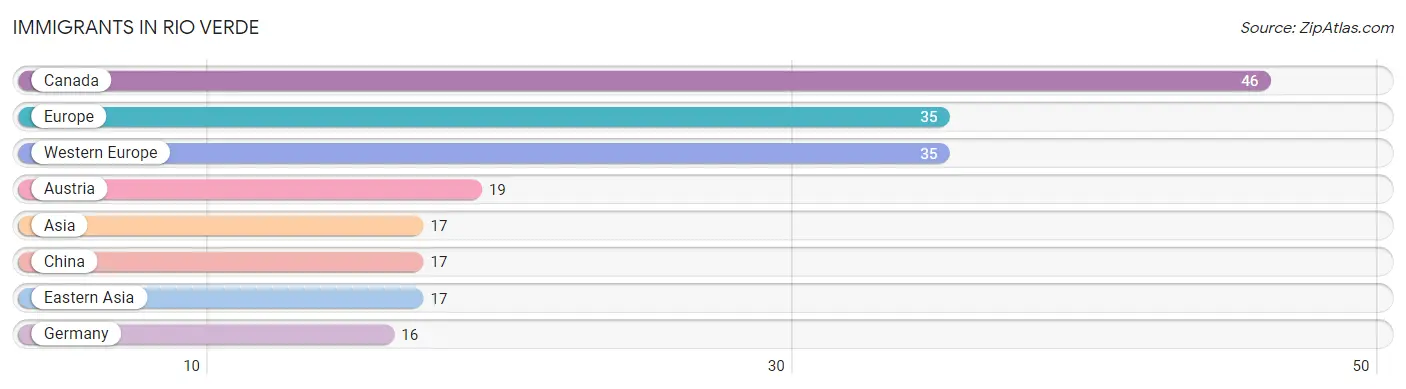
The most numerous immigrant groups reported in Rio Verde came from Canada (46 | 1.9%), Europe (35 | 1.5%), Western Europe (35 | 1.5%), Austria (19 | 0.8%), and Asia (17 | 0.7%), together accounting for 6.3% of all Rio Verde residents.
| Immigration Origin | # Population | % Population |
| Asia | 17 | 0.7% |
| Austria | 19 | 0.8% |
| Canada | 46 | 1.9% |
| China | 17 | 0.7% |
| Eastern Asia | 17 | 0.7% |
| Europe | 35 | 1.5% |
| Germany | 16 | 0.7% |
| Western Europe | 35 | 1.5% | View All 8 Rows |
Sex and Age in Rio Verde
Sex and Age in Rio Verde
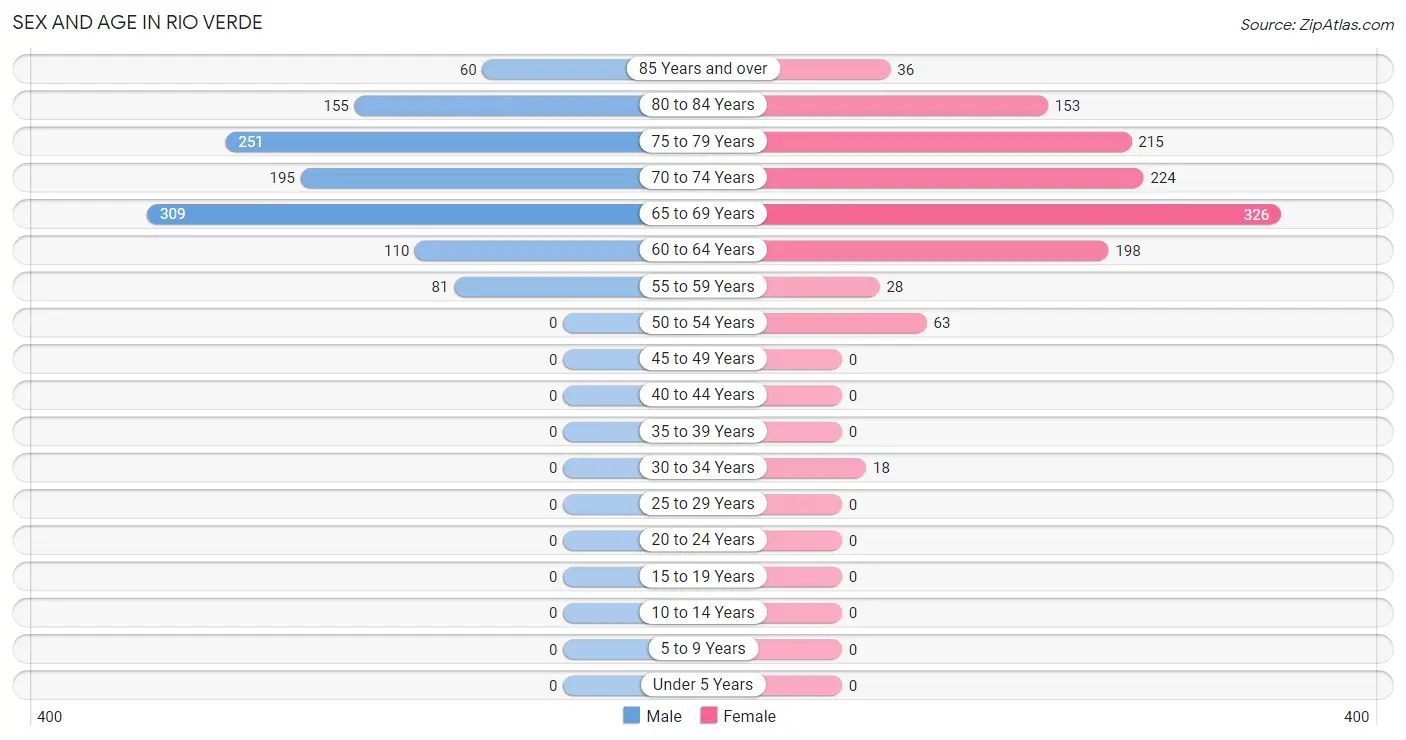
The most populous age groups in Rio Verde are 65 to 69 Years (309 | 26.6%) for men and 65 to 69 Years (326 | 25.9%) for women.
| Age Bracket | Male | Female |
| Under 5 Years | 0 (0.0%) | 0 (0.0%) |
| 5 to 9 Years | 0 (0.0%) | 0 (0.0%) |
| 10 to 14 Years | 0 (0.0%) | 0 (0.0%) |
| 15 to 19 Years | 0 (0.0%) | 0 (0.0%) |
| 20 to 24 Years | 0 (0.0%) | 0 (0.0%) |
| 25 to 29 Years | 0 (0.0%) | 0 (0.0%) |
| 30 to 34 Years | 0 (0.0%) | 18 (1.4%) |
| 35 to 39 Years | 0 (0.0%) | 0 (0.0%) |
| 40 to 44 Years | 0 (0.0%) | 0 (0.0%) |
| 45 to 49 Years | 0 (0.0%) | 0 (0.0%) |
| 50 to 54 Years | 0 (0.0%) | 63 (5.0%) |
| 55 to 59 Years | 81 (7.0%) | 28 (2.2%) |
| 60 to 64 Years | 110 (9.5%) | 198 (15.7%) |
| 65 to 69 Years | 309 (26.6%) | 326 (25.9%) |
| 70 to 74 Years | 195 (16.8%) | 224 (17.8%) |
| 75 to 79 Years | 251 (21.6%) | 215 (17.1%) |
| 80 to 84 Years | 155 (13.4%) | 153 (12.1%) |
| 85 Years and over | 60 (5.2%) | 36 (2.9%) |
| Total | 1,161 (100.0%) | 1,261 (100.0%) |
Families and Households in Rio Verde
Median Family Size in Rio Verde
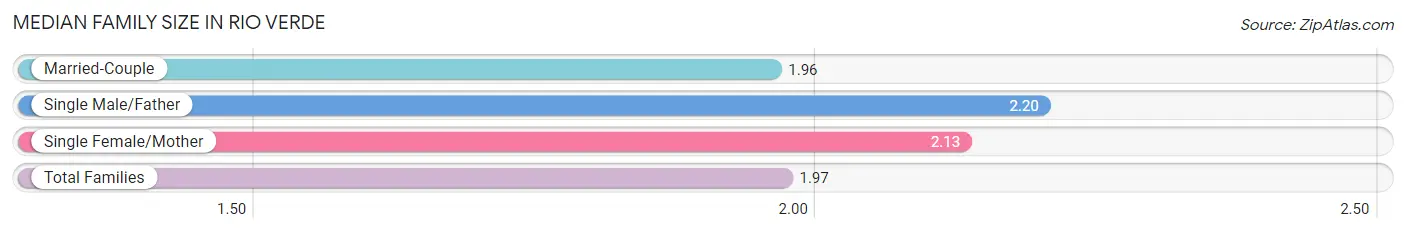
The median family size in Rio Verde is 1.97 persons per family, with single male/father families (15 | 1.4%) accounting for the largest median family size of 2.2 persons per family. On the other hand, married-couple families (1,026 | 97.1%) represent the smallest median family size with 1.96 persons per family.
| Family Type | # Families | Family Size |
| Married-Couple | 1,026 (97.1%) | 1.96 |
| Single Male/Father | 15 (1.4%) | 2.20 |
| Single Female/Mother | 16 (1.5%) | 2.13 |
| Total Families | 1,057 (100.0%) | 1.97 |
Median Household Size in Rio Verde
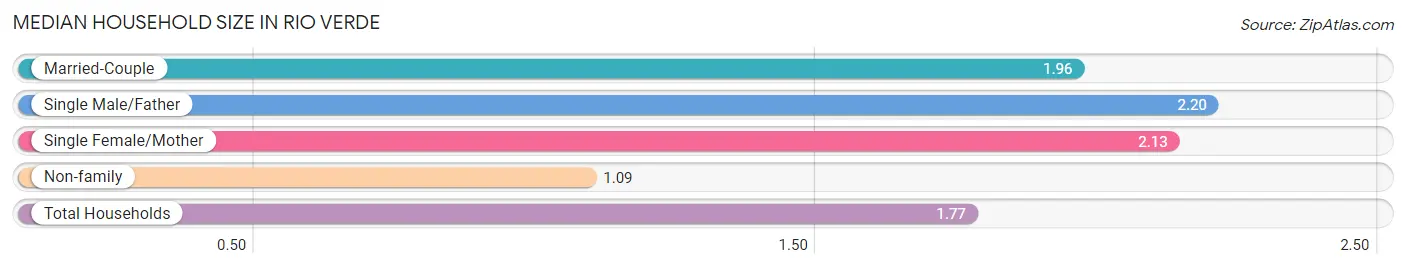
The median household size in Rio Verde is 1.77 persons per household, with single male/father households (15 | 1.1%) accounting for the largest median household size of 2.2 persons per household. non-family households (312 | 22.8%) represent the smallest median household size with 1.09 persons per household.
| Household Type | # Households | Household Size |
| Married-Couple | 1,026 (75.0%) | 1.96 |
| Single Male/Father | 15 (1.1%) | 2.20 |
| Single Female/Mother | 16 (1.2%) | 2.13 |
| Non-family | 312 (22.8%) | 1.09 |
| Total Households | 1,369 (100.0%) | 1.77 |
Household Size by Marriage Status in Rio Verde
Out of a total of 1,369 households in Rio Verde, 1,057 (77.2%) are family households, while 312 (22.8%) are nonfamily households. The most numerous type of family households are 2-person households, comprising 1,048, and the most common type of nonfamily households are 1-person households, comprising 286.
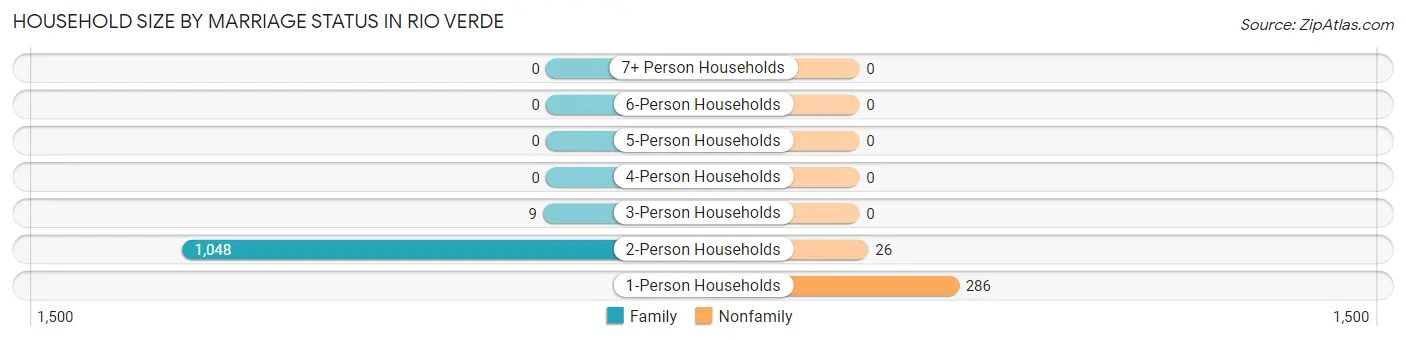
| Household Size | Family Households | Nonfamily Households |
| 1-Person Households | - | 286 (20.9%) |
| 2-Person Households | 1,048 (76.5%) | 26 (1.9%) |
| 3-Person Households | 9 (0.7%) | 0 (0.0%) |
| 4-Person Households | 0 (0.0%) | 0 (0.0%) |
| 5-Person Households | 0 (0.0%) | 0 (0.0%) |
| 6-Person Households | 0 (0.0%) | 0 (0.0%) |
| 7+ Person Households | 0 (0.0%) | 0 (0.0%) |
| Total | 1,057 (77.2%) | 312 (22.8%) |
Female Fertility in Rio Verde
Fertility by Age in Rio Verde
| Age Bracket | Women with Births | Births / 1,000 Women |
| 15 to 19 years | 0 (0.0%) | 0.0 |
| 20 to 34 years | 0 (0.0%) | 0.0 |
| 35 to 50 years | 0 (0.0%) | 0.0 |
| Total | 0 (0.0%) | 0.0 |
Fertility by Age by Marriage Status in Rio Verde
| Age Bracket | Married | Unmarried |
| 15 to 19 years | 0 (0.0%) | 0 (0.0%) |
| 20 to 34 years | 0 (0.0%) | 0 (0.0%) |
| 35 to 50 years | 0 (0.0%) | 0 (0.0%) |
| Total | 0 (0.0%) | 0 (0.0%) |
Fertility by Education in Rio Verde
| Educational Attainment | Women with Births | Births / 1,000 Women |
| Less than High School | 0 (0.0%) | 0.0 |
| High School Diploma | 0 (0.0%) | 0.0 |
| College or Associate's Degree | 0 (0.0%) | 0.0 |
| Bachelor's Degree | 0 (0.0%) | 0.0 |
| Graduate Degree | 0 (0.0%) | 0.0 |
| Total | 0 (0.0%) | 0.0 |
Fertility by Education by Marriage Status in Rio Verde
| Educational Attainment | Married | Unmarried |
| Less than High School | 0 (0.0%) | 0 (0.0%) |
| High School Diploma | 0 (0.0%) | 0 (0.0%) |
| College or Associate's Degree | 0 (0.0%) | 0 (0.0%) |
| Bachelor's Degree | 0 (0.0%) | 0 (0.0%) |
| Graduate Degree | 0 (0.0%) | 0 (0.0%) |
| Total | 0 (0.0%) | 0 (0.0%) |
Employment Characteristics in Rio Verde
Employment by Class of Employer in Rio Verde
Among the 684 employed individuals in Rio Verde, private company employees (363 | 53.1%), self-employed (incorporated) (171 | 25.0%), and self-employed (not incorporated) (70 | 10.2%) make up the most common classes of employment.
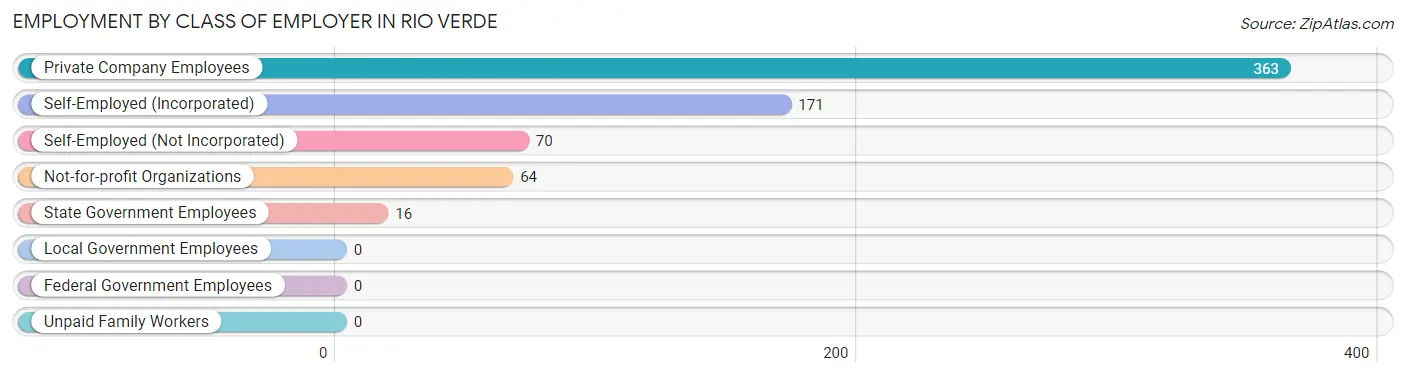
| Employer Class | # Employees | % Employees |
| Private Company Employees | 363 | 53.1% |
| Self-Employed (Incorporated) | 171 | 25.0% |
| Self-Employed (Not Incorporated) | 70 | 10.2% |
| Not-for-profit Organizations | 64 | 9.4% |
| Local Government Employees | 0 | 0.0% |
| State Government Employees | 16 | 2.3% |
| Federal Government Employees | 0 | 0.0% |
| Unpaid Family Workers | 0 | 0.0% |
| Total | 684 | 100.0% |
Employment Status by Age in Rio Verde
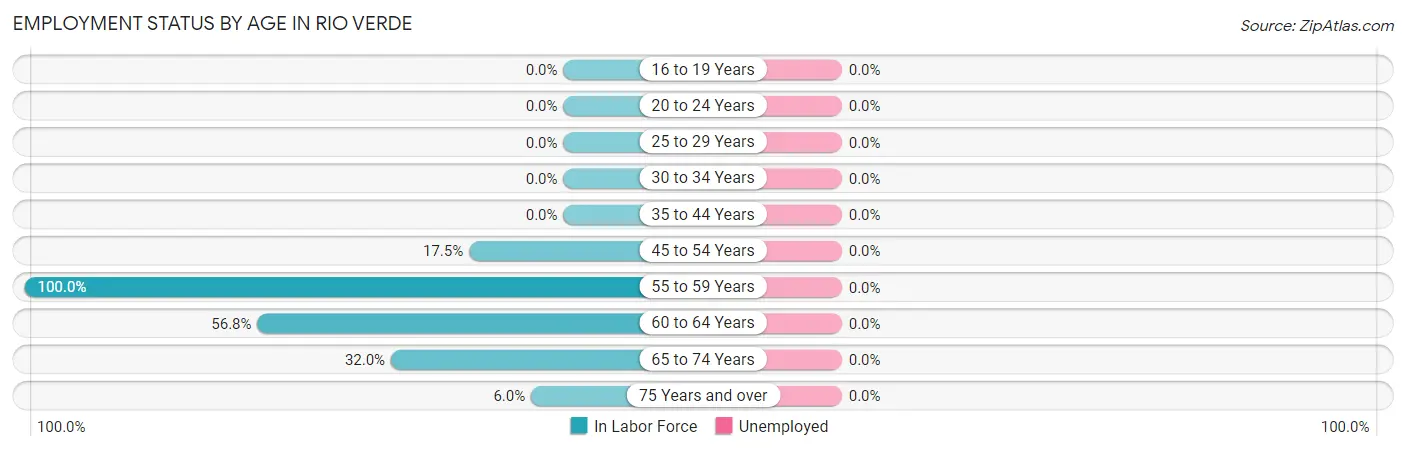
| Age Bracket | In Labor Force | Unemployed |
| 16 to 19 Years | 0 (0.0%) | 0 (0.0%) |
| 20 to 24 Years | 0 (0.0%) | 0 (0.0%) |
| 25 to 29 Years | 0 (0.0%) | 0 (0.0%) |
| 30 to 34 Years | 0 (0.0%) | 0 (0.0%) |
| 35 to 44 Years | 0 (0.0%) | 0 (0.0%) |
| 45 to 54 Years | 11 (17.5%) | 0 (0.0%) |
| 55 to 59 Years | 109 (100.0%) | 0 (0.0%) |
| 60 to 64 Years | 175 (56.8%) | 0 (0.0%) |
| 65 to 74 Years | 337 (32.0%) | 0 (0.0%) |
| 75 Years and over | 52 (6.0%) | 0 (0.0%) |
| Total | 683 (28.2%) | 0 (0.0%) |
Employment Status by Educational Attainment in Rio Verde
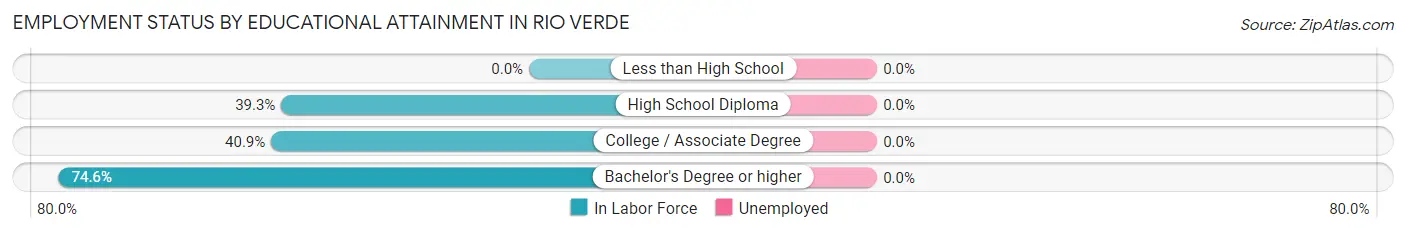
| Educational Attainment | In Labor Force | Unemployed |
| Less than High School | 0 (0.0%) | 0 (0.0%) |
| High School Diploma | 11 (39.3%) | 0 (0.0%) |
| College / Associate Degree | 81 (40.9%) | 0 (0.0%) |
| Bachelor's Degree or higher | 203 (74.6%) | 0 (0.0%) |
| Total | 295 (59.2%) | 0 (0.0%) |
Employment Occupations by Sex in Rio Verde
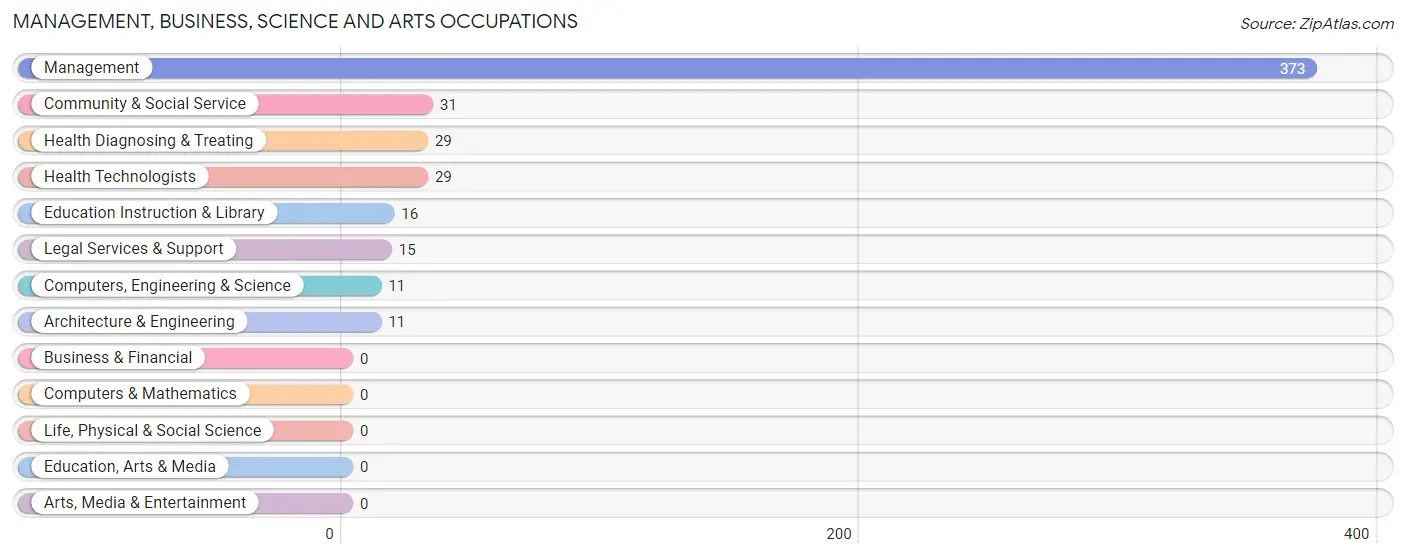
Management, Business, Science and Arts Occupations
The most common Management, Business, Science and Arts occupations in Rio Verde are Management (373 | 54.5%), Community & Social Service (31 | 4.5%), Health Diagnosing & Treating (29 | 4.2%), Health Technologists (29 | 4.2%), and Education Instruction & Library (16 | 2.3%).
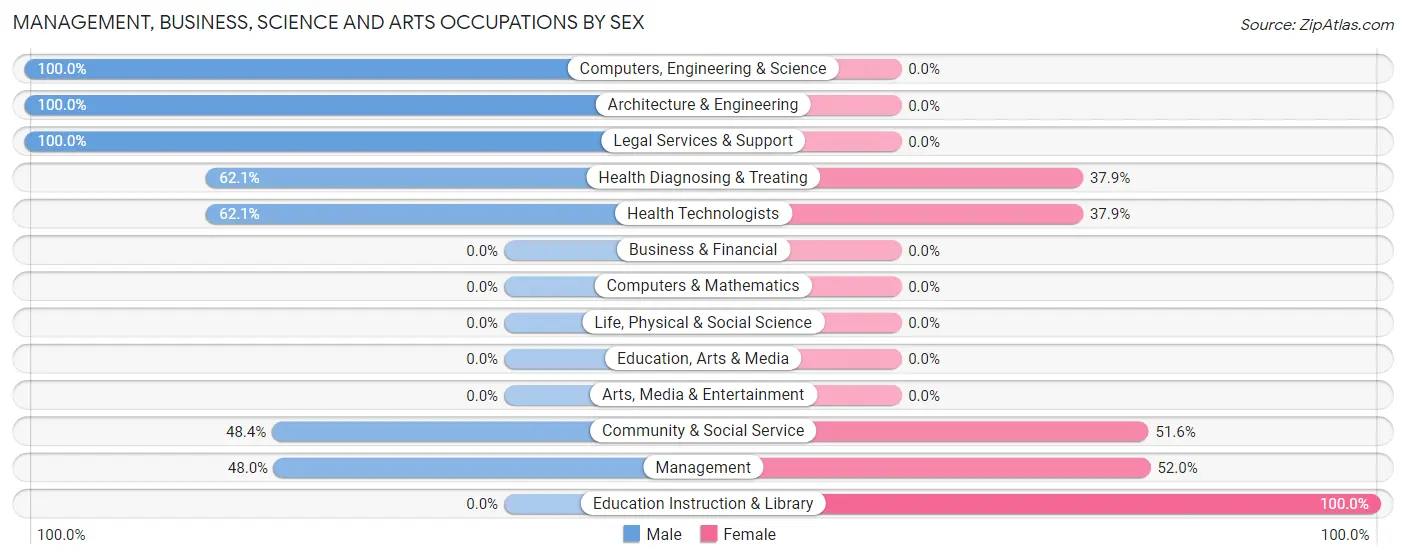
Management, Business, Science and Arts Occupations by Sex
Within the Management, Business, Science and Arts occupations in Rio Verde, the most male-oriented occupations are Computers, Engineering & Science (100.0%), Architecture & Engineering (100.0%), and Legal Services & Support (100.0%), while the most female-oriented occupations are Education Instruction & Library (100.0%), Management (52.0%), and Community & Social Service (51.6%).
| Occupation | Male | Female |
| Management | 179 (48.0%) | 194 (52.0%) |
| Business & Financial | 0 (0.0%) | 0 (0.0%) |
| Computers, Engineering & Science | 11 (100.0%) | 0 (0.0%) |
| Computers & Mathematics | 0 (0.0%) | 0 (0.0%) |
| Architecture & Engineering | 11 (100.0%) | 0 (0.0%) |
| Life, Physical & Social Science | 0 (0.0%) | 0 (0.0%) |
| Community & Social Service | 15 (48.4%) | 16 (51.6%) |
| Education, Arts & Media | 0 (0.0%) | 0 (0.0%) |
| Legal Services & Support | 15 (100.0%) | 0 (0.0%) |
| Education Instruction & Library | 0 (0.0%) | 16 (100.0%) |
| Arts, Media & Entertainment | 0 (0.0%) | 0 (0.0%) |
| Health Diagnosing & Treating | 18 (62.1%) | 11 (37.9%) |
| Health Technologists | 18 (62.1%) | 11 (37.9%) |
| Total (Category) | 223 (50.2%) | 221 (49.8%) |
| Total (Overall) | 385 (56.3%) | 299 (43.7%) |
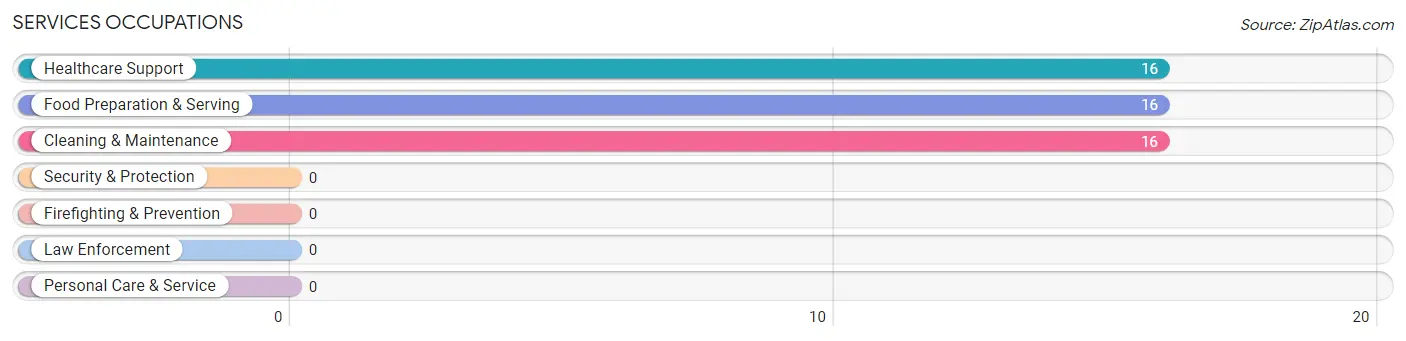
Services Occupations
The most common Services occupations in Rio Verde are Healthcare Support (16 | 2.3%), Food Preparation & Serving (16 | 2.3%), and Cleaning & Maintenance (16 | 2.3%).
Services Occupations by Sex
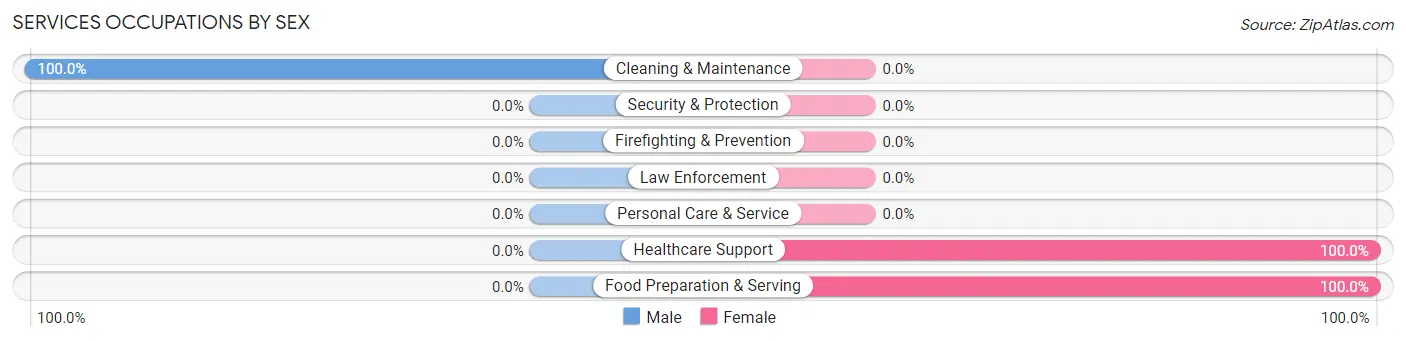
| Occupation | Male | Female |
| Healthcare Support | 0 (0.0%) | 16 (100.0%) |
| Security & Protection | 0 (0.0%) | 0 (0.0%) |
| Firefighting & Prevention | 0 (0.0%) | 0 (0.0%) |
| Law Enforcement | 0 (0.0%) | 0 (0.0%) |
| Food Preparation & Serving | 0 (0.0%) | 16 (100.0%) |
| Cleaning & Maintenance | 16 (100.0%) | 0 (0.0%) |
| Personal Care & Service | 0 (0.0%) | 0 (0.0%) |
| Total (Category) | 16 (33.3%) | 32 (66.7%) |
| Total (Overall) | 385 (56.3%) | 299 (43.7%) |
Sales and Office Occupations
The most common Sales and Office occupations in Rio Verde are Sales & Related (45 | 6.6%), and Office & Administration (29 | 4.2%).

Sales and Office Occupations by Sex

| Occupation | Male | Female |
| Sales & Related | 28 (62.2%) | 17 (37.8%) |
| Office & Administration | 0 (0.0%) | 29 (100.0%) |
| Total (Category) | 28 (37.8%) | 46 (62.2%) |
| Total (Overall) | 385 (56.3%) | 299 (43.7%) |
Natural Resources, Construction and Maintenance Occupations

Natural Resources, Construction and Maintenance Occupations by Sex
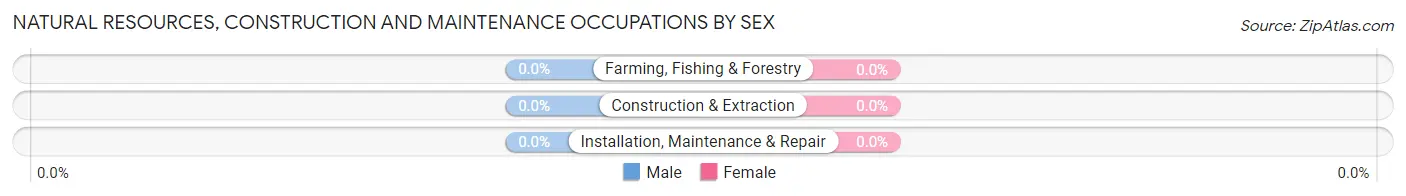
| Occupation | Male | Female |
| Farming, Fishing & Forestry | 0 (0.0%) | 0 (0.0%) |
| Construction & Extraction | 0 (0.0%) | 0 (0.0%) |
| Installation, Maintenance & Repair | 0 (0.0%) | 0 (0.0%) |
| Total (Category) | 0 (0.0%) | 0 (0.0%) |
| Total (Overall) | 385 (56.3%) | 299 (43.7%) |
Production, Transportation and Moving Occupations
The most common Production, Transportation and Moving occupations in Rio Verde are Transportation (100 | 14.6%), and Production (18 | 2.6%).
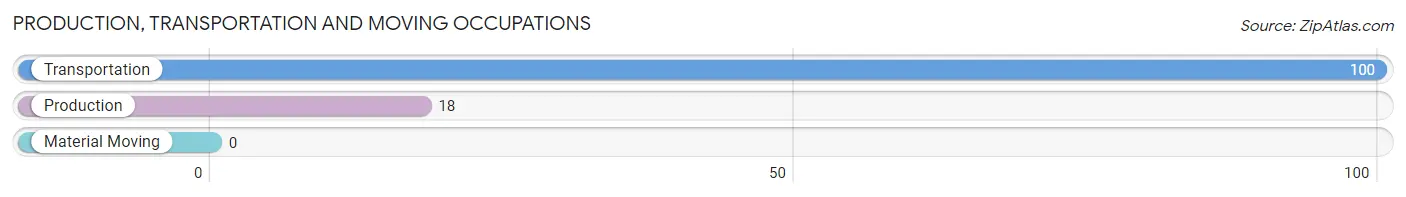
Production, Transportation and Moving Occupations by Sex
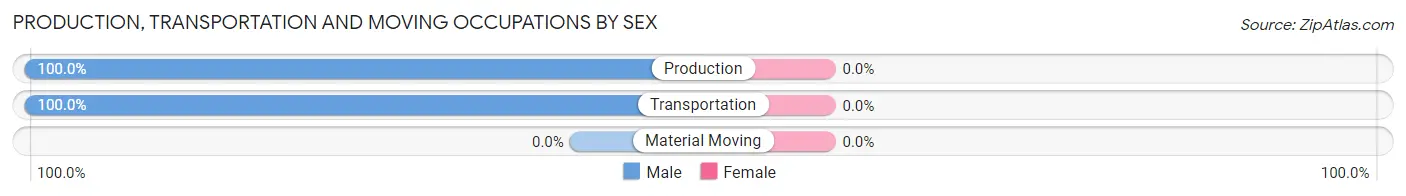
| Occupation | Male | Female |
| Production | 18 (100.0%) | 0 (0.0%) |
| Transportation | 100 (100.0%) | 0 (0.0%) |
| Material Moving | 0 (0.0%) | 0 (0.0%) |
| Total (Category) | 118 (100.0%) | 0 (0.0%) |
| Total (Overall) | 385 (56.3%) | 299 (43.7%) |
Employment Industries by Sex in Rio Verde
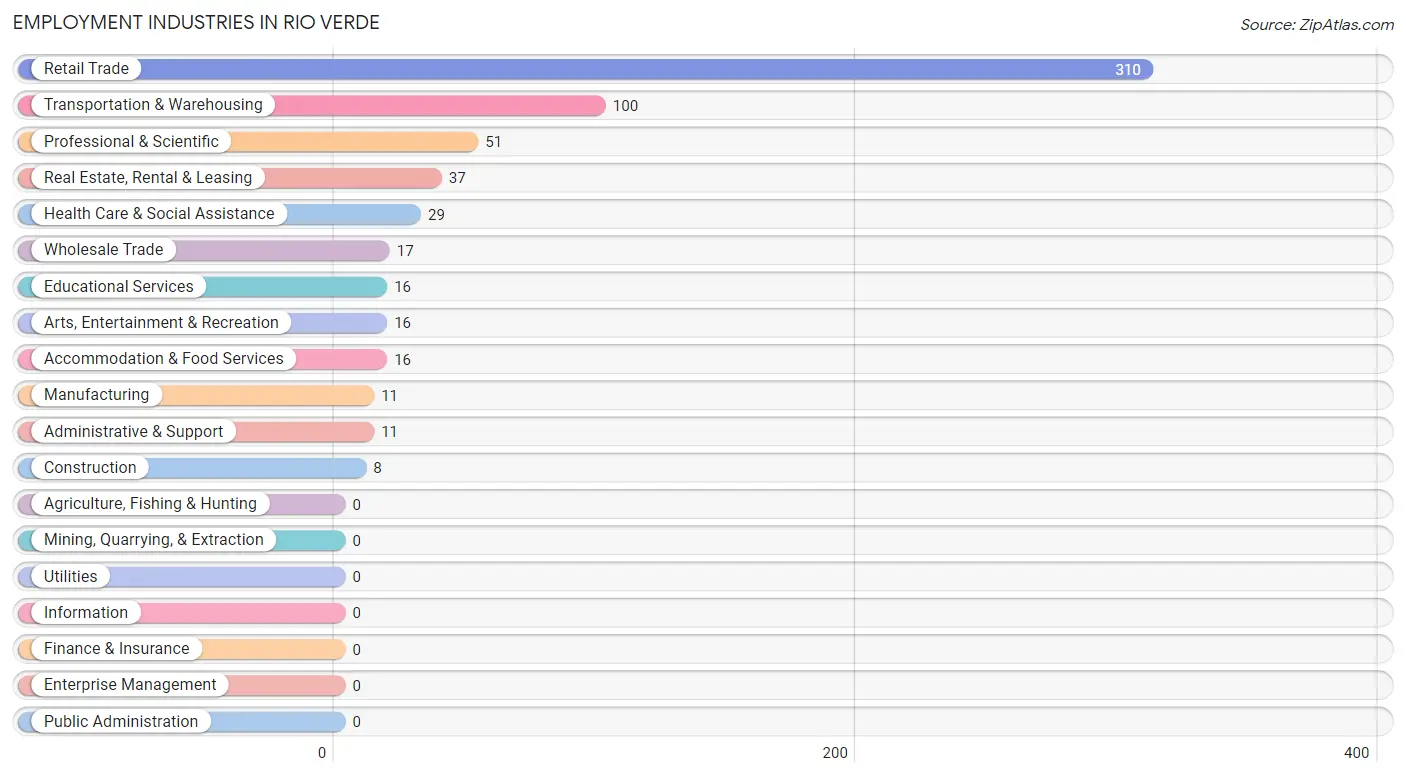
Employment Industries in Rio Verde
The major employment industries in Rio Verde include Retail Trade (310 | 45.3%), Transportation & Warehousing (100 | 14.6%), Professional & Scientific (51 | 7.5%), Real Estate, Rental & Leasing (37 | 5.4%), and Health Care & Social Assistance (29 | 4.2%).
Employment Industries by Sex in Rio Verde
The Rio Verde industries that see more men than women are Manufacturing (100.0%), Wholesale Trade (100.0%), and Transportation & Warehousing (100.0%), whereas the industries that tend to have a higher number of women are Construction (100.0%), Administrative & Support (100.0%), and Educational Services (100.0%).
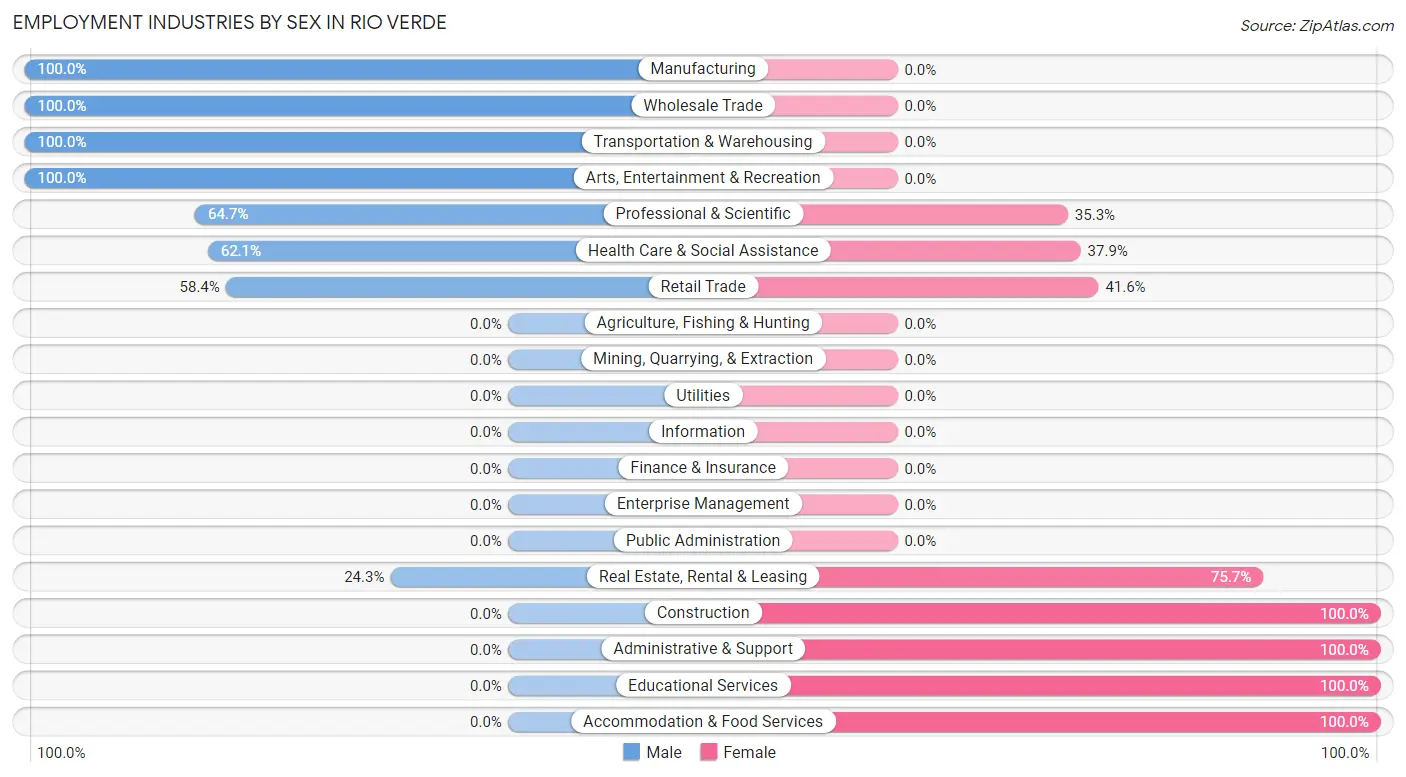
| Industry | Male | Female |
| Agriculture, Fishing & Hunting | 0 (0.0%) | 0 (0.0%) |
| Mining, Quarrying, & Extraction | 0 (0.0%) | 0 (0.0%) |
| Construction | 0 (0.0%) | 8 (100.0%) |
| Manufacturing | 11 (100.0%) | 0 (0.0%) |
| Wholesale Trade | 17 (100.0%) | 0 (0.0%) |
| Retail Trade | 181 (58.4%) | 129 (41.6%) |
| Transportation & Warehousing | 100 (100.0%) | 0 (0.0%) |
| Utilities | 0 (0.0%) | 0 (0.0%) |
| Information | 0 (0.0%) | 0 (0.0%) |
| Finance & Insurance | 0 (0.0%) | 0 (0.0%) |
| Real Estate, Rental & Leasing | 9 (24.3%) | 28 (75.7%) |
| Professional & Scientific | 33 (64.7%) | 18 (35.3%) |
| Enterprise Management | 0 (0.0%) | 0 (0.0%) |
| Administrative & Support | 0 (0.0%) | 11 (100.0%) |
| Educational Services | 0 (0.0%) | 16 (100.0%) |
| Health Care & Social Assistance | 18 (62.1%) | 11 (37.9%) |
| Arts, Entertainment & Recreation | 16 (100.0%) | 0 (0.0%) |
| Accommodation & Food Services | 0 (0.0%) | 16 (100.0%) |
| Public Administration | 0 (0.0%) | 0 (0.0%) |
| Total | 385 (56.3%) | 299 (43.7%) |
Education in Rio Verde
School Enrollment in Rio Verde
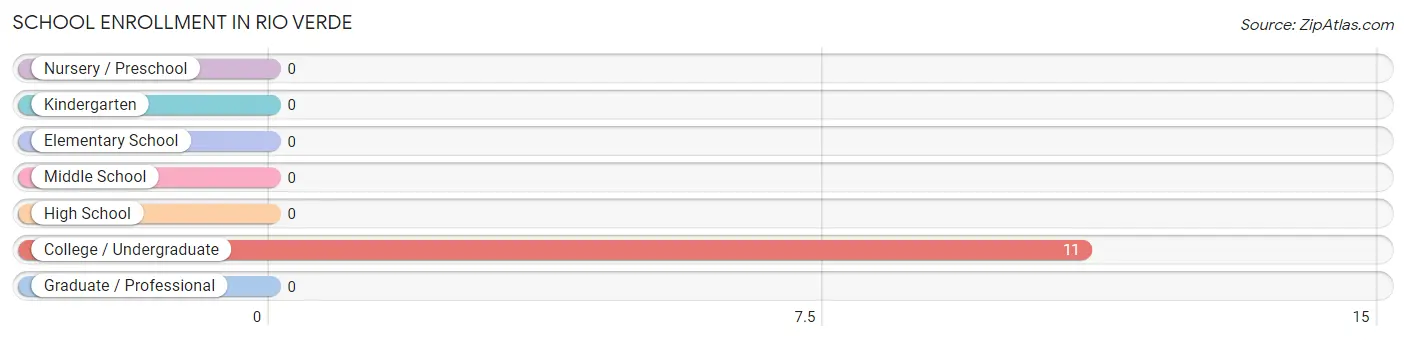
| School Level | # Students | % Students |
| Nursery / Preschool | 0 | 0.0% |
| Kindergarten | 0 | 0.0% |
| Elementary School | 0 | 0.0% |
| Middle School | 0 | 0.0% |
| High School | 0 | 0.0% |
| College / Undergraduate | 11 | 100.0% |
| Graduate / Professional | 0 | 0.0% |
| Total | 11 | 100.0% |
School Enrollment by Age by Funding Source in Rio Verde
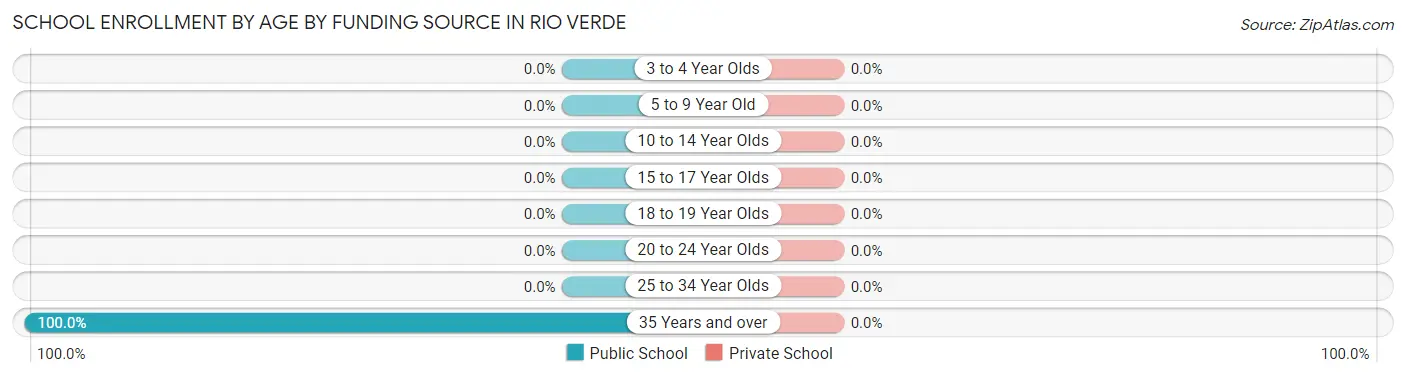
| Age Bracket | Public School | Private School |
| 3 to 4 Year Olds | 0 (0.0%) | 0 (0.0%) |
| 5 to 9 Year Old | 0 (0.0%) | 0 (0.0%) |
| 10 to 14 Year Olds | 0 (0.0%) | 0 (0.0%) |
| 15 to 17 Year Olds | 0 (0.0%) | 0 (0.0%) |
| 18 to 19 Year Olds | 0 (0.0%) | 0 (0.0%) |
| 20 to 24 Year Olds | 0 (0.0%) | 0 (0.0%) |
| 25 to 34 Year Olds | 0 (0.0%) | 0 (0.0%) |
| 35 Years and over | 11 (100.0%) | 0 (0.0%) |
| Total | 11 (100.0%) | 0 (0.0%) |
Educational Attainment by Field of Study in Rio Verde
Business (458 | 25.8%), education (255 | 14.4%), science & technology (238 | 13.4%), liberal arts & history (198 | 11.2%), and social sciences (185 | 10.4%) are the most common fields of study among 1,774 individuals in Rio Verde who have obtained a bachelor's degree or higher.
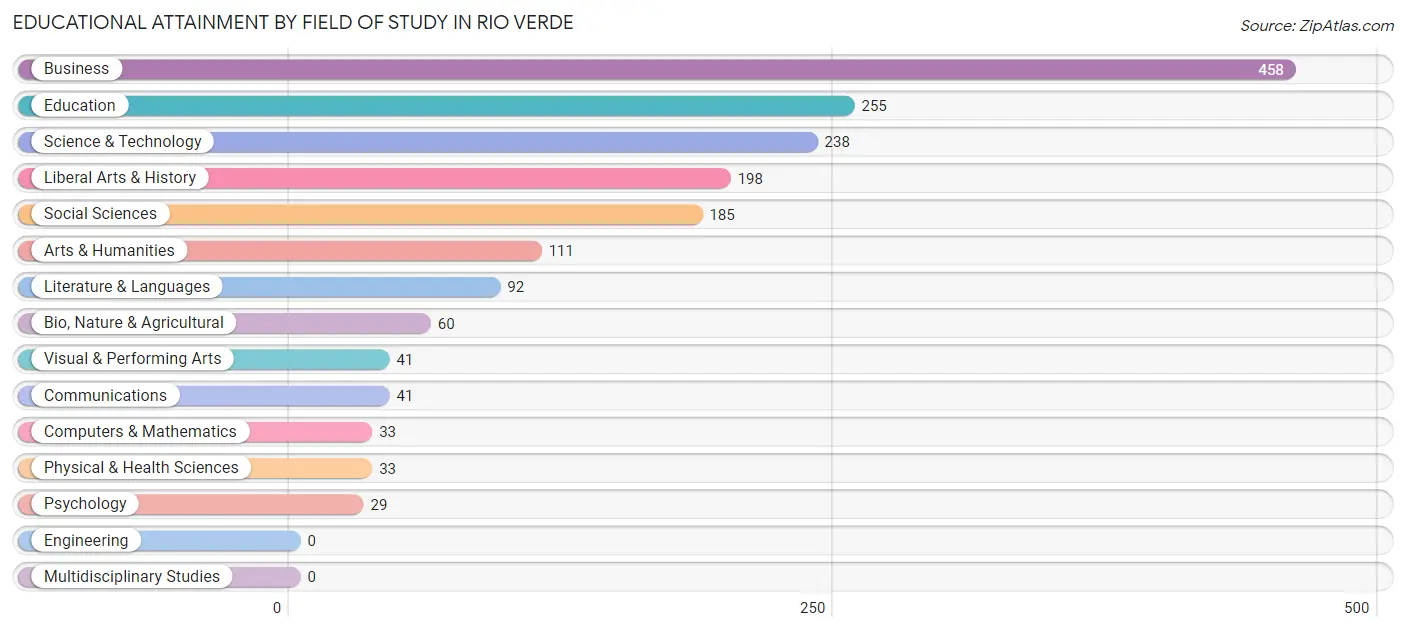
| Field of Study | # Graduates | % Graduates |
| Computers & Mathematics | 33 | 1.9% |
| Bio, Nature & Agricultural | 60 | 3.4% |
| Physical & Health Sciences | 33 | 1.9% |
| Psychology | 29 | 1.6% |
| Social Sciences | 185 | 10.4% |
| Engineering | 0 | 0.0% |
| Multidisciplinary Studies | 0 | 0.0% |
| Science & Technology | 238 | 13.4% |
| Business | 458 | 25.8% |
| Education | 255 | 14.4% |
| Literature & Languages | 92 | 5.2% |
| Liberal Arts & History | 198 | 11.2% |
| Visual & Performing Arts | 41 | 2.3% |
| Communications | 41 | 2.3% |
| Arts & Humanities | 111 | 6.3% |
| Total | 1,774 | 100.0% |
Transportation & Commute in Rio Verde
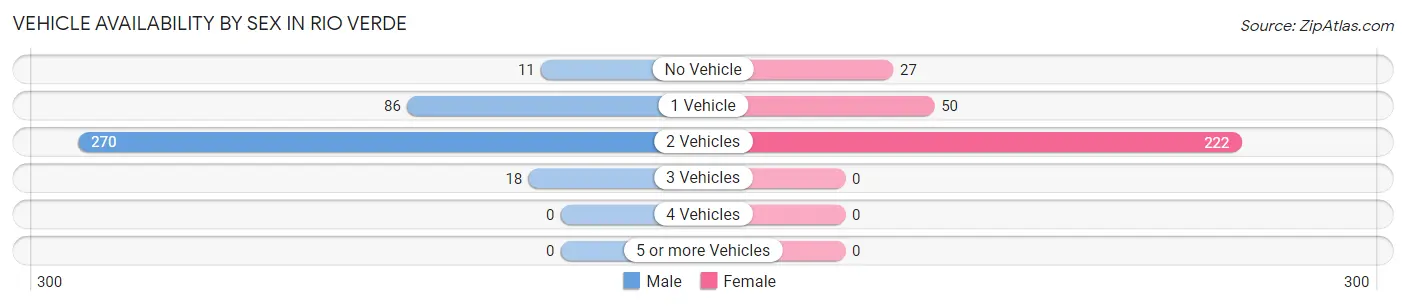
Vehicle Availability by Sex in Rio Verde
The most prevalent vehicle ownership categories in Rio Verde are males with 2 vehicles (270, accounting for 70.1%) and females with 2 vehicles (222, making up 90.3%).
| Vehicles Available | Male | Female |
| No Vehicle | 11 (2.9%) | 27 (9.0%) |
| 1 Vehicle | 86 (22.3%) | 50 (16.7%) |
| 2 Vehicles | 270 (70.1%) | 222 (74.3%) |
| 3 Vehicles | 18 (4.7%) | 0 (0.0%) |
| 4 Vehicles | 0 (0.0%) | 0 (0.0%) |
| 5 or more Vehicles | 0 (0.0%) | 0 (0.0%) |
| Total | 385 (100.0%) | 299 (100.0%) |
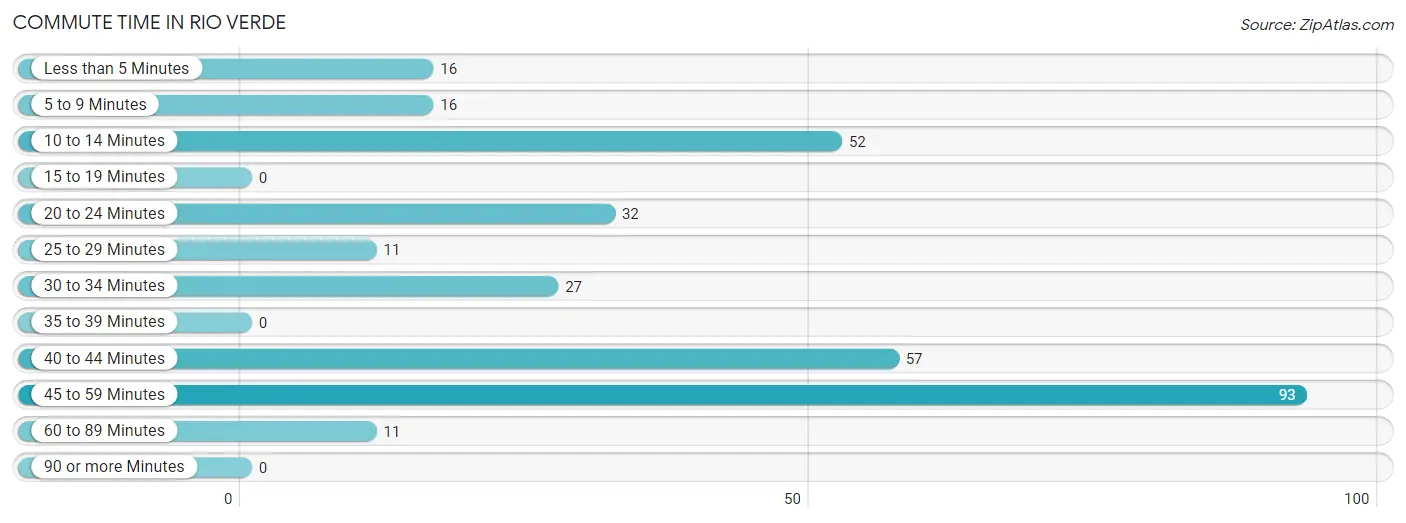
Commute Time in Rio Verde
The most frequently occuring commute durations in Rio Verde are 45 to 59 minutes (93 commuters, 29.5%), 40 to 44 minutes (57 commuters, 18.1%), and 10 to 14 minutes (52 commuters, 16.5%).
| Commute Time | # Commuters | % Commuters |
| Less than 5 Minutes | 16 | 5.1% |
| 5 to 9 Minutes | 16 | 5.1% |
| 10 to 14 Minutes | 52 | 16.5% |
| 15 to 19 Minutes | 0 | 0.0% |
| 20 to 24 Minutes | 32 | 10.2% |
| 25 to 29 Minutes | 11 | 3.5% |
| 30 to 34 Minutes | 27 | 8.6% |
| 35 to 39 Minutes | 0 | 0.0% |
| 40 to 44 Minutes | 57 | 18.1% |
| 45 to 59 Minutes | 93 | 29.5% |
| 60 to 89 Minutes | 11 | 3.5% |
| 90 or more Minutes | 0 | 0.0% |
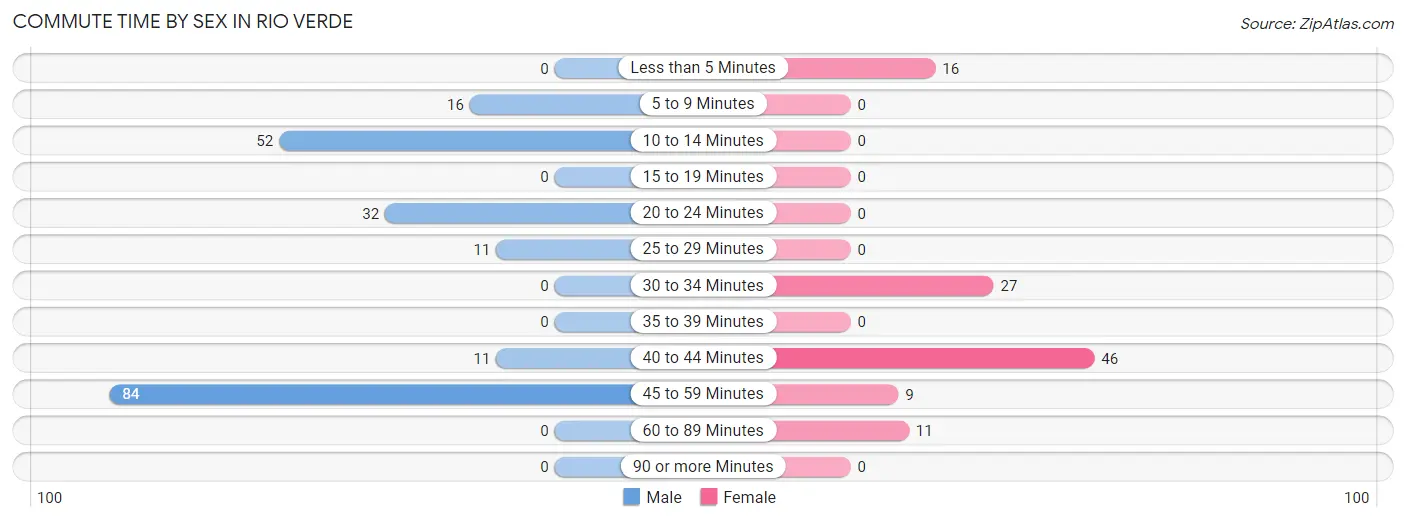
Commute Time by Sex in Rio Verde
The most common commute times in Rio Verde are 45 to 59 minutes (84 commuters, 40.8%) for males and 40 to 44 minutes (46 commuters, 42.2%) for females.
| Commute Time | Male | Female |
| Less than 5 Minutes | 0 (0.0%) | 16 (14.7%) |
| 5 to 9 Minutes | 16 (7.8%) | 0 (0.0%) |
| 10 to 14 Minutes | 52 (25.2%) | 0 (0.0%) |
| 15 to 19 Minutes | 0 (0.0%) | 0 (0.0%) |
| 20 to 24 Minutes | 32 (15.5%) | 0 (0.0%) |
| 25 to 29 Minutes | 11 (5.3%) | 0 (0.0%) |
| 30 to 34 Minutes | 0 (0.0%) | 27 (24.8%) |
| 35 to 39 Minutes | 0 (0.0%) | 0 (0.0%) |
| 40 to 44 Minutes | 11 (5.3%) | 46 (42.2%) |
| 45 to 59 Minutes | 84 (40.8%) | 9 (8.3%) |
| 60 to 89 Minutes | 0 (0.0%) | 11 (10.1%) |
| 90 or more Minutes | 0 (0.0%) | 0 (0.0%) |
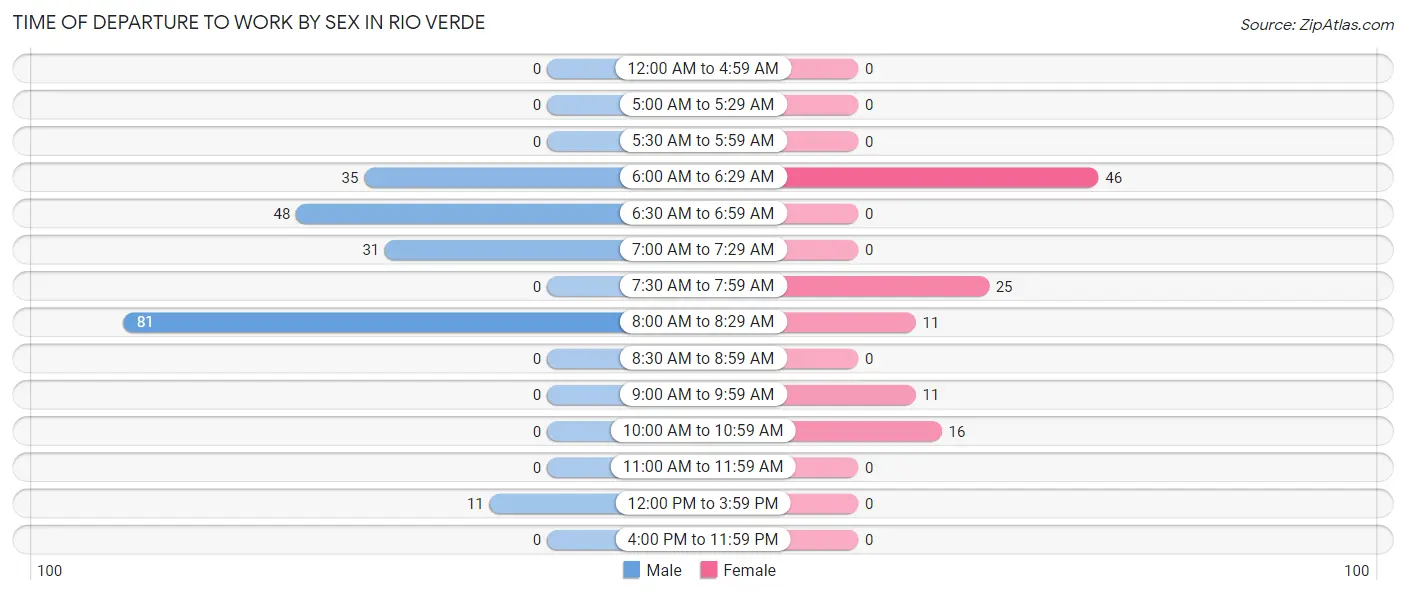
Time of Departure to Work by Sex in Rio Verde
The most frequent times of departure to work in Rio Verde are 8:00 AM to 8:29 AM (81, 39.3%) for males and 6:00 AM to 6:29 AM (46, 42.2%) for females.
| Time of Departure | Male | Female |
| 12:00 AM to 4:59 AM | 0 (0.0%) | 0 (0.0%) |
| 5:00 AM to 5:29 AM | 0 (0.0%) | 0 (0.0%) |
| 5:30 AM to 5:59 AM | 0 (0.0%) | 0 (0.0%) |
| 6:00 AM to 6:29 AM | 35 (17.0%) | 46 (42.2%) |
| 6:30 AM to 6:59 AM | 48 (23.3%) | 0 (0.0%) |
| 7:00 AM to 7:29 AM | 31 (15.0%) | 0 (0.0%) |
| 7:30 AM to 7:59 AM | 0 (0.0%) | 25 (22.9%) |
| 8:00 AM to 8:29 AM | 81 (39.3%) | 11 (10.1%) |
| 8:30 AM to 8:59 AM | 0 (0.0%) | 0 (0.0%) |
| 9:00 AM to 9:59 AM | 0 (0.0%) | 11 (10.1%) |
| 10:00 AM to 10:59 AM | 0 (0.0%) | 16 (14.7%) |
| 11:00 AM to 11:59 AM | 0 (0.0%) | 0 (0.0%) |
| 12:00 PM to 3:59 PM | 11 (5.3%) | 0 (0.0%) |
| 4:00 PM to 11:59 PM | 0 (0.0%) | 0 (0.0%) |
| Total | 206 (100.0%) | 109 (100.0%) |
Housing Occupancy in Rio Verde
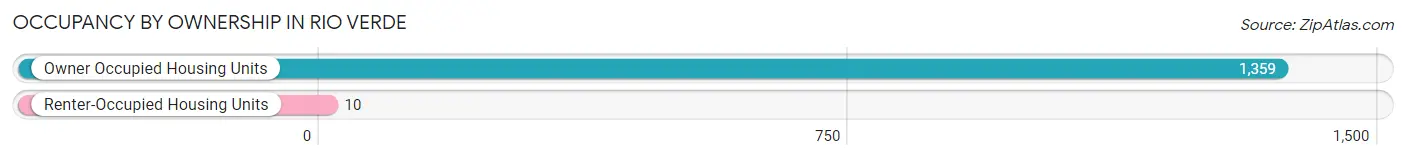
Occupancy by Ownership in Rio Verde
Of the total 1,369 dwellings in Rio Verde, owner-occupied units account for 1,359 (99.3%), while renter-occupied units make up 10 (0.7%).
| Occupancy | # Housing Units | % Housing Units |
| Owner Occupied Housing Units | 1,359 | 99.3% |
| Renter-Occupied Housing Units | 10 | 0.7% |
| Total Occupied Housing Units | 1,369 | 100.0% |
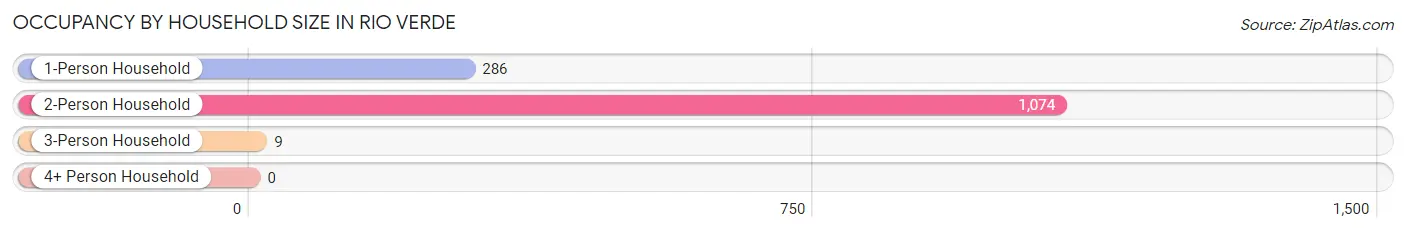
Occupancy by Household Size in Rio Verde
| Household Size | # Housing Units | % Housing Units |
| 1-Person Household | 286 | 20.9% |
| 2-Person Household | 1,074 | 78.4% |
| 3-Person Household | 9 | 0.7% |
| 4+ Person Household | 0 | 0.0% |
| Total Housing Units | 1,369 | 100.0% |
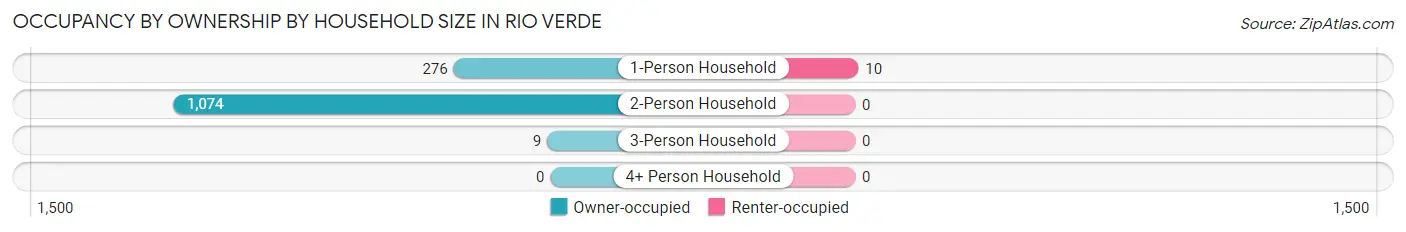
Occupancy by Ownership by Household Size in Rio Verde
| Household Size | Owner-occupied | Renter-occupied |
| 1-Person Household | 276 (96.5%) | 10 (3.5%) |
| 2-Person Household | 1,074 (100.0%) | 0 (0.0%) |
| 3-Person Household | 9 (100.0%) | 0 (0.0%) |
| 4+ Person Household | 0 (0.0%) | 0 (0.0%) |
| Total Housing Units | 1,359 (99.3%) | 10 (0.7%) |
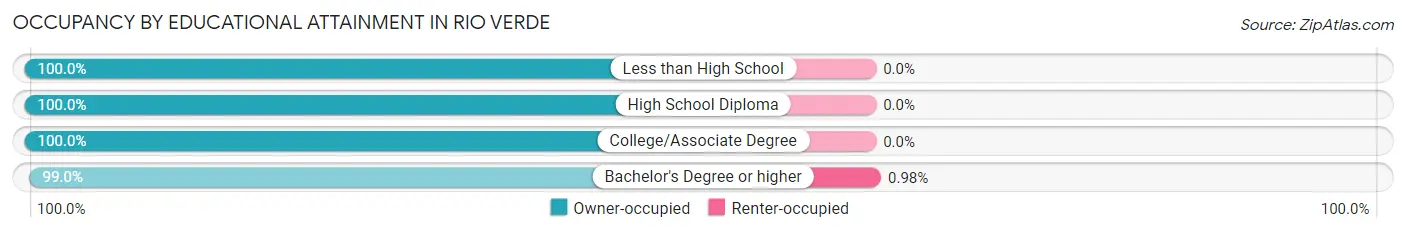
Occupancy by Educational Attainment in Rio Verde
| Household Size | Owner-occupied | Renter-occupied |
| Less than High School | 9 (100.0%) | 0 (0.0%) |
| High School Diploma | 78 (100.0%) | 0 (0.0%) |
| College/Associate Degree | 266 (100.0%) | 0 (0.0%) |
| Bachelor's Degree or higher | 1,006 (99.0%) | 10 (1.0%) |
Occupancy by Age of Householder in Rio Verde
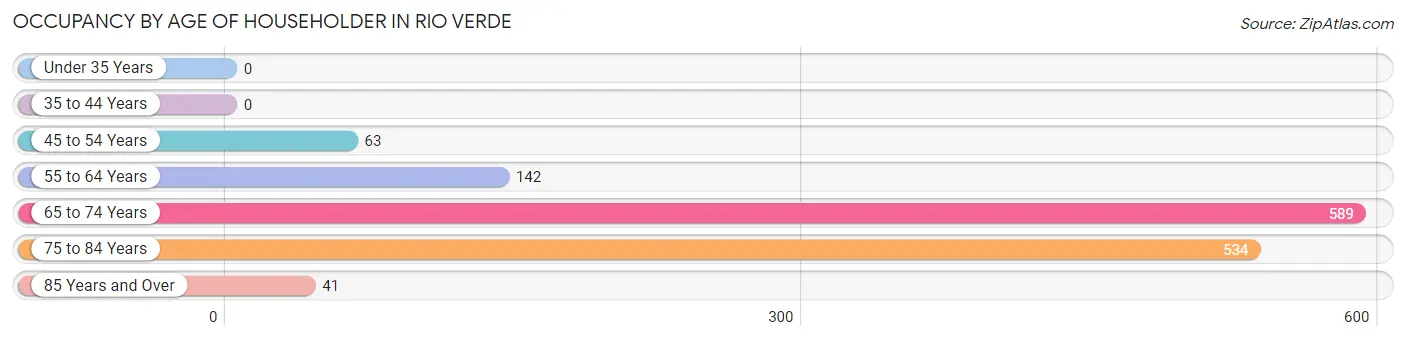
| Age Bracket | # Households | % Households |
| Under 35 Years | 0 | 0.0% |
| 35 to 44 Years | 0 | 0.0% |
| 45 to 54 Years | 63 | 4.6% |
| 55 to 64 Years | 142 | 10.4% |
| 65 to 74 Years | 589 | 43.0% |
| 75 to 84 Years | 534 | 39.0% |
| 85 Years and Over | 41 | 3.0% |
| Total | 1,369 | 100.0% |
Housing Finances in Rio Verde
Median Income by Occupancy in Rio Verde
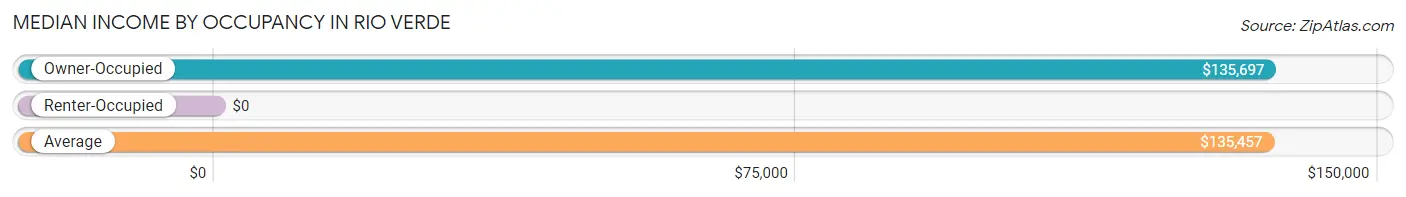
| Occupancy Type | # Households | Median Income |
| Owner-Occupied | 1,359 (99.3%) | $135,697 |
| Renter-Occupied | 10 (0.7%) | $0 |
| Average | 1,369 (100.0%) | $135,457 |
Occupancy by Householder Income Bracket in Rio Verde
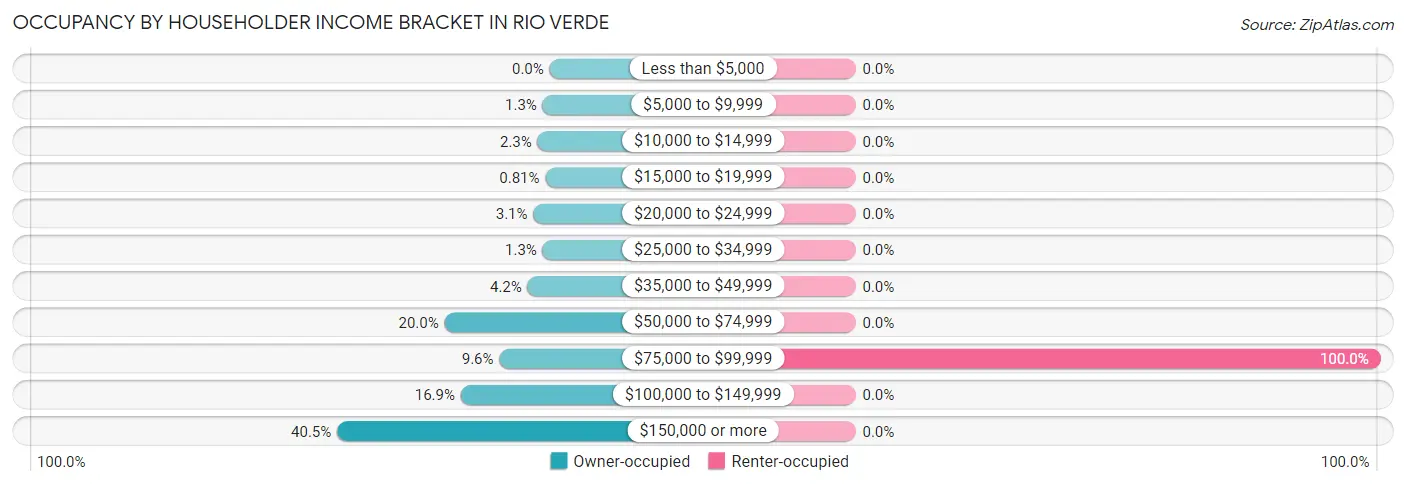
| Income Bracket | Owner-occupied | Renter-occupied |
| Less than $5,000 | 0 (0.0%) | 0 (0.0%) |
| $5,000 to $9,999 | 18 (1.3%) | 0 (0.0%) |
| $10,000 to $14,999 | 31 (2.3%) | 0 (0.0%) |
| $15,000 to $19,999 | 11 (0.8%) | 0 (0.0%) |
| $20,000 to $24,999 | 42 (3.1%) | 0 (0.0%) |
| $25,000 to $34,999 | 18 (1.3%) | 0 (0.0%) |
| $35,000 to $49,999 | 57 (4.2%) | 0 (0.0%) |
| $50,000 to $74,999 | 272 (20.0%) | 0 (0.0%) |
| $75,000 to $99,999 | 130 (9.6%) | 10 (100.0%) |
| $100,000 to $149,999 | 230 (16.9%) | 0 (0.0%) |
| $150,000 or more | 550 (40.5%) | 0 (0.0%) |
| Total | 1,359 (100.0%) | 10 (100.0%) |
Monthly Housing Cost Tiers in Rio Verde
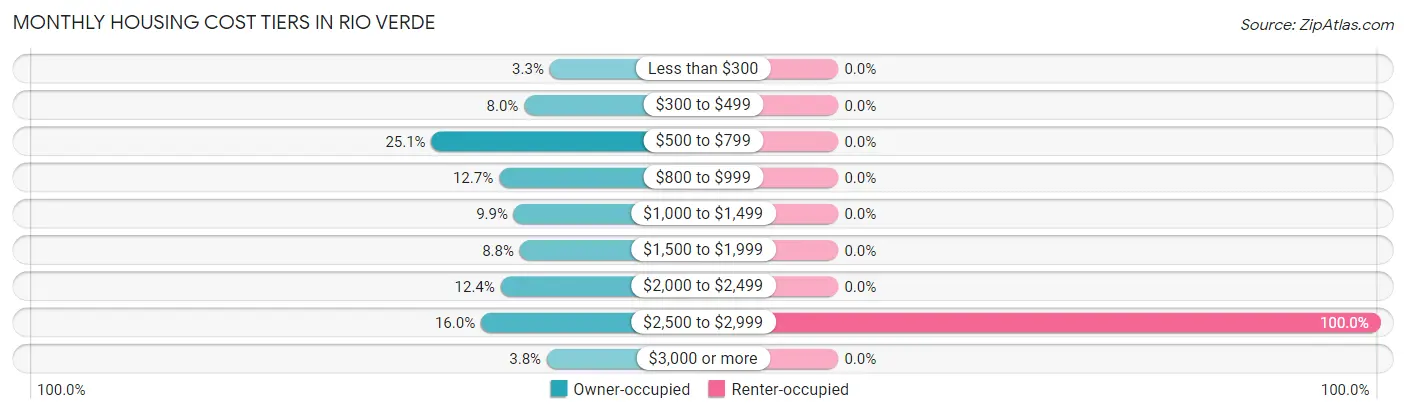
| Monthly Cost | Owner-occupied | Renter-occupied |
| Less than $300 | 45 (3.3%) | 0 (0.0%) |
| $300 to $499 | 109 (8.0%) | 0 (0.0%) |
| $500 to $799 | 341 (25.1%) | 0 (0.0%) |
| $800 to $999 | 172 (12.7%) | 0 (0.0%) |
| $1,000 to $1,499 | 135 (9.9%) | 0 (0.0%) |
| $1,500 to $1,999 | 120 (8.8%) | 0 (0.0%) |
| $2,000 to $2,499 | 168 (12.4%) | 0 (0.0%) |
| $2,500 to $2,999 | 217 (16.0%) | 10 (100.0%) |
| $3,000 or more | 52 (3.8%) | 0 (0.0%) |
| Total | 1,359 (100.0%) | 10 (100.0%) |
Physical Housing Characteristics in Rio Verde
Housing Structures in Rio Verde
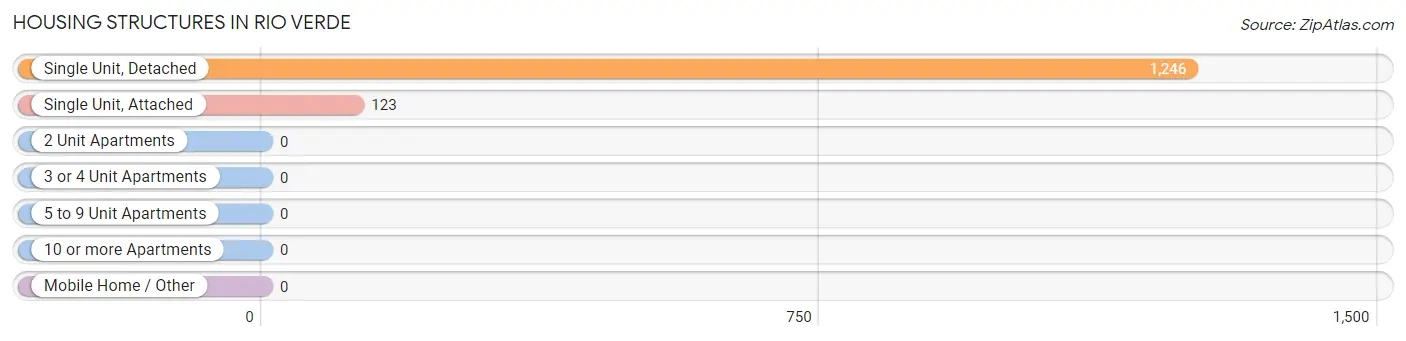
| Structure Type | # Housing Units | % Housing Units |
| Single Unit, Detached | 1,246 | 91.0% |
| Single Unit, Attached | 123 | 9.0% |
| 2 Unit Apartments | 0 | 0.0% |
| 3 or 4 Unit Apartments | 0 | 0.0% |
| 5 to 9 Unit Apartments | 0 | 0.0% |
| 10 or more Apartments | 0 | 0.0% |
| Mobile Home / Other | 0 | 0.0% |
| Total | 1,369 | 100.0% |
Housing Structures by Occupancy in Rio Verde
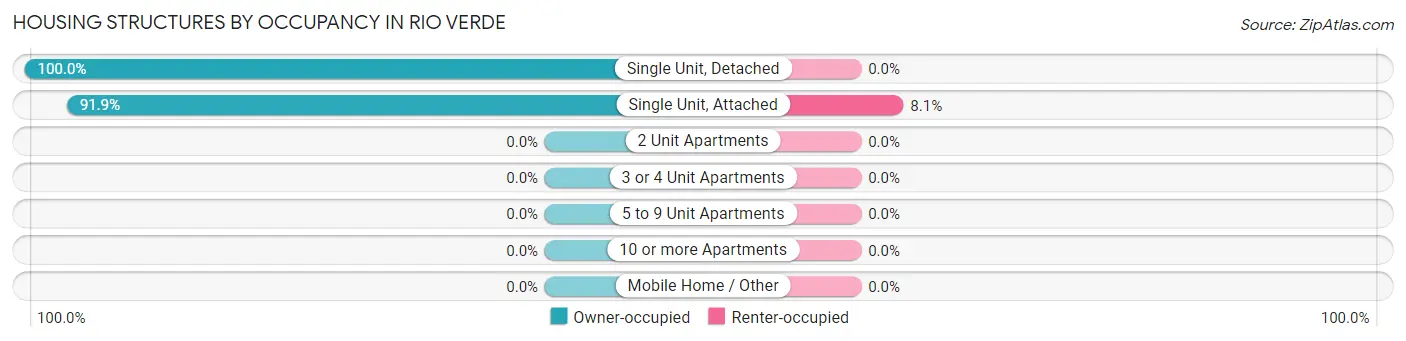
| Structure Type | Owner-occupied | Renter-occupied |
| Single Unit, Detached | 1,246 (100.0%) | 0 (0.0%) |
| Single Unit, Attached | 113 (91.9%) | 10 (8.1%) |
| 2 Unit Apartments | 0 (0.0%) | 0 (0.0%) |
| 3 or 4 Unit Apartments | 0 (0.0%) | 0 (0.0%) |
| 5 to 9 Unit Apartments | 0 (0.0%) | 0 (0.0%) |
| 10 or more Apartments | 0 (0.0%) | 0 (0.0%) |
| Mobile Home / Other | 0 (0.0%) | 0 (0.0%) |
| Total | 1,359 (99.3%) | 10 (0.7%) |
Housing Structures by Number of Rooms in Rio Verde
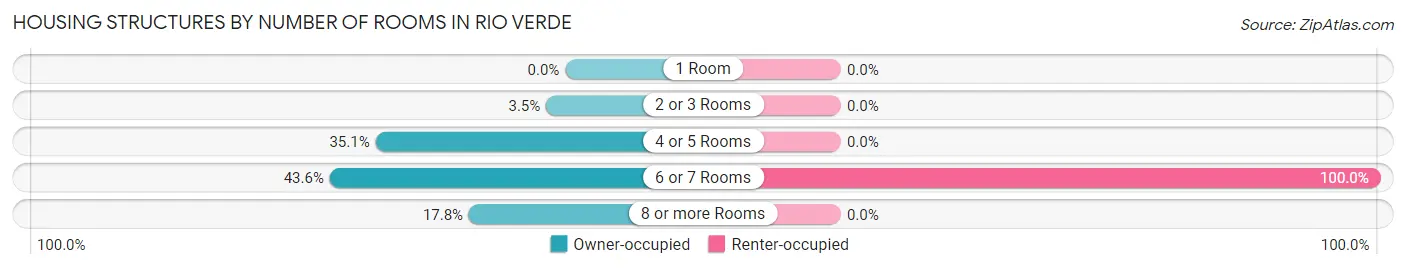
| Number of Rooms | Owner-occupied | Renter-occupied |
| 1 Room | 0 (0.0%) | 0 (0.0%) |
| 2 or 3 Rooms | 48 (3.5%) | 0 (0.0%) |
| 4 or 5 Rooms | 477 (35.1%) | 0 (0.0%) |
| 6 or 7 Rooms | 592 (43.6%) | 10 (100.0%) |
| 8 or more Rooms | 242 (17.8%) | 0 (0.0%) |
| Total | 1,359 (100.0%) | 10 (100.0%) |
Housing Structure by Heating Type in Rio Verde
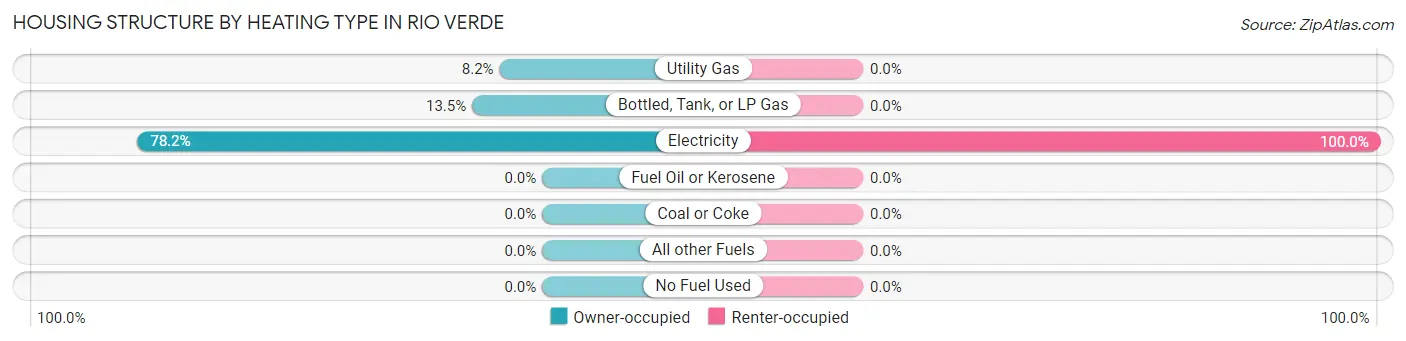
| Heating Type | Owner-occupied | Renter-occupied |
| Utility Gas | 112 (8.2%) | 0 (0.0%) |
| Bottled, Tank, or LP Gas | 184 (13.5%) | 0 (0.0%) |
| Electricity | 1,063 (78.2%) | 10 (100.0%) |
| Fuel Oil or Kerosene | 0 (0.0%) | 0 (0.0%) |
| Coal or Coke | 0 (0.0%) | 0 (0.0%) |
| All other Fuels | 0 (0.0%) | 0 (0.0%) |
| No Fuel Used | 0 (0.0%) | 0 (0.0%) |
| Total | 1,359 (100.0%) | 10 (100.0%) |
Household Vehicle Usage in Rio Verde
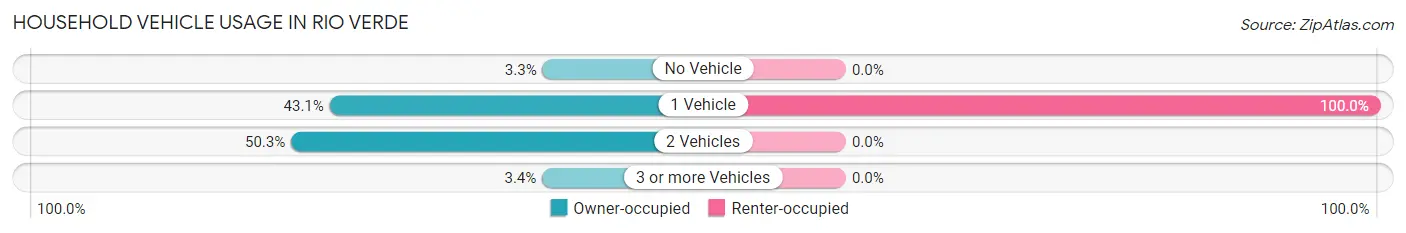
| Vehicles per Household | Owner-occupied | Renter-occupied |
| No Vehicle | 45 (3.3%) | 0 (0.0%) |
| 1 Vehicle | 585 (43.0%) | 10 (100.0%) |
| 2 Vehicles | 683 (50.3%) | 0 (0.0%) |
| 3 or more Vehicles | 46 (3.4%) | 0 (0.0%) |
| Total | 1,359 (100.0%) | 10 (100.0%) |
Real Estate & Mortgages in Rio Verde
Real Estate and Mortgage Overview in Rio Verde
| Characteristic | Without Mortgage | With Mortgage |
| Housing Units | 719 | 640 |
| Median Property Value | $652,400 | $649,000 |
| Median Household Income | $122,240 | $295 |
| Monthly Housing Costs | $711 | $52 |
| Real Estate Taxes | $3,837 | $0 |
Property Value by Mortgage Status in Rio Verde
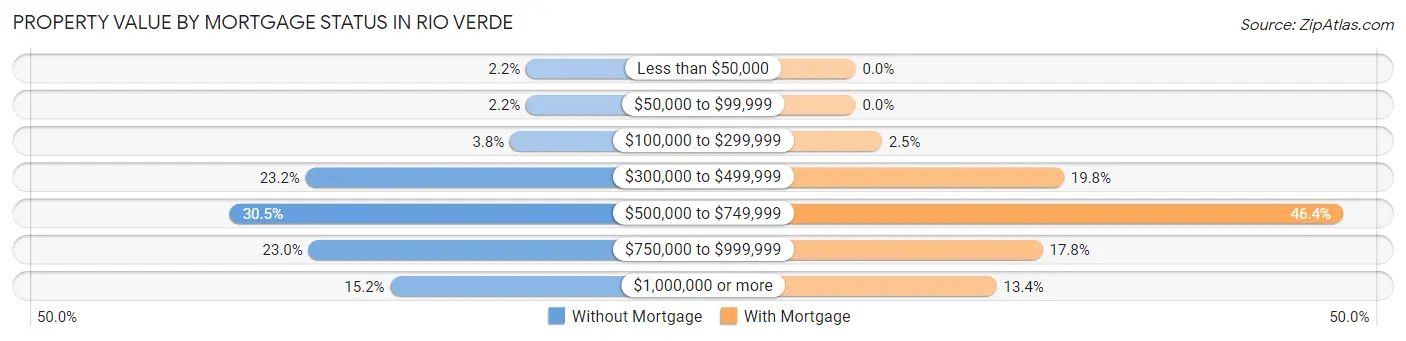
| Property Value | Without Mortgage | With Mortgage |
| Less than $50,000 | 16 (2.2%) | 0 (0.0%) |
| $50,000 to $99,999 | 16 (2.2%) | 0 (0.0%) |
| $100,000 to $299,999 | 27 (3.8%) | 16 (2.5%) |
| $300,000 to $499,999 | 167 (23.2%) | 127 (19.8%) |
| $500,000 to $749,999 | 219 (30.5%) | 297 (46.4%) |
| $750,000 to $999,999 | 165 (23.0%) | 114 (17.8%) |
| $1,000,000 or more | 109 (15.2%) | 86 (13.4%) |
| Total | 719 (100.0%) | 640 (100.0%) |
Household Income by Mortgage Status in Rio Verde
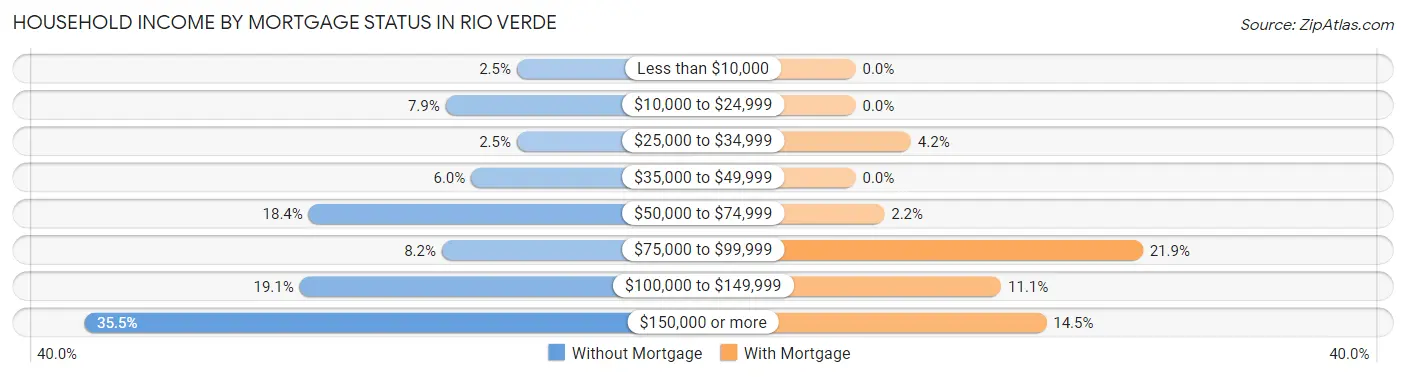
| Household Income | Without Mortgage | With Mortgage |
| Less than $10,000 | 18 (2.5%) | 0 (0.0%) |
| $10,000 to $24,999 | 57 (7.9%) | 0 (0.0%) |
| $25,000 to $34,999 | 18 (2.5%) | 27 (4.2%) |
| $35,000 to $49,999 | 43 (6.0%) | 0 (0.0%) |
| $50,000 to $74,999 | 132 (18.4%) | 14 (2.2%) |
| $75,000 to $99,999 | 59 (8.2%) | 140 (21.9%) |
| $100,000 to $149,999 | 137 (19.1%) | 71 (11.1%) |
| $150,000 or more | 255 (35.5%) | 93 (14.5%) |
| Total | 719 (100.0%) | 640 (100.0%) |
Property Value to Household Income Ratio in Rio Verde
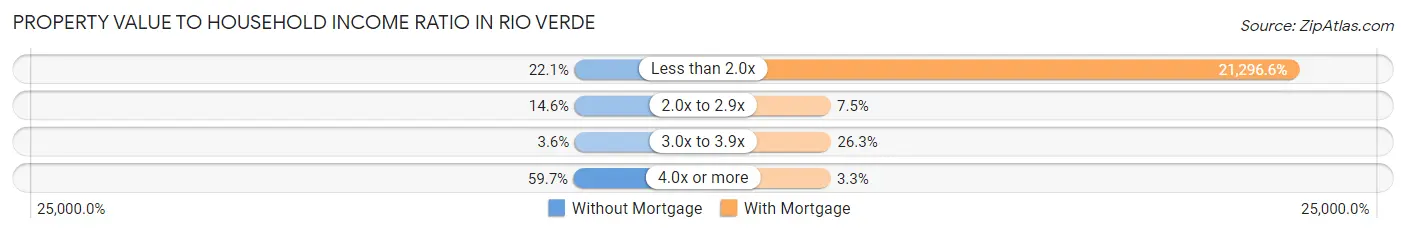
| Value-to-Income Ratio | Without Mortgage | With Mortgage |
| Less than 2.0x | 159 (22.1%) | 136,298 (21,296.6%) |
| 2.0x to 2.9x | 105 (14.6%) | 48 (7.5%) |
| 3.0x to 3.9x | 26 (3.6%) | 168 (26.3%) |
| 4.0x or more | 429 (59.7%) | 21 (3.3%) |
| Total | 719 (100.0%) | 640 (100.0%) |
Real Estate Taxes by Mortgage Status in Rio Verde

| Property Taxes | Without Mortgage | With Mortgage |
| Less than $800 | 0 (0.0%) | 0 (0.0%) |
| $800 to $1,499 | 45 (6.3%) | 0 (0.0%) |
| $800 to $1,499 | 674 (93.7%) | 16 (2.5%) |
| Total | 719 (100.0%) | 640 (100.0%) |
Health & Disability in Rio Verde
Health Insurance Coverage by Age in Rio Verde
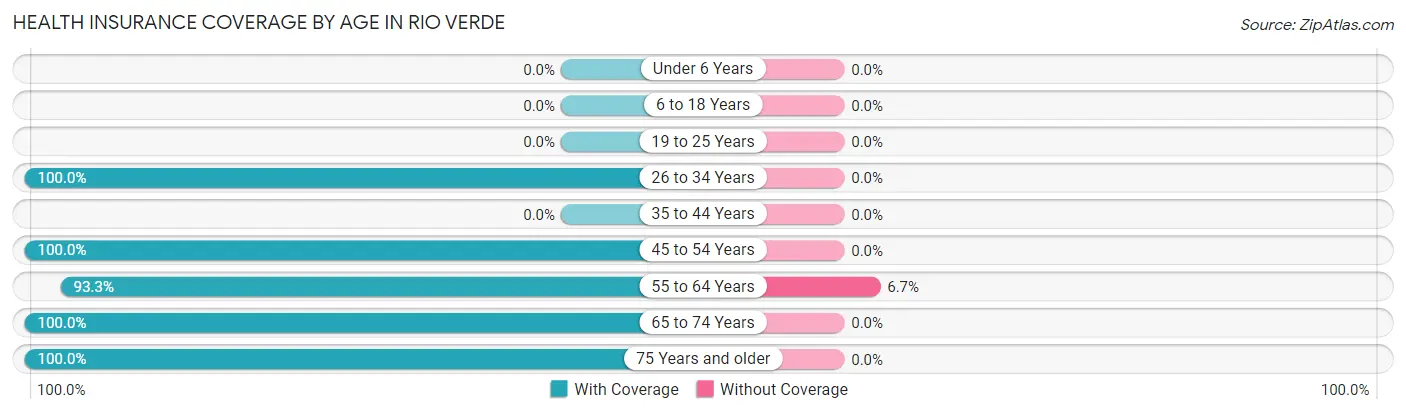
| Age Bracket | With Coverage | Without Coverage |
| Under 6 Years | 0 (0.0%) | 0 (0.0%) |
| 6 to 18 Years | 0 (0.0%) | 0 (0.0%) |
| 19 to 25 Years | 0 (0.0%) | 0 (0.0%) |
| 26 to 34 Years | 18 (100.0%) | 0 (0.0%) |
| 35 to 44 Years | 0 (0.0%) | 0 (0.0%) |
| 45 to 54 Years | 63 (100.0%) | 0 (0.0%) |
| 55 to 64 Years | 389 (93.3%) | 28 (6.7%) |
| 65 to 74 Years | 1,054 (100.0%) | 0 (0.0%) |
| 75 Years and older | 870 (100.0%) | 0 (0.0%) |
| Total | 2,394 (98.8%) | 28 (1.2%) |
Health Insurance Coverage by Citizenship Status in Rio Verde

| Citizenship Status | With Coverage | Without Coverage |
| Native Born | 0 (0.0%) | 0 (0.0%) |
| Foreign Born, Citizen | 0 (0.0%) | 0 (0.0%) |
| Foreign Born, not a Citizen | 0 (0.0%) | 0 (0.0%) |
Health Insurance Coverage by Household Income in Rio Verde
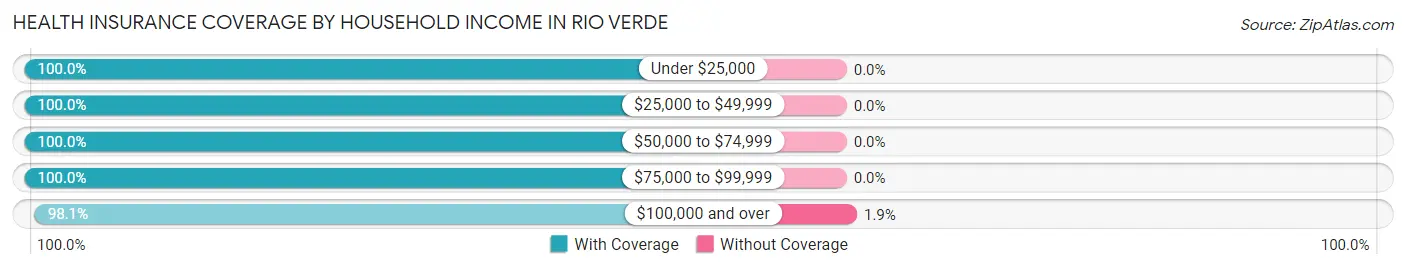
| Household Income | With Coverage | Without Coverage |
| Under $25,000 | 154 (100.0%) | 0 (0.0%) |
| $25,000 to $49,999 | 133 (100.0%) | 0 (0.0%) |
| $50,000 to $74,999 | 435 (100.0%) | 0 (0.0%) |
| $75,000 to $99,999 | 241 (100.0%) | 0 (0.0%) |
| $100,000 and over | 1,431 (98.1%) | 28 (1.9%) |
Public vs Private Health Insurance Coverage by Age in Rio Verde
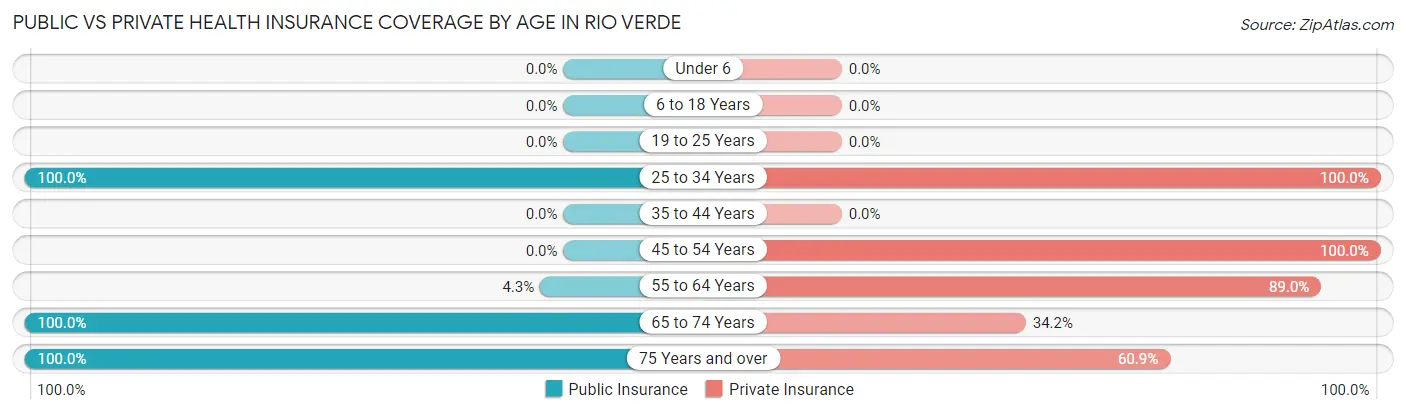
| Age Bracket | Public Insurance | Private Insurance |
| Under 6 | 0 (0.0%) | 0 (0.0%) |
| 6 to 18 Years | 0 (0.0%) | 0 (0.0%) |
| 19 to 25 Years | 0 (0.0%) | 0 (0.0%) |
| 25 to 34 Years | 18 (100.0%) | 18 (100.0%) |
| 35 to 44 Years | 0 (0.0%) | 0 (0.0%) |
| 45 to 54 Years | 0 (0.0%) | 63 (100.0%) |
| 55 to 64 Years | 18 (4.3%) | 371 (89.0%) |
| 65 to 74 Years | 1,054 (100.0%) | 360 (34.2%) |
| 75 Years and over | 870 (100.0%) | 530 (60.9%) |
| Total | 1,960 (80.9%) | 1,342 (55.4%) |
Disability Status by Sex by Age in Rio Verde
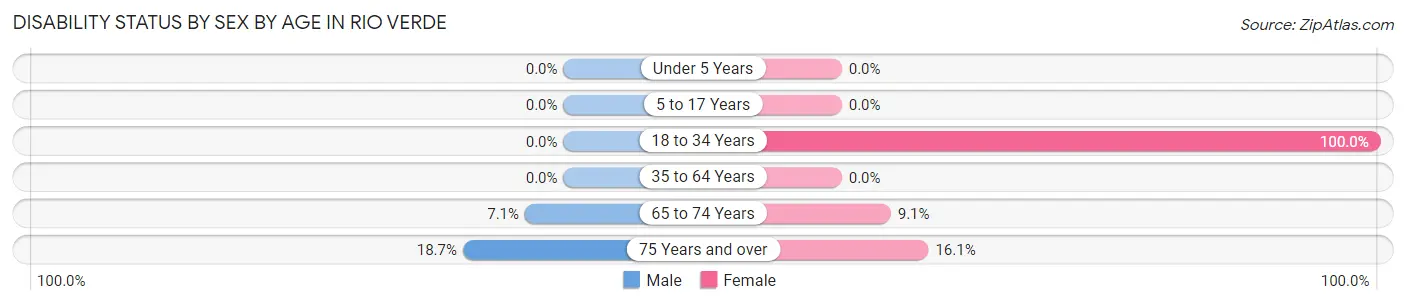
| Age Bracket | Male | Female |
| Under 5 Years | 0 (0.0%) | 0 (0.0%) |
| 5 to 17 Years | 0 (0.0%) | 0 (0.0%) |
| 18 to 34 Years | 0 (0.0%) | 18 (100.0%) |
| 35 to 64 Years | 0 (0.0%) | 0 (0.0%) |
| 65 to 74 Years | 36 (7.1%) | 50 (9.1%) |
| 75 Years and over | 87 (18.7%) | 65 (16.1%) |
Disability Class by Sex by Age in Rio Verde
Disability Class: Hearing Difficulty
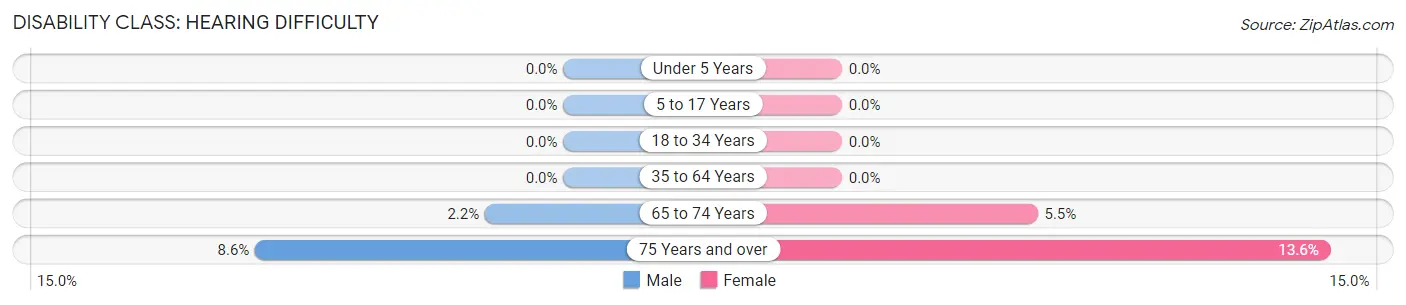
| Age Bracket | Male | Female |
| Under 5 Years | 0 (0.0%) | 0 (0.0%) |
| 5 to 17 Years | 0 (0.0%) | 0 (0.0%) |
| 18 to 34 Years | 0 (0.0%) | 0 (0.0%) |
| 35 to 64 Years | 0 (0.0%) | 0 (0.0%) |
| 65 to 74 Years | 11 (2.2%) | 30 (5.4%) |
| 75 Years and over | 40 (8.6%) | 55 (13.6%) |
Disability Class: Vision Difficulty
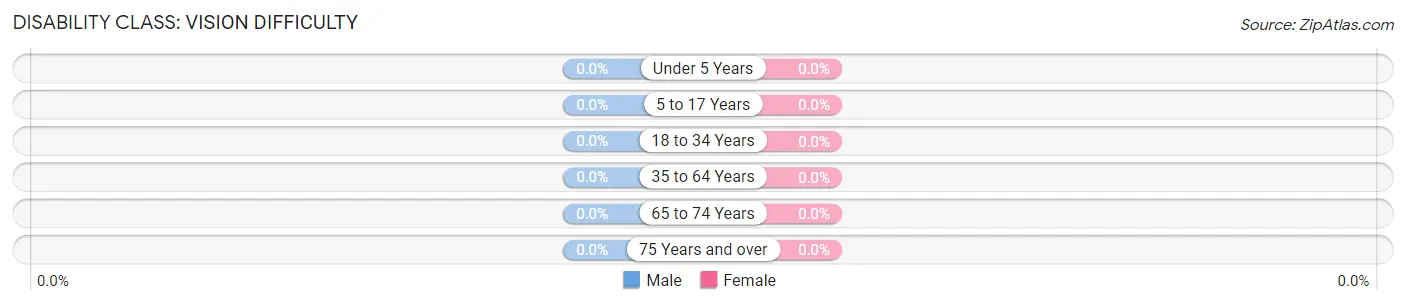
| Age Bracket | Male | Female |
| Under 5 Years | 0 (0.0%) | 0 (0.0%) |
| 5 to 17 Years | 0 (0.0%) | 0 (0.0%) |
| 18 to 34 Years | 0 (0.0%) | 0 (0.0%) |
| 35 to 64 Years | 0 (0.0%) | 0 (0.0%) |
| 65 to 74 Years | 0 (0.0%) | 0 (0.0%) |
| 75 Years and over | 0 (0.0%) | 0 (0.0%) |
Disability Class: Cognitive Difficulty
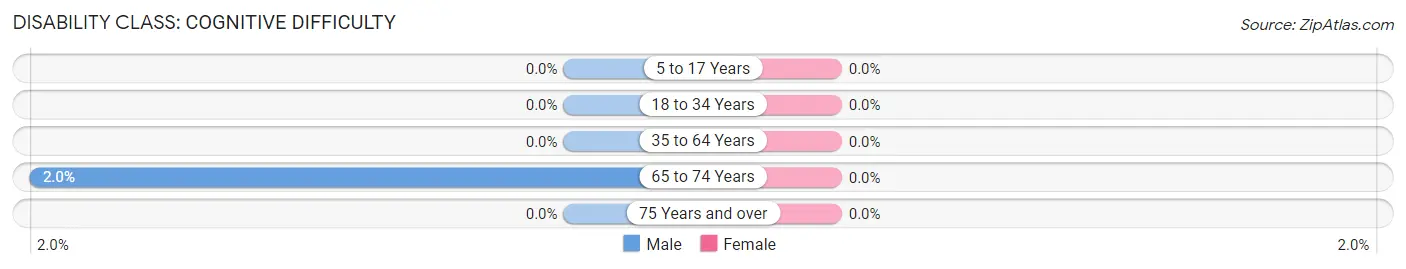
| Age Bracket | Male | Female |
| 5 to 17 Years | 0 (0.0%) | 0 (0.0%) |
| 18 to 34 Years | 0 (0.0%) | 0 (0.0%) |
| 35 to 64 Years | 0 (0.0%) | 0 (0.0%) |
| 65 to 74 Years | 10 (2.0%) | 0 (0.0%) |
| 75 Years and over | 0 (0.0%) | 0 (0.0%) |
Disability Class: Ambulatory Difficulty
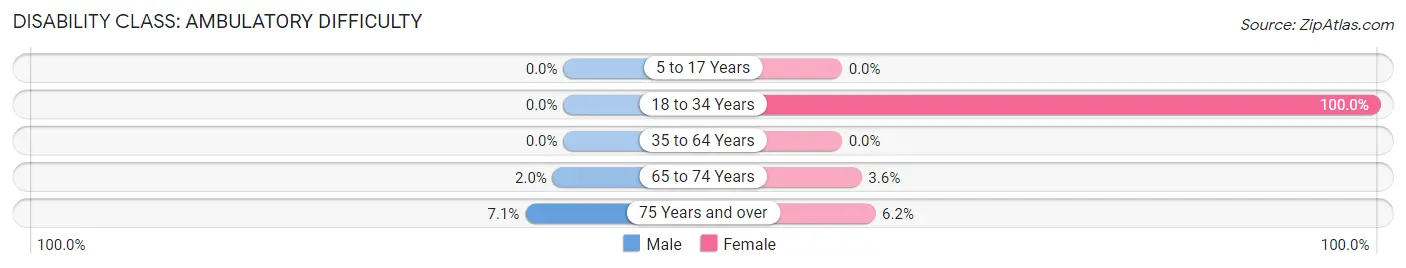
| Age Bracket | Male | Female |
| 5 to 17 Years | 0 (0.0%) | 0 (0.0%) |
| 18 to 34 Years | 0 (0.0%) | 18 (100.0%) |
| 35 to 64 Years | 0 (0.0%) | 0 (0.0%) |
| 65 to 74 Years | 10 (2.0%) | 20 (3.6%) |
| 75 Years and over | 33 (7.1%) | 25 (6.2%) |
Disability Class: Self-Care Difficulty

| Age Bracket | Male | Female |
| 5 to 17 Years | 0 (0.0%) | 0 (0.0%) |
| 18 to 34 Years | 0 (0.0%) | 18 (100.0%) |
| 35 to 64 Years | 0 (0.0%) | 0 (0.0%) |
| 65 to 74 Years | 10 (2.0%) | 0 (0.0%) |
| 75 Years and over | 0 (0.0%) | 0 (0.0%) |
Technology Access in Rio Verde
Computing Device Access in Rio Verde
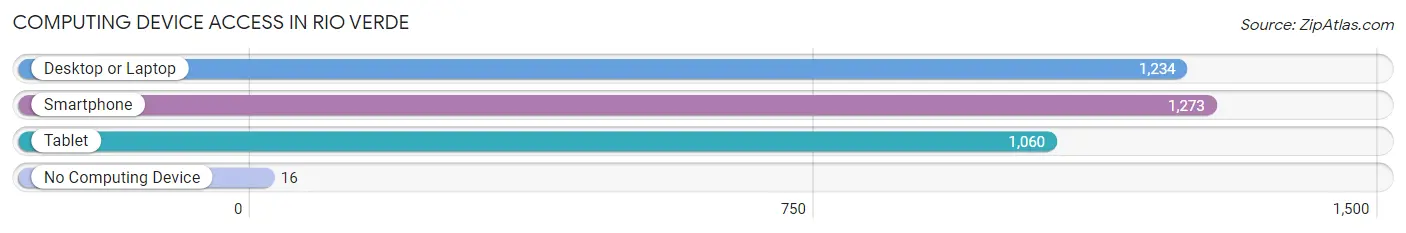
| Device Type | # Households | % Households |
| Desktop or Laptop | 1,234 | 90.1% |
| Smartphone | 1,273 | 93.0% |
| Tablet | 1,060 | 77.4% |
| No Computing Device | 16 | 1.2% |
| Total | 1,369 | 100.0% |
Internet Access in Rio Verde
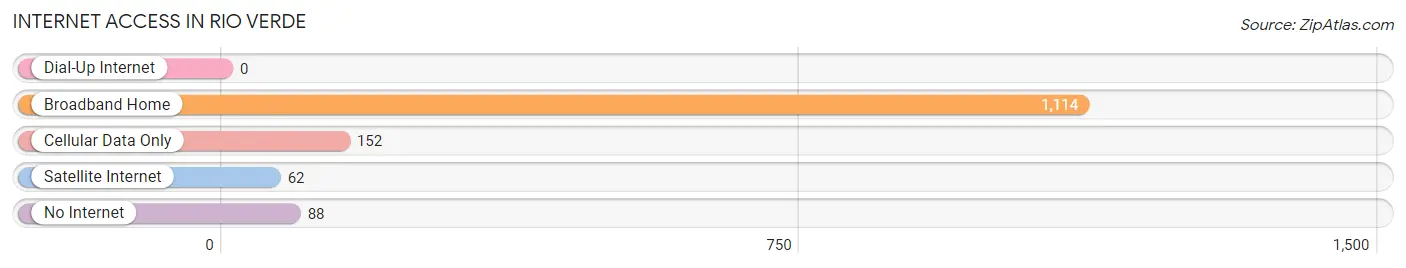
| Internet Type | # Households | % Households |
| Dial-Up Internet | 0 | 0.0% |
| Broadband Home | 1,114 | 81.4% |
| Cellular Data Only | 152 | 11.1% |
| Satellite Internet | 62 | 4.5% |
| No Internet | 88 | 6.4% |
| Total | 1,369 | 100.0% |
Rio Verde Summary
Rio Verde is a small unincorporated community located in Maricopa County, Arizona. It is situated in the foothills of the Tonto National Forest, approximately 25 miles northeast of Phoenix. The town is home to a population of approximately 1,000 people, and is known for its rural atmosphere and scenic views.
History
Rio Verde was first settled in the late 1800s by ranchers and farmers. The area was originally known as “Rio Verde Ranch” and was home to a variety of crops, including cotton, alfalfa, and citrus. The town was officially established in 1912, when the Rio Verde Irrigation District was formed. The district was responsible for providing water to the area, which allowed for the growth of the local agricultural industry.
In the early 1900s, the town began to grow as more people moved to the area. The town was home to a variety of businesses, including a general store, a post office, and a school. The town also had a train station, which allowed for the transportation of goods and people.
In the 1950s, the town began to decline as the local agricultural industry began to decline. The town’s population decreased, and many of the businesses closed. In the 1970s, the town began to experience a resurgence as people began to move to the area for its rural atmosphere and scenic views.
Geography
Rio Verde is located in the foothills of the Tonto National Forest, approximately 25 miles northeast of Phoenix. The town is situated at an elevation of 2,000 feet, and is surrounded by mountains and desert. The town is located in the Sonoran Desert, and is characterized by hot, dry summers and mild winters.
The town is home to a variety of wildlife, including coyotes, bobcats, javelinas, and rattlesnakes. The area is also home to a variety of birds, including quail, doves, and hawks.
Economy
Rio Verde’s economy is largely based on tourism and agriculture. The town is home to a variety of tourist attractions, including the Rio Verde Golf Course, the Rio Verde Trail, and the Rio Verde Wildlife Refuge. The town is also home to a variety of agricultural businesses, including farms, ranches, and wineries.
The town is also home to a variety of small businesses, including restaurants, shops, and galleries. The town is also home to a variety of services, including medical and dental offices, banks, and a post office.
Demographics
As of the 2010 census, the population of Rio Verde was 1,000. The town is predominantly white, with approximately 90% of the population identifying as white. The town is also home to a small Hispanic population, with approximately 8% of the population identifying as Hispanic. The town is also home to a small Native American population, with approximately 2% of the population identifying as Native American.
The median household income in Rio Verde is $50,000, and the median home value is $250,000. The town has a low unemployment rate, with approximately 4% of the population unemployed. The town also has a low crime rate, with approximately 1 crime per 1,000 people.
Common Questions
What is Per Capita Income in Rio Verde?
Per Capita income in Rio Verde is $94,118.
What is the Median Family Income in Rio Verde?
Median Family Income in Rio Verde is $149,196.
What is the Median Household income in Rio Verde?
Median Household Income in Rio Verde is $135,457.
What is Inequality or Gini Index in Rio Verde?
Inequality or Gini Index in Rio Verde is 0.45.
What is the Total Population of Rio Verde?
Total Population of Rio Verde is 2,422.
What is the Total Male Population of Rio Verde?
Total Male Population of Rio Verde is 1,161.
What is the Total Female Population of Rio Verde?
Total Female Population of Rio Verde is 1,261.
What is the Ratio of Males per 100 Females in Rio Verde?
There are 92.07 Males per 100 Females in Rio Verde.
What is the Ratio of Females per 100 Males in Rio Verde?
There are 108.61 Females per 100 Males in Rio Verde.
What is the Median Population Age in Rio Verde?
Median Population Age in Rio Verde is 71.6 Years.
What is the Average Family Size in Rio Verde
Average Family Size in Rio Verde is 2.0 People.
What is the Average Household Size in Rio Verde
Average Household Size in Rio Verde is 1.8 People.
How Large is the Labor Force in Rio Verde?
There are 683 People in the Labor Forcein in Rio Verde.
What is the Percentage of People in the Labor Force in Rio Verde?
28.2% of People are in the Labor Force in Rio Verde.