Chevy Chase Section Three, MD Map & Demographics
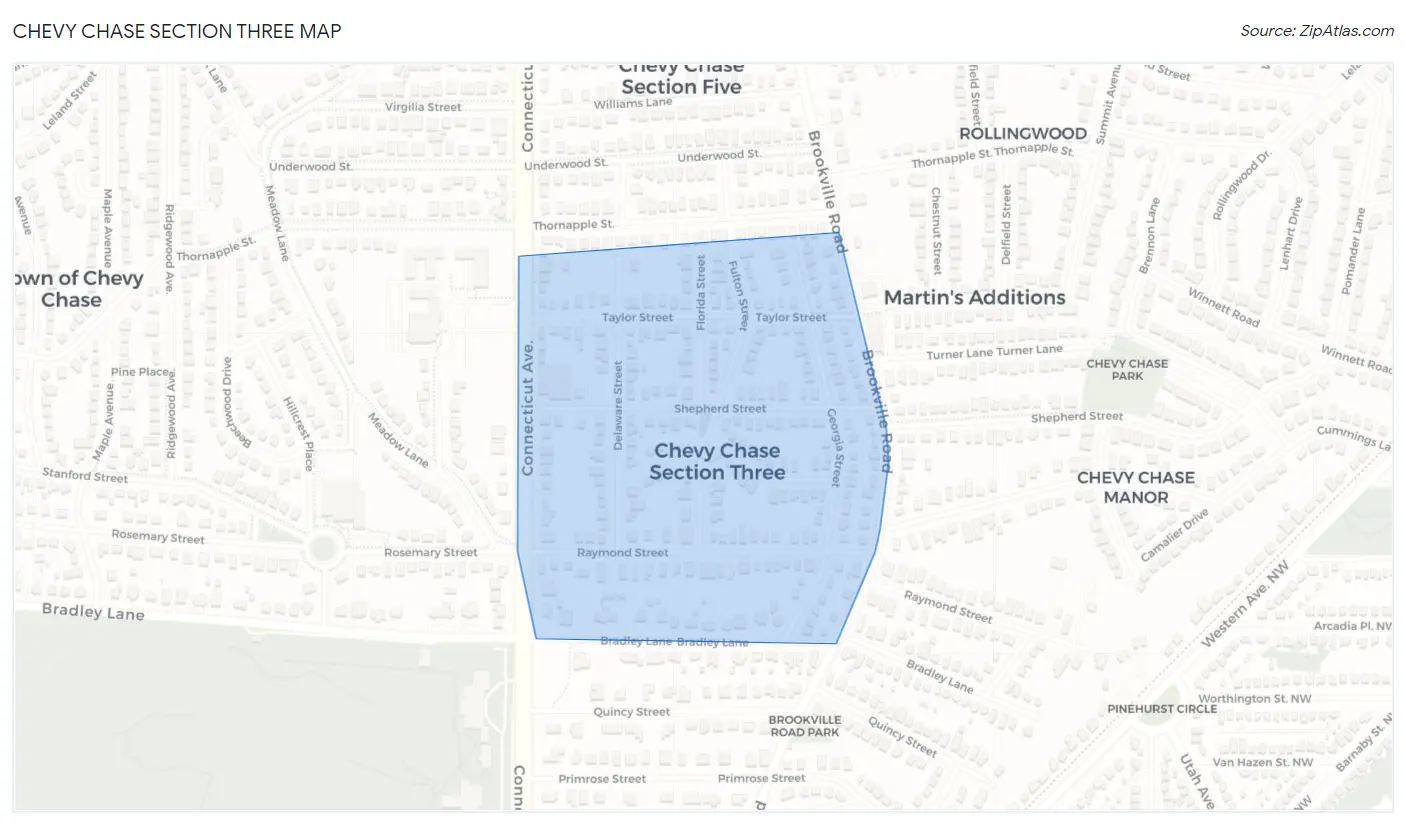
Chevy Chase Section Three Map
Chevy Chase Section Three Overview
$137,679
PER CAPITA INCOME
$250,001
AVG FAMILY INCOME
$250,001
AVG HOUSEHOLD INCOME
6.7%
WAGE / INCOME GAP [ % ]
93.3¢/ $1
WAGE / INCOME GAP [ $ ]
0.42
INEQUALITY / GINI INDEX
1,026
TOTAL POPULATION
480
MALE POPULATION
546
FEMALE POPULATION
87.91
MALES / 100 FEMALES
113.75
FEMALES / 100 MALES
44.8
MEDIAN AGE
3.4
AVG FAMILY SIZE
3.3
AVG HOUSEHOLD SIZE
450
LABOR FORCE [ PEOPLE ]
64.7%
PERCENT IN LABOR FORCE
0.7%
UNEMPLOYMENT RATE
Income in Chevy Chase Section Three
Income Overview in Chevy Chase Section Three
Per Capita Income in Chevy Chase Section Three is $137,679, while median incomes of families and households are $250,001 and $250,001 respectively.
| Characteristic | Number | Measure |
| Per Capita Income | 1,026 | $137,679 |
| Median Family Income | 288 | $250,001 |
| Mean Family Income | 288 | $461,569 |
| Median Household Income | 314 | $250,001 |
| Mean Household Income | 314 | $447,452 |
| Income Deficit | 288 | $0 |
| Wage / Income Gap (%) | 1,026 | 6.74% |
| Wage / Income Gap ($) | 1,026 | 93.26¢ per $1 |
| Gini / Inequality Index | 1,026 | 0.42 |
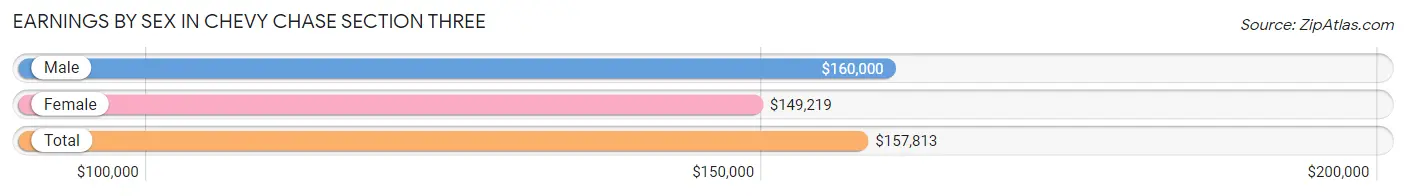
Earnings by Sex in Chevy Chase Section Three
Average Earnings in Chevy Chase Section Three are $157,813, $160,000 for men and $149,219 for women, a difference of 6.7%.
| Sex | Number | Average Earnings |
| Male | 260 (53.4%) | $160,000 |
| Female | 227 (46.6%) | $149,219 |
| Total | 487 (100.0%) | $157,813 |
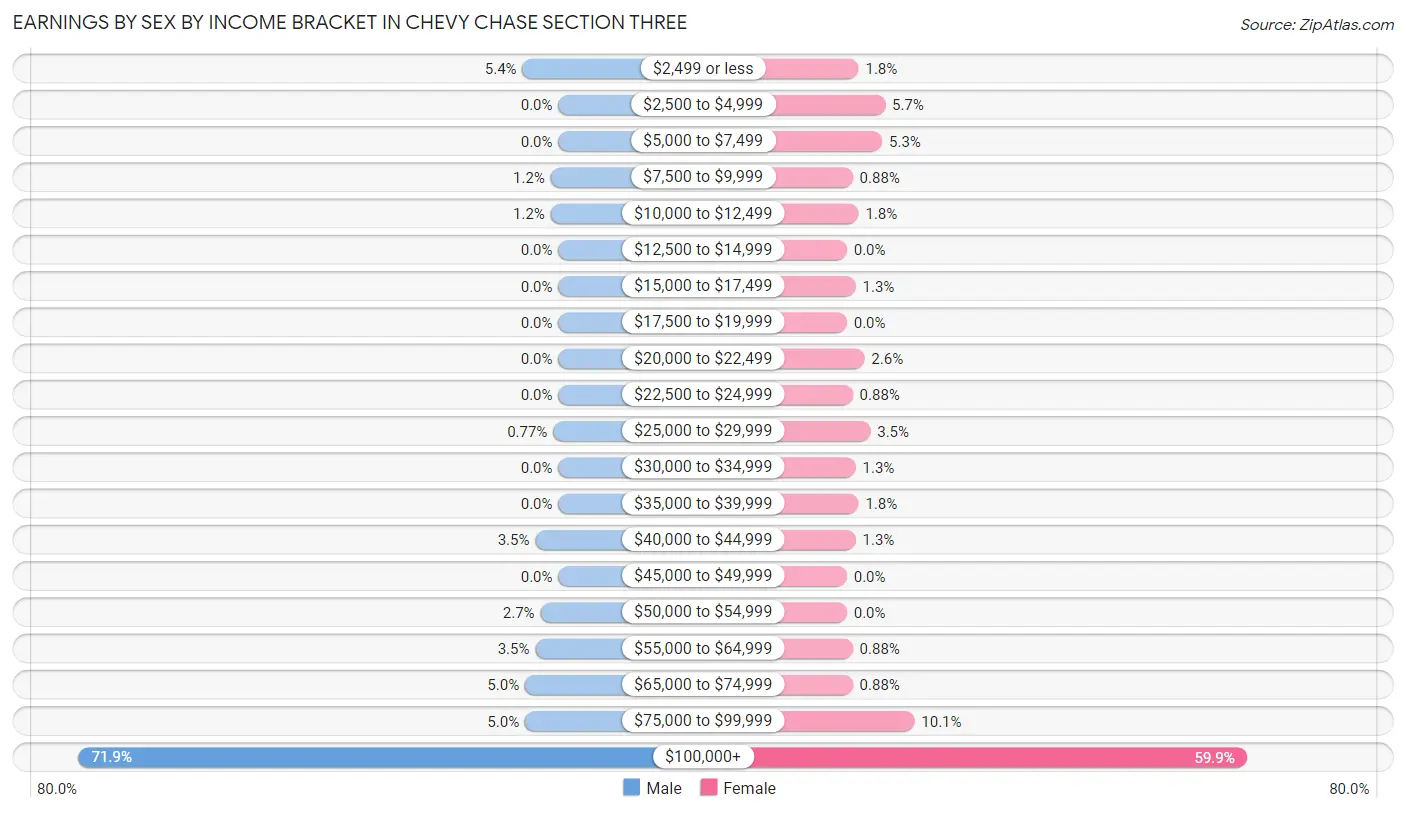
Earnings by Sex by Income Bracket in Chevy Chase Section Three
The most common earnings brackets in Chevy Chase Section Three are $100,000+ for men (187 | 71.9%) and $100,000+ for women (136 | 59.9%).
| Income | Male | Female |
| $2,499 or less | 14 (5.4%) | 4 (1.8%) |
| $2,500 to $4,999 | 0 (0.0%) | 13 (5.7%) |
| $5,000 to $7,499 | 0 (0.0%) | 12 (5.3%) |
| $7,500 to $9,999 | 3 (1.1%) | 2 (0.9%) |
| $10,000 to $12,499 | 3 (1.1%) | 4 (1.8%) |
| $12,500 to $14,999 | 0 (0.0%) | 0 (0.0%) |
| $15,000 to $17,499 | 0 (0.0%) | 3 (1.3%) |
| $17,500 to $19,999 | 0 (0.0%) | 0 (0.0%) |
| $20,000 to $22,499 | 0 (0.0%) | 6 (2.6%) |
| $22,500 to $24,999 | 0 (0.0%) | 2 (0.9%) |
| $25,000 to $29,999 | 2 (0.8%) | 8 (3.5%) |
| $30,000 to $34,999 | 0 (0.0%) | 3 (1.3%) |
| $35,000 to $39,999 | 0 (0.0%) | 4 (1.8%) |
| $40,000 to $44,999 | 9 (3.5%) | 3 (1.3%) |
| $45,000 to $49,999 | 0 (0.0%) | 0 (0.0%) |
| $50,000 to $54,999 | 7 (2.7%) | 0 (0.0%) |
| $55,000 to $64,999 | 9 (3.5%) | 2 (0.9%) |
| $65,000 to $74,999 | 13 (5.0%) | 2 (0.9%) |
| $75,000 to $99,999 | 13 (5.0%) | 23 (10.1%) |
| $100,000+ | 187 (71.9%) | 136 (59.9%) |
| Total | 260 (100.0%) | 227 (100.0%) |
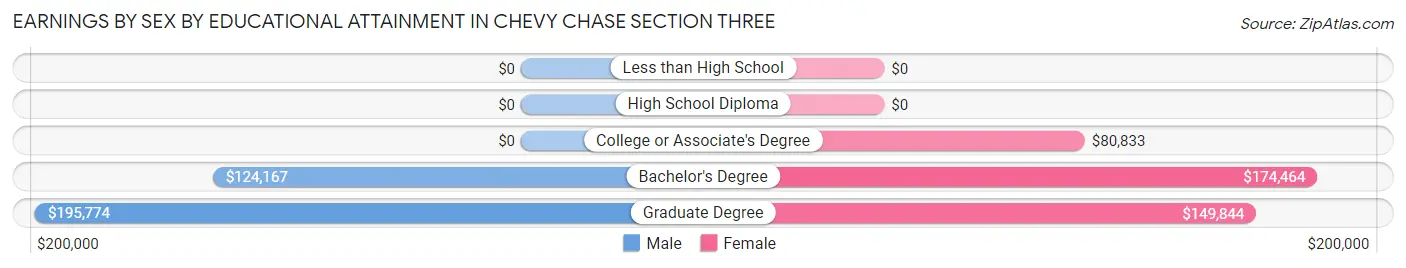
Earnings by Sex by Educational Attainment in Chevy Chase Section Three
Average earnings in Chevy Chase Section Three are $165,000 for men and $160,417 for women, a difference of 2.8%. Men with an educational attainment of graduate degree enjoy the highest average annual earnings of $195,774, while those with bachelor's degree education earn the least with $124,167. Women with an educational attainment of bachelor's degree earn the most with the average annual earnings of $174,464, while those with college or associate's degree education have the smallest earnings of $80,833.
| Educational Attainment | Male Income | Female Income |
| Less than High School | - | - |
| High School Diploma | - | - |
| College or Associate's Degree | - | - |
| Bachelor's Degree | $124,167 | $174,464 |
| Graduate Degree | $195,774 | $149,844 |
| Total | $165,000 | $160,417 |
Family Income in Chevy Chase Section Three
Family Income Brackets in Chevy Chase Section Three
According to the Chevy Chase Section Three family income data, there are 215 families falling into the $200,000+ income range, which is the most common income bracket and makes up 74.7% of all families.
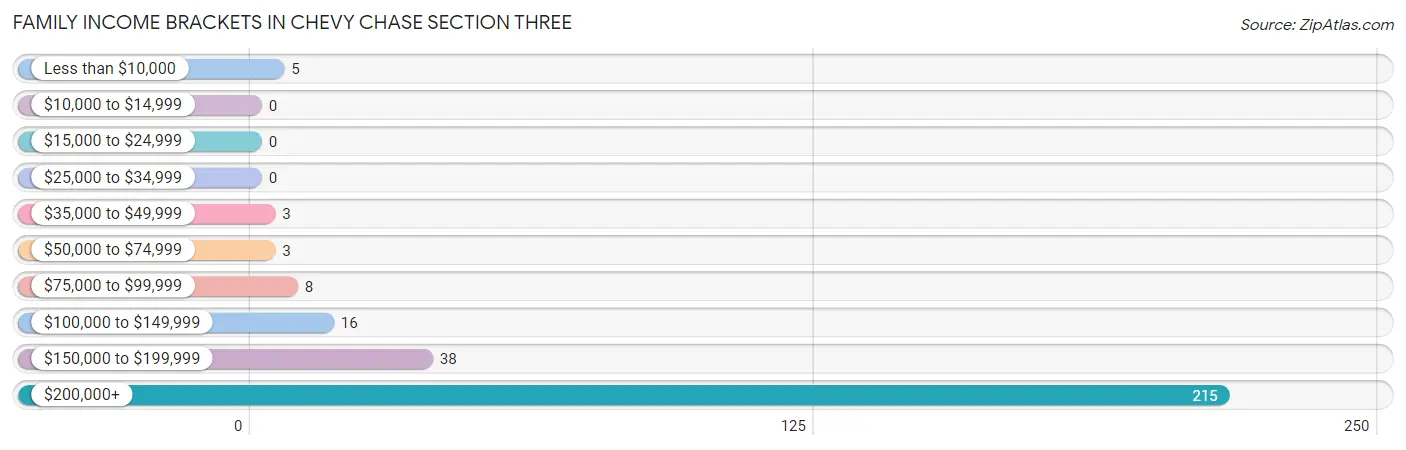
| Income Bracket | # Families | % Families |
| Less than $10,000 | 5 | 1.7% |
| $10,000 to $14,999 | 0 | 0.0% |
| $15,000 to $24,999 | 0 | 0.0% |
| $25,000 to $34,999 | 0 | 0.0% |
| $35,000 to $49,999 | 3 | 1.0% |
| $50,000 to $74,999 | 3 | 1.0% |
| $75,000 to $99,999 | 8 | 2.8% |
| $100,000 to $149,999 | 16 | 5.6% |
| $150,000 to $199,999 | 38 | 13.2% |
| $200,000+ | 215 | 74.7% |
Family Income by Famaliy Size in Chevy Chase Section Three
3-person families (31 | 10.8%) account for the highest median family income in Chevy Chase Section Three with $250,001 per family, while 2-person families (119 | 41.3%) have the highest median income of $117,292 per family member.
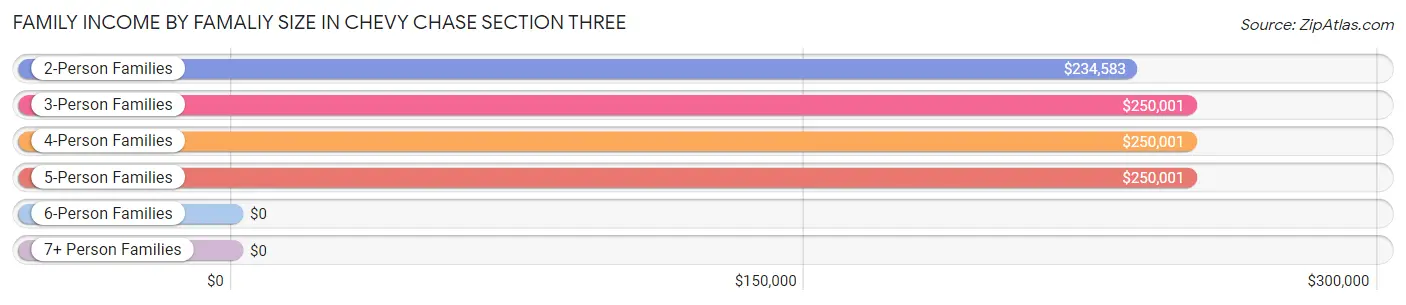
| Income Bracket | # Families | Median Income |
| 2-Person Families | 119 (41.3%) | $234,583 |
| 3-Person Families | 31 (10.8%) | $250,001 |
| 4-Person Families | 88 (30.6%) | $250,001 |
| 5-Person Families | 45 (15.6%) | $250,001 |
| 6-Person Families | 5 (1.7%) | $0 |
| 7+ Person Families | 0 (0.0%) | $0 |
| Total | 288 (100.0%) | $250,001 |
Family Income by Number of Earners in Chevy Chase Section Three
The median family income in Chevy Chase Section Three is $250,001, with families comprising 1 earner (63) having the highest median family income of $250,001, while families with no earners (40) have the lowest median family income of $136,250, accounting for 21.9% and 13.9% of families, respectively.
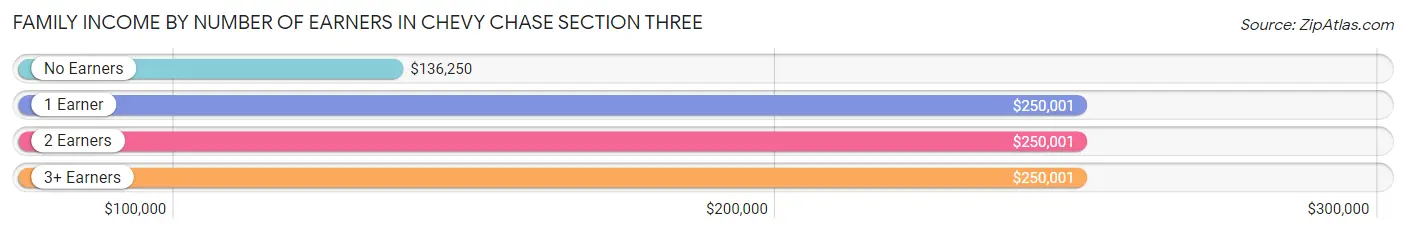
| Number of Earners | # Families | Median Income |
| No Earners | 40 (13.9%) | $136,250 |
| 1 Earner | 63 (21.9%) | $250,001 |
| 2 Earners | 174 (60.4%) | $250,001 |
| 3+ Earners | 11 (3.8%) | $250,001 |
| Total | 288 (100.0%) | $250,001 |
Household Income in Chevy Chase Section Three
Household Income Brackets in Chevy Chase Section Three
With 224 households falling in the category, the $200,000+ income range is the most frequent in Chevy Chase Section Three, accounting for 71.3% of all households.
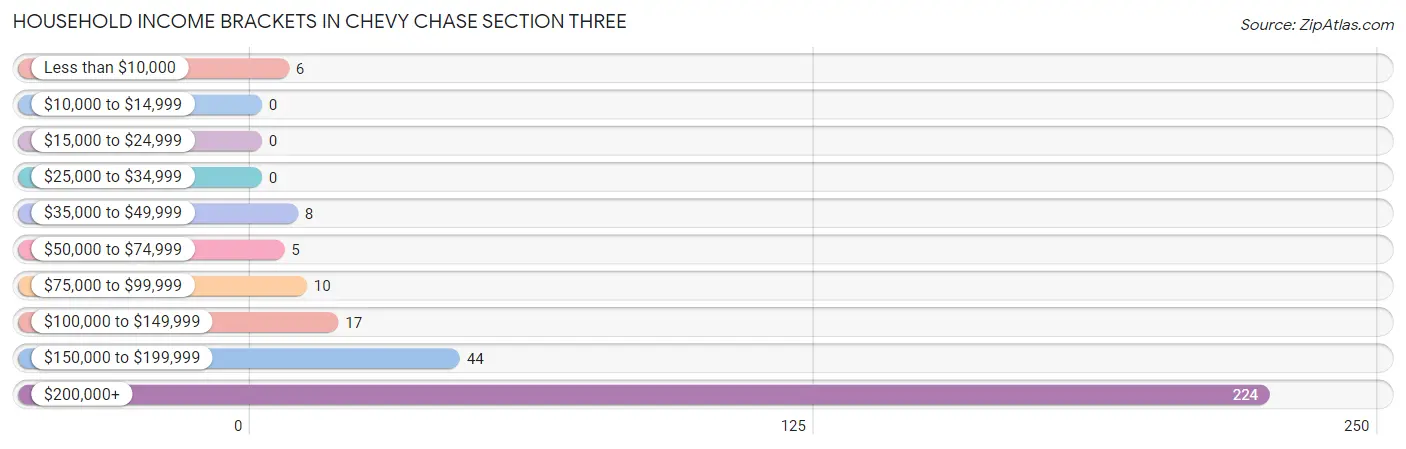
| Income Bracket | # Households | % Households |
| Less than $10,000 | 6 | 1.9% |
| $10,000 to $14,999 | 0 | 0.0% |
| $15,000 to $24,999 | 0 | 0.0% |
| $25,000 to $34,999 | 0 | 0.0% |
| $35,000 to $49,999 | 8 | 2.5% |
| $50,000 to $74,999 | 5 | 1.6% |
| $75,000 to $99,999 | 10 | 3.2% |
| $100,000 to $149,999 | 17 | 5.4% |
| $150,000 to $199,999 | 44 | 14.0% |
| $200,000+ | 224 | 71.3% |
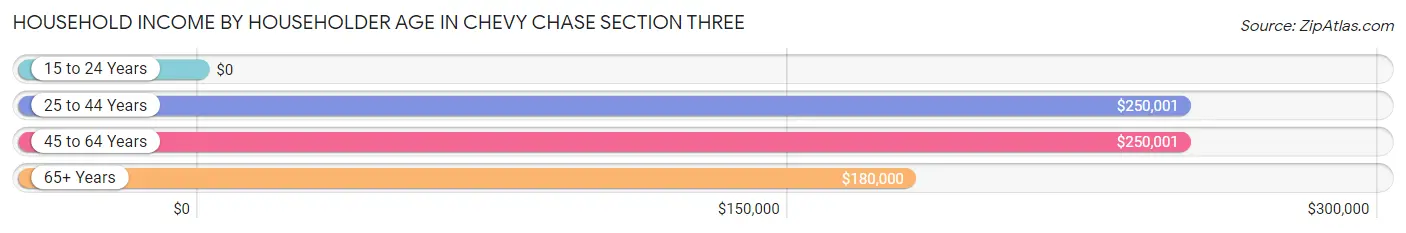
Household Income by Householder Age in Chevy Chase Section Three
The median household income in Chevy Chase Section Three is $250,001, with the highest median household income of $250,001 found in the 25 to 44 years age bracket for the primary householder. A total of 55 households (17.5%) fall into this category.
| Income Bracket | # Households | Median Income |
| 15 to 24 Years | 0 (0.0%) | $0 |
| 25 to 44 Years | 55 (17.5%) | $250,001 |
| 45 to 64 Years | 153 (48.7%) | $250,001 |
| 65+ Years | 106 (33.8%) | $180,000 |
| Total | 314 (100.0%) | $250,001 |
Poverty in Chevy Chase Section Three
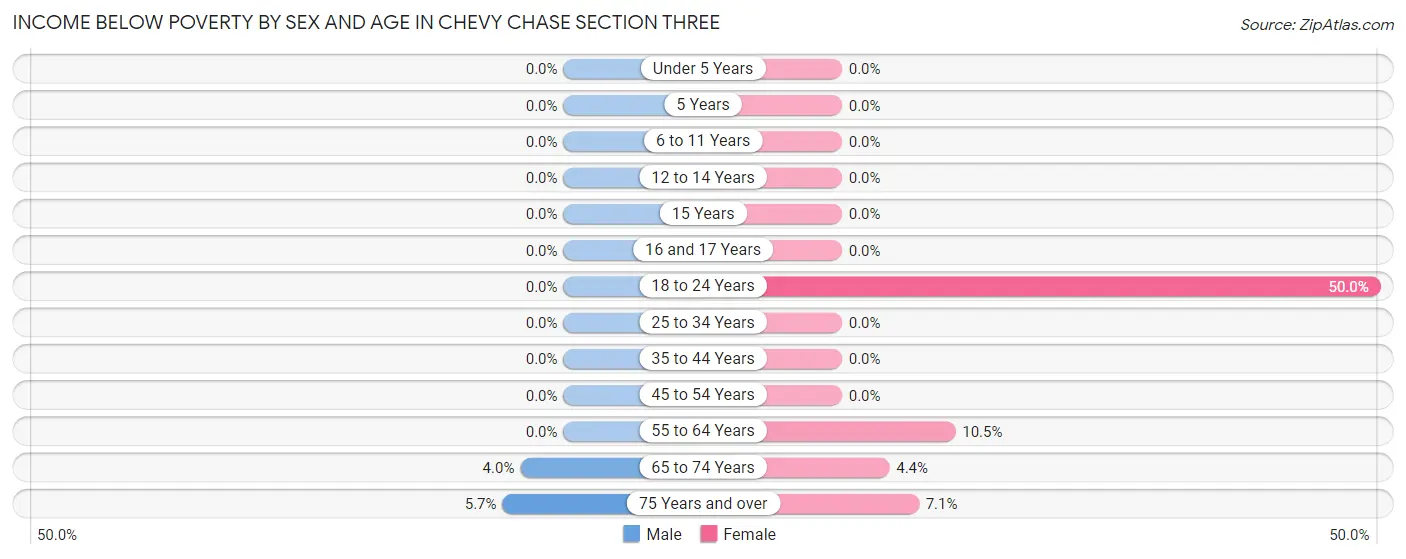
Income Below Poverty by Sex and Age in Chevy Chase Section Three
With 1.0% poverty level for males and 4.0% for females among the residents of Chevy Chase Section Three, 75 year old and over males and 18 to 24 year old females are the most vulnerable to poverty, with 3 males (5.7%) and 10 females (50.0%) in their respective age groups living below the poverty level.
| Age Bracket | Male | Female |
| Under 5 Years | 0 (0.0%) | 0 (0.0%) |
| 5 Years | 0 (0.0%) | 0 (0.0%) |
| 6 to 11 Years | 0 (0.0%) | 0 (0.0%) |
| 12 to 14 Years | 0 (0.0%) | 0 (0.0%) |
| 15 Years | 0 (0.0%) | 0 (0.0%) |
| 16 and 17 Years | 0 (0.0%) | 0 (0.0%) |
| 18 to 24 Years | 0 (0.0%) | 10 (50.0%) |
| 25 to 34 Years | 0 (0.0%) | 0 (0.0%) |
| 35 to 44 Years | 0 (0.0%) | 0 (0.0%) |
| 45 to 54 Years | 0 (0.0%) | 0 (0.0%) |
| 55 to 64 Years | 0 (0.0%) | 6 (10.5%) |
| 65 to 74 Years | 2 (4.0%) | 3 (4.4%) |
| 75 Years and over | 3 (5.7%) | 3 (7.1%) |
| Total | 5 (1.0%) | 22 (4.0%) |
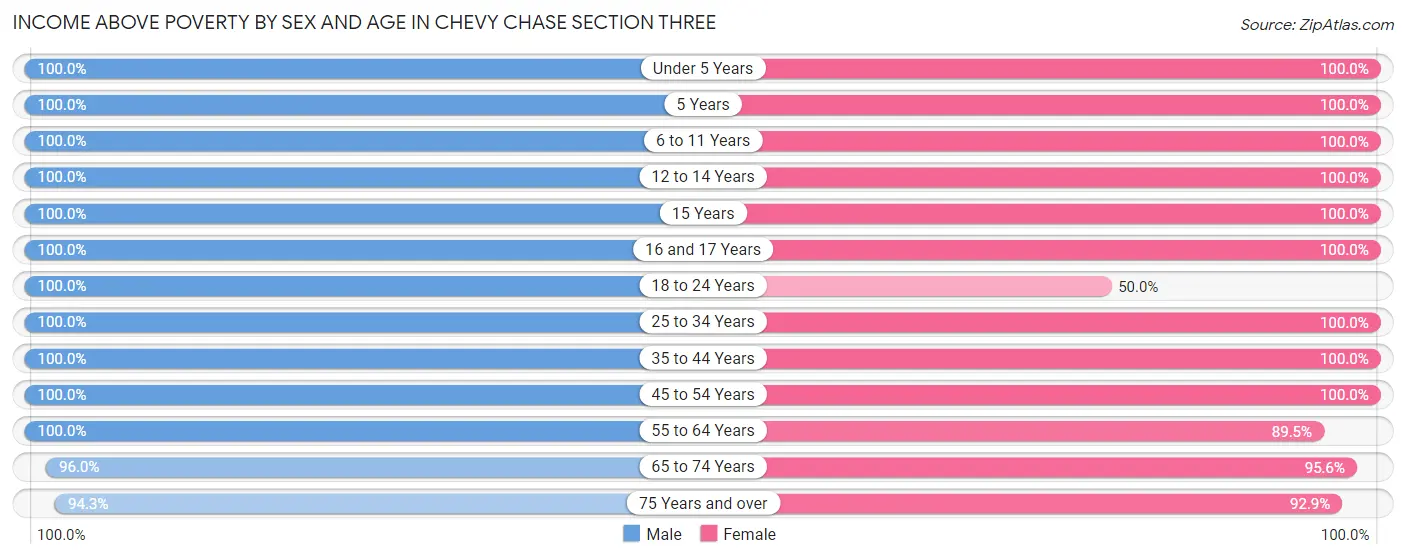
Income Above Poverty by Sex and Age in Chevy Chase Section Three
According to the poverty statistics in Chevy Chase Section Three, males aged under 5 years and females aged under 5 years are the age groups that are most secure financially, with 100.0% of males and 100.0% of females in these age groups living above the poverty line.
| Age Bracket | Male | Female |
| Under 5 Years | 43 (100.0%) | 14 (100.0%) |
| 5 Years | 2 (100.0%) | 7 (100.0%) |
| 6 to 11 Years | 35 (100.0%) | 101 (100.0%) |
| 12 to 14 Years | 55 (100.0%) | 56 (100.0%) |
| 15 Years | 3 (100.0%) | 13 (100.0%) |
| 16 and 17 Years | 19 (100.0%) | 2 (100.0%) |
| 18 to 24 Years | 11 (100.0%) | 10 (50.0%) |
| 25 to 34 Years | 25 (100.0%) | 15 (100.0%) |
| 35 to 44 Years | 49 (100.0%) | 44 (100.0%) |
| 45 to 54 Years | 90 (100.0%) | 106 (100.0%) |
| 55 to 64 Years | 45 (100.0%) | 51 (89.5%) |
| 65 to 74 Years | 48 (96.0%) | 65 (95.6%) |
| 75 Years and over | 50 (94.3%) | 39 (92.9%) |
| Total | 475 (99.0%) | 523 (96.0%) |
Income Below Poverty Among Married-Couple Families in Chevy Chase Section Three
The poverty statistics for married-couple families in Chevy Chase Section Three show that 0.8% or 2 of the total 263 families live below the poverty line. Families with no children have the highest poverty rate of 1.8%, comprising of 2 families. On the other hand, families with 1 or 2 children have the lowest poverty rate of 0.0%, which includes 0 families.
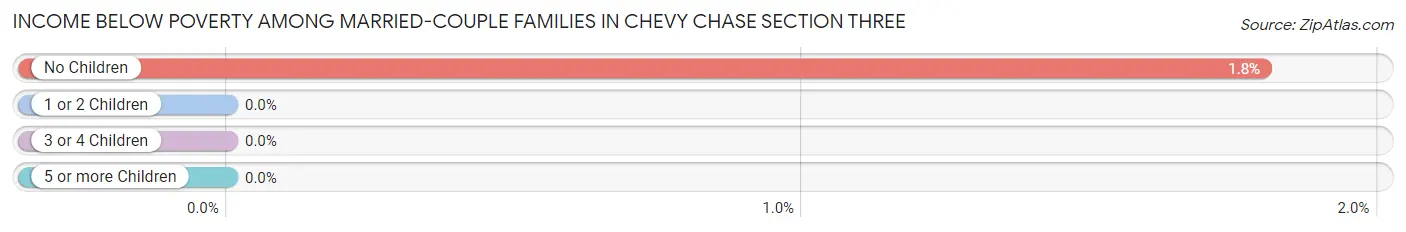
| Children | Above Poverty | Below Poverty |
| No Children | 109 (98.2%) | 2 (1.8%) |
| 1 or 2 Children | 104 (100.0%) | 0 (0.0%) |
| 3 or 4 Children | 48 (100.0%) | 0 (0.0%) |
| 5 or more Children | 0 (0.0%) | 0 (0.0%) |
| Total | 261 (99.2%) | 2 (0.8%) |
Income Below Poverty Among Single-Parent Households in Chevy Chase Section Three
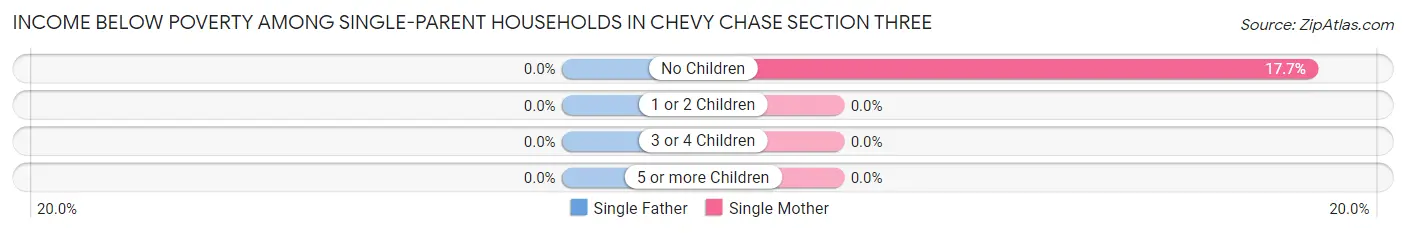
| Children | Single Father | Single Mother |
| No Children | 0 (0.0%) | 3 (17.6%) |
| 1 or 2 Children | 0 (0.0%) | 0 (0.0%) |
| 3 or 4 Children | 0 (0.0%) | 0 (0.0%) |
| 5 or more Children | 0 (0.0%) | 0 (0.0%) |
| Total | 0 (0.0%) | 3 (15.0%) |
Income Below Poverty Among Married-Couple vs Single-Parent Households in Chevy Chase Section Three
The poverty data for Chevy Chase Section Three shows that 2 of the married-couple family households (0.8%) and 3 of the single-parent households (12.0%) are living below the poverty level. Within the married-couple family households, those with no children have the highest poverty rate, with 2 households (1.8%) falling below the poverty line. Among the single-parent households, those with no children have the highest poverty rate, with 3 household (15.0%) living below poverty.
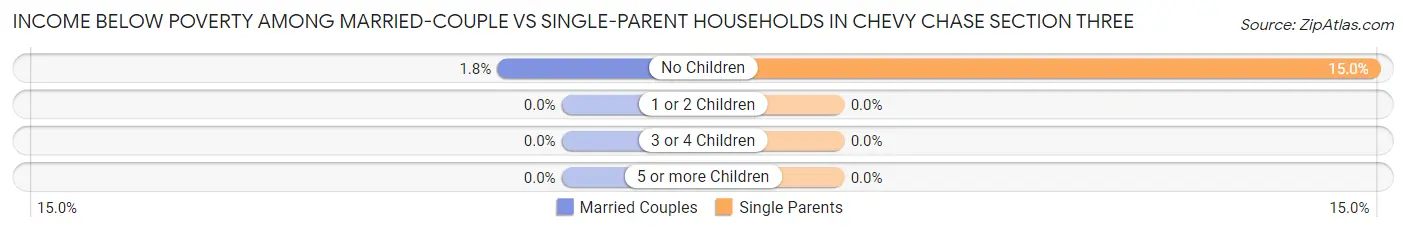
| Children | Married-Couple Families | Single-Parent Households |
| No Children | 2 (1.8%) | 3 (15.0%) |
| 1 or 2 Children | 0 (0.0%) | 0 (0.0%) |
| 3 or 4 Children | 0 (0.0%) | 0 (0.0%) |
| 5 or more Children | 0 (0.0%) | 0 (0.0%) |
| Total | 2 (0.8%) | 3 (12.0%) |
Race in Chevy Chase Section Three
The most populous races in Chevy Chase Section Three are White / Caucasian (845 | 82.4%), Two or more Races (136 | 13.3%), and Hispanic or Latino (52 | 5.1%).
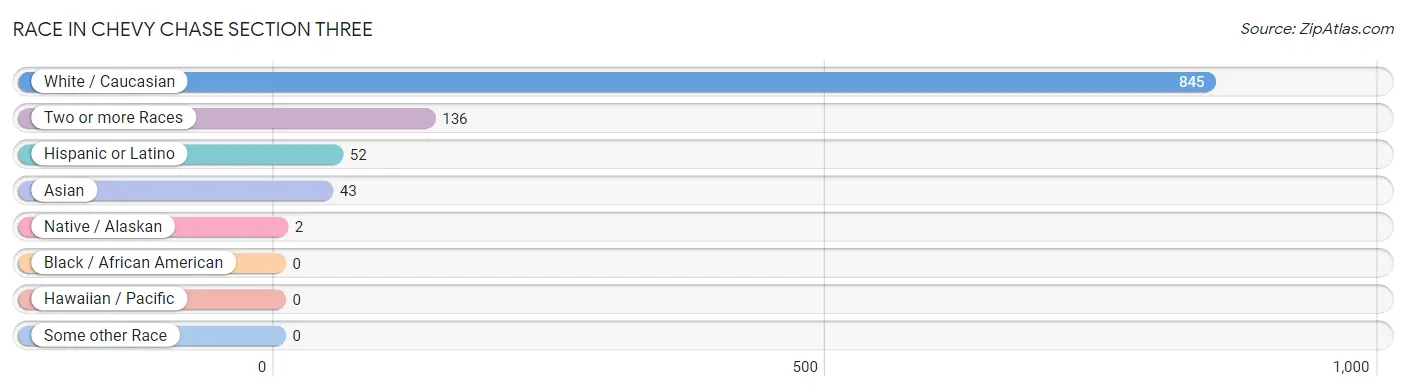
| Race | # Population | % Population |
| Asian | 43 | 4.2% |
| Black / African American | 0 | 0.0% |
| Hawaiian / Pacific | 0 | 0.0% |
| Hispanic or Latino | 52 | 5.1% |
| Native / Alaskan | 2 | 0.2% |
| White / Caucasian | 845 | 82.4% |
| Two or more Races | 136 | 13.3% |
| Some other Race | 0 | 0.0% |
| Total | 1,026 | 100.0% |
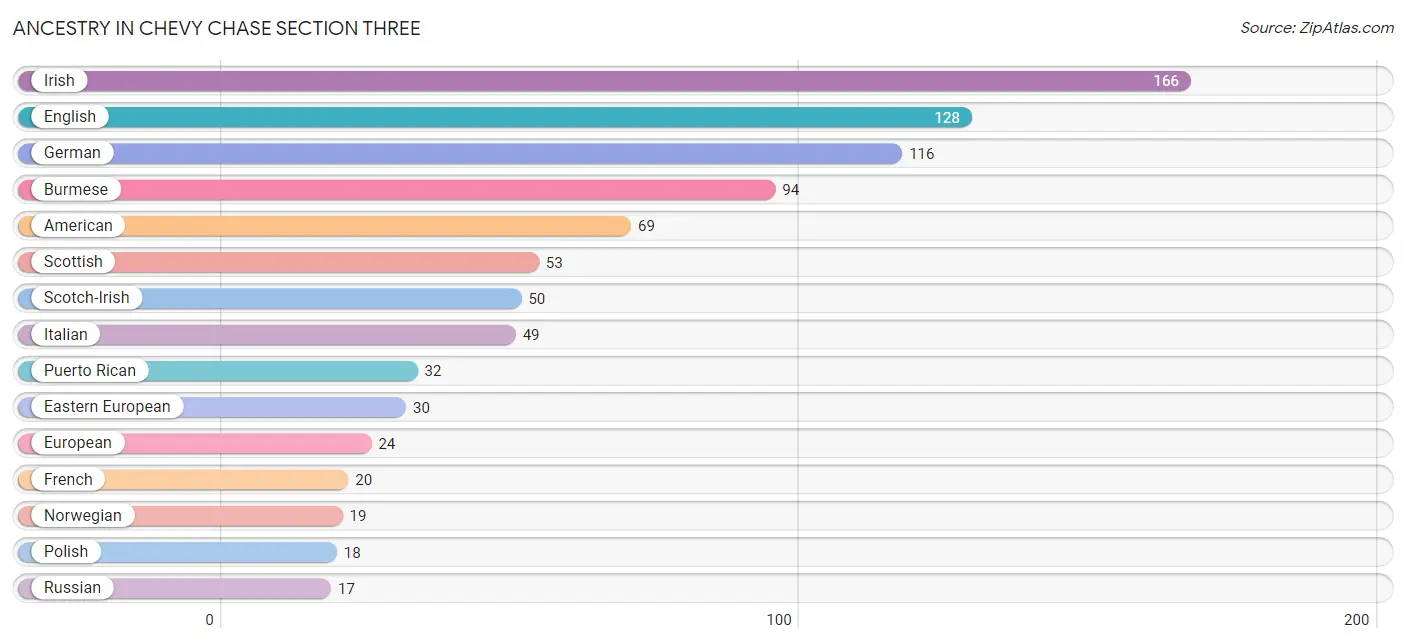
Ancestry in Chevy Chase Section Three
The most populous ancestries reported in Chevy Chase Section Three are Irish (166 | 16.2%), English (128 | 12.5%), German (116 | 11.3%), Burmese (94 | 9.2%), and American (69 | 6.7%), together accounting for 55.9% of all Chevy Chase Section Three residents.
| Ancestry | # Population | % Population |
| Alsatian | 5 | 0.5% |
| American | 69 | 6.7% |
| Arab | 10 | 1.0% |
| Armenian | 4 | 0.4% |
| Australian | 5 | 0.5% |
| Austrian | 1 | 0.1% |
| Brazilian | 4 | 0.4% |
| British | 11 | 1.1% |
| Burmese | 94 | 9.2% |
| Canadian | 4 | 0.4% |
| Celtic | 2 | 0.2% |
| Colombian | 8 | 0.8% |
| Czech | 7 | 0.7% |
| Czechoslovakian | 2 | 0.2% |
| Eastern European | 30 | 2.9% |
| Egyptian | 6 | 0.6% |
| English | 128 | 12.5% |
| European | 24 | 2.3% |
| French | 20 | 1.9% |
| French Canadian | 6 | 0.6% |
| German | 116 | 11.3% |
| Hungarian | 2 | 0.2% |
| Icelander | 3 | 0.3% |
| Iranian | 14 | 1.4% |
| Irish | 166 | 16.2% |
| Israeli | 7 | 0.7% |
| Italian | 49 | 4.8% |
| Korean | 15 | 1.5% |
| Lebanese | 1 | 0.1% |
| Mexican | 8 | 0.8% |
| Norwegian | 19 | 1.8% |
| Peruvian | 2 | 0.2% |
| Polish | 18 | 1.8% |
| Puerto Rican | 32 | 3.1% |
| Russian | 17 | 1.7% |
| Scandinavian | 3 | 0.3% |
| Scotch-Irish | 50 | 4.9% |
| Scottish | 53 | 5.2% |
| South American | 10 | 1.0% |
| South American Indian | 2 | 0.2% |
| Spanish | 2 | 0.2% |
| Swedish | 4 | 0.4% |
| Swiss | 13 | 1.3% |
| Thai | 9 | 0.9% |
| Trinidadian and Tobagonian | 7 | 0.7% |
| Ukrainian | 5 | 0.5% |
| Welsh | 15 | 1.5% | View All 47 Rows |
Immigrants in Chevy Chase Section Three
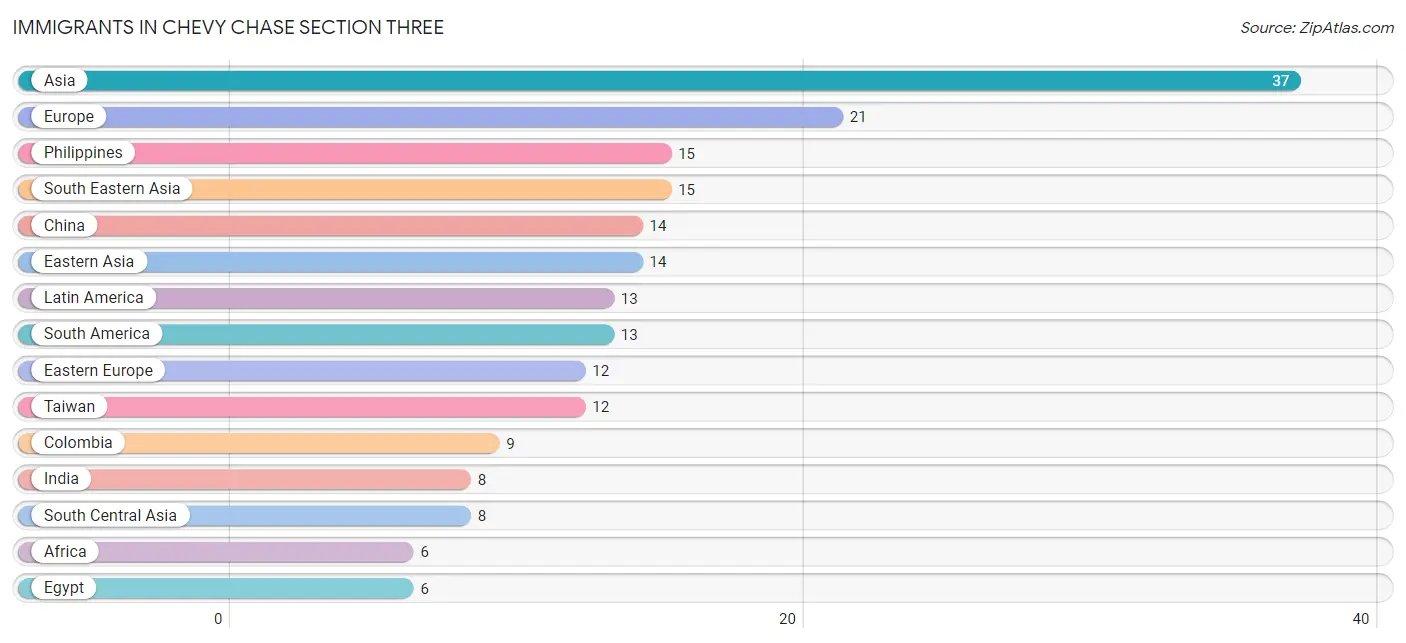
The most numerous immigrant groups reported in Chevy Chase Section Three came from Asia (37 | 3.6%), Europe (21 | 2.1%), Philippines (15 | 1.5%), South Eastern Asia (15 | 1.5%), and China (14 | 1.4%), together accounting for 9.9% of all Chevy Chase Section Three residents.
| Immigration Origin | # Population | % Population |
| Africa | 6 | 0.6% |
| Asia | 37 | 3.6% |
| Australia | 2 | 0.2% |
| Austria | 2 | 0.2% |
| Brazil | 4 | 0.4% |
| China | 14 | 1.4% |
| Colombia | 9 | 0.9% |
| Czechoslovakia | 3 | 0.3% |
| Eastern Asia | 14 | 1.4% |
| Eastern Europe | 12 | 1.2% |
| Egypt | 6 | 0.6% |
| Europe | 21 | 2.1% |
| Germany | 2 | 0.2% |
| Hong Kong | 2 | 0.2% |
| India | 8 | 0.8% |
| Latin America | 13 | 1.3% |
| Northern Africa | 6 | 0.6% |
| Northern Europe | 3 | 0.3% |
| Oceania | 2 | 0.2% |
| Philippines | 15 | 1.5% |
| Poland | 4 | 0.4% |
| Russia | 5 | 0.5% |
| South America | 13 | 1.3% |
| South Central Asia | 8 | 0.8% |
| South Eastern Asia | 15 | 1.5% |
| Switzerland | 2 | 0.2% |
| Taiwan | 12 | 1.2% |
| Western Europe | 6 | 0.6% | View All 28 Rows |
Sex and Age in Chevy Chase Section Three
Sex and Age in Chevy Chase Section Three
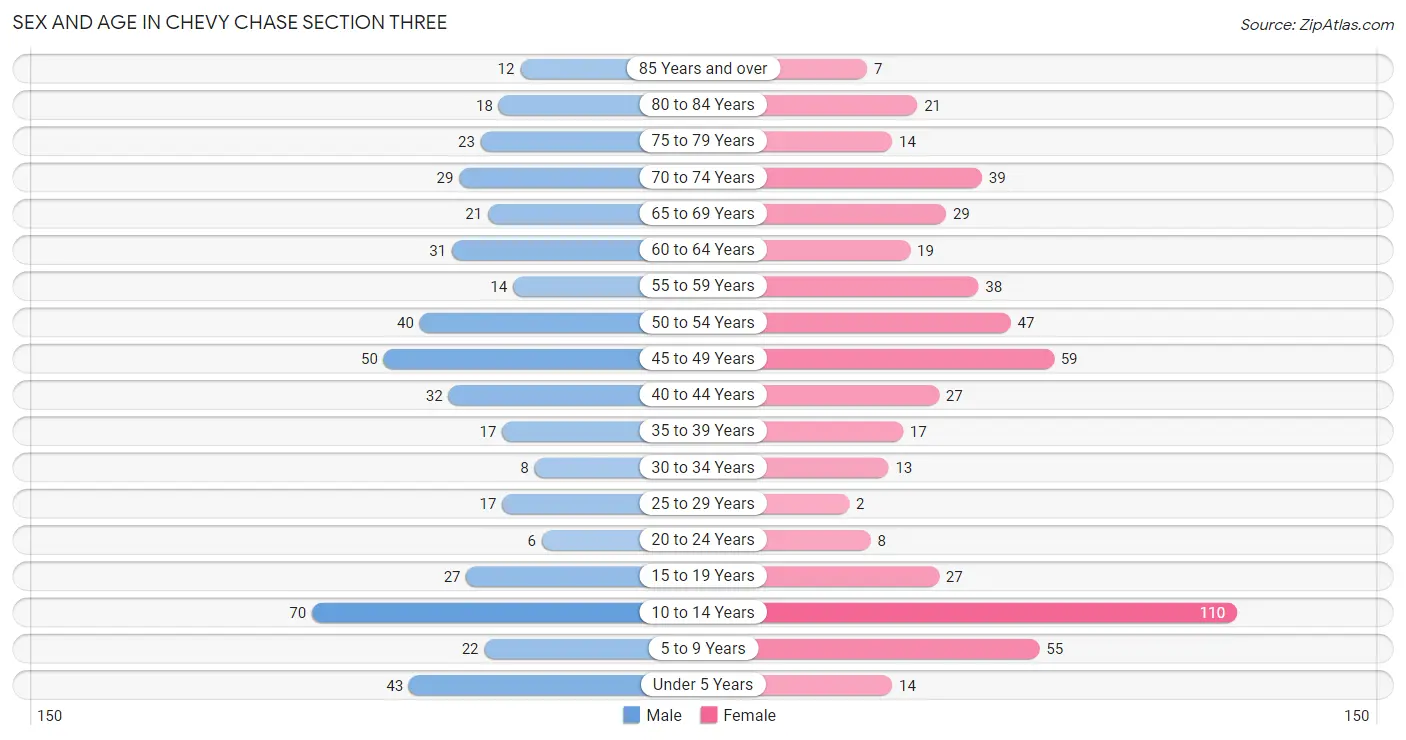
The most populous age groups in Chevy Chase Section Three are 10 to 14 Years (70 | 14.6%) for men and 10 to 14 Years (110 | 20.2%) for women.
| Age Bracket | Male | Female |
| Under 5 Years | 43 (9.0%) | 14 (2.6%) |
| 5 to 9 Years | 22 (4.6%) | 55 (10.1%) |
| 10 to 14 Years | 70 (14.6%) | 110 (20.2%) |
| 15 to 19 Years | 27 (5.6%) | 27 (5.0%) |
| 20 to 24 Years | 6 (1.3%) | 8 (1.5%) |
| 25 to 29 Years | 17 (3.5%) | 2 (0.4%) |
| 30 to 34 Years | 8 (1.7%) | 13 (2.4%) |
| 35 to 39 Years | 17 (3.5%) | 17 (3.1%) |
| 40 to 44 Years | 32 (6.7%) | 27 (5.0%) |
| 45 to 49 Years | 50 (10.4%) | 59 (10.8%) |
| 50 to 54 Years | 40 (8.3%) | 47 (8.6%) |
| 55 to 59 Years | 14 (2.9%) | 38 (7.0%) |
| 60 to 64 Years | 31 (6.5%) | 19 (3.5%) |
| 65 to 69 Years | 21 (4.4%) | 29 (5.3%) |
| 70 to 74 Years | 29 (6.0%) | 39 (7.1%) |
| 75 to 79 Years | 23 (4.8%) | 14 (2.6%) |
| 80 to 84 Years | 18 (3.7%) | 21 (3.8%) |
| 85 Years and over | 12 (2.5%) | 7 (1.3%) |
| Total | 480 (100.0%) | 546 (100.0%) |
Families and Households in Chevy Chase Section Three
Median Family Size in Chevy Chase Section Three
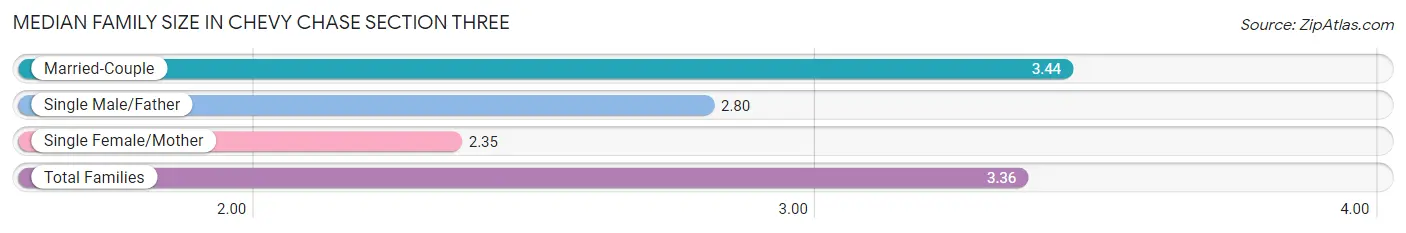
The median family size in Chevy Chase Section Three is 3.36 persons per family, with married-couple families (263 | 91.3%) accounting for the largest median family size of 3.44 persons per family. On the other hand, single female/mother families (20 | 6.9%) represent the smallest median family size with 2.35 persons per family.
| Family Type | # Families | Family Size |
| Married-Couple | 263 (91.3%) | 3.44 |
| Single Male/Father | 5 (1.7%) | 2.80 |
| Single Female/Mother | 20 (6.9%) | 2.35 |
| Total Families | 288 (100.0%) | 3.36 |
Median Household Size in Chevy Chase Section Three
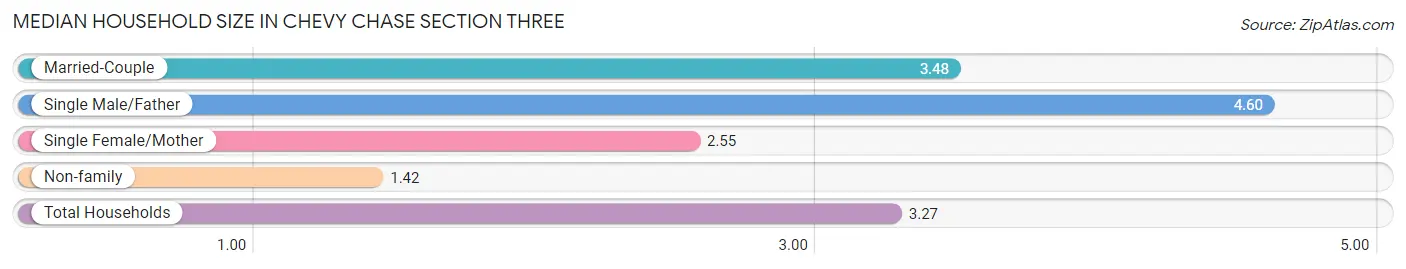
The median household size in Chevy Chase Section Three is 3.27 persons per household, with single male/father households (5 | 1.6%) accounting for the largest median household size of 4.6 persons per household. non-family households (26 | 8.3%) represent the smallest median household size with 1.42 persons per household.
| Household Type | # Households | Household Size |
| Married-Couple | 263 (83.8%) | 3.48 |
| Single Male/Father | 5 (1.6%) | 4.60 |
| Single Female/Mother | 20 (6.4%) | 2.55 |
| Non-family | 26 (8.3%) | 1.42 |
| Total Households | 314 (100.0%) | 3.27 |
Household Size by Marriage Status in Chevy Chase Section Three
Out of a total of 314 households in Chevy Chase Section Three, 288 (91.7%) are family households, while 26 (8.3%) are nonfamily households. The most numerous type of family households are 2-person households, comprising 113, and the most common type of nonfamily households are 1-person households, comprising 21.
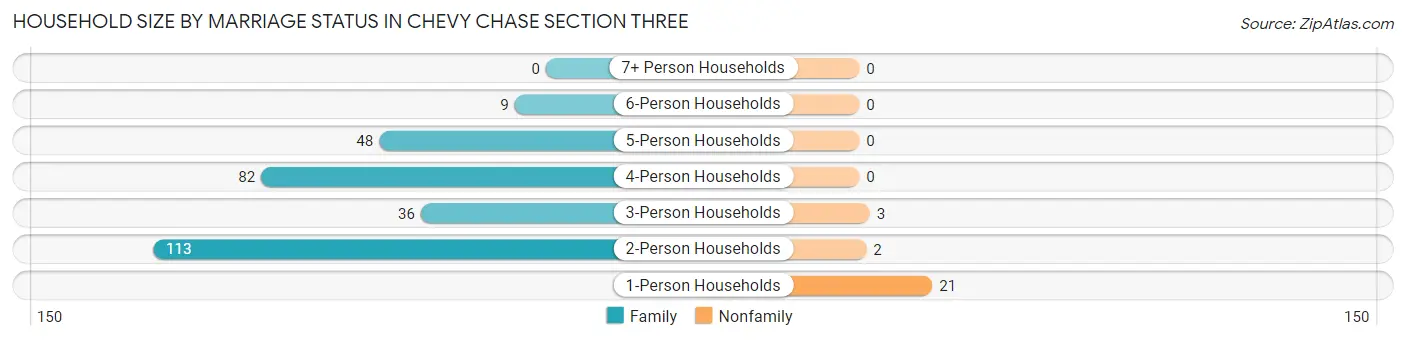
| Household Size | Family Households | Nonfamily Households |
| 1-Person Households | - | 21 (6.7%) |
| 2-Person Households | 113 (36.0%) | 2 (0.6%) |
| 3-Person Households | 36 (11.5%) | 3 (1.0%) |
| 4-Person Households | 82 (26.1%) | 0 (0.0%) |
| 5-Person Households | 48 (15.3%) | 0 (0.0%) |
| 6-Person Households | 9 (2.9%) | 0 (0.0%) |
| 7+ Person Households | 0 (0.0%) | 0 (0.0%) |
| Total | 288 (91.7%) | 26 (8.3%) |
Female Fertility in Chevy Chase Section Three
Fertility by Age in Chevy Chase Section Three
Average fertility rate in Chevy Chase Section Three is 56.0 births per 1,000 women. Women in the age bracket of 20 to 34 years have the highest fertility rate with 261.0 births per 1,000 women. Women in the age bracket of 20 to 34 years acount for 66.7% of all women with births.
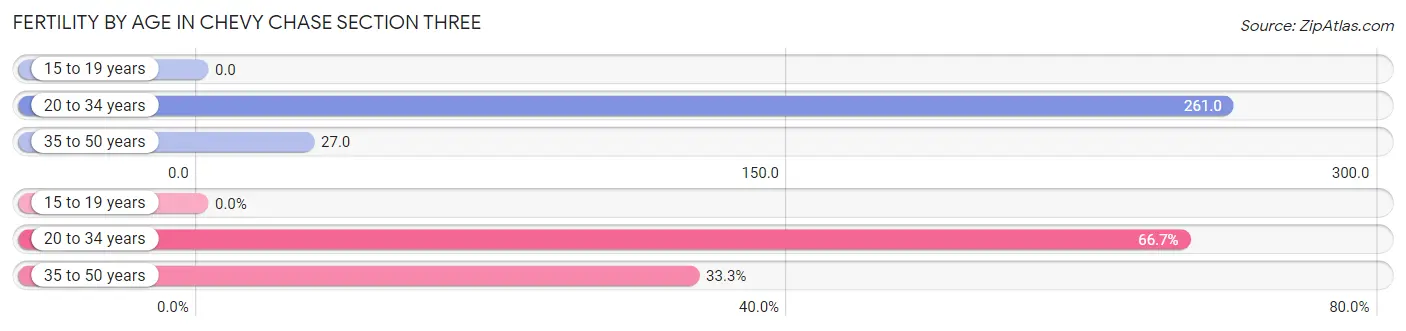
| Age Bracket | Women with Births | Births / 1,000 Women |
| 15 to 19 years | 0 (0.0%) | 0.0 |
| 20 to 34 years | 6 (66.7%) | 261.0 |
| 35 to 50 years | 3 (33.3%) | 27.0 |
| Total | 9 (100.0%) | 56.0 |
Fertility by Age by Marriage Status in Chevy Chase Section Three
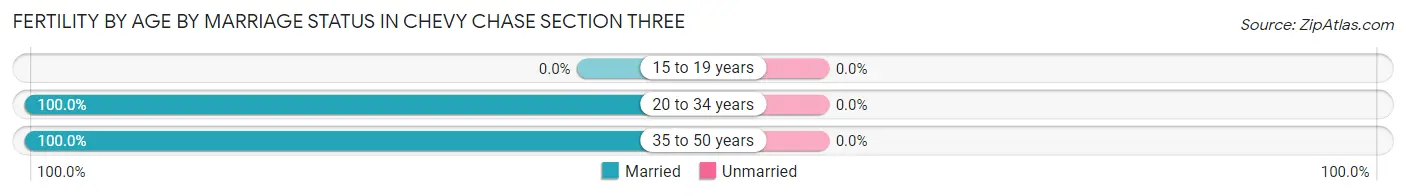
| Age Bracket | Married | Unmarried |
| 15 to 19 years | 0 (0.0%) | 0 (0.0%) |
| 20 to 34 years | 6 (100.0%) | 0 (0.0%) |
| 35 to 50 years | 3 (100.0%) | 0 (0.0%) |
| Total | 9 (100.0%) | 0 (0.0%) |
Fertility by Education in Chevy Chase Section Three
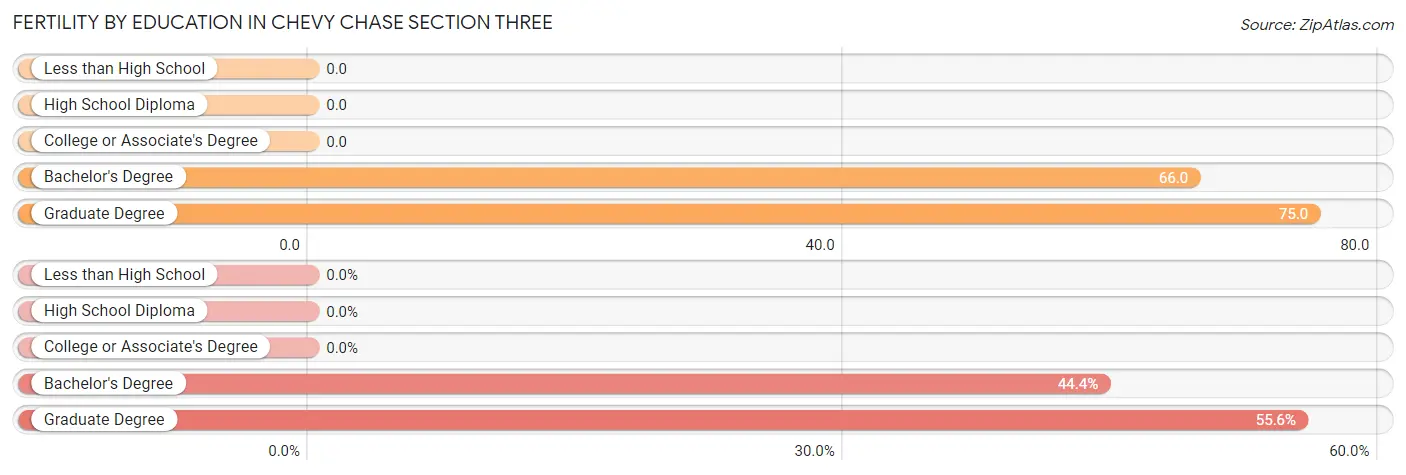
| Educational Attainment | Women with Births | Births / 1,000 Women |
| Less than High School | 0 (0.0%) | 0.0 |
| High School Diploma | 0 (0.0%) | 0.0 |
| College or Associate's Degree | 0 (0.0%) | 0.0 |
| Bachelor's Degree | 4 (44.4%) | 66.0 |
| Graduate Degree | 5 (55.6%) | 75.0 |
| Total | 9 (100.0%) | 56.0 |
Fertility by Education by Marriage Status in Chevy Chase Section Three
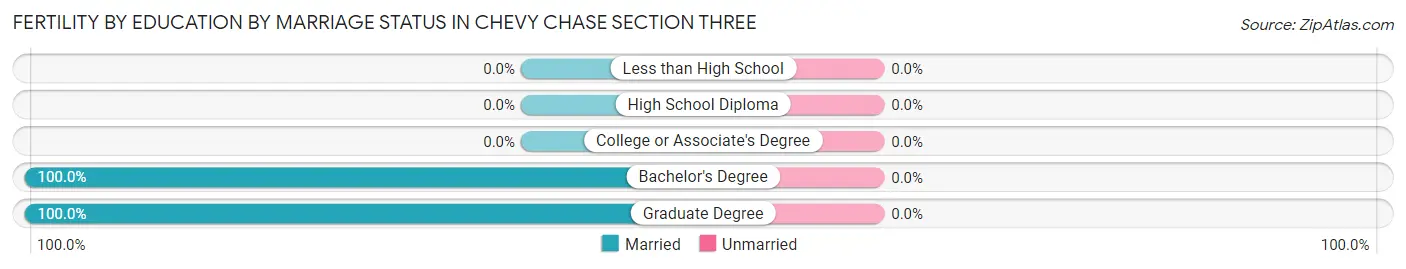
| Educational Attainment | Married | Unmarried |
| Less than High School | 0 (0.0%) | 0 (0.0%) |
| High School Diploma | 0 (0.0%) | 0 (0.0%) |
| College or Associate's Degree | 0 (0.0%) | 0 (0.0%) |
| Bachelor's Degree | 4 (100.0%) | 0 (0.0%) |
| Graduate Degree | 5 (100.0%) | 0 (0.0%) |
| Total | 9 (100.0%) | 0 (0.0%) |
Employment Characteristics in Chevy Chase Section Three
Employment by Class of Employer in Chevy Chase Section Three
Among the 441 employed individuals in Chevy Chase Section Three, private company employees (174 | 39.5%), not-for-profit organizations (95 | 21.5%), and federal government employees (67 | 15.2%) make up the most common classes of employment.
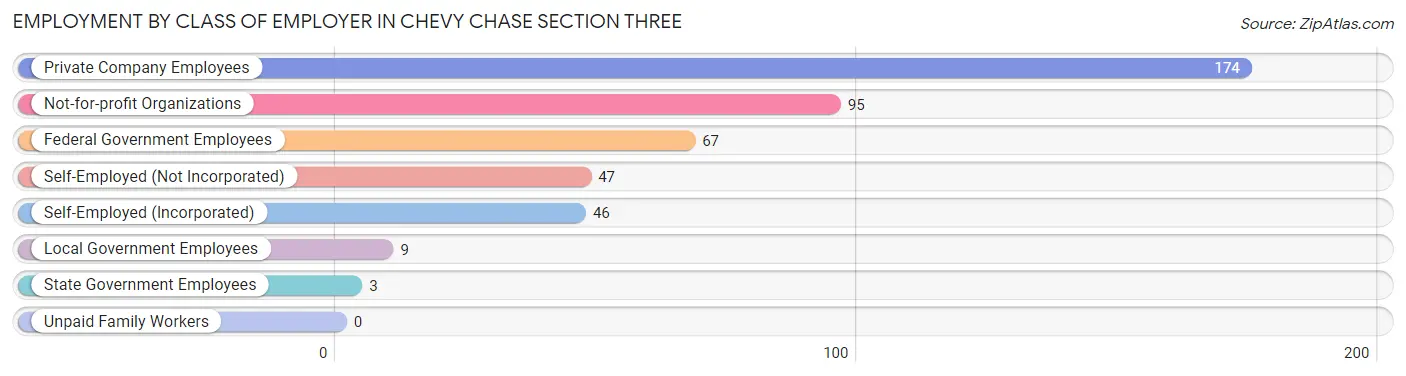
| Employer Class | # Employees | % Employees |
| Private Company Employees | 174 | 39.5% |
| Self-Employed (Incorporated) | 46 | 10.4% |
| Self-Employed (Not Incorporated) | 47 | 10.7% |
| Not-for-profit Organizations | 95 | 21.5% |
| Local Government Employees | 9 | 2.0% |
| State Government Employees | 3 | 0.7% |
| Federal Government Employees | 67 | 15.2% |
| Unpaid Family Workers | 0 | 0.0% |
| Total | 441 | 100.0% |
Employment Status by Age in Chevy Chase Section Three
According to the labor force statistics for Chevy Chase Section Three, out of the total population over 16 years of age (696), 64.7% or 450 individuals are in the labor force, with 0.7% or 3 of them unemployed. The age group with the highest labor force participation rate is 55 to 59 years, with 94.2% or 49 individuals in the labor force. Within the labor force, the 60 to 64 years age range has the highest percentage of unemployed individuals, with 8.6% or 3 of them being unemployed.
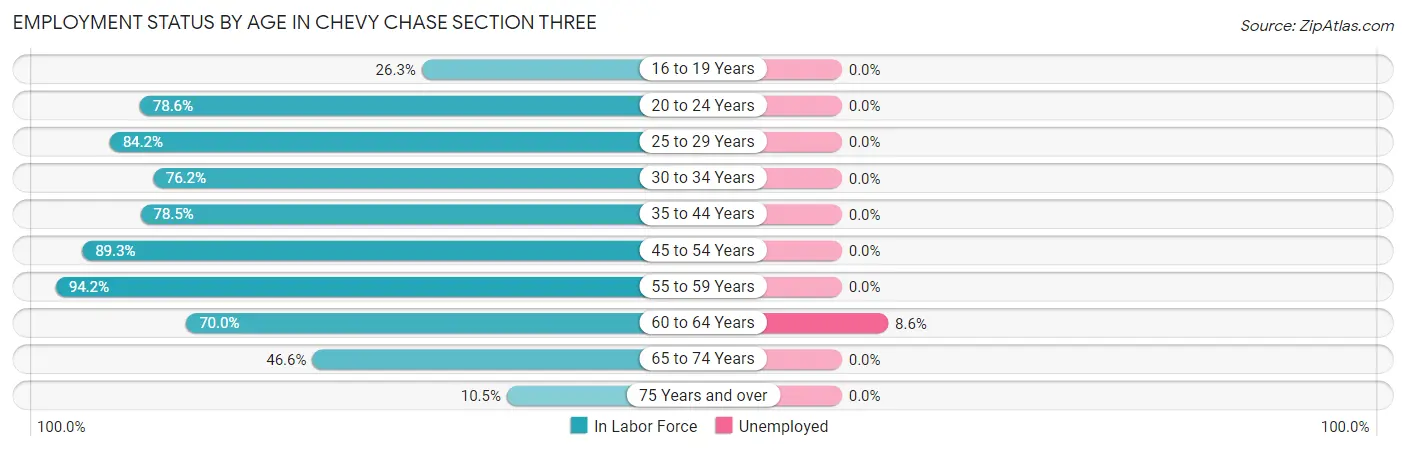
| Age Bracket | In Labor Force | Unemployed |
| 16 to 19 Years | 10 (26.3%) | 0 (0.0%) |
| 20 to 24 Years | 11 (78.6%) | 0 (0.0%) |
| 25 to 29 Years | 16 (84.2%) | 0 (0.0%) |
| 30 to 34 Years | 16 (76.2%) | 0 (0.0%) |
| 35 to 44 Years | 73 (78.5%) | 0 (0.0%) |
| 45 to 54 Years | 175 (89.3%) | 0 (0.0%) |
| 55 to 59 Years | 49 (94.2%) | 0 (0.0%) |
| 60 to 64 Years | 35 (70.0%) | 3 (8.6%) |
| 65 to 74 Years | 55 (46.6%) | 0 (0.0%) |
| 75 Years and over | 10 (10.5%) | 0 (0.0%) |
| Total | 450 (64.7%) | 3 (0.7%) |
Employment Status by Educational Attainment in Chevy Chase Section Three
According to labor force statistics for Chevy Chase Section Three, 84.5% of individuals (364) out of the total population between 25 and 64 years of age (431) are in the labor force, with 0.8% or 3 of them being unemployed. The group with the highest labor force participation rate are those with the educational attainment of high school diploma, with 100.0% or 3 individuals in the labor force. Within the labor force, individuals with bachelor's degree or higher education have the highest percentage of unemployment, with 0.9% or 3 of them being unemployed.
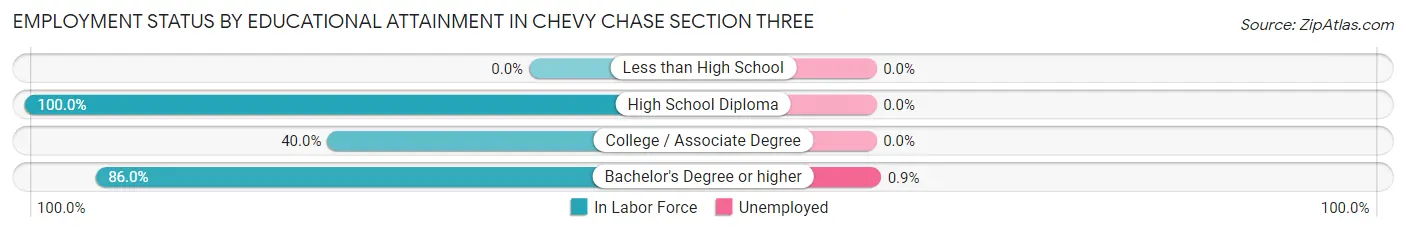
| Educational Attainment | In Labor Force | Unemployed |
| Less than High School | 0 (0.0%) | 0 (0.0%) |
| High School Diploma | 3 (100.0%) | 0 (0.0%) |
| College / Associate Degree | 6 (40.0%) | 0 (0.0%) |
| Bachelor's Degree or higher | 355 (86.0%) | 4 (0.9%) |
| Total | 364 (84.5%) | 3 (0.8%) |
Employment Occupations by Sex in Chevy Chase Section Three
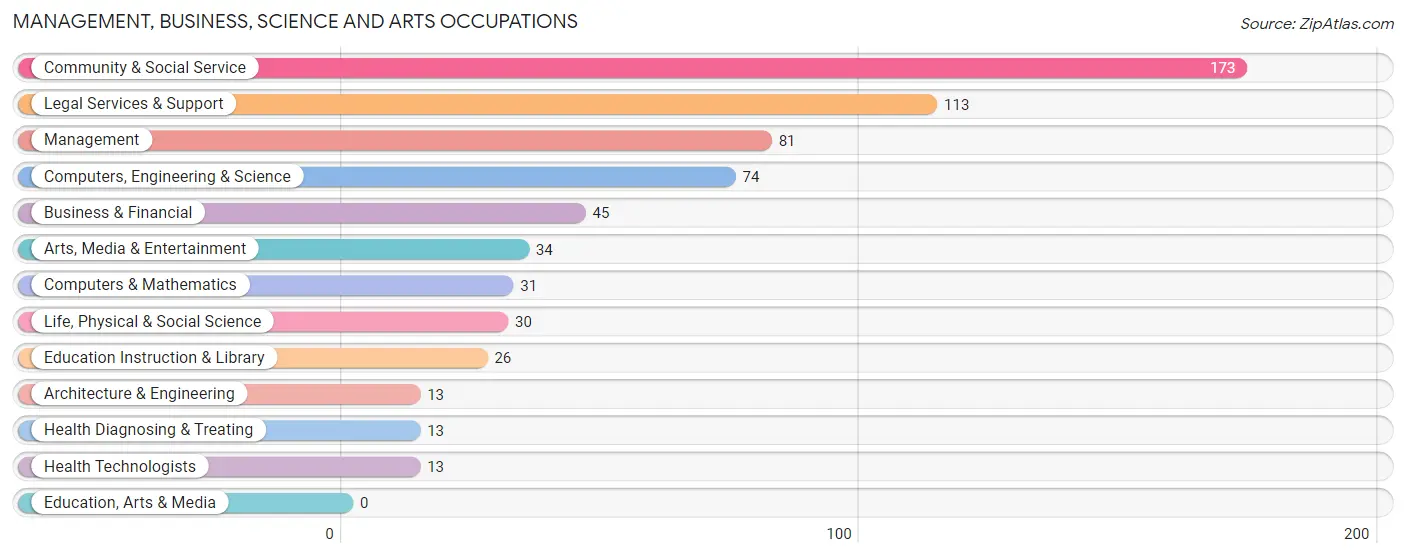
Management, Business, Science and Arts Occupations
The most common Management, Business, Science and Arts occupations in Chevy Chase Section Three are Community & Social Service (173 | 39.0%), Legal Services & Support (113 | 25.5%), Management (81 | 18.2%), Computers, Engineering & Science (74 | 16.7%), and Business & Financial (45 | 10.1%).
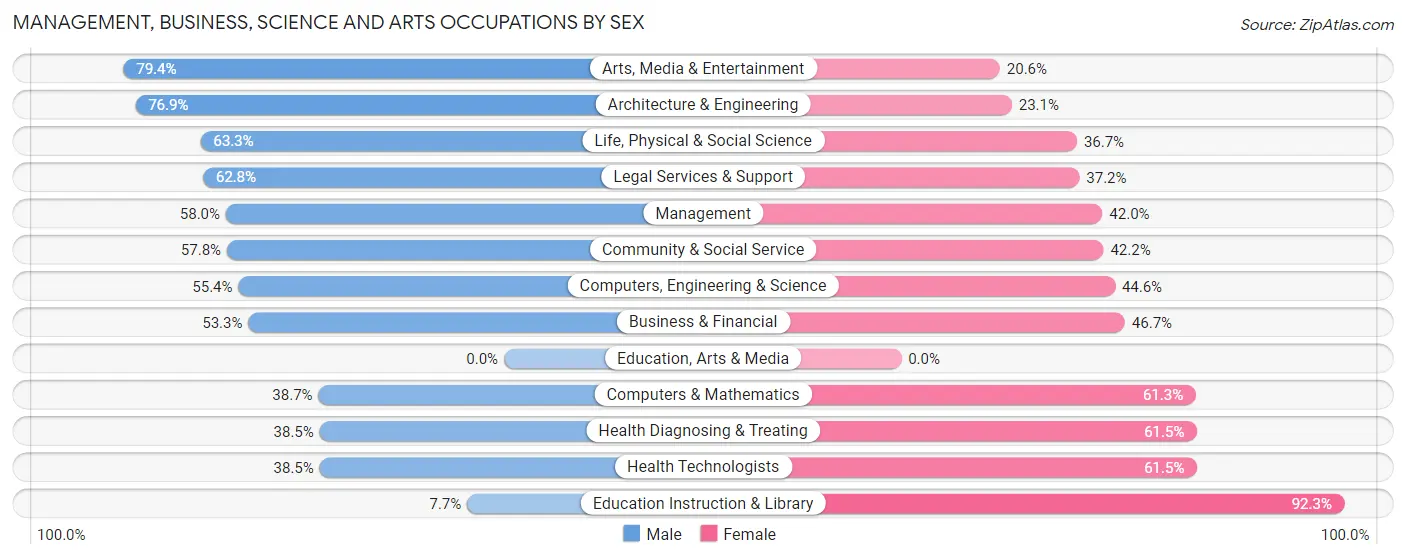
Management, Business, Science and Arts Occupations by Sex
Within the Management, Business, Science and Arts occupations in Chevy Chase Section Three, the most male-oriented occupations are Arts, Media & Entertainment (79.4%), Architecture & Engineering (76.9%), and Life, Physical & Social Science (63.3%), while the most female-oriented occupations are Education Instruction & Library (92.3%), Health Diagnosing & Treating (61.5%), and Health Technologists (61.5%).
| Occupation | Male | Female |
| Management | 47 (58.0%) | 34 (42.0%) |
| Business & Financial | 24 (53.3%) | 21 (46.7%) |
| Computers, Engineering & Science | 41 (55.4%) | 33 (44.6%) |
| Computers & Mathematics | 12 (38.7%) | 19 (61.3%) |
| Architecture & Engineering | 10 (76.9%) | 3 (23.1%) |
| Life, Physical & Social Science | 19 (63.3%) | 11 (36.7%) |
| Community & Social Service | 100 (57.8%) | 73 (42.2%) |
| Education, Arts & Media | 0 (0.0%) | 0 (0.0%) |
| Legal Services & Support | 71 (62.8%) | 42 (37.2%) |
| Education Instruction & Library | 2 (7.7%) | 24 (92.3%) |
| Arts, Media & Entertainment | 27 (79.4%) | 7 (20.6%) |
| Health Diagnosing & Treating | 5 (38.5%) | 8 (61.5%) |
| Health Technologists | 5 (38.5%) | 8 (61.5%) |
| Total (Category) | 217 (56.2%) | 169 (43.8%) |
| Total (Overall) | 242 (54.5%) | 202 (45.5%) |
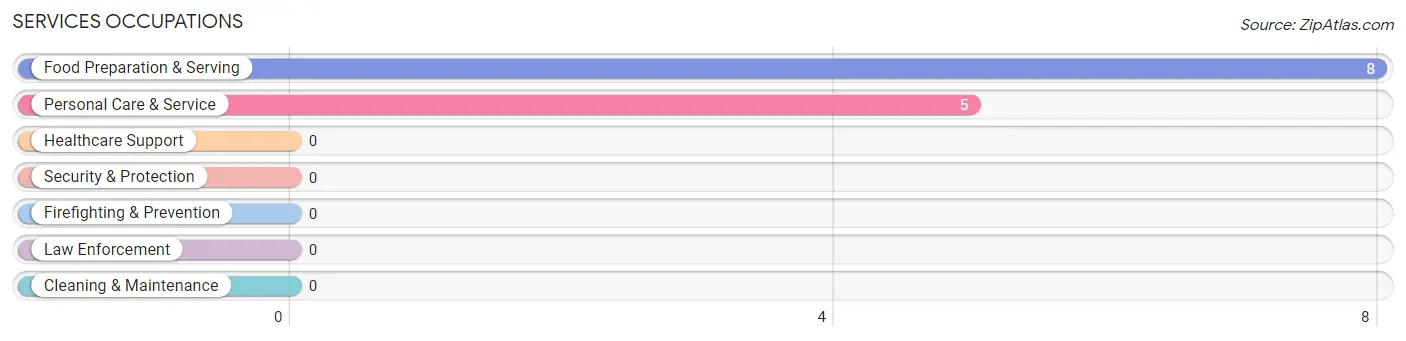
Services Occupations
The most common Services occupations in Chevy Chase Section Three are Food Preparation & Serving (8 | 1.8%), and Personal Care & Service (5 | 1.1%).
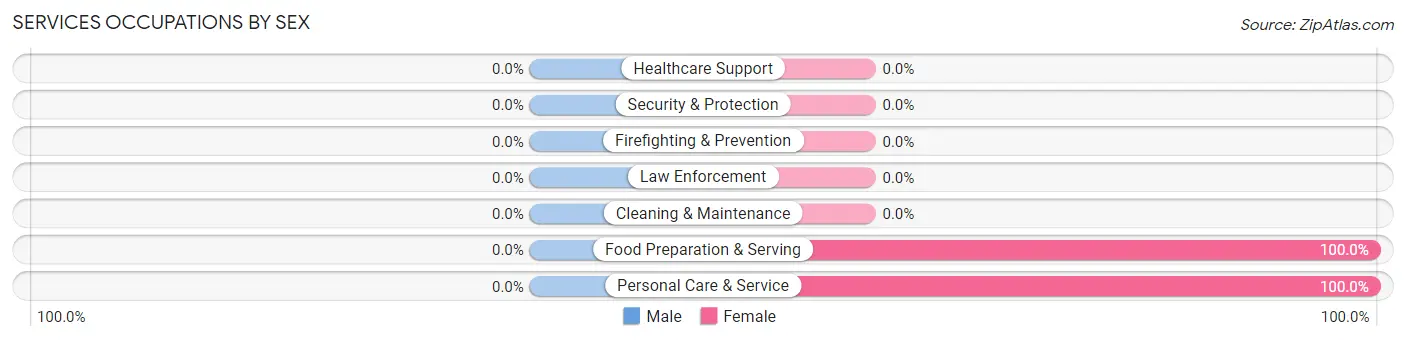
Services Occupations by Sex
| Occupation | Male | Female |
| Healthcare Support | 0 (0.0%) | 0 (0.0%) |
| Security & Protection | 0 (0.0%) | 0 (0.0%) |
| Firefighting & Prevention | 0 (0.0%) | 0 (0.0%) |
| Law Enforcement | 0 (0.0%) | 0 (0.0%) |
| Food Preparation & Serving | 0 (0.0%) | 8 (100.0%) |
| Cleaning & Maintenance | 0 (0.0%) | 0 (0.0%) |
| Personal Care & Service | 0 (0.0%) | 5 (100.0%) |
| Total (Category) | 0 (0.0%) | 13 (100.0%) |
| Total (Overall) | 242 (54.5%) | 202 (45.5%) |
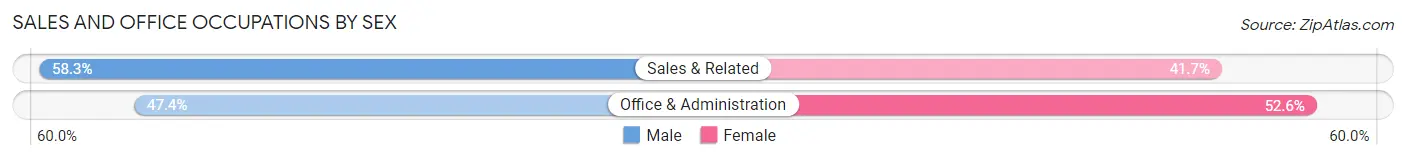
Sales and Office Occupations
The most common Sales and Office occupations in Chevy Chase Section Three are Sales & Related (24 | 5.4%), and Office & Administration (19 | 4.3%).
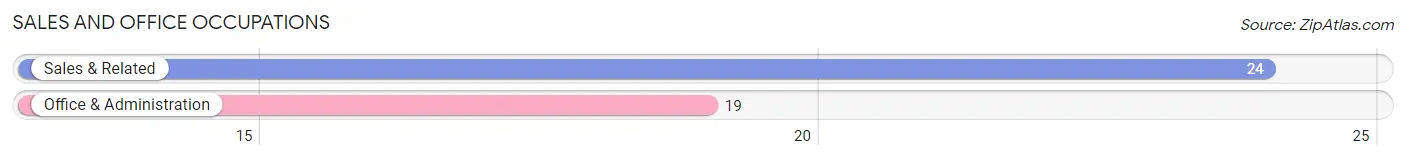
Sales and Office Occupations by Sex
| Occupation | Male | Female |
| Sales & Related | 14 (58.3%) | 10 (41.7%) |
| Office & Administration | 9 (47.4%) | 10 (52.6%) |
| Total (Category) | 23 (53.5%) | 20 (46.5%) |
| Total (Overall) | 242 (54.5%) | 202 (45.5%) |
Natural Resources, Construction and Maintenance Occupations
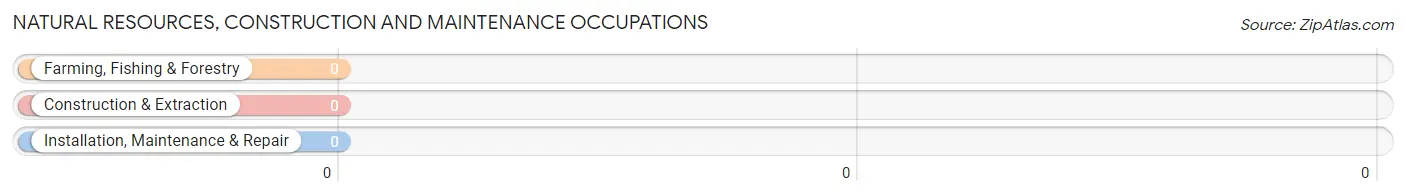
Natural Resources, Construction and Maintenance Occupations by Sex
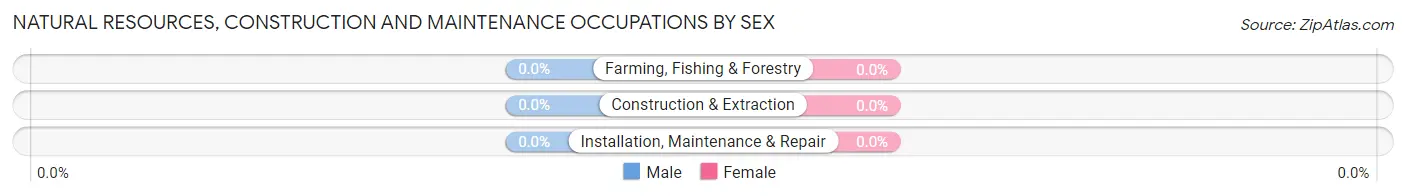
| Occupation | Male | Female |
| Farming, Fishing & Forestry | 0 (0.0%) | 0 (0.0%) |
| Construction & Extraction | 0 (0.0%) | 0 (0.0%) |
| Installation, Maintenance & Repair | 0 (0.0%) | 0 (0.0%) |
| Total (Category) | 0 (0.0%) | 0 (0.0%) |
| Total (Overall) | 242 (54.5%) | 202 (45.5%) |
Production, Transportation and Moving Occupations
The most common Production, Transportation and Moving occupations in Chevy Chase Section Three are , and Material Moving (2 | 0.4%).
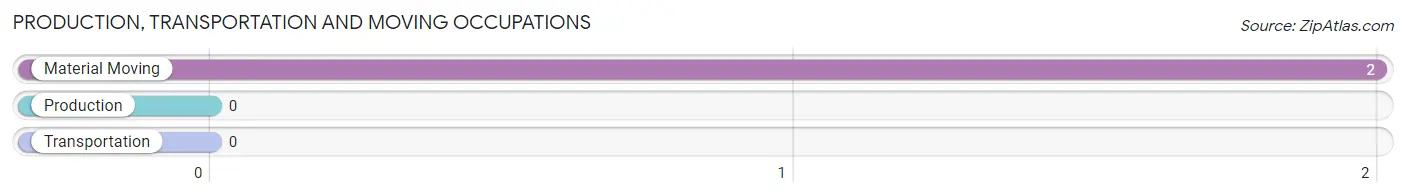
Production, Transportation and Moving Occupations by Sex
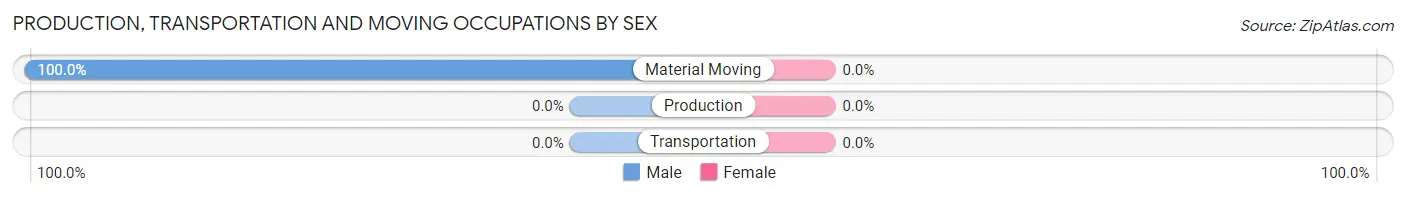
| Occupation | Male | Female |
| Production | 0 (0.0%) | 0 (0.0%) |
| Transportation | 0 (0.0%) | 0 (0.0%) |
| Material Moving | 2 (100.0%) | 0 (0.0%) |
| Total (Category) | 2 (100.0%) | 0 (0.0%) |
| Total (Overall) | 242 (54.5%) | 202 (45.5%) |
Employment Industries by Sex in Chevy Chase Section Three
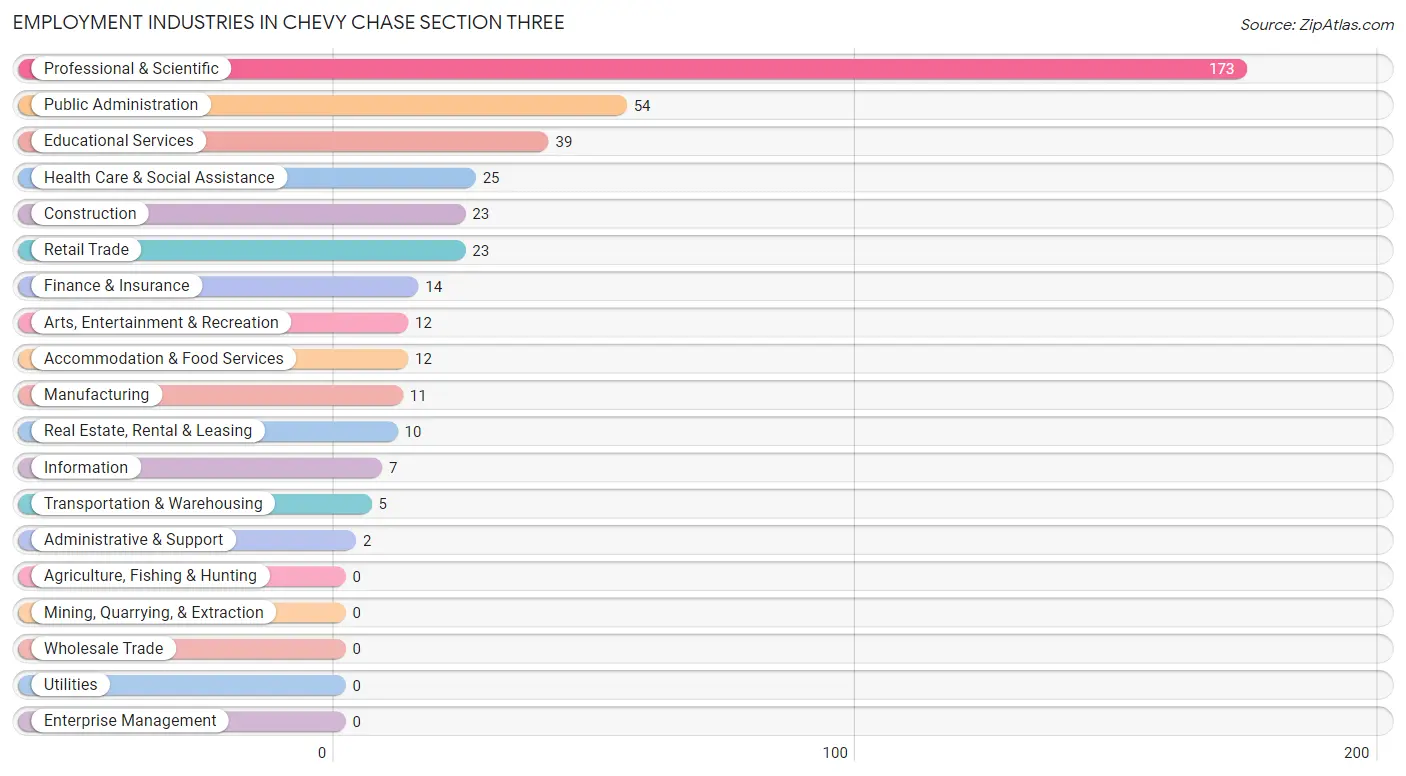
Employment Industries in Chevy Chase Section Three
The major employment industries in Chevy Chase Section Three include Professional & Scientific (173 | 39.0%), Public Administration (54 | 12.2%), Educational Services (39 | 8.8%), Health Care & Social Assistance (25 | 5.6%), and Construction (23 | 5.2%).
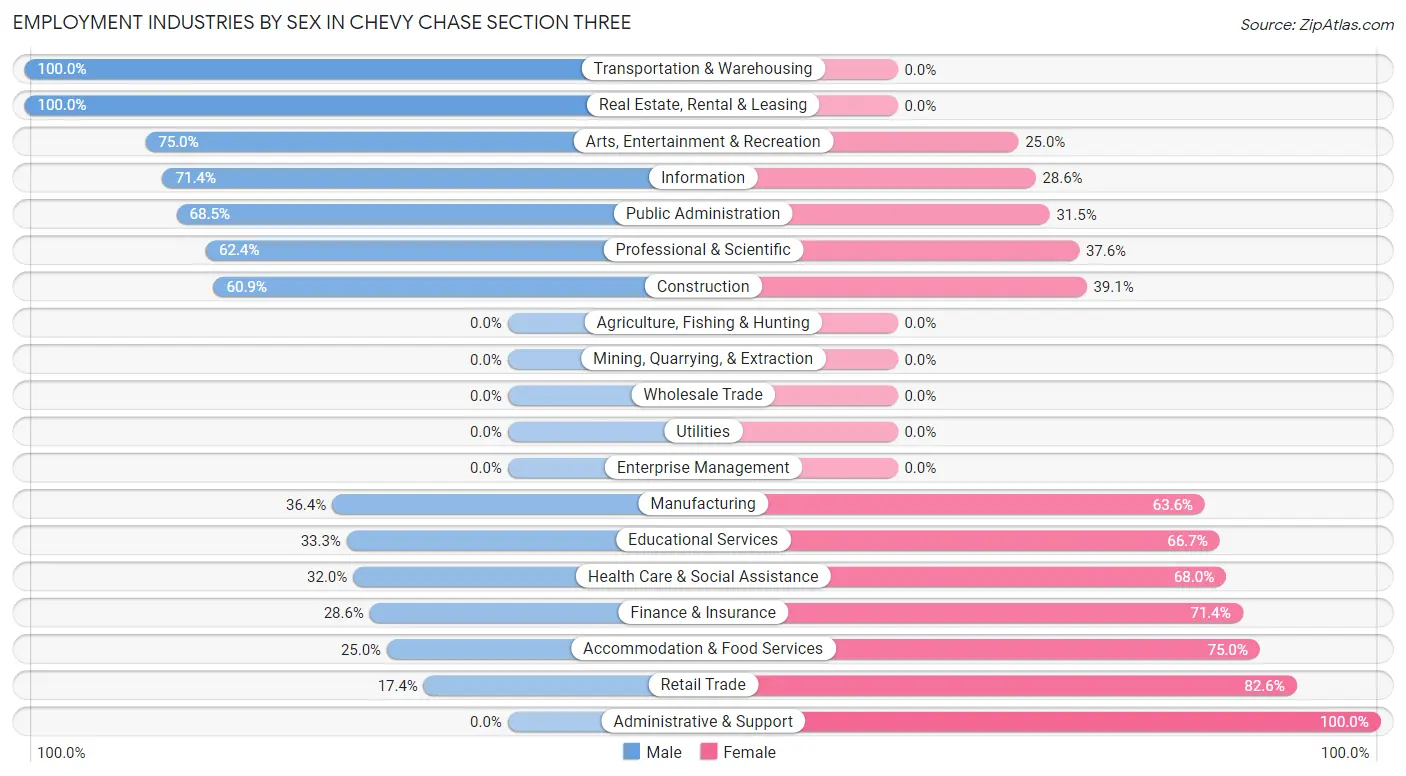
Employment Industries by Sex in Chevy Chase Section Three
The Chevy Chase Section Three industries that see more men than women are Transportation & Warehousing (100.0%), Real Estate, Rental & Leasing (100.0%), and Arts, Entertainment & Recreation (75.0%), whereas the industries that tend to have a higher number of women are Administrative & Support (100.0%), Retail Trade (82.6%), and Accommodation & Food Services (75.0%).
| Industry | Male | Female |
| Agriculture, Fishing & Hunting | 0 (0.0%) | 0 (0.0%) |
| Mining, Quarrying, & Extraction | 0 (0.0%) | 0 (0.0%) |
| Construction | 14 (60.9%) | 9 (39.1%) |
| Manufacturing | 4 (36.4%) | 7 (63.6%) |
| Wholesale Trade | 0 (0.0%) | 0 (0.0%) |
| Retail Trade | 4 (17.4%) | 19 (82.6%) |
| Transportation & Warehousing | 5 (100.0%) | 0 (0.0%) |
| Utilities | 0 (0.0%) | 0 (0.0%) |
| Information | 5 (71.4%) | 2 (28.6%) |
| Finance & Insurance | 4 (28.6%) | 10 (71.4%) |
| Real Estate, Rental & Leasing | 10 (100.0%) | 0 (0.0%) |
| Professional & Scientific | 108 (62.4%) | 65 (37.6%) |
| Enterprise Management | 0 (0.0%) | 0 (0.0%) |
| Administrative & Support | 0 (0.0%) | 2 (100.0%) |
| Educational Services | 13 (33.3%) | 26 (66.7%) |
| Health Care & Social Assistance | 8 (32.0%) | 17 (68.0%) |
| Arts, Entertainment & Recreation | 9 (75.0%) | 3 (25.0%) |
| Accommodation & Food Services | 3 (25.0%) | 9 (75.0%) |
| Public Administration | 37 (68.5%) | 17 (31.5%) |
| Total | 242 (54.5%) | 202 (45.5%) |
Education in Chevy Chase Section Three
School Enrollment in Chevy Chase Section Three
The most common levels of schooling among the 333 students in Chevy Chase Section Three are middle school (149 | 44.7%), elementary school (73 | 21.9%), and high school (65 | 19.5%).
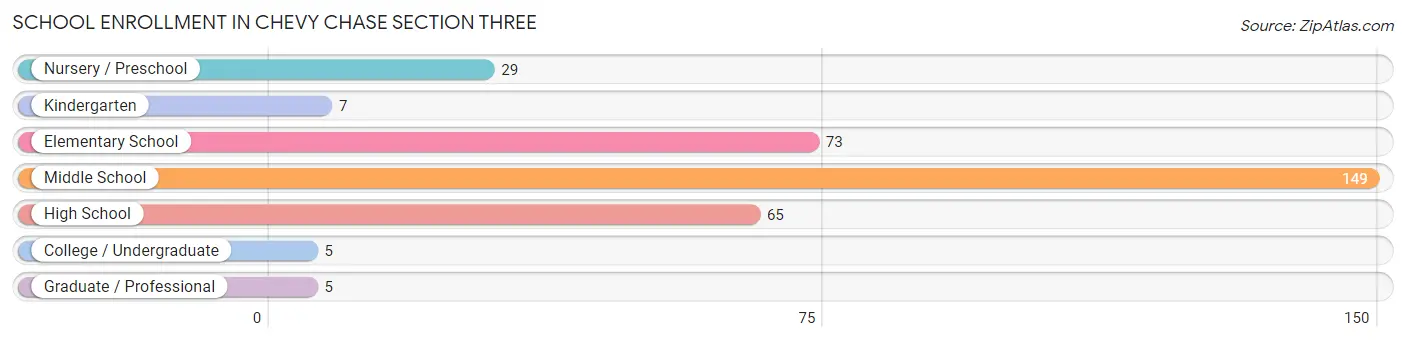
| School Level | # Students | % Students |
| Nursery / Preschool | 29 | 8.7% |
| Kindergarten | 7 | 2.1% |
| Elementary School | 73 | 21.9% |
| Middle School | 149 | 44.7% |
| High School | 65 | 19.5% |
| College / Undergraduate | 5 | 1.5% |
| Graduate / Professional | 5 | 1.5% |
| Total | 333 | 100.0% |
School Enrollment by Age by Funding Source in Chevy Chase Section Three
Out of a total of 333 students who are enrolled in schools in Chevy Chase Section Three, 163 (48.9%) attend a private institution, while the remaining 170 (51.1%) are enrolled in public schools. The age group of 3 to 4 year olds has the highest likelihood of being enrolled in private schools, with 20 (100.0% in the age bracket) enrolled. Conversely, the age group of 25 to 34 year olds has the lowest likelihood of being enrolled in a private school, with 3 (100.0% in the age bracket) attending a public institution.
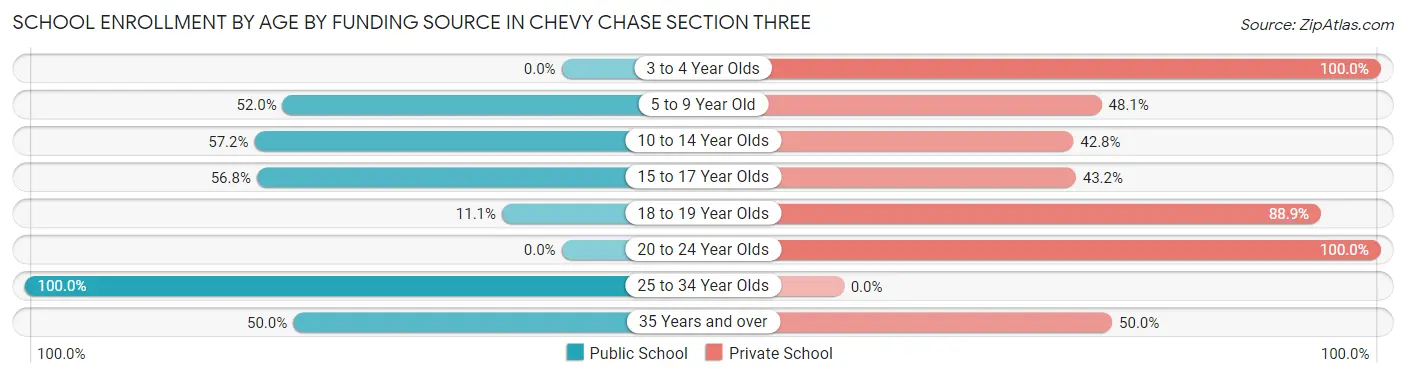
| Age Bracket | Public School | Private School |
| 3 to 4 Year Olds | 0 (0.0%) | 20 (100.0%) |
| 5 to 9 Year Old | 40 (51.9%) | 37 (48.0%) |
| 10 to 14 Year Olds | 103 (57.2%) | 77 (42.8%) |
| 15 to 17 Year Olds | 21 (56.8%) | 16 (43.2%) |
| 18 to 19 Year Olds | 1 (11.1%) | 8 (88.9%) |
| 20 to 24 Year Olds | 0 (0.0%) | 3 (100.0%) |
| 25 to 34 Year Olds | 3 (100.0%) | 0 (0.0%) |
| 35 Years and over | 2 (50.0%) | 2 (50.0%) |
| Total | 170 (51.1%) | 163 (48.9%) |
Educational Attainment by Field of Study in Chevy Chase Section Three
Social sciences (180 | 25.5%), literature & languages (92 | 13.0%), business (66 | 9.3%), liberal arts & history (61 | 8.6%), and engineering (52 | 7.4%) are the most common fields of study among 707 individuals in Chevy Chase Section Three who have obtained a bachelor's degree or higher.
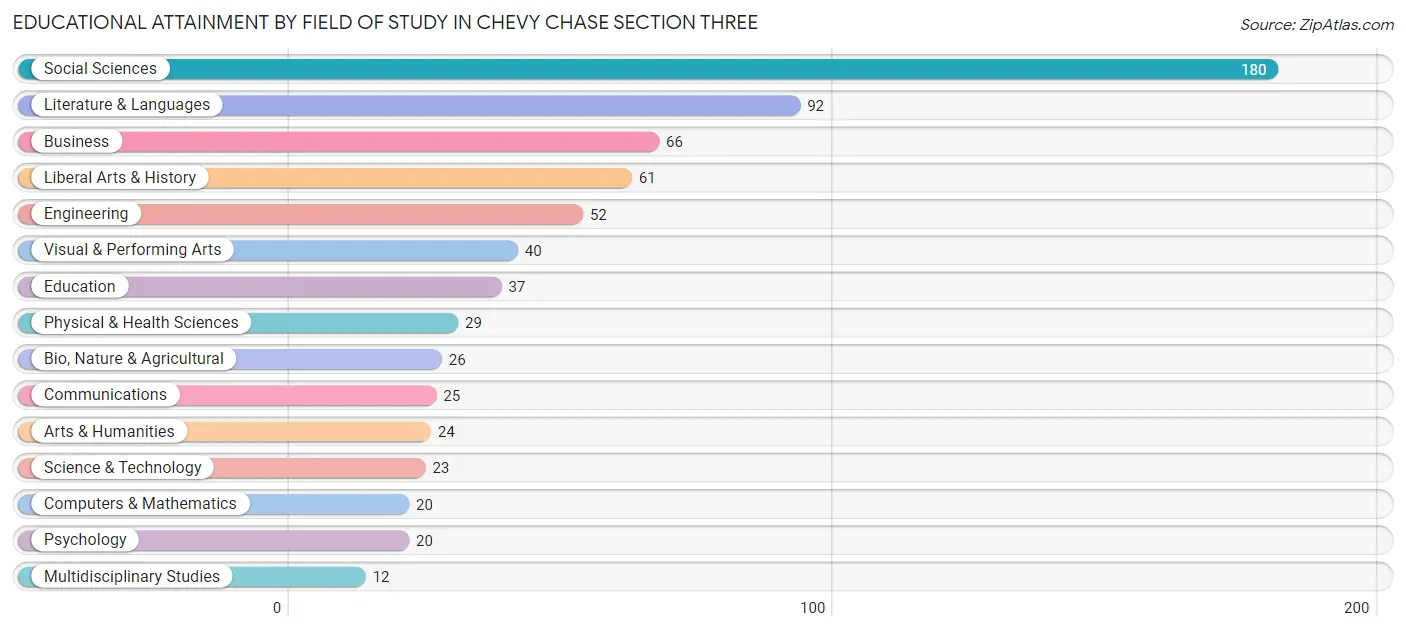
| Field of Study | # Graduates | % Graduates |
| Computers & Mathematics | 20 | 2.8% |
| Bio, Nature & Agricultural | 26 | 3.7% |
| Physical & Health Sciences | 29 | 4.1% |
| Psychology | 20 | 2.8% |
| Social Sciences | 180 | 25.5% |
| Engineering | 52 | 7.4% |
| Multidisciplinary Studies | 12 | 1.7% |
| Science & Technology | 23 | 3.3% |
| Business | 66 | 9.3% |
| Education | 37 | 5.2% |
| Literature & Languages | 92 | 13.0% |
| Liberal Arts & History | 61 | 8.6% |
| Visual & Performing Arts | 40 | 5.7% |
| Communications | 25 | 3.5% |
| Arts & Humanities | 24 | 3.4% |
| Total | 707 | 100.0% |
Transportation & Commute in Chevy Chase Section Three
Vehicle Availability by Sex in Chevy Chase Section Three
The most prevalent vehicle ownership categories in Chevy Chase Section Three are males with 2 vehicles (157, accounting for 65.4%) and females with 2 vehicles (128, making up 78.1%).
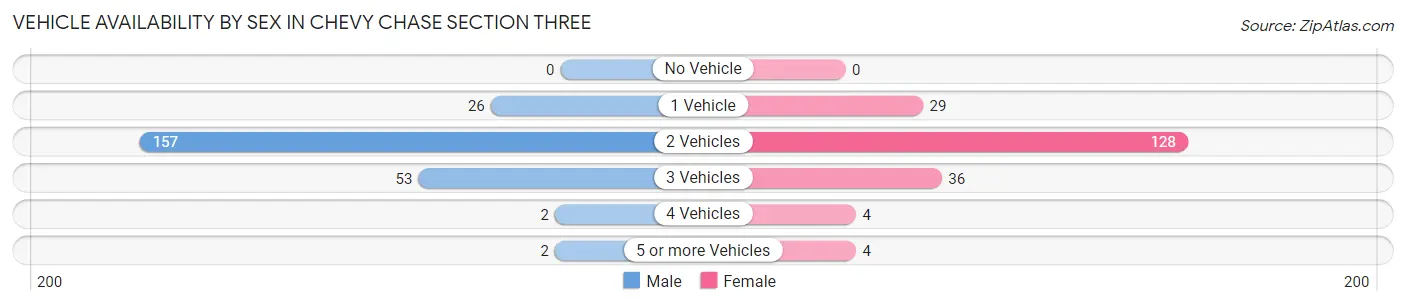
| Vehicles Available | Male | Female |
| No Vehicle | 0 (0.0%) | 0 (0.0%) |
| 1 Vehicle | 26 (10.8%) | 29 (14.4%) |
| 2 Vehicles | 157 (65.4%) | 128 (63.7%) |
| 3 Vehicles | 53 (22.1%) | 36 (17.9%) |
| 4 Vehicles | 2 (0.8%) | 4 (2.0%) |
| 5 or more Vehicles | 2 (0.8%) | 4 (2.0%) |
| Total | 240 (100.0%) | 201 (100.0%) |
Commute Time in Chevy Chase Section Three
The most frequently occuring commute durations in Chevy Chase Section Three are 30 to 34 minutes (50 commuters, 17.2%), 45 to 59 minutes (45 commuters, 15.5%), and 20 to 24 minutes (38 commuters, 13.1%).
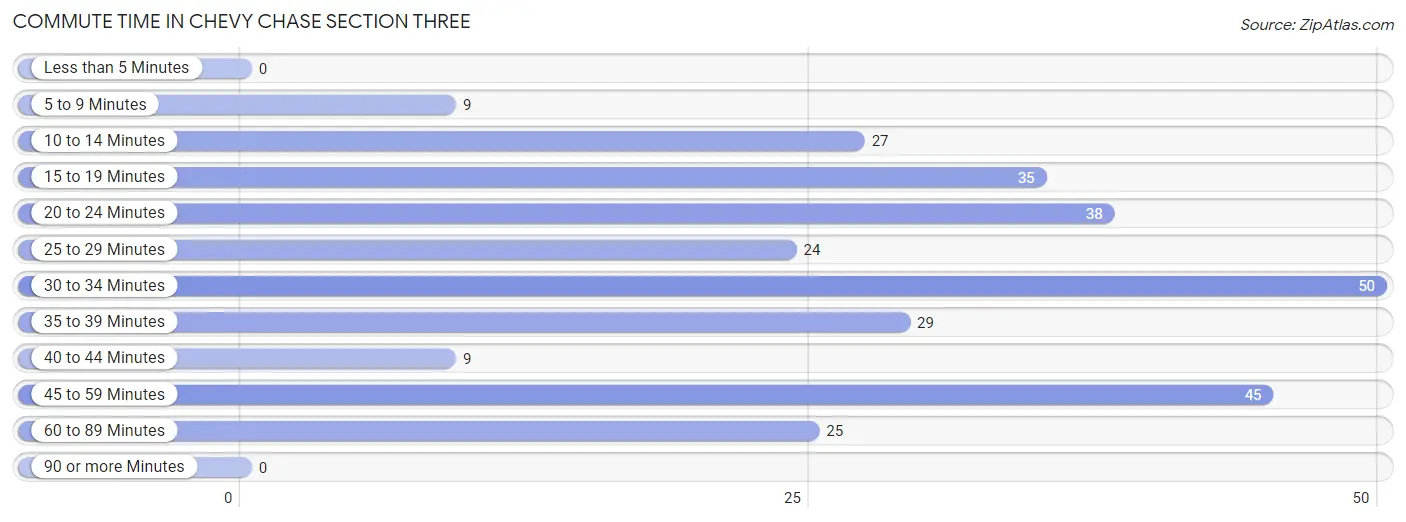
| Commute Time | # Commuters | % Commuters |
| Less than 5 Minutes | 0 | 0.0% |
| 5 to 9 Minutes | 9 | 3.1% |
| 10 to 14 Minutes | 27 | 9.3% |
| 15 to 19 Minutes | 35 | 12.0% |
| 20 to 24 Minutes | 38 | 13.1% |
| 25 to 29 Minutes | 24 | 8.3% |
| 30 to 34 Minutes | 50 | 17.2% |
| 35 to 39 Minutes | 29 | 10.0% |
| 40 to 44 Minutes | 9 | 3.1% |
| 45 to 59 Minutes | 45 | 15.5% |
| 60 to 89 Minutes | 25 | 8.6% |
| 90 or more Minutes | 0 | 0.0% |
Commute Time by Sex in Chevy Chase Section Three
The most common commute times in Chevy Chase Section Three are 20 to 24 minutes (29 commuters, 18.7%) for males and 30 to 34 minutes (36 commuters, 26.5%) for females.
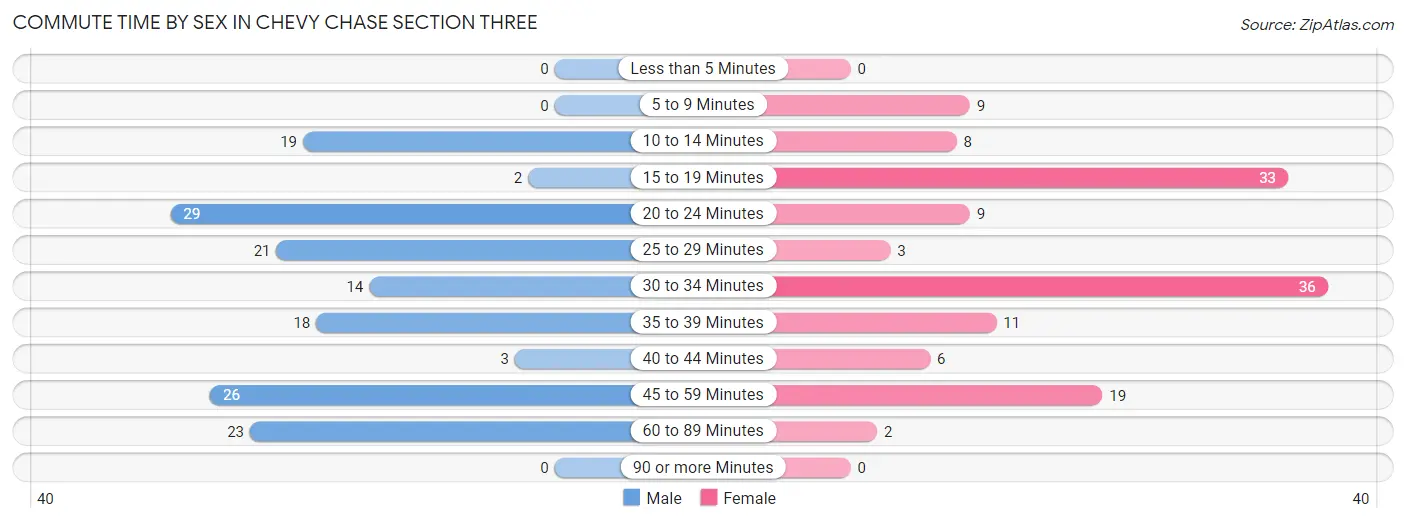
| Commute Time | Male | Female |
| Less than 5 Minutes | 0 (0.0%) | 0 (0.0%) |
| 5 to 9 Minutes | 0 (0.0%) | 9 (6.6%) |
| 10 to 14 Minutes | 19 (12.3%) | 8 (5.9%) |
| 15 to 19 Minutes | 2 (1.3%) | 33 (24.3%) |
| 20 to 24 Minutes | 29 (18.7%) | 9 (6.6%) |
| 25 to 29 Minutes | 21 (13.6%) | 3 (2.2%) |
| 30 to 34 Minutes | 14 (9.0%) | 36 (26.5%) |
| 35 to 39 Minutes | 18 (11.6%) | 11 (8.1%) |
| 40 to 44 Minutes | 3 (1.9%) | 6 (4.4%) |
| 45 to 59 Minutes | 26 (16.8%) | 19 (14.0%) |
| 60 to 89 Minutes | 23 (14.8%) | 2 (1.5%) |
| 90 or more Minutes | 0 (0.0%) | 0 (0.0%) |
Time of Departure to Work by Sex in Chevy Chase Section Three
The most frequent times of departure to work in Chevy Chase Section Three are 8:30 AM to 8:59 AM (34, 21.9%) for males and 9:00 AM to 9:59 AM (31, 22.8%) for females.
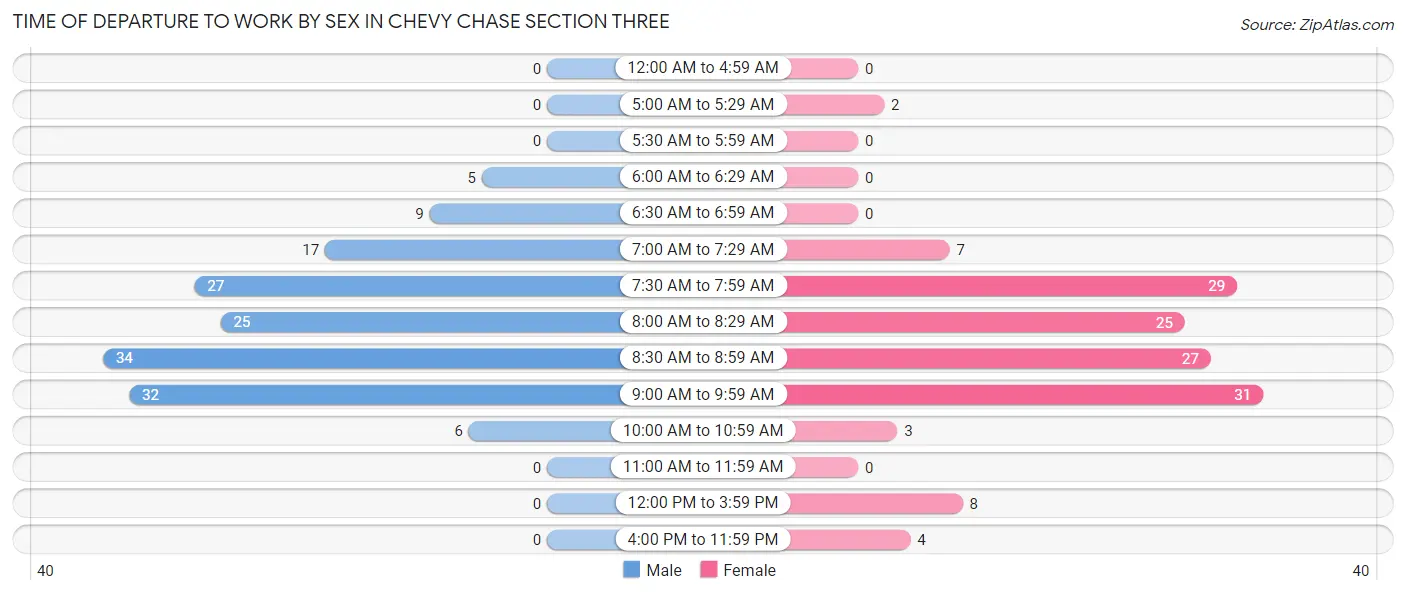
| Time of Departure | Male | Female |
| 12:00 AM to 4:59 AM | 0 (0.0%) | 0 (0.0%) |
| 5:00 AM to 5:29 AM | 0 (0.0%) | 2 (1.5%) |
| 5:30 AM to 5:59 AM | 0 (0.0%) | 0 (0.0%) |
| 6:00 AM to 6:29 AM | 5 (3.2%) | 0 (0.0%) |
| 6:30 AM to 6:59 AM | 9 (5.8%) | 0 (0.0%) |
| 7:00 AM to 7:29 AM | 17 (11.0%) | 7 (5.1%) |
| 7:30 AM to 7:59 AM | 27 (17.4%) | 29 (21.3%) |
| 8:00 AM to 8:29 AM | 25 (16.1%) | 25 (18.4%) |
| 8:30 AM to 8:59 AM | 34 (21.9%) | 27 (19.9%) |
| 9:00 AM to 9:59 AM | 32 (20.6%) | 31 (22.8%) |
| 10:00 AM to 10:59 AM | 6 (3.9%) | 3 (2.2%) |
| 11:00 AM to 11:59 AM | 0 (0.0%) | 0 (0.0%) |
| 12:00 PM to 3:59 PM | 0 (0.0%) | 8 (5.9%) |
| 4:00 PM to 11:59 PM | 0 (0.0%) | 4 (2.9%) |
| Total | 155 (100.0%) | 136 (100.0%) |
Housing Occupancy in Chevy Chase Section Three
Occupancy by Ownership in Chevy Chase Section Three
Of the total 314 dwellings in Chevy Chase Section Three, owner-occupied units account for 313 (99.7%), while renter-occupied units make up 1 (0.3%).
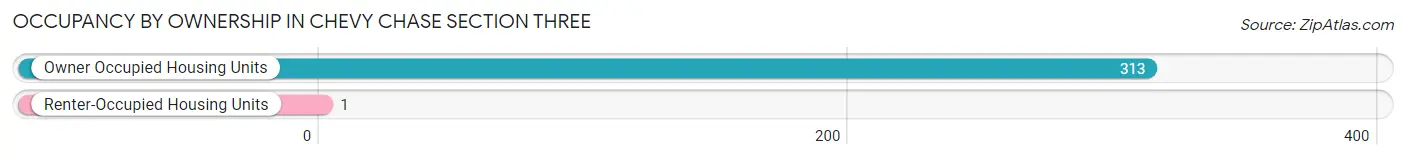
| Occupancy | # Housing Units | % Housing Units |
| Owner Occupied Housing Units | 313 | 99.7% |
| Renter-Occupied Housing Units | 1 | 0.3% |
| Total Occupied Housing Units | 314 | 100.0% |
Occupancy by Household Size in Chevy Chase Section Three
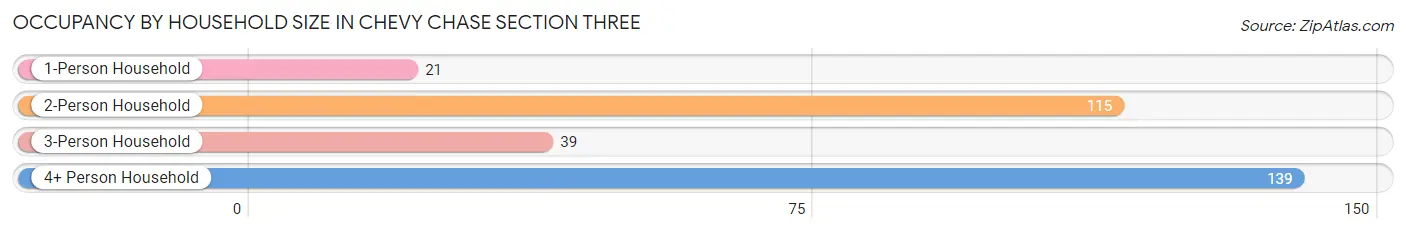
| Household Size | # Housing Units | % Housing Units |
| 1-Person Household | 21 | 6.7% |
| 2-Person Household | 115 | 36.6% |
| 3-Person Household | 39 | 12.4% |
| 4+ Person Household | 139 | 44.3% |
| Total Housing Units | 314 | 100.0% |
Occupancy by Ownership by Household Size in Chevy Chase Section Three
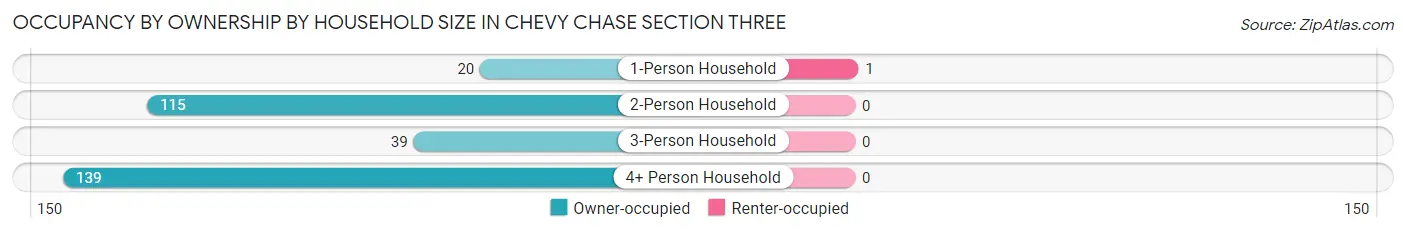
| Household Size | Owner-occupied | Renter-occupied |
| 1-Person Household | 20 (95.2%) | 1 (4.8%) |
| 2-Person Household | 115 (100.0%) | 0 (0.0%) |
| 3-Person Household | 39 (100.0%) | 0 (0.0%) |
| 4+ Person Household | 139 (100.0%) | 0 (0.0%) |
| Total Housing Units | 313 (99.7%) | 1 (0.3%) |
Occupancy by Educational Attainment in Chevy Chase Section Three
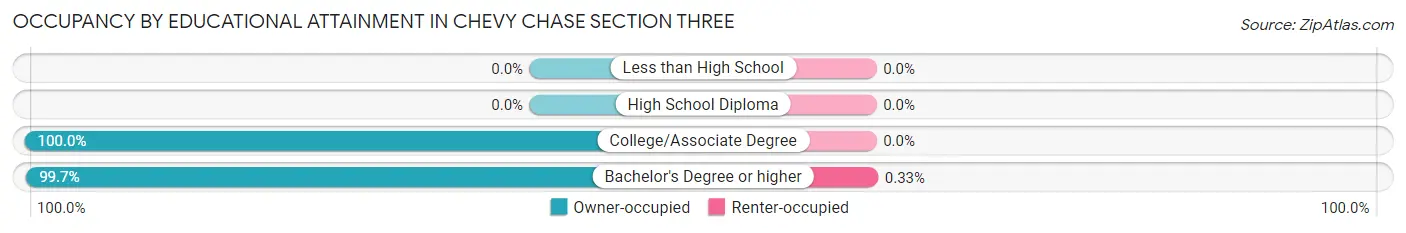
| Household Size | Owner-occupied | Renter-occupied |
| Less than High School | 0 (0.0%) | 0 (0.0%) |
| High School Diploma | 0 (0.0%) | 0 (0.0%) |
| College/Associate Degree | 8 (100.0%) | 0 (0.0%) |
| Bachelor's Degree or higher | 305 (99.7%) | 1 (0.3%) |
Occupancy by Age of Householder in Chevy Chase Section Three
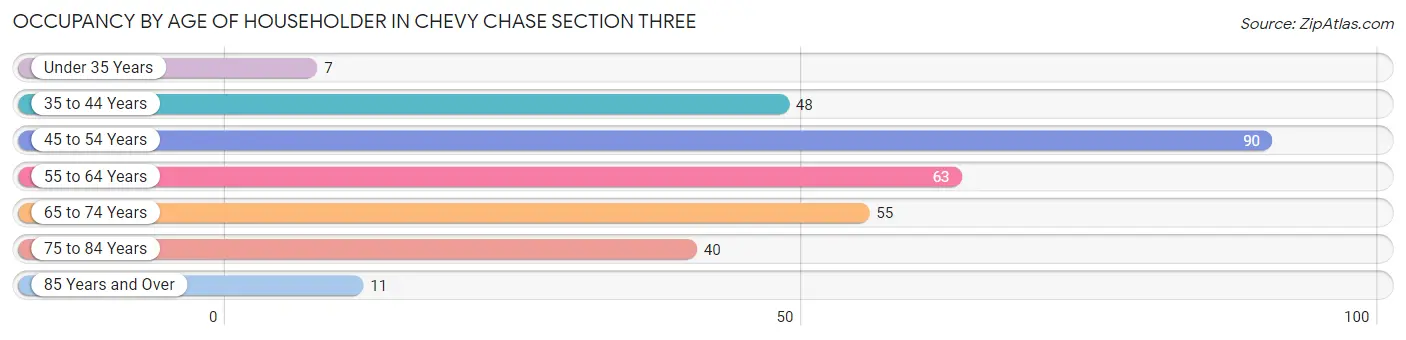
| Age Bracket | # Households | % Households |
| Under 35 Years | 7 | 2.2% |
| 35 to 44 Years | 48 | 15.3% |
| 45 to 54 Years | 90 | 28.7% |
| 55 to 64 Years | 63 | 20.1% |
| 65 to 74 Years | 55 | 17.5% |
| 75 to 84 Years | 40 | 12.7% |
| 85 Years and Over | 11 | 3.5% |
| Total | 314 | 100.0% |
Housing Finances in Chevy Chase Section Three
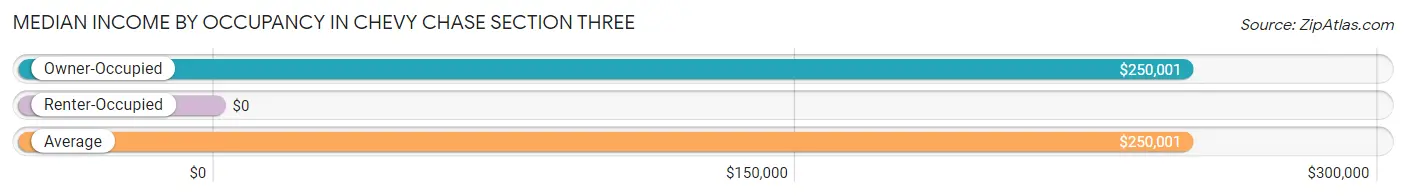
Median Income by Occupancy in Chevy Chase Section Three
| Occupancy Type | # Households | Median Income |
| Owner-Occupied | 313 (99.7%) | $250,001 |
| Renter-Occupied | 1 (0.3%) | $0 |
| Average | 314 (100.0%) | $250,001 |
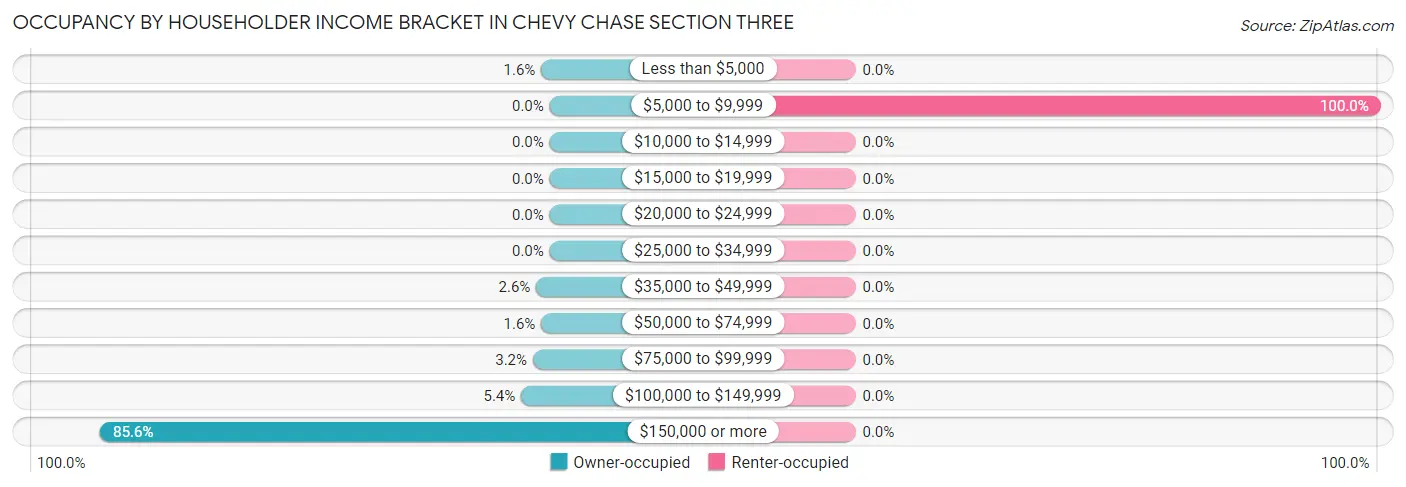
Occupancy by Householder Income Bracket in Chevy Chase Section Three
| Income Bracket | Owner-occupied | Renter-occupied |
| Less than $5,000 | 5 (1.6%) | 0 (0.0%) |
| $5,000 to $9,999 | 0 (0.0%) | 1 (100.0%) |
| $10,000 to $14,999 | 0 (0.0%) | 0 (0.0%) |
| $15,000 to $19,999 | 0 (0.0%) | 0 (0.0%) |
| $20,000 to $24,999 | 0 (0.0%) | 0 (0.0%) |
| $25,000 to $34,999 | 0 (0.0%) | 0 (0.0%) |
| $35,000 to $49,999 | 8 (2.6%) | 0 (0.0%) |
| $50,000 to $74,999 | 5 (1.6%) | 0 (0.0%) |
| $75,000 to $99,999 | 10 (3.2%) | 0 (0.0%) |
| $100,000 to $149,999 | 17 (5.4%) | 0 (0.0%) |
| $150,000 or more | 268 (85.6%) | 0 (0.0%) |
| Total | 313 (100.0%) | 1 (100.0%) |
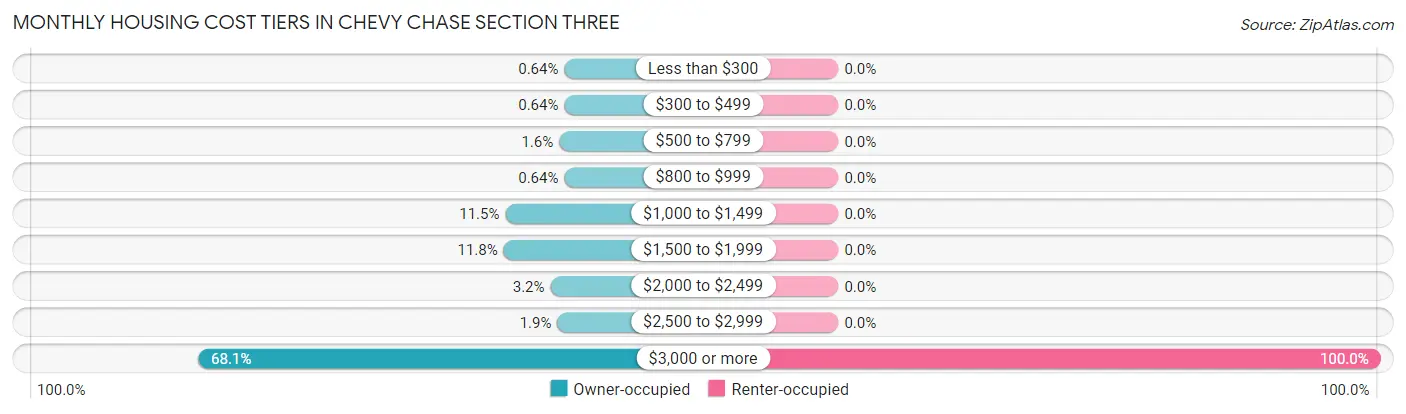
Monthly Housing Cost Tiers in Chevy Chase Section Three
| Monthly Cost | Owner-occupied | Renter-occupied |
| Less than $300 | 2 (0.6%) | 0 (0.0%) |
| $300 to $499 | 2 (0.6%) | 0 (0.0%) |
| $500 to $799 | 5 (1.6%) | 0 (0.0%) |
| $800 to $999 | 2 (0.6%) | 0 (0.0%) |
| $1,000 to $1,499 | 36 (11.5%) | 0 (0.0%) |
| $1,500 to $1,999 | 37 (11.8%) | 0 (0.0%) |
| $2,000 to $2,499 | 10 (3.2%) | 0 (0.0%) |
| $2,500 to $2,999 | 6 (1.9%) | 0 (0.0%) |
| $3,000 or more | 213 (68.0%) | 1 (100.0%) |
| Total | 313 (100.0%) | 1 (100.0%) |
Physical Housing Characteristics in Chevy Chase Section Three
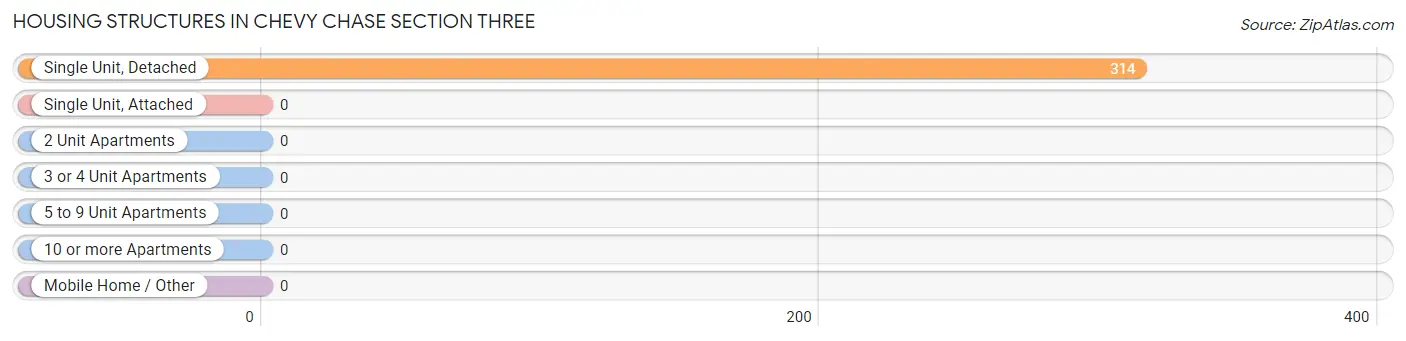
Housing Structures in Chevy Chase Section Three
| Structure Type | # Housing Units | % Housing Units |
| Single Unit, Detached | 314 | 100.0% |
| Single Unit, Attached | 0 | 0.0% |
| 2 Unit Apartments | 0 | 0.0% |
| 3 or 4 Unit Apartments | 0 | 0.0% |
| 5 to 9 Unit Apartments | 0 | 0.0% |
| 10 or more Apartments | 0 | 0.0% |
| Mobile Home / Other | 0 | 0.0% |
| Total | 314 | 100.0% |
Housing Structures by Occupancy in Chevy Chase Section Three
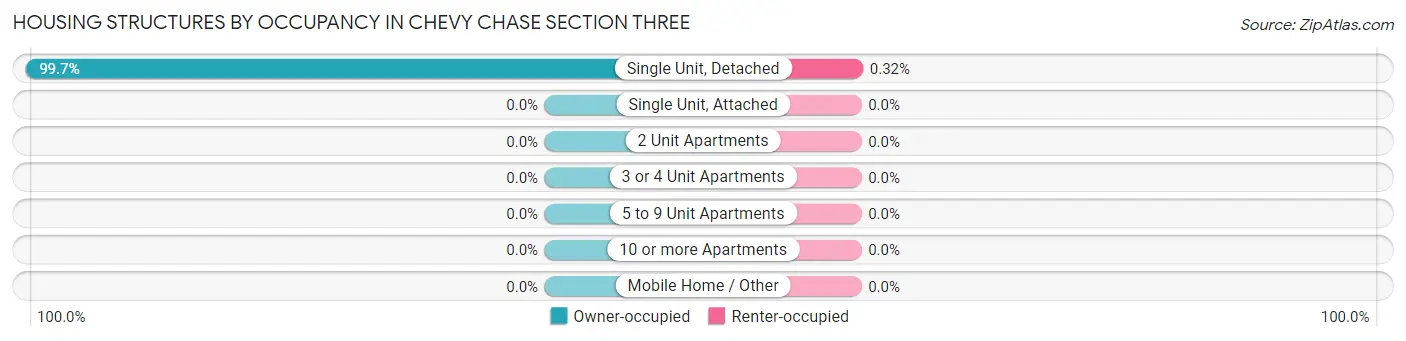
| Structure Type | Owner-occupied | Renter-occupied |
| Single Unit, Detached | 313 (99.7%) | 1 (0.3%) |
| Single Unit, Attached | 0 (0.0%) | 0 (0.0%) |
| 2 Unit Apartments | 0 (0.0%) | 0 (0.0%) |
| 3 or 4 Unit Apartments | 0 (0.0%) | 0 (0.0%) |
| 5 to 9 Unit Apartments | 0 (0.0%) | 0 (0.0%) |
| 10 or more Apartments | 0 (0.0%) | 0 (0.0%) |
| Mobile Home / Other | 0 (0.0%) | 0 (0.0%) |
| Total | 313 (99.7%) | 1 (0.3%) |
Housing Structures by Number of Rooms in Chevy Chase Section Three
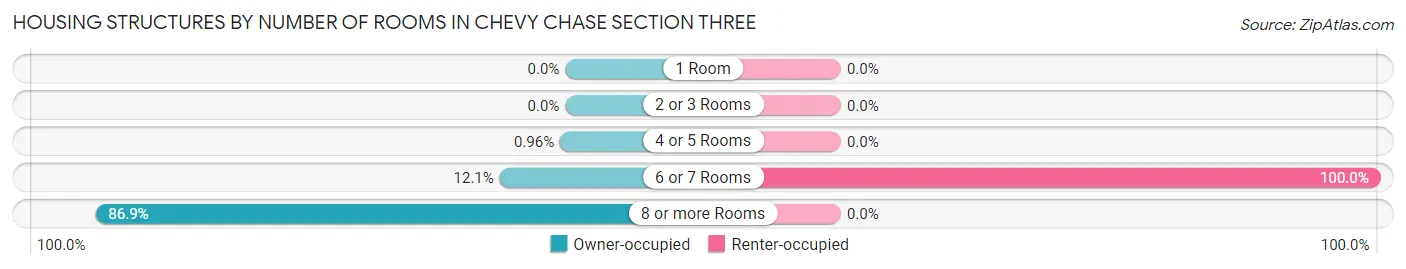
| Number of Rooms | Owner-occupied | Renter-occupied |
| 1 Room | 0 (0.0%) | 0 (0.0%) |
| 2 or 3 Rooms | 0 (0.0%) | 0 (0.0%) |
| 4 or 5 Rooms | 3 (1.0%) | 0 (0.0%) |
| 6 or 7 Rooms | 38 (12.1%) | 1 (100.0%) |
| 8 or more Rooms | 272 (86.9%) | 0 (0.0%) |
| Total | 313 (100.0%) | 1 (100.0%) |
Housing Structure by Heating Type in Chevy Chase Section Three
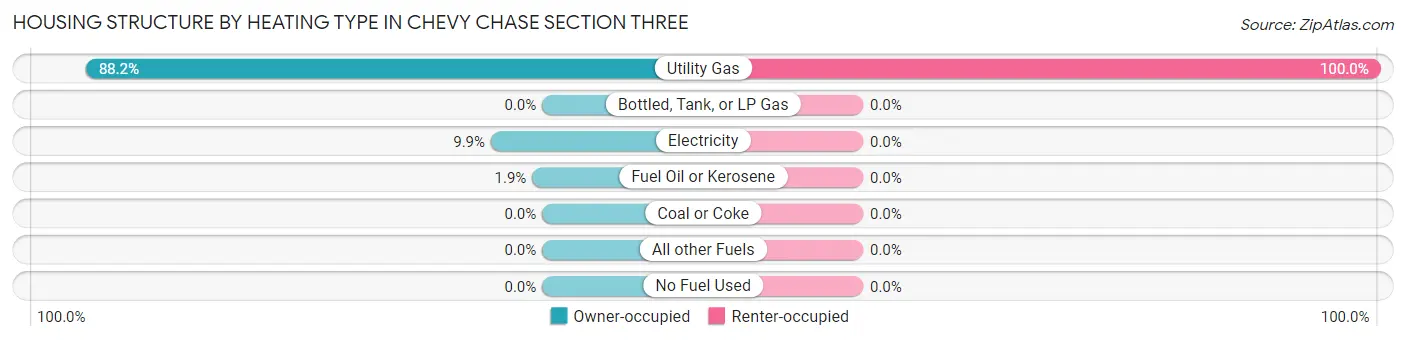
| Heating Type | Owner-occupied | Renter-occupied |
| Utility Gas | 276 (88.2%) | 1 (100.0%) |
| Bottled, Tank, or LP Gas | 0 (0.0%) | 0 (0.0%) |
| Electricity | 31 (9.9%) | 0 (0.0%) |
| Fuel Oil or Kerosene | 6 (1.9%) | 0 (0.0%) |
| Coal or Coke | 0 (0.0%) | 0 (0.0%) |
| All other Fuels | 0 (0.0%) | 0 (0.0%) |
| No Fuel Used | 0 (0.0%) | 0 (0.0%) |
| Total | 313 (100.0%) | 1 (100.0%) |
Household Vehicle Usage in Chevy Chase Section Three
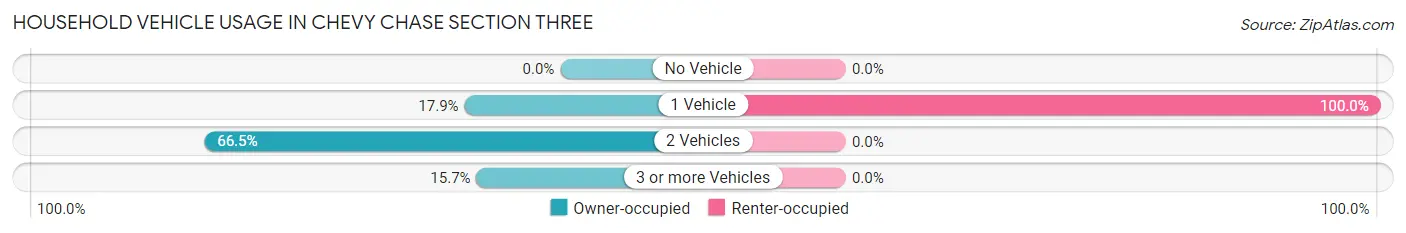
| Vehicles per Household | Owner-occupied | Renter-occupied |
| No Vehicle | 0 (0.0%) | 0 (0.0%) |
| 1 Vehicle | 56 (17.9%) | 1 (100.0%) |
| 2 Vehicles | 208 (66.4%) | 0 (0.0%) |
| 3 or more Vehicles | 49 (15.7%) | 0 (0.0%) |
| Total | 313 (100.0%) | 1 (100.0%) |
Real Estate & Mortgages in Chevy Chase Section Three
Real Estate and Mortgage Overview in Chevy Chase Section Three
| Characteristic | Without Mortgage | With Mortgage |
| Housing Units | 81 | 232 |
| Median Property Value | $1,177,600 | $1,627,300 |
| Median Household Income | $250,001 | $213 |
| Monthly Housing Costs | $1,407 | $211 |
| Real Estate Taxes | $9,805 | $0 |
Property Value by Mortgage Status in Chevy Chase Section Three
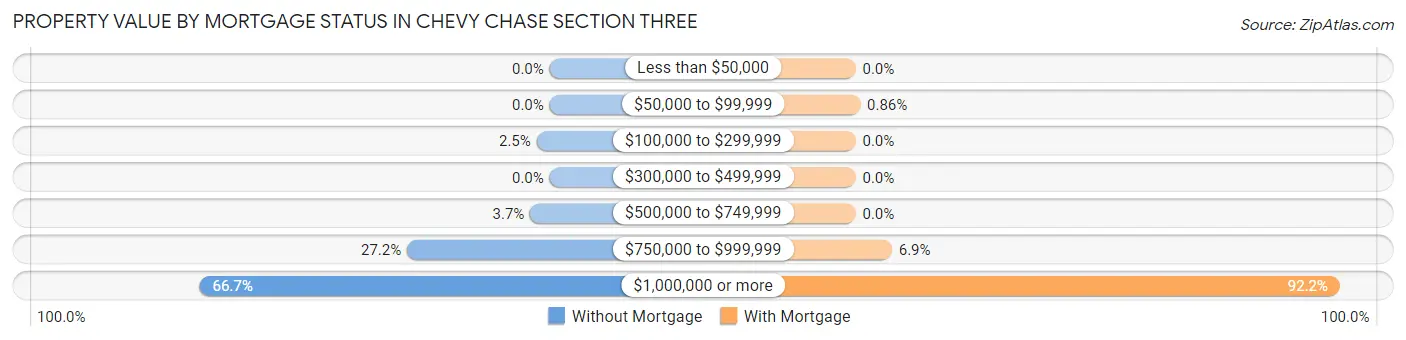
| Property Value | Without Mortgage | With Mortgage |
| Less than $50,000 | 0 (0.0%) | 0 (0.0%) |
| $50,000 to $99,999 | 0 (0.0%) | 2 (0.9%) |
| $100,000 to $299,999 | 2 (2.5%) | 0 (0.0%) |
| $300,000 to $499,999 | 0 (0.0%) | 0 (0.0%) |
| $500,000 to $749,999 | 3 (3.7%) | 0 (0.0%) |
| $750,000 to $999,999 | 22 (27.2%) | 16 (6.9%) |
| $1,000,000 or more | 54 (66.7%) | 214 (92.2%) |
| Total | 81 (100.0%) | 232 (100.0%) |
Household Income by Mortgage Status in Chevy Chase Section Three
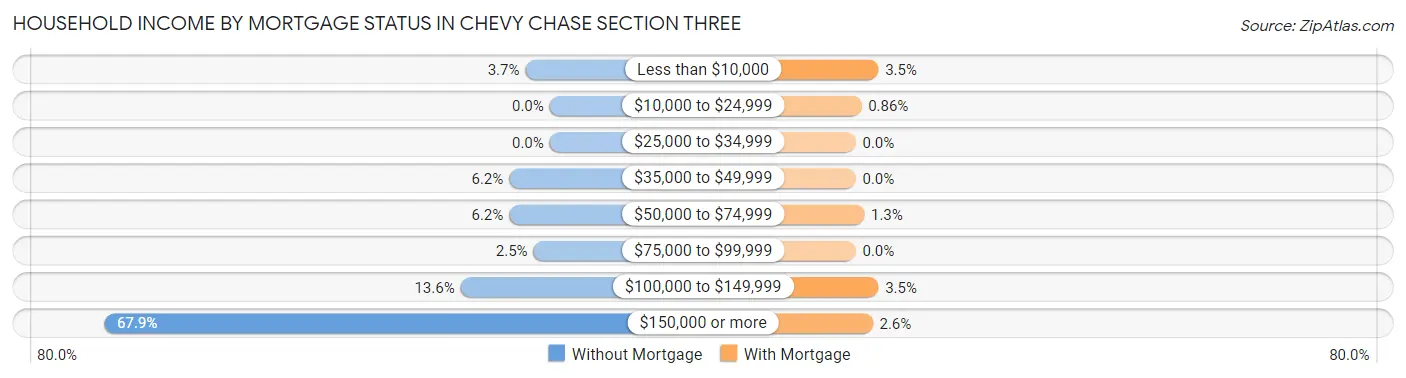
| Household Income | Without Mortgage | With Mortgage |
| Less than $10,000 | 3 (3.7%) | 8 (3.5%) |
| $10,000 to $24,999 | 0 (0.0%) | 2 (0.9%) |
| $25,000 to $34,999 | 0 (0.0%) | 0 (0.0%) |
| $35,000 to $49,999 | 5 (6.2%) | 0 (0.0%) |
| $50,000 to $74,999 | 5 (6.2%) | 3 (1.3%) |
| $75,000 to $99,999 | 2 (2.5%) | 0 (0.0%) |
| $100,000 to $149,999 | 11 (13.6%) | 8 (3.5%) |
| $150,000 or more | 55 (67.9%) | 6 (2.6%) |
| Total | 81 (100.0%) | 232 (100.0%) |
Property Value to Household Income Ratio in Chevy Chase Section Three
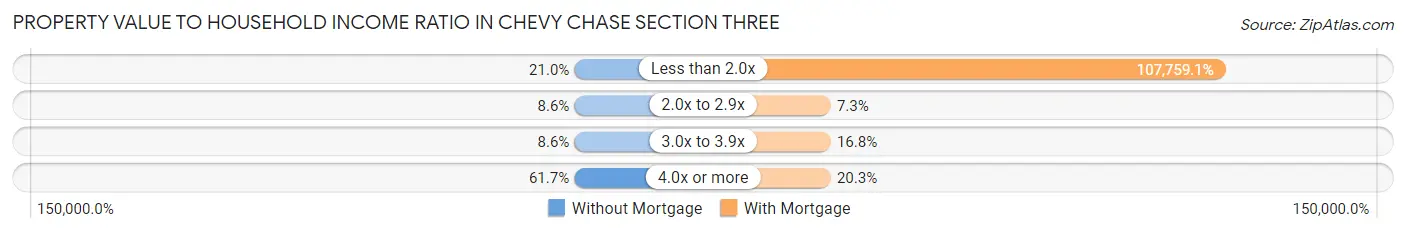
| Value-to-Income Ratio | Without Mortgage | With Mortgage |
| Less than 2.0x | 17 (21.0%) | 250,001 (107,759.1%) |
| 2.0x to 2.9x | 7 (8.6%) | 17 (7.3%) |
| 3.0x to 3.9x | 7 (8.6%) | 39 (16.8%) |
| 4.0x or more | 50 (61.7%) | 47 (20.3%) |
| Total | 81 (100.0%) | 232 (100.0%) |
Real Estate Taxes by Mortgage Status in Chevy Chase Section Three
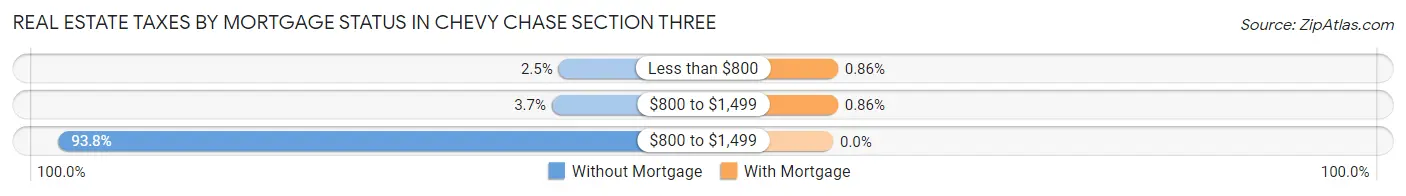
| Property Taxes | Without Mortgage | With Mortgage |
| Less than $800 | 2 (2.5%) | 2 (0.9%) |
| $800 to $1,499 | 3 (3.7%) | 2 (0.9%) |
| $800 to $1,499 | 76 (93.8%) | 0 (0.0%) |
| Total | 81 (100.0%) | 232 (100.0%) |
Health & Disability in Chevy Chase Section Three
Health Insurance Coverage by Age in Chevy Chase Section Three
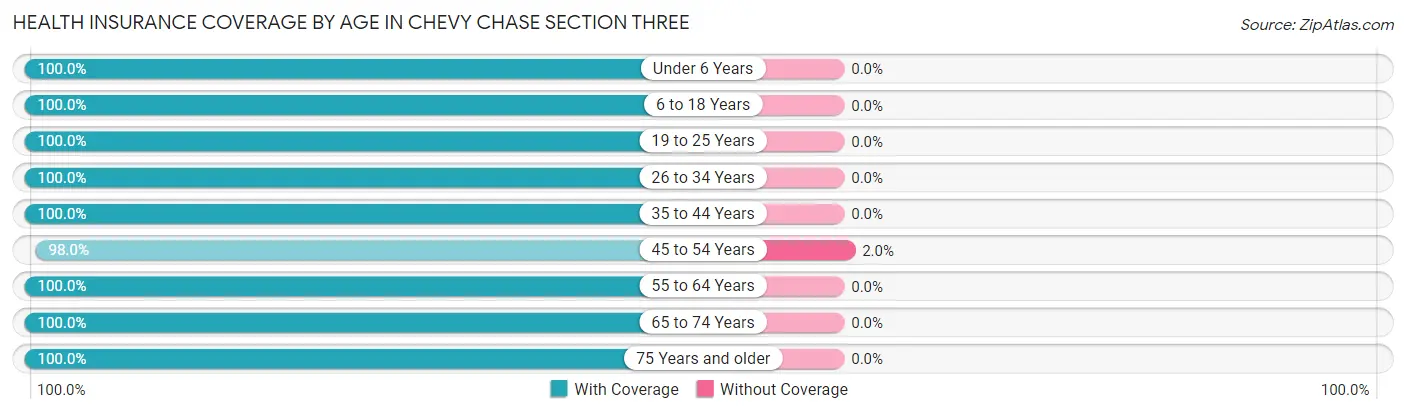
| Age Bracket | With Coverage | Without Coverage |
| Under 6 Years | 67 (100.0%) | 0 (0.0%) |
| 6 to 18 Years | 297 (100.0%) | 0 (0.0%) |
| 19 to 25 Years | 21 (100.0%) | 0 (0.0%) |
| 26 to 34 Years | 37 (100.0%) | 0 (0.0%) |
| 35 to 44 Years | 90 (100.0%) | 0 (0.0%) |
| 45 to 54 Years | 192 (98.0%) | 4 (2.0%) |
| 55 to 64 Years | 102 (100.0%) | 0 (0.0%) |
| 65 to 74 Years | 118 (100.0%) | 0 (0.0%) |
| 75 Years and older | 95 (100.0%) | 0 (0.0%) |
| Total | 1,019 (99.6%) | 4 (0.4%) |
Health Insurance Coverage by Citizenship Status in Chevy Chase Section Three
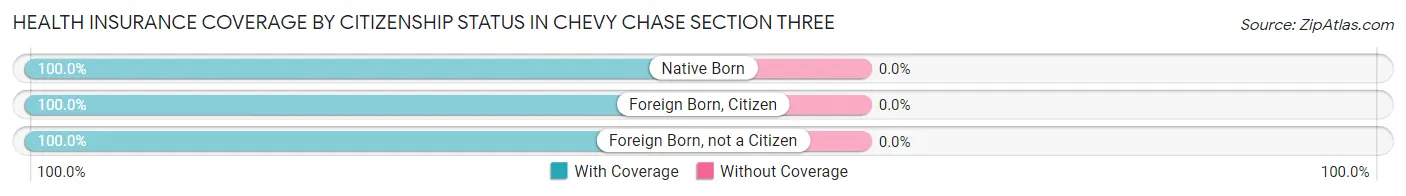
| Citizenship Status | With Coverage | Without Coverage |
| Native Born | 67 (100.0%) | 0 (0.0%) |
| Foreign Born, Citizen | 297 (100.0%) | 0 (0.0%) |
| Foreign Born, not a Citizen | 21 (100.0%) | 0 (0.0%) |
Health Insurance Coverage by Household Income in Chevy Chase Section Three
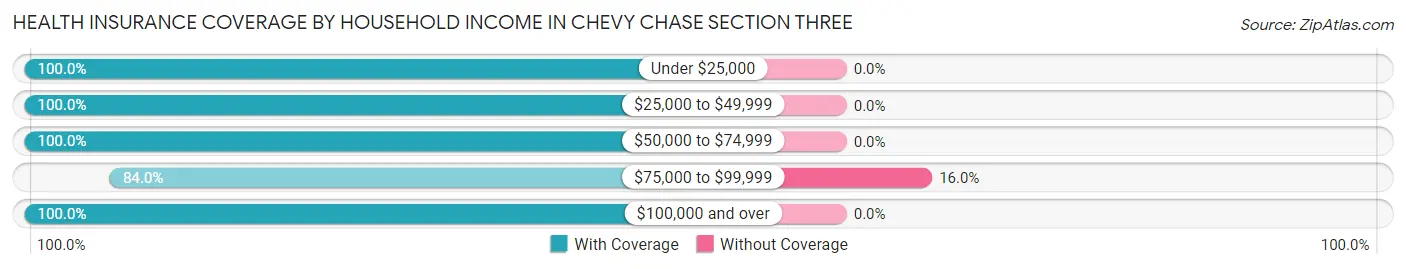
| Household Income | With Coverage | Without Coverage |
| Under $25,000 | 11 (100.0%) | 0 (0.0%) |
| $25,000 to $49,999 | 17 (100.0%) | 0 (0.0%) |
| $50,000 to $74,999 | 7 (100.0%) | 0 (0.0%) |
| $75,000 to $99,999 | 21 (84.0%) | 4 (16.0%) |
| $100,000 and over | 963 (100.0%) | 0 (0.0%) |
Public vs Private Health Insurance Coverage by Age in Chevy Chase Section Three
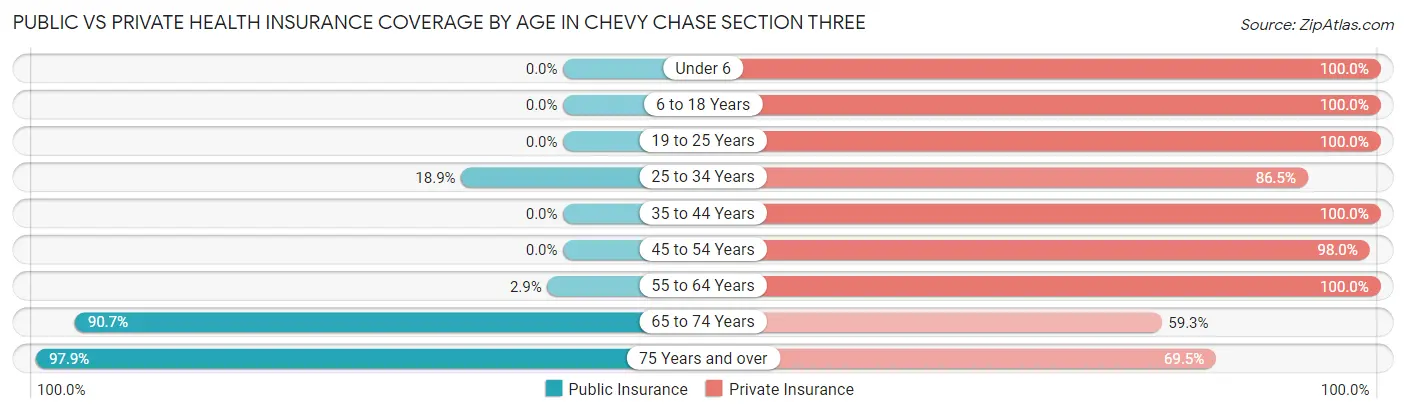
| Age Bracket | Public Insurance | Private Insurance |
| Under 6 | 0 (0.0%) | 67 (100.0%) |
| 6 to 18 Years | 0 (0.0%) | 297 (100.0%) |
| 19 to 25 Years | 0 (0.0%) | 21 (100.0%) |
| 25 to 34 Years | 7 (18.9%) | 32 (86.5%) |
| 35 to 44 Years | 0 (0.0%) | 90 (100.0%) |
| 45 to 54 Years | 0 (0.0%) | 192 (98.0%) |
| 55 to 64 Years | 3 (2.9%) | 102 (100.0%) |
| 65 to 74 Years | 107 (90.7%) | 70 (59.3%) |
| 75 Years and over | 93 (97.9%) | 66 (69.5%) |
| Total | 210 (20.5%) | 937 (91.6%) |
Disability Status by Sex by Age in Chevy Chase Section Three
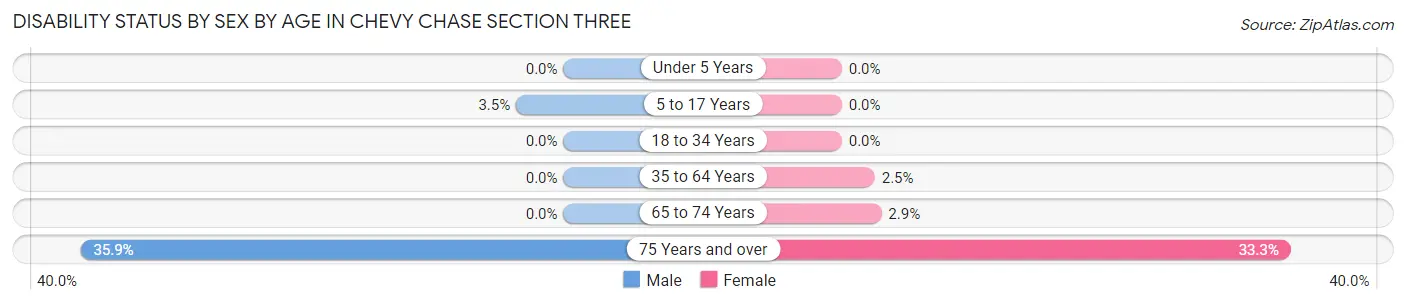
| Age Bracket | Male | Female |
| Under 5 Years | 0 (0.0%) | 0 (0.0%) |
| 5 to 17 Years | 4 (3.5%) | 0 (0.0%) |
| 18 to 34 Years | 0 (0.0%) | 0 (0.0%) |
| 35 to 64 Years | 0 (0.0%) | 5 (2.5%) |
| 65 to 74 Years | 0 (0.0%) | 2 (2.9%) |
| 75 Years and over | 19 (35.8%) | 14 (33.3%) |
Disability Class by Sex by Age in Chevy Chase Section Three
Disability Class: Hearing Difficulty
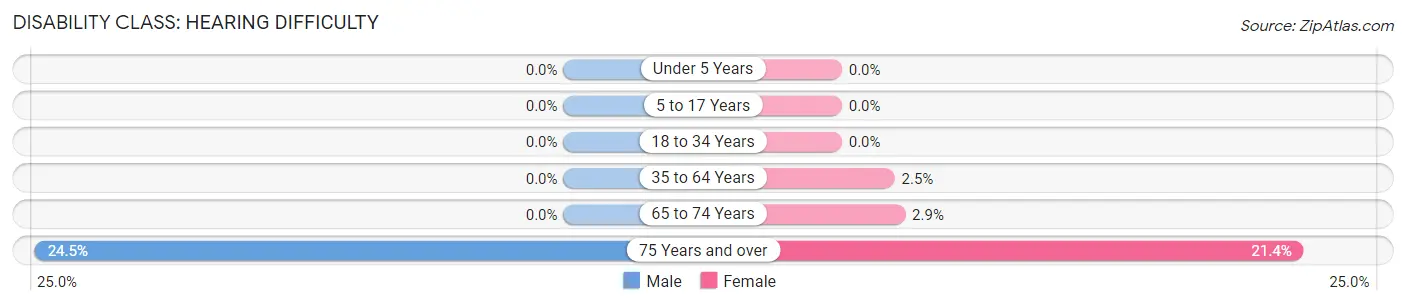
| Age Bracket | Male | Female |
| Under 5 Years | 0 (0.0%) | 0 (0.0%) |
| 5 to 17 Years | 0 (0.0%) | 0 (0.0%) |
| 18 to 34 Years | 0 (0.0%) | 0 (0.0%) |
| 35 to 64 Years | 0 (0.0%) | 5 (2.5%) |
| 65 to 74 Years | 0 (0.0%) | 2 (2.9%) |
| 75 Years and over | 13 (24.5%) | 9 (21.4%) |
Disability Class: Vision Difficulty
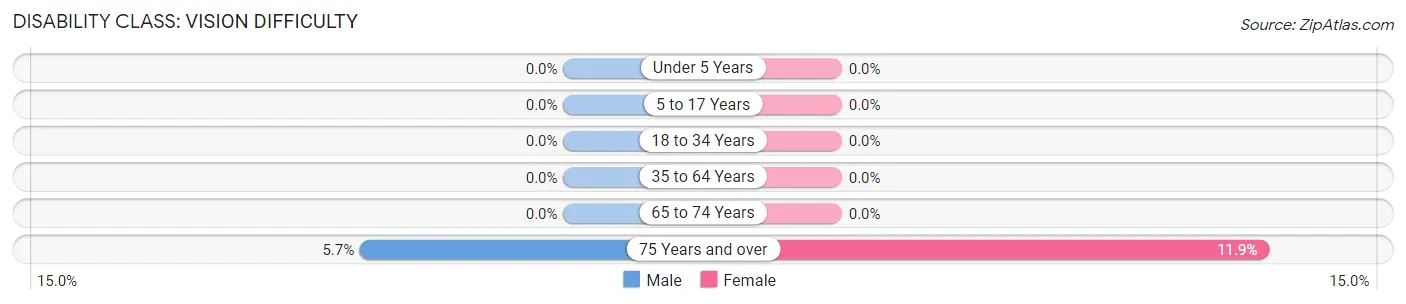
| Age Bracket | Male | Female |
| Under 5 Years | 0 (0.0%) | 0 (0.0%) |
| 5 to 17 Years | 0 (0.0%) | 0 (0.0%) |
| 18 to 34 Years | 0 (0.0%) | 0 (0.0%) |
| 35 to 64 Years | 0 (0.0%) | 0 (0.0%) |
| 65 to 74 Years | 0 (0.0%) | 0 (0.0%) |
| 75 Years and over | 3 (5.7%) | 5 (11.9%) |
Disability Class: Cognitive Difficulty
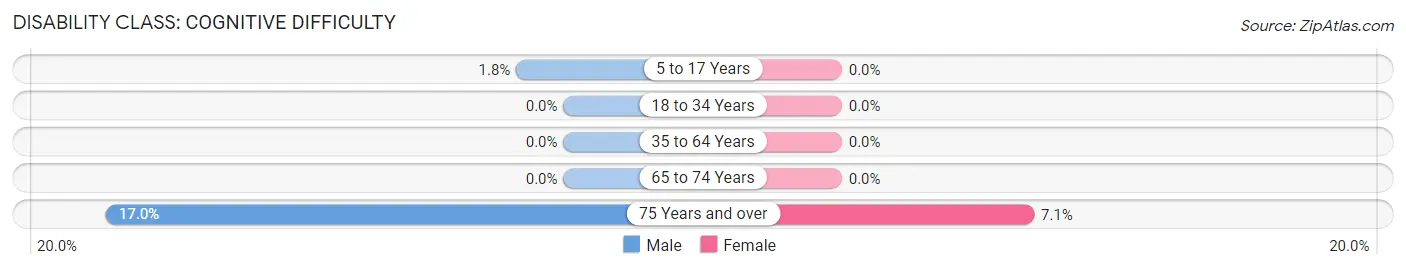
| Age Bracket | Male | Female |
| 5 to 17 Years | 2 (1.8%) | 0 (0.0%) |
| 18 to 34 Years | 0 (0.0%) | 0 (0.0%) |
| 35 to 64 Years | 0 (0.0%) | 0 (0.0%) |
| 65 to 74 Years | 0 (0.0%) | 0 (0.0%) |
| 75 Years and over | 9 (17.0%) | 3 (7.1%) |
Disability Class: Ambulatory Difficulty
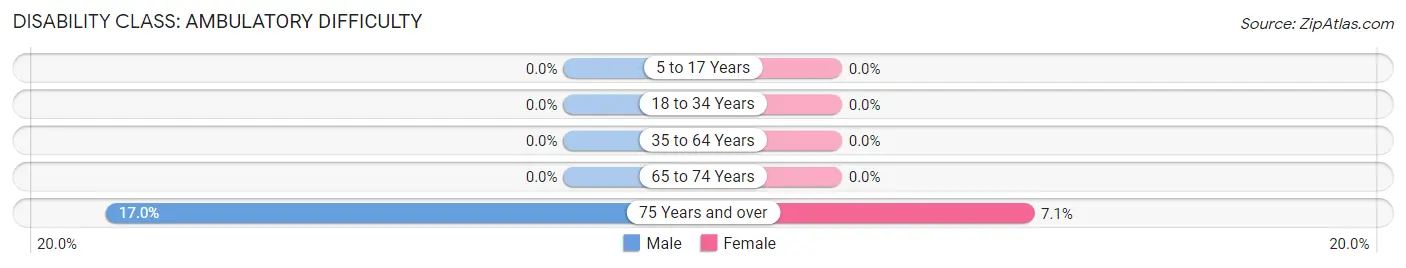
| Age Bracket | Male | Female |
| 5 to 17 Years | 0 (0.0%) | 0 (0.0%) |
| 18 to 34 Years | 0 (0.0%) | 0 (0.0%) |
| 35 to 64 Years | 0 (0.0%) | 0 (0.0%) |
| 65 to 74 Years | 0 (0.0%) | 0 (0.0%) |
| 75 Years and over | 9 (17.0%) | 3 (7.1%) |
Disability Class: Self-Care Difficulty
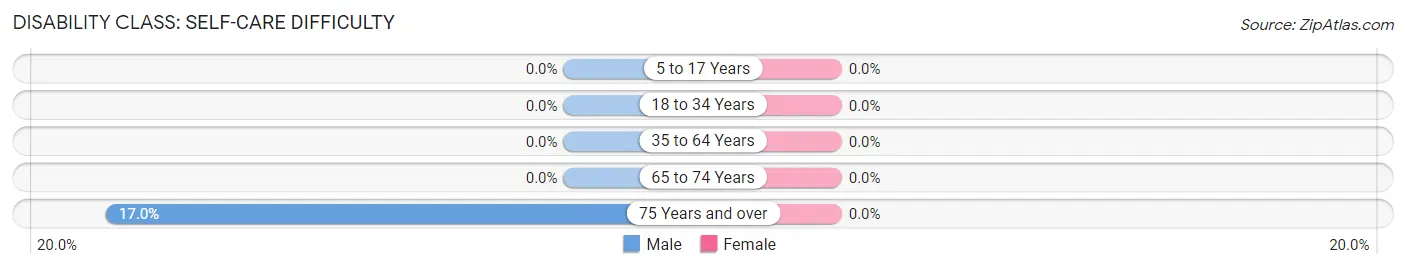
| Age Bracket | Male | Female |
| 5 to 17 Years | 0 (0.0%) | 0 (0.0%) |
| 18 to 34 Years | 0 (0.0%) | 0 (0.0%) |
| 35 to 64 Years | 0 (0.0%) | 0 (0.0%) |
| 65 to 74 Years | 0 (0.0%) | 0 (0.0%) |
| 75 Years and over | 9 (17.0%) | 0 (0.0%) |
Technology Access in Chevy Chase Section Three
Computing Device Access in Chevy Chase Section Three
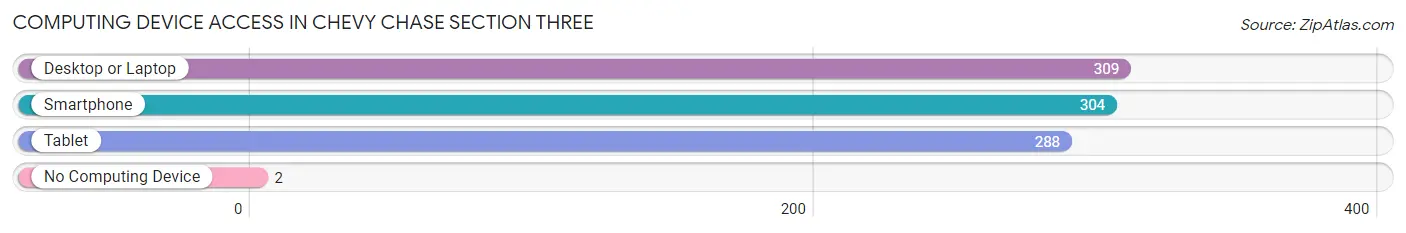
| Device Type | # Households | % Households |
| Desktop or Laptop | 309 | 98.4% |
| Smartphone | 304 | 96.8% |
| Tablet | 288 | 91.7% |
| No Computing Device | 2 | 0.6% |
| Total | 314 | 100.0% |
Internet Access in Chevy Chase Section Three
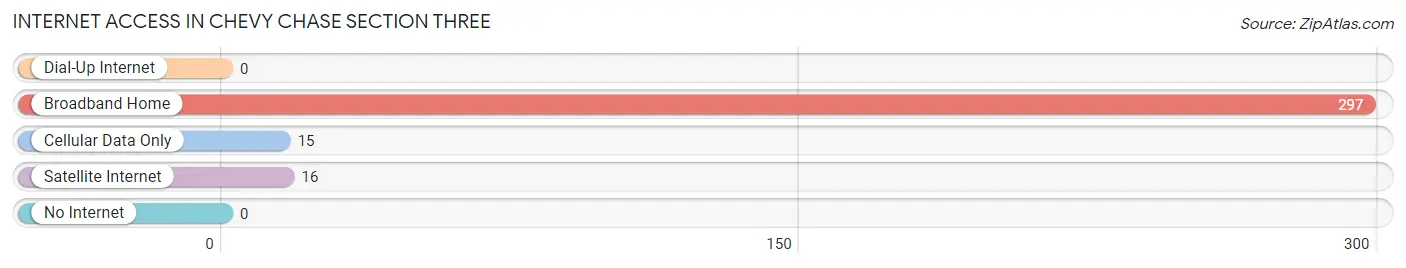
| Internet Type | # Households | % Households |
| Dial-Up Internet | 0 | 0.0% |
| Broadband Home | 297 | 94.6% |
| Cellular Data Only | 15 | 4.8% |
| Satellite Internet | 16 | 5.1% |
| No Internet | 0 | 0.0% |
| Total | 314 | 100.0% |
Chevy Chase Section Three Summary
Chevy Chase Section Three is a small, unincorporated community located in Montgomery County, Maryland. It is situated between the cities of Bethesda and Silver Spring, and is part of the Washington, D.C. metropolitan area. The community is bordered by the Capital Beltway (I-495) to the north, Connecticut Avenue to the east, Jones Mill Road to the south, and Rock Creek Park to the west.
History
Chevy Chase Section Three was originally part of a larger tract of land known as the “Chevy Chase Land Company”, which was established in 1890 by a group of wealthy Washingtonians. The land was divided into five sections, with Section Three being the smallest and most rural of the five. The area was largely undeveloped until the 1950s, when the construction of the Capital Beltway spurred development in the area.
Geography
Chevy Chase Section Three is located in the Piedmont region of Maryland, and is characterized by rolling hills and wooded areas. The community is situated at an elevation of approximately 400 feet above sea level. The area is drained by Rock Creek, which flows through the western portion of the community.
Economy
Chevy Chase Section Three is primarily a residential community, with no major commercial or industrial centers. The area is home to a number of small businesses, including restaurants, retail stores, and professional services. The community is also home to a number of government agencies, including the National Institutes of Health and the National Institute of Standards and Technology.
Demographics
As of the 2010 census, the population of Chevy Chase Section Three was 8,845. The racial makeup of the community was 79.3% White, 8.2% African American, 5.2% Asian, and 4.3% Hispanic or Latino. The median household income was $133,945, and the median home value was $817,500.
Chevy Chase Section Three is a small, affluent community with a diverse population. The area is home to a number of government agencies, and is a popular destination for those seeking a quiet, suburban lifestyle.
Common Questions
What is Per Capita Income in Chevy Chase Section Three?
Per Capita income in Chevy Chase Section Three is $137,679.
What is the Median Family Income in Chevy Chase Section Three?
Median Family Income in Chevy Chase Section Three is $250,001.
What is the Median Household income in Chevy Chase Section Three?
Median Household Income in Chevy Chase Section Three is $250,001.
What is Income or Wage Gap in Chevy Chase Section Three?
Income or Wage Gap in Chevy Chase Section Three is 6.7%.
Women in Chevy Chase Section Three earn 93.3 cents for every dollar earned by a man.
What is Inequality or Gini Index in Chevy Chase Section Three?
Inequality or Gini Index in Chevy Chase Section Three is 0.42.
What is the Total Population of Chevy Chase Section Three?
Total Population of Chevy Chase Section Three is 1,026.
What is the Total Male Population of Chevy Chase Section Three?
Total Male Population of Chevy Chase Section Three is 480.
What is the Total Female Population of Chevy Chase Section Three?
Total Female Population of Chevy Chase Section Three is 546.
What is the Ratio of Males per 100 Females in Chevy Chase Section Three?
There are 87.91 Males per 100 Females in Chevy Chase Section Three.
What is the Ratio of Females per 100 Males in Chevy Chase Section Three?
There are 113.75 Females per 100 Males in Chevy Chase Section Three.
What is the Median Population Age in Chevy Chase Section Three?
Median Population Age in Chevy Chase Section Three is 44.8 Years.
What is the Average Family Size in Chevy Chase Section Three
Average Family Size in Chevy Chase Section Three is 3.4 People.
What is the Average Household Size in Chevy Chase Section Three
Average Household Size in Chevy Chase Section Three is 3.3 People.
How Large is the Labor Force in Chevy Chase Section Three?
There are 450 People in the Labor Forcein in Chevy Chase Section Three.
What is the Percentage of People in the Labor Force in Chevy Chase Section Three?
64.7% of People are in the Labor Force in Chevy Chase Section Three.
What is the Unemployment Rate in Chevy Chase Section Three?
Unemployment Rate in Chevy Chase Section Three is 0.7%.