Ulm, MT Map & Demographics
Ulm Map
Ulm Overview
$38,943
PER CAPITA INCOME
$118,167
AVG FAMILY INCOME
$100,750
AVG HOUSEHOLD INCOME
25.0%
WAGE / INCOME GAP [ % ]
75.0¢/ $1
WAGE / INCOME GAP [ $ ]
0.34
INEQUALITY / GINI INDEX
919
TOTAL POPULATION
545
MALE POPULATION
374
FEMALE POPULATION
145.72
MALES / 100 FEMALES
68.62
FEMALES / 100 MALES
34.8
MEDIAN AGE
3.4
AVG FAMILY SIZE
3.0
AVG HOUSEHOLD SIZE
434
LABOR FORCE [ PEOPLE ]
65.1%
PERCENT IN LABOR FORCE
3.0%
UNEMPLOYMENT RATE
Ulm Zip Codes
Ulm Area Codes
Income in Ulm
Income Overview in Ulm
Per Capita Income in Ulm is $38,943, while median incomes of families and households are $118,167 and $100,750 respectively.
| Characteristic | Number | Measure |
| Per Capita Income | 919 | $38,943 |
| Median Family Income | 252 | $118,167 |
| Mean Family Income | 252 | $127,809 |
| Median Household Income | 302 | $100,750 |
| Mean Household Income | 302 | $114,905 |
| Income Deficit | 252 | $0 |
| Wage / Income Gap (%) | 919 | 25.04% |
| Wage / Income Gap ($) | 919 | 74.96¢ per $1 |
| Gini / Inequality Index | 919 | 0.34 |
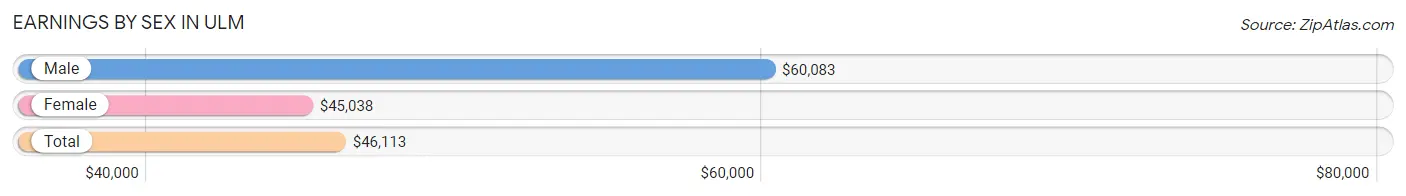
Earnings by Sex in Ulm
Average Earnings in Ulm are $46,113, $60,083 for men and $45,038 for women, a difference of 25.0%.
| Sex | Number | Average Earnings |
| Male | 241 (53.2%) | $60,083 |
| Female | 212 (46.8%) | $45,038 |
| Total | 453 (100.0%) | $46,113 |
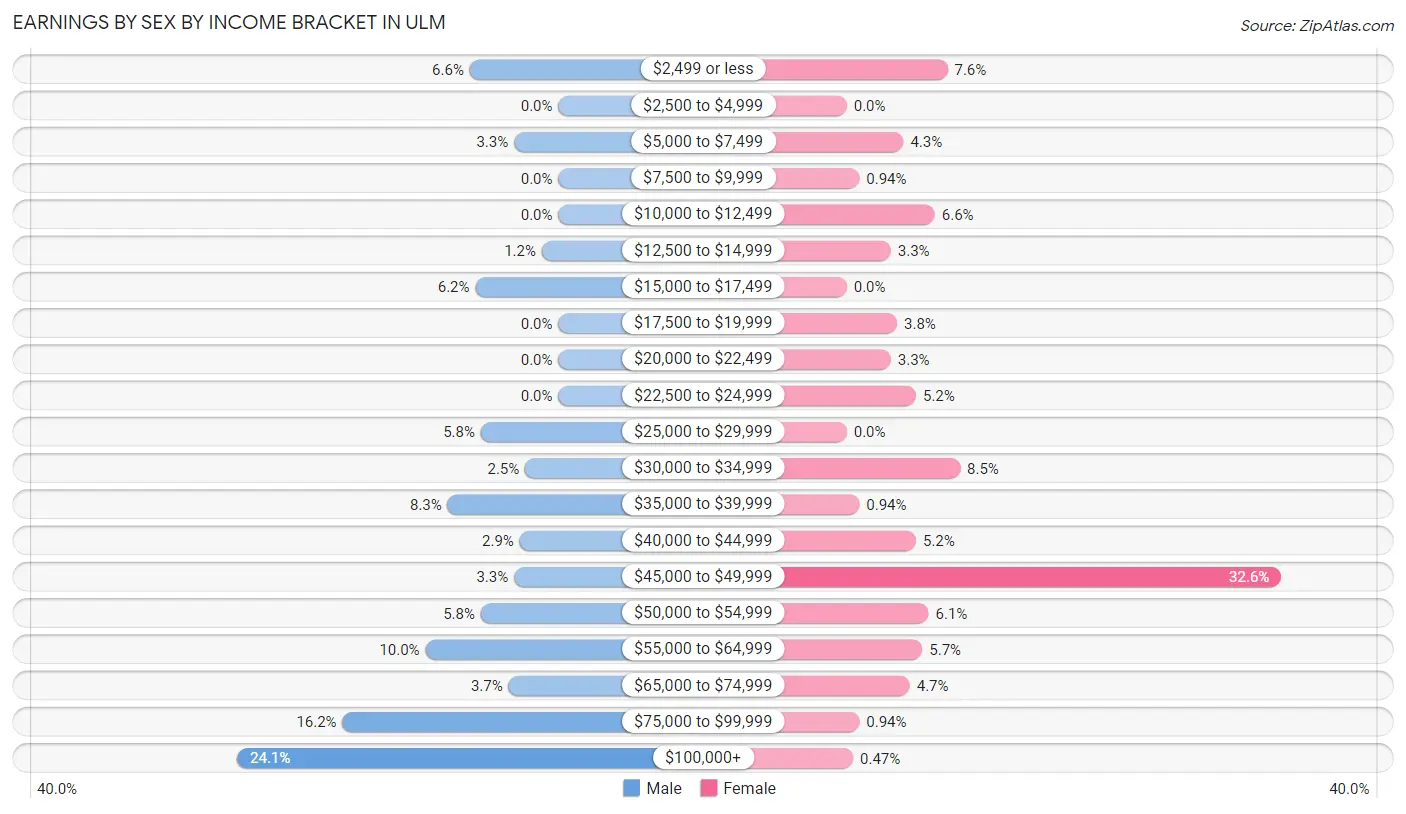
Earnings by Sex by Income Bracket in Ulm
The most common earnings brackets in Ulm are $100,000+ for men (58 | 24.1%) and $45,000 to $49,999 for women (69 | 32.6%).
| Income | Male | Female |
| $2,499 or less | 16 (6.6%) | 16 (7.5%) |
| $2,500 to $4,999 | 0 (0.0%) | 0 (0.0%) |
| $5,000 to $7,499 | 8 (3.3%) | 9 (4.3%) |
| $7,500 to $9,999 | 0 (0.0%) | 2 (0.9%) |
| $10,000 to $12,499 | 0 (0.0%) | 14 (6.6%) |
| $12,500 to $14,999 | 3 (1.2%) | 7 (3.3%) |
| $15,000 to $17,499 | 15 (6.2%) | 0 (0.0%) |
| $17,500 to $19,999 | 0 (0.0%) | 8 (3.8%) |
| $20,000 to $22,499 | 0 (0.0%) | 7 (3.3%) |
| $22,500 to $24,999 | 0 (0.0%) | 11 (5.2%) |
| $25,000 to $29,999 | 14 (5.8%) | 0 (0.0%) |
| $30,000 to $34,999 | 6 (2.5%) | 18 (8.5%) |
| $35,000 to $39,999 | 20 (8.3%) | 2 (0.9%) |
| $40,000 to $44,999 | 7 (2.9%) | 11 (5.2%) |
| $45,000 to $49,999 | 8 (3.3%) | 69 (32.6%) |
| $50,000 to $54,999 | 14 (5.8%) | 13 (6.1%) |
| $55,000 to $64,999 | 24 (10.0%) | 12 (5.7%) |
| $65,000 to $74,999 | 9 (3.7%) | 10 (4.7%) |
| $75,000 to $99,999 | 39 (16.2%) | 2 (0.9%) |
| $100,000+ | 58 (24.1%) | 1 (0.5%) |
| Total | 241 (100.0%) | 212 (100.0%) |
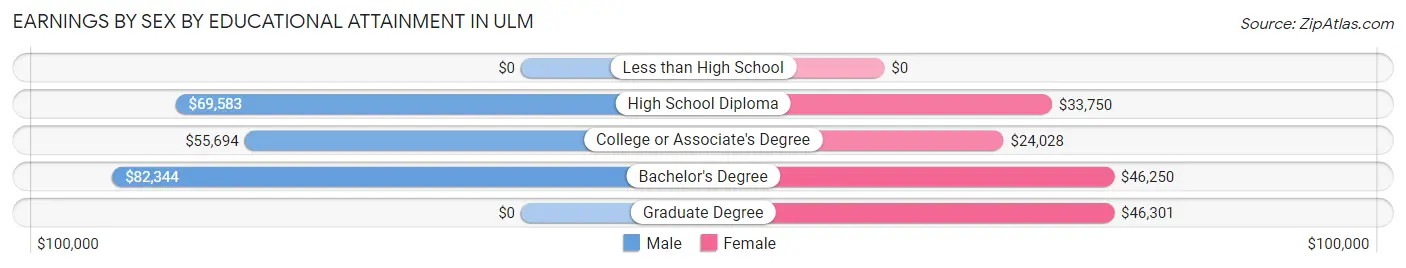
Earnings by Sex by Educational Attainment in Ulm
Average earnings in Ulm are $68,472 for men and $45,500 for women, a difference of 33.6%. Men with an educational attainment of bachelor's degree enjoy the highest average annual earnings of $82,344, while those with college or associate's degree education earn the least with $55,694. Women with an educational attainment of graduate degree earn the most with the average annual earnings of $46,301, while those with college or associate's degree education have the smallest earnings of $24,028.
| Educational Attainment | Male Income | Female Income |
| Less than High School | - | - |
| High School Diploma | $69,583 | $33,750 |
| College or Associate's Degree | $55,694 | $24,028 |
| Bachelor's Degree | $82,344 | $46,250 |
| Graduate Degree | - | - |
| Total | $68,472 | $45,500 |
Family Income in Ulm
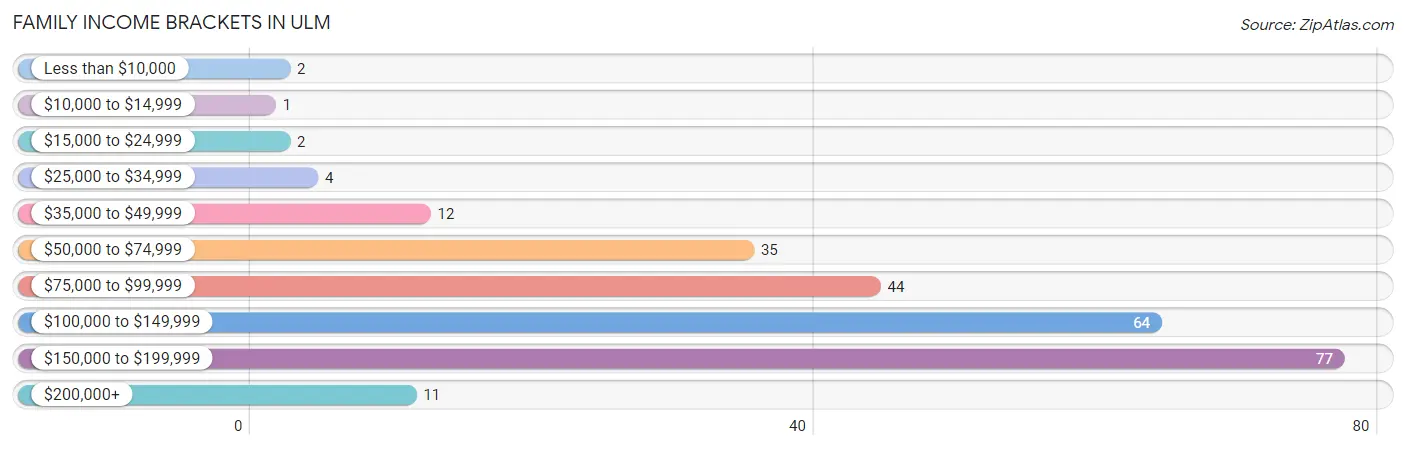
Family Income Brackets in Ulm
According to the Ulm family income data, there are 77 families falling into the $150,000 to $199,999 income range, which is the most common income bracket and makes up 30.6% of all families. Conversely, the $10,000 to $14,999 income bracket is the least frequent group with only 1 families (0.4%) belonging to this category.
| Income Bracket | # Families | % Families |
| Less than $10,000 | 2 | 0.8% |
| $10,000 to $14,999 | 1 | 0.4% |
| $15,000 to $24,999 | 2 | 0.8% |
| $25,000 to $34,999 | 4 | 1.6% |
| $35,000 to $49,999 | 12 | 4.8% |
| $50,000 to $74,999 | 35 | 13.9% |
| $75,000 to $99,999 | 44 | 17.5% |
| $100,000 to $149,999 | 64 | 25.4% |
| $150,000 to $199,999 | 77 | 30.6% |
| $200,000+ | 11 | 4.4% |
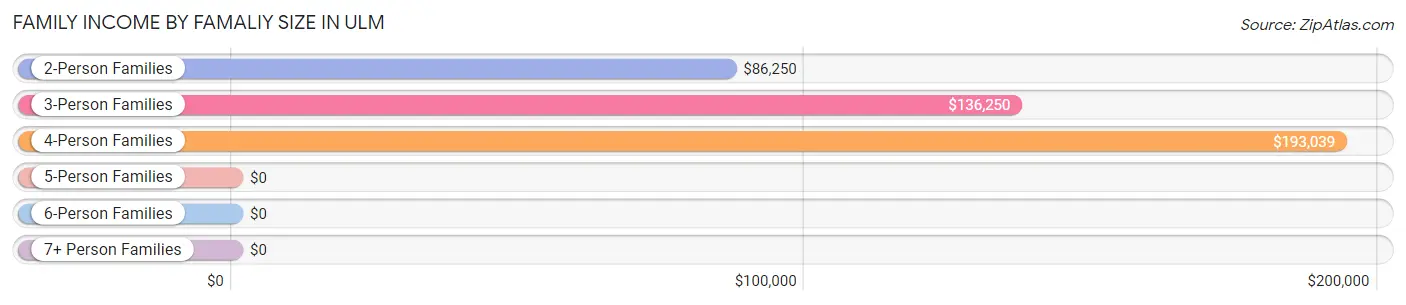
Family Income by Famaliy Size in Ulm
4-person families (80 | 31.8%) account for the highest median family income in Ulm with $193,039 per family, while 4-person families (80 | 31.8%) have the highest median income of $48,260 per family member.
| Income Bracket | # Families | Median Income |
| 2-Person Families | 95 (37.7%) | $86,250 |
| 3-Person Families | 50 (19.8%) | $136,250 |
| 4-Person Families | 80 (31.8%) | $193,039 |
| 5-Person Families | 14 (5.6%) | $0 |
| 6-Person Families | 6 (2.4%) | $0 |
| 7+ Person Families | 7 (2.8%) | $0 |
| Total | 252 (100.0%) | $118,167 |
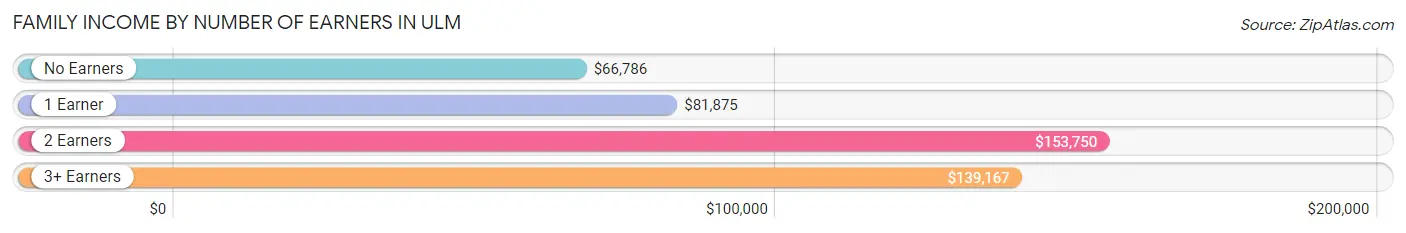
Family Income by Number of Earners in Ulm
The median family income in Ulm is $118,167, with families comprising 2 earners (128) having the highest median family income of $153,750, while families with no earners (46) have the lowest median family income of $66,786, accounting for 50.8% and 18.2% of families, respectively.
| Number of Earners | # Families | Median Income |
| No Earners | 46 (18.2%) | $66,786 |
| 1 Earner | 30 (11.9%) | $81,875 |
| 2 Earners | 128 (50.8%) | $153,750 |
| 3+ Earners | 48 (19.1%) | $139,167 |
| Total | 252 (100.0%) | $118,167 |
Household Income in Ulm
Household Income Brackets in Ulm
With 79 households falling in the category, the $150,000 to $199,999 income range is the most frequent in Ulm, accounting for 26.2% of all households. In contrast, only 2 households (0.7%) fall into the less than $10,000 income bracket, making it the least populous group.

| Income Bracket | # Households | % Households |
| Less than $10,000 | 2 | 0.7% |
| $10,000 to $14,999 | 6 | 2.0% |
| $15,000 to $24,999 | 4 | 1.3% |
| $25,000 to $34,999 | 15 | 5.0% |
| $35,000 to $49,999 | 22 | 7.3% |
| $50,000 to $74,999 | 55 | 18.2% |
| $75,000 to $99,999 | 44 | 14.6% |
| $100,000 to $149,999 | 64 | 21.2% |
| $150,000 to $199,999 | 79 | 26.2% |
| $200,000+ | 11 | 3.6% |
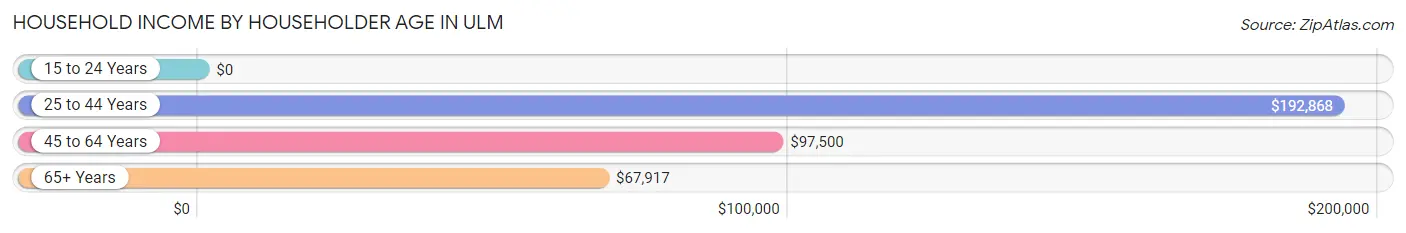
Household Income by Householder Age in Ulm
The median household income in Ulm is $100,750, with the highest median household income of $192,868 found in the 25 to 44 years age bracket for the primary householder. A total of 91 households (30.1%) fall into this category.
| Income Bracket | # Households | Median Income |
| 15 to 24 Years | 0 (0.0%) | $0 |
| 25 to 44 Years | 91 (30.1%) | $192,868 |
| 45 to 64 Years | 118 (39.1%) | $97,500 |
| 65+ Years | 93 (30.8%) | $67,917 |
| Total | 302 (100.0%) | $100,750 |
Poverty in Ulm
Income Below Poverty by Sex and Age in Ulm
With 1.1% poverty level for males and 6.1% for females among the residents of Ulm, under 5 year old males and 35 to 44 year old females are the most vulnerable to poverty, with 2 males (66.7%) and 9 females (25.0%) in their respective age groups living below the poverty level.
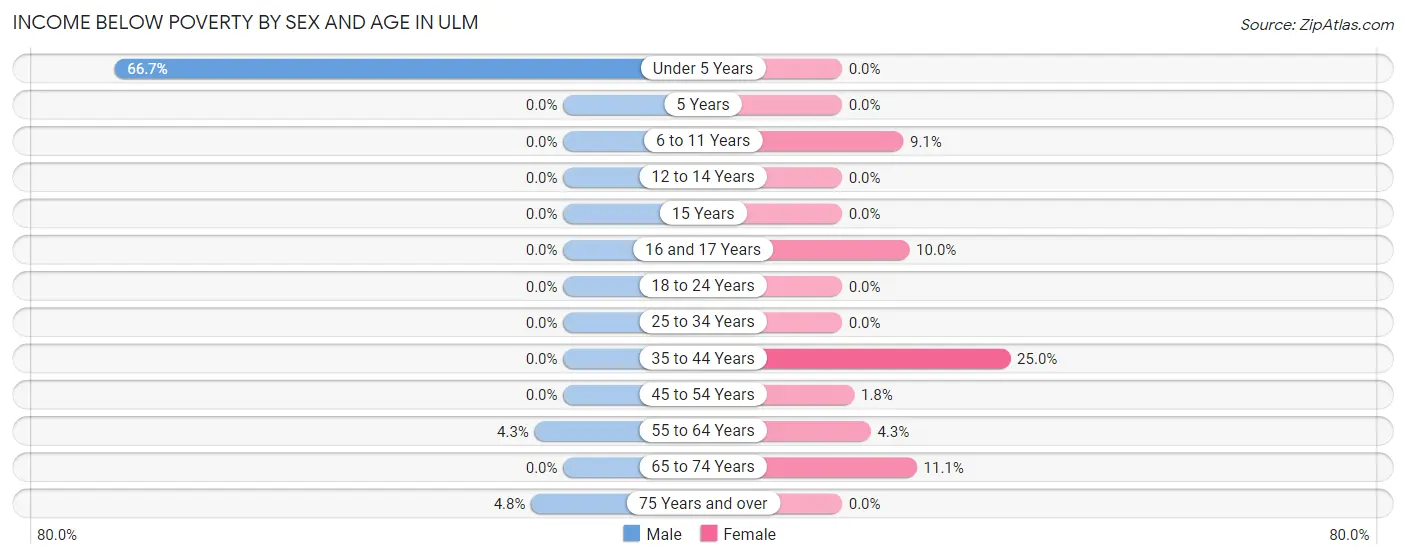
| Age Bracket | Male | Female |
| Under 5 Years | 2 (66.7%) | 0 (0.0%) |
| 5 Years | 0 (0.0%) | 0 (0.0%) |
| 6 to 11 Years | 0 (0.0%) | 3 (9.1%) |
| 12 to 14 Years | 0 (0.0%) | 0 (0.0%) |
| 15 Years | 0 (0.0%) | 0 (0.0%) |
| 16 and 17 Years | 0 (0.0%) | 2 (10.0%) |
| 18 to 24 Years | 0 (0.0%) | 0 (0.0%) |
| 25 to 34 Years | 0 (0.0%) | 0 (0.0%) |
| 35 to 44 Years | 0 (0.0%) | 9 (25.0%) |
| 45 to 54 Years | 0 (0.0%) | 1 (1.8%) |
| 55 to 64 Years | 2 (4.3%) | 2 (4.3%) |
| 65 to 74 Years | 0 (0.0%) | 6 (11.1%) |
| 75 Years and over | 2 (4.8%) | 0 (0.0%) |
| Total | 6 (1.1%) | 23 (6.1%) |
Income Above Poverty by Sex and Age in Ulm
According to the poverty statistics in Ulm, males aged 5 years and females aged under 5 years are the age groups that are most secure financially, with 100.0% of males and 100.0% of females in these age groups living above the poverty line.
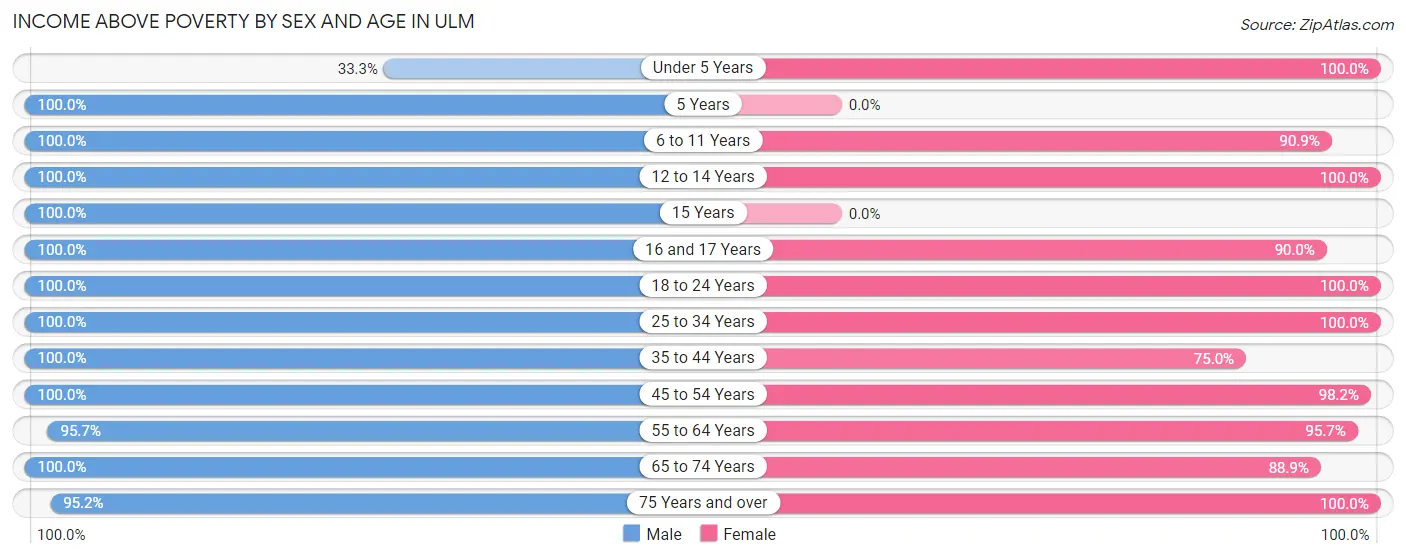
| Age Bracket | Male | Female |
| Under 5 Years | 1 (33.3%) | 12 (100.0%) |
| 5 Years | 57 (100.0%) | 0 (0.0%) |
| 6 to 11 Years | 89 (100.0%) | 30 (90.9%) |
| 12 to 14 Years | 20 (100.0%) | 20 (100.0%) |
| 15 Years | 18 (100.0%) | 0 (0.0%) |
| 16 and 17 Years | 20 (100.0%) | 18 (90.0%) |
| 18 to 24 Years | 28 (100.0%) | 10 (100.0%) |
| 25 to 34 Years | 72 (100.0%) | 66 (100.0%) |
| 35 to 44 Years | 37 (100.0%) | 27 (75.0%) |
| 45 to 54 Years | 63 (100.0%) | 54 (98.2%) |
| 55 to 64 Years | 45 (95.7%) | 45 (95.7%) |
| 65 to 74 Years | 49 (100.0%) | 48 (88.9%) |
| 75 Years and over | 40 (95.2%) | 21 (100.0%) |
| Total | 539 (98.9%) | 351 (93.9%) |
Income Below Poverty Among Married-Couple Families in Ulm
The poverty statistics for married-couple families in Ulm show that 0.8% or 2 of the total 240 families live below the poverty line. Families with no children have the highest poverty rate of 1.6%, comprising of 2 families. On the other hand, families with 1 or 2 children have the lowest poverty rate of 0.0%, which includes 0 families.
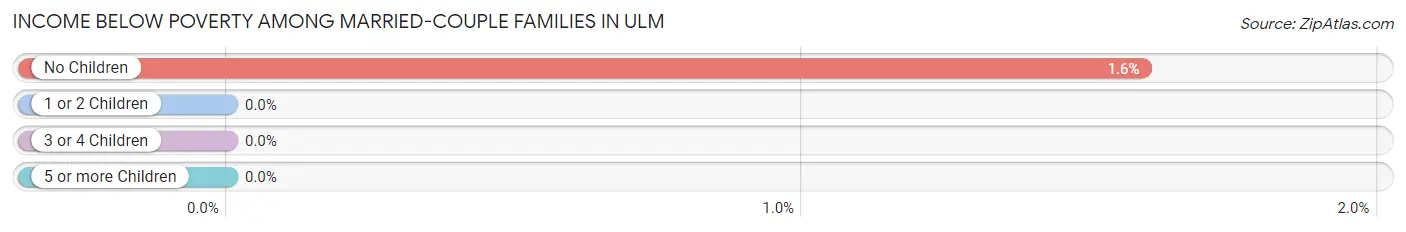
| Children | Above Poverty | Below Poverty |
| No Children | 124 (98.4%) | 2 (1.6%) |
| 1 or 2 Children | 87 (100.0%) | 0 (0.0%) |
| 3 or 4 Children | 22 (100.0%) | 0 (0.0%) |
| 5 or more Children | 5 (100.0%) | 0 (0.0%) |
| Total | 238 (99.2%) | 2 (0.8%) |
Income Below Poverty Among Single-Parent Households in Ulm
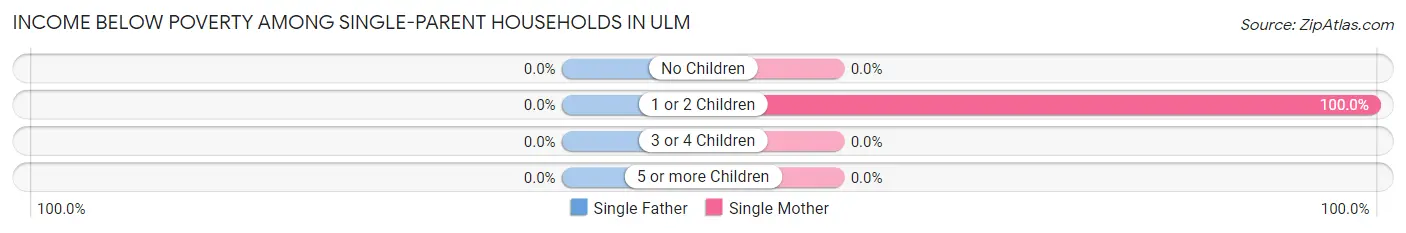
| Children | Single Father | Single Mother |
| No Children | 0 (0.0%) | 0 (0.0%) |
| 1 or 2 Children | 0 (0.0%) | 3 (100.0%) |
| 3 or 4 Children | 0 (0.0%) | 0 (0.0%) |
| 5 or more Children | 0 (0.0%) | 0 (0.0%) |
| Total | 0 (0.0%) | 3 (60.0%) |
Income Below Poverty Among Married-Couple vs Single-Parent Households in Ulm
The poverty data for Ulm shows that 2 of the married-couple family households (0.8%) and 3 of the single-parent households (25.0%) are living below the poverty level. Within the married-couple family households, those with no children have the highest poverty rate, with 2 households (1.6%) falling below the poverty line. Among the single-parent households, those with 1 or 2 children have the highest poverty rate, with 3 household (30.0%) living below poverty.
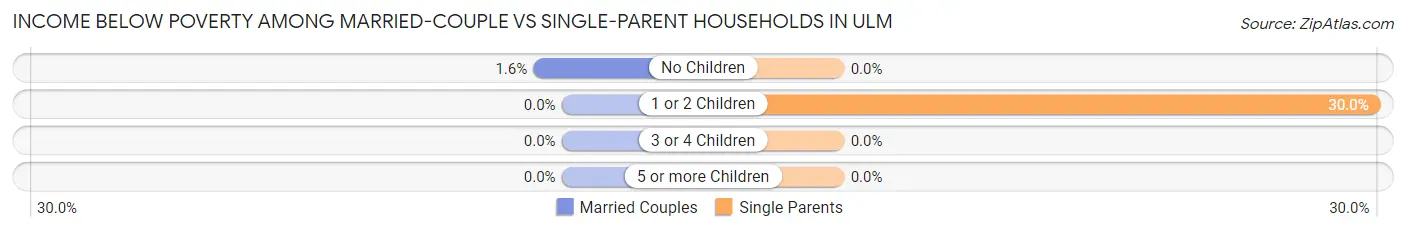
| Children | Married-Couple Families | Single-Parent Households |
| No Children | 2 (1.6%) | 0 (0.0%) |
| 1 or 2 Children | 0 (0.0%) | 3 (30.0%) |
| 3 or 4 Children | 0 (0.0%) | 0 (0.0%) |
| 5 or more Children | 0 (0.0%) | 0 (0.0%) |
| Total | 2 (0.8%) | 3 (25.0%) |
Race in Ulm
The most populous races in Ulm are White / Caucasian (848 | 92.3%), Two or more Races (57 | 6.2%), and Hispanic or Latino (24 | 2.6%).
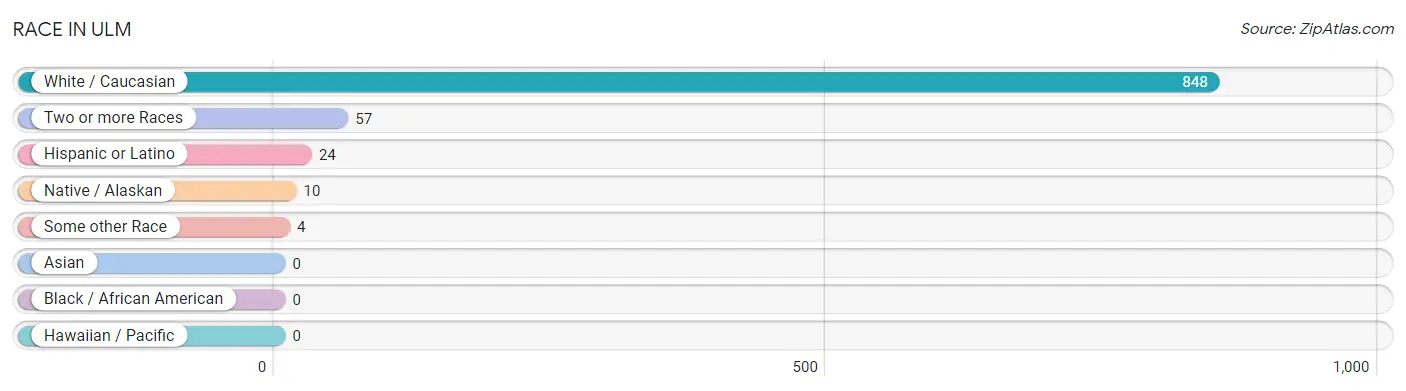
| Race | # Population | % Population |
| Asian | 0 | 0.0% |
| Black / African American | 0 | 0.0% |
| Hawaiian / Pacific | 0 | 0.0% |
| Hispanic or Latino | 24 | 2.6% |
| Native / Alaskan | 10 | 1.1% |
| White / Caucasian | 848 | 92.3% |
| Two or more Races | 57 | 6.2% |
| Some other Race | 4 | 0.4% |
| Total | 919 | 100.0% |
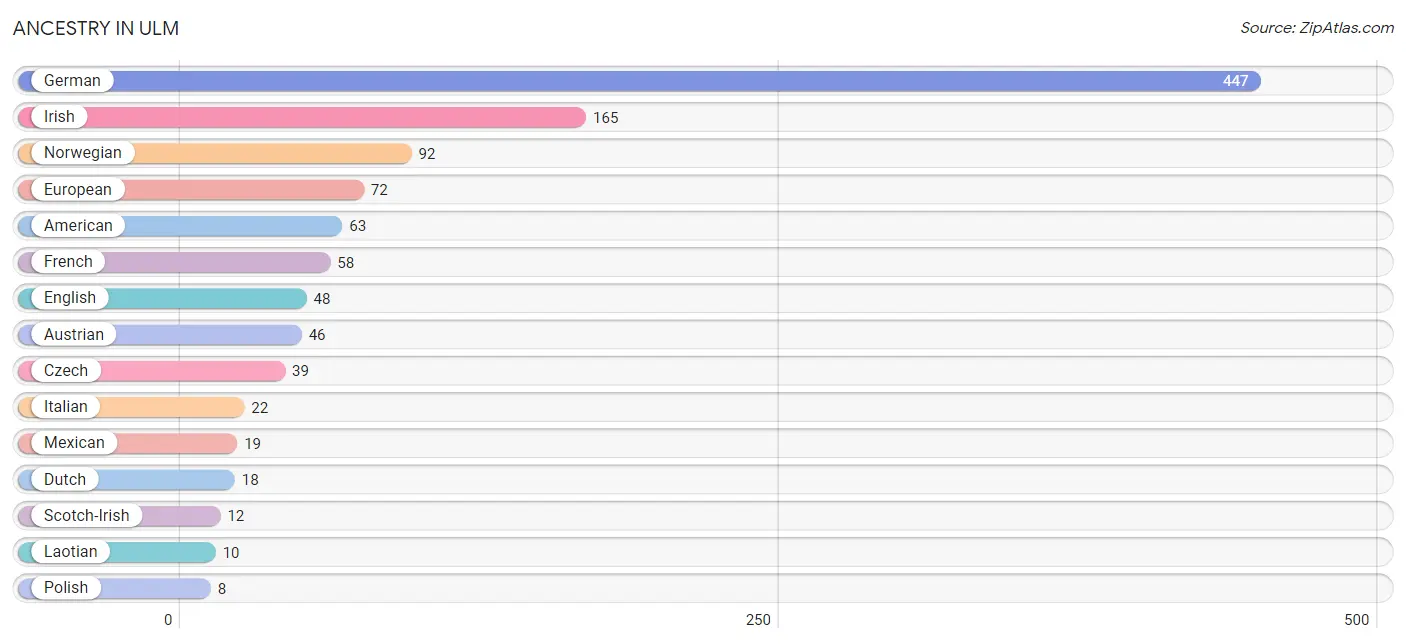
Ancestry in Ulm
The most populous ancestries reported in Ulm are German (447 | 48.6%), Irish (165 | 17.9%), Norwegian (92 | 10.0%), European (72 | 7.8%), and American (63 | 6.9%), together accounting for 91.3% of all Ulm residents.
| Ancestry | # Population | % Population |
| American | 63 | 6.9% |
| Austrian | 46 | 5.0% |
| British | 2 | 0.2% |
| Chippewa | 6 | 0.6% |
| Czech | 39 | 4.2% |
| Dutch | 18 | 2.0% |
| English | 48 | 5.2% |
| European | 72 | 7.8% |
| French | 58 | 6.3% |
| French Canadian | 4 | 0.4% |
| German | 447 | 48.6% |
| Irish | 165 | 17.9% |
| Italian | 22 | 2.4% |
| Laotian | 10 | 1.1% |
| Mexican | 19 | 2.1% |
| Norwegian | 92 | 10.0% |
| Polish | 8 | 0.9% |
| Scandinavian | 1 | 0.1% |
| Scotch-Irish | 12 | 1.3% |
| Scottish | 4 | 0.4% |
| Spanish | 5 | 0.5% |
| Swedish | 4 | 0.4% |
| Welsh | 2 | 0.2% | View All 23 Rows |
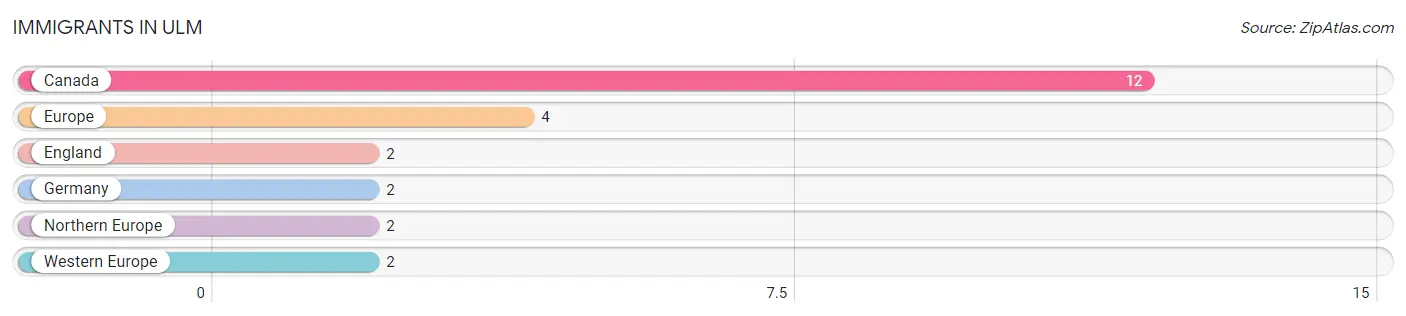
Immigrants in Ulm
The most numerous immigrant groups reported in Ulm came from Canada (12 | 1.3%), Europe (4 | 0.4%), England (2 | 0.2%), Germany (2 | 0.2%), and Northern Europe (2 | 0.2%), together accounting for 2.4% of all Ulm residents.
| Immigration Origin | # Population | % Population |
| Canada | 12 | 1.3% |
| England | 2 | 0.2% |
| Europe | 4 | 0.4% |
| Germany | 2 | 0.2% |
| Northern Europe | 2 | 0.2% |
| Western Europe | 2 | 0.2% | View All 6 Rows |
Sex and Age in Ulm
Sex and Age in Ulm
The most populous age groups in Ulm are 5 to 9 Years (138 | 25.3%) for men and 30 to 34 Years (56 | 15.0%) for women.
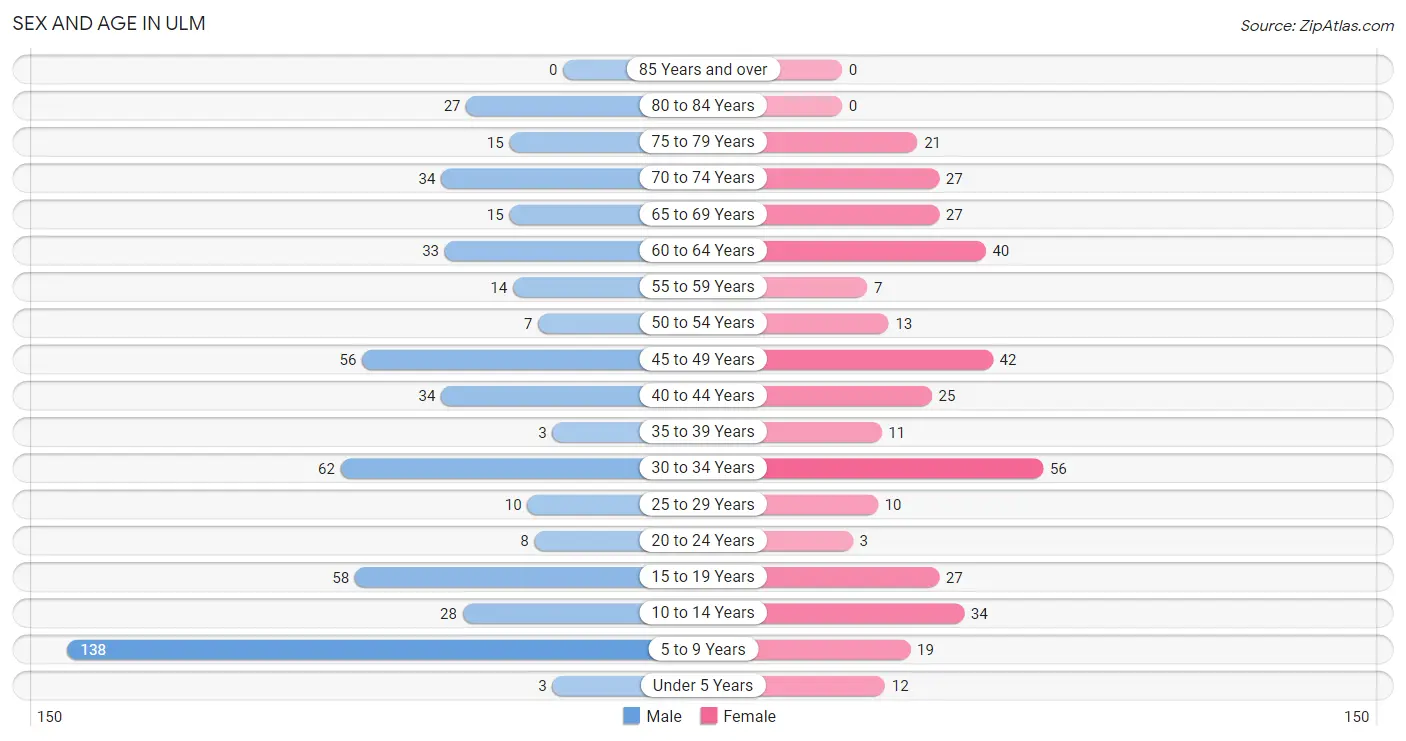
| Age Bracket | Male | Female |
| Under 5 Years | 3 (0.5%) | 12 (3.2%) |
| 5 to 9 Years | 138 (25.3%) | 19 (5.1%) |
| 10 to 14 Years | 28 (5.1%) | 34 (9.1%) |
| 15 to 19 Years | 58 (10.6%) | 27 (7.2%) |
| 20 to 24 Years | 8 (1.5%) | 3 (0.8%) |
| 25 to 29 Years | 10 (1.8%) | 10 (2.7%) |
| 30 to 34 Years | 62 (11.4%) | 56 (15.0%) |
| 35 to 39 Years | 3 (0.5%) | 11 (2.9%) |
| 40 to 44 Years | 34 (6.2%) | 25 (6.7%) |
| 45 to 49 Years | 56 (10.3%) | 42 (11.2%) |
| 50 to 54 Years | 7 (1.3%) | 13 (3.5%) |
| 55 to 59 Years | 14 (2.6%) | 7 (1.9%) |
| 60 to 64 Years | 33 (6.1%) | 40 (10.7%) |
| 65 to 69 Years | 15 (2.8%) | 27 (7.2%) |
| 70 to 74 Years | 34 (6.2%) | 27 (7.2%) |
| 75 to 79 Years | 15 (2.8%) | 21 (5.6%) |
| 80 to 84 Years | 27 (5.0%) | 0 (0.0%) |
| 85 Years and over | 0 (0.0%) | 0 (0.0%) |
| Total | 545 (100.0%) | 374 (100.0%) |
Families and Households in Ulm
Median Family Size in Ulm
The median family size in Ulm is 3.38 persons per family, with single male/father families (7 | 2.8%) accounting for the largest median family size of 4.14 persons per family. On the other hand, single female/mother families (5 | 2.0%) represent the smallest median family size with 2.60 persons per family.
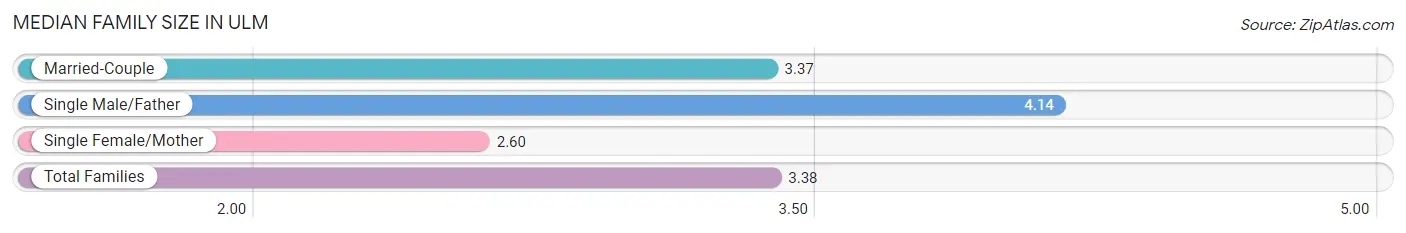
| Family Type | # Families | Family Size |
| Married-Couple | 240 (95.2%) | 3.37 |
| Single Male/Father | 7 (2.8%) | 4.14 |
| Single Female/Mother | 5 (2.0%) | 2.60 |
| Total Families | 252 (100.0%) | 3.38 |
Median Household Size in Ulm
The median household size in Ulm is 3.04 persons per household, with single male/father households (7 | 2.3%) accounting for the largest median household size of 5.14 persons per household. non-family households (50 | 16.6%) represent the smallest median household size with 1.12 persons per household.
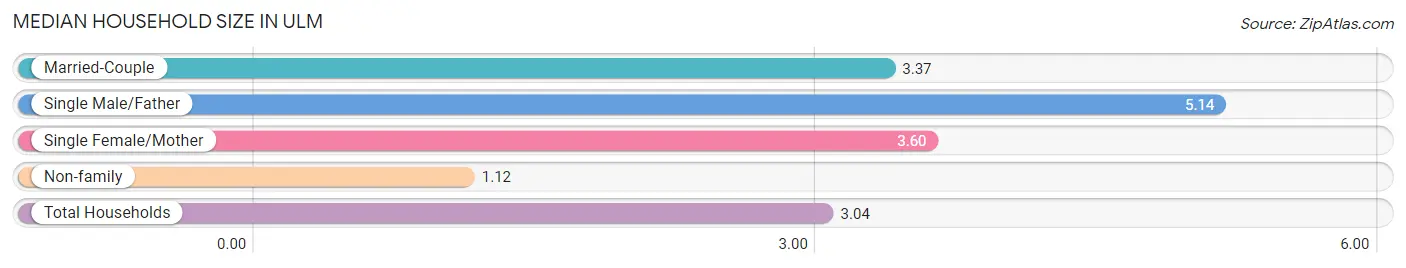
| Household Type | # Households | Household Size |
| Married-Couple | 240 (79.5%) | 3.37 |
| Single Male/Father | 7 (2.3%) | 5.14 |
| Single Female/Mother | 5 (1.7%) | 3.60 |
| Non-family | 50 (16.6%) | 1.12 |
| Total Households | 302 (100.0%) | 3.04 |
Household Size by Marriage Status in Ulm
Out of a total of 302 households in Ulm, 252 (83.4%) are family households, while 50 (16.6%) are nonfamily households. The most numerous type of family households are 2-person households, comprising 94, and the most common type of nonfamily households are 1-person households, comprising 43.
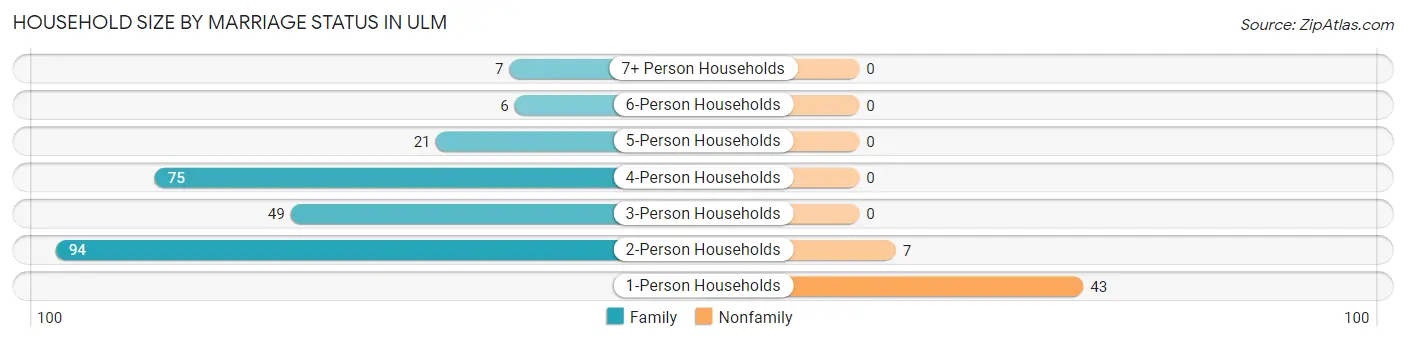
| Household Size | Family Households | Nonfamily Households |
| 1-Person Households | - | 43 (14.2%) |
| 2-Person Households | 94 (31.1%) | 7 (2.3%) |
| 3-Person Households | 49 (16.2%) | 0 (0.0%) |
| 4-Person Households | 75 (24.8%) | 0 (0.0%) |
| 5-Person Households | 21 (7.0%) | 0 (0.0%) |
| 6-Person Households | 6 (2.0%) | 0 (0.0%) |
| 7+ Person Households | 7 (2.3%) | 0 (0.0%) |
| Total | 252 (83.4%) | 50 (16.6%) |
Female Fertility in Ulm
Fertility by Age in Ulm
Average fertility rate in Ulm is 5.0 births per 1,000 women. Women in the age bracket of 35 to 50 years have the highest fertility rate with 11.0 births per 1,000 women. Women in the age bracket of 35 to 50 years acount for 100.0% of all women with births.
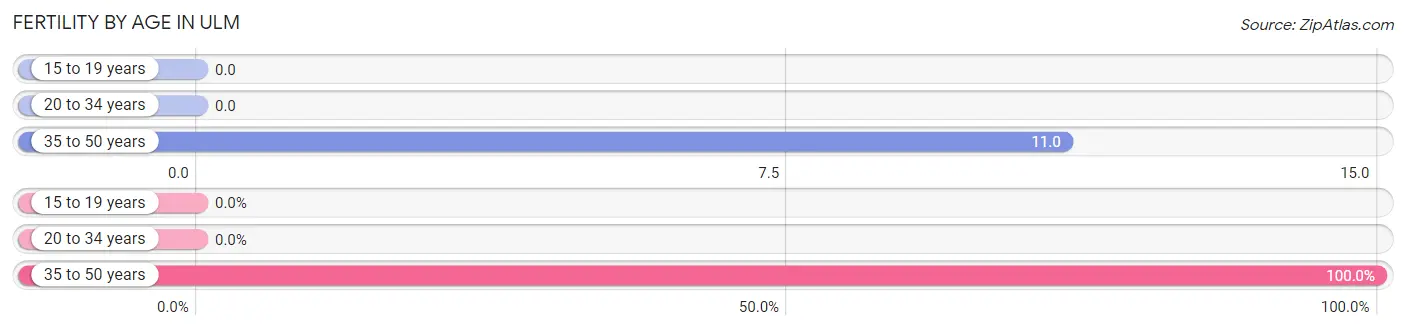
| Age Bracket | Women with Births | Births / 1,000 Women |
| 15 to 19 years | 0 (0.0%) | 0.0 |
| 20 to 34 years | 0 (0.0%) | 0.0 |
| 35 to 50 years | 1 (100.0%) | 11.0 |
| Total | 1 (100.0%) | 5.0 |
Fertility by Age by Marriage Status in Ulm
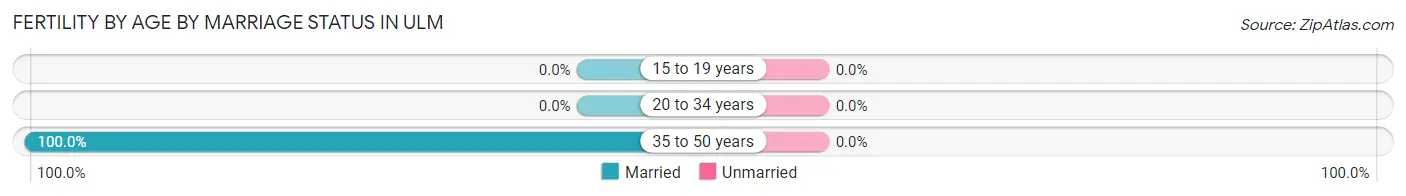
| Age Bracket | Married | Unmarried |
| 15 to 19 years | 0 (0.0%) | 0 (0.0%) |
| 20 to 34 years | 0 (0.0%) | 0 (0.0%) |
| 35 to 50 years | 1 (100.0%) | 0 (0.0%) |
| Total | 1 (100.0%) | 0 (0.0%) |
Fertility by Education in Ulm
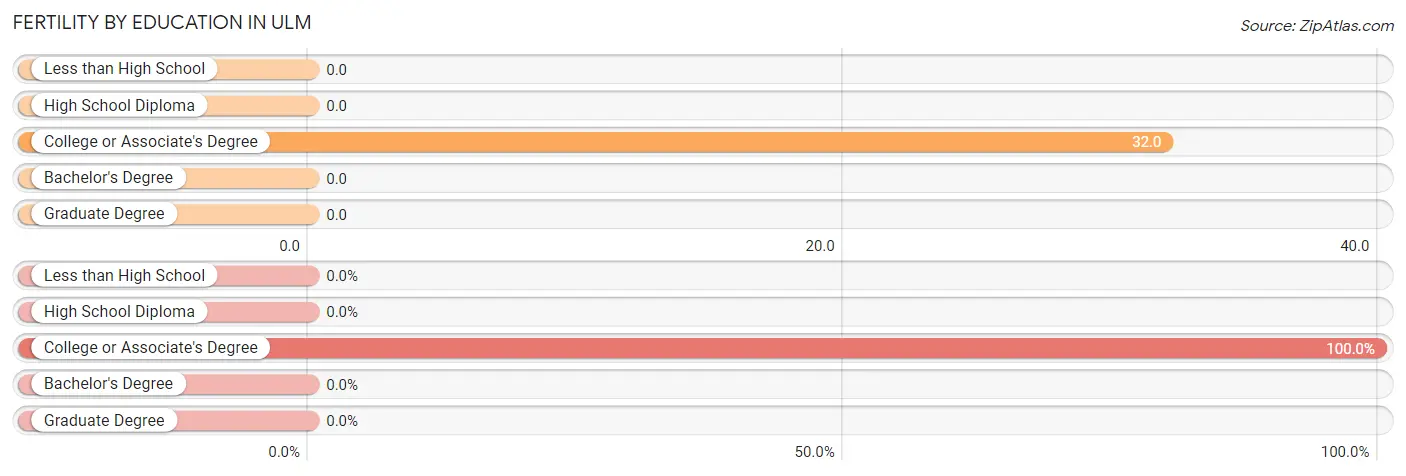
| Educational Attainment | Women with Births | Births / 1,000 Women |
| Less than High School | 0 (0.0%) | 0.0 |
| High School Diploma | 0 (0.0%) | 0.0 |
| College or Associate's Degree | 1 (100.0%) | 32.0 |
| Bachelor's Degree | 0 (0.0%) | 0.0 |
| Graduate Degree | 0 (0.0%) | 0.0 |
| Total | 1 (100.0%) | 5.0 |
Fertility by Education by Marriage Status in Ulm
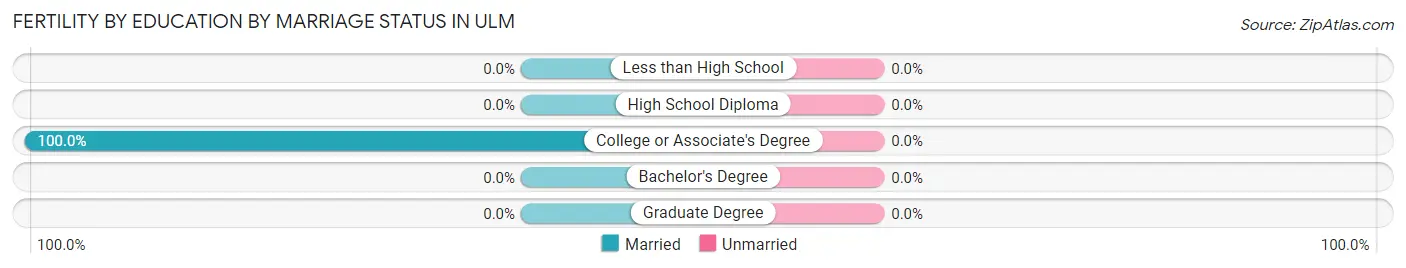
| Educational Attainment | Married | Unmarried |
| Less than High School | 0 (0.0%) | 0 (0.0%) |
| High School Diploma | 0 (0.0%) | 0 (0.0%) |
| College or Associate's Degree | 1 (100.0%) | 0 (0.0%) |
| Bachelor's Degree | 0 (0.0%) | 0 (0.0%) |
| Graduate Degree | 0 (0.0%) | 0 (0.0%) |
| Total | 1 (100.0%) | 0 (0.0%) |
Employment Characteristics in Ulm
Employment by Class of Employer in Ulm
Among the 421 employed individuals in Ulm, private company employees (226 | 53.7%), state government employees (69 | 16.4%), and not-for-profit organizations (34 | 8.1%) make up the most common classes of employment.
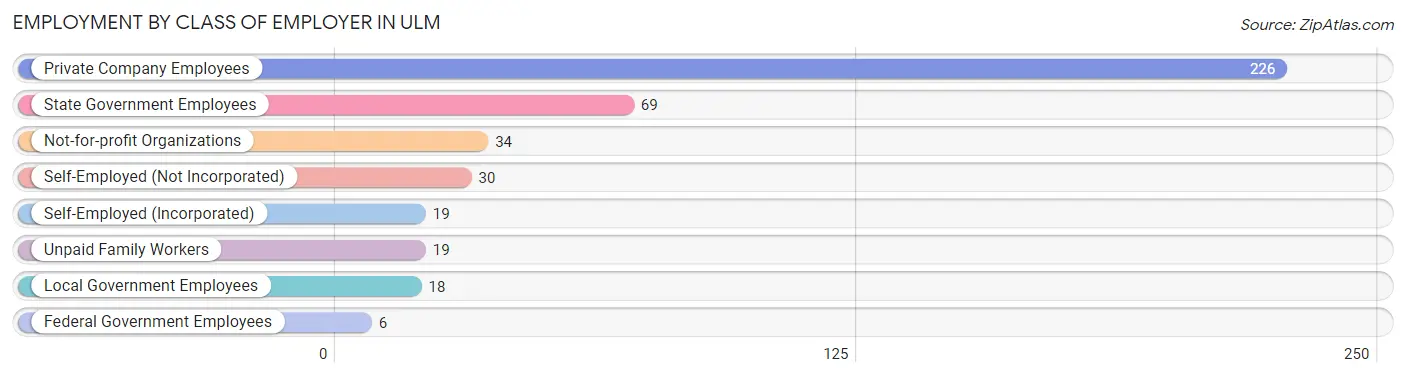
| Employer Class | # Employees | % Employees |
| Private Company Employees | 226 | 53.7% |
| Self-Employed (Incorporated) | 19 | 4.5% |
| Self-Employed (Not Incorporated) | 30 | 7.1% |
| Not-for-profit Organizations | 34 | 8.1% |
| Local Government Employees | 18 | 4.3% |
| State Government Employees | 69 | 16.4% |
| Federal Government Employees | 6 | 1.4% |
| Unpaid Family Workers | 19 | 4.5% |
| Total | 421 | 100.0% |
Employment Status by Age in Ulm
According to the labor force statistics for Ulm, out of the total population over 16 years of age (667), 65.1% or 434 individuals are in the labor force, with 3.0% or 13 of them unemployed. The age group with the highest labor force participation rate is 20 to 24 years, with 100.0% or 11 individuals in the labor force. Within the labor force, the 20 to 24 years age range has the highest percentage of unemployed individuals, with 72.7% or 8 of them being unemployed.
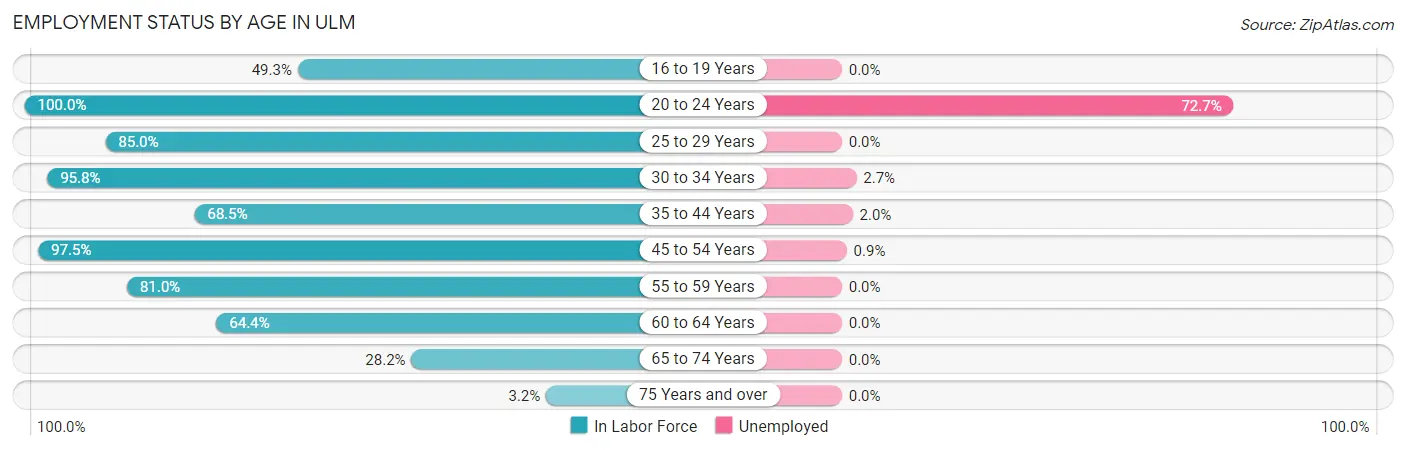
| Age Bracket | In Labor Force | Unemployed |
| 16 to 19 Years | 33 (49.3%) | 0 (0.0%) |
| 20 to 24 Years | 11 (100.0%) | 8 (72.7%) |
| 25 to 29 Years | 17 (85.0%) | 0 (0.0%) |
| 30 to 34 Years | 113 (95.8%) | 3 (2.7%) |
| 35 to 44 Years | 50 (68.5%) | 1 (2.0%) |
| 45 to 54 Years | 115 (97.5%) | 1 (0.9%) |
| 55 to 59 Years | 17 (81.0%) | 0 (0.0%) |
| 60 to 64 Years | 47 (64.4%) | 0 (0.0%) |
| 65 to 74 Years | 29 (28.2%) | 0 (0.0%) |
| 75 Years and over | 2 (3.2%) | 0 (0.0%) |
| Total | 434 (65.1%) | 13 (3.0%) |
Employment Status by Educational Attainment in Ulm
According to labor force statistics for Ulm, 84.9% of individuals (359) out of the total population between 25 and 64 years of age (423) are in the labor force, with 1.4% or 5 of them being unemployed. The group with the highest labor force participation rate are those with the educational attainment of bachelor's degree or higher, with 88.7% or 110 individuals in the labor force. Within the labor force, individuals with high school diploma education have the highest percentage of unemployment, with 1.9% or 3 of them being unemployed.
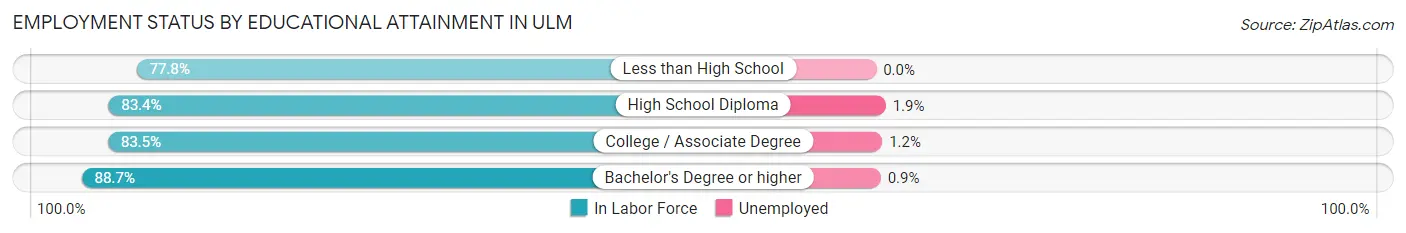
| Educational Attainment | In Labor Force | Unemployed |
| Less than High School | 7 (77.8%) | 0 (0.0%) |
| High School Diploma | 156 (83.4%) | 4 (1.9%) |
| College / Associate Degree | 86 (83.5%) | 1 (1.2%) |
| Bachelor's Degree or higher | 110 (88.7%) | 1 (0.9%) |
| Total | 359 (84.9%) | 6 (1.4%) |
Employment Occupations by Sex in Ulm
Management, Business, Science and Arts Occupations
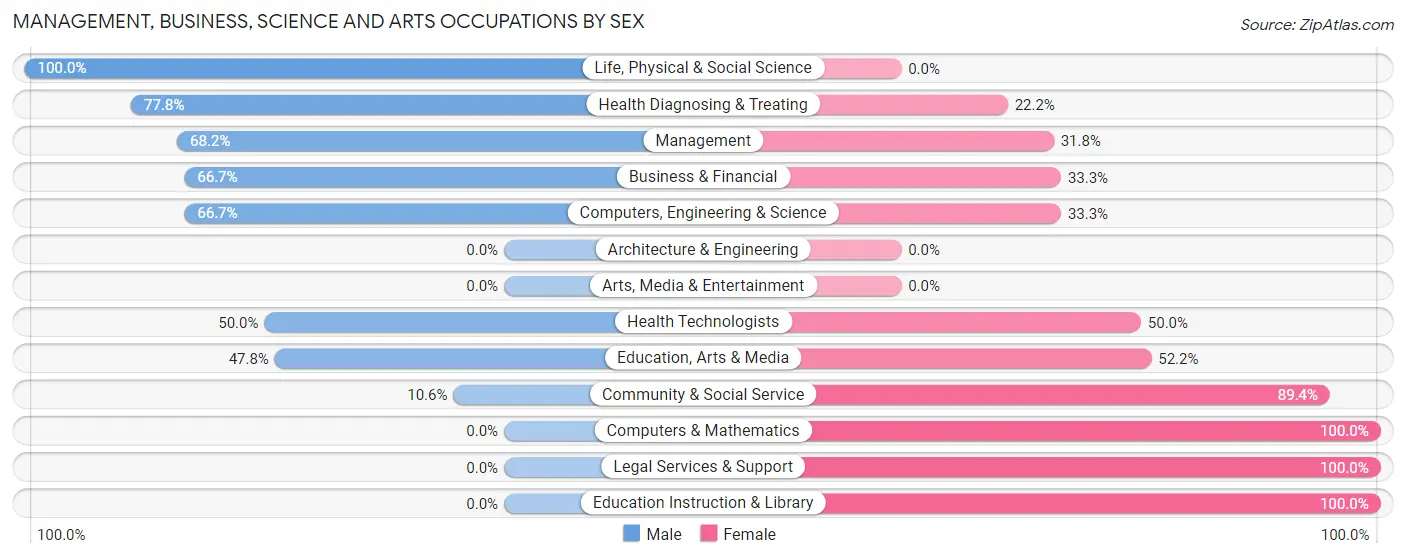
The most common Management, Business, Science and Arts occupations in Ulm are Community & Social Service (104 | 24.7%), Education Instruction & Library (77 | 18.3%), Management (44 | 10.4%), Education, Arts & Media (23 | 5.5%), and Computers, Engineering & Science (15 | 3.6%).
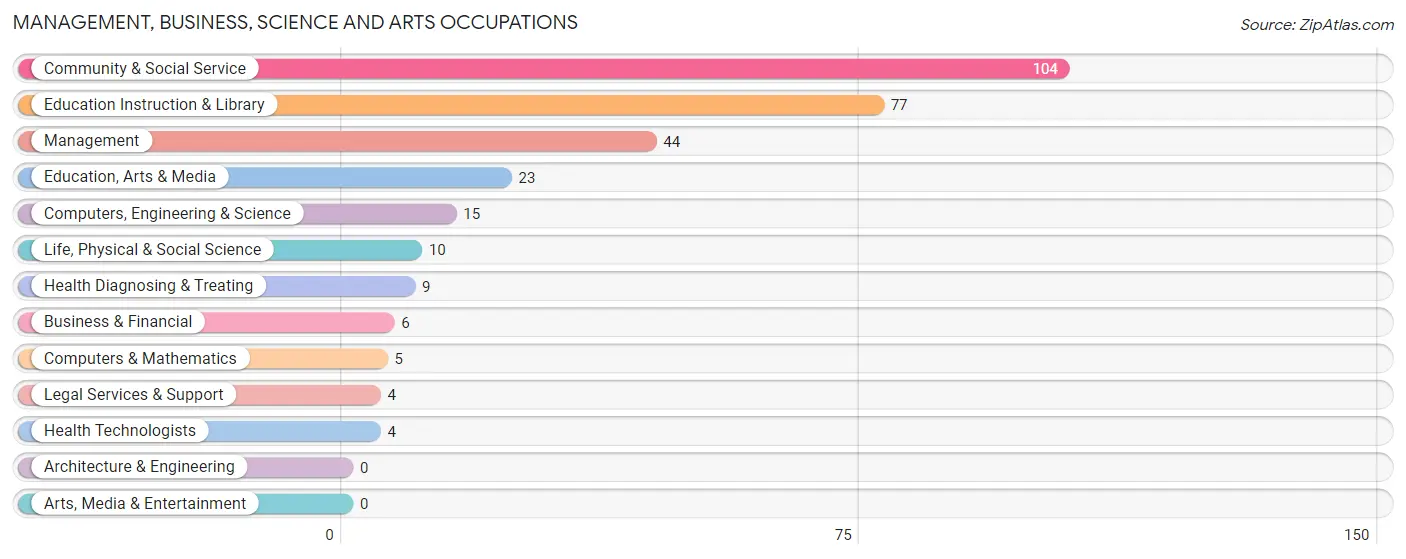
Management, Business, Science and Arts Occupations by Sex
Within the Management, Business, Science and Arts occupations in Ulm, the most male-oriented occupations are Life, Physical & Social Science (100.0%), Health Diagnosing & Treating (77.8%), and Management (68.2%), while the most female-oriented occupations are Computers & Mathematics (100.0%), Legal Services & Support (100.0%), and Education Instruction & Library (100.0%).
| Occupation | Male | Female |
| Management | 30 (68.2%) | 14 (31.8%) |
| Business & Financial | 4 (66.7%) | 2 (33.3%) |
| Computers, Engineering & Science | 10 (66.7%) | 5 (33.3%) |
| Computers & Mathematics | 0 (0.0%) | 5 (100.0%) |
| Architecture & Engineering | 0 (0.0%) | 0 (0.0%) |
| Life, Physical & Social Science | 10 (100.0%) | 0 (0.0%) |
| Community & Social Service | 11 (10.6%) | 93 (89.4%) |
| Education, Arts & Media | 11 (47.8%) | 12 (52.2%) |
| Legal Services & Support | 0 (0.0%) | 4 (100.0%) |
| Education Instruction & Library | 0 (0.0%) | 77 (100.0%) |
| Arts, Media & Entertainment | 0 (0.0%) | 0 (0.0%) |
| Health Diagnosing & Treating | 7 (77.8%) | 2 (22.2%) |
| Health Technologists | 2 (50.0%) | 2 (50.0%) |
| Total (Category) | 62 (34.8%) | 116 (65.2%) |
| Total (Overall) | 213 (50.6%) | 208 (49.4%) |
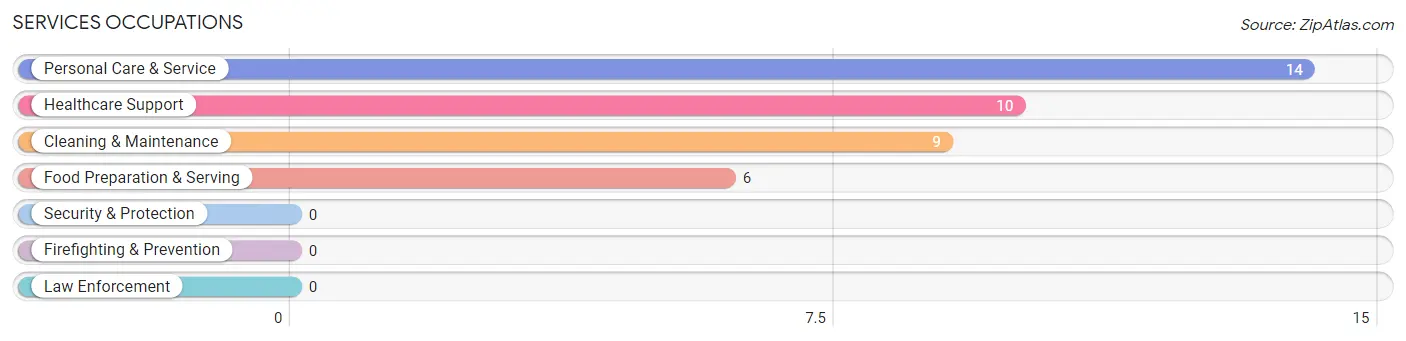
Services Occupations
The most common Services occupations in Ulm are Personal Care & Service (14 | 3.3%), Healthcare Support (10 | 2.4%), Cleaning & Maintenance (9 | 2.1%), and Food Preparation & Serving (6 | 1.4%).
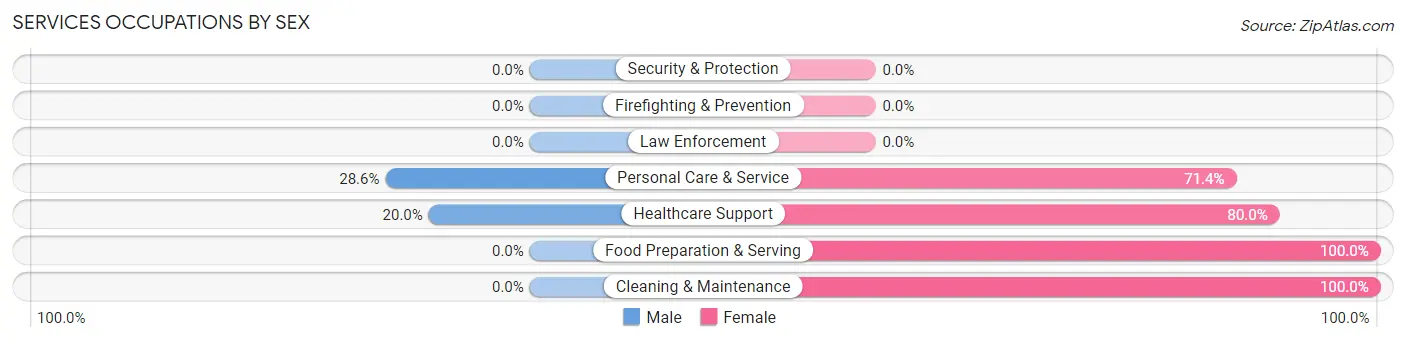
Services Occupations by Sex
Within the Services occupations in Ulm, the most male-oriented occupations are Personal Care & Service (28.6%), and Healthcare Support (20.0%), while the most female-oriented occupations are Food Preparation & Serving (100.0%), Cleaning & Maintenance (100.0%), and Healthcare Support (80.0%).
| Occupation | Male | Female |
| Healthcare Support | 2 (20.0%) | 8 (80.0%) |
| Security & Protection | 0 (0.0%) | 0 (0.0%) |
| Firefighting & Prevention | 0 (0.0%) | 0 (0.0%) |
| Law Enforcement | 0 (0.0%) | 0 (0.0%) |
| Food Preparation & Serving | 0 (0.0%) | 6 (100.0%) |
| Cleaning & Maintenance | 0 (0.0%) | 9 (100.0%) |
| Personal Care & Service | 4 (28.6%) | 10 (71.4%) |
| Total (Category) | 6 (15.4%) | 33 (84.6%) |
| Total (Overall) | 213 (50.6%) | 208 (49.4%) |
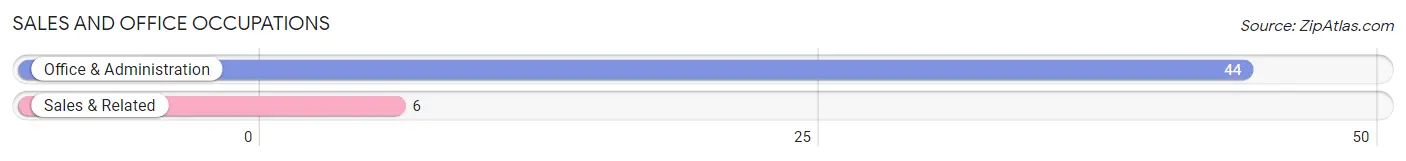
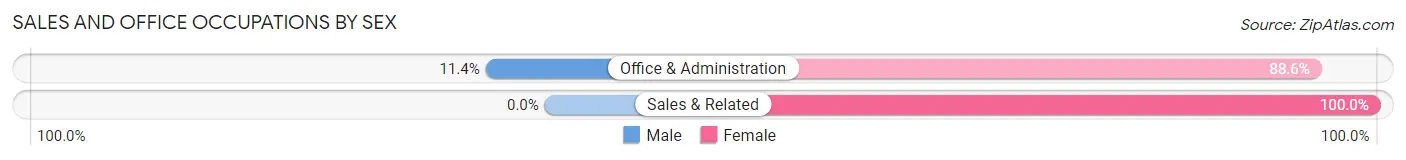
Sales and Office Occupations
The most common Sales and Office occupations in Ulm are Office & Administration (44 | 10.4%), and Sales & Related (6 | 1.4%).
Sales and Office Occupations by Sex
| Occupation | Male | Female |
| Sales & Related | 0 (0.0%) | 6 (100.0%) |
| Office & Administration | 5 (11.4%) | 39 (88.6%) |
| Total (Category) | 5 (10.0%) | 45 (90.0%) |
| Total (Overall) | 213 (50.6%) | 208 (49.4%) |
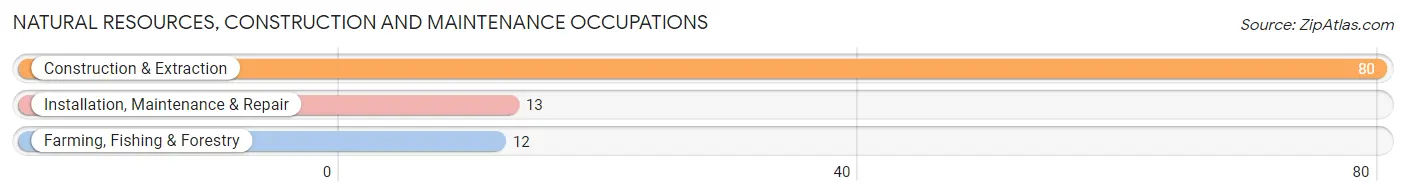
Natural Resources, Construction and Maintenance Occupations
The most common Natural Resources, Construction and Maintenance occupations in Ulm are Construction & Extraction (80 | 19.0%), Installation, Maintenance & Repair (13 | 3.1%), and Farming, Fishing & Forestry (12 | 2.9%).
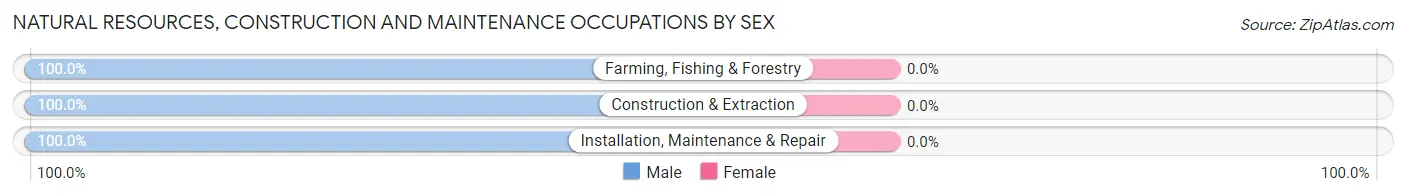
Natural Resources, Construction and Maintenance Occupations by Sex
| Occupation | Male | Female |
| Farming, Fishing & Forestry | 12 (100.0%) | 0 (0.0%) |
| Construction & Extraction | 80 (100.0%) | 0 (0.0%) |
| Installation, Maintenance & Repair | 13 (100.0%) | 0 (0.0%) |
| Total (Category) | 105 (100.0%) | 0 (0.0%) |
| Total (Overall) | 213 (50.6%) | 208 (49.4%) |
Production, Transportation and Moving Occupations
The most common Production, Transportation and Moving occupations in Ulm are Transportation (26 | 6.2%), and Production (23 | 5.5%).
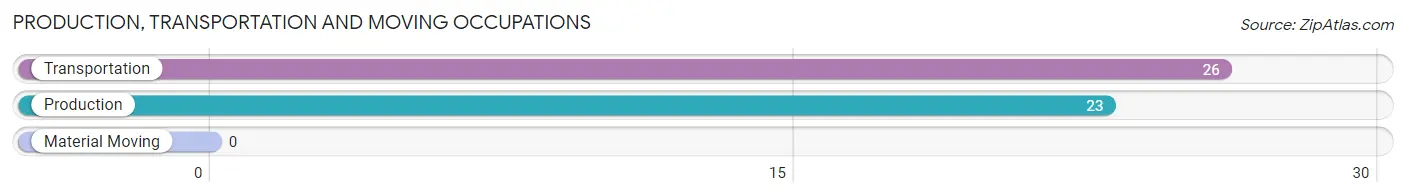
Production, Transportation and Moving Occupations by Sex
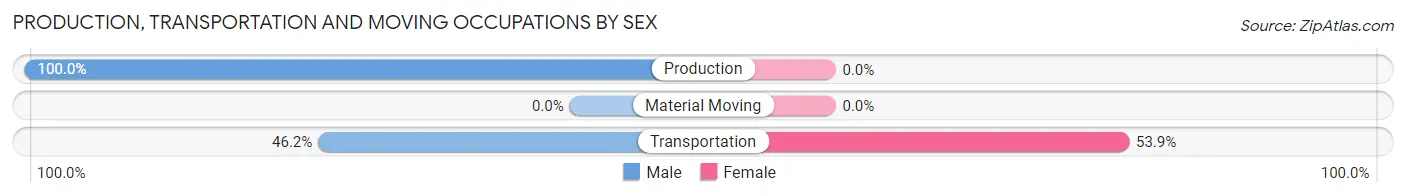
| Occupation | Male | Female |
| Production | 23 (100.0%) | 0 (0.0%) |
| Transportation | 12 (46.2%) | 14 (53.8%) |
| Material Moving | 0 (0.0%) | 0 (0.0%) |
| Total (Category) | 35 (71.4%) | 14 (28.6%) |
| Total (Overall) | 213 (50.6%) | 208 (49.4%) |
Employment Industries by Sex in Ulm
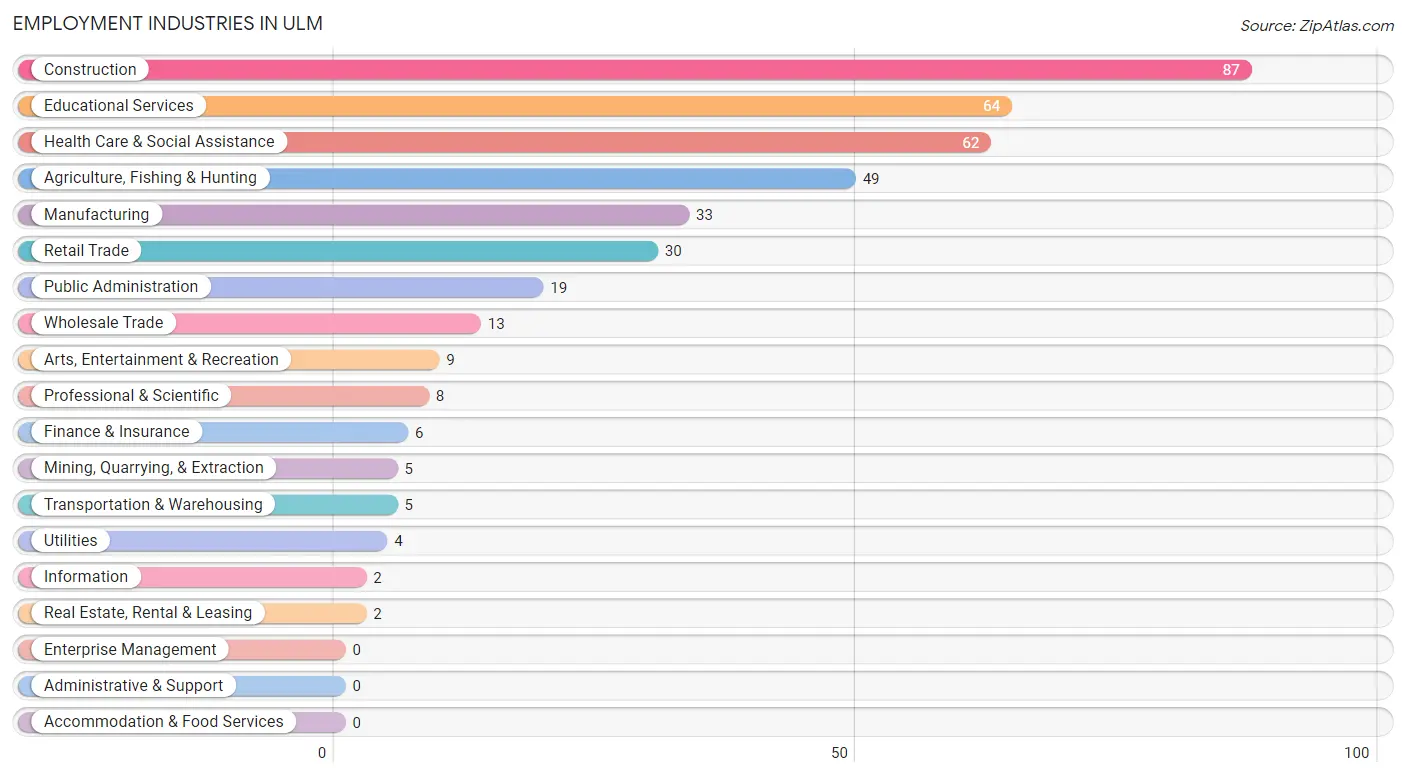
Employment Industries in Ulm
The major employment industries in Ulm include Construction (87 | 20.7%), Educational Services (64 | 15.2%), Health Care & Social Assistance (62 | 14.7%), Agriculture, Fishing & Hunting (49 | 11.6%), and Manufacturing (33 | 7.8%).
Employment Industries by Sex in Ulm
The Ulm industries that see more men than women are Construction (100.0%), Manufacturing (100.0%), and Agriculture, Fishing & Hunting (69.4%), whereas the industries that tend to have a higher number of women are Utilities (100.0%), Information (100.0%), and Finance & Insurance (100.0%).
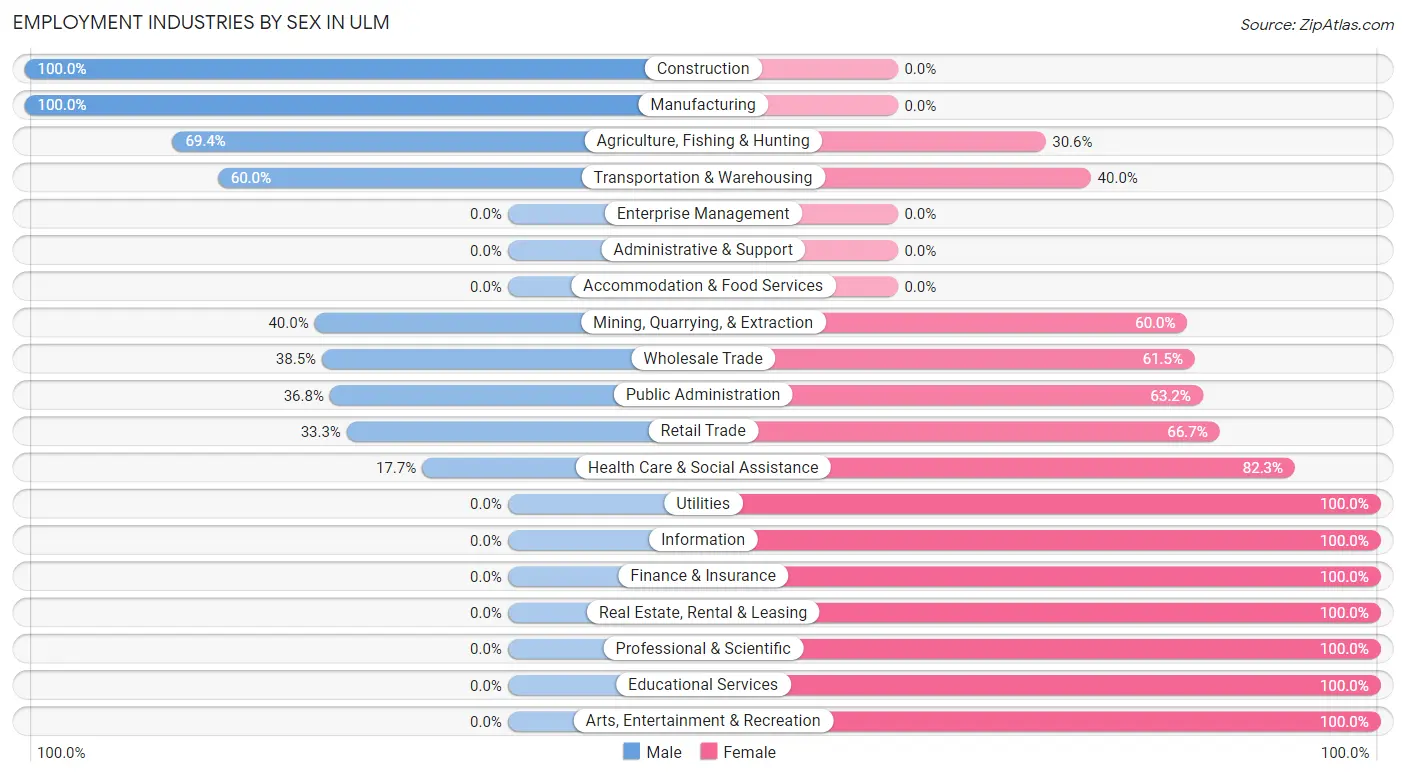
| Industry | Male | Female |
| Agriculture, Fishing & Hunting | 34 (69.4%) | 15 (30.6%) |
| Mining, Quarrying, & Extraction | 2 (40.0%) | 3 (60.0%) |
| Construction | 87 (100.0%) | 0 (0.0%) |
| Manufacturing | 33 (100.0%) | 0 (0.0%) |
| Wholesale Trade | 5 (38.5%) | 8 (61.5%) |
| Retail Trade | 10 (33.3%) | 20 (66.7%) |
| Transportation & Warehousing | 3 (60.0%) | 2 (40.0%) |
| Utilities | 0 (0.0%) | 4 (100.0%) |
| Information | 0 (0.0%) | 2 (100.0%) |
| Finance & Insurance | 0 (0.0%) | 6 (100.0%) |
| Real Estate, Rental & Leasing | 0 (0.0%) | 2 (100.0%) |
| Professional & Scientific | 0 (0.0%) | 8 (100.0%) |
| Enterprise Management | 0 (0.0%) | 0 (0.0%) |
| Administrative & Support | 0 (0.0%) | 0 (0.0%) |
| Educational Services | 0 (0.0%) | 64 (100.0%) |
| Health Care & Social Assistance | 11 (17.7%) | 51 (82.3%) |
| Arts, Entertainment & Recreation | 0 (0.0%) | 9 (100.0%) |
| Accommodation & Food Services | 0 (0.0%) | 0 (0.0%) |
| Public Administration | 7 (36.8%) | 12 (63.2%) |
| Total | 213 (50.6%) | 208 (49.4%) |
Education in Ulm
School Enrollment in Ulm
The most common levels of schooling among the 291 students in Ulm are elementary school (81 | 27.8%), nursery / preschool (75 | 25.8%), and high school (69 | 23.7%).
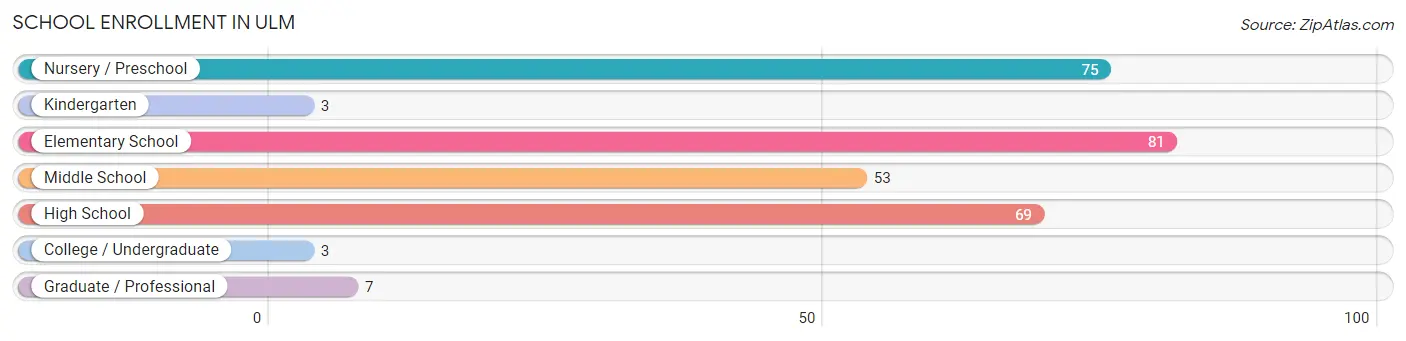
| School Level | # Students | % Students |
| Nursery / Preschool | 75 | 25.8% |
| Kindergarten | 3 | 1.0% |
| Elementary School | 81 | 27.8% |
| Middle School | 53 | 18.2% |
| High School | 69 | 23.7% |
| College / Undergraduate | 3 | 1.0% |
| Graduate / Professional | 7 | 2.4% |
| Total | 291 | 100.0% |
School Enrollment by Age by Funding Source in Ulm
Out of a total of 291 students who are enrolled in schools in Ulm, 13 (4.5%) attend a private institution, while the remaining 278 (95.5%) are enrolled in public schools. The age group of 25 to 34 year olds has the highest likelihood of being enrolled in private schools, with 3 (100.0% in the age bracket) enrolled. Conversely, the age group of 3 to 4 year olds has the lowest likelihood of being enrolled in a private school, with 2 (100.0% in the age bracket) attending a public institution.
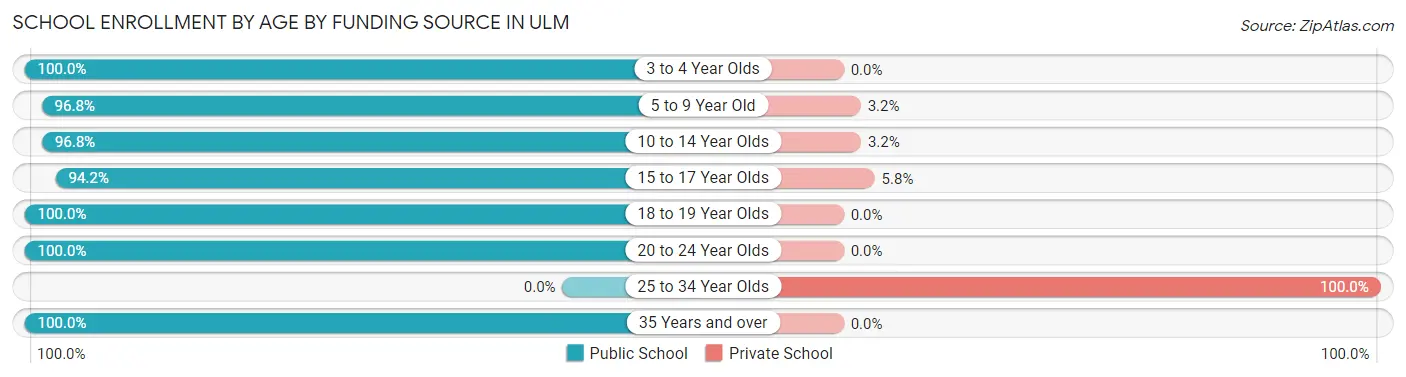
| Age Bracket | Public School | Private School |
| 3 to 4 Year Olds | 2 (100.0%) | 0 (0.0%) |
| 5 to 9 Year Old | 152 (96.8%) | 5 (3.2%) |
| 10 to 14 Year Olds | 60 (96.8%) | 2 (3.2%) |
| 15 to 17 Year Olds | 49 (94.2%) | 3 (5.8%) |
| 18 to 19 Year Olds | 8 (100.0%) | 0 (0.0%) |
| 20 to 24 Year Olds | 3 (100.0%) | 0 (0.0%) |
| 25 to 34 Year Olds | 0 (0.0%) | 3 (100.0%) |
| 35 Years and over | 4 (100.0%) | 0 (0.0%) |
| Total | 278 (95.5%) | 13 (4.5%) |
Educational Attainment by Field of Study in Ulm
Education (104 | 59.8%), bio, nature & agricultural (49 | 28.2%), physical & health sciences (9 | 5.2%), science & technology (6 | 3.5%), and business (4 | 2.3%) are the most common fields of study among 174 individuals in Ulm who have obtained a bachelor's degree or higher.
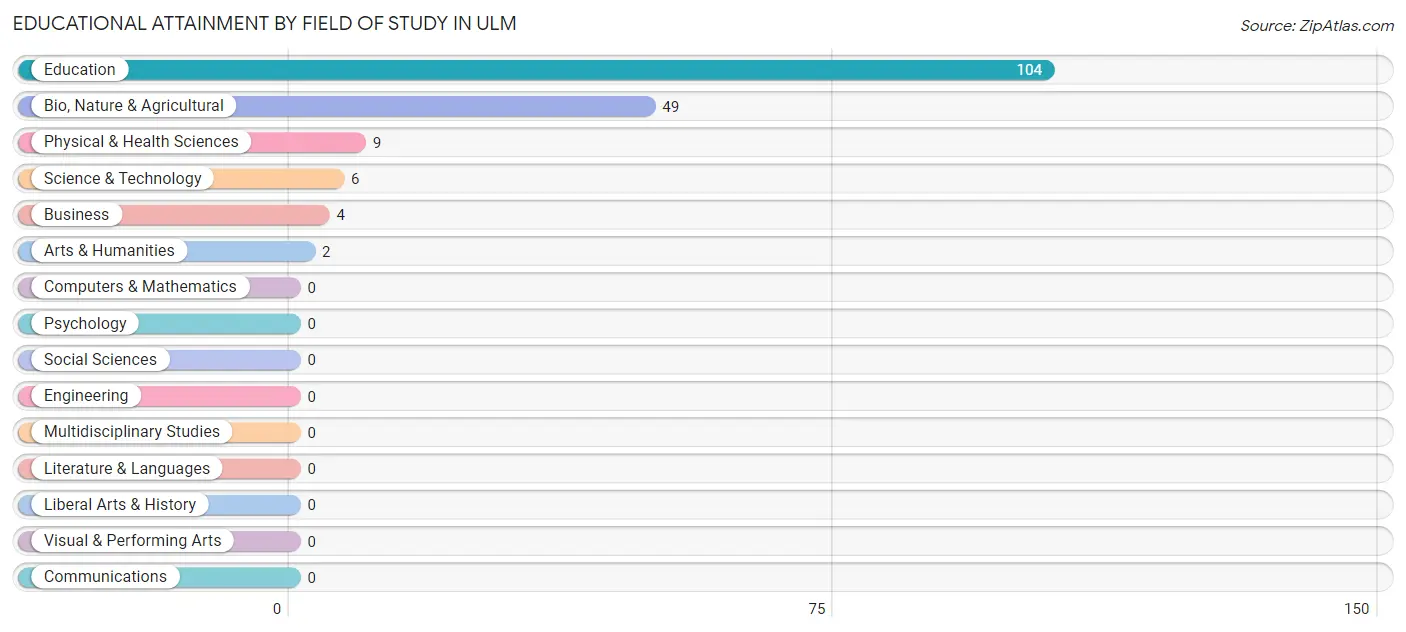
| Field of Study | # Graduates | % Graduates |
| Computers & Mathematics | 0 | 0.0% |
| Bio, Nature & Agricultural | 49 | 28.2% |
| Physical & Health Sciences | 9 | 5.2% |
| Psychology | 0 | 0.0% |
| Social Sciences | 0 | 0.0% |
| Engineering | 0 | 0.0% |
| Multidisciplinary Studies | 0 | 0.0% |
| Science & Technology | 6 | 3.5% |
| Business | 4 | 2.3% |
| Education | 104 | 59.8% |
| Literature & Languages | 0 | 0.0% |
| Liberal Arts & History | 0 | 0.0% |
| Visual & Performing Arts | 0 | 0.0% |
| Communications | 0 | 0.0% |
| Arts & Humanities | 2 | 1.1% |
| Total | 174 | 100.0% |
Transportation & Commute in Ulm
Vehicle Availability by Sex in Ulm
The most prevalent vehicle ownership categories in Ulm are males with 2 vehicles (74, accounting for 34.7%) and females with 2 vehicles (78, making up 35.6%).
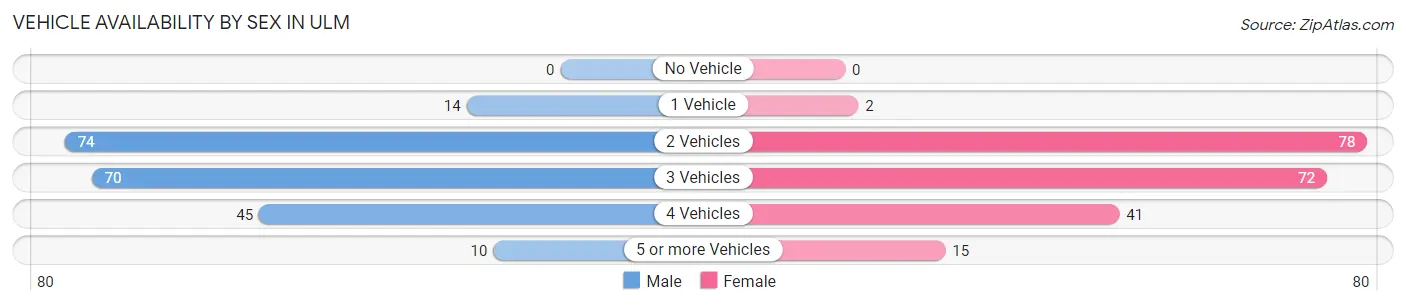
| Vehicles Available | Male | Female |
| No Vehicle | 0 (0.0%) | 0 (0.0%) |
| 1 Vehicle | 14 (6.6%) | 2 (1.0%) |
| 2 Vehicles | 74 (34.7%) | 78 (37.5%) |
| 3 Vehicles | 70 (32.9%) | 72 (34.6%) |
| 4 Vehicles | 45 (21.1%) | 41 (19.7%) |
| 5 or more Vehicles | 10 (4.7%) | 15 (7.2%) |
| Total | 213 (100.0%) | 208 (100.0%) |
Commute Time in Ulm
The most frequently occuring commute durations in Ulm are 20 to 24 minutes (130 commuters, 33.8%), 60 to 89 minutes (59 commuters, 15.3%), and 30 to 34 minutes (58 commuters, 15.1%).
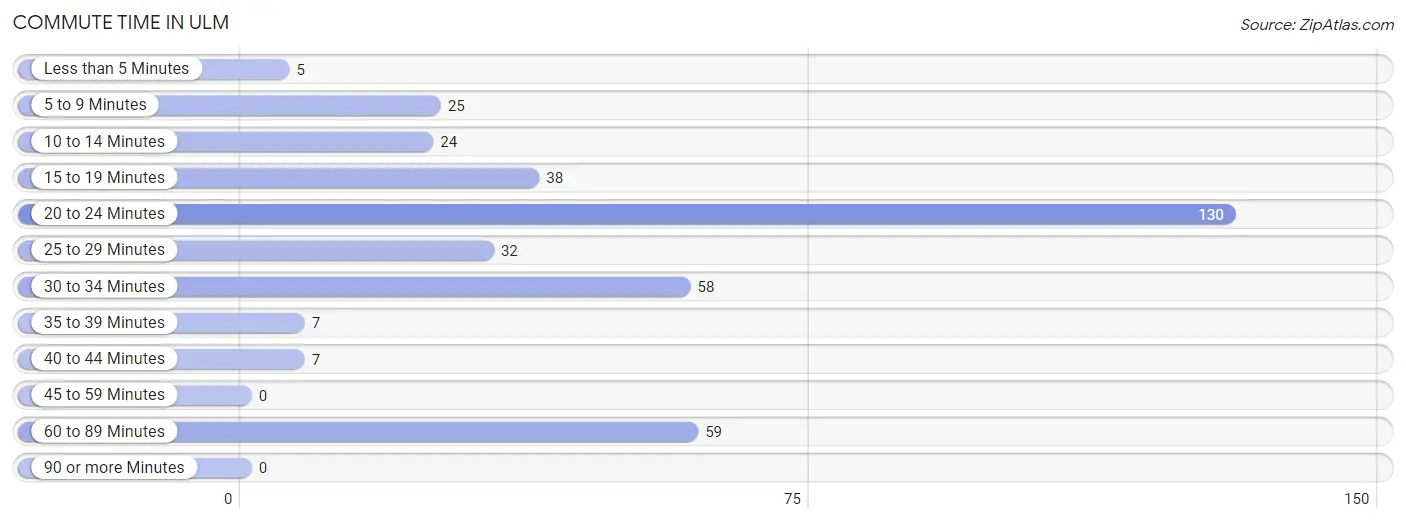
| Commute Time | # Commuters | % Commuters |
| Less than 5 Minutes | 5 | 1.3% |
| 5 to 9 Minutes | 25 | 6.5% |
| 10 to 14 Minutes | 24 | 6.2% |
| 15 to 19 Minutes | 38 | 9.9% |
| 20 to 24 Minutes | 130 | 33.8% |
| 25 to 29 Minutes | 32 | 8.3% |
| 30 to 34 Minutes | 58 | 15.1% |
| 35 to 39 Minutes | 7 | 1.8% |
| 40 to 44 Minutes | 7 | 1.8% |
| 45 to 59 Minutes | 0 | 0.0% |
| 60 to 89 Minutes | 59 | 15.3% |
| 90 or more Minutes | 0 | 0.0% |
Commute Time by Sex in Ulm
The most common commute times in Ulm are 20 to 24 minutes (94 commuters, 46.1%) for males and 60 to 89 minutes (49 commuters, 27.1%) for females.
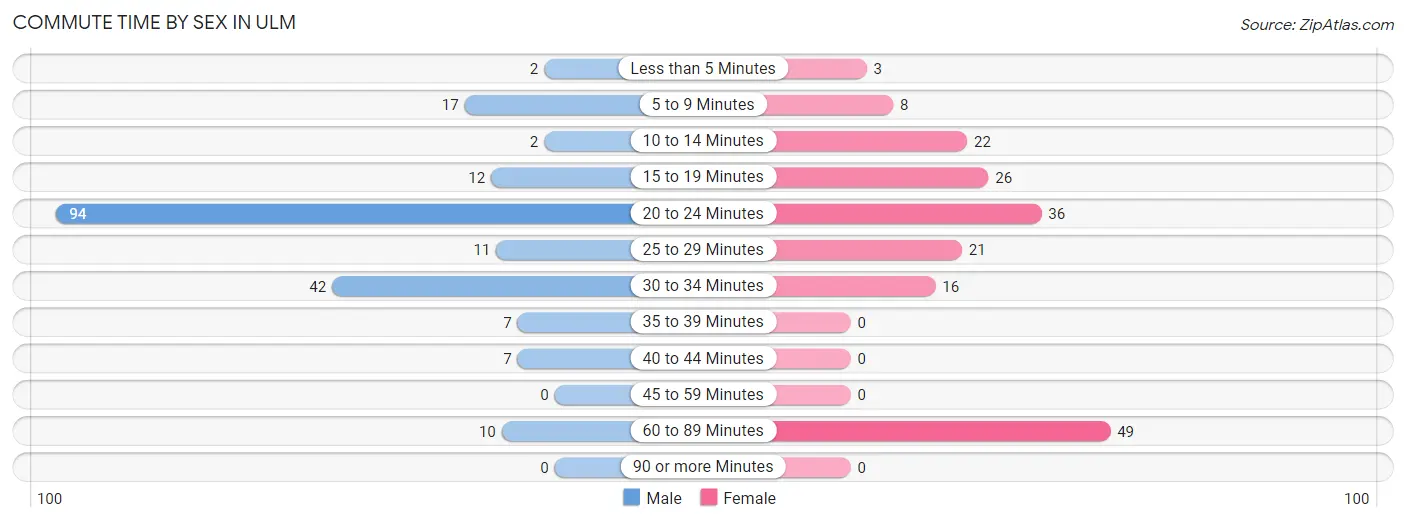
| Commute Time | Male | Female |
| Less than 5 Minutes | 2 (1.0%) | 3 (1.7%) |
| 5 to 9 Minutes | 17 (8.3%) | 8 (4.4%) |
| 10 to 14 Minutes | 2 (1.0%) | 22 (12.1%) |
| 15 to 19 Minutes | 12 (5.9%) | 26 (14.4%) |
| 20 to 24 Minutes | 94 (46.1%) | 36 (19.9%) |
| 25 to 29 Minutes | 11 (5.4%) | 21 (11.6%) |
| 30 to 34 Minutes | 42 (20.6%) | 16 (8.8%) |
| 35 to 39 Minutes | 7 (3.4%) | 0 (0.0%) |
| 40 to 44 Minutes | 7 (3.4%) | 0 (0.0%) |
| 45 to 59 Minutes | 0 (0.0%) | 0 (0.0%) |
| 60 to 89 Minutes | 10 (4.9%) | 49 (27.1%) |
| 90 or more Minutes | 0 (0.0%) | 0 (0.0%) |
Time of Departure to Work by Sex in Ulm
The most frequent times of departure to work in Ulm are 6:30 AM to 6:59 AM (77, 37.8%) for males and 5:30 AM to 5:59 AM (49, 27.1%) for females.
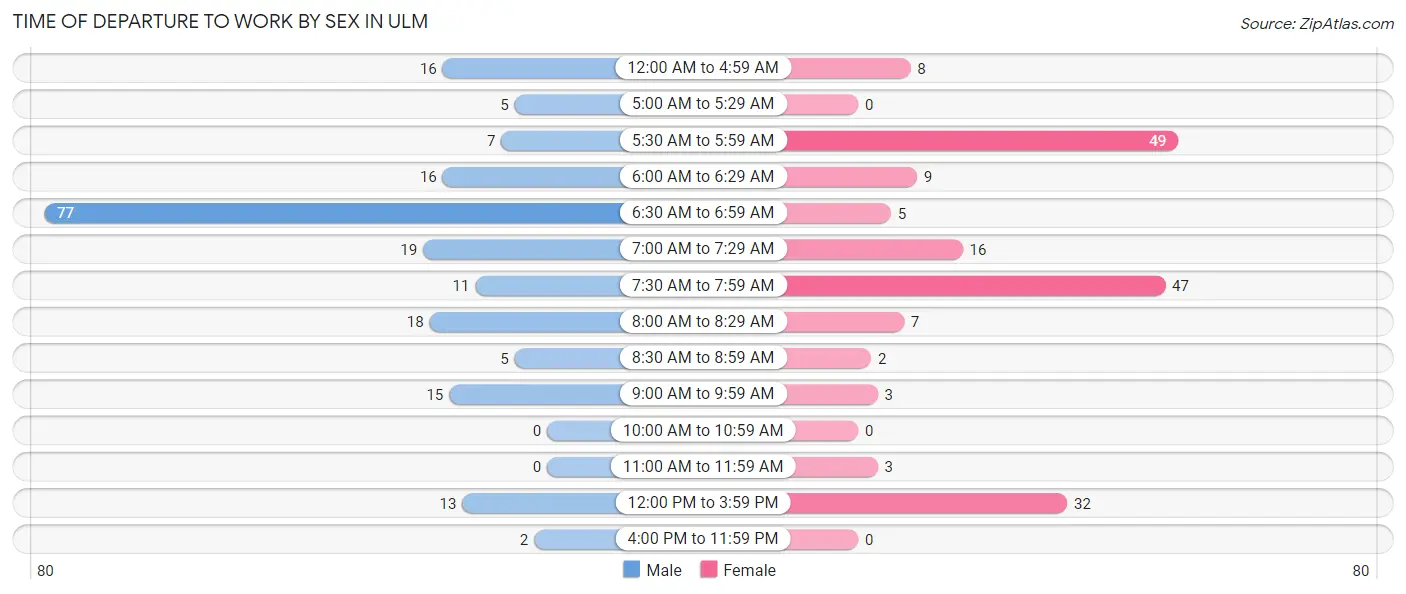
| Time of Departure | Male | Female |
| 12:00 AM to 4:59 AM | 16 (7.8%) | 8 (4.4%) |
| 5:00 AM to 5:29 AM | 5 (2.5%) | 0 (0.0%) |
| 5:30 AM to 5:59 AM | 7 (3.4%) | 49 (27.1%) |
| 6:00 AM to 6:29 AM | 16 (7.8%) | 9 (5.0%) |
| 6:30 AM to 6:59 AM | 77 (37.8%) | 5 (2.8%) |
| 7:00 AM to 7:29 AM | 19 (9.3%) | 16 (8.8%) |
| 7:30 AM to 7:59 AM | 11 (5.4%) | 47 (26.0%) |
| 8:00 AM to 8:29 AM | 18 (8.8%) | 7 (3.9%) |
| 8:30 AM to 8:59 AM | 5 (2.5%) | 2 (1.1%) |
| 9:00 AM to 9:59 AM | 15 (7.3%) | 3 (1.7%) |
| 10:00 AM to 10:59 AM | 0 (0.0%) | 0 (0.0%) |
| 11:00 AM to 11:59 AM | 0 (0.0%) | 3 (1.7%) |
| 12:00 PM to 3:59 PM | 13 (6.4%) | 32 (17.7%) |
| 4:00 PM to 11:59 PM | 2 (1.0%) | 0 (0.0%) |
| Total | 204 (100.0%) | 181 (100.0%) |
Housing Occupancy in Ulm
Occupancy by Ownership in Ulm
Of the total 302 dwellings in Ulm, owner-occupied units account for 301 (99.7%), while renter-occupied units make up 1 (0.3%).
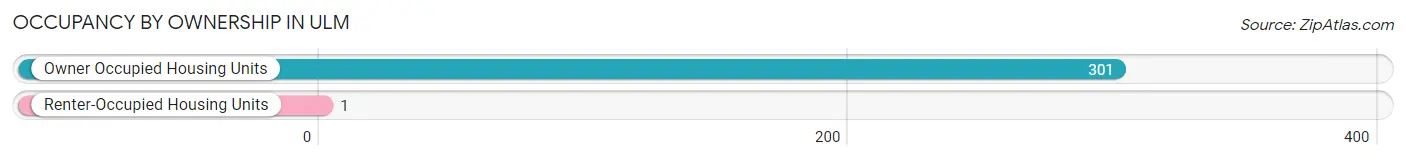
| Occupancy | # Housing Units | % Housing Units |
| Owner Occupied Housing Units | 301 | 99.7% |
| Renter-Occupied Housing Units | 1 | 0.3% |
| Total Occupied Housing Units | 302 | 100.0% |
Occupancy by Household Size in Ulm
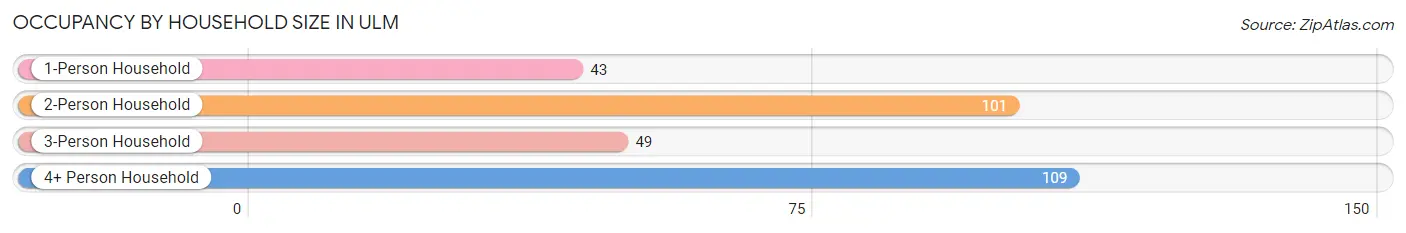
| Household Size | # Housing Units | % Housing Units |
| 1-Person Household | 43 | 14.2% |
| 2-Person Household | 101 | 33.4% |
| 3-Person Household | 49 | 16.2% |
| 4+ Person Household | 109 | 36.1% |
| Total Housing Units | 302 | 100.0% |
Occupancy by Ownership by Household Size in Ulm
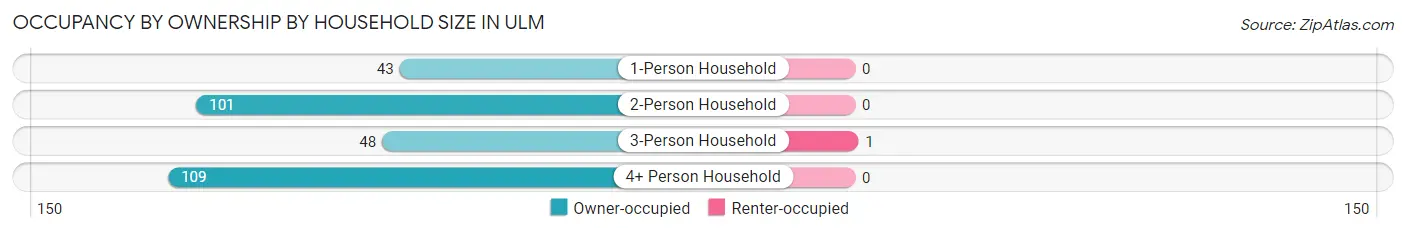
| Household Size | Owner-occupied | Renter-occupied |
| 1-Person Household | 43 (100.0%) | 0 (0.0%) |
| 2-Person Household | 101 (100.0%) | 0 (0.0%) |
| 3-Person Household | 48 (98.0%) | 1 (2.0%) |
| 4+ Person Household | 109 (100.0%) | 0 (0.0%) |
| Total Housing Units | 301 (99.7%) | 1 (0.3%) |
Occupancy by Educational Attainment in Ulm
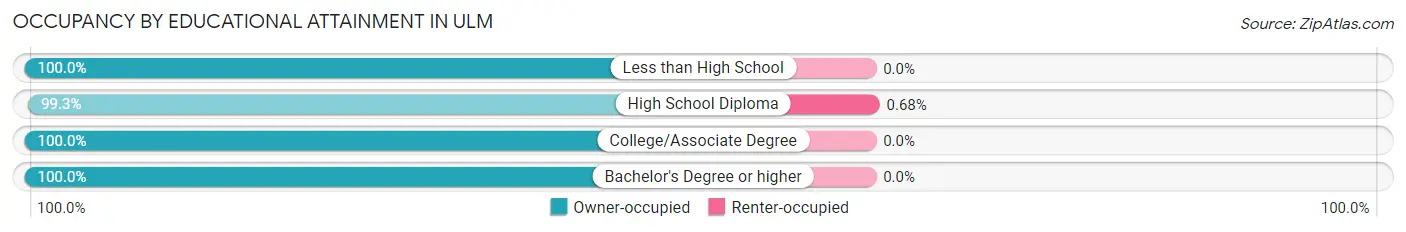
| Household Size | Owner-occupied | Renter-occupied |
| Less than High School | 9 (100.0%) | 0 (0.0%) |
| High School Diploma | 147 (99.3%) | 1 (0.7%) |
| College/Associate Degree | 78 (100.0%) | 0 (0.0%) |
| Bachelor's Degree or higher | 67 (100.0%) | 0 (0.0%) |
Occupancy by Age of Householder in Ulm
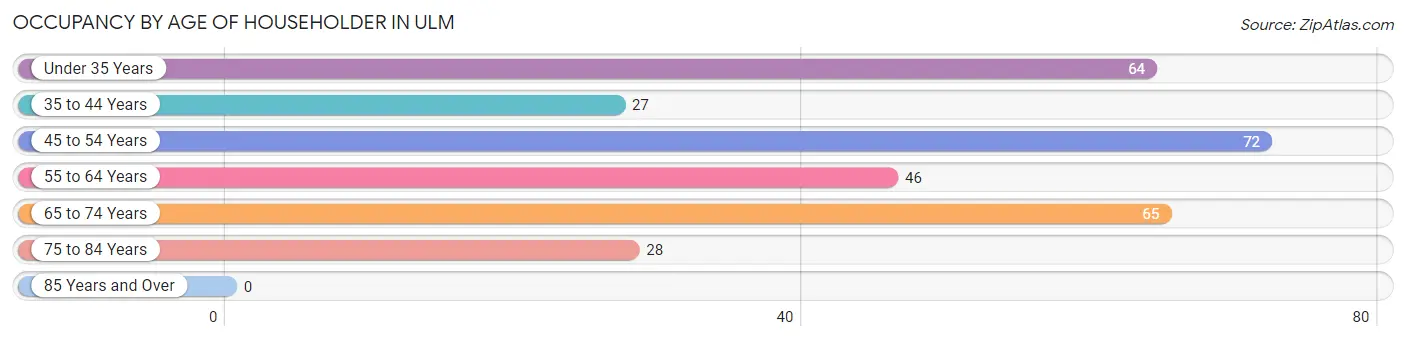
| Age Bracket | # Households | % Households |
| Under 35 Years | 64 | 21.2% |
| 35 to 44 Years | 27 | 8.9% |
| 45 to 54 Years | 72 | 23.8% |
| 55 to 64 Years | 46 | 15.2% |
| 65 to 74 Years | 65 | 21.5% |
| 75 to 84 Years | 28 | 9.3% |
| 85 Years and Over | 0 | 0.0% |
| Total | 302 | 100.0% |
Housing Finances in Ulm
Median Income by Occupancy in Ulm
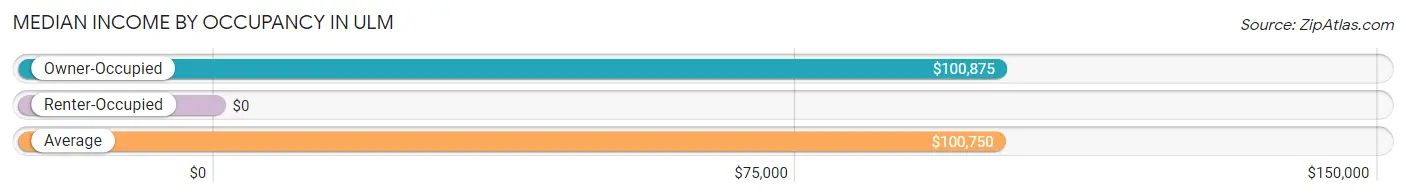
| Occupancy Type | # Households | Median Income |
| Owner-Occupied | 301 (99.7%) | $100,875 |
| Renter-Occupied | 1 (0.3%) | $0 |
| Average | 302 (100.0%) | $100,750 |
Occupancy by Householder Income Bracket in Ulm
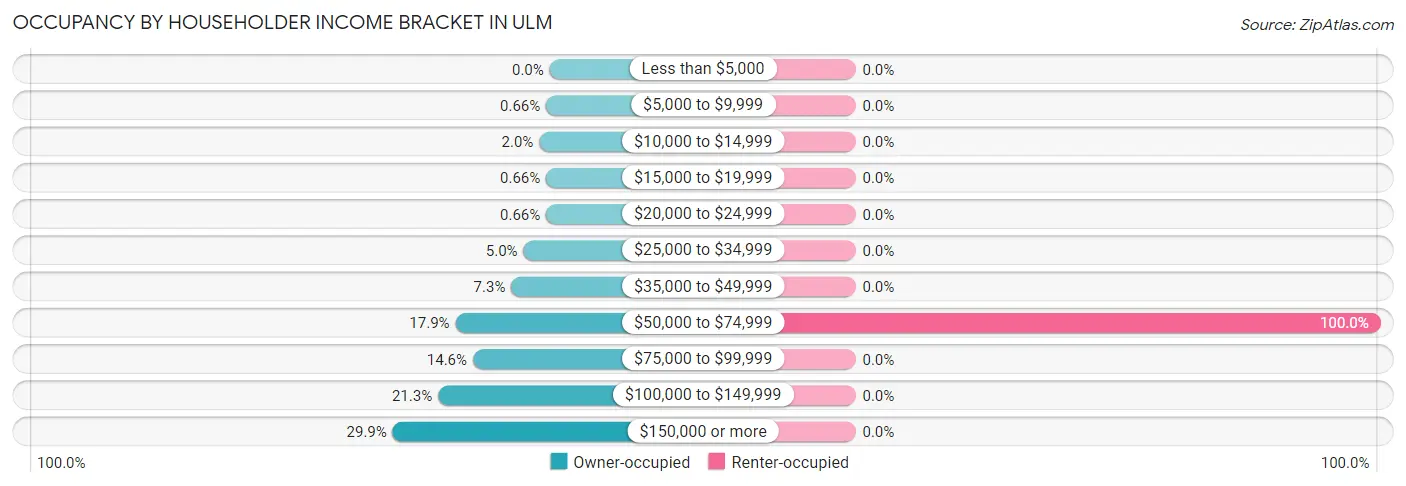
| Income Bracket | Owner-occupied | Renter-occupied |
| Less than $5,000 | 0 (0.0%) | 0 (0.0%) |
| $5,000 to $9,999 | 2 (0.7%) | 0 (0.0%) |
| $10,000 to $14,999 | 6 (2.0%) | 0 (0.0%) |
| $15,000 to $19,999 | 2 (0.7%) | 0 (0.0%) |
| $20,000 to $24,999 | 2 (0.7%) | 0 (0.0%) |
| $25,000 to $34,999 | 15 (5.0%) | 0 (0.0%) |
| $35,000 to $49,999 | 22 (7.3%) | 0 (0.0%) |
| $50,000 to $74,999 | 54 (17.9%) | 1 (100.0%) |
| $75,000 to $99,999 | 44 (14.6%) | 0 (0.0%) |
| $100,000 to $149,999 | 64 (21.3%) | 0 (0.0%) |
| $150,000 or more | 90 (29.9%) | 0 (0.0%) |
| Total | 301 (100.0%) | 1 (100.0%) |
Monthly Housing Cost Tiers in Ulm
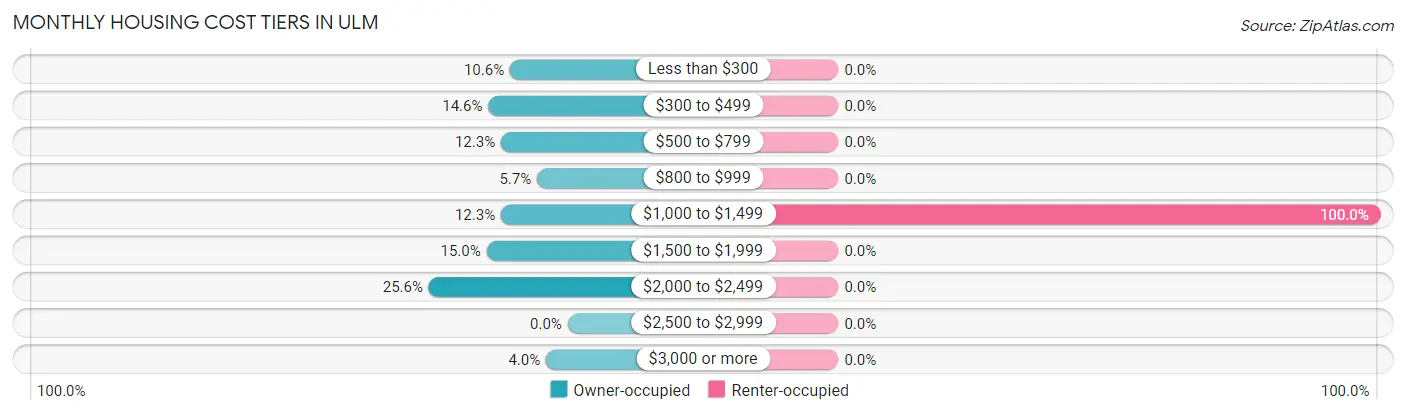
| Monthly Cost | Owner-occupied | Renter-occupied |
| Less than $300 | 32 (10.6%) | 0 (0.0%) |
| $300 to $499 | 44 (14.6%) | 0 (0.0%) |
| $500 to $799 | 37 (12.3%) | 0 (0.0%) |
| $800 to $999 | 17 (5.7%) | 0 (0.0%) |
| $1,000 to $1,499 | 37 (12.3%) | 1 (100.0%) |
| $1,500 to $1,999 | 45 (14.9%) | 0 (0.0%) |
| $2,000 to $2,499 | 77 (25.6%) | 0 (0.0%) |
| $2,500 to $2,999 | 0 (0.0%) | 0 (0.0%) |
| $3,000 or more | 12 (4.0%) | 0 (0.0%) |
| Total | 301 (100.0%) | 1 (100.0%) |
Physical Housing Characteristics in Ulm
Housing Structures in Ulm
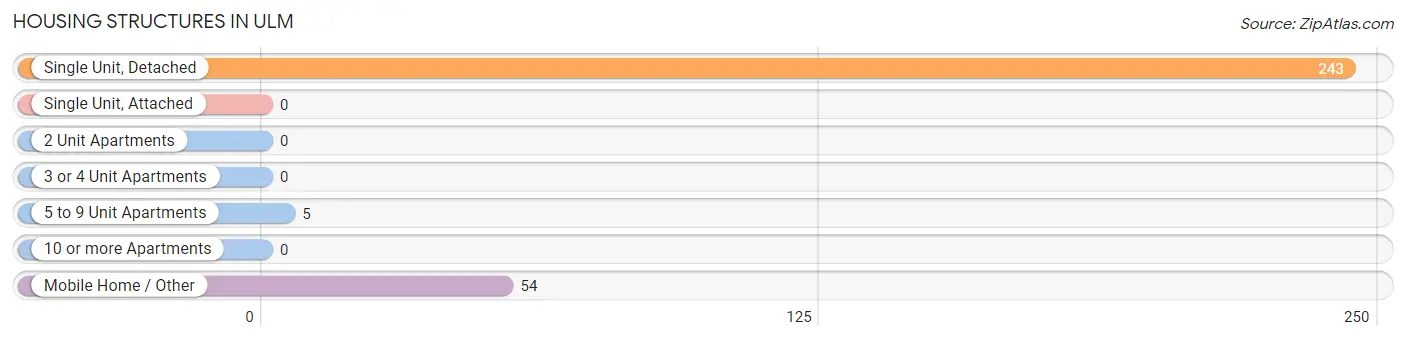
| Structure Type | # Housing Units | % Housing Units |
| Single Unit, Detached | 243 | 80.5% |
| Single Unit, Attached | 0 | 0.0% |
| 2 Unit Apartments | 0 | 0.0% |
| 3 or 4 Unit Apartments | 0 | 0.0% |
| 5 to 9 Unit Apartments | 5 | 1.7% |
| 10 or more Apartments | 0 | 0.0% |
| Mobile Home / Other | 54 | 17.9% |
| Total | 302 | 100.0% |
Housing Structures by Occupancy in Ulm
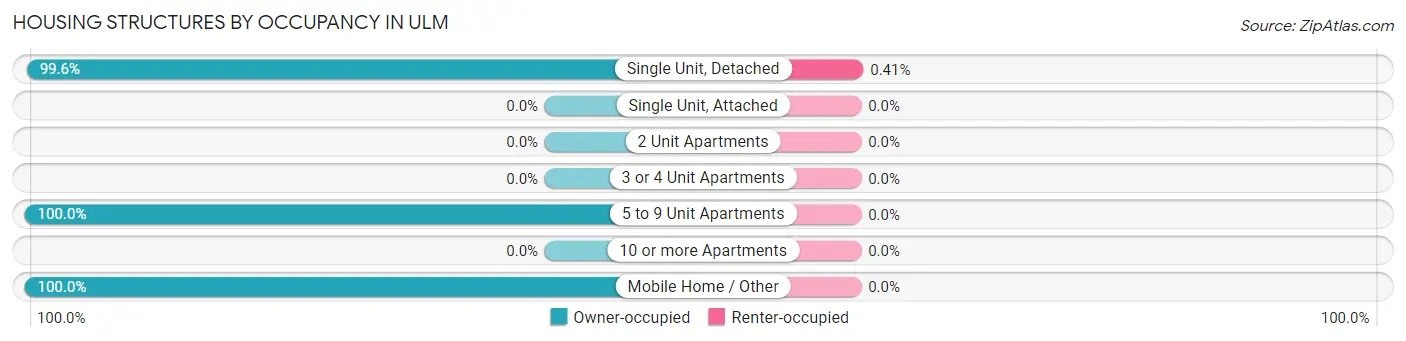
| Structure Type | Owner-occupied | Renter-occupied |
| Single Unit, Detached | 242 (99.6%) | 1 (0.4%) |
| Single Unit, Attached | 0 (0.0%) | 0 (0.0%) |
| 2 Unit Apartments | 0 (0.0%) | 0 (0.0%) |
| 3 or 4 Unit Apartments | 0 (0.0%) | 0 (0.0%) |
| 5 to 9 Unit Apartments | 5 (100.0%) | 0 (0.0%) |
| 10 or more Apartments | 0 (0.0%) | 0 (0.0%) |
| Mobile Home / Other | 54 (100.0%) | 0 (0.0%) |
| Total | 301 (99.7%) | 1 (0.3%) |
Housing Structures by Number of Rooms in Ulm
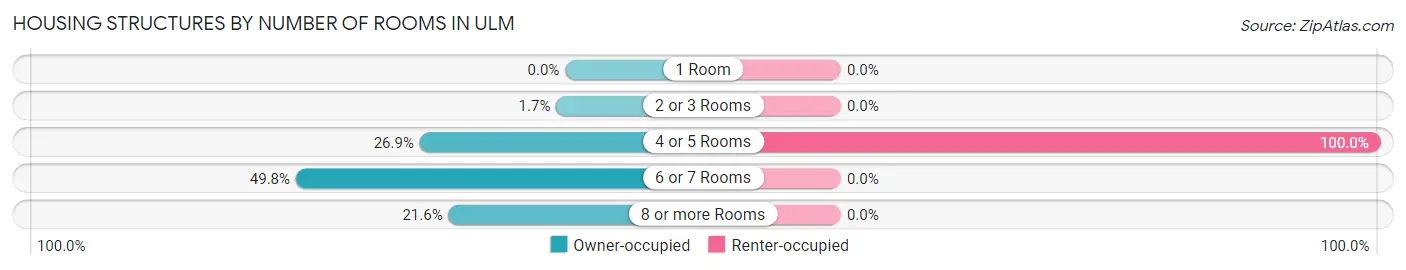
| Number of Rooms | Owner-occupied | Renter-occupied |
| 1 Room | 0 (0.0%) | 0 (0.0%) |
| 2 or 3 Rooms | 5 (1.7%) | 0 (0.0%) |
| 4 or 5 Rooms | 81 (26.9%) | 1 (100.0%) |
| 6 or 7 Rooms | 150 (49.8%) | 0 (0.0%) |
| 8 or more Rooms | 65 (21.6%) | 0 (0.0%) |
| Total | 301 (100.0%) | 1 (100.0%) |
Housing Structure by Heating Type in Ulm
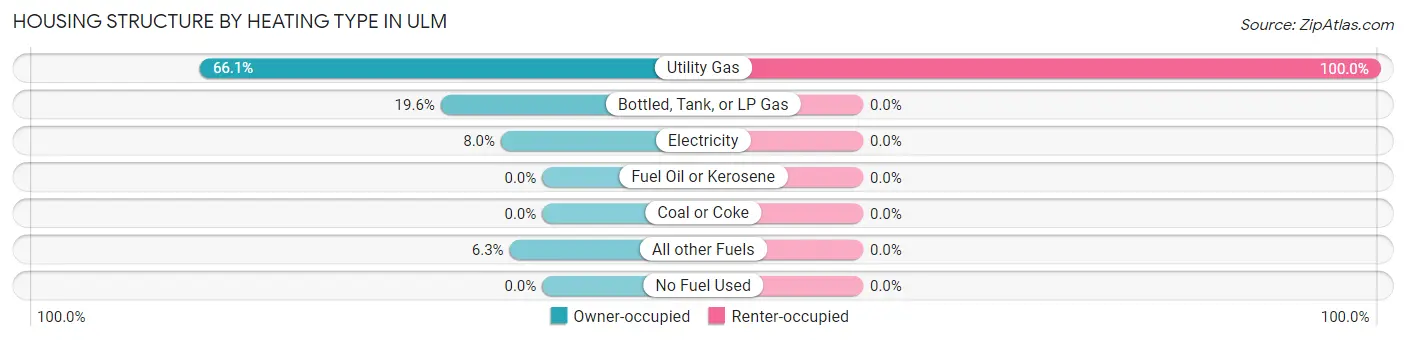
| Heating Type | Owner-occupied | Renter-occupied |
| Utility Gas | 199 (66.1%) | 1 (100.0%) |
| Bottled, Tank, or LP Gas | 59 (19.6%) | 0 (0.0%) |
| Electricity | 24 (8.0%) | 0 (0.0%) |
| Fuel Oil or Kerosene | 0 (0.0%) | 0 (0.0%) |
| Coal or Coke | 0 (0.0%) | 0 (0.0%) |
| All other Fuels | 19 (6.3%) | 0 (0.0%) |
| No Fuel Used | 0 (0.0%) | 0 (0.0%) |
| Total | 301 (100.0%) | 1 (100.0%) |
Household Vehicle Usage in Ulm
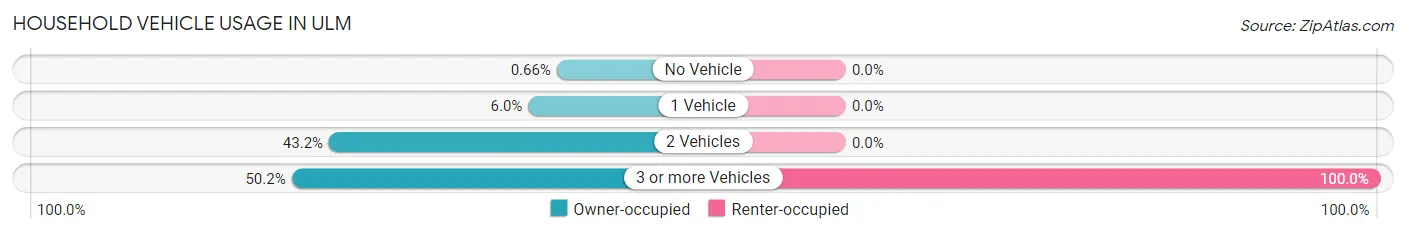
| Vehicles per Household | Owner-occupied | Renter-occupied |
| No Vehicle | 2 (0.7%) | 0 (0.0%) |
| 1 Vehicle | 18 (6.0%) | 0 (0.0%) |
| 2 Vehicles | 130 (43.2%) | 0 (0.0%) |
| 3 or more Vehicles | 151 (50.2%) | 1 (100.0%) |
| Total | 301 (100.0%) | 1 (100.0%) |
Real Estate & Mortgages in Ulm
Real Estate and Mortgage Overview in Ulm
| Characteristic | Without Mortgage | With Mortgage |
| Housing Units | 123 | 178 |
| Median Property Value | $216,100 | $400,000 |
| Median Household Income | $75,781 | $82 |
| Monthly Housing Costs | $394 | $12 |
| Real Estate Taxes | $1,478 | $0 |
Property Value by Mortgage Status in Ulm
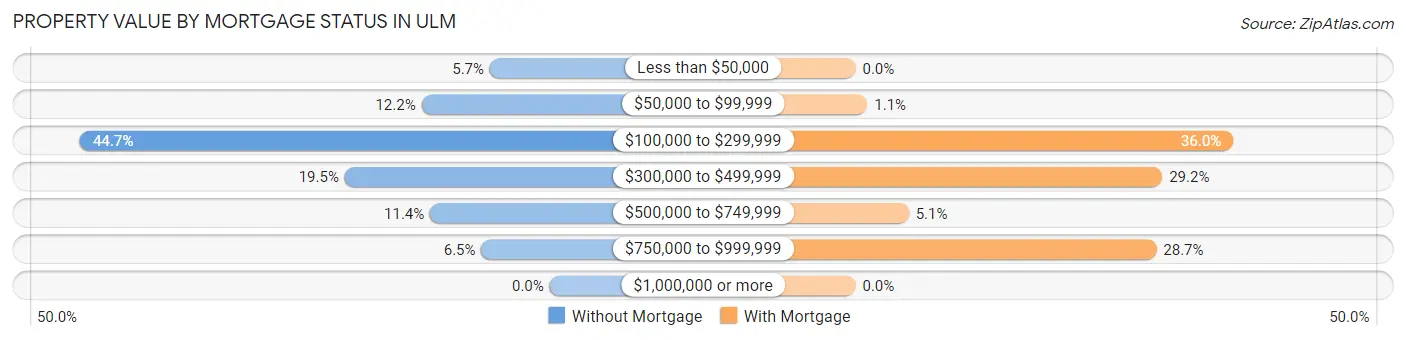
| Property Value | Without Mortgage | With Mortgage |
| Less than $50,000 | 7 (5.7%) | 0 (0.0%) |
| $50,000 to $99,999 | 15 (12.2%) | 2 (1.1%) |
| $100,000 to $299,999 | 55 (44.7%) | 64 (36.0%) |
| $300,000 to $499,999 | 24 (19.5%) | 52 (29.2%) |
| $500,000 to $749,999 | 14 (11.4%) | 9 (5.1%) |
| $750,000 to $999,999 | 8 (6.5%) | 51 (28.6%) |
| $1,000,000 or more | 0 (0.0%) | 0 (0.0%) |
| Total | 123 (100.0%) | 178 (100.0%) |
Household Income by Mortgage Status in Ulm
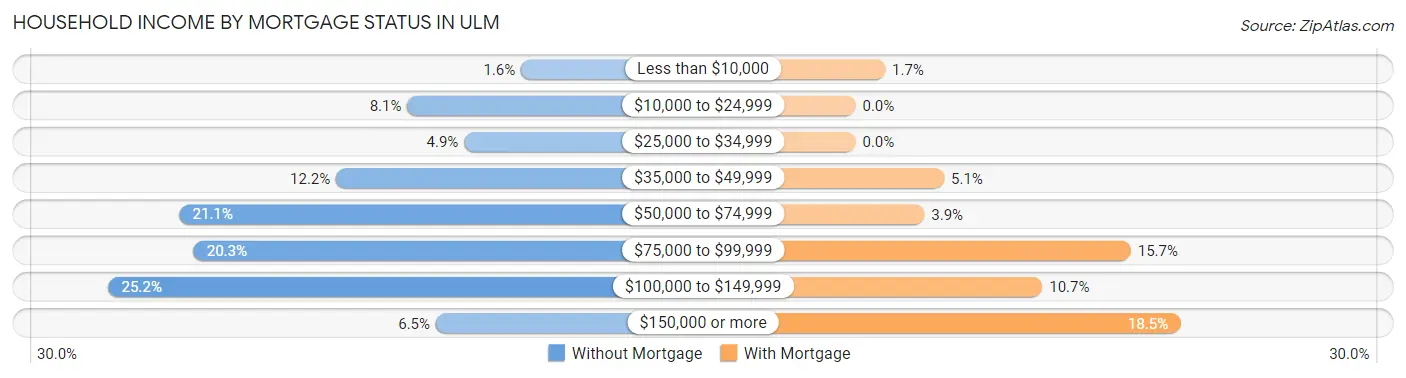
| Household Income | Without Mortgage | With Mortgage |
| Less than $10,000 | 2 (1.6%) | 3 (1.7%) |
| $10,000 to $24,999 | 10 (8.1%) | 0 (0.0%) |
| $25,000 to $34,999 | 6 (4.9%) | 0 (0.0%) |
| $35,000 to $49,999 | 15 (12.2%) | 9 (5.1%) |
| $50,000 to $74,999 | 26 (21.1%) | 7 (3.9%) |
| $75,000 to $99,999 | 25 (20.3%) | 28 (15.7%) |
| $100,000 to $149,999 | 31 (25.2%) | 19 (10.7%) |
| $150,000 or more | 8 (6.5%) | 33 (18.5%) |
| Total | 123 (100.0%) | 178 (100.0%) |
Property Value to Household Income Ratio in Ulm
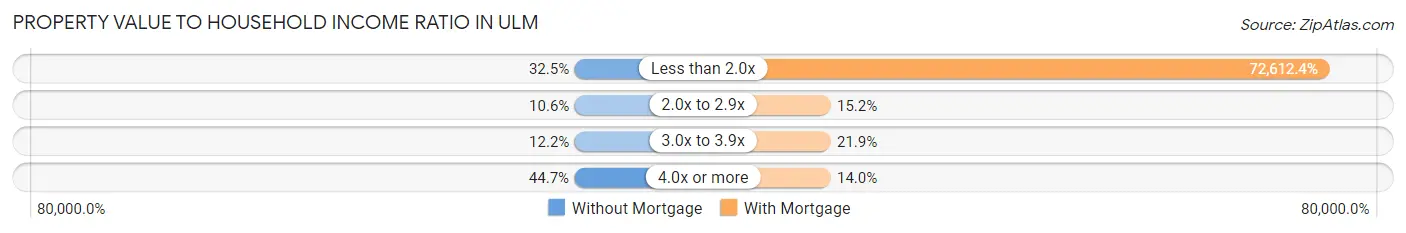
| Value-to-Income Ratio | Without Mortgage | With Mortgage |
| Less than 2.0x | 40 (32.5%) | 129,250 (72,612.4%) |
| 2.0x to 2.9x | 13 (10.6%) | 27 (15.2%) |
| 3.0x to 3.9x | 15 (12.2%) | 39 (21.9%) |
| 4.0x or more | 55 (44.7%) | 25 (14.0%) |
| Total | 123 (100.0%) | 178 (100.0%) |
Real Estate Taxes by Mortgage Status in Ulm
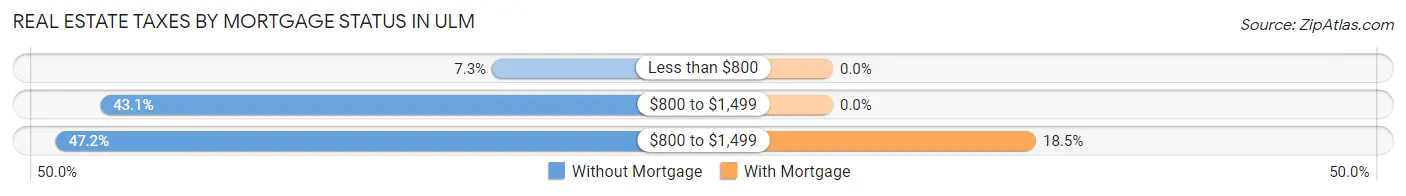
| Property Taxes | Without Mortgage | With Mortgage |
| Less than $800 | 9 (7.3%) | 0 (0.0%) |
| $800 to $1,499 | 53 (43.1%) | 0 (0.0%) |
| $800 to $1,499 | 58 (47.1%) | 33 (18.5%) |
| Total | 123 (100.0%) | 178 (100.0%) |
Health & Disability in Ulm
Health Insurance Coverage by Age in Ulm
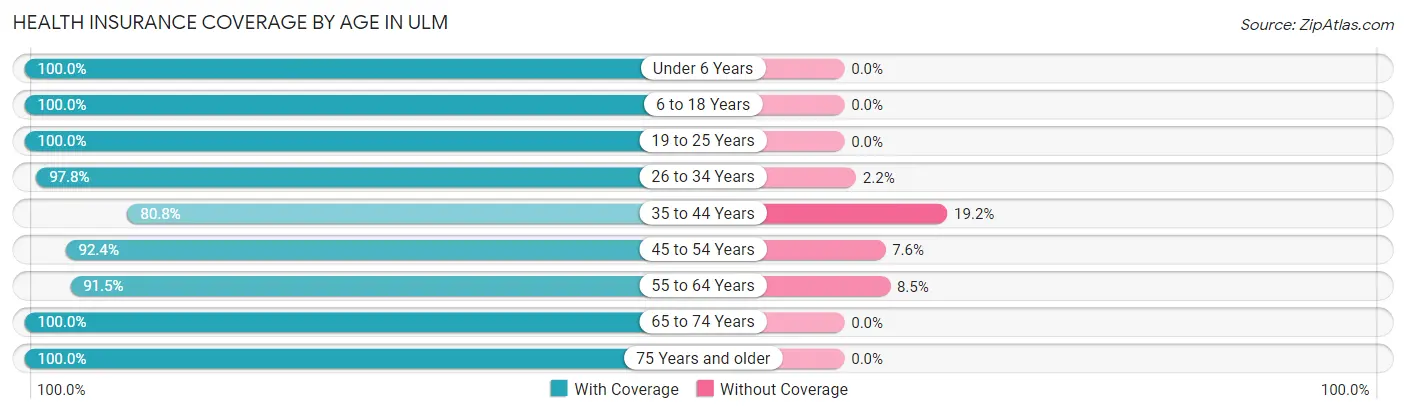
| Age Bracket | With Coverage | Without Coverage |
| Under 6 Years | 72 (100.0%) | 0 (0.0%) |
| 6 to 18 Years | 233 (100.0%) | 0 (0.0%) |
| 19 to 25 Years | 25 (100.0%) | 0 (0.0%) |
| 26 to 34 Years | 135 (97.8%) | 3 (2.2%) |
| 35 to 44 Years | 59 (80.8%) | 14 (19.2%) |
| 45 to 54 Years | 109 (92.4%) | 9 (7.6%) |
| 55 to 64 Years | 86 (91.5%) | 8 (8.5%) |
| 65 to 74 Years | 103 (100.0%) | 0 (0.0%) |
| 75 Years and older | 63 (100.0%) | 0 (0.0%) |
| Total | 885 (96.3%) | 34 (3.7%) |
Health Insurance Coverage by Citizenship Status in Ulm
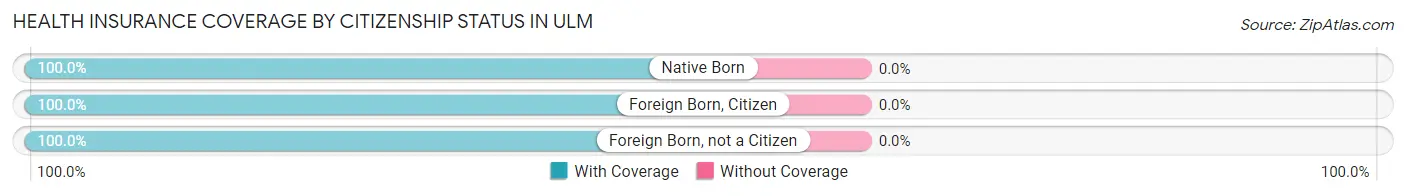
| Citizenship Status | With Coverage | Without Coverage |
| Native Born | 72 (100.0%) | 0 (0.0%) |
| Foreign Born, Citizen | 233 (100.0%) | 0 (0.0%) |
| Foreign Born, not a Citizen | 25 (100.0%) | 0 (0.0%) |
Health Insurance Coverage by Household Income in Ulm

| Household Income | With Coverage | Without Coverage |
| Under $25,000 | 14 (100.0%) | 0 (0.0%) |
| $25,000 to $49,999 | 38 (74.5%) | 13 (25.5%) |
| $50,000 to $74,999 | 130 (87.8%) | 18 (12.2%) |
| $75,000 to $99,999 | 141 (100.0%) | 0 (0.0%) |
| $100,000 and over | 562 (99.5%) | 3 (0.5%) |
Public vs Private Health Insurance Coverage by Age in Ulm
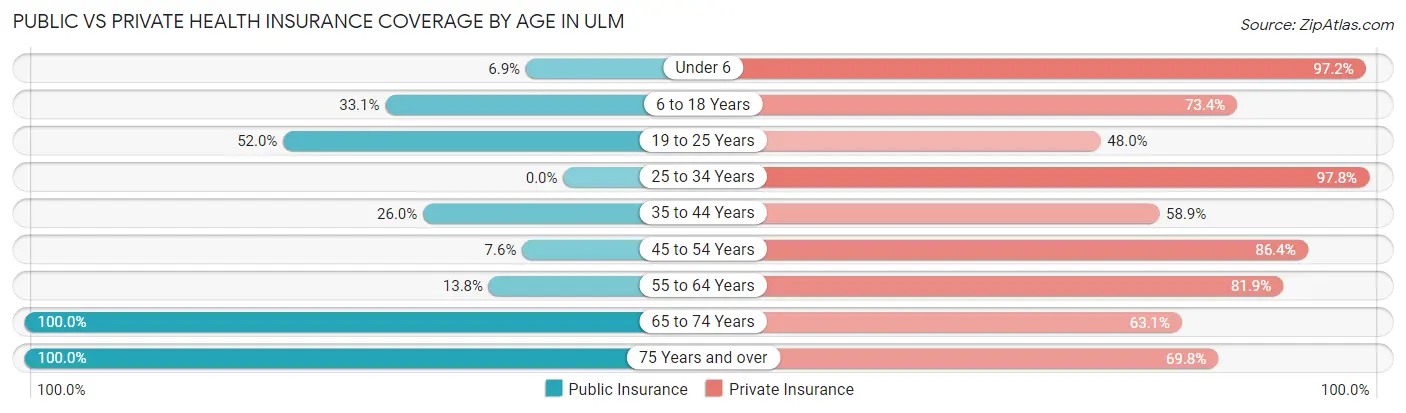
| Age Bracket | Public Insurance | Private Insurance |
| Under 6 | 5 (6.9%) | 70 (97.2%) |
| 6 to 18 Years | 77 (33.1%) | 171 (73.4%) |
| 19 to 25 Years | 13 (52.0%) | 12 (48.0%) |
| 25 to 34 Years | 0 (0.0%) | 135 (97.8%) |
| 35 to 44 Years | 19 (26.0%) | 43 (58.9%) |
| 45 to 54 Years | 9 (7.6%) | 102 (86.4%) |
| 55 to 64 Years | 13 (13.8%) | 77 (81.9%) |
| 65 to 74 Years | 103 (100.0%) | 65 (63.1%) |
| 75 Years and over | 63 (100.0%) | 44 (69.8%) |
| Total | 302 (32.9%) | 719 (78.2%) |
Disability Status by Sex by Age in Ulm
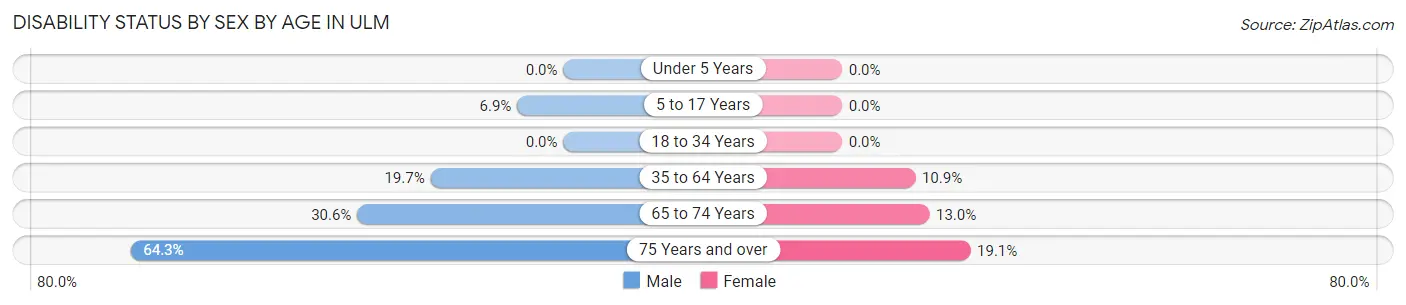
| Age Bracket | Male | Female |
| Under 5 Years | 0 (0.0%) | 0 (0.0%) |
| 5 to 17 Years | 14 (6.9%) | 0 (0.0%) |
| 18 to 34 Years | 0 (0.0%) | 0 (0.0%) |
| 35 to 64 Years | 29 (19.7%) | 15 (10.9%) |
| 65 to 74 Years | 15 (30.6%) | 7 (13.0%) |
| 75 Years and over | 27 (64.3%) | 4 (19.1%) |
Disability Class by Sex by Age in Ulm
Disability Class: Hearing Difficulty
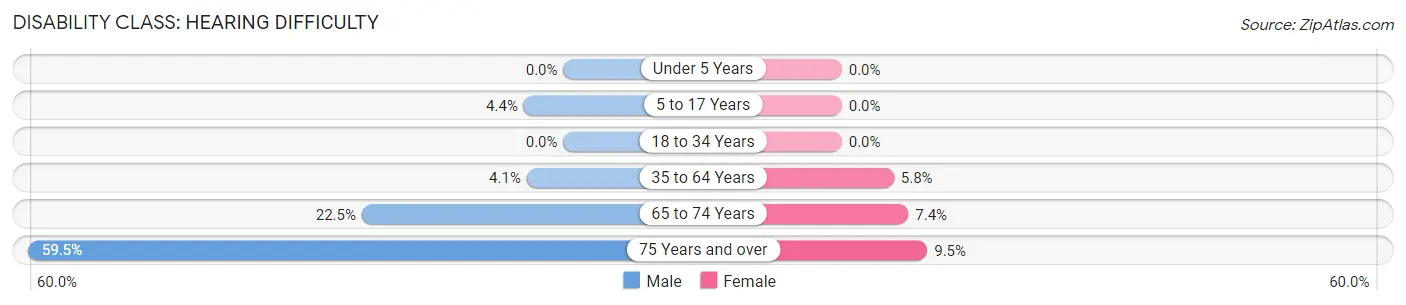
| Age Bracket | Male | Female |
| Under 5 Years | 0 (0.0%) | 0 (0.0%) |
| 5 to 17 Years | 9 (4.4%) | 0 (0.0%) |
| 18 to 34 Years | 0 (0.0%) | 0 (0.0%) |
| 35 to 64 Years | 6 (4.1%) | 8 (5.8%) |
| 65 to 74 Years | 11 (22.5%) | 4 (7.4%) |
| 75 Years and over | 25 (59.5%) | 2 (9.5%) |
Disability Class: Vision Difficulty
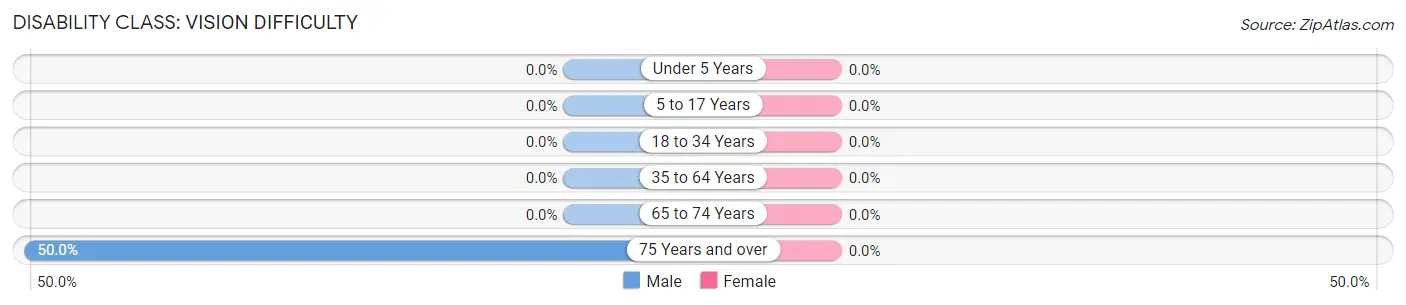
| Age Bracket | Male | Female |
| Under 5 Years | 0 (0.0%) | 0 (0.0%) |
| 5 to 17 Years | 0 (0.0%) | 0 (0.0%) |
| 18 to 34 Years | 0 (0.0%) | 0 (0.0%) |
| 35 to 64 Years | 0 (0.0%) | 0 (0.0%) |
| 65 to 74 Years | 0 (0.0%) | 0 (0.0%) |
| 75 Years and over | 21 (50.0%) | 0 (0.0%) |
Disability Class: Cognitive Difficulty
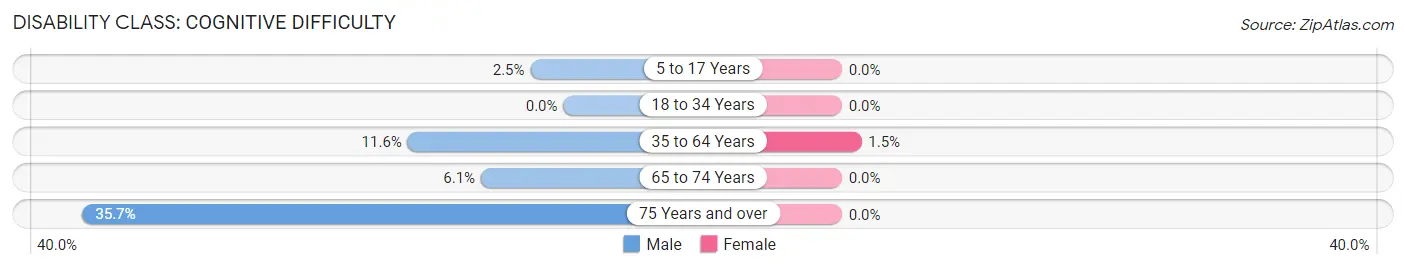
| Age Bracket | Male | Female |
| 5 to 17 Years | 5 (2.5%) | 0 (0.0%) |
| 18 to 34 Years | 0 (0.0%) | 0 (0.0%) |
| 35 to 64 Years | 17 (11.6%) | 2 (1.5%) |
| 65 to 74 Years | 3 (6.1%) | 0 (0.0%) |
| 75 Years and over | 15 (35.7%) | 0 (0.0%) |
Disability Class: Ambulatory Difficulty
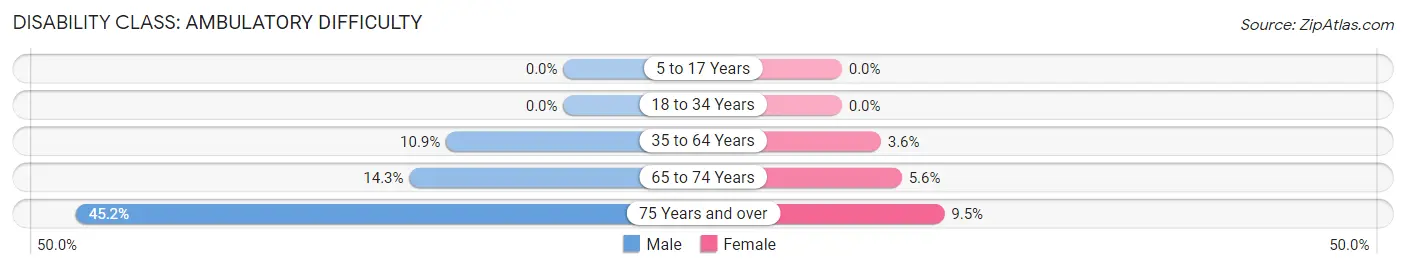
| Age Bracket | Male | Female |
| 5 to 17 Years | 0 (0.0%) | 0 (0.0%) |
| 18 to 34 Years | 0 (0.0%) | 0 (0.0%) |
| 35 to 64 Years | 16 (10.9%) | 5 (3.6%) |
| 65 to 74 Years | 7 (14.3%) | 3 (5.6%) |
| 75 Years and over | 19 (45.2%) | 2 (9.5%) |
Disability Class: Self-Care Difficulty
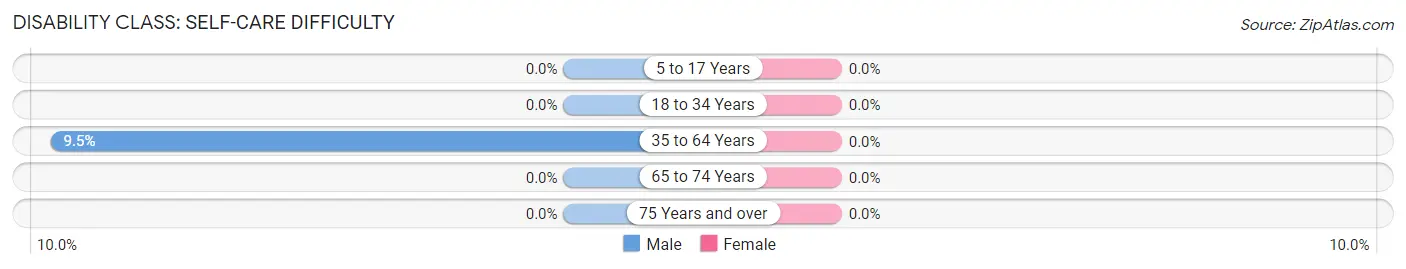
| Age Bracket | Male | Female |
| 5 to 17 Years | 0 (0.0%) | 0 (0.0%) |
| 18 to 34 Years | 0 (0.0%) | 0 (0.0%) |
| 35 to 64 Years | 14 (9.5%) | 0 (0.0%) |
| 65 to 74 Years | 0 (0.0%) | 0 (0.0%) |
| 75 Years and over | 0 (0.0%) | 0 (0.0%) |
Technology Access in Ulm
Computing Device Access in Ulm
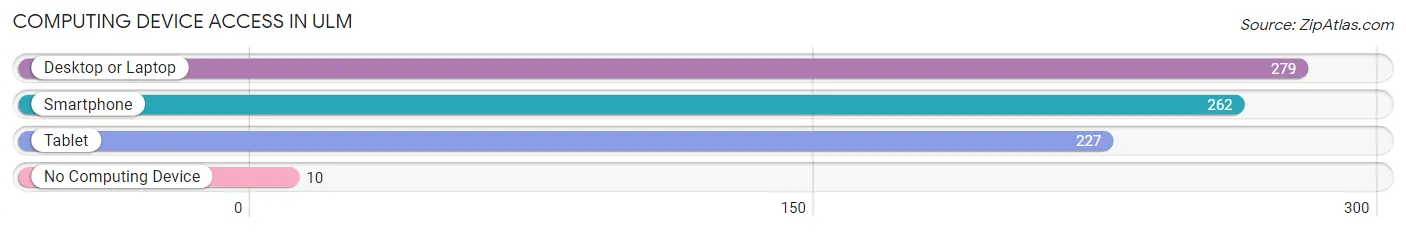
| Device Type | # Households | % Households |
| Desktop or Laptop | 279 | 92.4% |
| Smartphone | 262 | 86.8% |
| Tablet | 227 | 75.2% |
| No Computing Device | 10 | 3.3% |
| Total | 302 | 100.0% |
Internet Access in Ulm
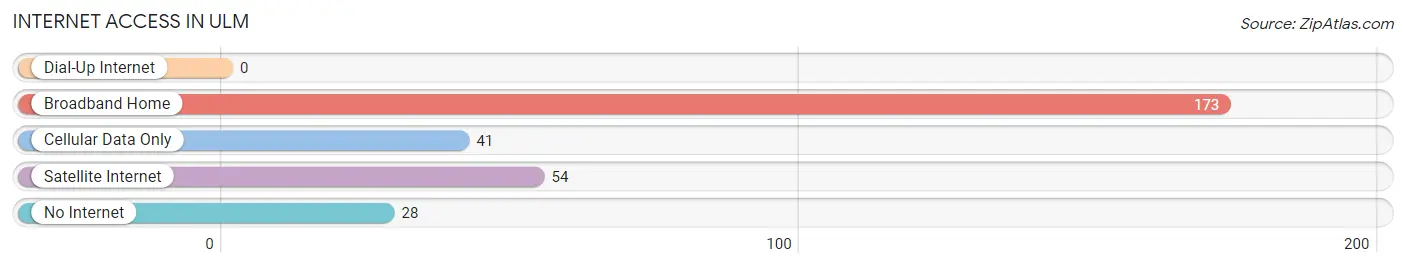
| Internet Type | # Households | % Households |
| Dial-Up Internet | 0 | 0.0% |
| Broadband Home | 173 | 57.3% |
| Cellular Data Only | 41 | 13.6% |
| Satellite Internet | 54 | 17.9% |
| No Internet | 28 | 9.3% |
| Total | 302 | 100.0% |
Ulm Summary
Ulm, Montana is a small city located in Cascade County, Montana, United States. It is situated along the Missouri River, approximately 20 miles east of Great Falls. The city has a population of approximately 1,800 people and is the county seat of Cascade County.
History
Ulm was founded in 1883 by German immigrants who had come to the area to work in the coal mines. The city was named after the city of Ulm in Germany. The city was incorporated in 1887 and was the first city in Cascade County.
In the early 1900s, Ulm was a thriving community with a variety of businesses, including a brewery, a hotel, a bank, a newspaper, and a variety of other businesses. The city was also home to a number of churches, including the German Lutheran Church, which was founded in 1884.
In the 1920s, the city experienced a period of growth and prosperity. The city was home to a number of businesses, including a flour mill, a creamery, a furniture store, and a variety of other businesses. The city also had a number of churches, including the German Lutheran Church, which was founded in 1884.
In the 1930s, the city experienced a period of decline due to the Great Depression. Many of the businesses in the city closed and the population decreased.
In the 1940s, the city experienced a period of growth and prosperity. The city was home to a number of businesses, including a flour mill, a creamery, a furniture store, and a variety of other businesses. The city also had a number of churches, including the German Lutheran Church, which was founded in 1884.
In the 1950s, the city experienced a period of decline due to the decline of the coal industry. Many of the businesses in the city closed and the population decreased.
In the 1960s, the city experienced a period of growth and prosperity. The city was home to a number of businesses, including a flour mill, a creamery, a furniture store, and a variety of other businesses. The city also had a number of churches, including the German Lutheran Church, which was founded in 1884.
In the 1970s, the city experienced a period of decline due to the decline of the coal industry. Many of the businesses in the city closed and the population decreased.
In the 1980s, the city experienced a period of growth and prosperity. The city was home to a number of businesses, including a flour mill, a creamery, a furniture store, and a variety of other businesses. The city also had a number of churches, including the German Lutheran Church, which was founded in 1884.
Geography
Ulm is located in Cascade County, Montana, United States. It is situated along the Missouri River, approximately 20 miles east of Great Falls. The city has a total area of 1.2 square miles, all of which is land.
The city is located in a semi-arid climate, with hot summers and cold winters. The average temperature in the summer is around 80°F and the average temperature in the winter is around 20°F.
Economy
The economy of Ulm is largely based on agriculture and tourism. The city is home to a number of farms, which produce a variety of crops, including wheat, barley, oats, and hay. The city is also home to a number of tourist attractions, including the Ulm Pishkun State Park, which is a popular destination for camping, fishing, and hiking.
The city is also home to a number of businesses, including a flour mill, a creamery, a furniture store, and a variety of other businesses. The city also has a number of churches, including the German Lutheran Church, which was founded in 1884.
Demographics
As of the 2010 census, the population of Ulm was 1,800 people. The racial makeup of the city was 97.2% White, 0.3% African American, 0.2% Native American, 0.2% Asian, 0.1% Pacific Islander, 0.6% from other races, and 1.6% from two or more races. Hispanic or Latino of any race were 1.6% of the population.
The median income for a household in the city was $37,500 and the median income for a family was $45,000. The per capita income for the city was $18,000. About 11.2% of families and 14.2% of the population were below the poverty line, including 18.2% of those under age 18 and 8.3% of those age 65 or over.
Common Questions
What is Per Capita Income in Ulm?
Per Capita income in Ulm is $38,943.
What is the Median Family Income in Ulm?
Median Family Income in Ulm is $118,167.
What is the Median Household income in Ulm?
Median Household Income in Ulm is $100,750.
What is Income or Wage Gap in Ulm?
Income or Wage Gap in Ulm is 25.0%.
Women in Ulm earn 75.0 cents for every dollar earned by a man.
What is Inequality or Gini Index in Ulm?
Inequality or Gini Index in Ulm is 0.34.
What is the Total Population of Ulm?
Total Population of Ulm is 919.
What is the Total Male Population of Ulm?
Total Male Population of Ulm is 545.
What is the Total Female Population of Ulm?
Total Female Population of Ulm is 374.
What is the Ratio of Males per 100 Females in Ulm?
There are 145.72 Males per 100 Females in Ulm.
What is the Ratio of Females per 100 Males in Ulm?
There are 68.62 Females per 100 Males in Ulm.
What is the Median Population Age in Ulm?
Median Population Age in Ulm is 34.8 Years.
What is the Average Family Size in Ulm
Average Family Size in Ulm is 3.4 People.
What is the Average Household Size in Ulm
Average Household Size in Ulm is 3.0 People.
How Large is the Labor Force in Ulm?
There are 434 People in the Labor Forcein in Ulm.
What is the Percentage of People in the Labor Force in Ulm?
65.1% of People are in the Labor Force in Ulm.
What is the Unemployment Rate in Ulm?
Unemployment Rate in Ulm is 3.0%.