Dedham, IA Map & Demographics
Dedham Map
Dedham Overview
$30,155
PER CAPITA INCOME
$91,875
AVG FAMILY INCOME
$85,417
AVG HOUSEHOLD INCOME
48.7%
WAGE / INCOME GAP [ % ]
51.3¢/ $1
WAGE / INCOME GAP [ $ ]
0.30
INEQUALITY / GINI INDEX
228
TOTAL POPULATION
124
MALE POPULATION
104
FEMALE POPULATION
119.23
MALES / 100 FEMALES
83.87
FEMALES / 100 MALES
30.7
MEDIAN AGE
3.4
AVG FAMILY SIZE
2.9
AVG HOUSEHOLD SIZE
135
LABOR FORCE [ PEOPLE ]
80.8%
PERCENT IN LABOR FORCE
1.5%
UNEMPLOYMENT RATE
Dedham Zip Codes
Dedham Area Codes
Income in Dedham
Income Overview in Dedham
Per Capita Income in Dedham is $30,155, while median incomes of families and households are $91,875 and $85,417 respectively.
| Characteristic | Number | Measure |
| Per Capita Income | 228 | $30,155 |
| Median Family Income | 57 | $91,875 |
| Mean Family Income | 57 | $85,218 |
| Median Household Income | 79 | $85,417 |
| Mean Household Income | 79 | $84,368 |
| Income Deficit | 57 | $0 |
| Wage / Income Gap (%) | 228 | 48.69% |
| Wage / Income Gap ($) | 228 | 51.31¢ per $1 |
| Gini / Inequality Index | 228 | 0.30 |
Earnings by Sex in Dedham
Average Earnings in Dedham are $33,750, $51,563 for men and $26,458 for women, a difference of 48.7%.
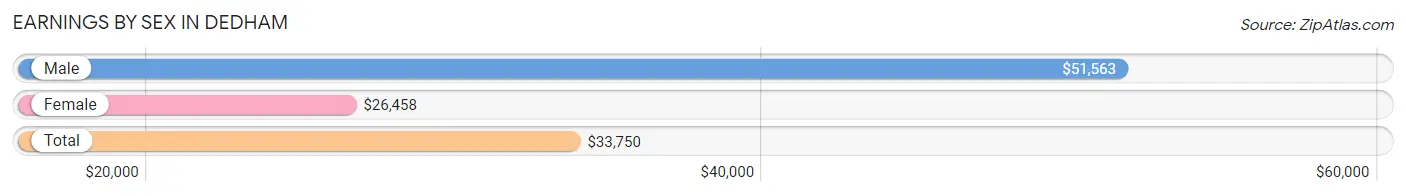
| Sex | Number | Average Earnings |
| Male | 79 (54.9%) | $51,563 |
| Female | 65 (45.1%) | $26,458 |
| Total | 144 (100.0%) | $33,750 |
Earnings by Sex by Income Bracket in Dedham
The most common earnings brackets in Dedham are $55,000 to $64,999 for men (11 | 13.9%) and $25,000 to $29,999 for women (9 | 13.9%).
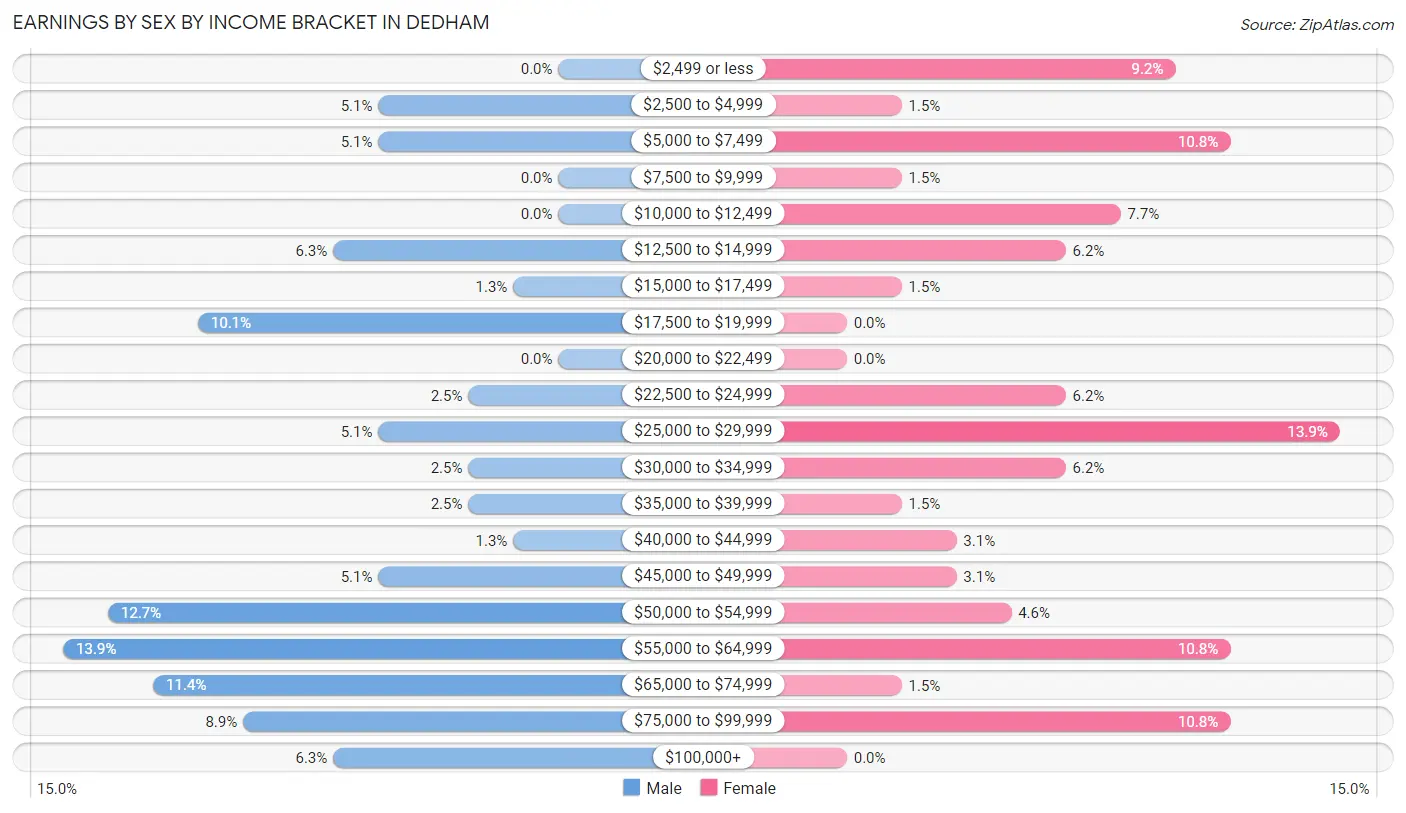
| Income | Male | Female |
| $2,499 or less | 0 (0.0%) | 6 (9.2%) |
| $2,500 to $4,999 | 4 (5.1%) | 1 (1.5%) |
| $5,000 to $7,499 | 4 (5.1%) | 7 (10.8%) |
| $7,500 to $9,999 | 0 (0.0%) | 1 (1.5%) |
| $10,000 to $12,499 | 0 (0.0%) | 5 (7.7%) |
| $12,500 to $14,999 | 5 (6.3%) | 4 (6.1%) |
| $15,000 to $17,499 | 1 (1.3%) | 1 (1.5%) |
| $17,500 to $19,999 | 8 (10.1%) | 0 (0.0%) |
| $20,000 to $22,499 | 0 (0.0%) | 0 (0.0%) |
| $22,500 to $24,999 | 2 (2.5%) | 4 (6.1%) |
| $25,000 to $29,999 | 4 (5.1%) | 9 (13.9%) |
| $30,000 to $34,999 | 2 (2.5%) | 4 (6.1%) |
| $35,000 to $39,999 | 2 (2.5%) | 1 (1.5%) |
| $40,000 to $44,999 | 1 (1.3%) | 2 (3.1%) |
| $45,000 to $49,999 | 4 (5.1%) | 2 (3.1%) |
| $50,000 to $54,999 | 10 (12.7%) | 3 (4.6%) |
| $55,000 to $64,999 | 11 (13.9%) | 7 (10.8%) |
| $65,000 to $74,999 | 9 (11.4%) | 1 (1.5%) |
| $75,000 to $99,999 | 7 (8.9%) | 7 (10.8%) |
| $100,000+ | 5 (6.3%) | 0 (0.0%) |
| Total | 79 (100.0%) | 65 (100.0%) |
Earnings by Sex by Educational Attainment in Dedham
Average earnings in Dedham are $54,792 for men and $30,313 for women, a difference of 44.7%. Men with an educational attainment of college or associate's degree enjoy the highest average annual earnings of $57,250, while those with high school diploma education earn the least with $52,083. Women with an educational attainment of bachelor's degree earn the most with the average annual earnings of $48,750, while those with college or associate's degree education have the smallest earnings of $26,500.
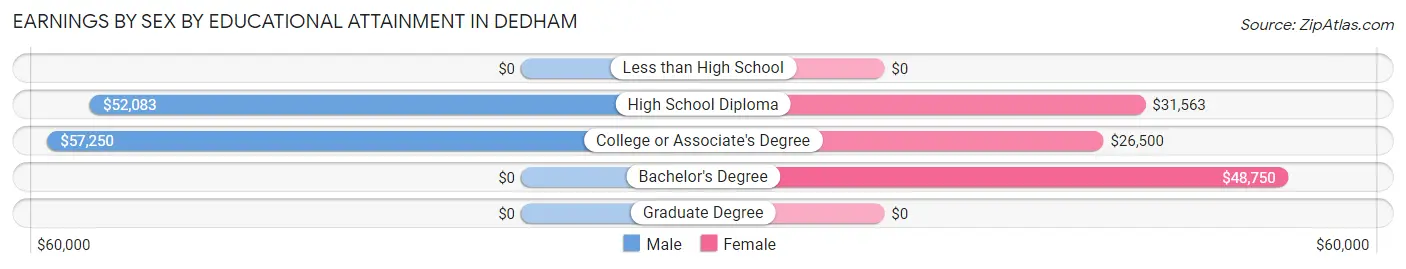
| Educational Attainment | Male Income | Female Income |
| Less than High School | - | - |
| High School Diploma | $52,083 | $31,563 |
| College or Associate's Degree | $57,250 | $26,500 |
| Bachelor's Degree | - | - |
| Graduate Degree | - | - |
| Total | $54,792 | $30,313 |
Family Income in Dedham
Family Income Brackets in Dedham
According to the Dedham family income data, there are 18 families falling into the $100,000 to $149,999 income range, which is the most common income bracket and makes up 31.6% of all families.
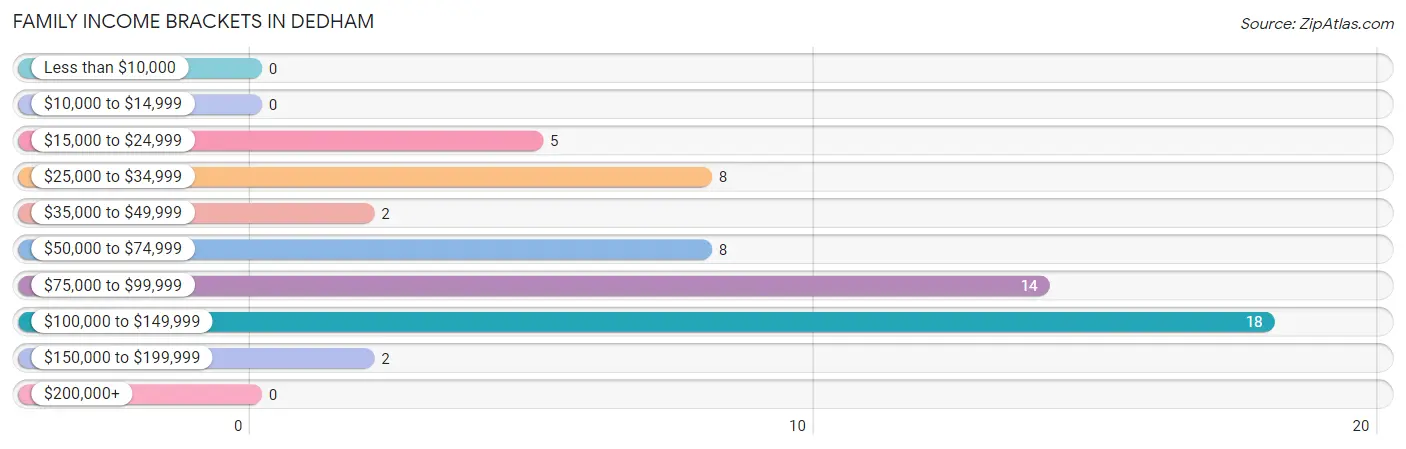
| Income Bracket | # Families | % Families |
| Less than $10,000 | 0 | 0.0% |
| $10,000 to $14,999 | 0 | 0.0% |
| $15,000 to $24,999 | 5 | 8.8% |
| $25,000 to $34,999 | 8 | 14.0% |
| $35,000 to $49,999 | 2 | 3.5% |
| $50,000 to $74,999 | 8 | 14.0% |
| $75,000 to $99,999 | 14 | 24.6% |
| $100,000 to $149,999 | 18 | 31.6% |
| $150,000 to $199,999 | 2 | 3.5% |
| $200,000+ | 0 | 0.0% |
Family Income by Famaliy Size in Dedham
3-person families (15 | 26.3%) account for the highest median family income in Dedham with $94,750 per family, while 2-person families (23 | 40.4%) have the highest median income of $36,875 per family member.
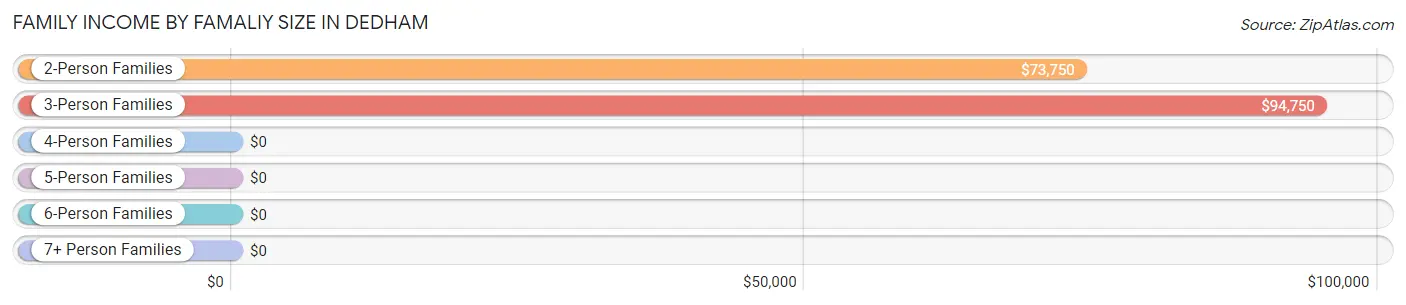
| Income Bracket | # Families | Median Income |
| 2-Person Families | 23 (40.4%) | $73,750 |
| 3-Person Families | 15 (26.3%) | $94,750 |
| 4-Person Families | 9 (15.8%) | $0 |
| 5-Person Families | 8 (14.0%) | $0 |
| 6-Person Families | 2 (3.5%) | $0 |
| 7+ Person Families | 0 (0.0%) | $0 |
| Total | 57 (100.0%) | $91,875 |
Family Income by Number of Earners in Dedham
The median family income in Dedham is $91,875, with families comprising 3+ earners (6) having the highest median family income of $132,500, while families with 1 earner (8) have the lowest median family income of $43,750, accounting for 10.5% and 14.0% of families, respectively.
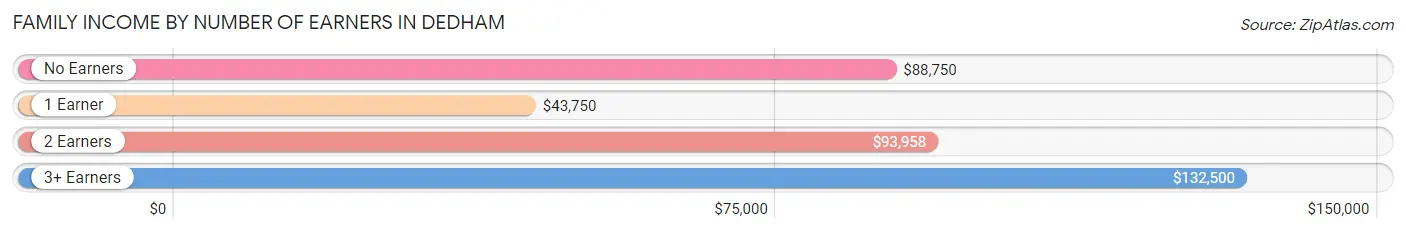
| Number of Earners | # Families | Median Income |
| No Earners | 4 (7.0%) | $88,750 |
| 1 Earner | 8 (14.0%) | $43,750 |
| 2 Earners | 39 (68.4%) | $93,958 |
| 3+ Earners | 6 (10.5%) | $132,500 |
| Total | 57 (100.0%) | $91,875 |
Household Income in Dedham
Household Income Brackets in Dedham
With 23 households falling in the category, the $75,000 to $99,999 income range is the most frequent in Dedham, accounting for 29.1% of all households.
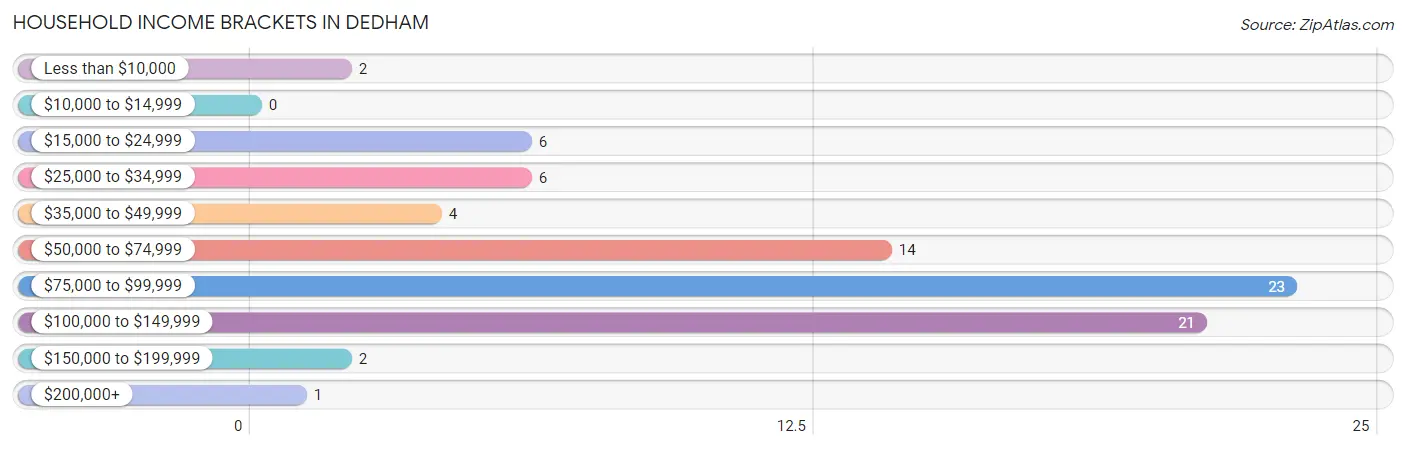
| Income Bracket | # Households | % Households |
| Less than $10,000 | 2 | 2.5% |
| $10,000 to $14,999 | 0 | 0.0% |
| $15,000 to $24,999 | 6 | 7.6% |
| $25,000 to $34,999 | 6 | 7.6% |
| $35,000 to $49,999 | 4 | 5.1% |
| $50,000 to $74,999 | 14 | 17.7% |
| $75,000 to $99,999 | 23 | 29.1% |
| $100,000 to $149,999 | 21 | 26.6% |
| $150,000 to $199,999 | 2 | 2.5% |
| $200,000+ | 1 | 1.3% |
Household Income by Householder Age in Dedham
The median household income in Dedham is $85,417, with the highest median household income of $125,000 found in the 45 to 64 years age bracket for the primary householder. A total of 22 households (27.9%) fall into this category.
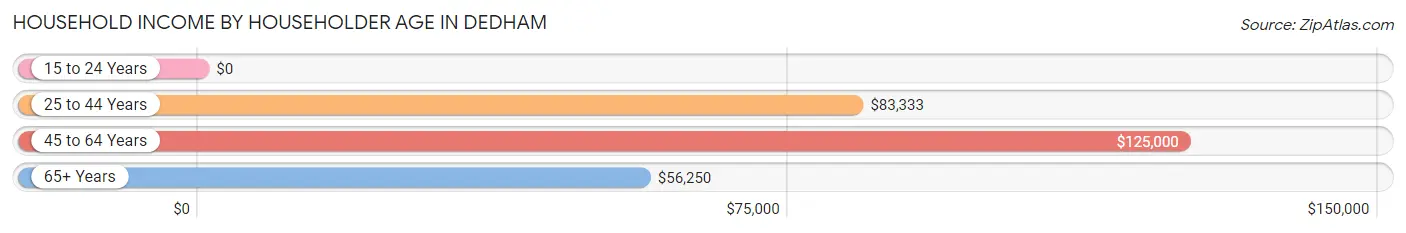
| Income Bracket | # Households | Median Income |
| 15 to 24 Years | 0 (0.0%) | $0 |
| 25 to 44 Years | 42 (53.2%) | $83,333 |
| 45 to 64 Years | 22 (27.9%) | $125,000 |
| 65+ Years | 15 (19.0%) | $56,250 |
| Total | 79 (100.0%) | $85,417 |
Poverty in Dedham
Income Below Poverty by Sex and Age in Dedham
With 17.7% poverty level for males and 23.1% for females among the residents of Dedham, 6 to 11 year old males and 12 to 14 year old females are the most vulnerable to poverty, with 12 males (66.7%) and 9 females (81.8%) in their respective age groups living below the poverty level.
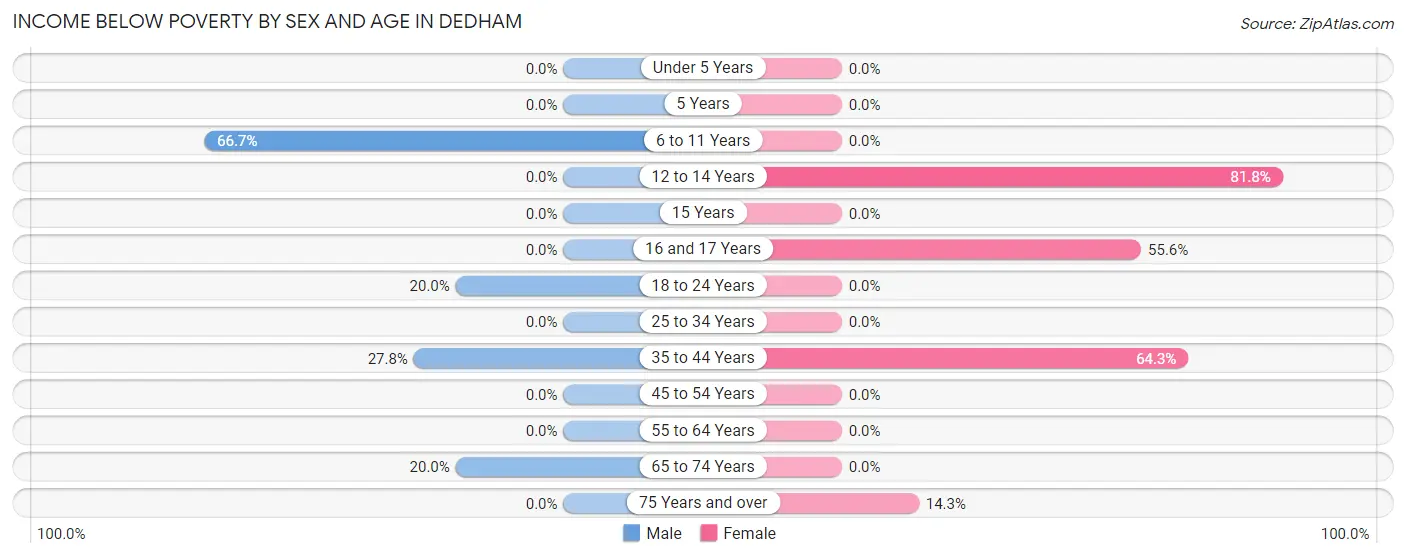
| Age Bracket | Male | Female |
| Under 5 Years | 0 (0.0%) | 0 (0.0%) |
| 5 Years | 0 (0.0%) | 0 (0.0%) |
| 6 to 11 Years | 12 (66.7%) | 0 (0.0%) |
| 12 to 14 Years | 0 (0.0%) | 9 (81.8%) |
| 15 Years | 0 (0.0%) | 0 (0.0%) |
| 16 and 17 Years | 0 (0.0%) | 5 (55.6%) |
| 18 to 24 Years | 4 (20.0%) | 0 (0.0%) |
| 25 to 34 Years | 0 (0.0%) | 0 (0.0%) |
| 35 to 44 Years | 5 (27.8%) | 9 (64.3%) |
| 45 to 54 Years | 0 (0.0%) | 0 (0.0%) |
| 55 to 64 Years | 0 (0.0%) | 0 (0.0%) |
| 65 to 74 Years | 1 (20.0%) | 0 (0.0%) |
| 75 Years and over | 0 (0.0%) | 1 (14.3%) |
| Total | 22 (17.7%) | 24 (23.1%) |
Income Above Poverty by Sex and Age in Dedham
According to the poverty statistics in Dedham, males aged under 5 years and females aged under 5 years are the age groups that are most secure financially, with 100.0% of males and 100.0% of females in these age groups living above the poverty line.
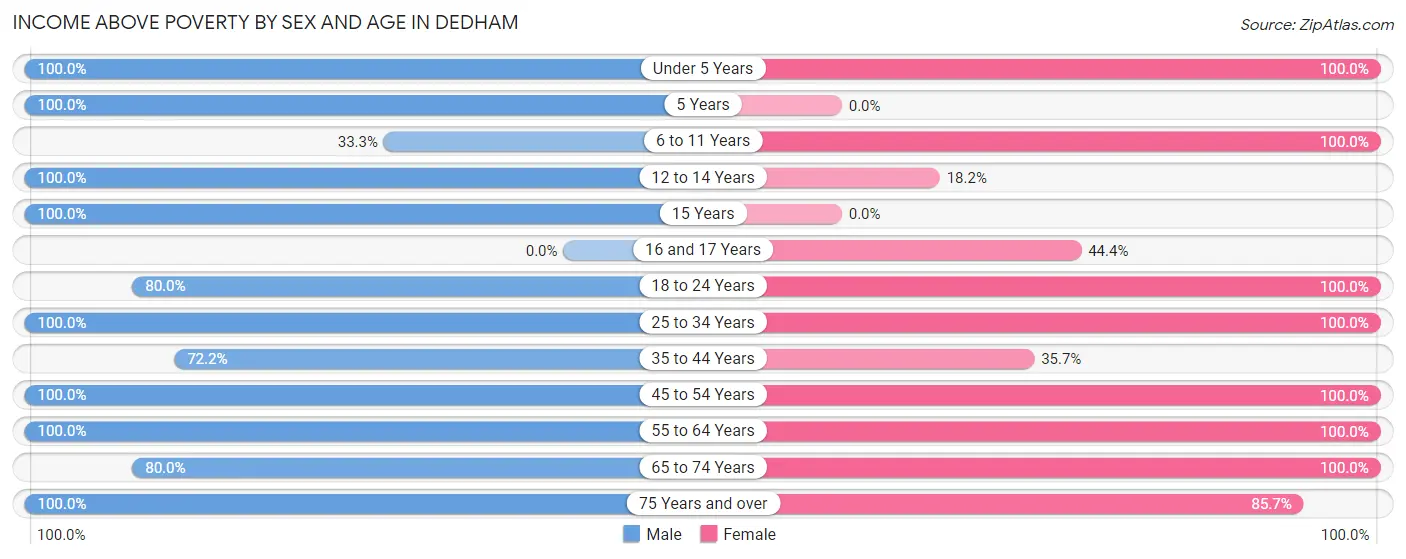
| Age Bracket | Male | Female |
| Under 5 Years | 7 (100.0%) | 10 (100.0%) |
| 5 Years | 2 (100.0%) | 0 (0.0%) |
| 6 to 11 Years | 6 (33.3%) | 7 (100.0%) |
| 12 to 14 Years | 4 (100.0%) | 2 (18.2%) |
| 15 Years | 2 (100.0%) | 0 (0.0%) |
| 16 and 17 Years | 0 (0.0%) | 4 (44.4%) |
| 18 to 24 Years | 16 (80.0%) | 5 (100.0%) |
| 25 to 34 Years | 20 (100.0%) | 13 (100.0%) |
| 35 to 44 Years | 13 (72.2%) | 5 (35.7%) |
| 45 to 54 Years | 10 (100.0%) | 13 (100.0%) |
| 55 to 64 Years | 11 (100.0%) | 10 (100.0%) |
| 65 to 74 Years | 4 (80.0%) | 5 (100.0%) |
| 75 Years and over | 7 (100.0%) | 6 (85.7%) |
| Total | 102 (82.3%) | 80 (76.9%) |
Income Below Poverty Among Married-Couple Families in Dedham
The poverty statistics for married-couple families in Dedham show that 9.1% or 4 of the total 44 families live below the poverty line. Families with 3 or 4 children have the highest poverty rate of 44.4%, comprising of 4 families. On the other hand, families with no children have the lowest poverty rate of 0.0%, which includes 0 families.
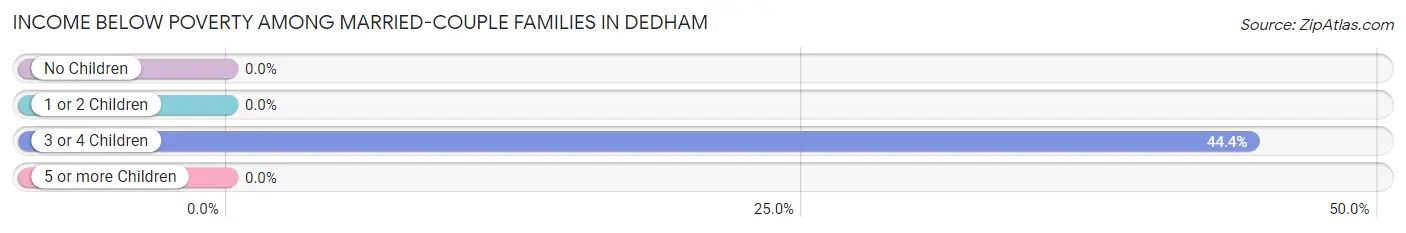
| Children | Above Poverty | Below Poverty |
| No Children | 24 (100.0%) | 0 (0.0%) |
| 1 or 2 Children | 11 (100.0%) | 0 (0.0%) |
| 3 or 4 Children | 5 (55.6%) | 4 (44.4%) |
| 5 or more Children | 0 (0.0%) | 0 (0.0%) |
| Total | 40 (90.9%) | 4 (9.1%) |
Income Below Poverty Among Single-Parent Households in Dedham
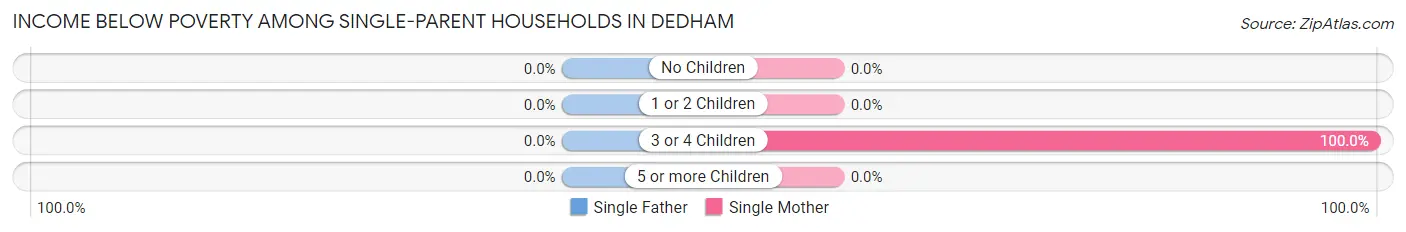
| Children | Single Father | Single Mother |
| No Children | 0 (0.0%) | 0 (0.0%) |
| 1 or 2 Children | 0 (0.0%) | 0 (0.0%) |
| 3 or 4 Children | 0 (0.0%) | 5 (100.0%) |
| 5 or more Children | 0 (0.0%) | 0 (0.0%) |
| Total | 0 (0.0%) | 5 (38.5%) |
Income Below Poverty Among Married-Couple vs Single-Parent Households in Dedham
The poverty data for Dedham shows that 4 of the married-couple family households (9.1%) and 5 of the single-parent households (38.5%) are living below the poverty level. Within the married-couple family households, those with 3 or 4 children have the highest poverty rate, with 4 households (44.4%) falling below the poverty line. Among the single-parent households, those with 3 or 4 children have the highest poverty rate, with 5 household (100.0%) living below poverty.
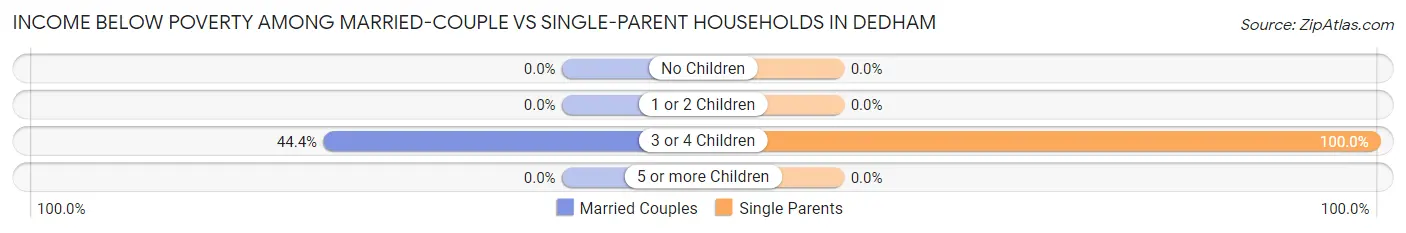
| Children | Married-Couple Families | Single-Parent Households |
| No Children | 0 (0.0%) | 0 (0.0%) |
| 1 or 2 Children | 0 (0.0%) | 0 (0.0%) |
| 3 or 4 Children | 4 (44.4%) | 5 (100.0%) |
| 5 or more Children | 0 (0.0%) | 0 (0.0%) |
| Total | 4 (9.1%) | 5 (38.5%) |
Race in Dedham
The most populous races in Dedham are White / Caucasian (226 | 99.1%), Hispanic or Latino (2 | 0.9%), and Two or more Races (2 | 0.9%).
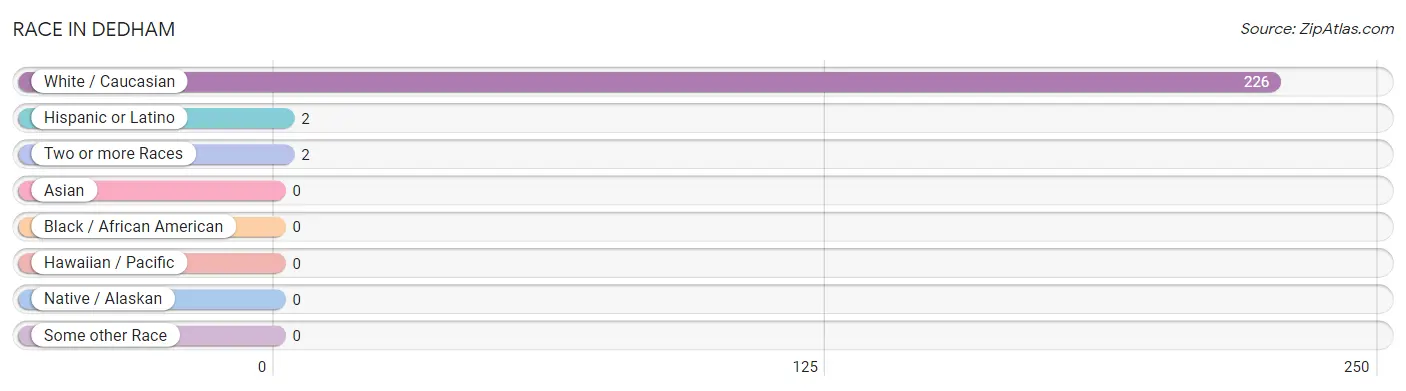
| Race | # Population | % Population |
| Asian | 0 | 0.0% |
| Black / African American | 0 | 0.0% |
| Hawaiian / Pacific | 0 | 0.0% |
| Hispanic or Latino | 2 | 0.9% |
| Native / Alaskan | 0 | 0.0% |
| White / Caucasian | 226 | 99.1% |
| Two or more Races | 2 | 0.9% |
| Some other Race | 0 | 0.0% |
| Total | 228 | 100.0% |
Ancestry in Dedham
The most populous ancestries reported in Dedham are German (156 | 68.4%), Irish (36 | 15.8%), American (27 | 11.8%), Dutch (4 | 1.8%), and English (3 | 1.3%), together accounting for 99.1% of all Dedham residents.
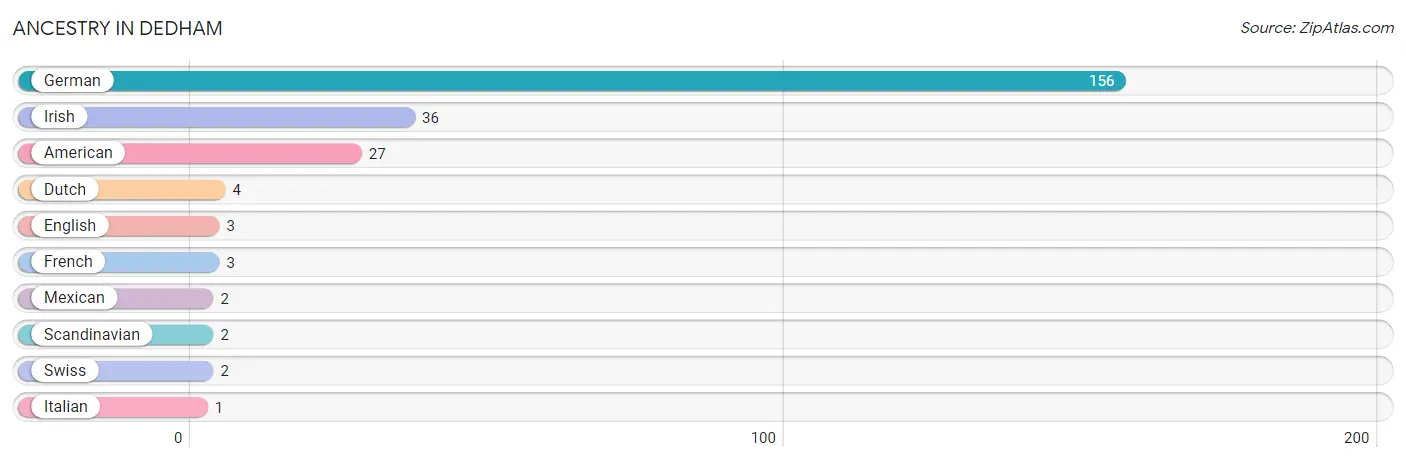
| Ancestry | # Population | % Population |
| American | 27 | 11.8% |
| Dutch | 4 | 1.8% |
| English | 3 | 1.3% |
| French | 3 | 1.3% |
| German | 156 | 68.4% |
| Irish | 36 | 15.8% |
| Italian | 1 | 0.4% |
| Mexican | 2 | 0.9% |
| Scandinavian | 2 | 0.9% |
| Swiss | 2 | 0.9% | View All 10 Rows |
Immigrants in Dedham

| Immigration Origin | # Population | % Population | View All 0 Rows |
Sex and Age in Dedham
Sex and Age in Dedham
The most populous age groups in Dedham are 20 to 24 Years (18 | 14.5%) for men and 10 to 14 Years (17 | 16.4%) for women.
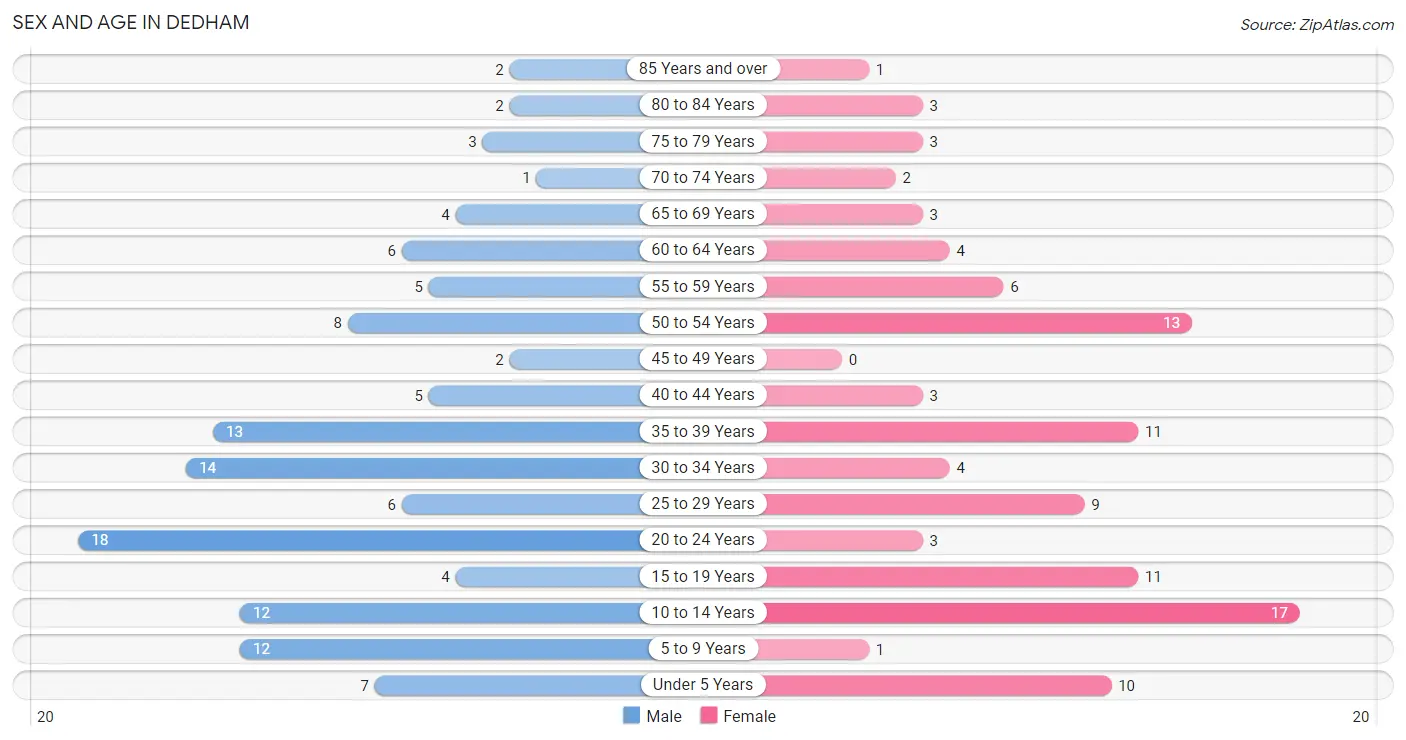
| Age Bracket | Male | Female |
| Under 5 Years | 7 (5.7%) | 10 (9.6%) |
| 5 to 9 Years | 12 (9.7%) | 1 (1.0%) |
| 10 to 14 Years | 12 (9.7%) | 17 (16.4%) |
| 15 to 19 Years | 4 (3.2%) | 11 (10.6%) |
| 20 to 24 Years | 18 (14.5%) | 3 (2.9%) |
| 25 to 29 Years | 6 (4.8%) | 9 (8.6%) |
| 30 to 34 Years | 14 (11.3%) | 4 (3.8%) |
| 35 to 39 Years | 13 (10.5%) | 11 (10.6%) |
| 40 to 44 Years | 5 (4.0%) | 3 (2.9%) |
| 45 to 49 Years | 2 (1.6%) | 0 (0.0%) |
| 50 to 54 Years | 8 (6.5%) | 13 (12.5%) |
| 55 to 59 Years | 5 (4.0%) | 6 (5.8%) |
| 60 to 64 Years | 6 (4.8%) | 4 (3.8%) |
| 65 to 69 Years | 4 (3.2%) | 3 (2.9%) |
| 70 to 74 Years | 1 (0.8%) | 2 (1.9%) |
| 75 to 79 Years | 3 (2.4%) | 3 (2.9%) |
| 80 to 84 Years | 2 (1.6%) | 3 (2.9%) |
| 85 Years and over | 2 (1.6%) | 1 (1.0%) |
| Total | 124 (100.0%) | 104 (100.0%) |
Families and Households in Dedham
Median Family Size in Dedham
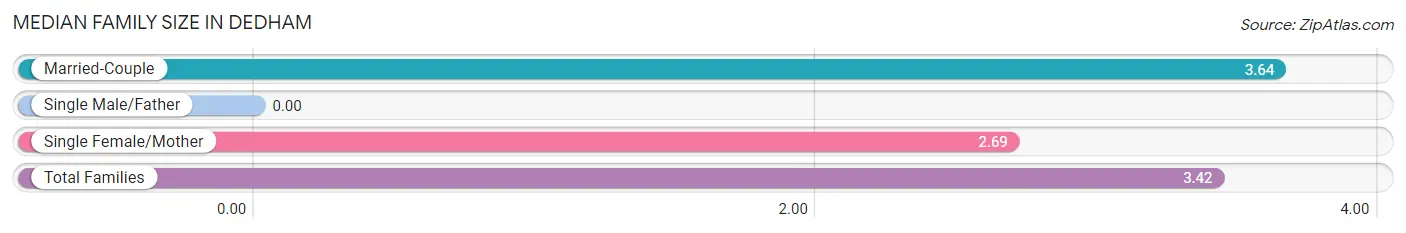
| Family Type | # Families | Family Size |
| Married-Couple | 44 (77.2%) | 3.64 |
| Single Male/Father | 0 (0.0%) | - |
| Single Female/Mother | 13 (22.8%) | 2.69 |
| Total Families | 57 (100.0%) | 3.42 |
Median Household Size in Dedham
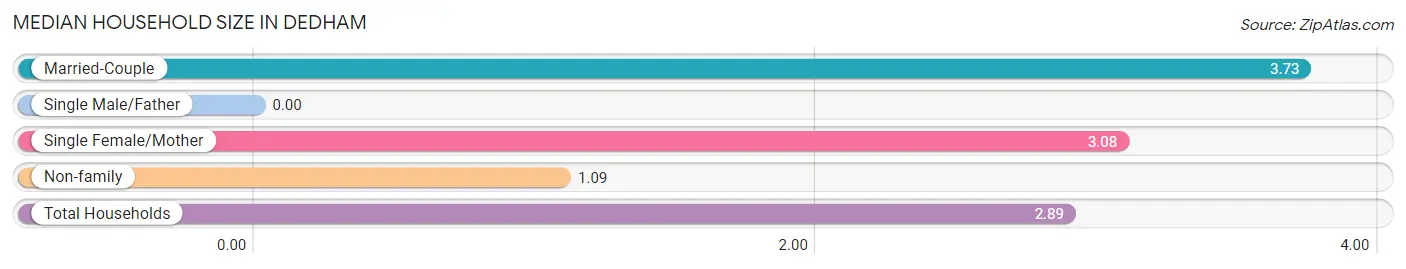
| Household Type | # Households | Household Size |
| Married-Couple | 44 (55.7%) | 3.73 |
| Single Male/Father | 0 (0.0%) | - |
| Single Female/Mother | 13 (16.5%) | 3.08 |
| Non-family | 22 (27.9%) | 1.09 |
| Total Households | 79 (100.0%) | 2.89 |
Household Size by Marriage Status in Dedham
Out of a total of 79 households in Dedham, 57 (72.2%) are family households, while 22 (27.9%) are nonfamily households. The most numerous type of family households are 2-person households, comprising 19, and the most common type of nonfamily households are 1-person households, comprising 20.
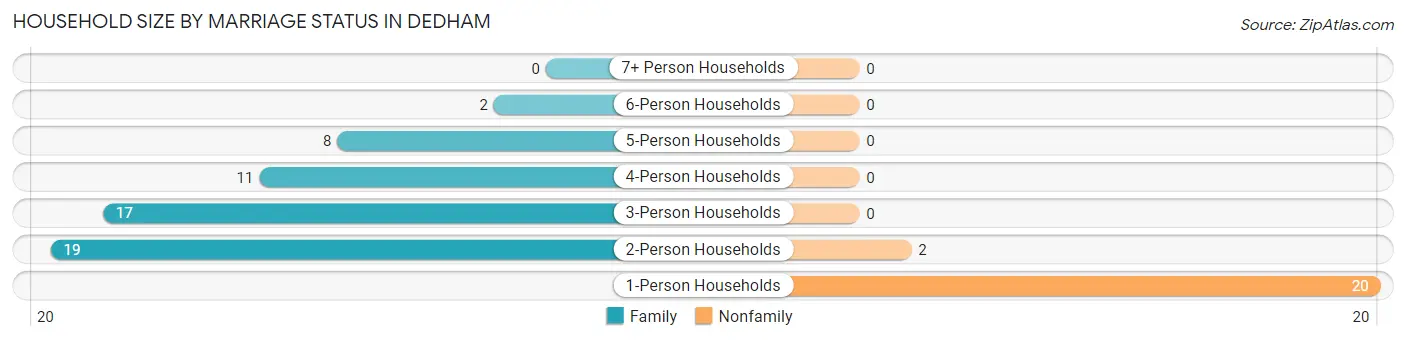
| Household Size | Family Households | Nonfamily Households |
| 1-Person Households | - | 20 (25.3%) |
| 2-Person Households | 19 (24.0%) | 2 (2.5%) |
| 3-Person Households | 17 (21.5%) | 0 (0.0%) |
| 4-Person Households | 11 (13.9%) | 0 (0.0%) |
| 5-Person Households | 8 (10.1%) | 0 (0.0%) |
| 6-Person Households | 2 (2.5%) | 0 (0.0%) |
| 7+ Person Households | 0 (0.0%) | 0 (0.0%) |
| Total | 57 (72.2%) | 22 (27.9%) |
Female Fertility in Dedham
Fertility by Age in Dedham
Average fertility rate in Dedham is 133.0 births per 1,000 women. Women in the age bracket of 20 to 34 years have the highest fertility rate with 375.0 births per 1,000 women. Women in the age bracket of 20 to 34 years acount for 100.0% of all women with births.
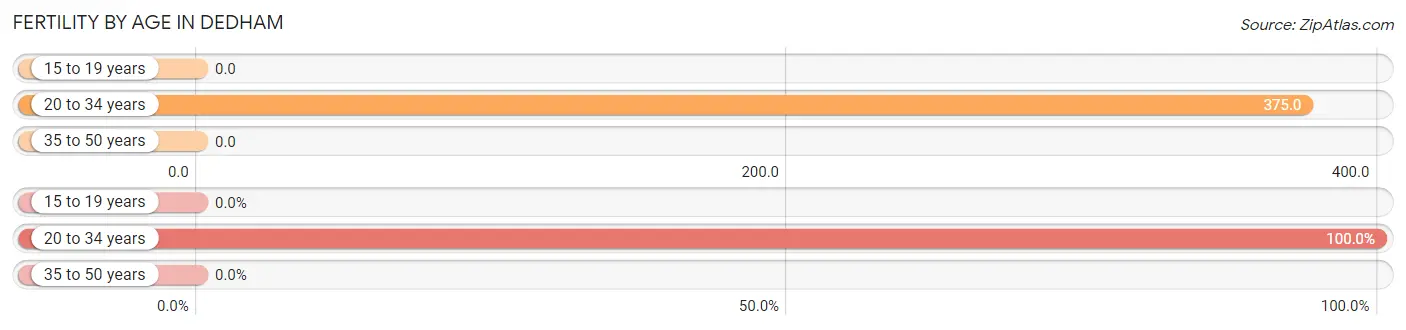
| Age Bracket | Women with Births | Births / 1,000 Women |
| 15 to 19 years | 0 (0.0%) | 0.0 |
| 20 to 34 years | 6 (100.0%) | 375.0 |
| 35 to 50 years | 0 (0.0%) | 0.0 |
| Total | 6 (100.0%) | 133.0 |
Fertility by Age by Marriage Status in Dedham
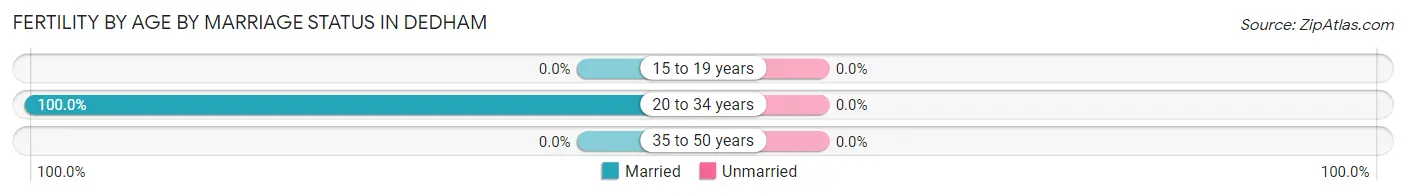
| Age Bracket | Married | Unmarried |
| 15 to 19 years | 0 (0.0%) | 0 (0.0%) |
| 20 to 34 years | 6 (100.0%) | 0 (0.0%) |
| 35 to 50 years | 0 (0.0%) | 0 (0.0%) |
| Total | 6 (100.0%) | 0 (0.0%) |
Fertility by Education in Dedham
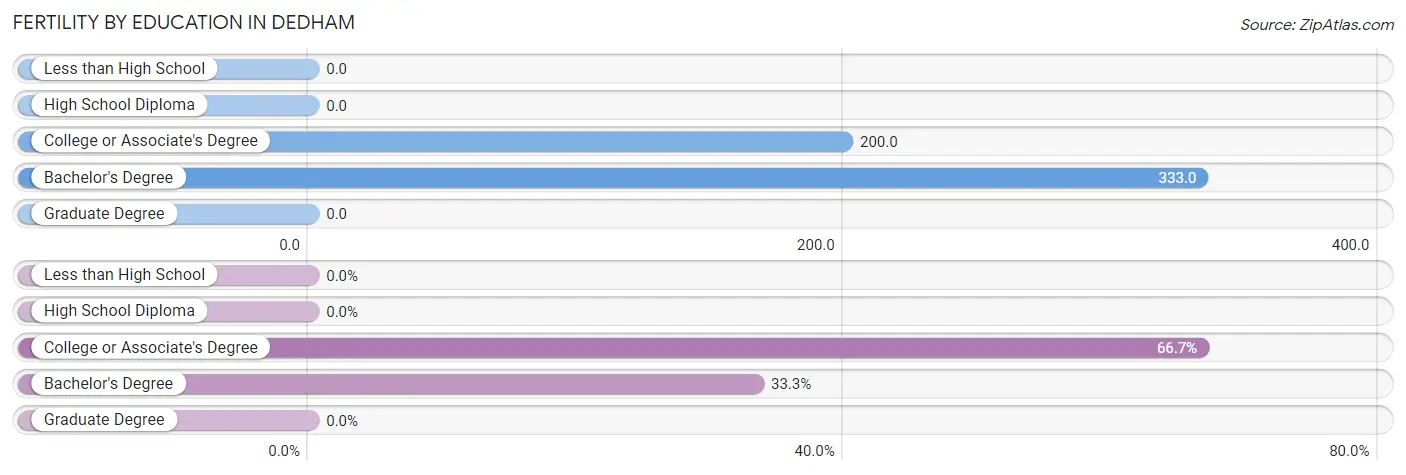
| Educational Attainment | Women with Births | Births / 1,000 Women |
| Less than High School | 0 (0.0%) | 0.0 |
| High School Diploma | 0 (0.0%) | 0.0 |
| College or Associate's Degree | 4 (66.7%) | 200.0 |
| Bachelor's Degree | 2 (33.3%) | 333.0 |
| Graduate Degree | 0 (0.0%) | 0.0 |
| Total | 6 (100.0%) | 133.0 |
Fertility by Education by Marriage Status in Dedham
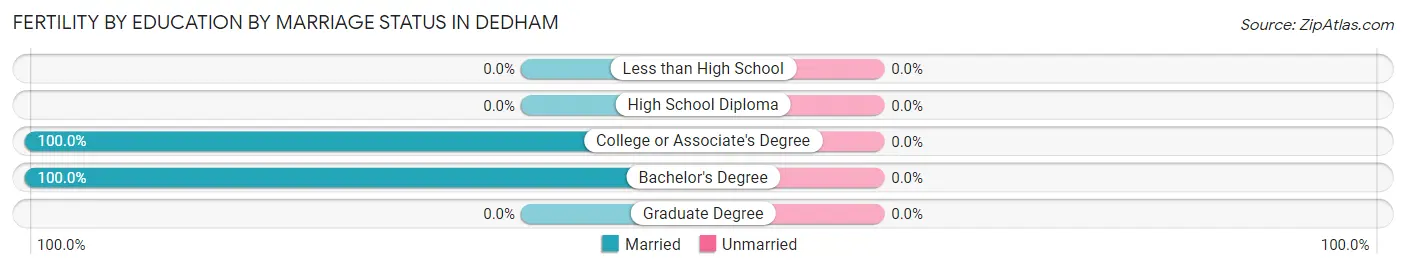
| Educational Attainment | Married | Unmarried |
| Less than High School | 0 (0.0%) | 0 (0.0%) |
| High School Diploma | 0 (0.0%) | 0 (0.0%) |
| College or Associate's Degree | 4 (100.0%) | 0 (0.0%) |
| Bachelor's Degree | 2 (100.0%) | 0 (0.0%) |
| Graduate Degree | 0 (0.0%) | 0 (0.0%) |
| Total | 6 (100.0%) | 0 (0.0%) |
Employment Characteristics in Dedham
Employment by Class of Employer in Dedham
Among the 133 employed individuals in Dedham, private company employees (78 | 58.7%), self-employed (not incorporated) (21 | 15.8%), and self-employed (incorporated) (12 | 9.0%) make up the most common classes of employment.
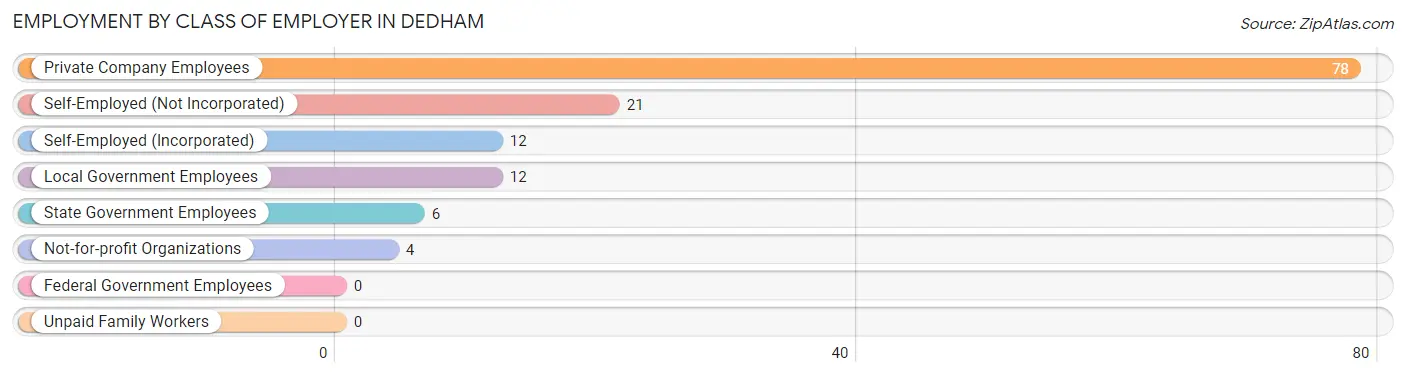
| Employer Class | # Employees | % Employees |
| Private Company Employees | 78 | 58.7% |
| Self-Employed (Incorporated) | 12 | 9.0% |
| Self-Employed (Not Incorporated) | 21 | 15.8% |
| Not-for-profit Organizations | 4 | 3.0% |
| Local Government Employees | 12 | 9.0% |
| State Government Employees | 6 | 4.5% |
| Federal Government Employees | 0 | 0.0% |
| Unpaid Family Workers | 0 | 0.0% |
| Total | 133 | 100.0% |
Employment Status by Age in Dedham
According to the labor force statistics for Dedham, out of the total population over 16 years of age (167), 80.8% or 135 individuals are in the labor force, with 1.5% or 2 of them unemployed. The age group with the highest labor force participation rate is 25 to 29 years, with 100.0% or 15 individuals in the labor force. Within the labor force, the 35 to 44 years age range has the highest percentage of unemployed individuals, with 6.3% or 2 of them being unemployed.
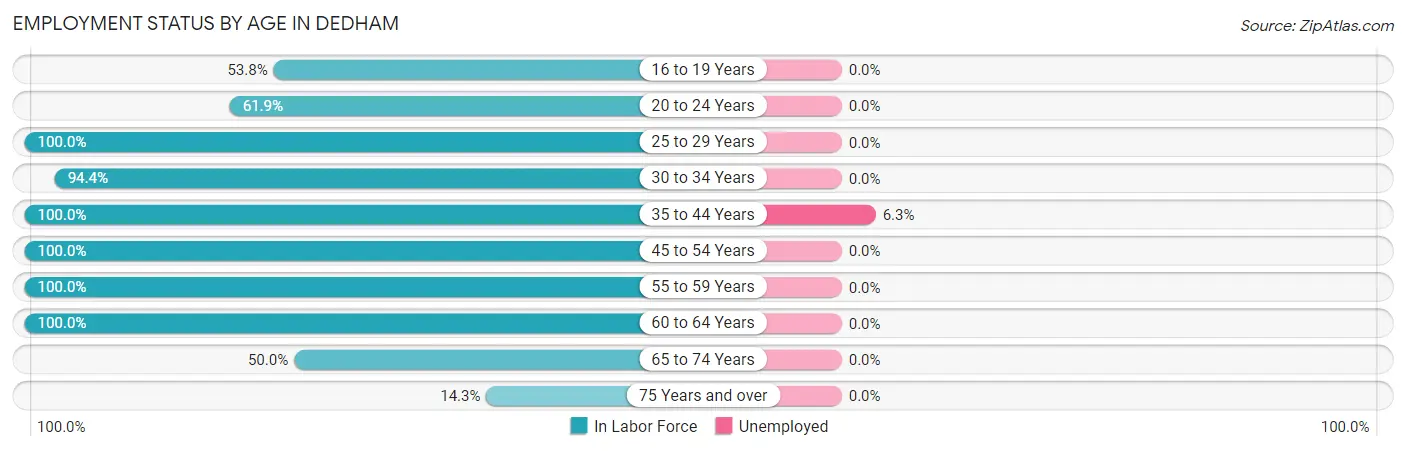
| Age Bracket | In Labor Force | Unemployed |
| 16 to 19 Years | 7 (53.8%) | 0 (0.0%) |
| 20 to 24 Years | 13 (61.9%) | 0 (0.0%) |
| 25 to 29 Years | 15 (100.0%) | 0 (0.0%) |
| 30 to 34 Years | 17 (94.4%) | 0 (0.0%) |
| 35 to 44 Years | 32 (100.0%) | 2 (6.3%) |
| 45 to 54 Years | 23 (100.0%) | 0 (0.0%) |
| 55 to 59 Years | 11 (100.0%) | 0 (0.0%) |
| 60 to 64 Years | 10 (100.0%) | 0 (0.0%) |
| 65 to 74 Years | 5 (50.0%) | 0 (0.0%) |
| 75 Years and over | 2 (14.3%) | 0 (0.0%) |
| Total | 135 (80.8%) | 2 (1.5%) |
Employment Status by Educational Attainment in Dedham
According to labor force statistics for Dedham, 99.1% of individuals (108) out of the total population between 25 and 64 years of age (109) are in the labor force, with 1.9% or 2 of them being unemployed. The group with the highest labor force participation rate are those with the educational attainment of less than high school, with 100.0% or 1 individuals in the labor force. Within the labor force, individuals with high school diploma education have the highest percentage of unemployment, with 5.3% or 2 of them being unemployed.
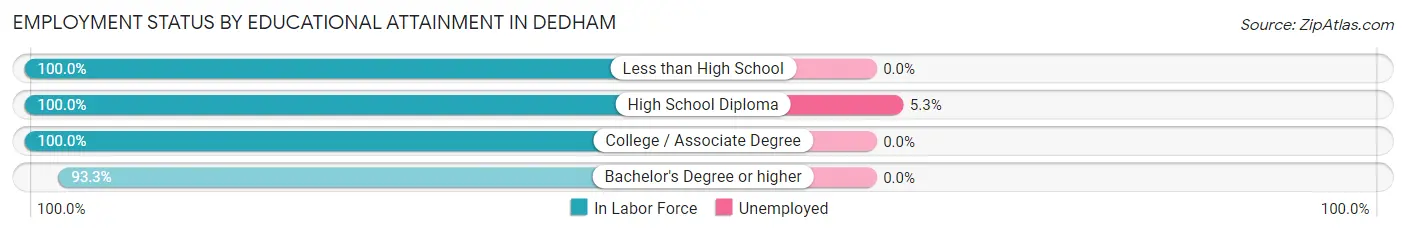
| Educational Attainment | In Labor Force | Unemployed |
| Less than High School | 1 (100.0%) | 0 (0.0%) |
| High School Diploma | 38 (100.0%) | 2 (5.3%) |
| College / Associate Degree | 55 (100.0%) | 0 (0.0%) |
| Bachelor's Degree or higher | 14 (93.3%) | 0 (0.0%) |
| Total | 108 (99.1%) | 2 (1.9%) |
Employment Occupations by Sex in Dedham
Management, Business, Science and Arts Occupations
The most common Management, Business, Science and Arts occupations in Dedham are Management (15 | 11.3%), Computers, Engineering & Science (8 | 6.0%), Community & Social Service (8 | 6.0%), Education Instruction & Library (7 | 5.3%), and Life, Physical & Social Science (6 | 4.5%).
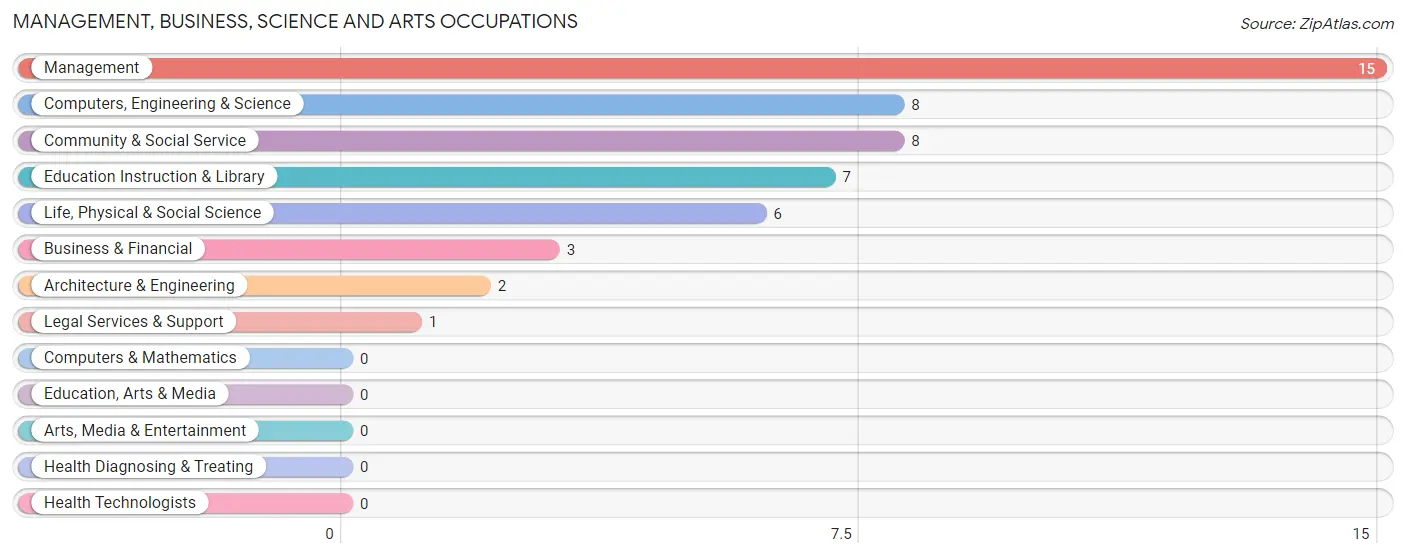
Management, Business, Science and Arts Occupations by Sex
Within the Management, Business, Science and Arts occupations in Dedham, the most male-oriented occupations are Business & Financial (100.0%), Computers, Engineering & Science (100.0%), and Architecture & Engineering (100.0%), while the most female-oriented occupations are Community & Social Service (100.0%), Legal Services & Support (100.0%), and Education Instruction & Library (100.0%).
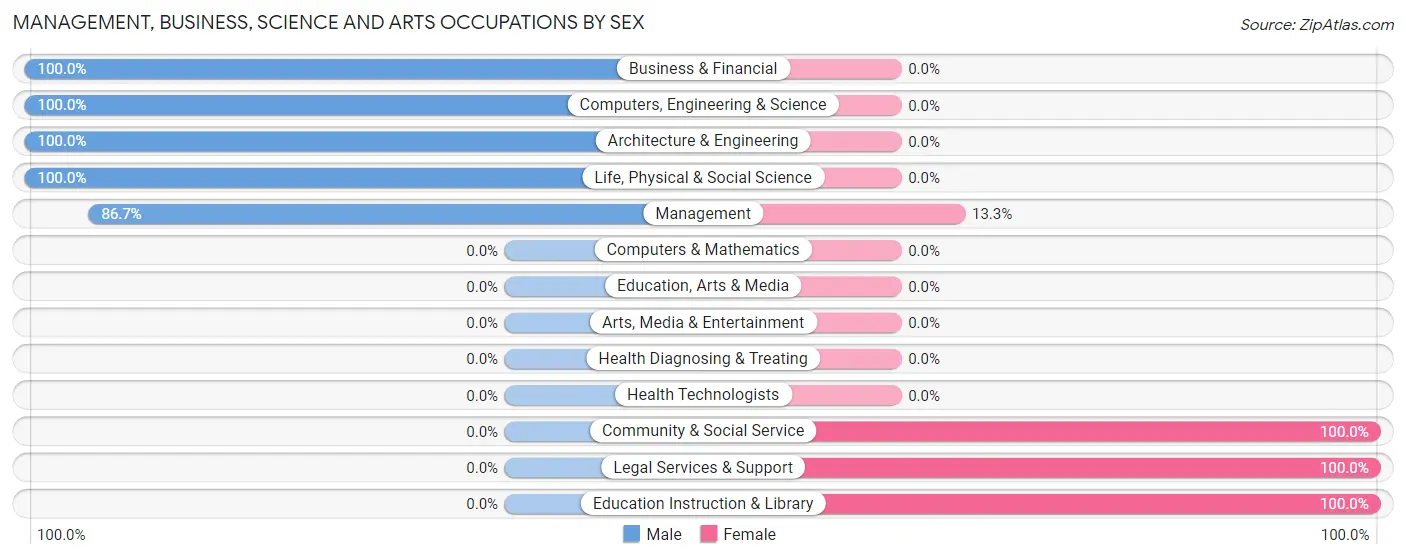
| Occupation | Male | Female |
| Management | 13 (86.7%) | 2 (13.3%) |
| Business & Financial | 3 (100.0%) | 0 (0.0%) |
| Computers, Engineering & Science | 8 (100.0%) | 0 (0.0%) |
| Computers & Mathematics | 0 (0.0%) | 0 (0.0%) |
| Architecture & Engineering | 2 (100.0%) | 0 (0.0%) |
| Life, Physical & Social Science | 6 (100.0%) | 0 (0.0%) |
| Community & Social Service | 0 (0.0%) | 8 (100.0%) |
| Education, Arts & Media | 0 (0.0%) | 0 (0.0%) |
| Legal Services & Support | 0 (0.0%) | 1 (100.0%) |
| Education Instruction & Library | 0 (0.0%) | 7 (100.0%) |
| Arts, Media & Entertainment | 0 (0.0%) | 0 (0.0%) |
| Health Diagnosing & Treating | 0 (0.0%) | 0 (0.0%) |
| Health Technologists | 0 (0.0%) | 0 (0.0%) |
| Total (Category) | 24 (70.6%) | 10 (29.4%) |
| Total (Overall) | 73 (54.9%) | 60 (45.1%) |
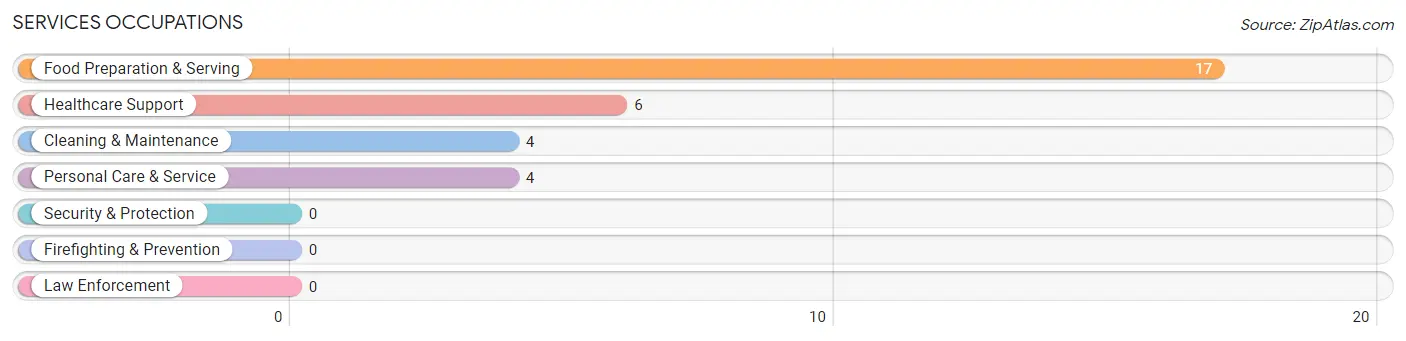
Services Occupations
The most common Services occupations in Dedham are Food Preparation & Serving (17 | 12.8%), Healthcare Support (6 | 4.5%), Cleaning & Maintenance (4 | 3.0%), and Personal Care & Service (4 | 3.0%).
Services Occupations by Sex
Within the Services occupations in Dedham, the most male-oriented occupations are Cleaning & Maintenance (100.0%), Healthcare Support (33.3%), and Food Preparation & Serving (17.6%), while the most female-oriented occupations are Personal Care & Service (100.0%), Food Preparation & Serving (82.4%), and Healthcare Support (66.7%).
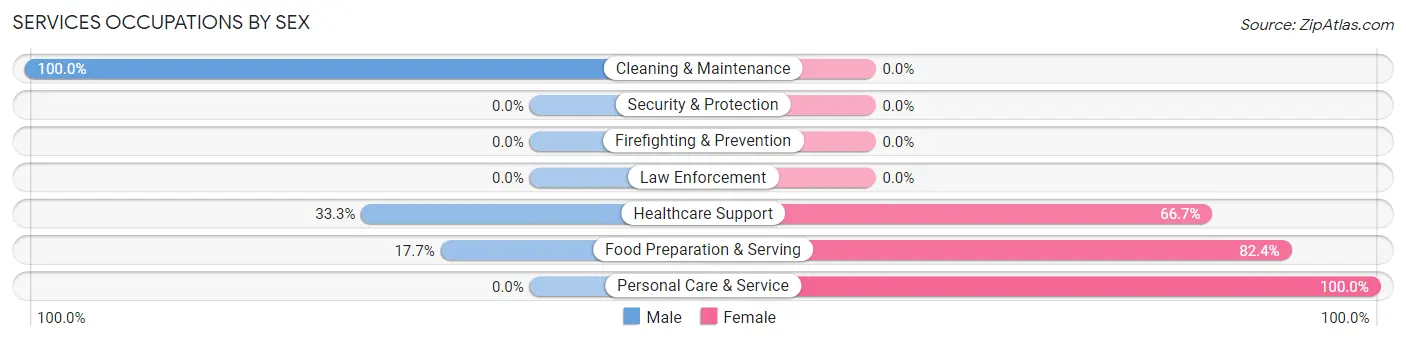
| Occupation | Male | Female |
| Healthcare Support | 2 (33.3%) | 4 (66.7%) |
| Security & Protection | 0 (0.0%) | 0 (0.0%) |
| Firefighting & Prevention | 0 (0.0%) | 0 (0.0%) |
| Law Enforcement | 0 (0.0%) | 0 (0.0%) |
| Food Preparation & Serving | 3 (17.6%) | 14 (82.4%) |
| Cleaning & Maintenance | 4 (100.0%) | 0 (0.0%) |
| Personal Care & Service | 0 (0.0%) | 4 (100.0%) |
| Total (Category) | 9 (29.0%) | 22 (71.0%) |
| Total (Overall) | 73 (54.9%) | 60 (45.1%) |
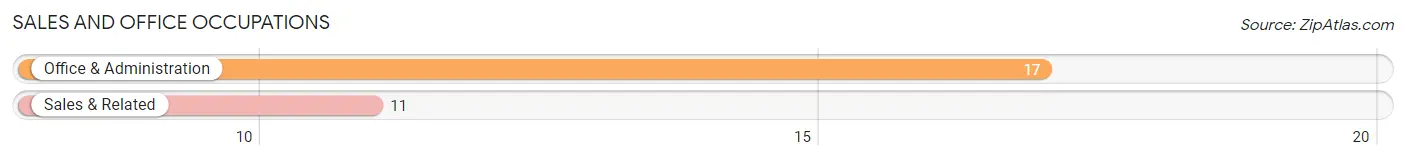
Sales and Office Occupations
The most common Sales and Office occupations in Dedham are Office & Administration (17 | 12.8%), and Sales & Related (11 | 8.3%).
Sales and Office Occupations by Sex
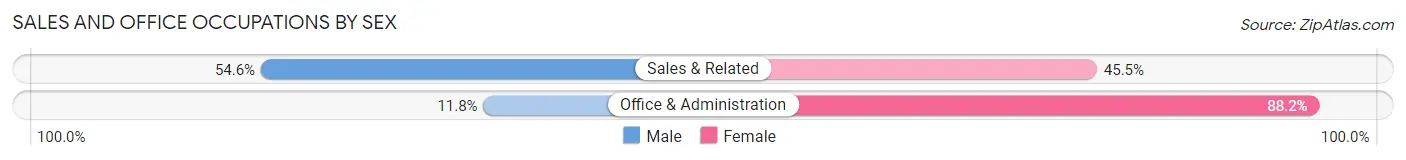
| Occupation | Male | Female |
| Sales & Related | 6 (54.5%) | 5 (45.5%) |
| Office & Administration | 2 (11.8%) | 15 (88.2%) |
| Total (Category) | 8 (28.6%) | 20 (71.4%) |
| Total (Overall) | 73 (54.9%) | 60 (45.1%) |
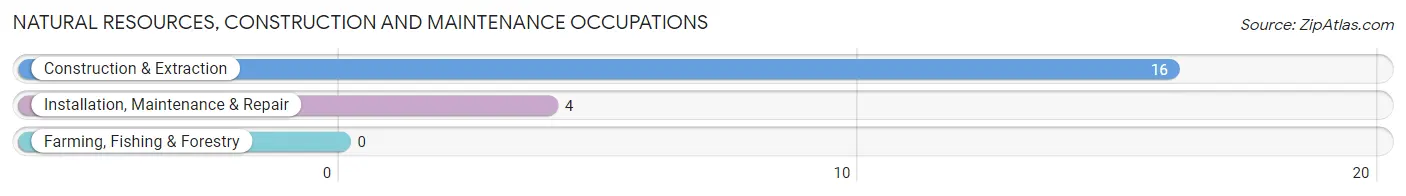
Natural Resources, Construction and Maintenance Occupations
The most common Natural Resources, Construction and Maintenance occupations in Dedham are Construction & Extraction (16 | 12.0%), and Installation, Maintenance & Repair (4 | 3.0%).
Natural Resources, Construction and Maintenance Occupations by Sex
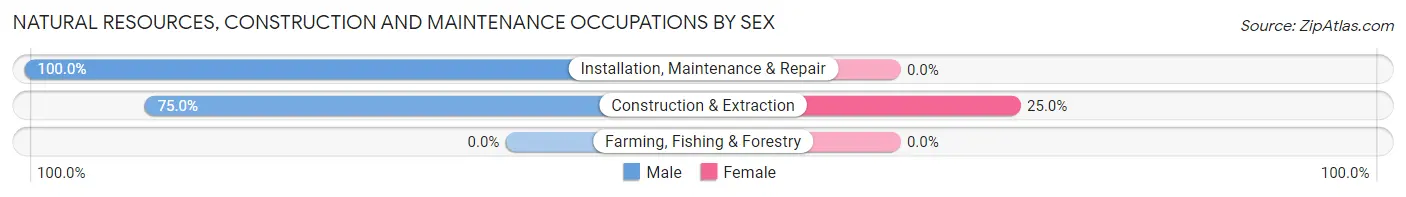
| Occupation | Male | Female |
| Farming, Fishing & Forestry | 0 (0.0%) | 0 (0.0%) |
| Construction & Extraction | 12 (75.0%) | 4 (25.0%) |
| Installation, Maintenance & Repair | 4 (100.0%) | 0 (0.0%) |
| Total (Category) | 16 (80.0%) | 4 (20.0%) |
| Total (Overall) | 73 (54.9%) | 60 (45.1%) |
Production, Transportation and Moving Occupations
The most common Production, Transportation and Moving occupations in Dedham are Production (13 | 9.8%), Material Moving (6 | 4.5%), and Transportation (1 | 0.7%).
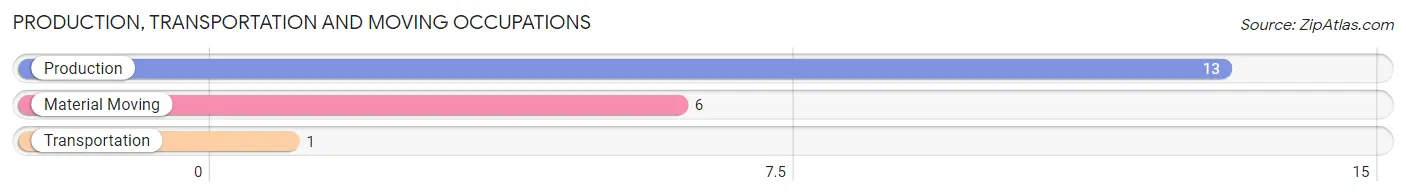
Production, Transportation and Moving Occupations by Sex
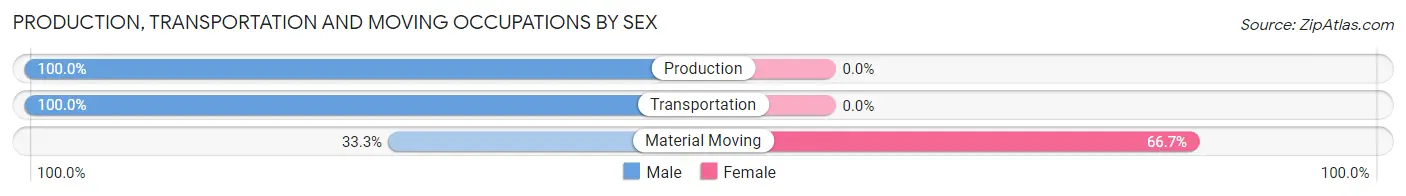
| Occupation | Male | Female |
| Production | 13 (100.0%) | 0 (0.0%) |
| Transportation | 1 (100.0%) | 0 (0.0%) |
| Material Moving | 2 (33.3%) | 4 (66.7%) |
| Total (Category) | 16 (80.0%) | 4 (20.0%) |
| Total (Overall) | 73 (54.9%) | 60 (45.1%) |
Employment Industries by Sex in Dedham
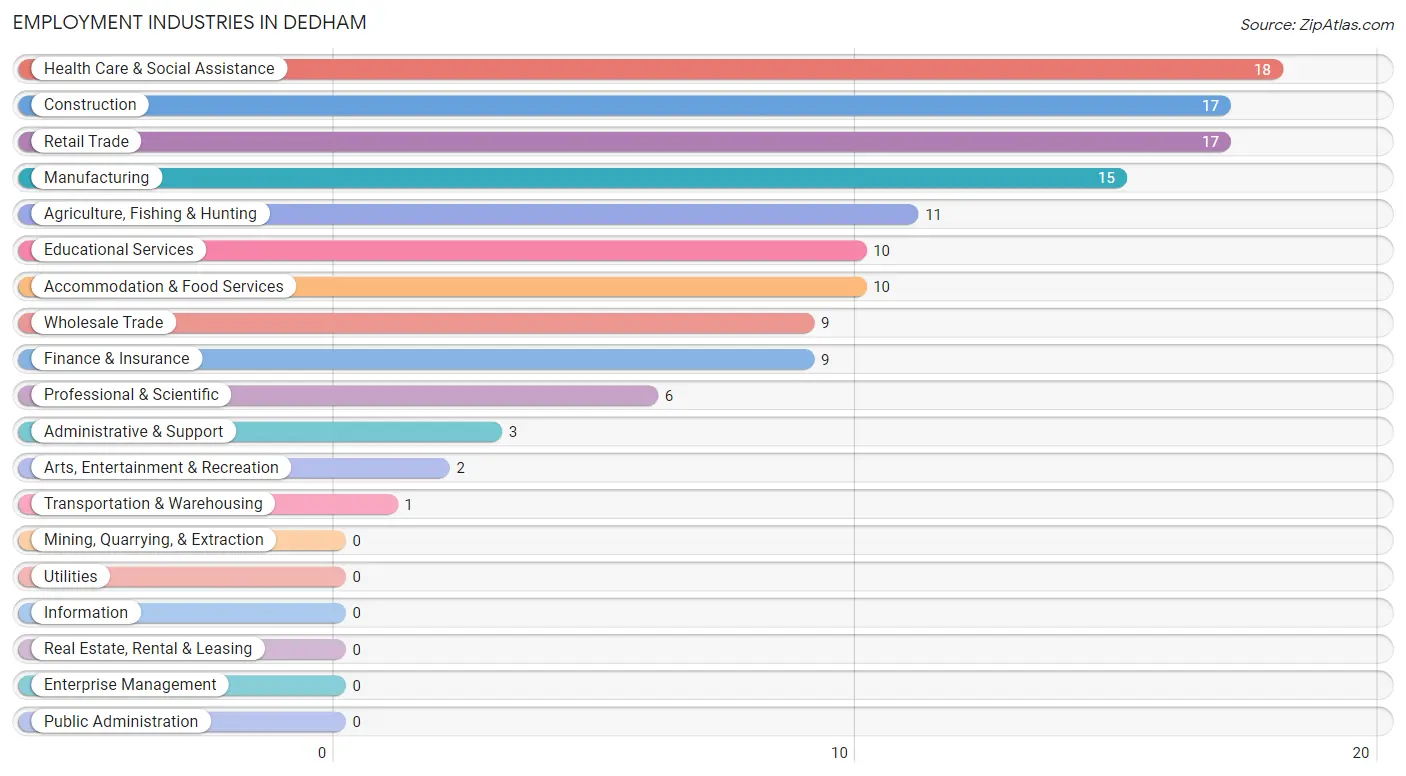
Employment Industries in Dedham
The major employment industries in Dedham include Health Care & Social Assistance (18 | 13.5%), Construction (17 | 12.8%), Retail Trade (17 | 12.8%), Manufacturing (15 | 11.3%), and Agriculture, Fishing & Hunting (11 | 8.3%).
Employment Industries by Sex in Dedham
The Dedham industries that see more men than women are Manufacturing (100.0%), Transportation & Warehousing (100.0%), and Professional & Scientific (100.0%), whereas the industries that tend to have a higher number of women are Accommodation & Food Services (100.0%), Finance & Insurance (88.9%), and Health Care & Social Assistance (72.2%).
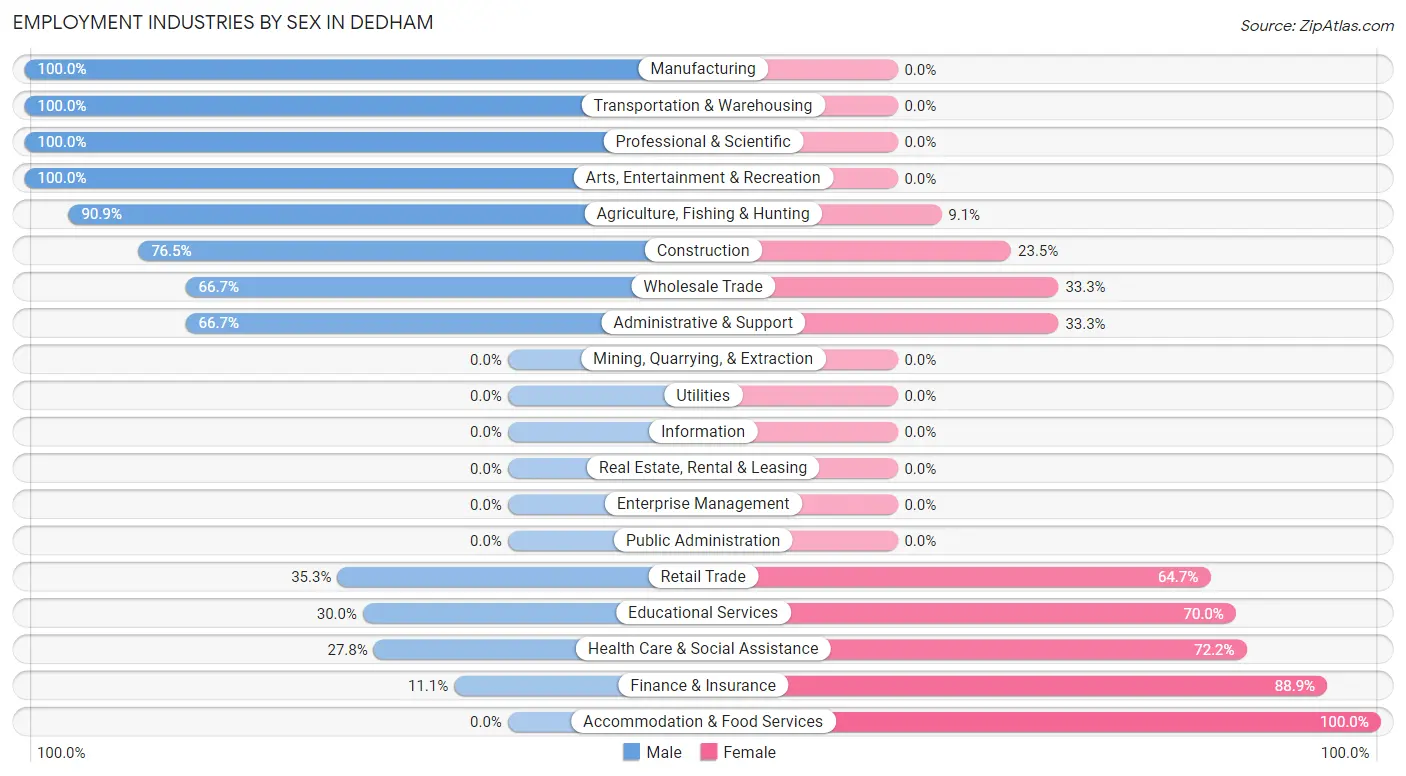
| Industry | Male | Female |
| Agriculture, Fishing & Hunting | 10 (90.9%) | 1 (9.1%) |
| Mining, Quarrying, & Extraction | 0 (0.0%) | 0 (0.0%) |
| Construction | 13 (76.5%) | 4 (23.5%) |
| Manufacturing | 15 (100.0%) | 0 (0.0%) |
| Wholesale Trade | 6 (66.7%) | 3 (33.3%) |
| Retail Trade | 6 (35.3%) | 11 (64.7%) |
| Transportation & Warehousing | 1 (100.0%) | 0 (0.0%) |
| Utilities | 0 (0.0%) | 0 (0.0%) |
| Information | 0 (0.0%) | 0 (0.0%) |
| Finance & Insurance | 1 (11.1%) | 8 (88.9%) |
| Real Estate, Rental & Leasing | 0 (0.0%) | 0 (0.0%) |
| Professional & Scientific | 6 (100.0%) | 0 (0.0%) |
| Enterprise Management | 0 (0.0%) | 0 (0.0%) |
| Administrative & Support | 2 (66.7%) | 1 (33.3%) |
| Educational Services | 3 (30.0%) | 7 (70.0%) |
| Health Care & Social Assistance | 5 (27.8%) | 13 (72.2%) |
| Arts, Entertainment & Recreation | 2 (100.0%) | 0 (0.0%) |
| Accommodation & Food Services | 0 (0.0%) | 10 (100.0%) |
| Public Administration | 0 (0.0%) | 0 (0.0%) |
| Total | 73 (54.9%) | 60 (45.1%) |
Education in Dedham
School Enrollment in Dedham
The most common levels of schooling among the 72 students in Dedham are middle school (23 | 31.9%), high school (15 | 20.8%), and elementary school (14 | 19.4%).
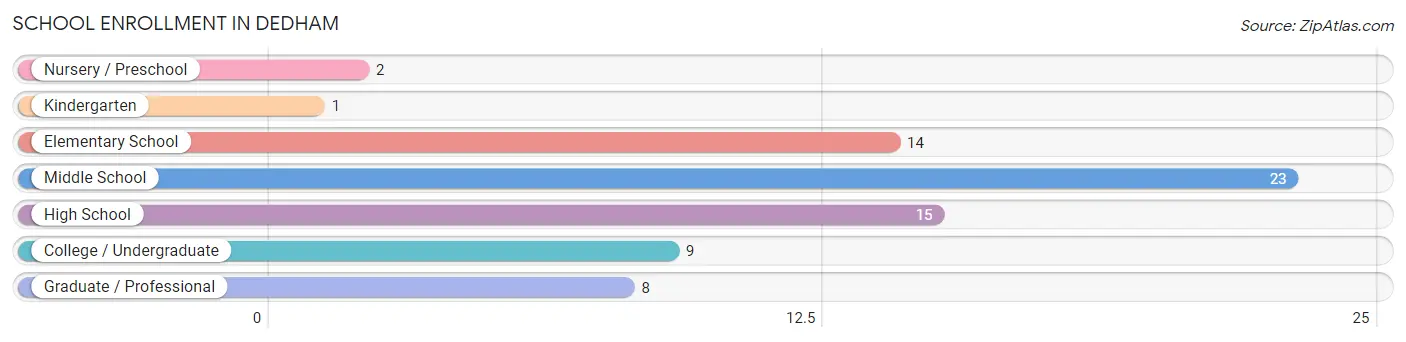
| School Level | # Students | % Students |
| Nursery / Preschool | 2 | 2.8% |
| Kindergarten | 1 | 1.4% |
| Elementary School | 14 | 19.4% |
| Middle School | 23 | 31.9% |
| High School | 15 | 20.8% |
| College / Undergraduate | 9 | 12.5% |
| Graduate / Professional | 8 | 11.1% |
| Total | 72 | 100.0% |
School Enrollment by Age by Funding Source in Dedham
Out of a total of 72 students who are enrolled in schools in Dedham, 23 (31.9%) attend a private institution, while the remaining 49 (68.1%) are enrolled in public schools. The age group of 20 to 24 year olds has the highest likelihood of being enrolled in private schools, with 7 (46.7% in the age bracket) enrolled. Conversely, the age group of 18 to 19 year olds has the lowest likelihood of being enrolled in a private school, with 4 (100.0% in the age bracket) attending a public institution.
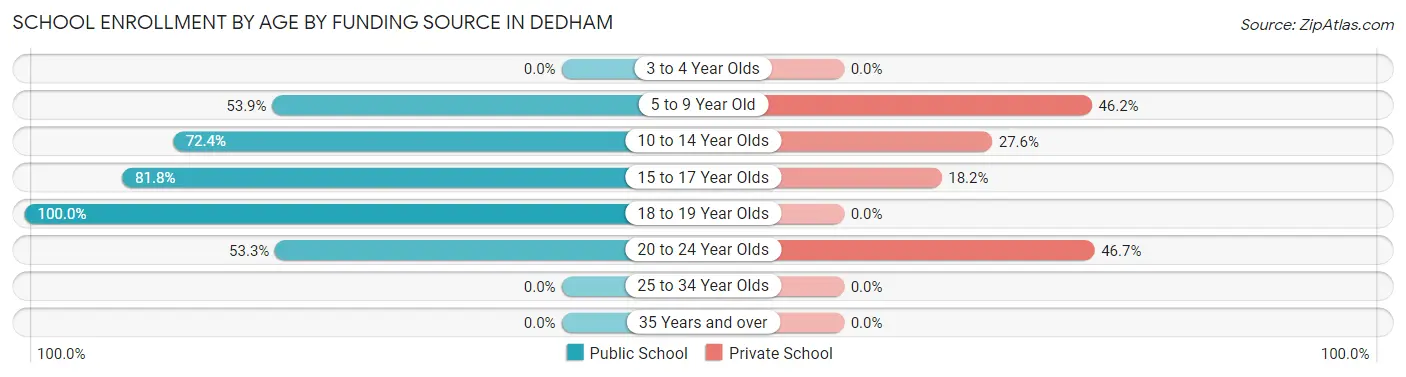
| Age Bracket | Public School | Private School |
| 3 to 4 Year Olds | 0 (0.0%) | 0 (0.0%) |
| 5 to 9 Year Old | 7 (53.8%) | 6 (46.2%) |
| 10 to 14 Year Olds | 21 (72.4%) | 8 (27.6%) |
| 15 to 17 Year Olds | 9 (81.8%) | 2 (18.2%) |
| 18 to 19 Year Olds | 4 (100.0%) | 0 (0.0%) |
| 20 to 24 Year Olds | 8 (53.3%) | 7 (46.7%) |
| 25 to 34 Year Olds | 0 (0.0%) | 0 (0.0%) |
| 35 Years and over | 0 (0.0%) | 0 (0.0%) |
| Total | 49 (68.1%) | 23 (31.9%) |
Educational Attainment by Field of Study in Dedham
Business (8 | 50.0%), education (7 | 43.8%), and science & technology (1 | 6.2%) are the most common fields of study among 16 individuals in Dedham who have obtained a bachelor's degree or higher.
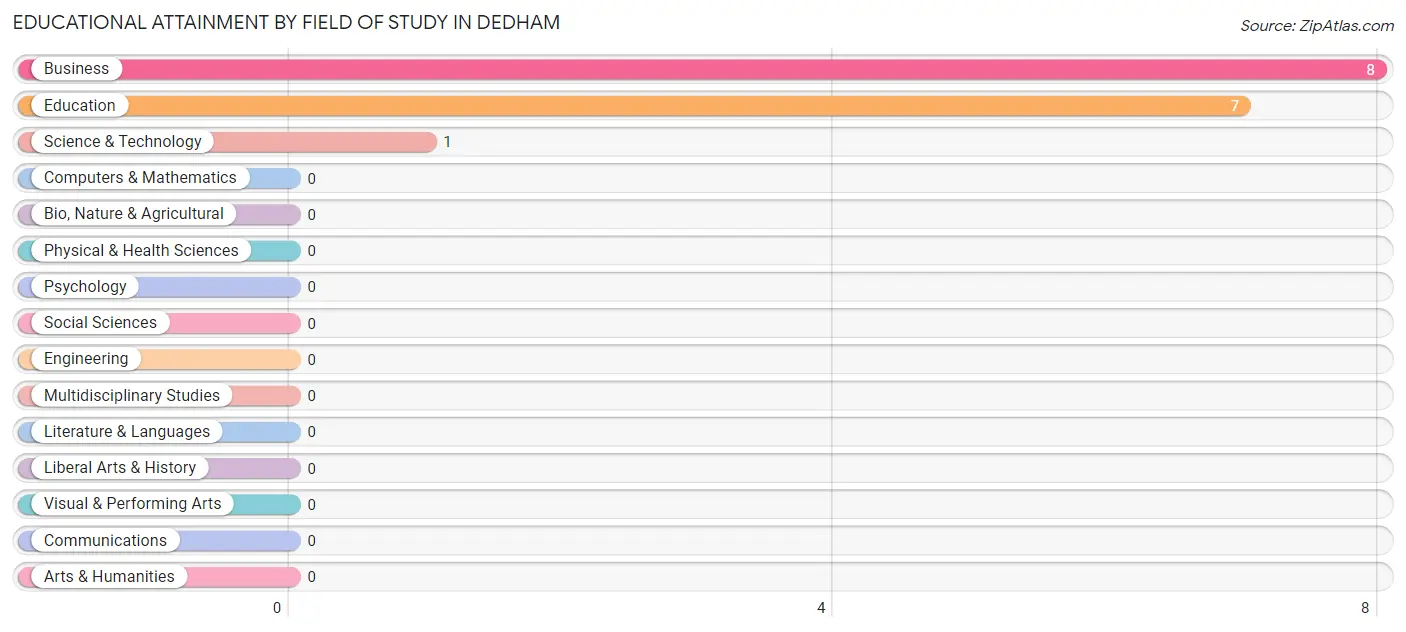
| Field of Study | # Graduates | % Graduates |
| Computers & Mathematics | 0 | 0.0% |
| Bio, Nature & Agricultural | 0 | 0.0% |
| Physical & Health Sciences | 0 | 0.0% |
| Psychology | 0 | 0.0% |
| Social Sciences | 0 | 0.0% |
| Engineering | 0 | 0.0% |
| Multidisciplinary Studies | 0 | 0.0% |
| Science & Technology | 1 | 6.2% |
| Business | 8 | 50.0% |
| Education | 7 | 43.8% |
| Literature & Languages | 0 | 0.0% |
| Liberal Arts & History | 0 | 0.0% |
| Visual & Performing Arts | 0 | 0.0% |
| Communications | 0 | 0.0% |
| Arts & Humanities | 0 | 0.0% |
| Total | 16 | 100.0% |
Transportation & Commute in Dedham
Vehicle Availability by Sex in Dedham
The most prevalent vehicle ownership categories in Dedham are males with 2 vehicles (32, accounting for 43.8%) and females with 2 vehicles (23, making up 53.3%).
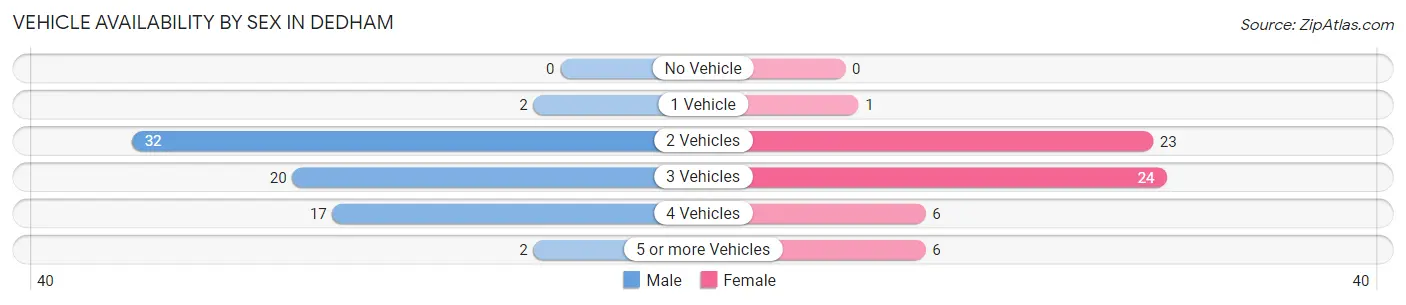
| Vehicles Available | Male | Female |
| No Vehicle | 0 (0.0%) | 0 (0.0%) |
| 1 Vehicle | 2 (2.7%) | 1 (1.7%) |
| 2 Vehicles | 32 (43.8%) | 23 (38.3%) |
| 3 Vehicles | 20 (27.4%) | 24 (40.0%) |
| 4 Vehicles | 17 (23.3%) | 6 (10.0%) |
| 5 or more Vehicles | 2 (2.7%) | 6 (10.0%) |
| Total | 73 (100.0%) | 60 (100.0%) |
Commute Time in Dedham
The most frequently occuring commute durations in Dedham are 15 to 19 minutes (31 commuters, 24.6%), 20 to 24 minutes (27 commuters, 21.4%), and 10 to 14 minutes (20 commuters, 15.9%).
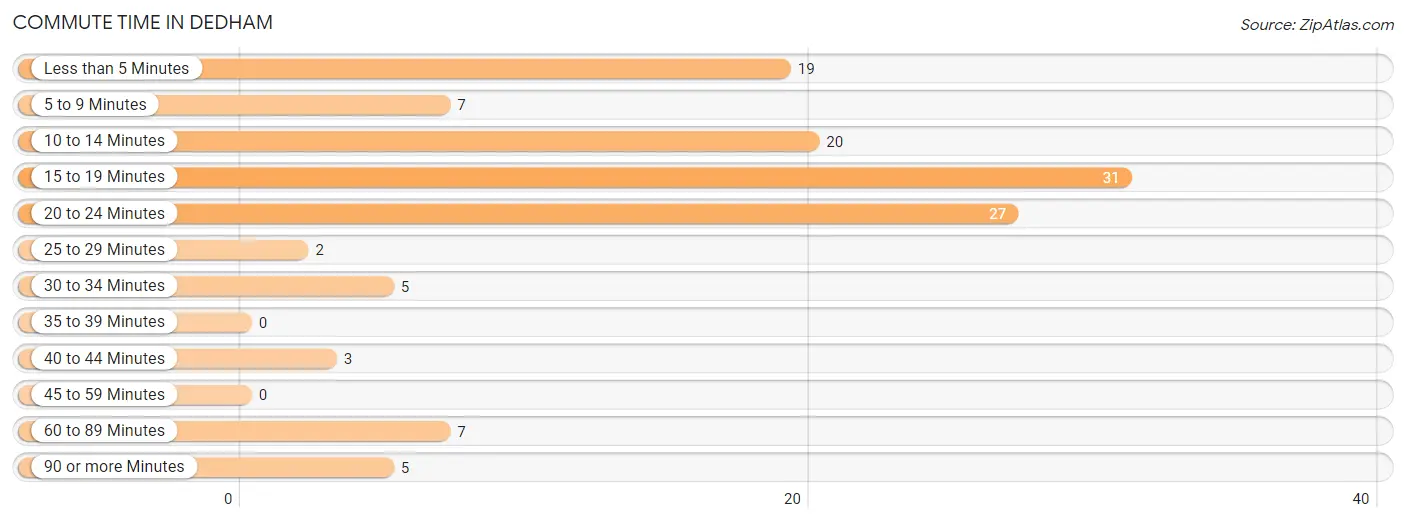
| Commute Time | # Commuters | % Commuters |
| Less than 5 Minutes | 19 | 15.1% |
| 5 to 9 Minutes | 7 | 5.6% |
| 10 to 14 Minutes | 20 | 15.9% |
| 15 to 19 Minutes | 31 | 24.6% |
| 20 to 24 Minutes | 27 | 21.4% |
| 25 to 29 Minutes | 2 | 1.6% |
| 30 to 34 Minutes | 5 | 4.0% |
| 35 to 39 Minutes | 0 | 0.0% |
| 40 to 44 Minutes | 3 | 2.4% |
| 45 to 59 Minutes | 0 | 0.0% |
| 60 to 89 Minutes | 7 | 5.6% |
| 90 or more Minutes | 5 | 4.0% |
Commute Time by Sex in Dedham
The most common commute times in Dedham are 15 to 19 minutes (20 commuters, 28.2%) for males and 20 to 24 minutes (12 commuters, 21.8%) for females.
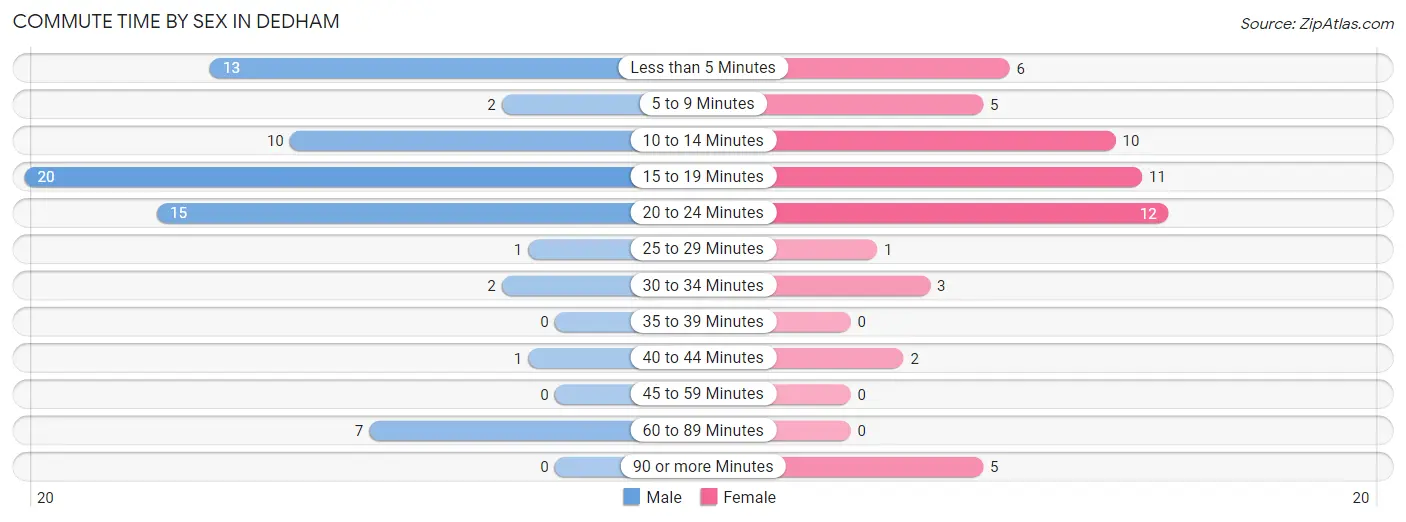
| Commute Time | Male | Female |
| Less than 5 Minutes | 13 (18.3%) | 6 (10.9%) |
| 5 to 9 Minutes | 2 (2.8%) | 5 (9.1%) |
| 10 to 14 Minutes | 10 (14.1%) | 10 (18.2%) |
| 15 to 19 Minutes | 20 (28.2%) | 11 (20.0%) |
| 20 to 24 Minutes | 15 (21.1%) | 12 (21.8%) |
| 25 to 29 Minutes | 1 (1.4%) | 1 (1.8%) |
| 30 to 34 Minutes | 2 (2.8%) | 3 (5.4%) |
| 35 to 39 Minutes | 0 (0.0%) | 0 (0.0%) |
| 40 to 44 Minutes | 1 (1.4%) | 2 (3.6%) |
| 45 to 59 Minutes | 0 (0.0%) | 0 (0.0%) |
| 60 to 89 Minutes | 7 (9.9%) | 0 (0.0%) |
| 90 or more Minutes | 0 (0.0%) | 5 (9.1%) |
Time of Departure to Work by Sex in Dedham
The most frequent times of departure to work in Dedham are 7:00 AM to 7:29 AM (22, 31.0%) for males and 7:00 AM to 7:29 AM (18, 32.7%) for females.
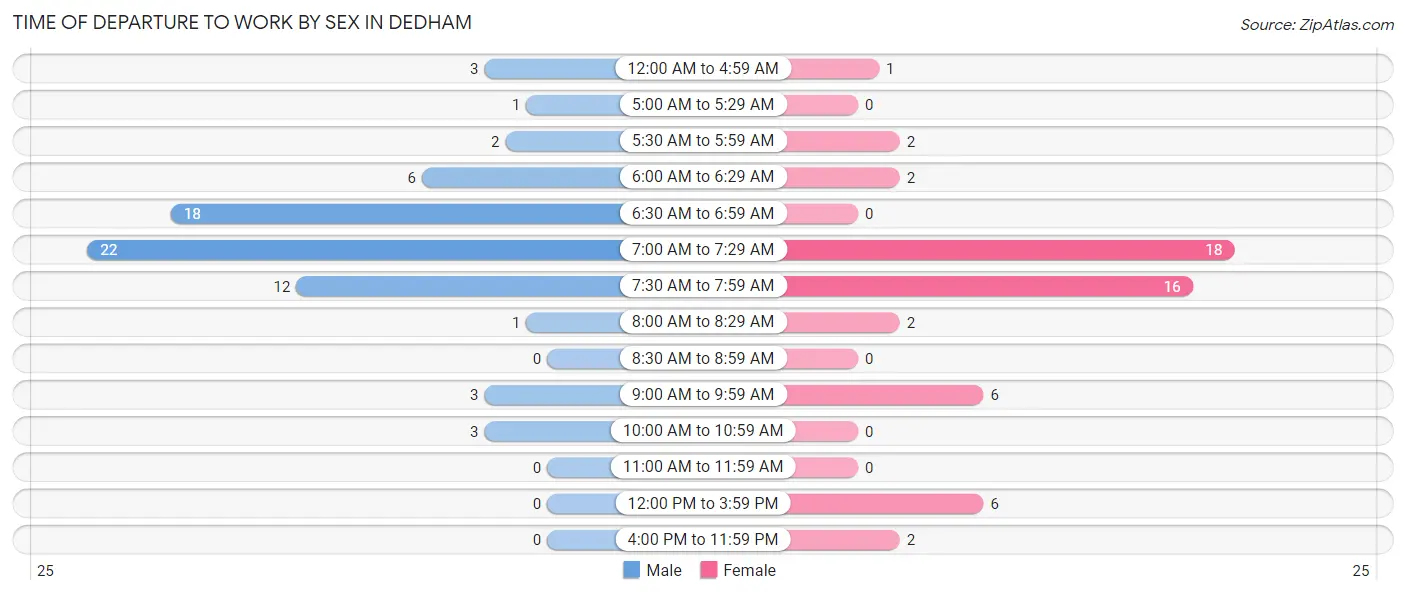
| Time of Departure | Male | Female |
| 12:00 AM to 4:59 AM | 3 (4.2%) | 1 (1.8%) |
| 5:00 AM to 5:29 AM | 1 (1.4%) | 0 (0.0%) |
| 5:30 AM to 5:59 AM | 2 (2.8%) | 2 (3.6%) |
| 6:00 AM to 6:29 AM | 6 (8.5%) | 2 (3.6%) |
| 6:30 AM to 6:59 AM | 18 (25.4%) | 0 (0.0%) |
| 7:00 AM to 7:29 AM | 22 (31.0%) | 18 (32.7%) |
| 7:30 AM to 7:59 AM | 12 (16.9%) | 16 (29.1%) |
| 8:00 AM to 8:29 AM | 1 (1.4%) | 2 (3.6%) |
| 8:30 AM to 8:59 AM | 0 (0.0%) | 0 (0.0%) |
| 9:00 AM to 9:59 AM | 3 (4.2%) | 6 (10.9%) |
| 10:00 AM to 10:59 AM | 3 (4.2%) | 0 (0.0%) |
| 11:00 AM to 11:59 AM | 0 (0.0%) | 0 (0.0%) |
| 12:00 PM to 3:59 PM | 0 (0.0%) | 6 (10.9%) |
| 4:00 PM to 11:59 PM | 0 (0.0%) | 2 (3.6%) |
| Total | 71 (100.0%) | 55 (100.0%) |
Housing Occupancy in Dedham
Occupancy by Ownership in Dedham
Of the total 79 dwellings in Dedham, owner-occupied units account for 78 (98.7%), while renter-occupied units make up 1 (1.3%).
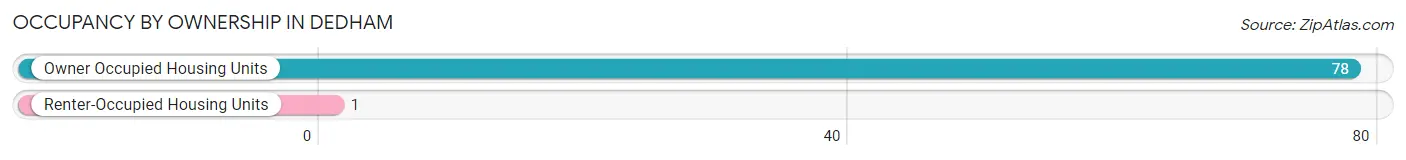
| Occupancy | # Housing Units | % Housing Units |
| Owner Occupied Housing Units | 78 | 98.7% |
| Renter-Occupied Housing Units | 1 | 1.3% |
| Total Occupied Housing Units | 79 | 100.0% |
Occupancy by Household Size in Dedham
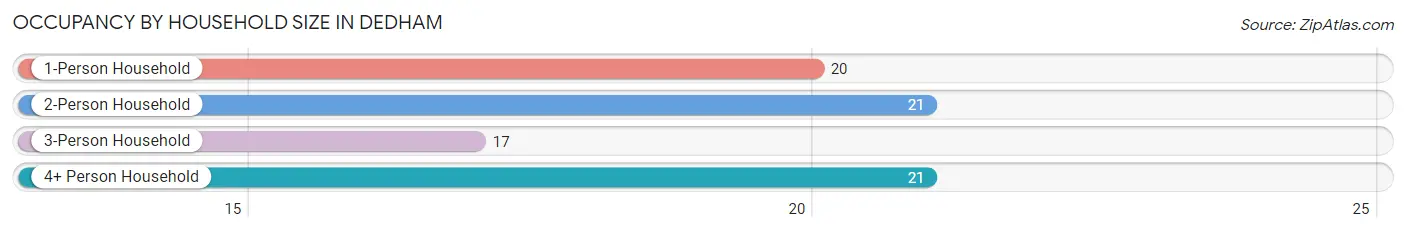
| Household Size | # Housing Units | % Housing Units |
| 1-Person Household | 20 | 25.3% |
| 2-Person Household | 21 | 26.6% |
| 3-Person Household | 17 | 21.5% |
| 4+ Person Household | 21 | 26.6% |
| Total Housing Units | 79 | 100.0% |
Occupancy by Ownership by Household Size in Dedham
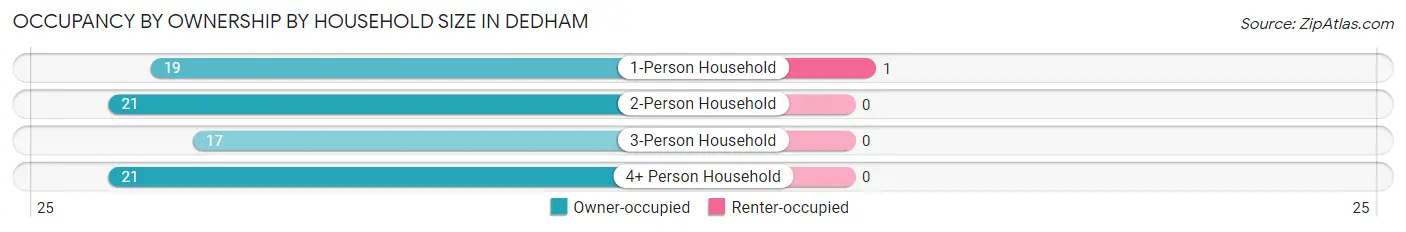
| Household Size | Owner-occupied | Renter-occupied |
| 1-Person Household | 19 (95.0%) | 1 (5.0%) |
| 2-Person Household | 21 (100.0%) | 0 (0.0%) |
| 3-Person Household | 17 (100.0%) | 0 (0.0%) |
| 4+ Person Household | 21 (100.0%) | 0 (0.0%) |
| Total Housing Units | 78 (98.7%) | 1 (1.3%) |
Occupancy by Educational Attainment in Dedham
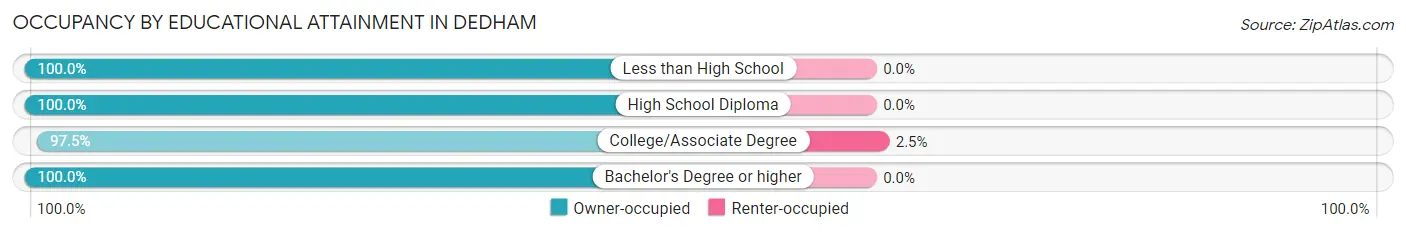
| Household Size | Owner-occupied | Renter-occupied |
| Less than High School | 2 (100.0%) | 0 (0.0%) |
| High School Diploma | 26 (100.0%) | 0 (0.0%) |
| College/Associate Degree | 39 (97.5%) | 1 (2.5%) |
| Bachelor's Degree or higher | 11 (100.0%) | 0 (0.0%) |
Occupancy by Age of Householder in Dedham
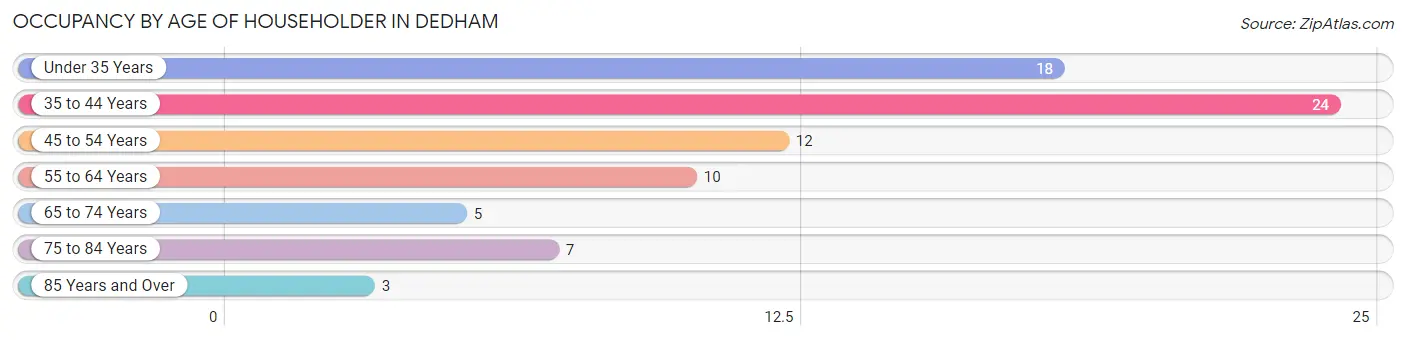
| Age Bracket | # Households | % Households |
| Under 35 Years | 18 | 22.8% |
| 35 to 44 Years | 24 | 30.4% |
| 45 to 54 Years | 12 | 15.2% |
| 55 to 64 Years | 10 | 12.7% |
| 65 to 74 Years | 5 | 6.3% |
| 75 to 84 Years | 7 | 8.9% |
| 85 Years and Over | 3 | 3.8% |
| Total | 79 | 100.0% |
Housing Finances in Dedham
Median Income by Occupancy in Dedham
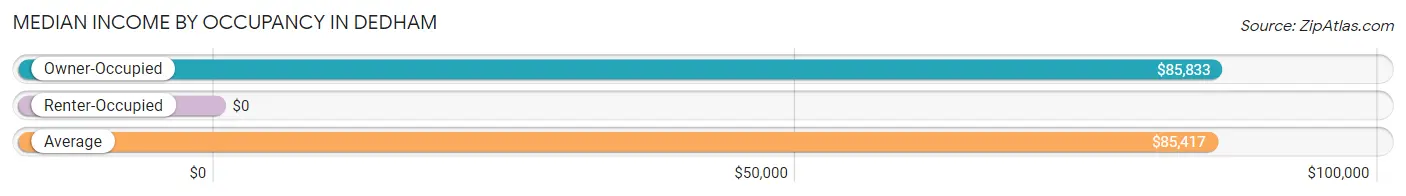
| Occupancy Type | # Households | Median Income |
| Owner-Occupied | 78 (98.7%) | $85,833 |
| Renter-Occupied | 1 (1.3%) | $0 |
| Average | 79 (100.0%) | $85,417 |
Occupancy by Householder Income Bracket in Dedham
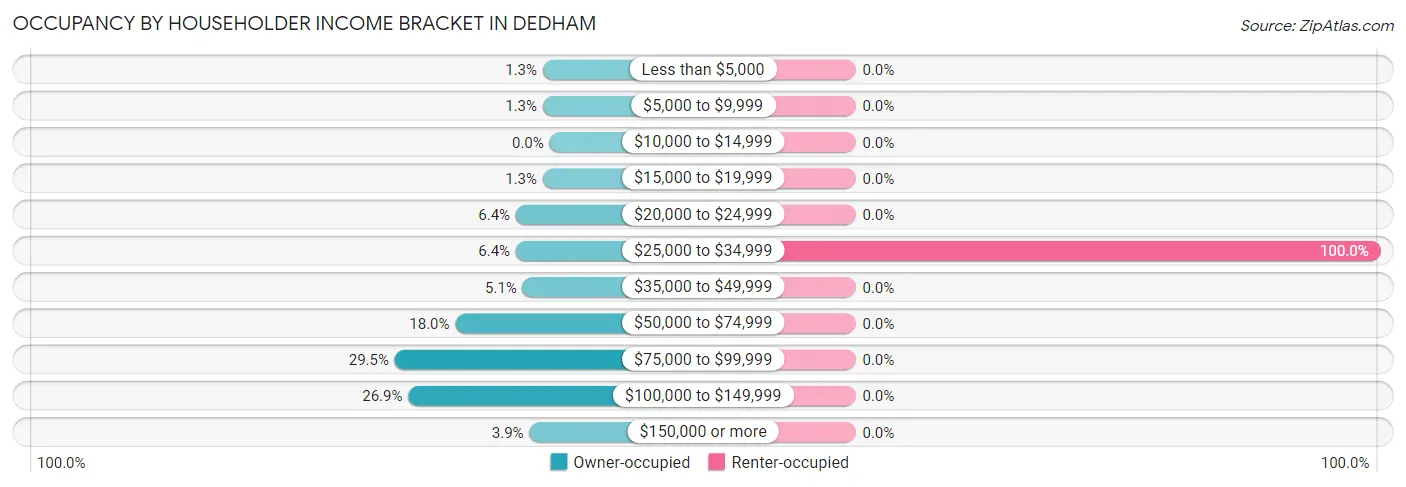
| Income Bracket | Owner-occupied | Renter-occupied |
| Less than $5,000 | 1 (1.3%) | 0 (0.0%) |
| $5,000 to $9,999 | 1 (1.3%) | 0 (0.0%) |
| $10,000 to $14,999 | 0 (0.0%) | 0 (0.0%) |
| $15,000 to $19,999 | 1 (1.3%) | 0 (0.0%) |
| $20,000 to $24,999 | 5 (6.4%) | 0 (0.0%) |
| $25,000 to $34,999 | 5 (6.4%) | 1 (100.0%) |
| $35,000 to $49,999 | 4 (5.1%) | 0 (0.0%) |
| $50,000 to $74,999 | 14 (17.9%) | 0 (0.0%) |
| $75,000 to $99,999 | 23 (29.5%) | 0 (0.0%) |
| $100,000 to $149,999 | 21 (26.9%) | 0 (0.0%) |
| $150,000 or more | 3 (3.8%) | 0 (0.0%) |
| Total | 78 (100.0%) | 1 (100.0%) |
Monthly Housing Cost Tiers in Dedham
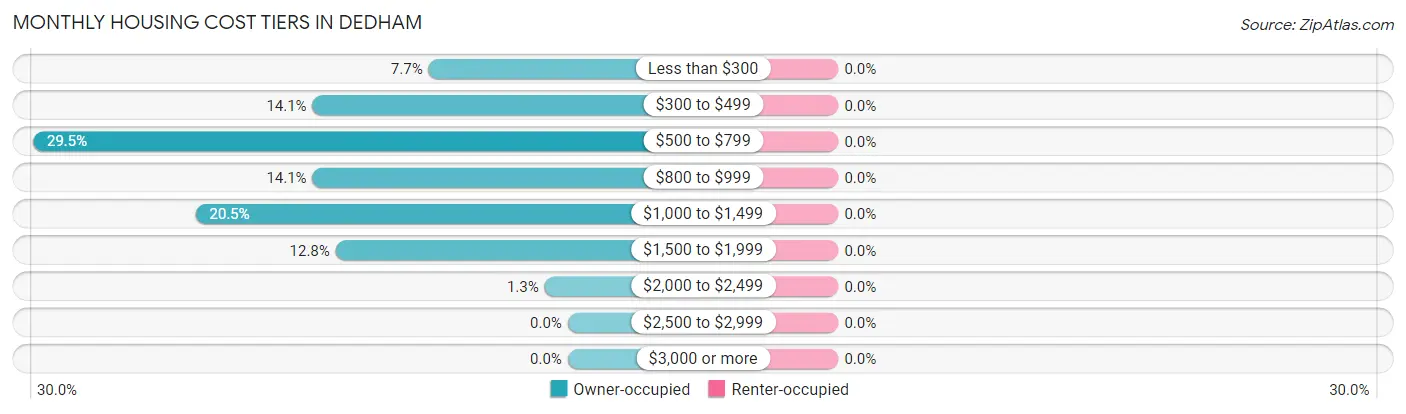
| Monthly Cost | Owner-occupied | Renter-occupied |
| Less than $300 | 6 (7.7%) | 0 (0.0%) |
| $300 to $499 | 11 (14.1%) | 0 (0.0%) |
| $500 to $799 | 23 (29.5%) | 0 (0.0%) |
| $800 to $999 | 11 (14.1%) | 0 (0.0%) |
| $1,000 to $1,499 | 16 (20.5%) | 0 (0.0%) |
| $1,500 to $1,999 | 10 (12.8%) | 0 (0.0%) |
| $2,000 to $2,499 | 1 (1.3%) | 0 (0.0%) |
| $2,500 to $2,999 | 0 (0.0%) | 0 (0.0%) |
| $3,000 or more | 0 (0.0%) | 0 (0.0%) |
| Total | 78 (100.0%) | 1 (100.0%) |
Physical Housing Characteristics in Dedham
Housing Structures in Dedham
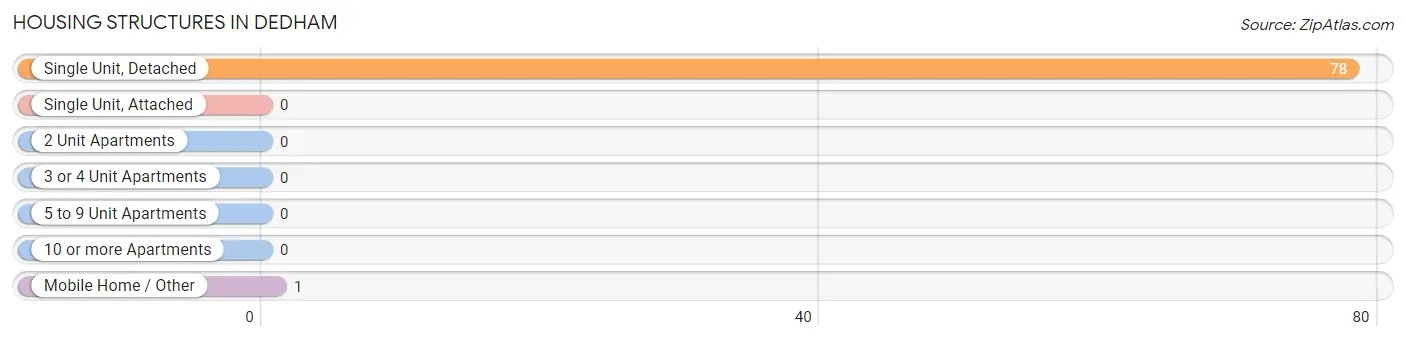
| Structure Type | # Housing Units | % Housing Units |
| Single Unit, Detached | 78 | 98.7% |
| Single Unit, Attached | 0 | 0.0% |
| 2 Unit Apartments | 0 | 0.0% |
| 3 or 4 Unit Apartments | 0 | 0.0% |
| 5 to 9 Unit Apartments | 0 | 0.0% |
| 10 or more Apartments | 0 | 0.0% |
| Mobile Home / Other | 1 | 1.3% |
| Total | 79 | 100.0% |
Housing Structures by Occupancy in Dedham
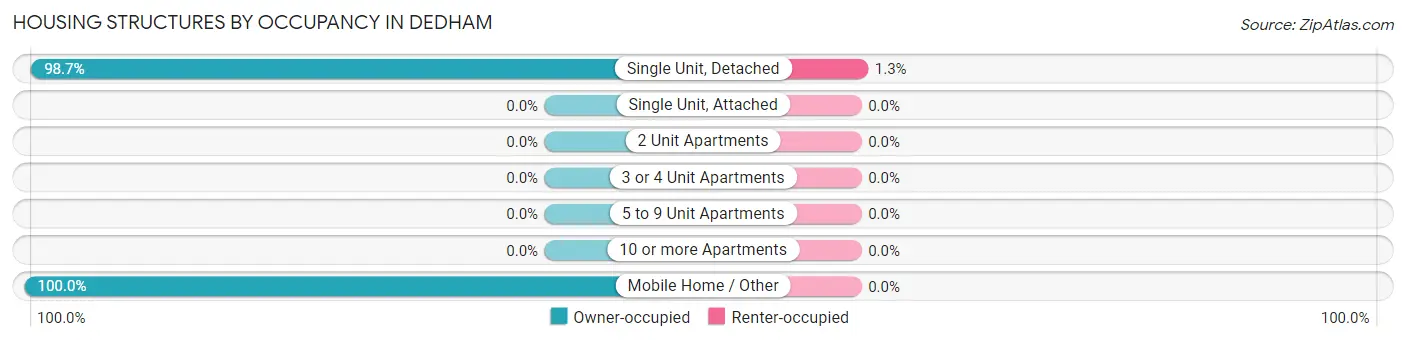
| Structure Type | Owner-occupied | Renter-occupied |
| Single Unit, Detached | 77 (98.7%) | 1 (1.3%) |
| Single Unit, Attached | 0 (0.0%) | 0 (0.0%) |
| 2 Unit Apartments | 0 (0.0%) | 0 (0.0%) |
| 3 or 4 Unit Apartments | 0 (0.0%) | 0 (0.0%) |
| 5 to 9 Unit Apartments | 0 (0.0%) | 0 (0.0%) |
| 10 or more Apartments | 0 (0.0%) | 0 (0.0%) |
| Mobile Home / Other | 1 (100.0%) | 0 (0.0%) |
| Total | 78 (98.7%) | 1 (1.3%) |
Housing Structures by Number of Rooms in Dedham
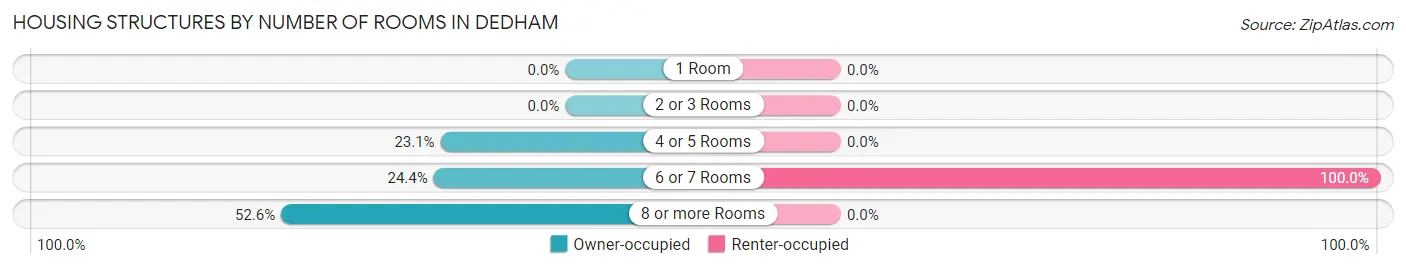
| Number of Rooms | Owner-occupied | Renter-occupied |
| 1 Room | 0 (0.0%) | 0 (0.0%) |
| 2 or 3 Rooms | 0 (0.0%) | 0 (0.0%) |
| 4 or 5 Rooms | 18 (23.1%) | 0 (0.0%) |
| 6 or 7 Rooms | 19 (24.4%) | 1 (100.0%) |
| 8 or more Rooms | 41 (52.6%) | 0 (0.0%) |
| Total | 78 (100.0%) | 1 (100.0%) |
Housing Structure by Heating Type in Dedham
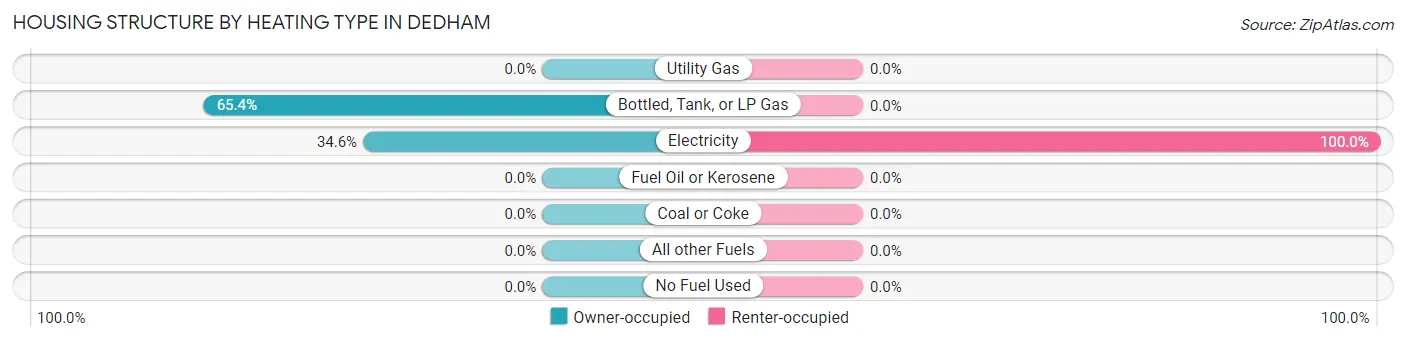
| Heating Type | Owner-occupied | Renter-occupied |
| Utility Gas | 0 (0.0%) | 0 (0.0%) |
| Bottled, Tank, or LP Gas | 51 (65.4%) | 0 (0.0%) |
| Electricity | 27 (34.6%) | 1 (100.0%) |
| Fuel Oil or Kerosene | 0 (0.0%) | 0 (0.0%) |
| Coal or Coke | 0 (0.0%) | 0 (0.0%) |
| All other Fuels | 0 (0.0%) | 0 (0.0%) |
| No Fuel Used | 0 (0.0%) | 0 (0.0%) |
| Total | 78 (100.0%) | 1 (100.0%) |
Household Vehicle Usage in Dedham
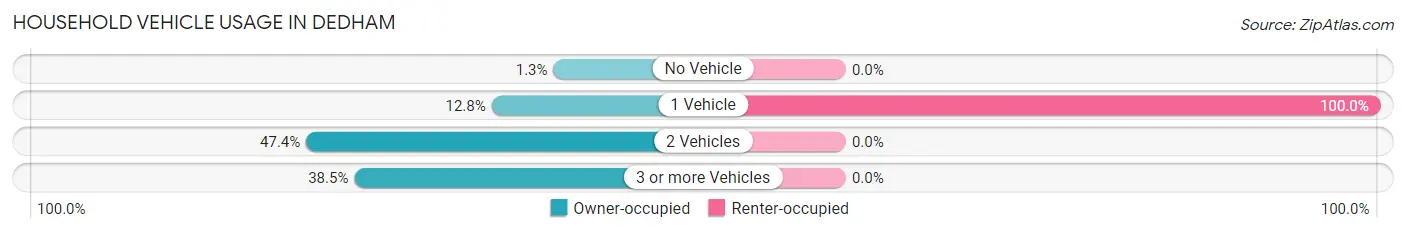
| Vehicles per Household | Owner-occupied | Renter-occupied |
| No Vehicle | 1 (1.3%) | 0 (0.0%) |
| 1 Vehicle | 10 (12.8%) | 1 (100.0%) |
| 2 Vehicles | 37 (47.4%) | 0 (0.0%) |
| 3 or more Vehicles | 30 (38.5%) | 0 (0.0%) |
| Total | 78 (100.0%) | 1 (100.0%) |
Real Estate & Mortgages in Dedham
Real Estate and Mortgage Overview in Dedham
| Characteristic | Without Mortgage | With Mortgage |
| Housing Units | 28 | 50 |
| Median Property Value | $114,600 | $138,500 |
| Median Household Income | $84,286 | $2 |
| Monthly Housing Costs | $440 | $0 |
| Real Estate Taxes | $867 | $3 |
Property Value by Mortgage Status in Dedham
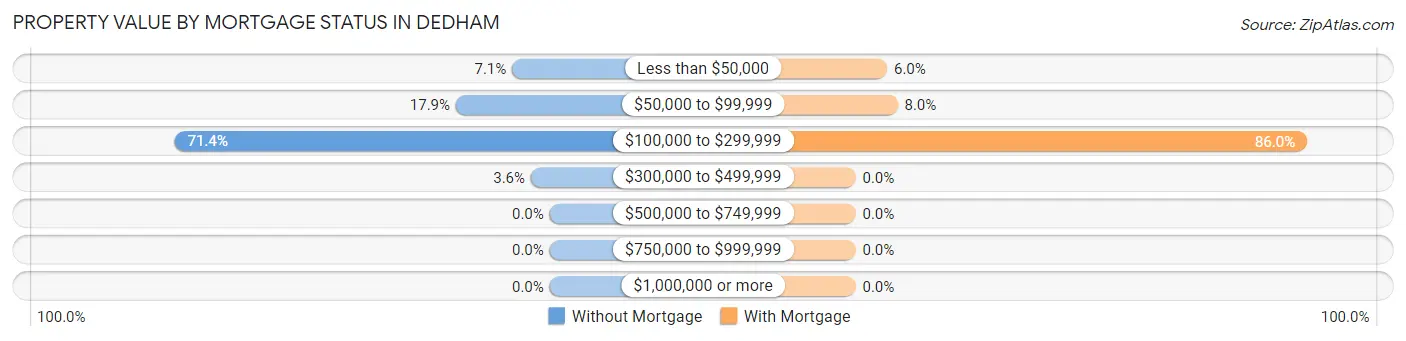
| Property Value | Without Mortgage | With Mortgage |
| Less than $50,000 | 2 (7.1%) | 3 (6.0%) |
| $50,000 to $99,999 | 5 (17.9%) | 4 (8.0%) |
| $100,000 to $299,999 | 20 (71.4%) | 43 (86.0%) |
| $300,000 to $499,999 | 1 (3.6%) | 0 (0.0%) |
| $500,000 to $749,999 | 0 (0.0%) | 0 (0.0%) |
| $750,000 to $999,999 | 0 (0.0%) | 0 (0.0%) |
| $1,000,000 or more | 0 (0.0%) | 0 (0.0%) |
| Total | 28 (100.0%) | 50 (100.0%) |
Household Income by Mortgage Status in Dedham
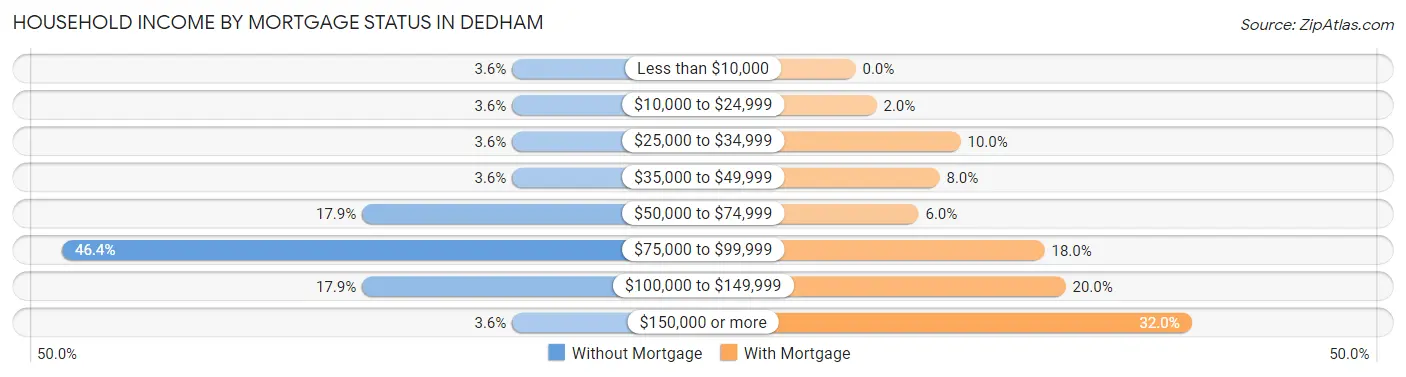
| Household Income | Without Mortgage | With Mortgage |
| Less than $10,000 | 1 (3.6%) | 0 (0.0%) |
| $10,000 to $24,999 | 1 (3.6%) | 1 (2.0%) |
| $25,000 to $34,999 | 1 (3.6%) | 5 (10.0%) |
| $35,000 to $49,999 | 1 (3.6%) | 4 (8.0%) |
| $50,000 to $74,999 | 5 (17.9%) | 3 (6.0%) |
| $75,000 to $99,999 | 13 (46.4%) | 9 (18.0%) |
| $100,000 to $149,999 | 5 (17.9%) | 10 (20.0%) |
| $150,000 or more | 1 (3.6%) | 16 (32.0%) |
| Total | 28 (100.0%) | 50 (100.0%) |
Property Value to Household Income Ratio in Dedham
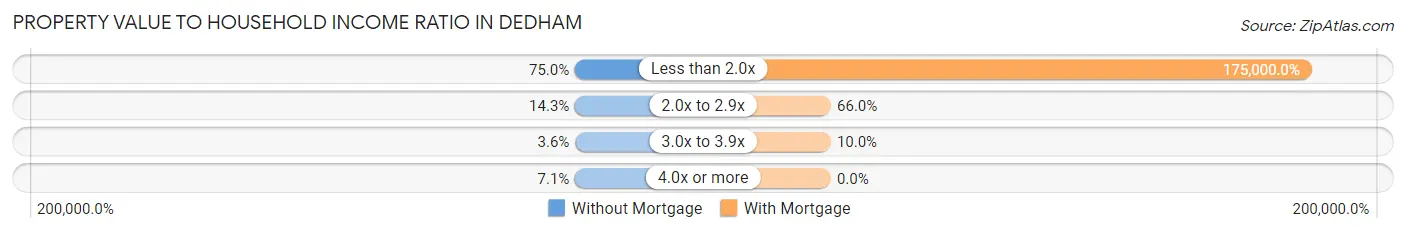
| Value-to-Income Ratio | Without Mortgage | With Mortgage |
| Less than 2.0x | 21 (75.0%) | 87,500 (175,000.0%) |
| 2.0x to 2.9x | 4 (14.3%) | 33 (66.0%) |
| 3.0x to 3.9x | 1 (3.6%) | 5 (10.0%) |
| 4.0x or more | 2 (7.1%) | 0 (0.0%) |
| Total | 28 (100.0%) | 50 (100.0%) |
Real Estate Taxes by Mortgage Status in Dedham
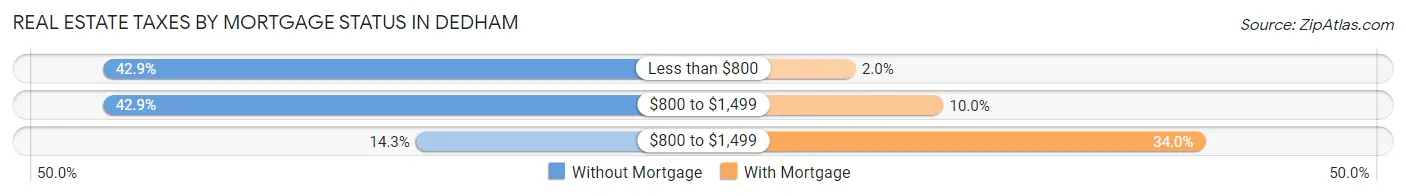
| Property Taxes | Without Mortgage | With Mortgage |
| Less than $800 | 12 (42.9%) | 1 (2.0%) |
| $800 to $1,499 | 12 (42.9%) | 5 (10.0%) |
| $800 to $1,499 | 4 (14.3%) | 17 (34.0%) |
| Total | 28 (100.0%) | 50 (100.0%) |
Health & Disability in Dedham
Health Insurance Coverage by Age in Dedham
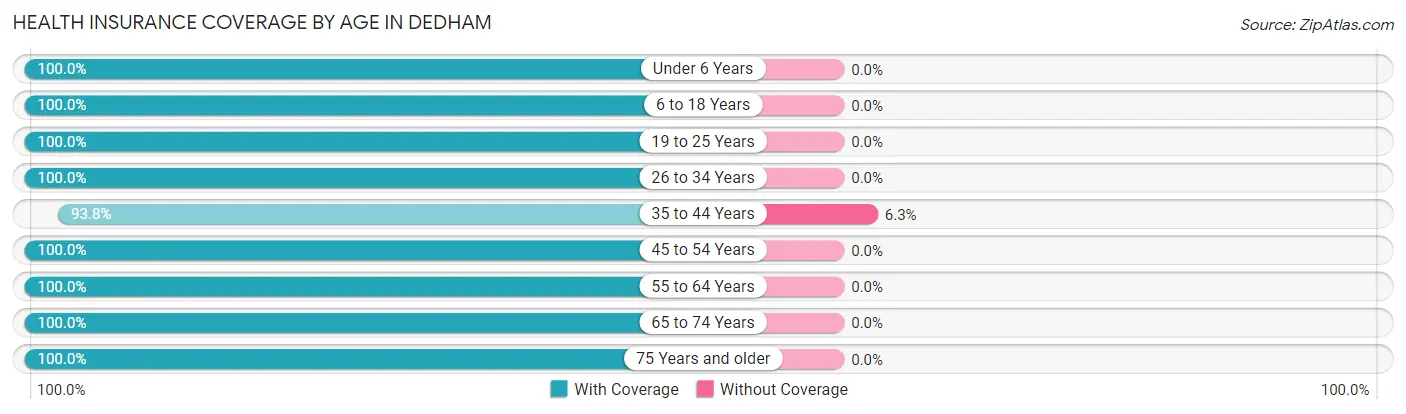
| Age Bracket | With Coverage | Without Coverage |
| Under 6 Years | 19 (100.0%) | 0 (0.0%) |
| 6 to 18 Years | 53 (100.0%) | 0 (0.0%) |
| 19 to 25 Years | 26 (100.0%) | 0 (0.0%) |
| 26 to 34 Years | 30 (100.0%) | 0 (0.0%) |
| 35 to 44 Years | 30 (93.8%) | 2 (6.2%) |
| 45 to 54 Years | 23 (100.0%) | 0 (0.0%) |
| 55 to 64 Years | 21 (100.0%) | 0 (0.0%) |
| 65 to 74 Years | 10 (100.0%) | 0 (0.0%) |
| 75 Years and older | 14 (100.0%) | 0 (0.0%) |
| Total | 226 (99.1%) | 2 (0.9%) |
Health Insurance Coverage by Citizenship Status in Dedham
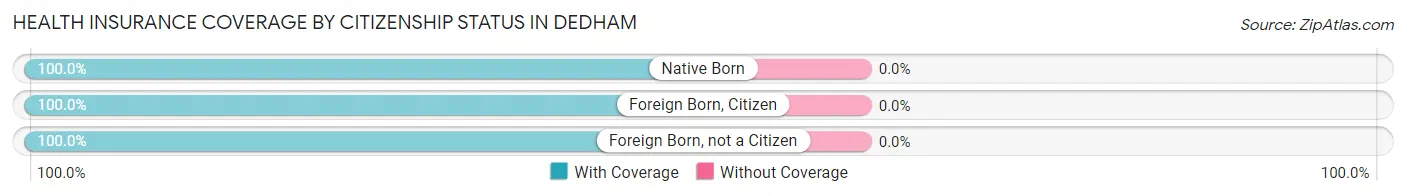
| Citizenship Status | With Coverage | Without Coverage |
| Native Born | 19 (100.0%) | 0 (0.0%) |
| Foreign Born, Citizen | 53 (100.0%) | 0 (0.0%) |
| Foreign Born, not a Citizen | 26 (100.0%) | 0 (0.0%) |
Health Insurance Coverage by Household Income in Dedham
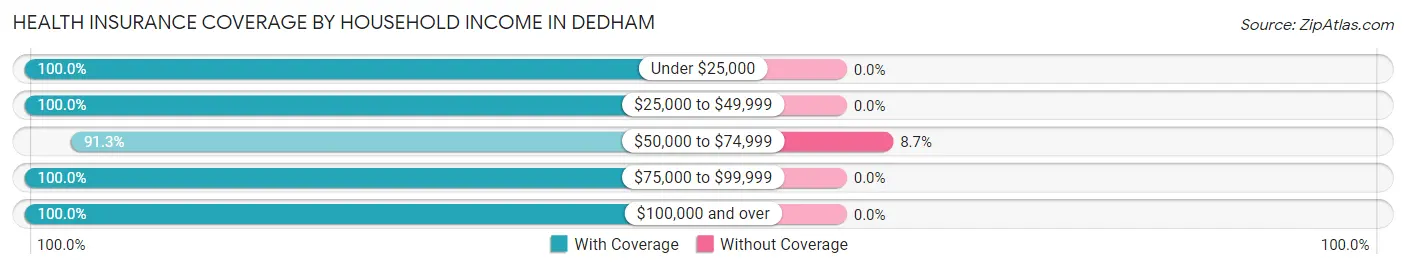
| Household Income | With Coverage | Without Coverage |
| Under $25,000 | 22 (100.0%) | 0 (0.0%) |
| $25,000 to $49,999 | 30 (100.0%) | 0 (0.0%) |
| $50,000 to $74,999 | 21 (91.3%) | 2 (8.7%) |
| $75,000 to $99,999 | 55 (100.0%) | 0 (0.0%) |
| $100,000 and over | 98 (100.0%) | 0 (0.0%) |
Public vs Private Health Insurance Coverage by Age in Dedham
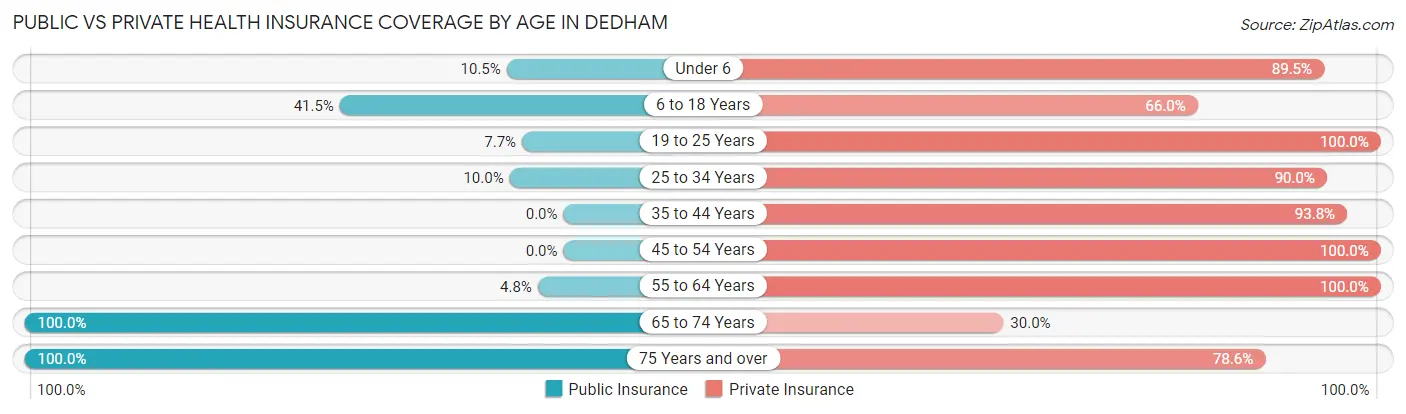
| Age Bracket | Public Insurance | Private Insurance |
| Under 6 | 2 (10.5%) | 17 (89.5%) |
| 6 to 18 Years | 22 (41.5%) | 35 (66.0%) |
| 19 to 25 Years | 2 (7.7%) | 26 (100.0%) |
| 25 to 34 Years | 3 (10.0%) | 27 (90.0%) |
| 35 to 44 Years | 0 (0.0%) | 30 (93.8%) |
| 45 to 54 Years | 0 (0.0%) | 23 (100.0%) |
| 55 to 64 Years | 1 (4.8%) | 21 (100.0%) |
| 65 to 74 Years | 10 (100.0%) | 3 (30.0%) |
| 75 Years and over | 14 (100.0%) | 11 (78.6%) |
| Total | 54 (23.7%) | 193 (84.7%) |
Disability Status by Sex by Age in Dedham
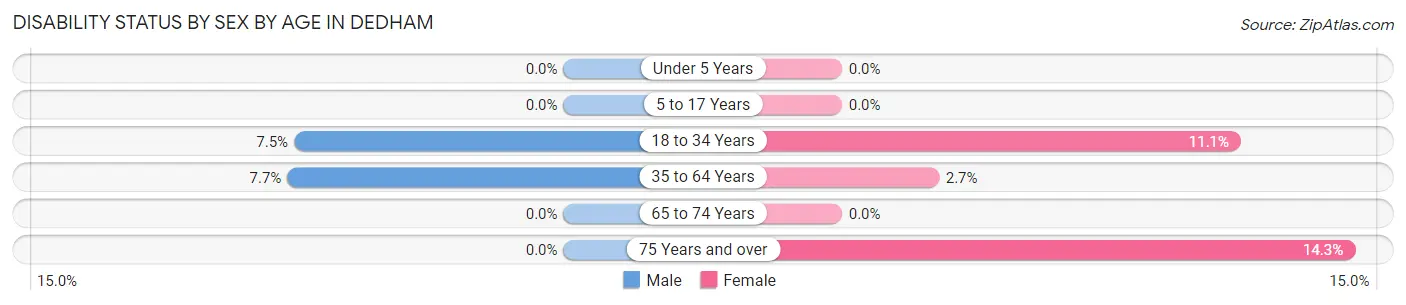
| Age Bracket | Male | Female |
| Under 5 Years | 0 (0.0%) | 0 (0.0%) |
| 5 to 17 Years | 0 (0.0%) | 0 (0.0%) |
| 18 to 34 Years | 3 (7.5%) | 2 (11.1%) |
| 35 to 64 Years | 3 (7.7%) | 1 (2.7%) |
| 65 to 74 Years | 0 (0.0%) | 0 (0.0%) |
| 75 Years and over | 0 (0.0%) | 1 (14.3%) |
Disability Class by Sex by Age in Dedham
Disability Class: Hearing Difficulty
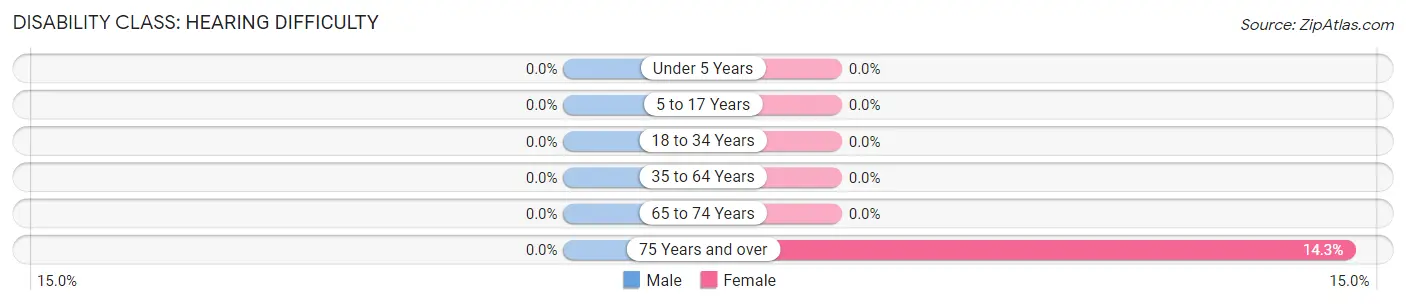
| Age Bracket | Male | Female |
| Under 5 Years | 0 (0.0%) | 0 (0.0%) |
| 5 to 17 Years | 0 (0.0%) | 0 (0.0%) |
| 18 to 34 Years | 0 (0.0%) | 0 (0.0%) |
| 35 to 64 Years | 0 (0.0%) | 0 (0.0%) |
| 65 to 74 Years | 0 (0.0%) | 0 (0.0%) |
| 75 Years and over | 0 (0.0%) | 1 (14.3%) |
Disability Class: Vision Difficulty
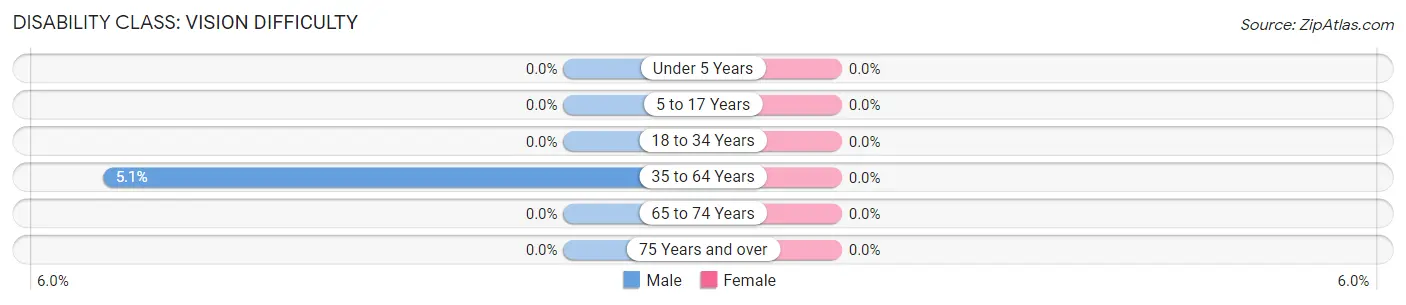
| Age Bracket | Male | Female |
| Under 5 Years | 0 (0.0%) | 0 (0.0%) |
| 5 to 17 Years | 0 (0.0%) | 0 (0.0%) |
| 18 to 34 Years | 0 (0.0%) | 0 (0.0%) |
| 35 to 64 Years | 2 (5.1%) | 0 (0.0%) |
| 65 to 74 Years | 0 (0.0%) | 0 (0.0%) |
| 75 Years and over | 0 (0.0%) | 0 (0.0%) |
Disability Class: Cognitive Difficulty
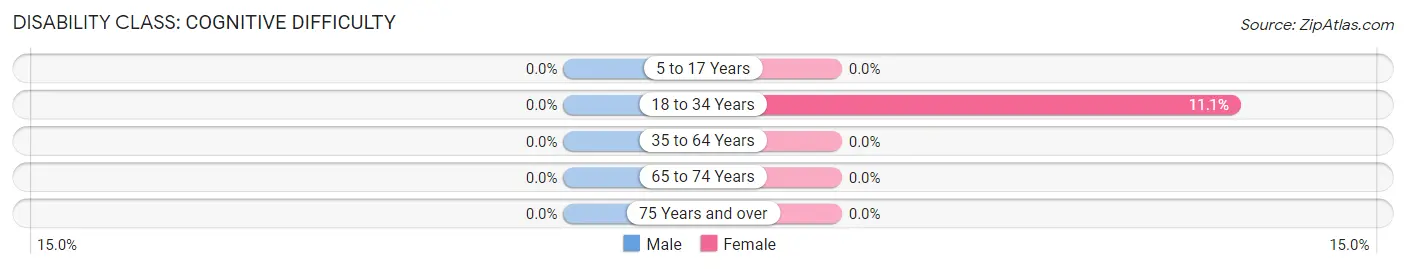
| Age Bracket | Male | Female |
| 5 to 17 Years | 0 (0.0%) | 0 (0.0%) |
| 18 to 34 Years | 0 (0.0%) | 2 (11.1%) |
| 35 to 64 Years | 0 (0.0%) | 0 (0.0%) |
| 65 to 74 Years | 0 (0.0%) | 0 (0.0%) |
| 75 Years and over | 0 (0.0%) | 0 (0.0%) |
Disability Class: Ambulatory Difficulty
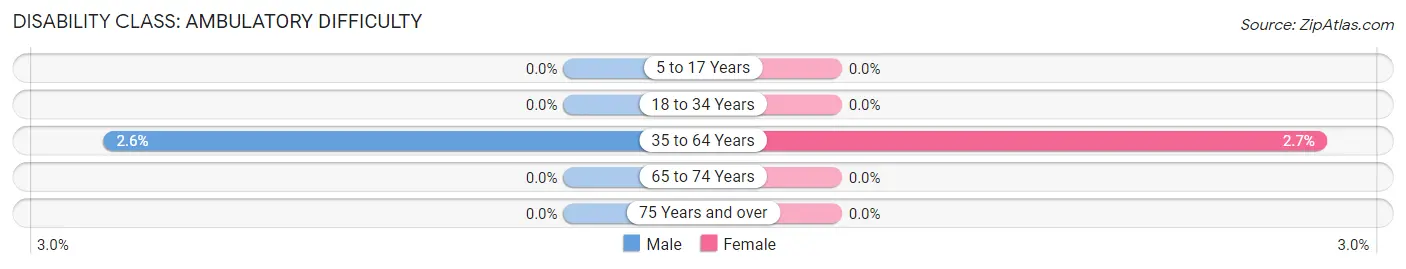
| Age Bracket | Male | Female |
| 5 to 17 Years | 0 (0.0%) | 0 (0.0%) |
| 18 to 34 Years | 0 (0.0%) | 0 (0.0%) |
| 35 to 64 Years | 1 (2.6%) | 1 (2.7%) |
| 65 to 74 Years | 0 (0.0%) | 0 (0.0%) |
| 75 Years and over | 0 (0.0%) | 0 (0.0%) |
Disability Class: Self-Care Difficulty
| Age Bracket | Male | Female |
| 5 to 17 Years | 0 (0.0%) | 0 (0.0%) |
| 18 to 34 Years | 0 (0.0%) | 0 (0.0%) |
| 35 to 64 Years | 0 (0.0%) | 0 (0.0%) |
| 65 to 74 Years | 0 (0.0%) | 0 (0.0%) |
| 75 Years and over | 0 (0.0%) | 0 (0.0%) |
Technology Access in Dedham
Computing Device Access in Dedham
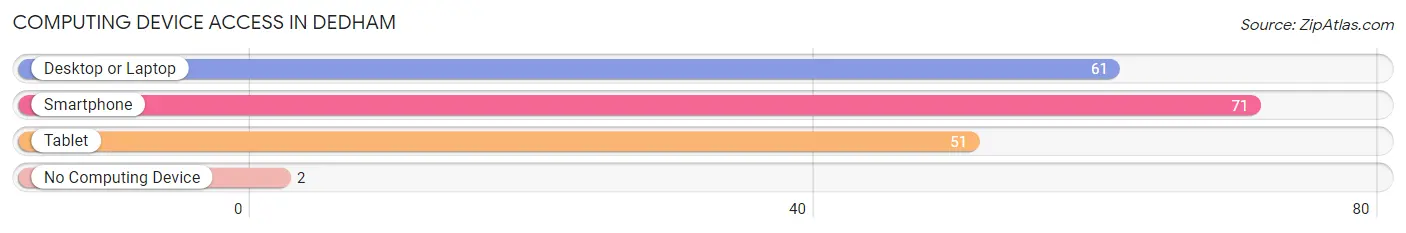
| Device Type | # Households | % Households |
| Desktop or Laptop | 61 | 77.2% |
| Smartphone | 71 | 89.9% |
| Tablet | 51 | 64.6% |
| No Computing Device | 2 | 2.5% |
| Total | 79 | 100.0% |
Internet Access in Dedham
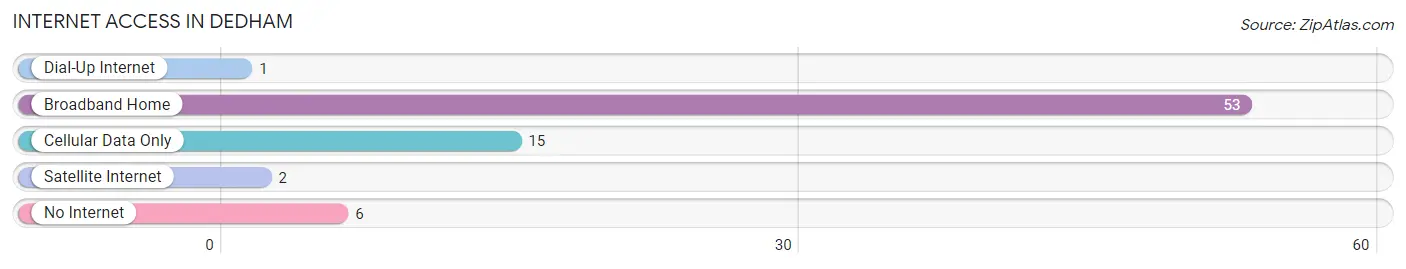
| Internet Type | # Households | % Households |
| Dial-Up Internet | 1 | 1.3% |
| Broadband Home | 53 | 67.1% |
| Cellular Data Only | 15 | 19.0% |
| Satellite Internet | 2 | 2.5% |
| No Internet | 6 | 7.6% |
| Total | 79 | 100.0% |
Dedham Summary
Dedham is a small town located in the state of Iowa in the United States. It is located in the county of Carroll and is part of the Carroll Micropolitan Statistical Area. The town has a population of just over 500 people and is located in the rolling hills of western Iowa.
Geography
Dedham is located in western Iowa, in the county of Carroll. It is situated in the rolling hills of the Loess Hills region, which is a region of wind-deposited silt that covers much of western Iowa. The town is located at the intersection of two major highways, U.S. Route 30 and Iowa Highway 141. The town is located about 25 miles east of the Missouri River and about 40 miles west of Des Moines.
The town is located in a rural area and is surrounded by farmland. The nearest major city is Des Moines, which is about 40 miles away. The nearest smaller towns are Glidden, which is about 10 miles away, and Coon Rapids, which is about 15 miles away.
History
Dedham was founded in 1856 by a group of settlers from Dedham, Massachusetts. The town was named after the Massachusetts town and was originally intended to be a utopian community. The settlers built a grist mill, a saw mill, and a blacksmith shop. The town grew slowly but steadily over the years and by the early 1900s had a population of about 500 people.
The town was largely agricultural and the main crops were corn, oats, and hay. The town also had a few small businesses, including a general store, a bank, and a post office.
In the 1950s, the town began to decline as many of the young people moved away to find work in larger cities. The population of the town has remained fairly stable since then, with a population of about 500 people.
Economy
The economy of Dedham is largely based on agriculture. The main crops are corn, oats, and hay. The town also has a few small businesses, including a general store, a bank, and a post office.
Demographics
As of the 2010 census, the population of Dedham was 514 people. The racial makeup of the town was 97.3% White, 0.6% African American, 0.2% Native American, 0.2% Asian, 0.2% from other races, and 1.6% from two or more races. Hispanic or Latino of any race were 0.8% of the population.
The median household income in Dedham was $45,833 and the median family income was $50,000. The per capita income for the town was $20,845. About 8.3% of families and 10.2% of the population were below the poverty line, including 11.3% of those under age 18 and 8.3% of those age 65 or over.
Conclusion
Dedham is a small town located in western Iowa. It has a population of just over 500 people and is largely agricultural. The town has a few small businesses and the main crops are corn, oats, and hay. The town has a median household income of $45,833 and a per capita income of $20,845. The racial makeup of the town is mostly White, with a small percentage of African American, Native American, and Asian residents.
Common Questions
What is Per Capita Income in Dedham?
Per Capita income in Dedham is $30,155.
What is the Median Family Income in Dedham?
Median Family Income in Dedham is $91,875.
What is the Median Household income in Dedham?
Median Household Income in Dedham is $85,417.
What is Income or Wage Gap in Dedham?
Income or Wage Gap in Dedham is 48.7%.
Women in Dedham earn 51.3 cents for every dollar earned by a man.
What is Inequality or Gini Index in Dedham?
Inequality or Gini Index in Dedham is 0.30.
What is the Total Population of Dedham?
Total Population of Dedham is 228.
What is the Total Male Population of Dedham?
Total Male Population of Dedham is 124.
What is the Total Female Population of Dedham?
Total Female Population of Dedham is 104.
What is the Ratio of Males per 100 Females in Dedham?
There are 119.23 Males per 100 Females in Dedham.
What is the Ratio of Females per 100 Males in Dedham?
There are 83.87 Females per 100 Males in Dedham.
What is the Median Population Age in Dedham?
Median Population Age in Dedham is 30.7 Years.
What is the Average Family Size in Dedham
Average Family Size in Dedham is 3.4 People.
What is the Average Household Size in Dedham
Average Household Size in Dedham is 2.9 People.
How Large is the Labor Force in Dedham?
There are 135 People in the Labor Forcein in Dedham.
What is the Percentage of People in the Labor Force in Dedham?
80.8% of People are in the Labor Force in Dedham.
What is the Unemployment Rate in Dedham?
Unemployment Rate in Dedham is 1.5%.