Huxley, TX Map & Demographics
Huxley Map
Huxley Overview
$33,010
PER CAPITA INCOME
$90,278
AVG FAMILY INCOME
$64,167
AVG HOUSEHOLD INCOME
59.9%
WAGE / INCOME GAP [ % ]
40.1¢/ $1
WAGE / INCOME GAP [ $ ]
0.40
INEQUALITY / GINI INDEX
457
TOTAL POPULATION
224
MALE POPULATION
233
FEMALE POPULATION
96.14
MALES / 100 FEMALES
104.02
FEMALES / 100 MALES
48.0
MEDIAN AGE
3.1
AVG FAMILY SIZE
2.6
AVG HOUSEHOLD SIZE
191
LABOR FORCE [ PEOPLE ]
50.0%
PERCENT IN LABOR FORCE
Income in Huxley
Income Overview in Huxley
Per Capita Income in Huxley is $33,010, while median incomes of families and households are $90,278 and $64,167 respectively.
| Characteristic | Number | Measure |
| Per Capita Income | 457 | $33,010 |
| Median Family Income | 130 | $90,278 |
| Mean Family Income | 130 | $98,252 |
| Median Household Income | 178 | $64,167 |
| Mean Household Income | 178 | $82,969 |
| Income Deficit | 130 | $0 |
| Wage / Income Gap (%) | 457 | 59.94% |
| Wage / Income Gap ($) | 457 | 40.06¢ per $1 |
| Gini / Inequality Index | 457 | 0.40 |
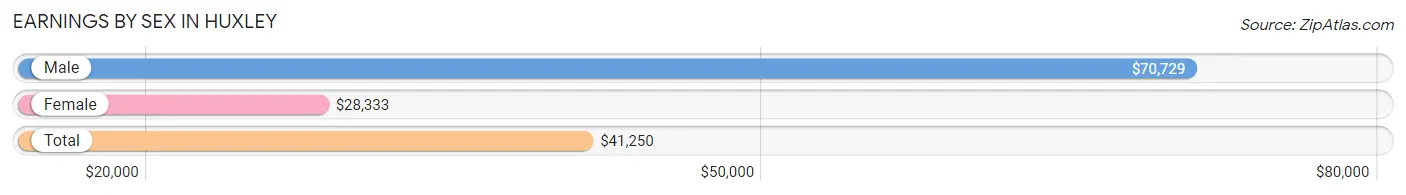
Earnings by Sex in Huxley
Average Earnings in Huxley are $41,250, $70,729 for men and $28,333 for women, a difference of 59.9%.
| Sex | Number | Average Earnings |
| Male | 115 (54.5%) | $70,729 |
| Female | 96 (45.5%) | $28,333 |
| Total | 211 (100.0%) | $41,250 |
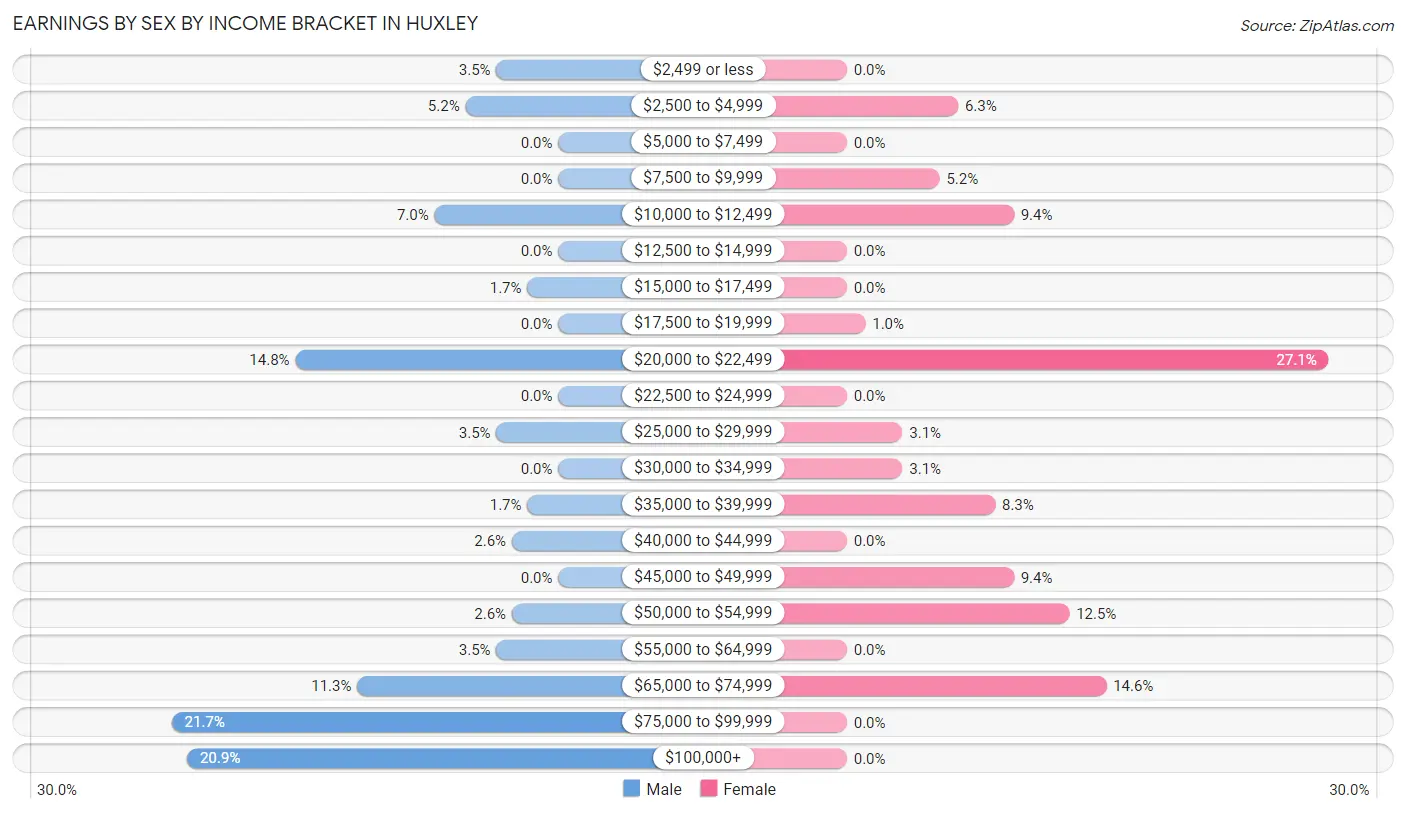
Earnings by Sex by Income Bracket in Huxley
The most common earnings brackets in Huxley are $75,000 to $99,999 for men (25 | 21.7%) and $20,000 to $22,499 for women (26 | 27.1%).
| Income | Male | Female |
| $2,499 or less | 4 (3.5%) | 0 (0.0%) |
| $2,500 to $4,999 | 6 (5.2%) | 6 (6.2%) |
| $5,000 to $7,499 | 0 (0.0%) | 0 (0.0%) |
| $7,500 to $9,999 | 0 (0.0%) | 5 (5.2%) |
| $10,000 to $12,499 | 8 (7.0%) | 9 (9.4%) |
| $12,500 to $14,999 | 0 (0.0%) | 0 (0.0%) |
| $15,000 to $17,499 | 2 (1.7%) | 0 (0.0%) |
| $17,500 to $19,999 | 0 (0.0%) | 1 (1.0%) |
| $20,000 to $22,499 | 17 (14.8%) | 26 (27.1%) |
| $22,500 to $24,999 | 0 (0.0%) | 0 (0.0%) |
| $25,000 to $29,999 | 4 (3.5%) | 3 (3.1%) |
| $30,000 to $34,999 | 0 (0.0%) | 3 (3.1%) |
| $35,000 to $39,999 | 2 (1.7%) | 8 (8.3%) |
| $40,000 to $44,999 | 3 (2.6%) | 0 (0.0%) |
| $45,000 to $49,999 | 0 (0.0%) | 9 (9.4%) |
| $50,000 to $54,999 | 3 (2.6%) | 12 (12.5%) |
| $55,000 to $64,999 | 4 (3.5%) | 0 (0.0%) |
| $65,000 to $74,999 | 13 (11.3%) | 14 (14.6%) |
| $75,000 to $99,999 | 25 (21.7%) | 0 (0.0%) |
| $100,000+ | 24 (20.9%) | 0 (0.0%) |
| Total | 115 (100.0%) | 96 (100.0%) |
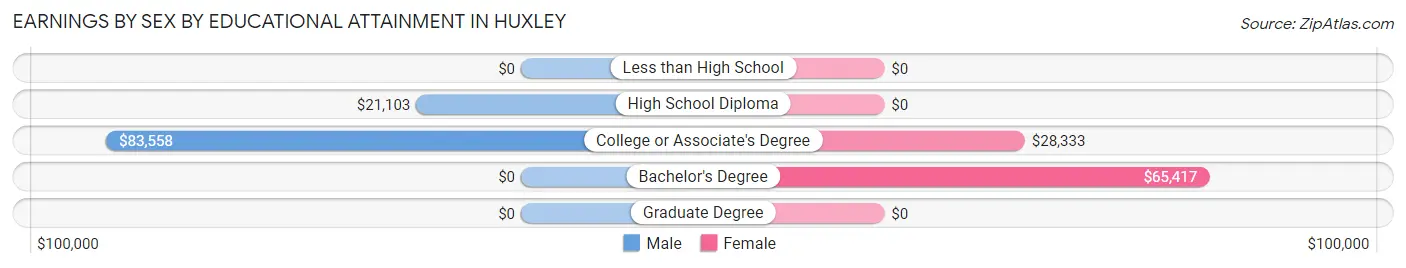
Earnings by Sex by Educational Attainment in Huxley
Average earnings in Huxley are $71,406 for men and $29,167 for women, a difference of 59.2%. Men with an educational attainment of college or associate's degree enjoy the highest average annual earnings of $83,558, while those with high school diploma education earn the least with $21,103. Women with an educational attainment of bachelor's degree earn the most with the average annual earnings of $65,417, while those with college or associate's degree education have the smallest earnings of $28,333.
| Educational Attainment | Male Income | Female Income |
| Less than High School | - | - |
| High School Diploma | $21,103 | $0 |
| College or Associate's Degree | $83,558 | $28,333 |
| Bachelor's Degree | - | - |
| Graduate Degree | - | - |
| Total | $71,406 | $29,167 |
Family Income in Huxley
Family Income Brackets in Huxley
According to the Huxley family income data, there are 35 families falling into the $35,000 to $49,999 income range, which is the most common income bracket and makes up 26.9% of all families.
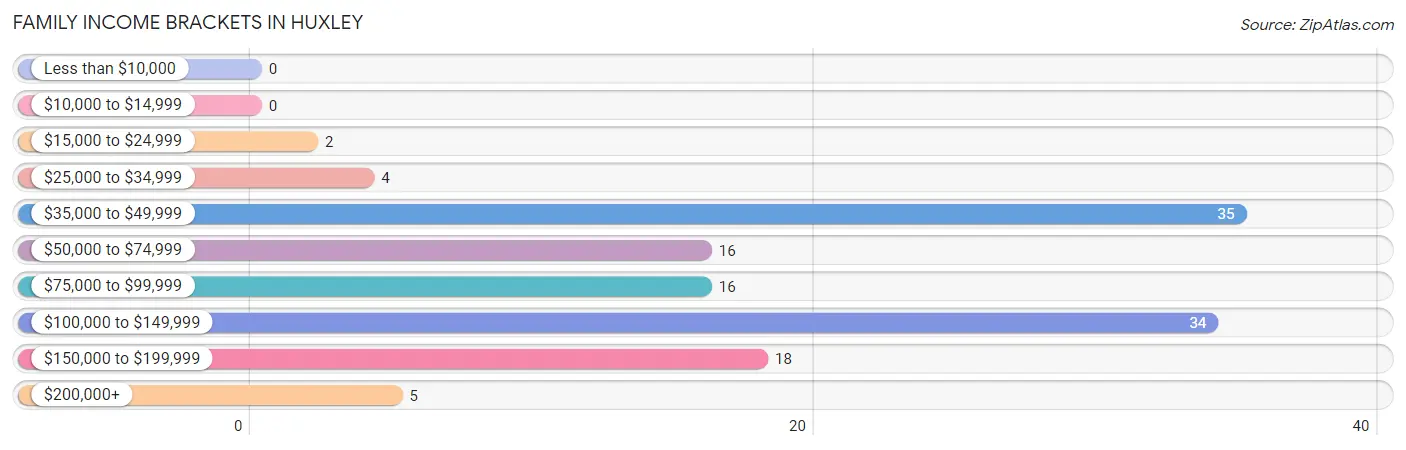
| Income Bracket | # Families | % Families |
| Less than $10,000 | 0 | 0.0% |
| $10,000 to $14,999 | 0 | 0.0% |
| $15,000 to $24,999 | 2 | 1.5% |
| $25,000 to $34,999 | 4 | 3.1% |
| $35,000 to $49,999 | 35 | 26.9% |
| $50,000 to $74,999 | 16 | 12.3% |
| $75,000 to $99,999 | 16 | 12.3% |
| $100,000 to $149,999 | 34 | 26.2% |
| $150,000 to $199,999 | 18 | 13.8% |
| $200,000+ | 5 | 3.8% |
Family Income by Famaliy Size in Huxley
3-person families (21 | 16.2%) account for the highest median family income in Huxley with $139,750 per family, while 3-person families (21 | 16.2%) have the highest median income of $46,583 per family member.
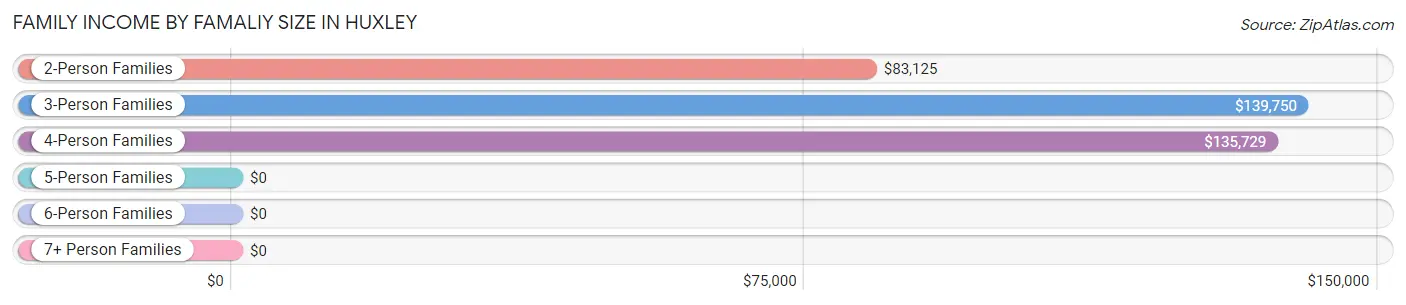
| Income Bracket | # Families | Median Income |
| 2-Person Families | 59 (45.4%) | $83,125 |
| 3-Person Families | 21 (16.2%) | $139,750 |
| 4-Person Families | 25 (19.2%) | $135,729 |
| 5-Person Families | 5 (3.8%) | $0 |
| 6-Person Families | 20 (15.4%) | $0 |
| 7+ Person Families | 0 (0.0%) | $0 |
| Total | 130 (100.0%) | $90,278 |
Family Income by Number of Earners in Huxley
The median family income in Huxley is $90,278, with families comprising 3+ earners (11) having the highest median family income of $182,250, while families with no earners (18) have the lowest median family income of $37,500, accounting for 8.5% and 13.9% of families, respectively.
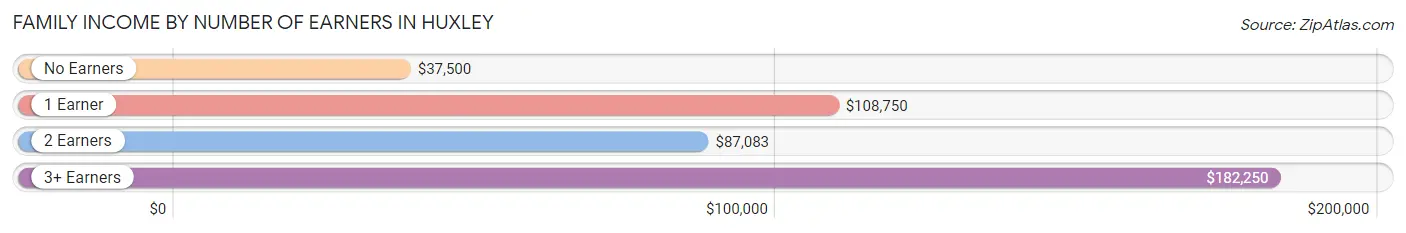
| Number of Earners | # Families | Median Income |
| No Earners | 18 (13.9%) | $37,500 |
| 1 Earner | 34 (26.2%) | $108,750 |
| 2 Earners | 67 (51.5%) | $87,083 |
| 3+ Earners | 11 (8.5%) | $182,250 |
| Total | 130 (100.0%) | $90,278 |
Household Income in Huxley
Household Income Brackets in Huxley
With 41 households falling in the category, the $35,000 to $49,999 income range is the most frequent in Huxley, accounting for 23.0% of all households. In contrast, only 2 households (1.1%) fall into the $10,000 to $14,999 income bracket, making it the least populous group.
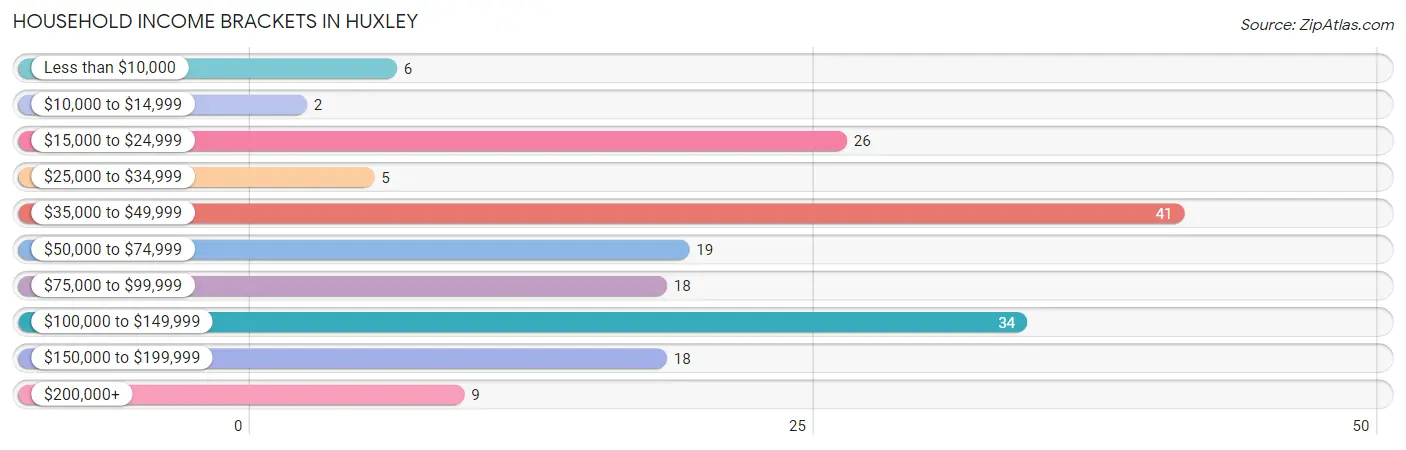
| Income Bracket | # Households | % Households |
| Less than $10,000 | 6 | 3.4% |
| $10,000 to $14,999 | 2 | 1.1% |
| $15,000 to $24,999 | 26 | 14.6% |
| $25,000 to $34,999 | 5 | 2.8% |
| $35,000 to $49,999 | 41 | 23.0% |
| $50,000 to $74,999 | 19 | 10.7% |
| $75,000 to $99,999 | 18 | 10.1% |
| $100,000 to $149,999 | 34 | 19.1% |
| $150,000 to $199,999 | 18 | 10.1% |
| $200,000+ | 9 | 5.1% |
Household Income by Householder Age in Huxley
The median household income in Huxley is $64,167, with the highest median household income of $109,688 found in the 25 to 44 years age bracket for the primary householder. A total of 34 households (19.1%) fall into this category. Meanwhile, the 15 to 24 years age bracket for the primary householder has the lowest median household income of $0, with 2 households (1.1%) in this group.
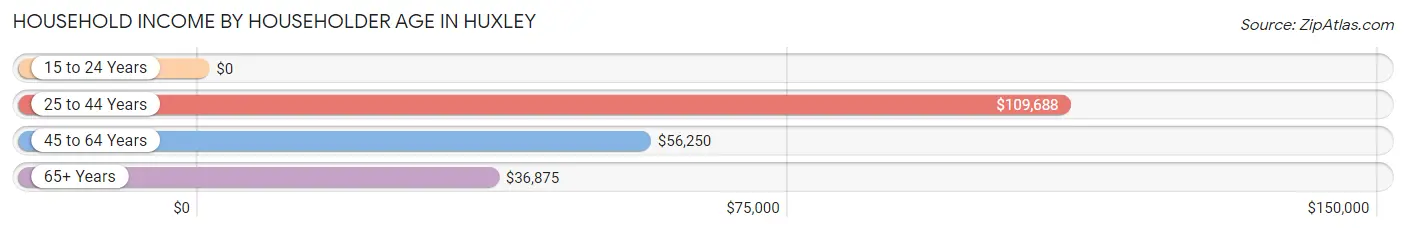
| Income Bracket | # Households | Median Income |
| 15 to 24 Years | 2 (1.1%) | $0 |
| 25 to 44 Years | 34 (19.1%) | $109,688 |
| 45 to 64 Years | 96 (53.9%) | $56,250 |
| 65+ Years | 46 (25.8%) | $36,875 |
| Total | 178 (100.0%) | $64,167 |
Poverty in Huxley
Income Below Poverty by Sex and Age in Huxley
With 0.9% poverty level for males and 8.6% for females among the residents of Huxley, 55 to 64 year old males and 15 year old females are the most vulnerable to poverty, with 2 males (9.5%) and 2 females (100.0%) in their respective age groups living below the poverty level.
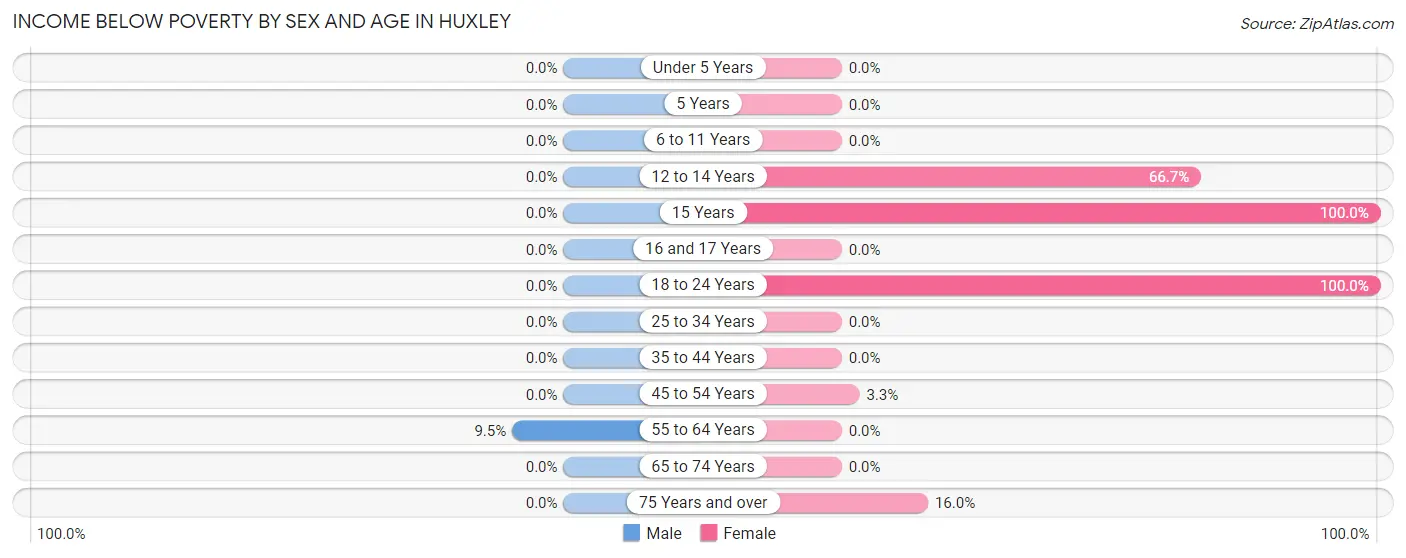
| Age Bracket | Male | Female |
| Under 5 Years | 0 (0.0%) | 0 (0.0%) |
| 5 Years | 0 (0.0%) | 0 (0.0%) |
| 6 to 11 Years | 0 (0.0%) | 0 (0.0%) |
| 12 to 14 Years | 0 (0.0%) | 10 (66.7%) |
| 15 Years | 0 (0.0%) | 2 (100.0%) |
| 16 and 17 Years | 0 (0.0%) | 0 (0.0%) |
| 18 to 24 Years | 0 (0.0%) | 2 (100.0%) |
| 25 to 34 Years | 0 (0.0%) | 0 (0.0%) |
| 35 to 44 Years | 0 (0.0%) | 0 (0.0%) |
| 45 to 54 Years | 0 (0.0%) | 2 (3.3%) |
| 55 to 64 Years | 2 (9.5%) | 0 (0.0%) |
| 65 to 74 Years | 0 (0.0%) | 0 (0.0%) |
| 75 Years and over | 0 (0.0%) | 4 (16.0%) |
| Total | 2 (0.9%) | 20 (8.6%) |
Income Above Poverty by Sex and Age in Huxley
According to the poverty statistics in Huxley, males aged under 5 years and females aged under 5 years are the age groups that are most secure financially, with 100.0% of males and 100.0% of females in these age groups living above the poverty line.
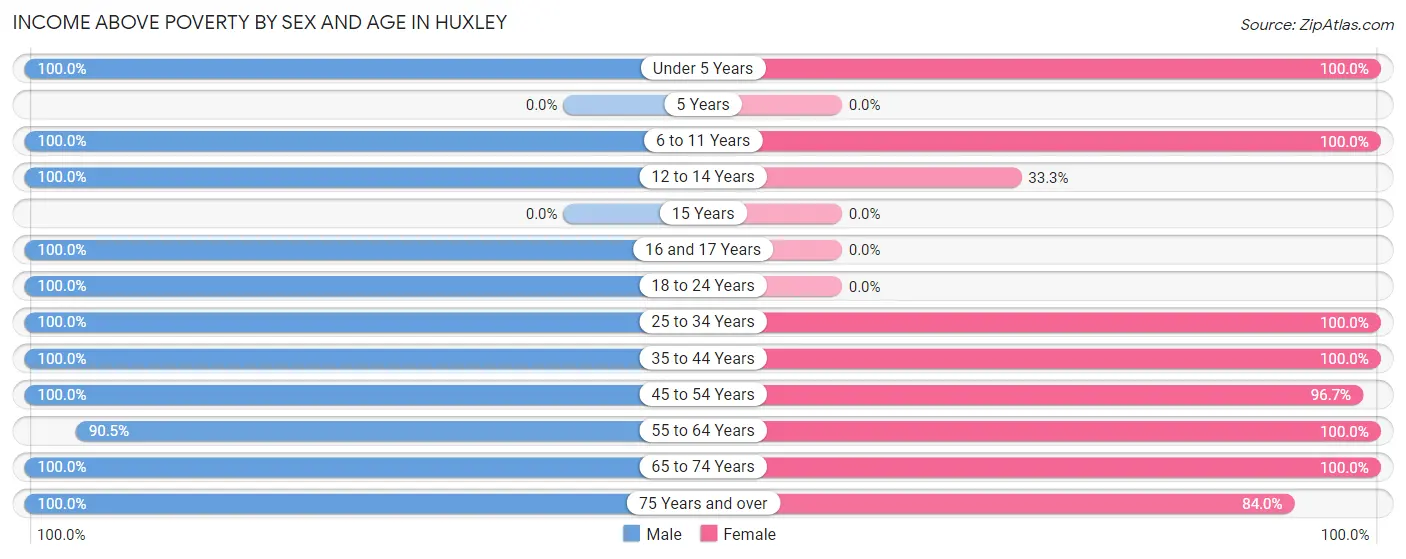
| Age Bracket | Male | Female |
| Under 5 Years | 3 (100.0%) | 20 (100.0%) |
| 5 Years | 0 (0.0%) | 0 (0.0%) |
| 6 to 11 Years | 28 (100.0%) | 4 (100.0%) |
| 12 to 14 Years | 3 (100.0%) | 5 (33.3%) |
| 15 Years | 0 (0.0%) | 0 (0.0%) |
| 16 and 17 Years | 1 (100.0%) | 0 (0.0%) |
| 18 to 24 Years | 15 (100.0%) | 0 (0.0%) |
| 25 to 34 Years | 24 (100.0%) | 18 (100.0%) |
| 35 to 44 Years | 57 (100.0%) | 20 (100.0%) |
| 45 to 54 Years | 39 (100.0%) | 59 (96.7%) |
| 55 to 64 Years | 19 (90.5%) | 57 (100.0%) |
| 65 to 74 Years | 11 (100.0%) | 9 (100.0%) |
| 75 Years and over | 22 (100.0%) | 21 (84.0%) |
| Total | 222 (99.1%) | 213 (91.4%) |
Income Below Poverty Among Married-Couple Families in Huxley
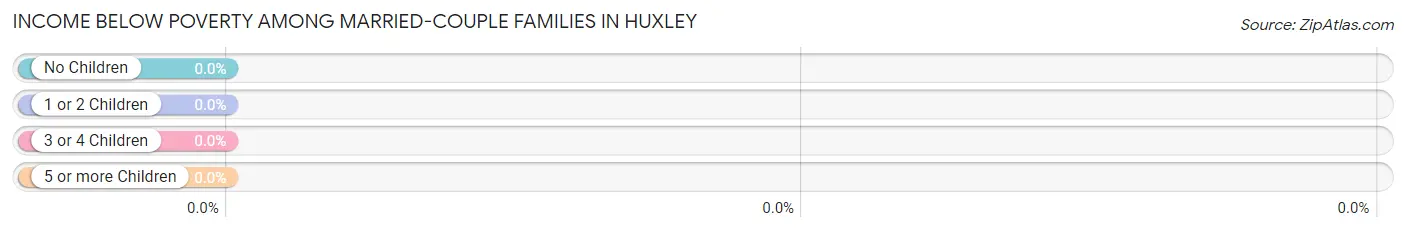
| Children | Above Poverty | Below Poverty |
| No Children | 72 (100.0%) | 0 (0.0%) |
| 1 or 2 Children | 26 (100.0%) | 0 (0.0%) |
| 3 or 4 Children | 2 (100.0%) | 0 (0.0%) |
| 5 or more Children | 0 (0.0%) | 0 (0.0%) |
| Total | 100 (100.0%) | 0 (0.0%) |
Income Below Poverty Among Single-Parent Households in Huxley

| Children | Single Father | Single Mother |
| No Children | 0 (0.0%) | 0 (0.0%) |
| 1 or 2 Children | 0 (0.0%) | 0 (0.0%) |
| 3 or 4 Children | 0 (0.0%) | 2 (100.0%) |
| 5 or more Children | 0 (0.0%) | 0 (0.0%) |
| Total | 0 (0.0%) | 2 (8.3%) |
Income Below Poverty Among Married-Couple vs Single-Parent Households in Huxley
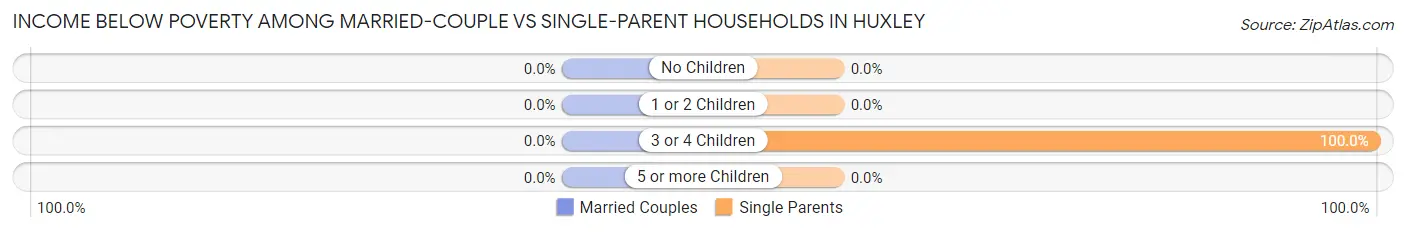
| Children | Married-Couple Families | Single-Parent Households |
| No Children | 0 (0.0%) | 0 (0.0%) |
| 1 or 2 Children | 0 (0.0%) | 0 (0.0%) |
| 3 or 4 Children | 0 (0.0%) | 2 (100.0%) |
| 5 or more Children | 0 (0.0%) | 0 (0.0%) |
| Total | 0 (0.0%) | 2 (6.7%) |
Race in Huxley
The most populous races in Huxley are White / Caucasian (453 | 99.1%), Hispanic or Latino (2 | 0.4%), and Native / Alaskan (2 | 0.4%).
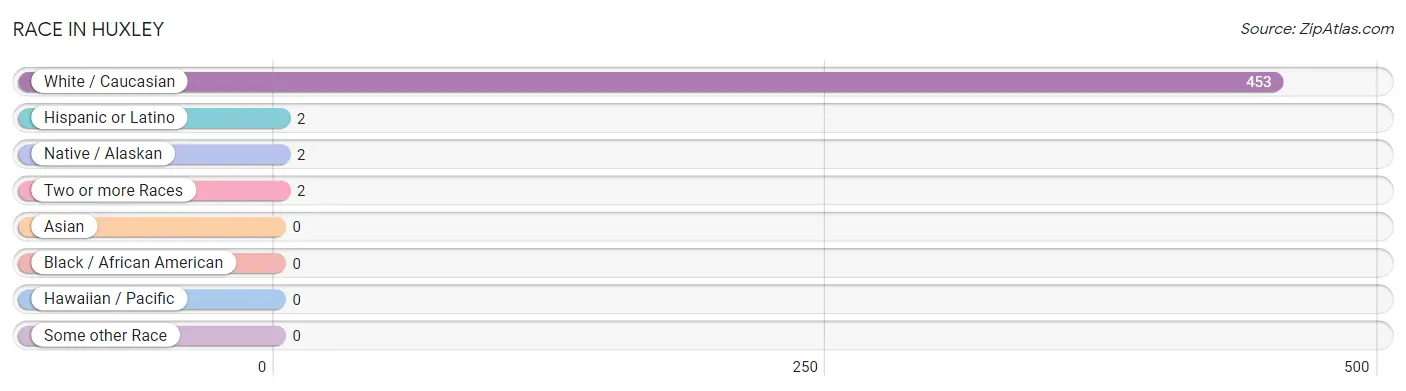
| Race | # Population | % Population |
| Asian | 0 | 0.0% |
| Black / African American | 0 | 0.0% |
| Hawaiian / Pacific | 0 | 0.0% |
| Hispanic or Latino | 2 | 0.4% |
| Native / Alaskan | 2 | 0.4% |
| White / Caucasian | 453 | 99.1% |
| Two or more Races | 2 | 0.4% |
| Some other Race | 0 | 0.0% |
| Total | 457 | 100.0% |
Ancestry in Huxley
The most populous ancestries reported in Huxley are American (189 | 41.4%), Irish (51 | 11.2%), English (43 | 9.4%), German (34 | 7.4%), and European (11 | 2.4%), together accounting for 71.8% of all Huxley residents.
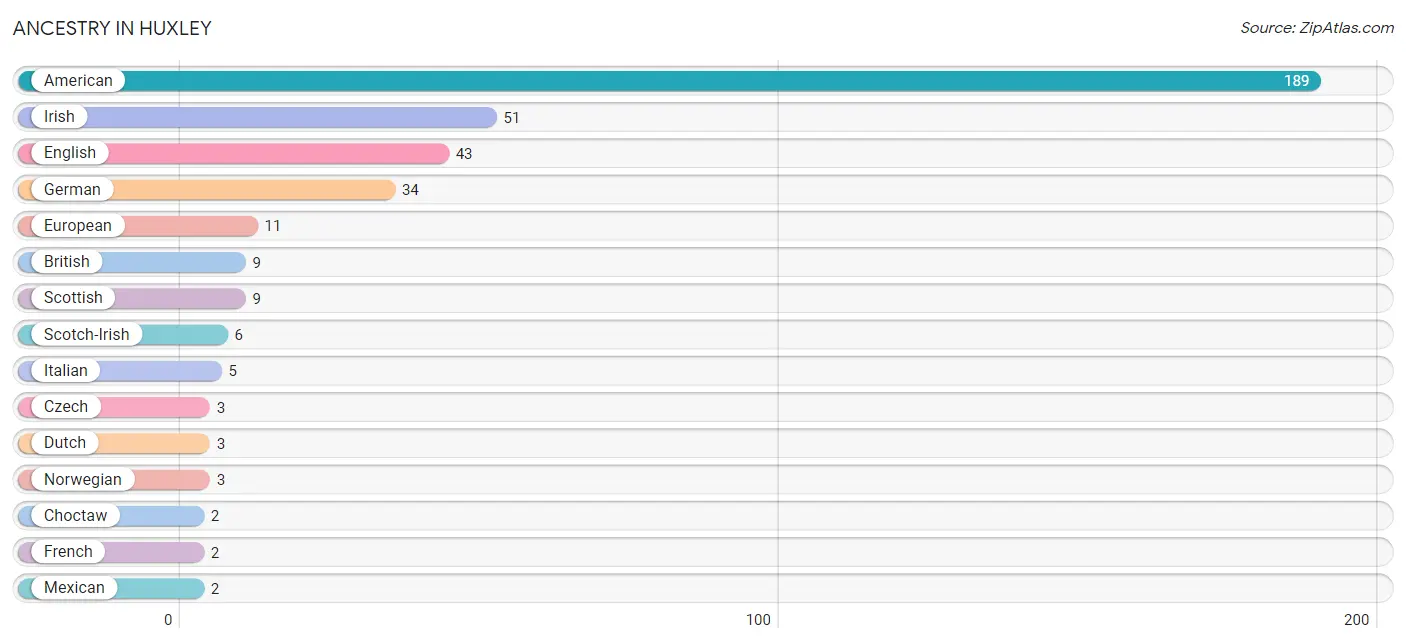
| Ancestry | # Population | % Population |
| American | 189 | 41.4% |
| British | 9 | 2.0% |
| Choctaw | 2 | 0.4% |
| Czech | 3 | 0.7% |
| Dutch | 3 | 0.7% |
| English | 43 | 9.4% |
| European | 11 | 2.4% |
| French | 2 | 0.4% |
| German | 34 | 7.4% |
| Irish | 51 | 11.2% |
| Italian | 5 | 1.1% |
| Mexican | 2 | 0.4% |
| Mexican American Indian | 2 | 0.4% |
| Norwegian | 3 | 0.7% |
| Scotch-Irish | 6 | 1.3% |
| Scottish | 9 | 2.0% | View All 16 Rows |
Immigrants in Huxley
The most numerous immigrant groups reported in Huxley came from Central America (2 | 0.4%), Latin America (2 | 0.4%), and Mexico (2 | 0.4%), together accounting for 1.3% of all Huxley residents.
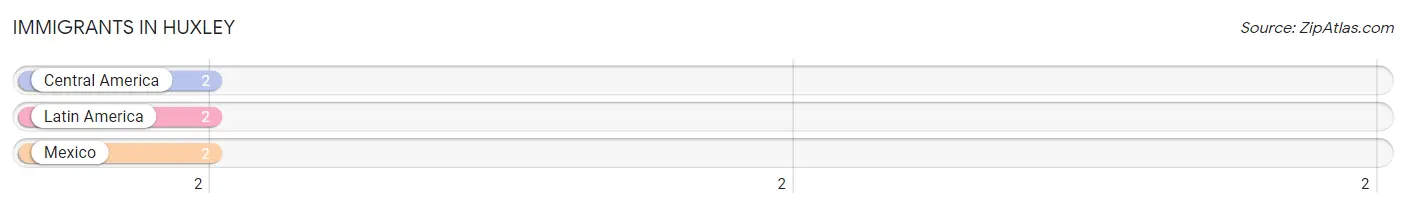
| Immigration Origin | # Population | % Population |
| Central America | 2 | 0.4% |
| Latin America | 2 | 0.4% |
| Mexico | 2 | 0.4% | View All 3 Rows |
Sex and Age in Huxley
Sex and Age in Huxley
The most populous age groups in Huxley are 40 to 44 Years (49 | 21.9%) for men and 60 to 64 Years (54 | 23.2%) for women.
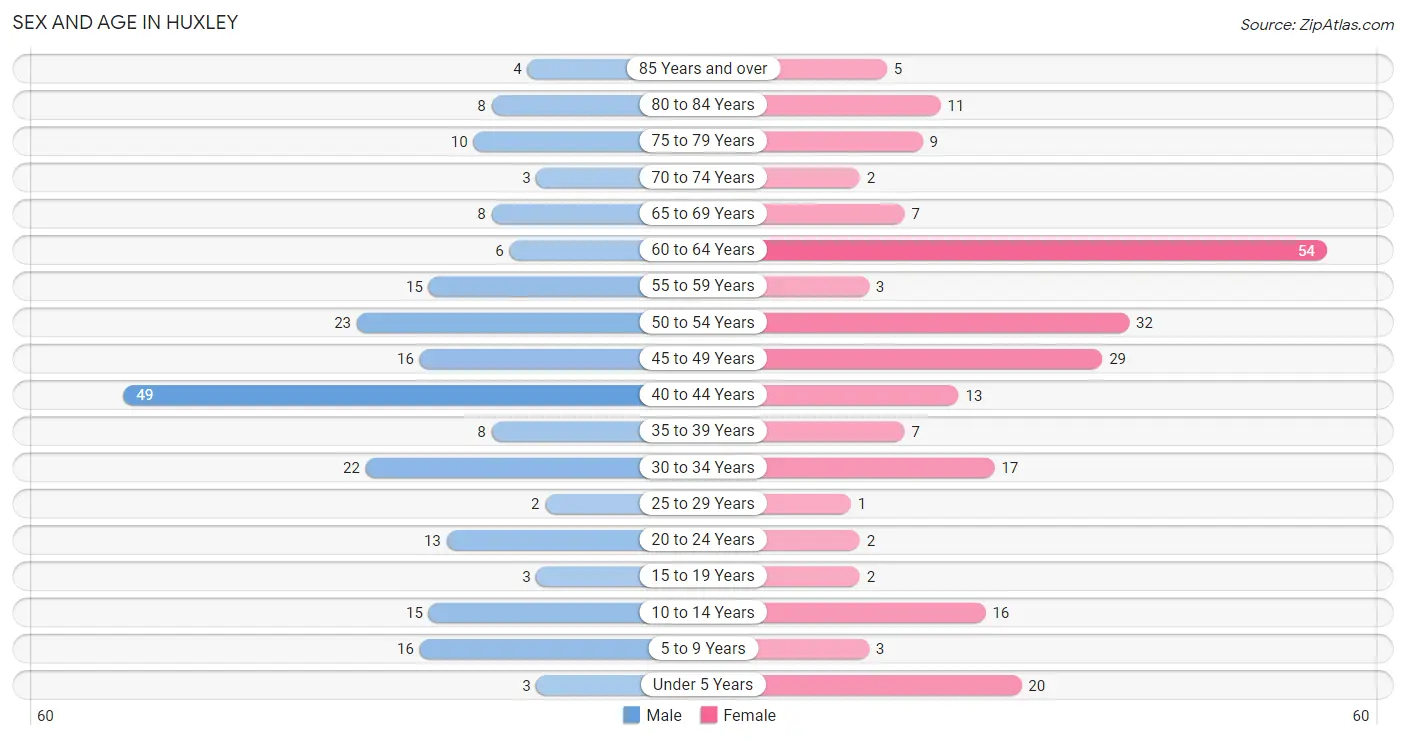
| Age Bracket | Male | Female |
| Under 5 Years | 3 (1.3%) | 20 (8.6%) |
| 5 to 9 Years | 16 (7.1%) | 3 (1.3%) |
| 10 to 14 Years | 15 (6.7%) | 16 (6.9%) |
| 15 to 19 Years | 3 (1.3%) | 2 (0.9%) |
| 20 to 24 Years | 13 (5.8%) | 2 (0.9%) |
| 25 to 29 Years | 2 (0.9%) | 1 (0.4%) |
| 30 to 34 Years | 22 (9.8%) | 17 (7.3%) |
| 35 to 39 Years | 8 (3.6%) | 7 (3.0%) |
| 40 to 44 Years | 49 (21.9%) | 13 (5.6%) |
| 45 to 49 Years | 16 (7.1%) | 29 (12.4%) |
| 50 to 54 Years | 23 (10.3%) | 32 (13.7%) |
| 55 to 59 Years | 15 (6.7%) | 3 (1.3%) |
| 60 to 64 Years | 6 (2.7%) | 54 (23.2%) |
| 65 to 69 Years | 8 (3.6%) | 7 (3.0%) |
| 70 to 74 Years | 3 (1.3%) | 2 (0.9%) |
| 75 to 79 Years | 10 (4.5%) | 9 (3.9%) |
| 80 to 84 Years | 8 (3.6%) | 11 (4.7%) |
| 85 Years and over | 4 (1.8%) | 5 (2.1%) |
| Total | 224 (100.0%) | 233 (100.0%) |
Families and Households in Huxley
Median Family Size in Huxley
The median family size in Huxley is 3.10 persons per family, with single female/mother families (24 | 18.5%) accounting for the largest median family size of 4.83 persons per family. On the other hand, married-couple families (100 | 76.9%) represent the smallest median family size with 2.70 persons per family.
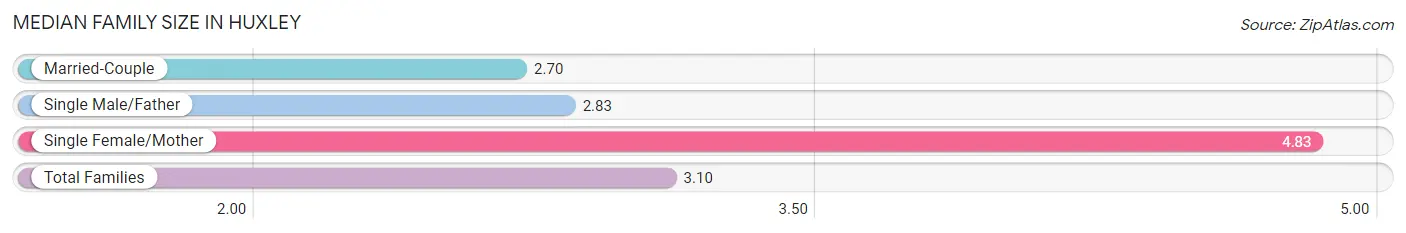
| Family Type | # Families | Family Size |
| Married-Couple | 100 (76.9%) | 2.70 |
| Single Male/Father | 6 (4.6%) | 2.83 |
| Single Female/Mother | 24 (18.5%) | 4.83 |
| Total Families | 130 (100.0%) | 3.10 |
Median Household Size in Huxley
The median household size in Huxley is 2.57 persons per household, with single female/mother households (24 | 13.5%) accounting for the largest median household size of 4.92 persons per household. non-family households (48 | 27.0%) represent the smallest median household size with 1.08 persons per household.
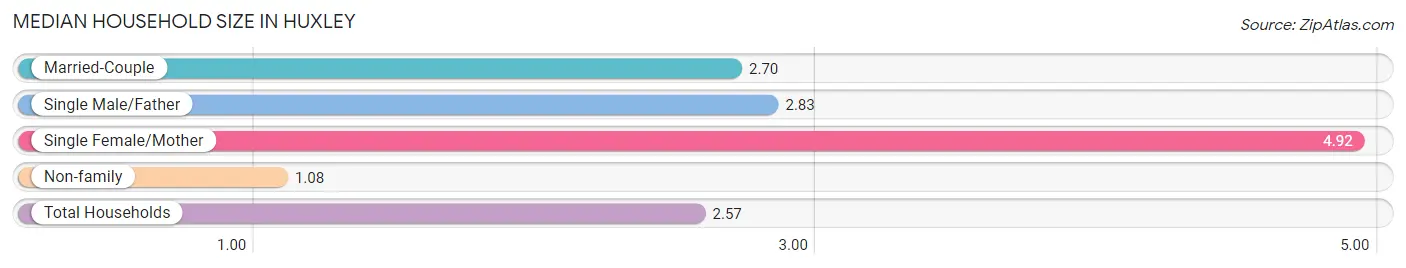
| Household Type | # Households | Household Size |
| Married-Couple | 100 (56.2%) | 2.70 |
| Single Male/Father | 6 (3.4%) | 2.83 |
| Single Female/Mother | 24 (13.5%) | 4.92 |
| Non-family | 48 (27.0%) | 1.08 |
| Total Households | 178 (100.0%) | 2.57 |
Household Size by Marriage Status in Huxley
Out of a total of 178 households in Huxley, 130 (73.0%) are family households, while 48 (27.0%) are nonfamily households. The most numerous type of family households are 2-person households, comprising 57, and the most common type of nonfamily households are 1-person households, comprising 44.
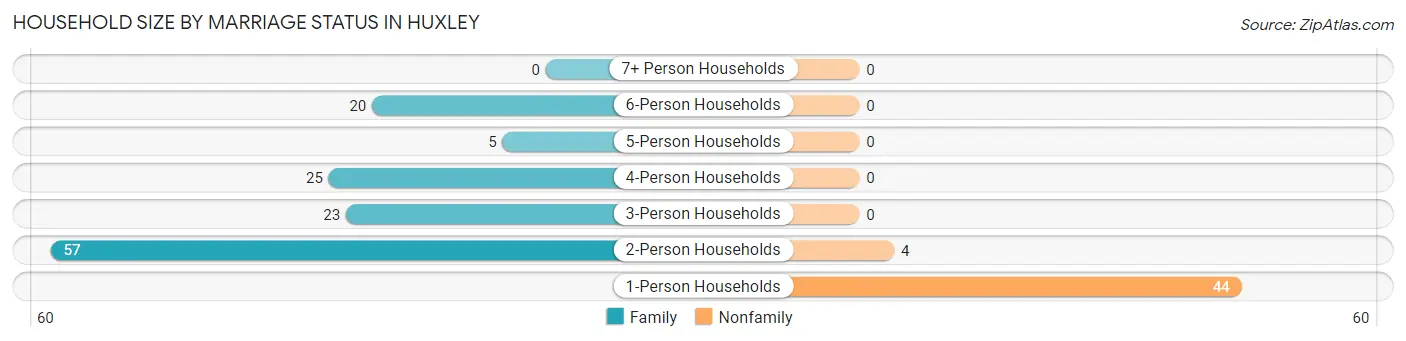
| Household Size | Family Households | Nonfamily Households |
| 1-Person Households | - | 44 (24.7%) |
| 2-Person Households | 57 (32.0%) | 4 (2.2%) |
| 3-Person Households | 23 (12.9%) | 0 (0.0%) |
| 4-Person Households | 25 (14.0%) | 0 (0.0%) |
| 5-Person Households | 5 (2.8%) | 0 (0.0%) |
| 6-Person Households | 20 (11.2%) | 0 (0.0%) |
| 7+ Person Households | 0 (0.0%) | 0 (0.0%) |
| Total | 130 (73.0%) | 48 (27.0%) |
Female Fertility in Huxley
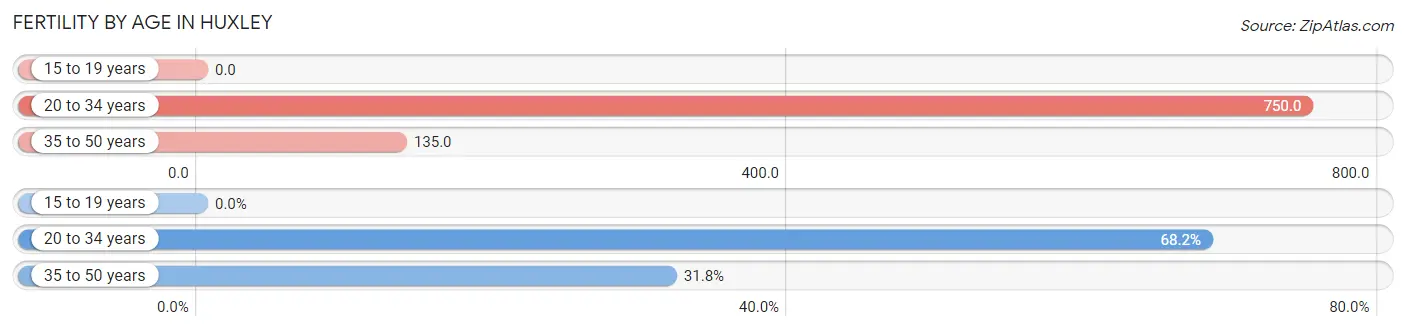
Fertility by Age in Huxley
Average fertility rate in Huxley is 297.0 births per 1,000 women. Women in the age bracket of 20 to 34 years have the highest fertility rate with 750.0 births per 1,000 women. Women in the age bracket of 20 to 34 years acount for 68.2% of all women with births.
| Age Bracket | Women with Births | Births / 1,000 Women |
| 15 to 19 years | 0 (0.0%) | 0.0 |
| 20 to 34 years | 15 (68.2%) | 750.0 |
| 35 to 50 years | 7 (31.8%) | 135.0 |
| Total | 22 (100.0%) | 297.0 |
Fertility by Age by Marriage Status in Huxley
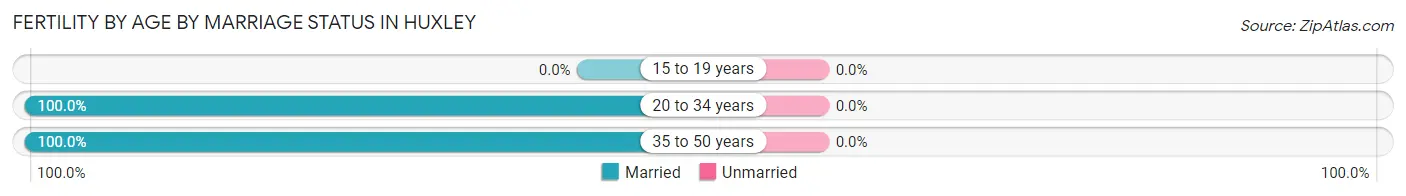
| Age Bracket | Married | Unmarried |
| 15 to 19 years | 0 (0.0%) | 0 (0.0%) |
| 20 to 34 years | 15 (100.0%) | 0 (0.0%) |
| 35 to 50 years | 7 (100.0%) | 0 (0.0%) |
| Total | 22 (100.0%) | 0 (0.0%) |
Fertility by Education in Huxley
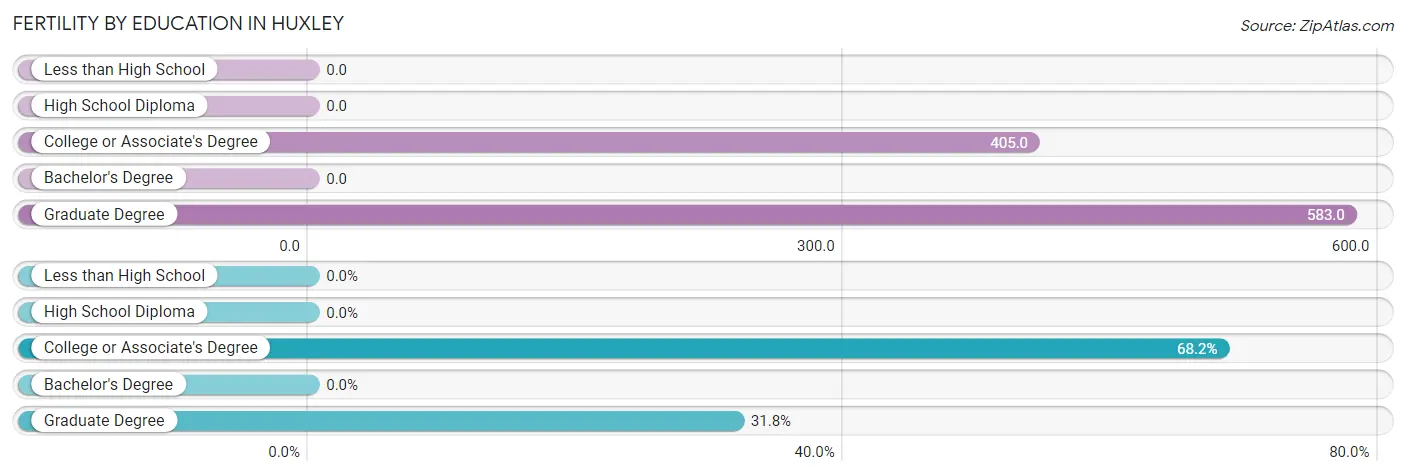
| Educational Attainment | Women with Births | Births / 1,000 Women |
| Less than High School | 0 (0.0%) | 0.0 |
| High School Diploma | 0 (0.0%) | 0.0 |
| College or Associate's Degree | 15 (68.2%) | 405.0 |
| Bachelor's Degree | 0 (0.0%) | 0.0 |
| Graduate Degree | 7 (31.8%) | 583.0 |
| Total | 22 (100.0%) | 297.0 |
Fertility by Education by Marriage Status in Huxley
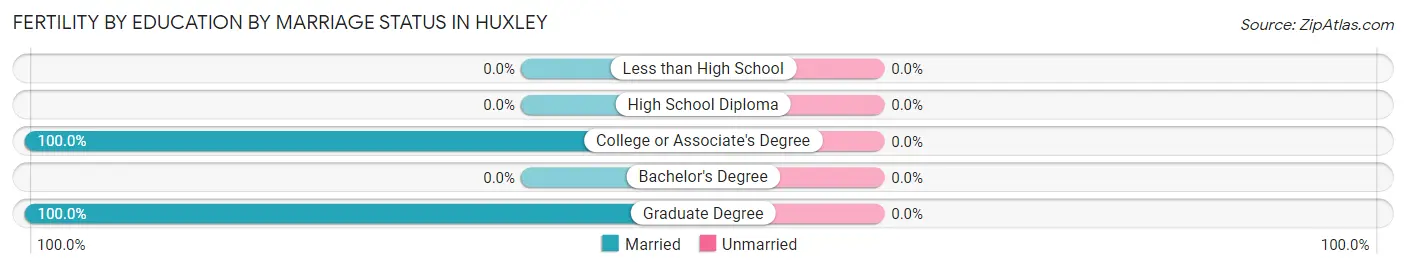
| Educational Attainment | Married | Unmarried |
| Less than High School | 0 (0.0%) | 0 (0.0%) |
| High School Diploma | 0 (0.0%) | 0 (0.0%) |
| College or Associate's Degree | 15 (100.0%) | 0 (0.0%) |
| Bachelor's Degree | 0 (0.0%) | 0 (0.0%) |
| Graduate Degree | 7 (100.0%) | 0 (0.0%) |
| Total | 22 (100.0%) | 0 (0.0%) |
Employment Characteristics in Huxley
Employment by Class of Employer in Huxley
Among the 191 employed individuals in Huxley, private company employees (135 | 70.7%), self-employed (not incorporated) (21 | 11.0%), and self-employed (incorporated) (16 | 8.4%) make up the most common classes of employment.
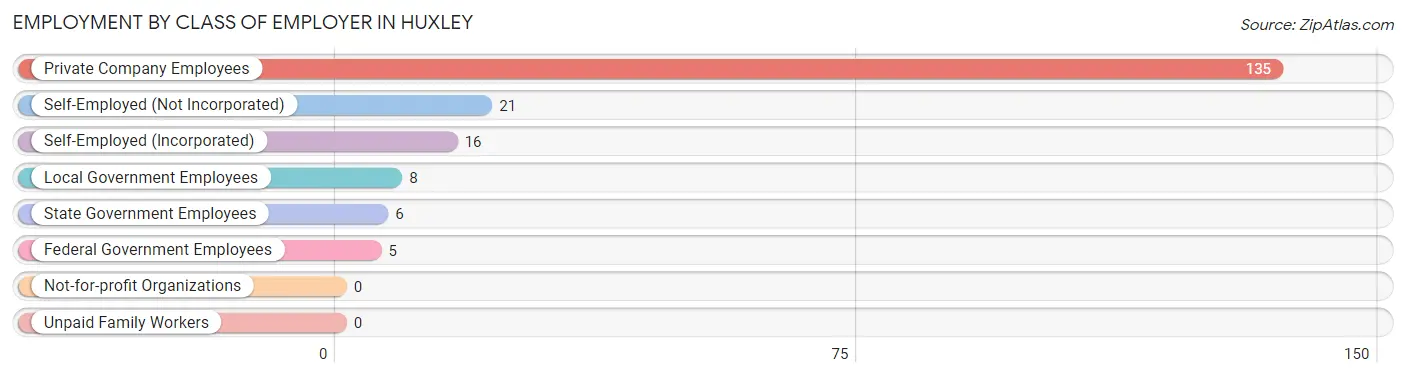
| Employer Class | # Employees | % Employees |
| Private Company Employees | 135 | 70.7% |
| Self-Employed (Incorporated) | 16 | 8.4% |
| Self-Employed (Not Incorporated) | 21 | 11.0% |
| Not-for-profit Organizations | 0 | 0.0% |
| Local Government Employees | 8 | 4.2% |
| State Government Employees | 6 | 3.1% |
| Federal Government Employees | 5 | 2.6% |
| Unpaid Family Workers | 0 | 0.0% |
| Total | 191 | 100.0% |
Employment Status by Age in Huxley
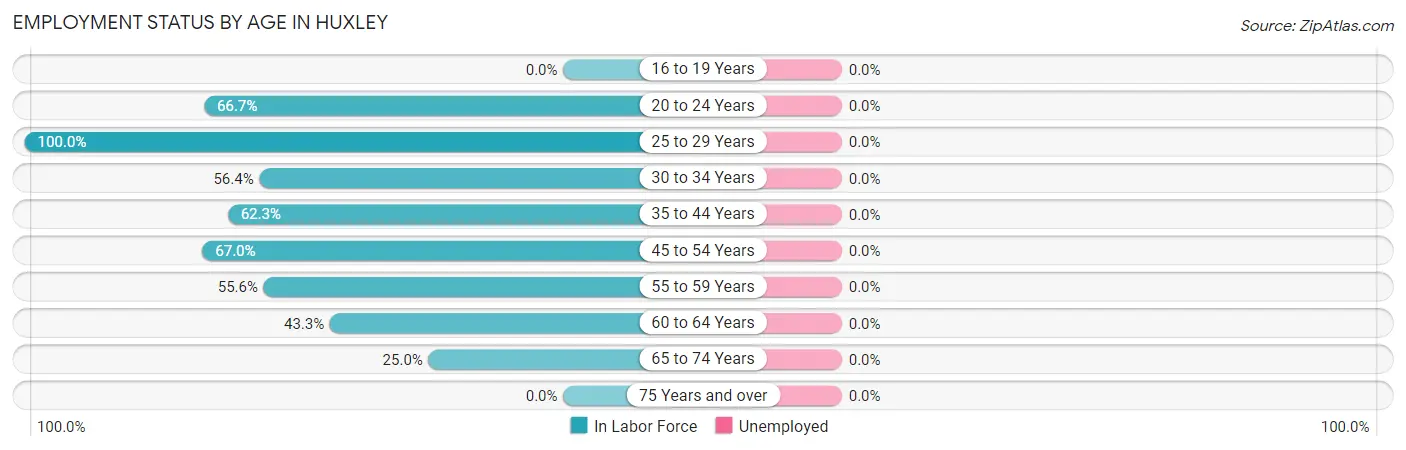
| Age Bracket | In Labor Force | Unemployed |
| 16 to 19 Years | 0 (0.0%) | 0 (0.0%) |
| 20 to 24 Years | 10 (66.7%) | 0 (0.0%) |
| 25 to 29 Years | 3 (100.0%) | 0 (0.0%) |
| 30 to 34 Years | 22 (56.4%) | 0 (0.0%) |
| 35 to 44 Years | 48 (62.3%) | 0 (0.0%) |
| 45 to 54 Years | 67 (67.0%) | 0 (0.0%) |
| 55 to 59 Years | 10 (55.6%) | 0 (0.0%) |
| 60 to 64 Years | 26 (43.3%) | 0 (0.0%) |
| 65 to 74 Years | 5 (25.0%) | 0 (0.0%) |
| 75 Years and over | 0 (0.0%) | 0 (0.0%) |
| Total | 191 (50.0%) | 0 (0.0%) |
Employment Status by Educational Attainment in Huxley
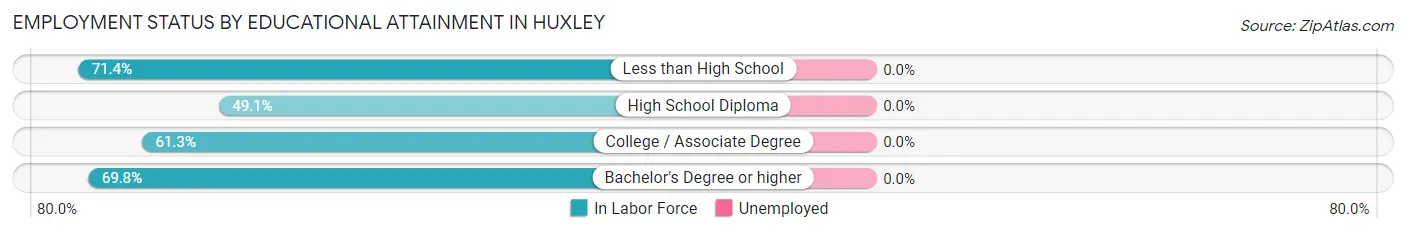
| Educational Attainment | In Labor Force | Unemployed |
| Less than High School | 20 (71.4%) | 0 (0.0%) |
| High School Diploma | 54 (49.1%) | 0 (0.0%) |
| College / Associate Degree | 65 (61.3%) | 0 (0.0%) |
| Bachelor's Degree or higher | 37 (69.8%) | 0 (0.0%) |
| Total | 176 (59.3%) | 0 (0.0%) |
Employment Occupations by Sex in Huxley
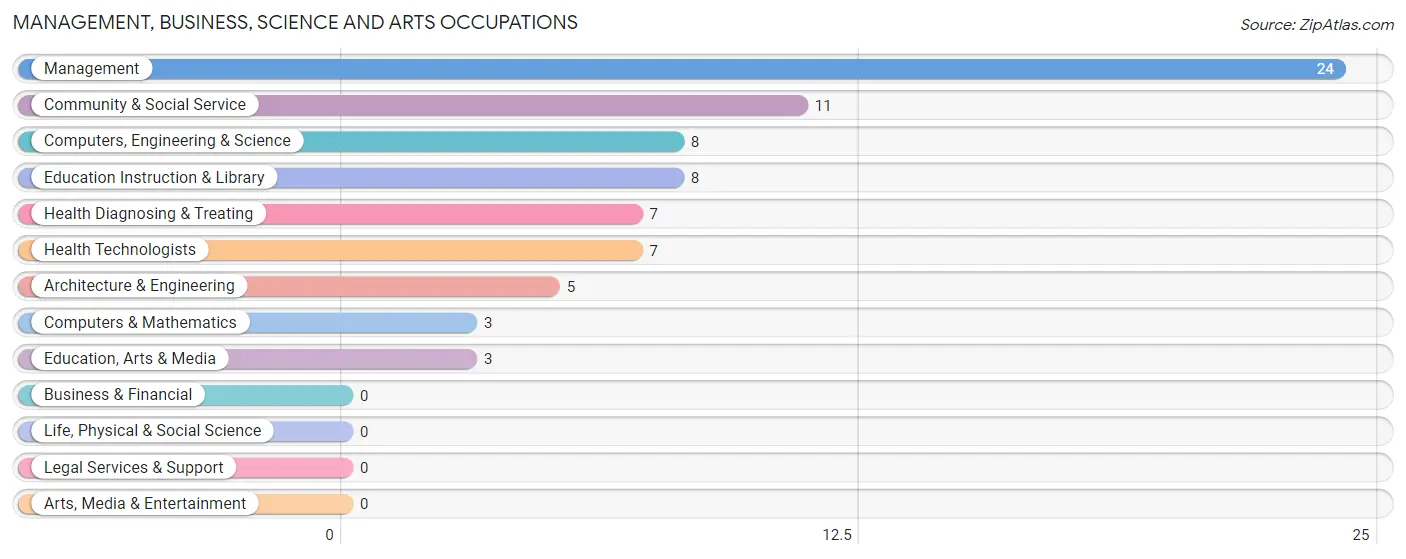
Management, Business, Science and Arts Occupations
The most common Management, Business, Science and Arts occupations in Huxley are Management (24 | 12.6%), Community & Social Service (11 | 5.8%), Computers, Engineering & Science (8 | 4.2%), Education Instruction & Library (8 | 4.2%), and Health Diagnosing & Treating (7 | 3.7%).
Management, Business, Science and Arts Occupations by Sex
Within the Management, Business, Science and Arts occupations in Huxley, the most male-oriented occupations are Architecture & Engineering (100.0%), Education, Arts & Media (100.0%), and Community & Social Service (72.7%), while the most female-oriented occupations are Computers & Mathematics (100.0%), Health Diagnosing & Treating (100.0%), and Health Technologists (100.0%).
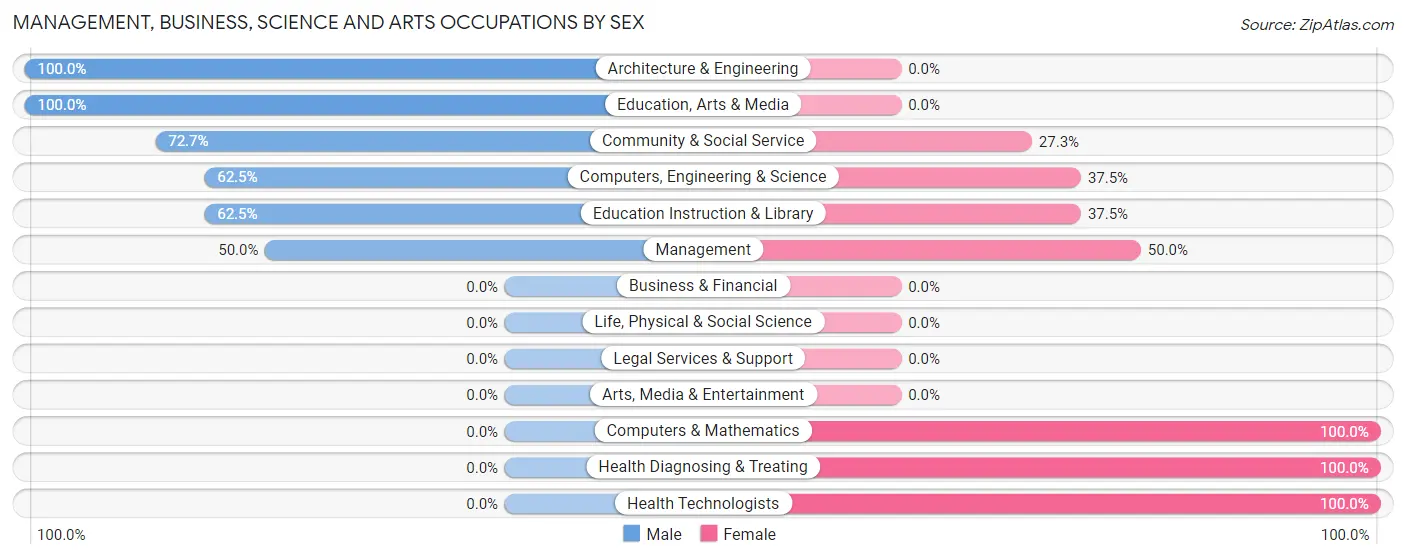
| Occupation | Male | Female |
| Management | 12 (50.0%) | 12 (50.0%) |
| Business & Financial | 0 (0.0%) | 0 (0.0%) |
| Computers, Engineering & Science | 5 (62.5%) | 3 (37.5%) |
| Computers & Mathematics | 0 (0.0%) | 3 (100.0%) |
| Architecture & Engineering | 5 (100.0%) | 0 (0.0%) |
| Life, Physical & Social Science | 0 (0.0%) | 0 (0.0%) |
| Community & Social Service | 8 (72.7%) | 3 (27.3%) |
| Education, Arts & Media | 3 (100.0%) | 0 (0.0%) |
| Legal Services & Support | 0 (0.0%) | 0 (0.0%) |
| Education Instruction & Library | 5 (62.5%) | 3 (37.5%) |
| Arts, Media & Entertainment | 0 (0.0%) | 0 (0.0%) |
| Health Diagnosing & Treating | 0 (0.0%) | 7 (100.0%) |
| Health Technologists | 0 (0.0%) | 7 (100.0%) |
| Total (Category) | 25 (50.0%) | 25 (50.0%) |
| Total (Overall) | 111 (58.1%) | 80 (41.9%) |
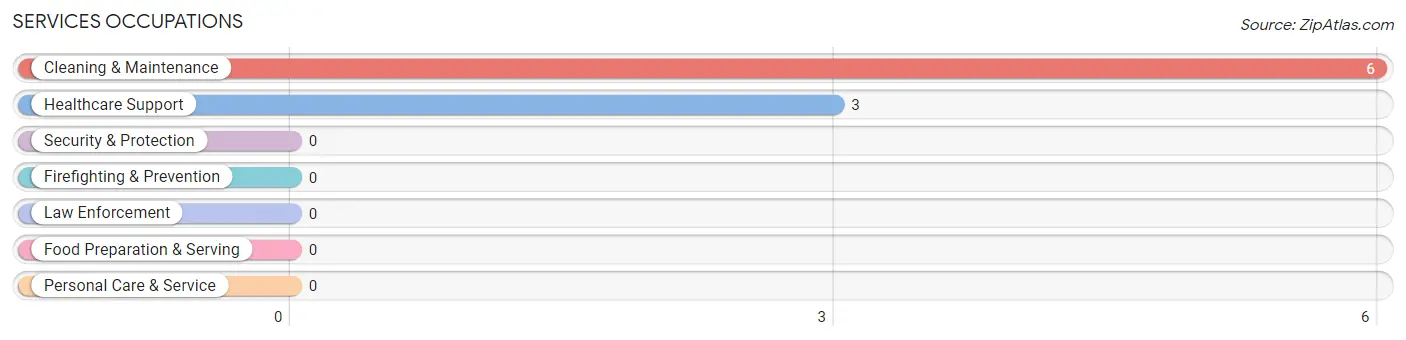
Services Occupations
The most common Services occupations in Huxley are Cleaning & Maintenance (6 | 3.1%), and Healthcare Support (3 | 1.6%).
Services Occupations by Sex
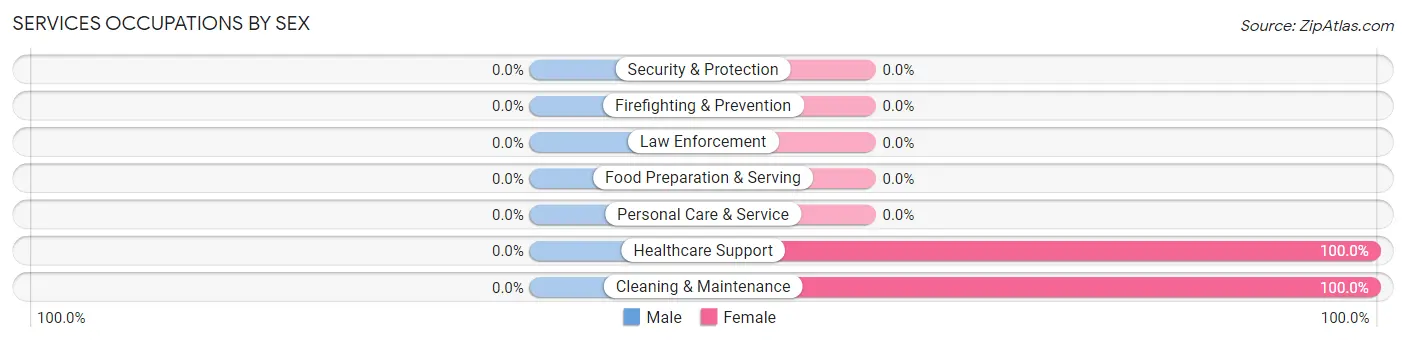
| Occupation | Male | Female |
| Healthcare Support | 0 (0.0%) | 3 (100.0%) |
| Security & Protection | 0 (0.0%) | 0 (0.0%) |
| Firefighting & Prevention | 0 (0.0%) | 0 (0.0%) |
| Law Enforcement | 0 (0.0%) | 0 (0.0%) |
| Food Preparation & Serving | 0 (0.0%) | 0 (0.0%) |
| Cleaning & Maintenance | 0 (0.0%) | 6 (100.0%) |
| Personal Care & Service | 0 (0.0%) | 0 (0.0%) |
| Total (Category) | 0 (0.0%) | 9 (100.0%) |
| Total (Overall) | 111 (58.1%) | 80 (41.9%) |
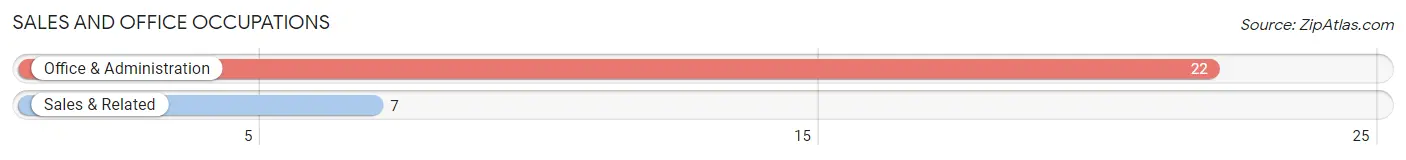
Sales and Office Occupations
The most common Sales and Office occupations in Huxley are Office & Administration (22 | 11.5%), and Sales & Related (7 | 3.7%).
Sales and Office Occupations by Sex
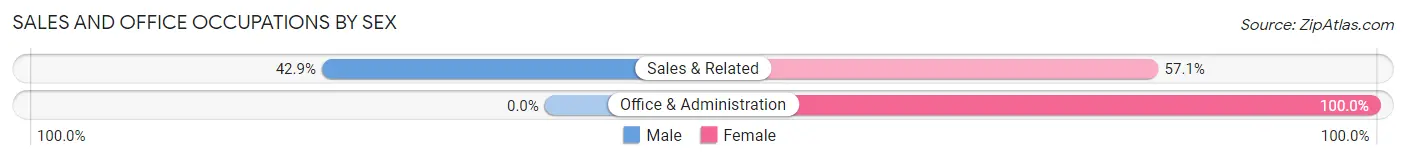
| Occupation | Male | Female |
| Sales & Related | 3 (42.9%) | 4 (57.1%) |
| Office & Administration | 0 (0.0%) | 22 (100.0%) |
| Total (Category) | 3 (10.3%) | 26 (89.7%) |
| Total (Overall) | 111 (58.1%) | 80 (41.9%) |
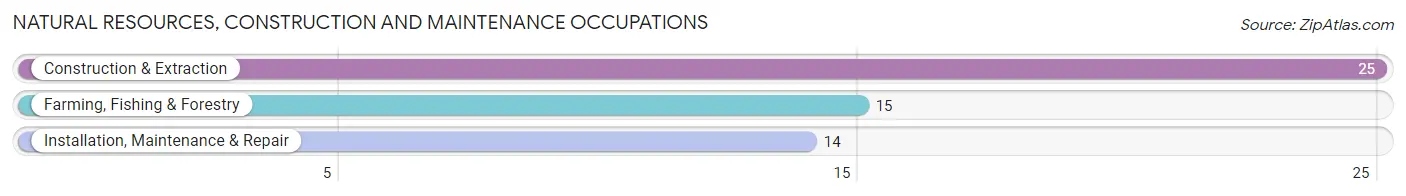
Natural Resources, Construction and Maintenance Occupations
The most common Natural Resources, Construction and Maintenance occupations in Huxley are Construction & Extraction (25 | 13.1%), Farming, Fishing & Forestry (15 | 7.9%), and Installation, Maintenance & Repair (14 | 7.3%).
Natural Resources, Construction and Maintenance Occupations by Sex
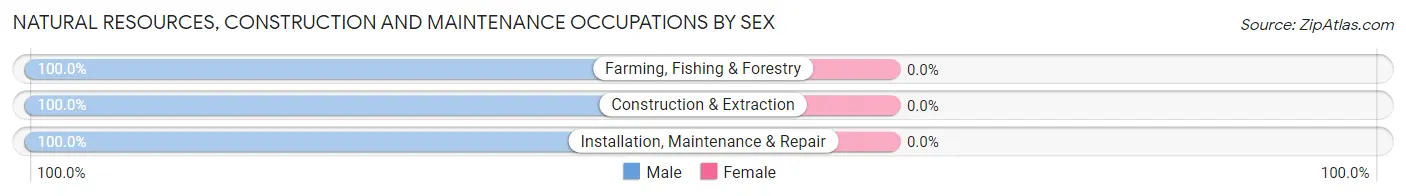
| Occupation | Male | Female |
| Farming, Fishing & Forestry | 15 (100.0%) | 0 (0.0%) |
| Construction & Extraction | 25 (100.0%) | 0 (0.0%) |
| Installation, Maintenance & Repair | 14 (100.0%) | 0 (0.0%) |
| Total (Category) | 54 (100.0%) | 0 (0.0%) |
| Total (Overall) | 111 (58.1%) | 80 (41.9%) |
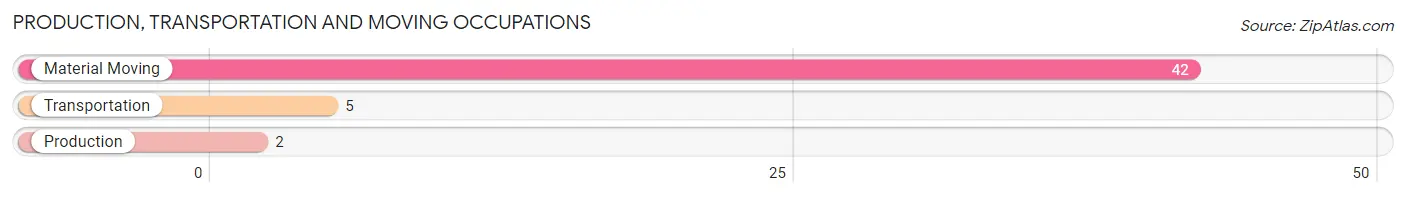
Production, Transportation and Moving Occupations
The most common Production, Transportation and Moving occupations in Huxley are Material Moving (42 | 22.0%), Transportation (5 | 2.6%), and Production (2 | 1.1%).
Production, Transportation and Moving Occupations by Sex
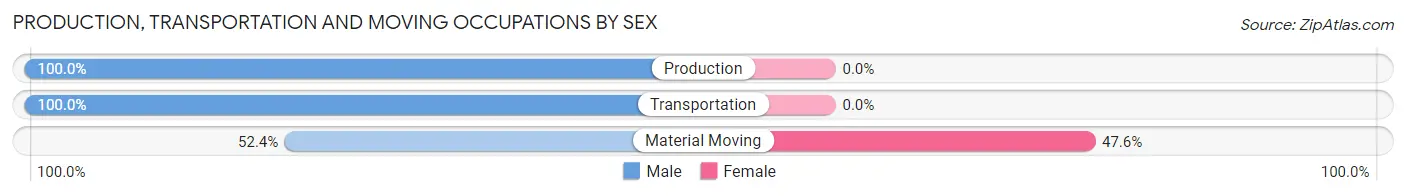
| Occupation | Male | Female |
| Production | 2 (100.0%) | 0 (0.0%) |
| Transportation | 5 (100.0%) | 0 (0.0%) |
| Material Moving | 22 (52.4%) | 20 (47.6%) |
| Total (Category) | 29 (59.2%) | 20 (40.8%) |
| Total (Overall) | 111 (58.1%) | 80 (41.9%) |
Employment Industries by Sex in Huxley
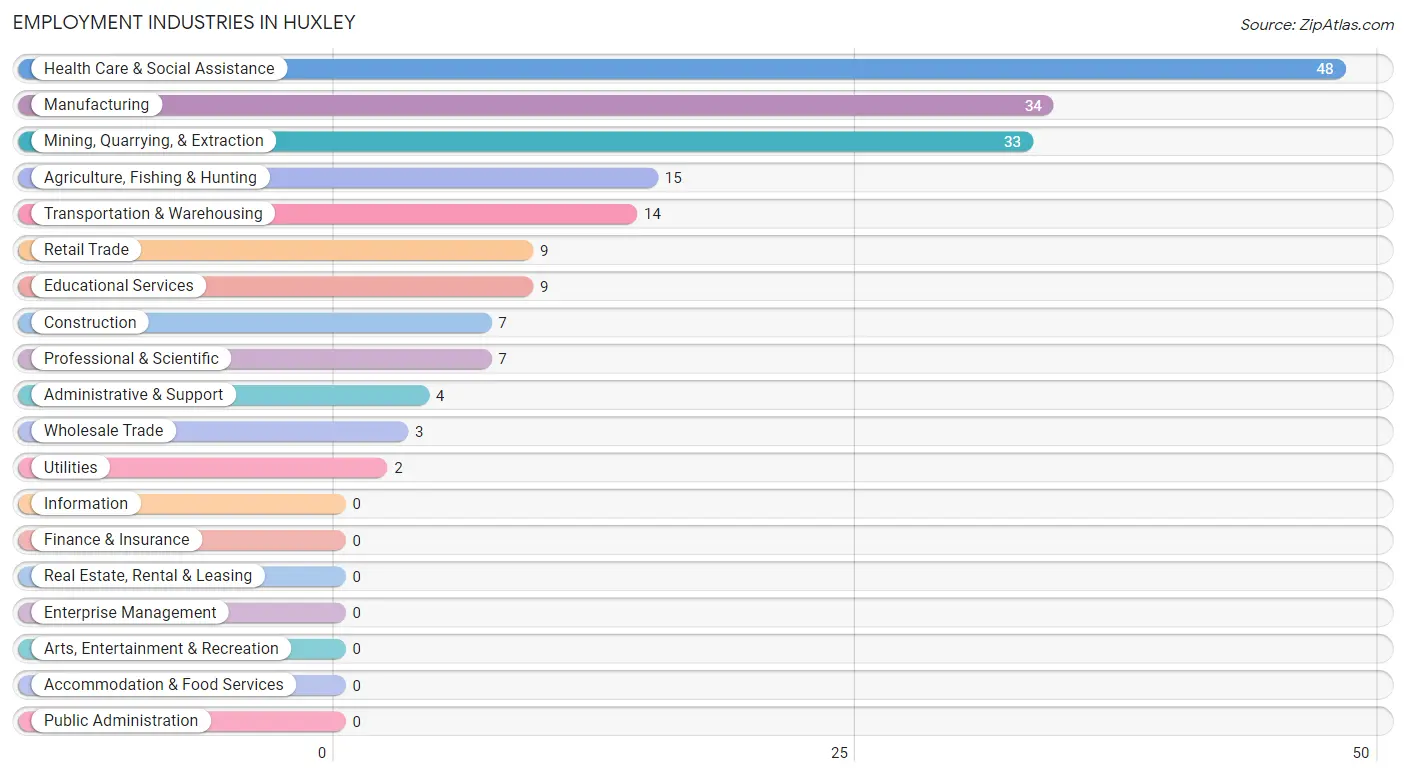
Employment Industries in Huxley
The major employment industries in Huxley include Health Care & Social Assistance (48 | 25.1%), Manufacturing (34 | 17.8%), Mining, Quarrying, & Extraction (33 | 17.3%), Agriculture, Fishing & Hunting (15 | 7.9%), and Transportation & Warehousing (14 | 7.3%).
Employment Industries by Sex in Huxley
The Huxley industries that see more men than women are Agriculture, Fishing & Hunting (100.0%), Construction (100.0%), and Manufacturing (100.0%), whereas the industries that tend to have a higher number of women are Wholesale Trade (100.0%), Administrative & Support (100.0%), and Health Care & Social Assistance (100.0%).
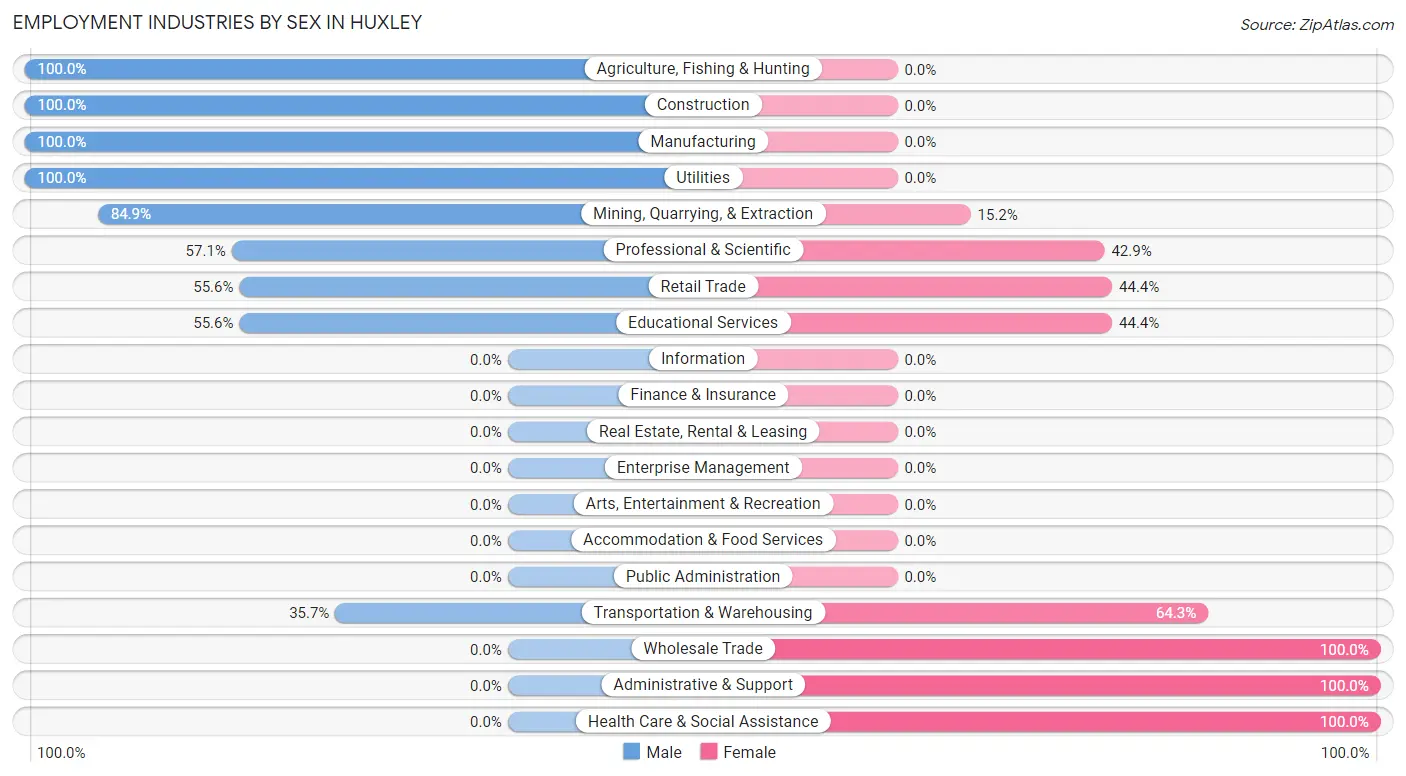
| Industry | Male | Female |
| Agriculture, Fishing & Hunting | 15 (100.0%) | 0 (0.0%) |
| Mining, Quarrying, & Extraction | 28 (84.9%) | 5 (15.1%) |
| Construction | 7 (100.0%) | 0 (0.0%) |
| Manufacturing | 34 (100.0%) | 0 (0.0%) |
| Wholesale Trade | 0 (0.0%) | 3 (100.0%) |
| Retail Trade | 5 (55.6%) | 4 (44.4%) |
| Transportation & Warehousing | 5 (35.7%) | 9 (64.3%) |
| Utilities | 2 (100.0%) | 0 (0.0%) |
| Information | 0 (0.0%) | 0 (0.0%) |
| Finance & Insurance | 0 (0.0%) | 0 (0.0%) |
| Real Estate, Rental & Leasing | 0 (0.0%) | 0 (0.0%) |
| Professional & Scientific | 4 (57.1%) | 3 (42.9%) |
| Enterprise Management | 0 (0.0%) | 0 (0.0%) |
| Administrative & Support | 0 (0.0%) | 4 (100.0%) |
| Educational Services | 5 (55.6%) | 4 (44.4%) |
| Health Care & Social Assistance | 0 (0.0%) | 48 (100.0%) |
| Arts, Entertainment & Recreation | 0 (0.0%) | 0 (0.0%) |
| Accommodation & Food Services | 0 (0.0%) | 0 (0.0%) |
| Public Administration | 0 (0.0%) | 0 (0.0%) |
| Total | 111 (58.1%) | 80 (41.9%) |
Education in Huxley
School Enrollment in Huxley
The most common levels of schooling among the 61 students in Huxley are elementary school (25 | 41.0%), middle school (21 | 34.4%), and graduate / professional (7 | 11.5%).
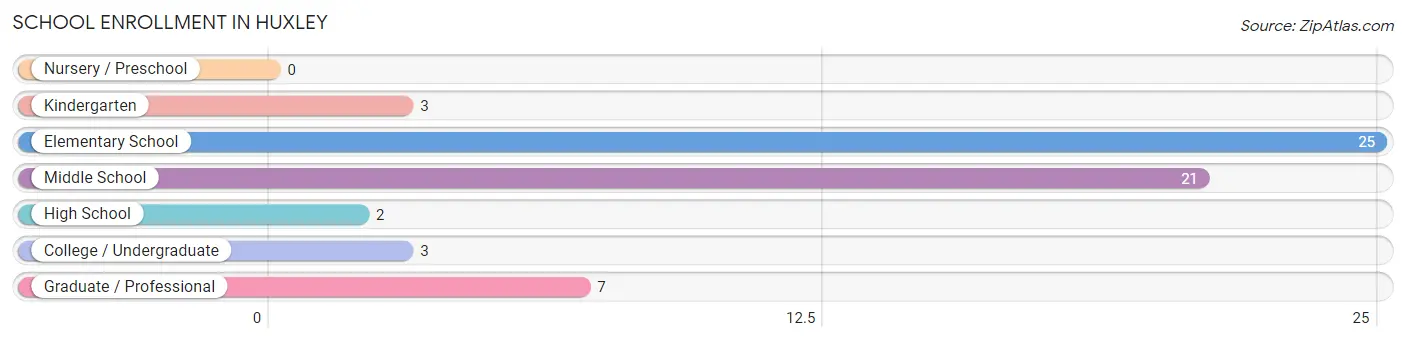
| School Level | # Students | % Students |
| Nursery / Preschool | 0 | 0.0% |
| Kindergarten | 3 | 4.9% |
| Elementary School | 25 | 41.0% |
| Middle School | 21 | 34.4% |
| High School | 2 | 3.3% |
| College / Undergraduate | 3 | 4.9% |
| Graduate / Professional | 7 | 11.5% |
| Total | 61 | 100.0% |
School Enrollment by Age by Funding Source in Huxley
Out of a total of 61 students who are enrolled in schools in Huxley, 7 (11.5%) attend a private institution, while the remaining 54 (88.5%) are enrolled in public schools. The age group of 20 to 24 year olds has the highest likelihood of being enrolled in private schools, with 2 (100.0% in the age bracket) enrolled. Conversely, the age group of 5 to 9 year old has the lowest likelihood of being enrolled in a private school, with 19 (100.0% in the age bracket) attending a public institution.
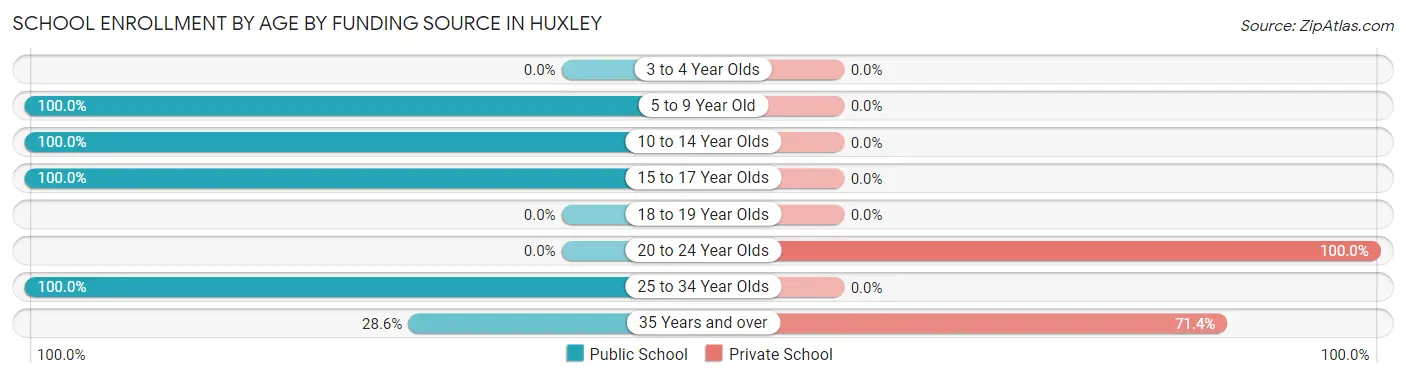
| Age Bracket | Public School | Private School |
| 3 to 4 Year Olds | 0 (0.0%) | 0 (0.0%) |
| 5 to 9 Year Old | 19 (100.0%) | 0 (0.0%) |
| 10 to 14 Year Olds | 30 (100.0%) | 0 (0.0%) |
| 15 to 17 Year Olds | 2 (100.0%) | 0 (0.0%) |
| 18 to 19 Year Olds | 0 (0.0%) | 0 (0.0%) |
| 20 to 24 Year Olds | 0 (0.0%) | 2 (100.0%) |
| 25 to 34 Year Olds | 1 (100.0%) | 0 (0.0%) |
| 35 Years and over | 2 (28.6%) | 5 (71.4%) |
| Total | 54 (88.5%) | 7 (11.5%) |
Educational Attainment by Field of Study in Huxley
Education (22 | 32.8%), bio, nature & agricultural (12 | 17.9%), science & technology (8 | 11.9%), arts & humanities (8 | 11.9%), and computers & mathematics (6 | 9.0%) are the most common fields of study among 67 individuals in Huxley who have obtained a bachelor's degree or higher.
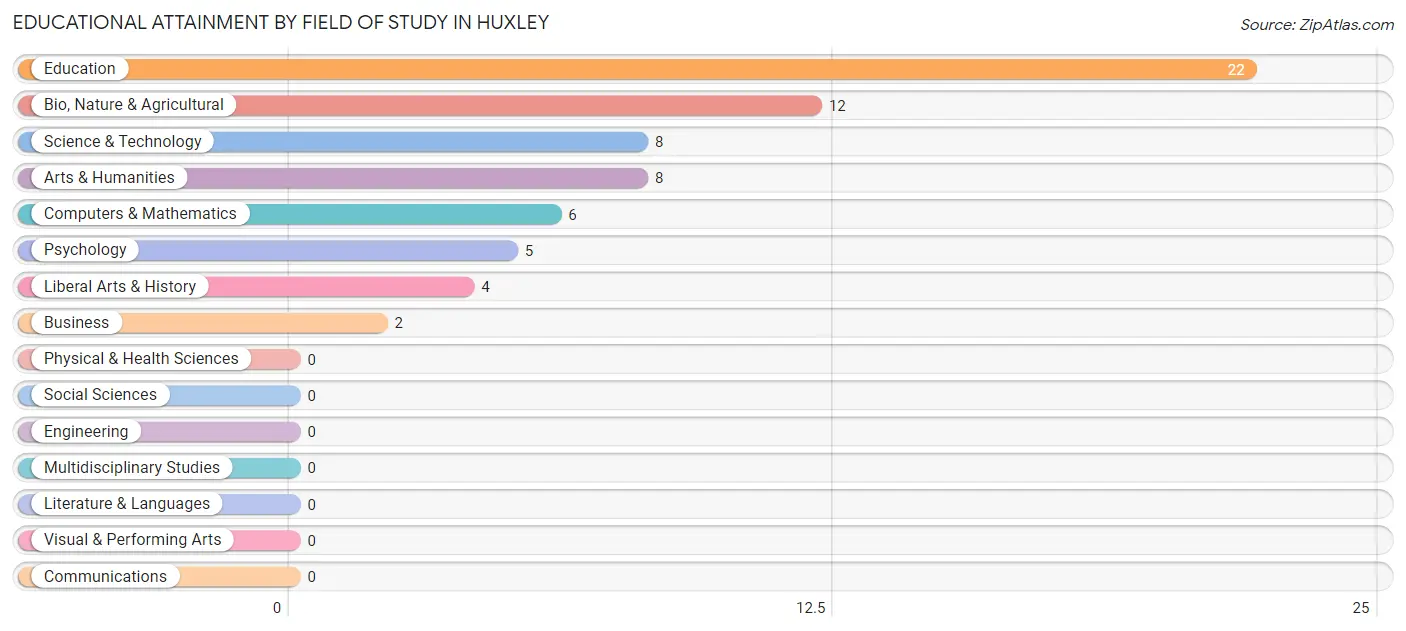
| Field of Study | # Graduates | % Graduates |
| Computers & Mathematics | 6 | 9.0% |
| Bio, Nature & Agricultural | 12 | 17.9% |
| Physical & Health Sciences | 0 | 0.0% |
| Psychology | 5 | 7.5% |
| Social Sciences | 0 | 0.0% |
| Engineering | 0 | 0.0% |
| Multidisciplinary Studies | 0 | 0.0% |
| Science & Technology | 8 | 11.9% |
| Business | 2 | 3.0% |
| Education | 22 | 32.8% |
| Literature & Languages | 0 | 0.0% |
| Liberal Arts & History | 4 | 6.0% |
| Visual & Performing Arts | 0 | 0.0% |
| Communications | 0 | 0.0% |
| Arts & Humanities | 8 | 11.9% |
| Total | 67 | 100.0% |
Transportation & Commute in Huxley
Vehicle Availability by Sex in Huxley
The most prevalent vehicle ownership categories in Huxley are males with 1 vehicle (32, accounting for 28.8%) and females with 1 vehicle (33, making up 40.0%).
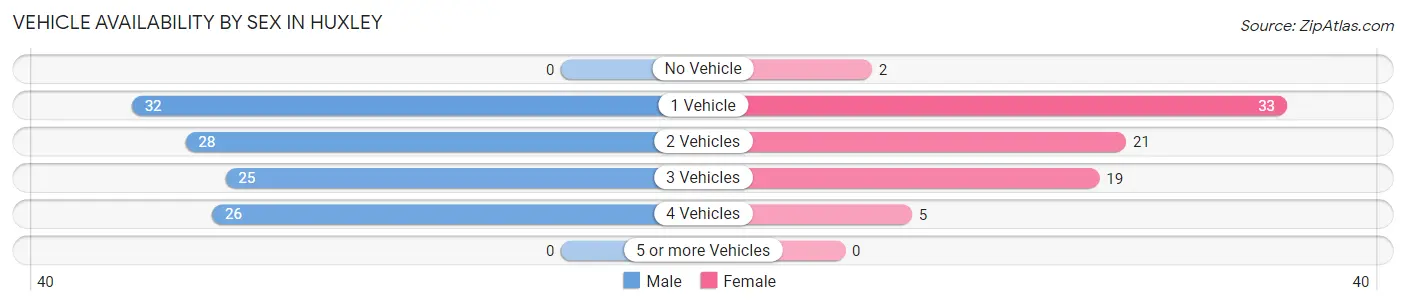
| Vehicles Available | Male | Female |
| No Vehicle | 0 (0.0%) | 2 (2.5%) |
| 1 Vehicle | 32 (28.8%) | 33 (41.2%) |
| 2 Vehicles | 28 (25.2%) | 21 (26.3%) |
| 3 Vehicles | 25 (22.5%) | 19 (23.7%) |
| 4 Vehicles | 26 (23.4%) | 5 (6.2%) |
| 5 or more Vehicles | 0 (0.0%) | 0 (0.0%) |
| Total | 111 (100.0%) | 80 (100.0%) |
Commute Time in Huxley
The most frequently occuring commute durations in Huxley are 45 to 59 minutes (50 commuters, 28.7%), 30 to 34 minutes (47 commuters, 27.0%), and 25 to 29 minutes (16 commuters, 9.2%).
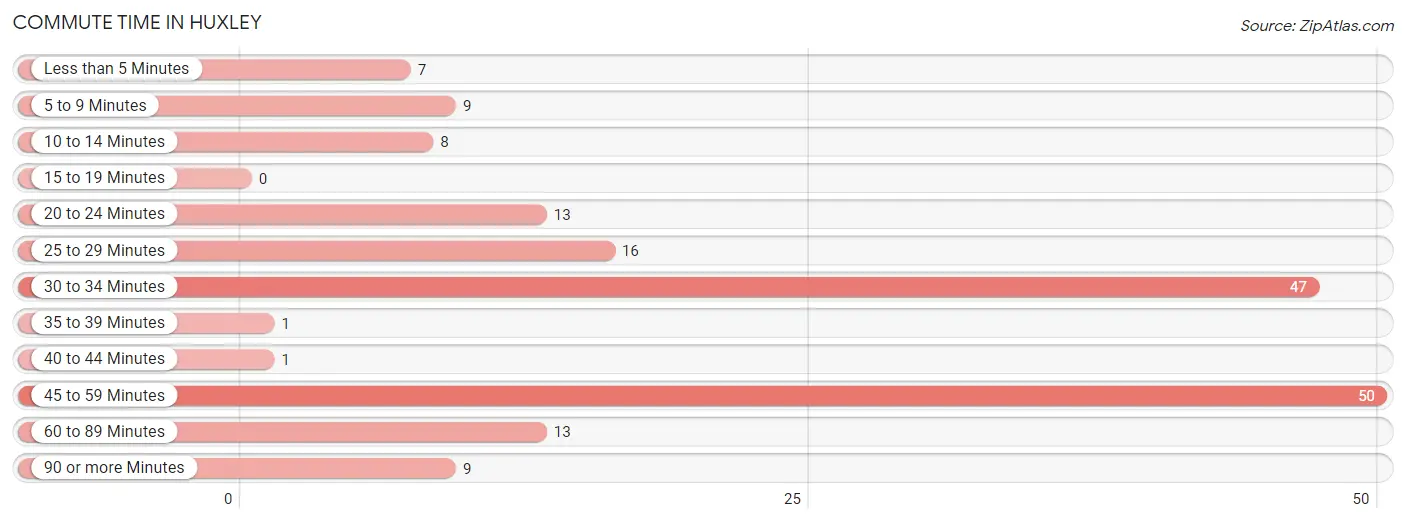
| Commute Time | # Commuters | % Commuters |
| Less than 5 Minutes | 7 | 4.0% |
| 5 to 9 Minutes | 9 | 5.2% |
| 10 to 14 Minutes | 8 | 4.6% |
| 15 to 19 Minutes | 0 | 0.0% |
| 20 to 24 Minutes | 13 | 7.5% |
| 25 to 29 Minutes | 16 | 9.2% |
| 30 to 34 Minutes | 47 | 27.0% |
| 35 to 39 Minutes | 1 | 0.6% |
| 40 to 44 Minutes | 1 | 0.6% |
| 45 to 59 Minutes | 50 | 28.7% |
| 60 to 89 Minutes | 13 | 7.5% |
| 90 or more Minutes | 9 | 5.2% |
Commute Time by Sex in Huxley
The most common commute times in Huxley are 45 to 59 minutes (30 commuters, 28.0%) for males and 30 to 34 minutes (25 commuters, 37.3%) for females.
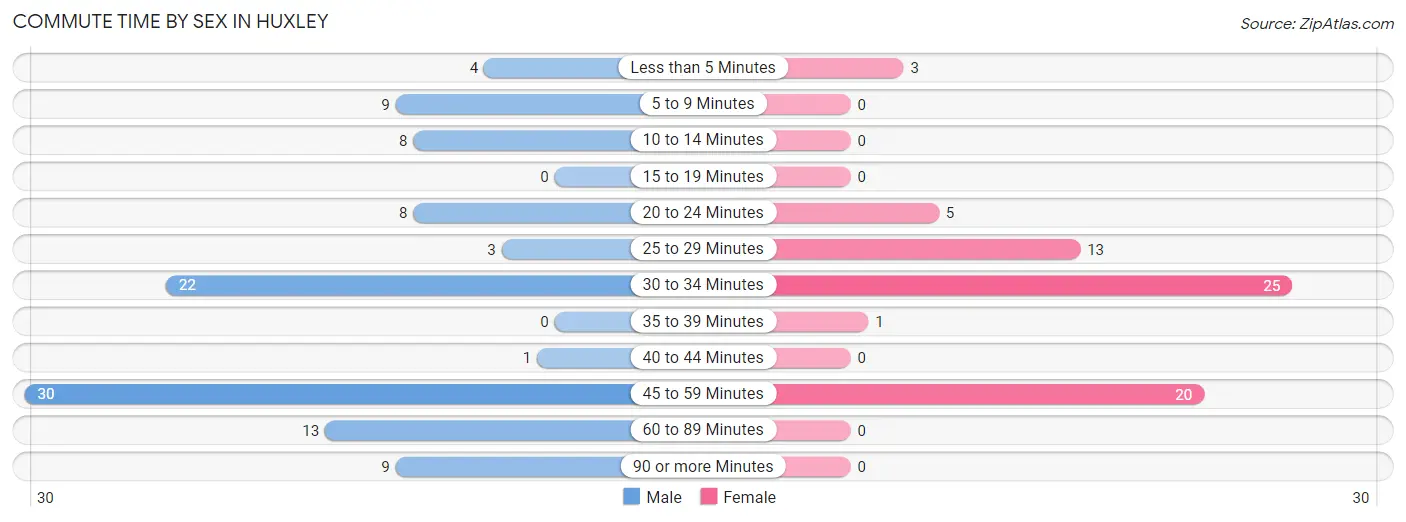
| Commute Time | Male | Female |
| Less than 5 Minutes | 4 (3.7%) | 3 (4.5%) |
| 5 to 9 Minutes | 9 (8.4%) | 0 (0.0%) |
| 10 to 14 Minutes | 8 (7.5%) | 0 (0.0%) |
| 15 to 19 Minutes | 0 (0.0%) | 0 (0.0%) |
| 20 to 24 Minutes | 8 (7.5%) | 5 (7.5%) |
| 25 to 29 Minutes | 3 (2.8%) | 13 (19.4%) |
| 30 to 34 Minutes | 22 (20.6%) | 25 (37.3%) |
| 35 to 39 Minutes | 0 (0.0%) | 1 (1.5%) |
| 40 to 44 Minutes | 1 (0.9%) | 0 (0.0%) |
| 45 to 59 Minutes | 30 (28.0%) | 20 (29.8%) |
| 60 to 89 Minutes | 13 (12.1%) | 0 (0.0%) |
| 90 or more Minutes | 9 (8.4%) | 0 (0.0%) |
Time of Departure to Work by Sex in Huxley
The most frequent times of departure to work in Huxley are 6:00 AM to 6:29 AM (40, 37.4%) for males and 6:00 AM to 6:29 AM (26, 38.8%) for females.
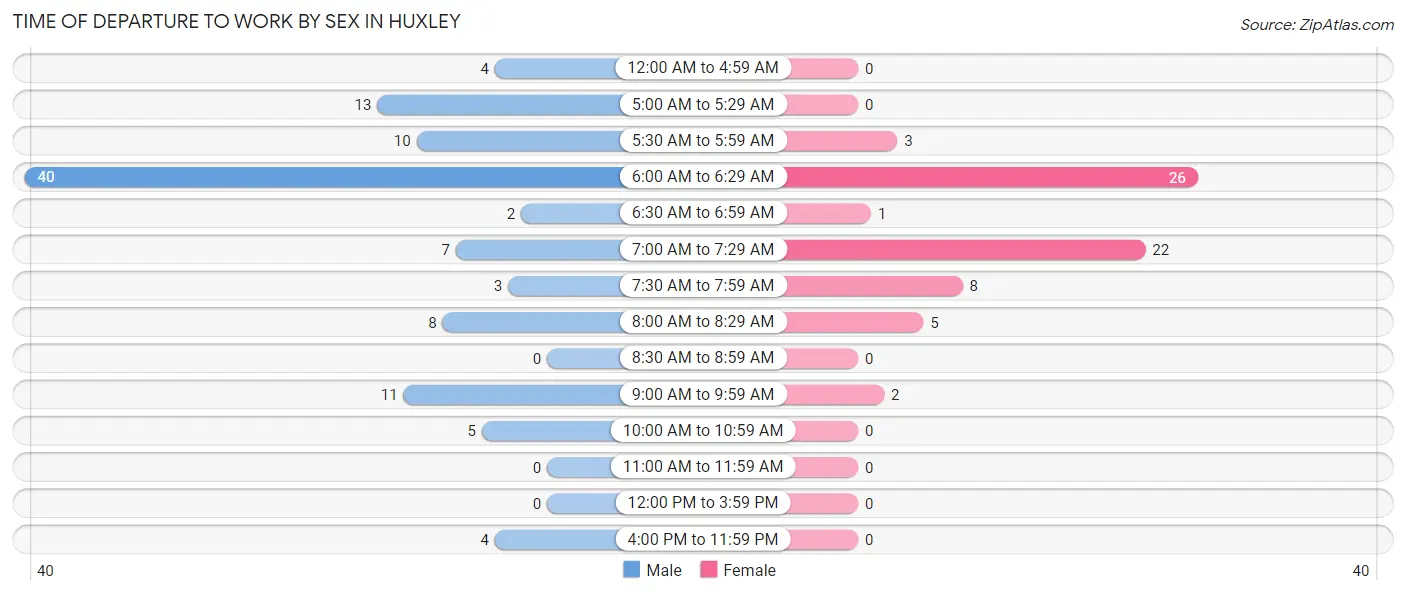
| Time of Departure | Male | Female |
| 12:00 AM to 4:59 AM | 4 (3.7%) | 0 (0.0%) |
| 5:00 AM to 5:29 AM | 13 (12.1%) | 0 (0.0%) |
| 5:30 AM to 5:59 AM | 10 (9.3%) | 3 (4.5%) |
| 6:00 AM to 6:29 AM | 40 (37.4%) | 26 (38.8%) |
| 6:30 AM to 6:59 AM | 2 (1.9%) | 1 (1.5%) |
| 7:00 AM to 7:29 AM | 7 (6.5%) | 22 (32.8%) |
| 7:30 AM to 7:59 AM | 3 (2.8%) | 8 (11.9%) |
| 8:00 AM to 8:29 AM | 8 (7.5%) | 5 (7.5%) |
| 8:30 AM to 8:59 AM | 0 (0.0%) | 0 (0.0%) |
| 9:00 AM to 9:59 AM | 11 (10.3%) | 2 (3.0%) |
| 10:00 AM to 10:59 AM | 5 (4.7%) | 0 (0.0%) |
| 11:00 AM to 11:59 AM | 0 (0.0%) | 0 (0.0%) |
| 12:00 PM to 3:59 PM | 0 (0.0%) | 0 (0.0%) |
| 4:00 PM to 11:59 PM | 4 (3.7%) | 0 (0.0%) |
| Total | 107 (100.0%) | 67 (100.0%) |
Housing Occupancy in Huxley
Occupancy by Ownership in Huxley
Of the total 178 dwellings in Huxley, owner-occupied units account for 176 (98.9%), while renter-occupied units make up 2 (1.1%).
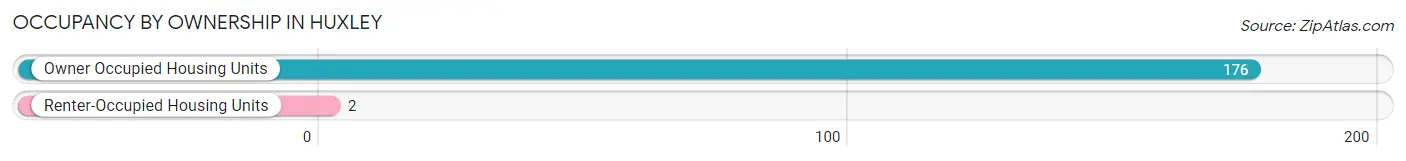
| Occupancy | # Housing Units | % Housing Units |
| Owner Occupied Housing Units | 176 | 98.9% |
| Renter-Occupied Housing Units | 2 | 1.1% |
| Total Occupied Housing Units | 178 | 100.0% |
Occupancy by Household Size in Huxley
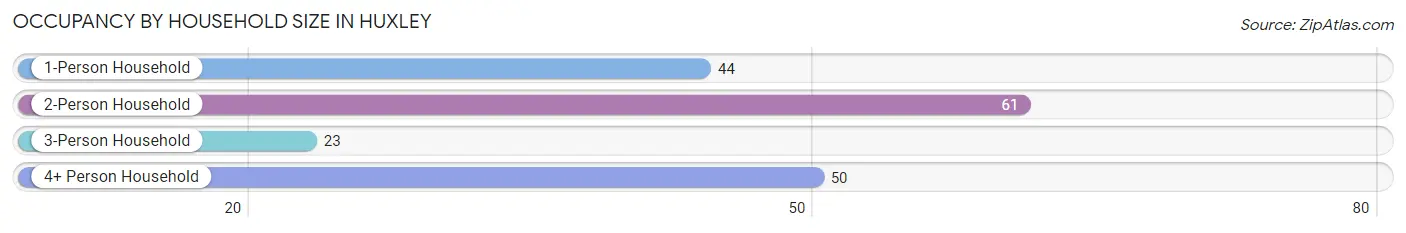
| Household Size | # Housing Units | % Housing Units |
| 1-Person Household | 44 | 24.7% |
| 2-Person Household | 61 | 34.3% |
| 3-Person Household | 23 | 12.9% |
| 4+ Person Household | 50 | 28.1% |
| Total Housing Units | 178 | 100.0% |
Occupancy by Ownership by Household Size in Huxley
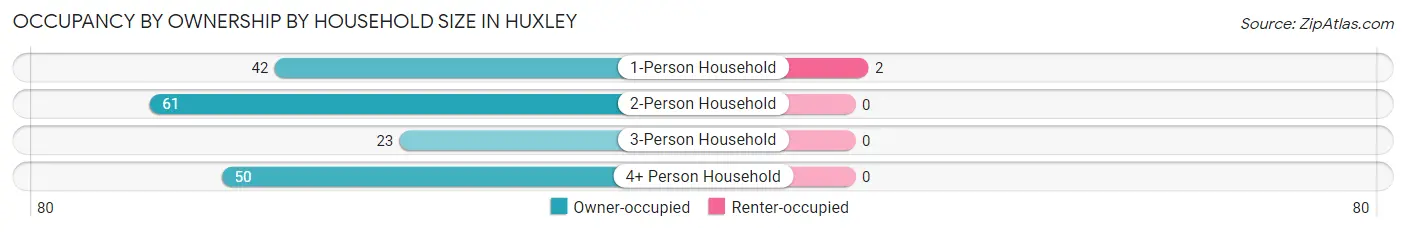
| Household Size | Owner-occupied | Renter-occupied |
| 1-Person Household | 42 (95.5%) | 2 (4.5%) |
| 2-Person Household | 61 (100.0%) | 0 (0.0%) |
| 3-Person Household | 23 (100.0%) | 0 (0.0%) |
| 4+ Person Household | 50 (100.0%) | 0 (0.0%) |
| Total Housing Units | 176 (98.9%) | 2 (1.1%) |
Occupancy by Educational Attainment in Huxley
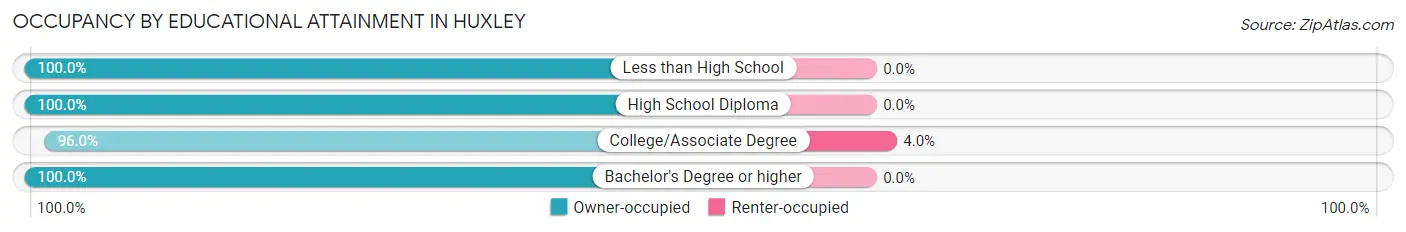
| Household Size | Owner-occupied | Renter-occupied |
| Less than High School | 32 (100.0%) | 0 (0.0%) |
| High School Diploma | 53 (100.0%) | 0 (0.0%) |
| College/Associate Degree | 48 (96.0%) | 2 (4.0%) |
| Bachelor's Degree or higher | 43 (100.0%) | 0 (0.0%) |
Occupancy by Age of Householder in Huxley
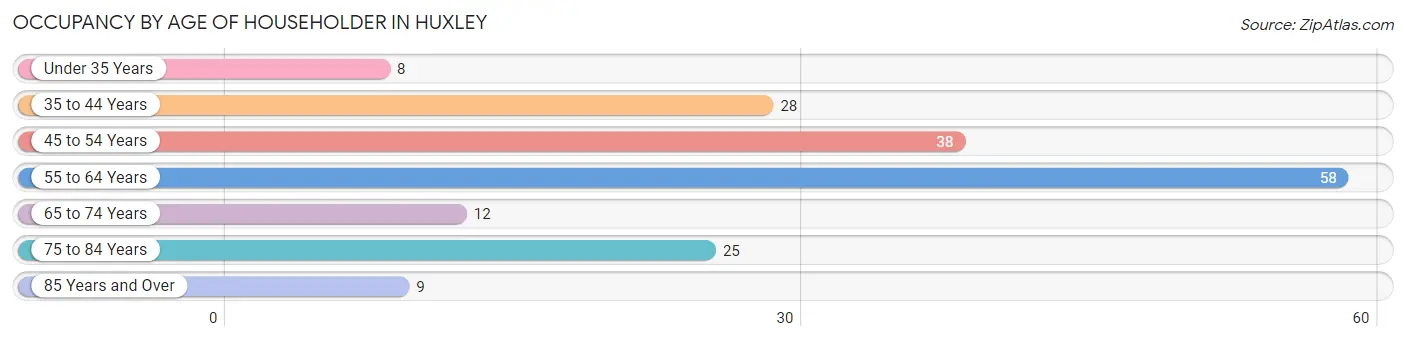
| Age Bracket | # Households | % Households |
| Under 35 Years | 8 | 4.5% |
| 35 to 44 Years | 28 | 15.7% |
| 45 to 54 Years | 38 | 21.3% |
| 55 to 64 Years | 58 | 32.6% |
| 65 to 74 Years | 12 | 6.7% |
| 75 to 84 Years | 25 | 14.0% |
| 85 Years and Over | 9 | 5.1% |
| Total | 178 | 100.0% |
Housing Finances in Huxley
Median Income by Occupancy in Huxley
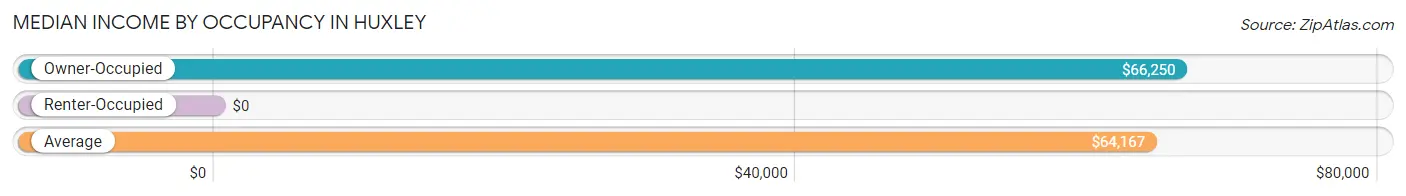
| Occupancy Type | # Households | Median Income |
| Owner-Occupied | 176 (98.9%) | $66,250 |
| Renter-Occupied | 2 (1.1%) | $0 |
| Average | 178 (100.0%) | $64,167 |
Occupancy by Householder Income Bracket in Huxley
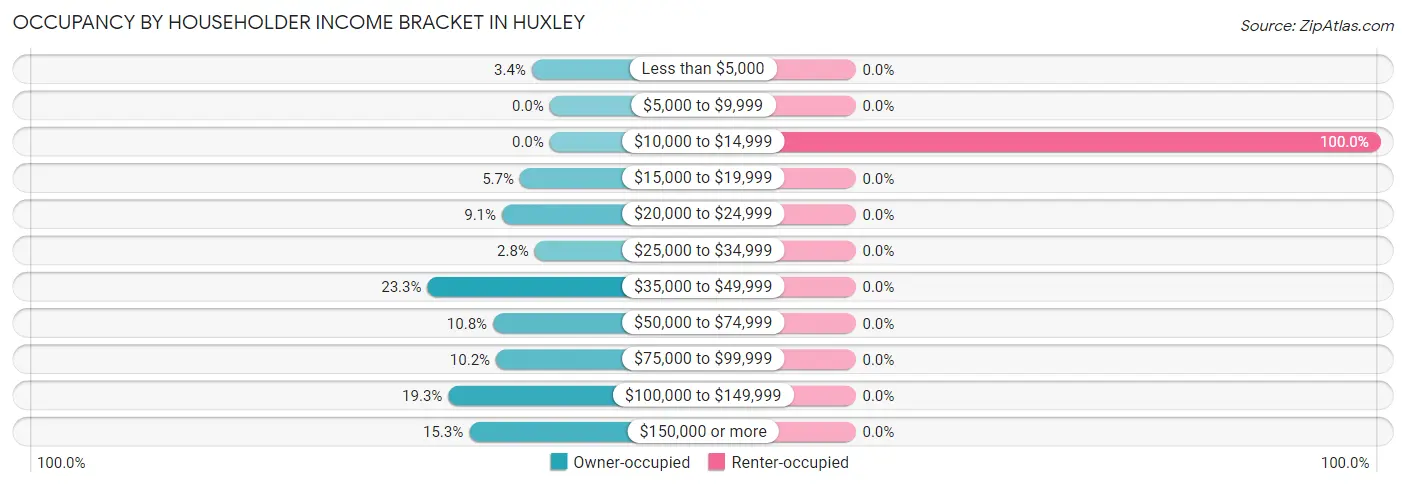
| Income Bracket | Owner-occupied | Renter-occupied |
| Less than $5,000 | 6 (3.4%) | 0 (0.0%) |
| $5,000 to $9,999 | 0 (0.0%) | 0 (0.0%) |
| $10,000 to $14,999 | 0 (0.0%) | 2 (100.0%) |
| $15,000 to $19,999 | 10 (5.7%) | 0 (0.0%) |
| $20,000 to $24,999 | 16 (9.1%) | 0 (0.0%) |
| $25,000 to $34,999 | 5 (2.8%) | 0 (0.0%) |
| $35,000 to $49,999 | 41 (23.3%) | 0 (0.0%) |
| $50,000 to $74,999 | 19 (10.8%) | 0 (0.0%) |
| $75,000 to $99,999 | 18 (10.2%) | 0 (0.0%) |
| $100,000 to $149,999 | 34 (19.3%) | 0 (0.0%) |
| $150,000 or more | 27 (15.3%) | 0 (0.0%) |
| Total | 176 (100.0%) | 2 (100.0%) |
Monthly Housing Cost Tiers in Huxley
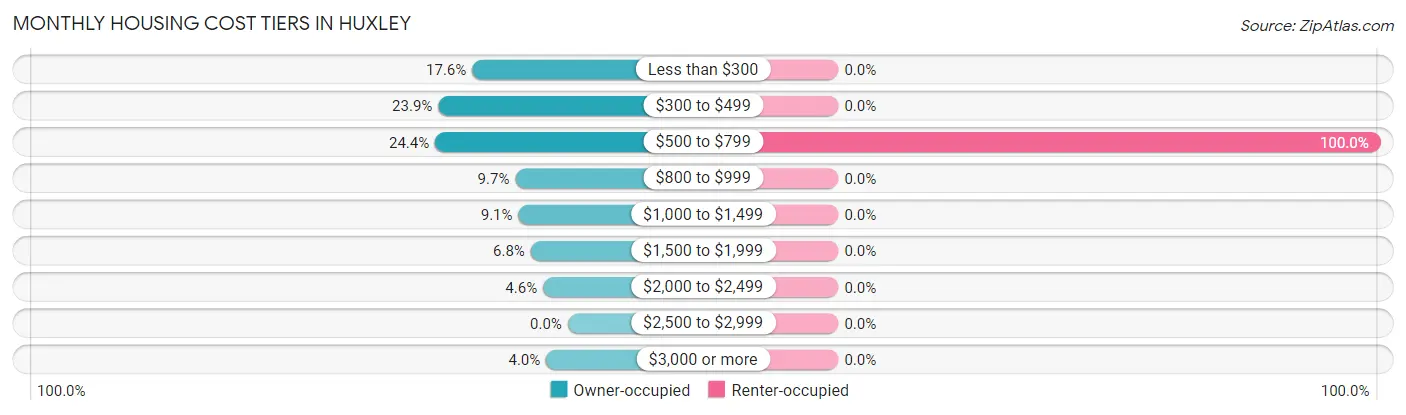
| Monthly Cost | Owner-occupied | Renter-occupied |
| Less than $300 | 31 (17.6%) | 0 (0.0%) |
| $300 to $499 | 42 (23.9%) | 0 (0.0%) |
| $500 to $799 | 43 (24.4%) | 2 (100.0%) |
| $800 to $999 | 17 (9.7%) | 0 (0.0%) |
| $1,000 to $1,499 | 16 (9.1%) | 0 (0.0%) |
| $1,500 to $1,999 | 12 (6.8%) | 0 (0.0%) |
| $2,000 to $2,499 | 8 (4.5%) | 0 (0.0%) |
| $2,500 to $2,999 | 0 (0.0%) | 0 (0.0%) |
| $3,000 or more | 7 (4.0%) | 0 (0.0%) |
| Total | 176 (100.0%) | 2 (100.0%) |
Physical Housing Characteristics in Huxley
Housing Structures in Huxley
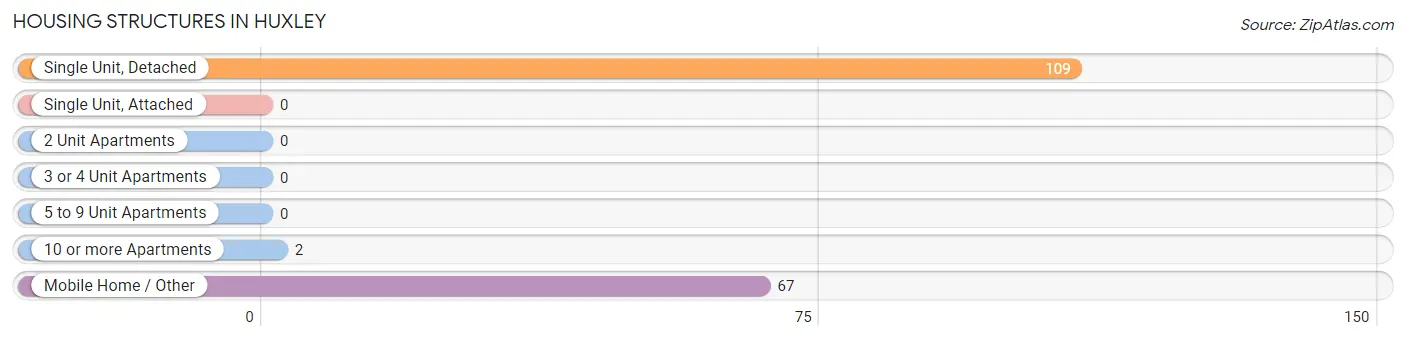
| Structure Type | # Housing Units | % Housing Units |
| Single Unit, Detached | 109 | 61.2% |
| Single Unit, Attached | 0 | 0.0% |
| 2 Unit Apartments | 0 | 0.0% |
| 3 or 4 Unit Apartments | 0 | 0.0% |
| 5 to 9 Unit Apartments | 0 | 0.0% |
| 10 or more Apartments | 2 | 1.1% |
| Mobile Home / Other | 67 | 37.6% |
| Total | 178 | 100.0% |
Housing Structures by Occupancy in Huxley
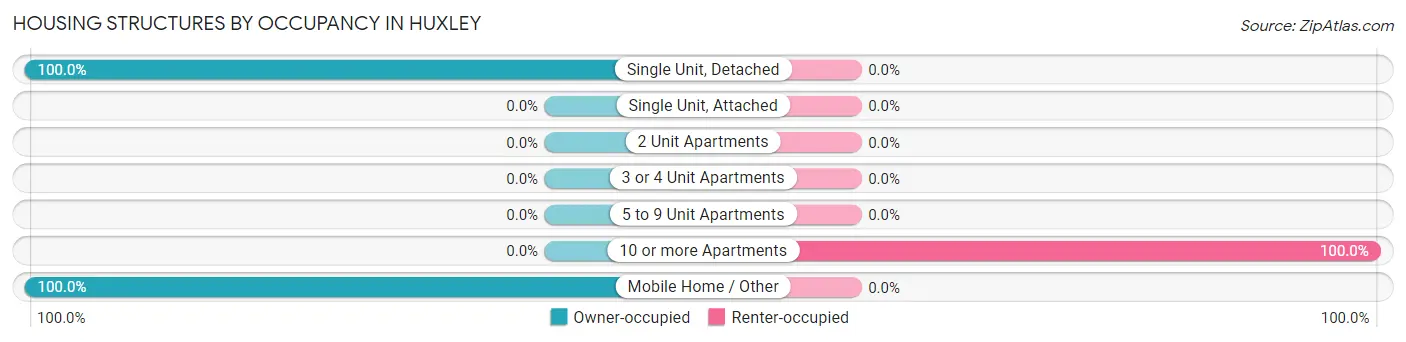
| Structure Type | Owner-occupied | Renter-occupied |
| Single Unit, Detached | 109 (100.0%) | 0 (0.0%) |
| Single Unit, Attached | 0 (0.0%) | 0 (0.0%) |
| 2 Unit Apartments | 0 (0.0%) | 0 (0.0%) |
| 3 or 4 Unit Apartments | 0 (0.0%) | 0 (0.0%) |
| 5 to 9 Unit Apartments | 0 (0.0%) | 0 (0.0%) |
| 10 or more Apartments | 0 (0.0%) | 2 (100.0%) |
| Mobile Home / Other | 67 (100.0%) | 0 (0.0%) |
| Total | 176 (98.9%) | 2 (1.1%) |
Housing Structures by Number of Rooms in Huxley
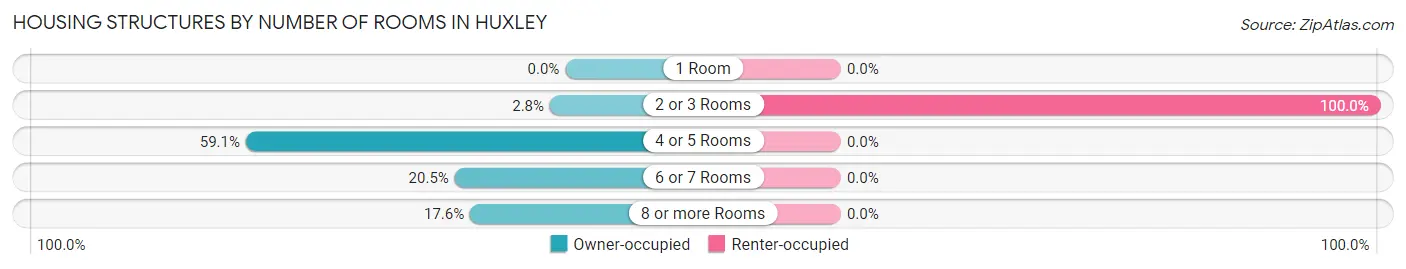
| Number of Rooms | Owner-occupied | Renter-occupied |
| 1 Room | 0 (0.0%) | 0 (0.0%) |
| 2 or 3 Rooms | 5 (2.8%) | 2 (100.0%) |
| 4 or 5 Rooms | 104 (59.1%) | 0 (0.0%) |
| 6 or 7 Rooms | 36 (20.4%) | 0 (0.0%) |
| 8 or more Rooms | 31 (17.6%) | 0 (0.0%) |
| Total | 176 (100.0%) | 2 (100.0%) |
Housing Structure by Heating Type in Huxley
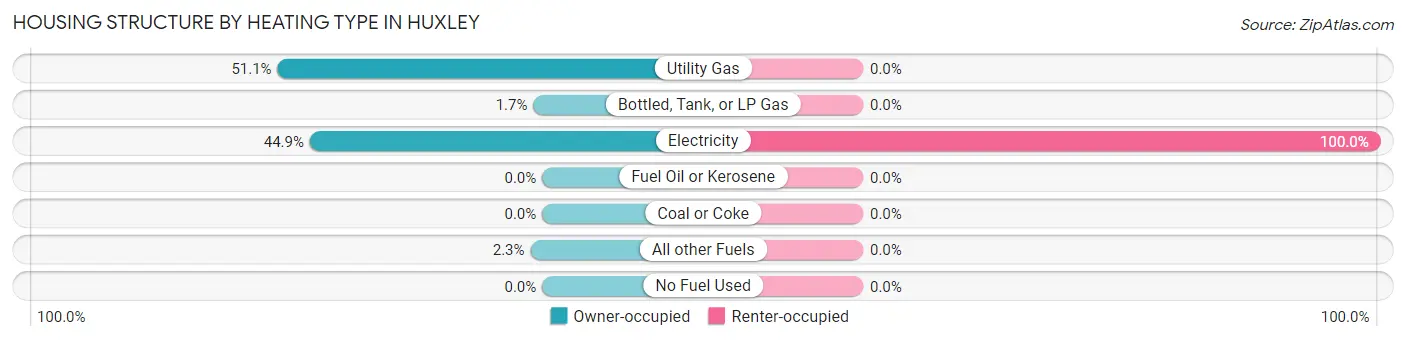
| Heating Type | Owner-occupied | Renter-occupied |
| Utility Gas | 90 (51.1%) | 0 (0.0%) |
| Bottled, Tank, or LP Gas | 3 (1.7%) | 0 (0.0%) |
| Electricity | 79 (44.9%) | 2 (100.0%) |
| Fuel Oil or Kerosene | 0 (0.0%) | 0 (0.0%) |
| Coal or Coke | 0 (0.0%) | 0 (0.0%) |
| All other Fuels | 4 (2.3%) | 0 (0.0%) |
| No Fuel Used | 0 (0.0%) | 0 (0.0%) |
| Total | 176 (100.0%) | 2 (100.0%) |
Household Vehicle Usage in Huxley
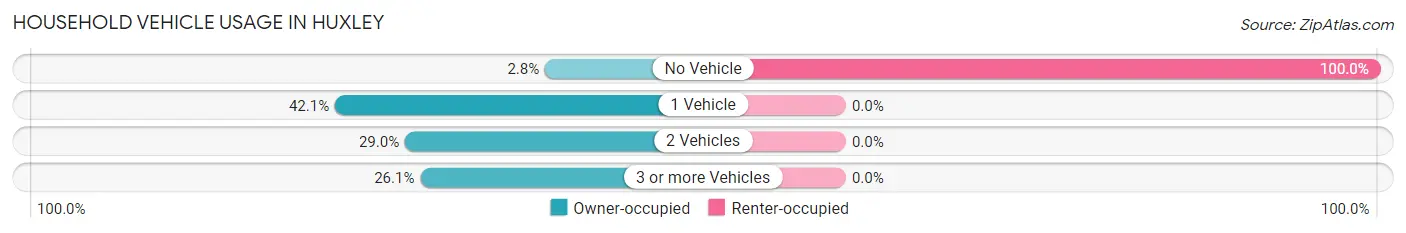
| Vehicles per Household | Owner-occupied | Renter-occupied |
| No Vehicle | 5 (2.8%) | 2 (100.0%) |
| 1 Vehicle | 74 (42.0%) | 0 (0.0%) |
| 2 Vehicles | 51 (29.0%) | 0 (0.0%) |
| 3 or more Vehicles | 46 (26.1%) | 0 (0.0%) |
| Total | 176 (100.0%) | 2 (100.0%) |
Real Estate & Mortgages in Huxley
Real Estate and Mortgage Overview in Huxley
| Characteristic | Without Mortgage | With Mortgage |
| Housing Units | 133 | 43 |
| Median Property Value | $86,300 | $173,600 |
| Median Household Income | $42,356 | $5 |
| Monthly Housing Costs | $472 | $7 |
| Real Estate Taxes | $420 | $0 |
Property Value by Mortgage Status in Huxley
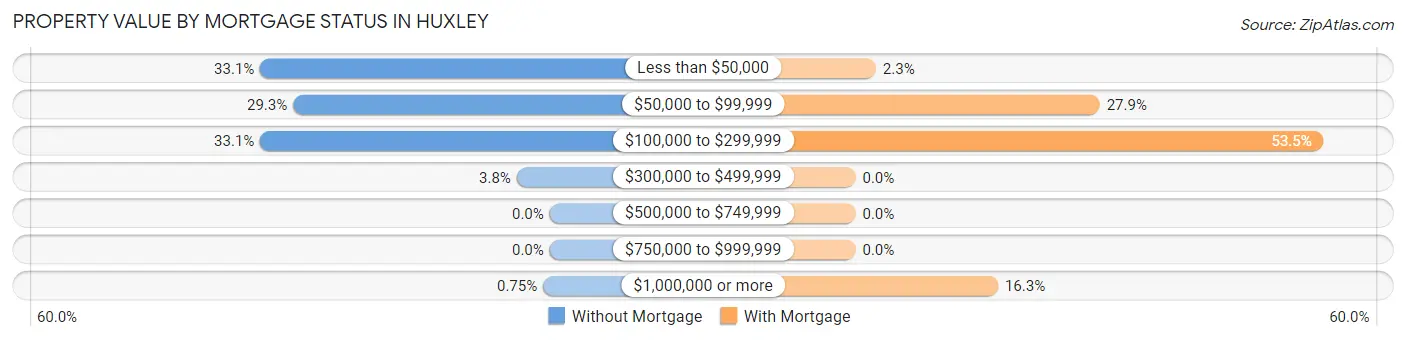
| Property Value | Without Mortgage | With Mortgage |
| Less than $50,000 | 44 (33.1%) | 1 (2.3%) |
| $50,000 to $99,999 | 39 (29.3%) | 12 (27.9%) |
| $100,000 to $299,999 | 44 (33.1%) | 23 (53.5%) |
| $300,000 to $499,999 | 5 (3.8%) | 0 (0.0%) |
| $500,000 to $749,999 | 0 (0.0%) | 0 (0.0%) |
| $750,000 to $999,999 | 0 (0.0%) | 0 (0.0%) |
| $1,000,000 or more | 1 (0.7%) | 7 (16.3%) |
| Total | 133 (100.0%) | 43 (100.0%) |
Household Income by Mortgage Status in Huxley
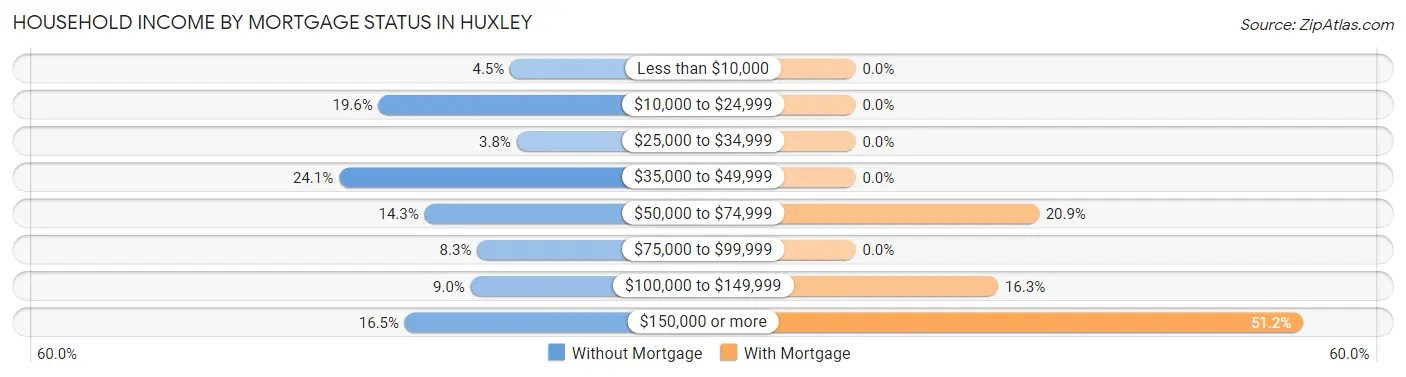
| Household Income | Without Mortgage | With Mortgage |
| Less than $10,000 | 6 (4.5%) | 0 (0.0%) |
| $10,000 to $24,999 | 26 (19.6%) | 0 (0.0%) |
| $25,000 to $34,999 | 5 (3.8%) | 0 (0.0%) |
| $35,000 to $49,999 | 32 (24.1%) | 0 (0.0%) |
| $50,000 to $74,999 | 19 (14.3%) | 9 (20.9%) |
| $75,000 to $99,999 | 11 (8.3%) | 0 (0.0%) |
| $100,000 to $149,999 | 12 (9.0%) | 7 (16.3%) |
| $150,000 or more | 22 (16.5%) | 22 (51.2%) |
| Total | 133 (100.0%) | 43 (100.0%) |
Property Value to Household Income Ratio in Huxley
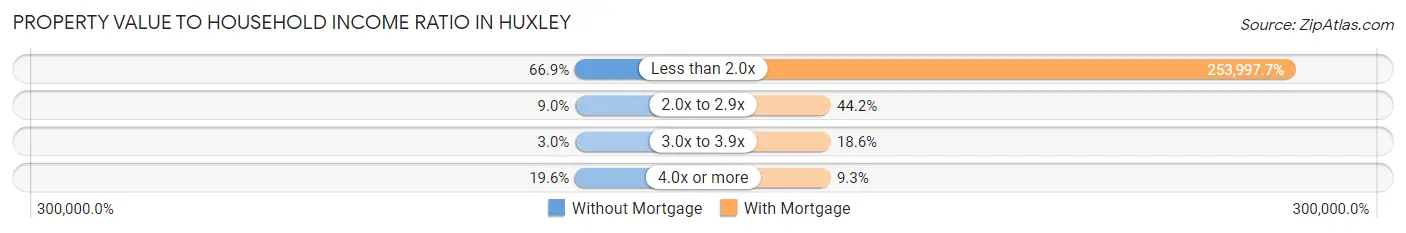
| Value-to-Income Ratio | Without Mortgage | With Mortgage |
| Less than 2.0x | 89 (66.9%) | 109,219 (253,997.7%) |
| 2.0x to 2.9x | 12 (9.0%) | 19 (44.2%) |
| 3.0x to 3.9x | 4 (3.0%) | 8 (18.6%) |
| 4.0x or more | 26 (19.6%) | 4 (9.3%) |
| Total | 133 (100.0%) | 43 (100.0%) |
Real Estate Taxes by Mortgage Status in Huxley
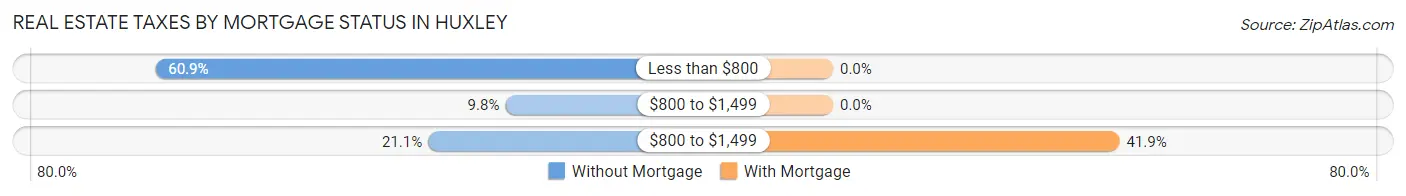
| Property Taxes | Without Mortgage | With Mortgage |
| Less than $800 | 81 (60.9%) | 0 (0.0%) |
| $800 to $1,499 | 13 (9.8%) | 0 (0.0%) |
| $800 to $1,499 | 28 (21.0%) | 18 (41.9%) |
| Total | 133 (100.0%) | 43 (100.0%) |
Health & Disability in Huxley
Health Insurance Coverage by Age in Huxley
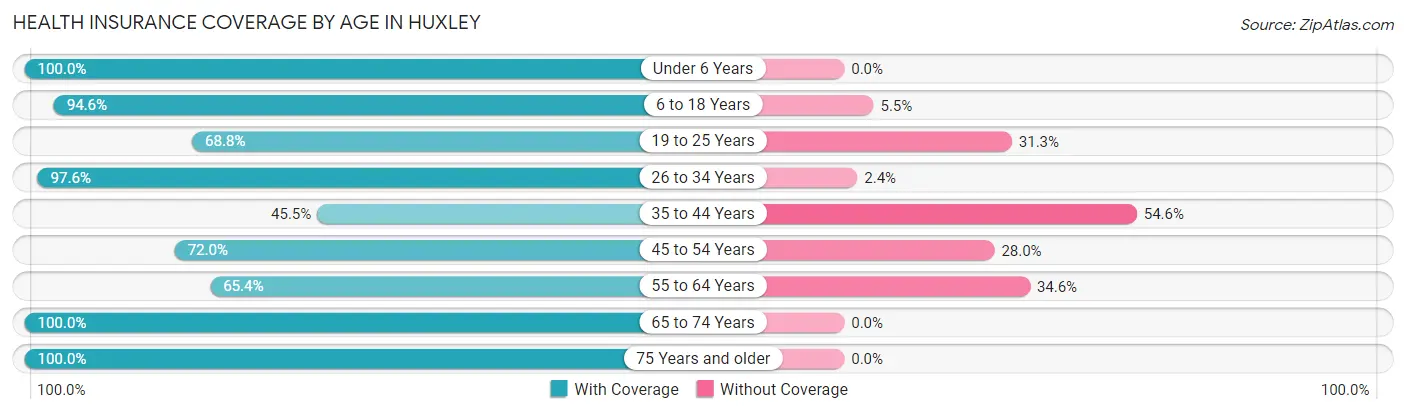
| Age Bracket | With Coverage | Without Coverage |
| Under 6 Years | 23 (100.0%) | 0 (0.0%) |
| 6 to 18 Years | 52 (94.6%) | 3 (5.4%) |
| 19 to 25 Years | 11 (68.8%) | 5 (31.2%) |
| 26 to 34 Years | 40 (97.6%) | 1 (2.4%) |
| 35 to 44 Years | 35 (45.5%) | 42 (54.5%) |
| 45 to 54 Years | 72 (72.0%) | 28 (28.0%) |
| 55 to 64 Years | 51 (65.4%) | 27 (34.6%) |
| 65 to 74 Years | 20 (100.0%) | 0 (0.0%) |
| 75 Years and older | 47 (100.0%) | 0 (0.0%) |
| Total | 351 (76.8%) | 106 (23.2%) |
Health Insurance Coverage by Citizenship Status in Huxley
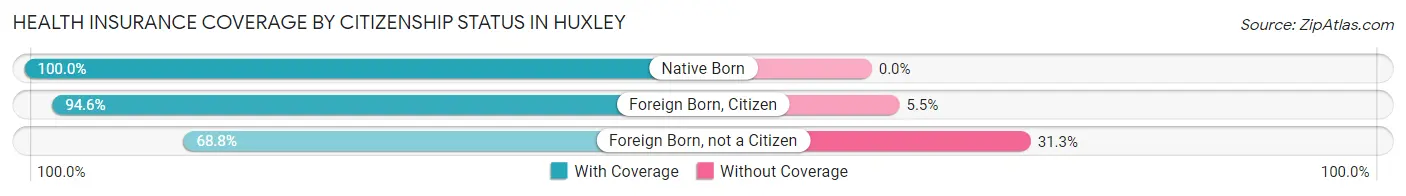
| Citizenship Status | With Coverage | Without Coverage |
| Native Born | 23 (100.0%) | 0 (0.0%) |
| Foreign Born, Citizen | 52 (94.6%) | 3 (5.4%) |
| Foreign Born, not a Citizen | 11 (68.8%) | 5 (31.2%) |
Health Insurance Coverage by Household Income in Huxley
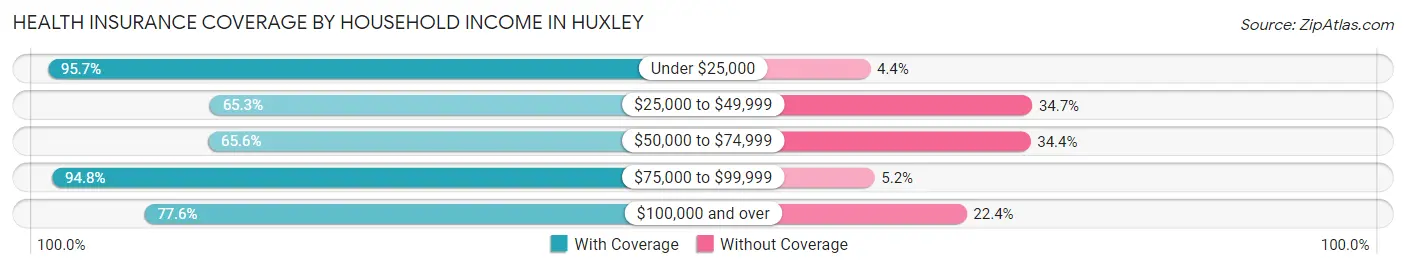
| Household Income | With Coverage | Without Coverage |
| Under $25,000 | 44 (95.7%) | 2 (4.3%) |
| $25,000 to $49,999 | 96 (65.3%) | 51 (34.7%) |
| $50,000 to $74,999 | 21 (65.6%) | 11 (34.4%) |
| $75,000 to $99,999 | 55 (94.8%) | 3 (5.2%) |
| $100,000 and over | 135 (77.6%) | 39 (22.4%) |
Public vs Private Health Insurance Coverage by Age in Huxley
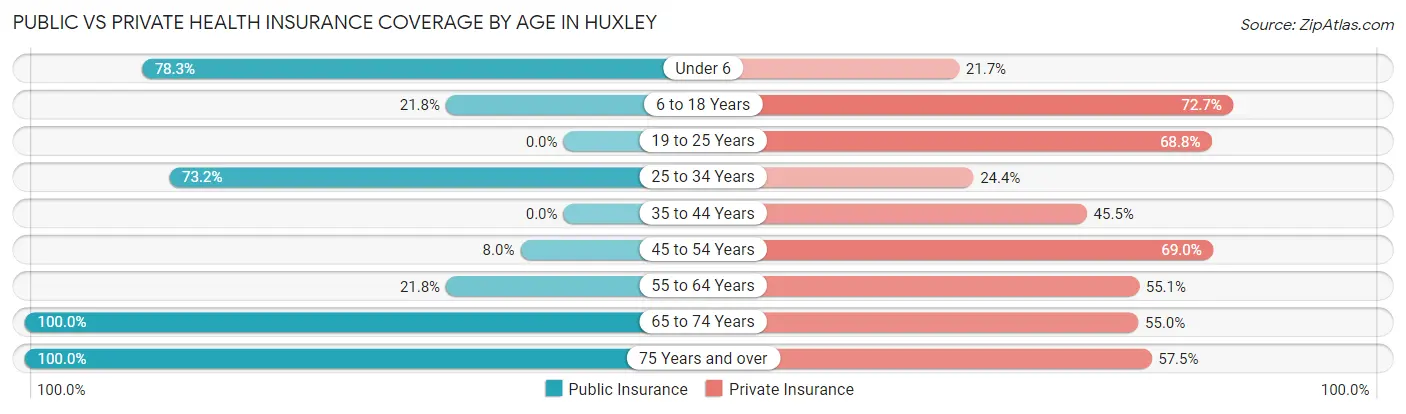
| Age Bracket | Public Insurance | Private Insurance |
| Under 6 | 18 (78.3%) | 5 (21.7%) |
| 6 to 18 Years | 12 (21.8%) | 40 (72.7%) |
| 19 to 25 Years | 0 (0.0%) | 11 (68.8%) |
| 25 to 34 Years | 30 (73.2%) | 10 (24.4%) |
| 35 to 44 Years | 0 (0.0%) | 35 (45.5%) |
| 45 to 54 Years | 8 (8.0%) | 69 (69.0%) |
| 55 to 64 Years | 17 (21.8%) | 43 (55.1%) |
| 65 to 74 Years | 20 (100.0%) | 11 (55.0%) |
| 75 Years and over | 47 (100.0%) | 27 (57.5%) |
| Total | 152 (33.3%) | 251 (54.9%) |
Disability Status by Sex by Age in Huxley
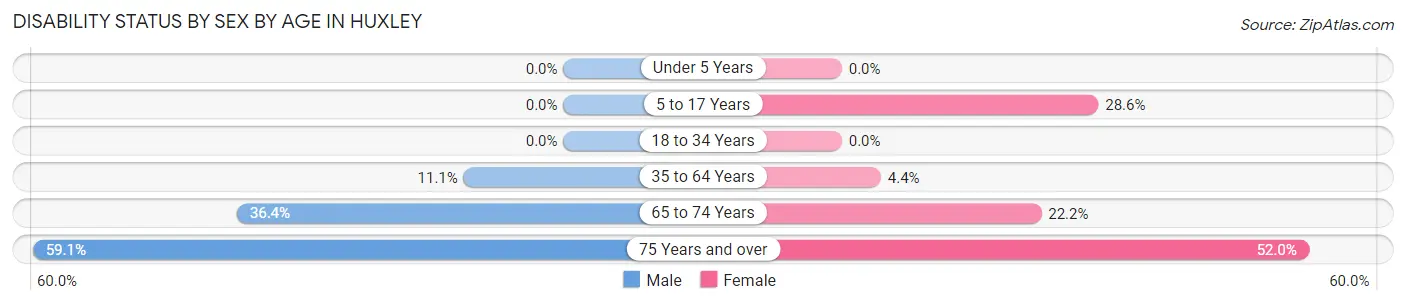
| Age Bracket | Male | Female |
| Under 5 Years | 0 (0.0%) | 0 (0.0%) |
| 5 to 17 Years | 0 (0.0%) | 6 (28.6%) |
| 18 to 34 Years | 0 (0.0%) | 0 (0.0%) |
| 35 to 64 Years | 13 (11.1%) | 6 (4.3%) |
| 65 to 74 Years | 4 (36.4%) | 2 (22.2%) |
| 75 Years and over | 13 (59.1%) | 13 (52.0%) |
Disability Class by Sex by Age in Huxley
Disability Class: Hearing Difficulty
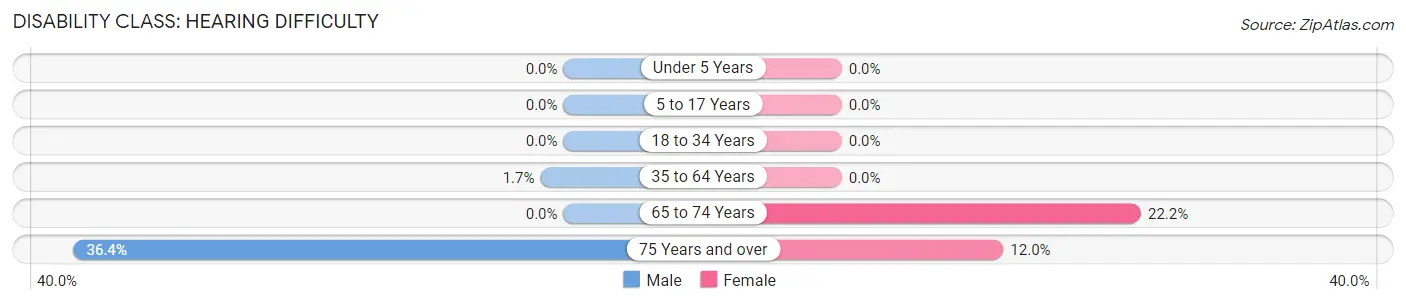
| Age Bracket | Male | Female |
| Under 5 Years | 0 (0.0%) | 0 (0.0%) |
| 5 to 17 Years | 0 (0.0%) | 0 (0.0%) |
| 18 to 34 Years | 0 (0.0%) | 0 (0.0%) |
| 35 to 64 Years | 2 (1.7%) | 0 (0.0%) |
| 65 to 74 Years | 0 (0.0%) | 2 (22.2%) |
| 75 Years and over | 8 (36.4%) | 3 (12.0%) |
Disability Class: Vision Difficulty
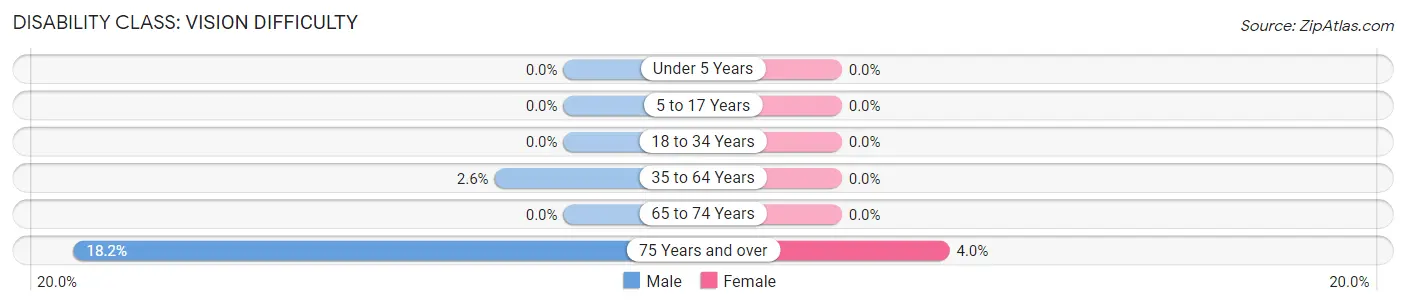
| Age Bracket | Male | Female |
| Under 5 Years | 0 (0.0%) | 0 (0.0%) |
| 5 to 17 Years | 0 (0.0%) | 0 (0.0%) |
| 18 to 34 Years | 0 (0.0%) | 0 (0.0%) |
| 35 to 64 Years | 3 (2.6%) | 0 (0.0%) |
| 65 to 74 Years | 0 (0.0%) | 0 (0.0%) |
| 75 Years and over | 4 (18.2%) | 1 (4.0%) |
Disability Class: Cognitive Difficulty
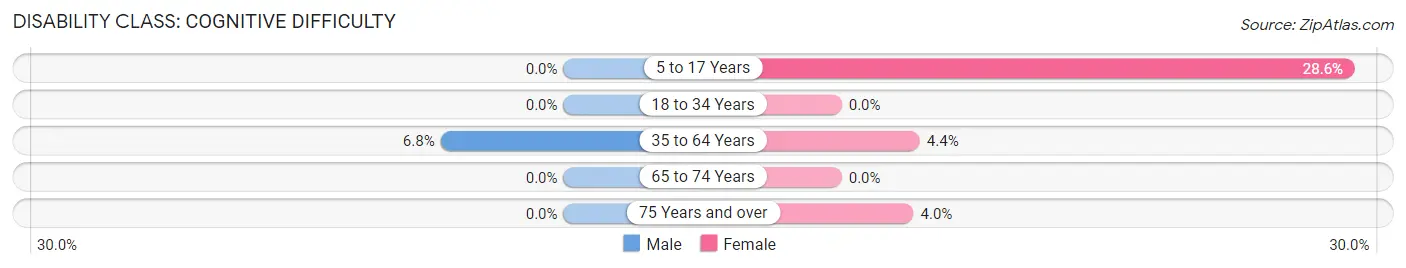
| Age Bracket | Male | Female |
| 5 to 17 Years | 0 (0.0%) | 6 (28.6%) |
| 18 to 34 Years | 0 (0.0%) | 0 (0.0%) |
| 35 to 64 Years | 8 (6.8%) | 6 (4.3%) |
| 65 to 74 Years | 0 (0.0%) | 0 (0.0%) |
| 75 Years and over | 0 (0.0%) | 1 (4.0%) |
Disability Class: Ambulatory Difficulty
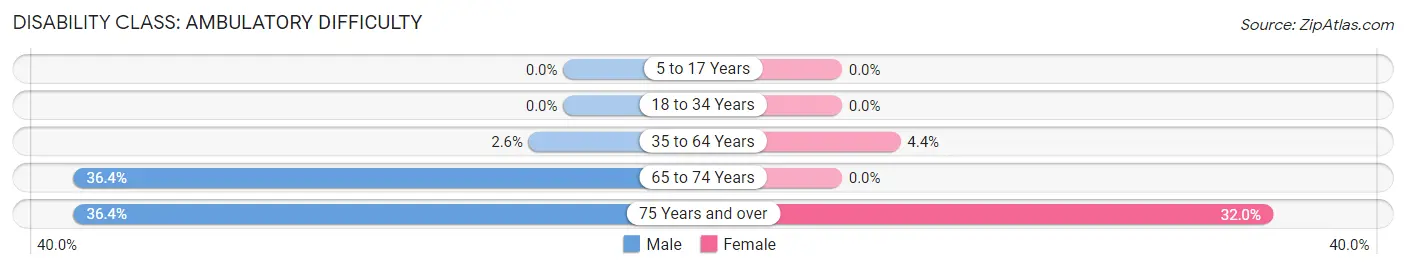
| Age Bracket | Male | Female |
| 5 to 17 Years | 0 (0.0%) | 0 (0.0%) |
| 18 to 34 Years | 0 (0.0%) | 0 (0.0%) |
| 35 to 64 Years | 3 (2.6%) | 6 (4.3%) |
| 65 to 74 Years | 4 (36.4%) | 0 (0.0%) |
| 75 Years and over | 8 (36.4%) | 8 (32.0%) |
Disability Class: Self-Care Difficulty
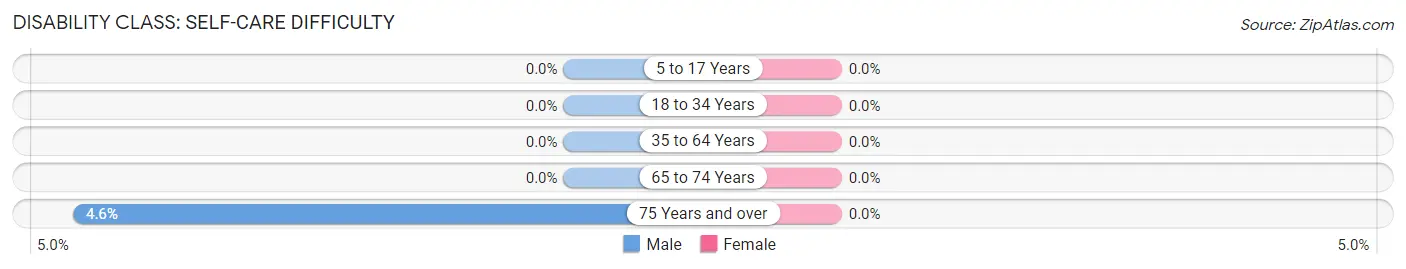
| Age Bracket | Male | Female |
| 5 to 17 Years | 0 (0.0%) | 0 (0.0%) |
| 18 to 34 Years | 0 (0.0%) | 0 (0.0%) |
| 35 to 64 Years | 0 (0.0%) | 0 (0.0%) |
| 65 to 74 Years | 0 (0.0%) | 0 (0.0%) |
| 75 Years and over | 1 (4.5%) | 0 (0.0%) |
Technology Access in Huxley
Computing Device Access in Huxley
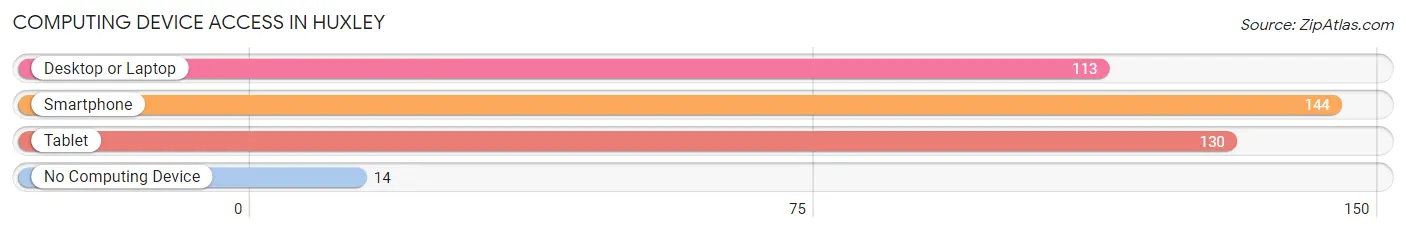
| Device Type | # Households | % Households |
| Desktop or Laptop | 113 | 63.5% |
| Smartphone | 144 | 80.9% |
| Tablet | 130 | 73.0% |
| No Computing Device | 14 | 7.9% |
| Total | 178 | 100.0% |
Internet Access in Huxley
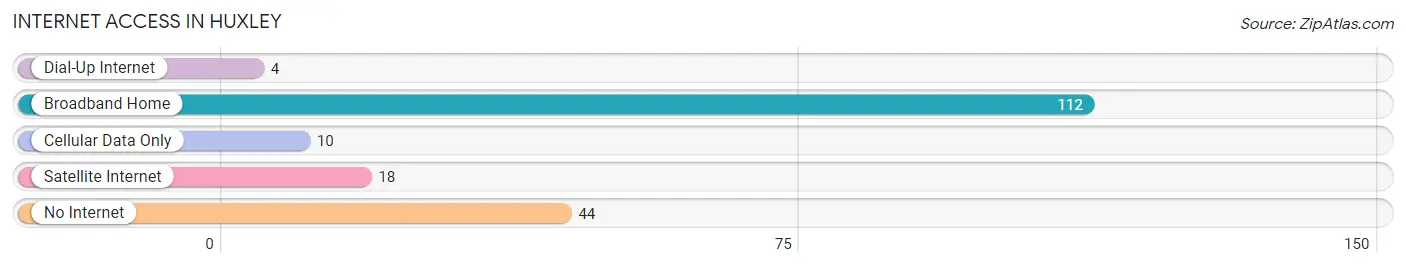
| Internet Type | # Households | % Households |
| Dial-Up Internet | 4 | 2.2% |
| Broadband Home | 112 | 62.9% |
| Cellular Data Only | 10 | 5.6% |
| Satellite Internet | 18 | 10.1% |
| No Internet | 44 | 24.7% |
| Total | 178 | 100.0% |
Huxley Summary
Huxley is a small town located in the state of Texas, in the United States. It is situated in the county of Bell, and is part of the Killeen-Temple-Fort Hood Metropolitan Statistical Area. The town has a population of approximately 1,000 people, and is located about 25 miles south of the city of Killeen.
History
Huxley was founded in 1881 by a group of settlers from the nearby town of Belton. The town was named after the English biologist Thomas Henry Huxley, who was a proponent of Darwin's theory of evolution. The town was originally a farming community, and the main crops grown were cotton, corn, and wheat. The town also had a small sawmill, which provided lumber for the local area.
In the early 1900s, the town began to grow and develop. A post office was established in 1906, and the town was incorporated in 1909. The town also had a school, which was built in 1910.
In the 1920s, the town began to experience a period of growth and prosperity. The population increased from around 500 people in 1920 to over 1,000 people in 1930. During this time, the town also saw the construction of several new businesses, including a bank, a hotel, and a movie theater.
In the 1940s, the town experienced a period of decline. The population decreased from 1,000 people in 1940 to just over 500 people in 1950. This decline was due to the fact that many of the town's residents had moved away to find work in larger cities.
Geography
Huxley is located in the central part of the state of Texas, in the county of Bell. The town is situated about 25 miles south of the city of Killeen, and is part of the Killeen-Temple-Fort Hood Metropolitan Statistical Area. The town is located in a rural area, and is surrounded by farmland and ranches.
The climate in Huxley is generally warm and humid, with temperatures ranging from the mid-50s in the winter to the mid-90s in the summer. The town receives an average of about 35 inches of rain per year.
Economy
The economy of Huxley is largely based on agriculture. The town is surrounded by farmland, and the main crops grown in the area are cotton, corn, and wheat. The town also has a small sawmill, which provides lumber for the local area.
In addition to agriculture, the town also has a few small businesses, including a bank, a hotel, and a movie theater. The town also has a few restaurants and bars, as well as a few retail stores.
Demographics
As of the 2010 census, the population of Huxley was 1,000 people. The racial makeup of the town was 94.2% White, 1.2% African American, 0.2% Native American, 0.2% Asian, 0.2% Pacific Islander, and 3.2% from other races. The median household income in the town was $37,500, and the median age was 37.5 years.
Common Questions
What is Per Capita Income in Huxley?
Per Capita income in Huxley is $33,010.
What is the Median Family Income in Huxley?
Median Family Income in Huxley is $90,278.
What is the Median Household income in Huxley?
Median Household Income in Huxley is $64,167.
What is Income or Wage Gap in Huxley?
Income or Wage Gap in Huxley is 59.9%.
Women in Huxley earn 40.1 cents for every dollar earned by a man.
What is Inequality or Gini Index in Huxley?
Inequality or Gini Index in Huxley is 0.40.
What is the Total Population of Huxley?
Total Population of Huxley is 457.
What is the Total Male Population of Huxley?
Total Male Population of Huxley is 224.
What is the Total Female Population of Huxley?
Total Female Population of Huxley is 233.
What is the Ratio of Males per 100 Females in Huxley?
There are 96.14 Males per 100 Females in Huxley.
What is the Ratio of Females per 100 Males in Huxley?
There are 104.02 Females per 100 Males in Huxley.
What is the Median Population Age in Huxley?
Median Population Age in Huxley is 48.0 Years.
What is the Average Family Size in Huxley
Average Family Size in Huxley is 3.1 People.
What is the Average Household Size in Huxley
Average Household Size in Huxley is 2.6 People.
How Large is the Labor Force in Huxley?
There are 191 People in the Labor Forcein in Huxley.
What is the Percentage of People in the Labor Force in Huxley?
50.0% of People are in the Labor Force in Huxley.