Cities with the Lowest Percentage of Renter-Occupied Units in Ohio
RELATED REPORTS & OPTIONS
Lowest Renter-Occupied
Ohio
Compare Cities
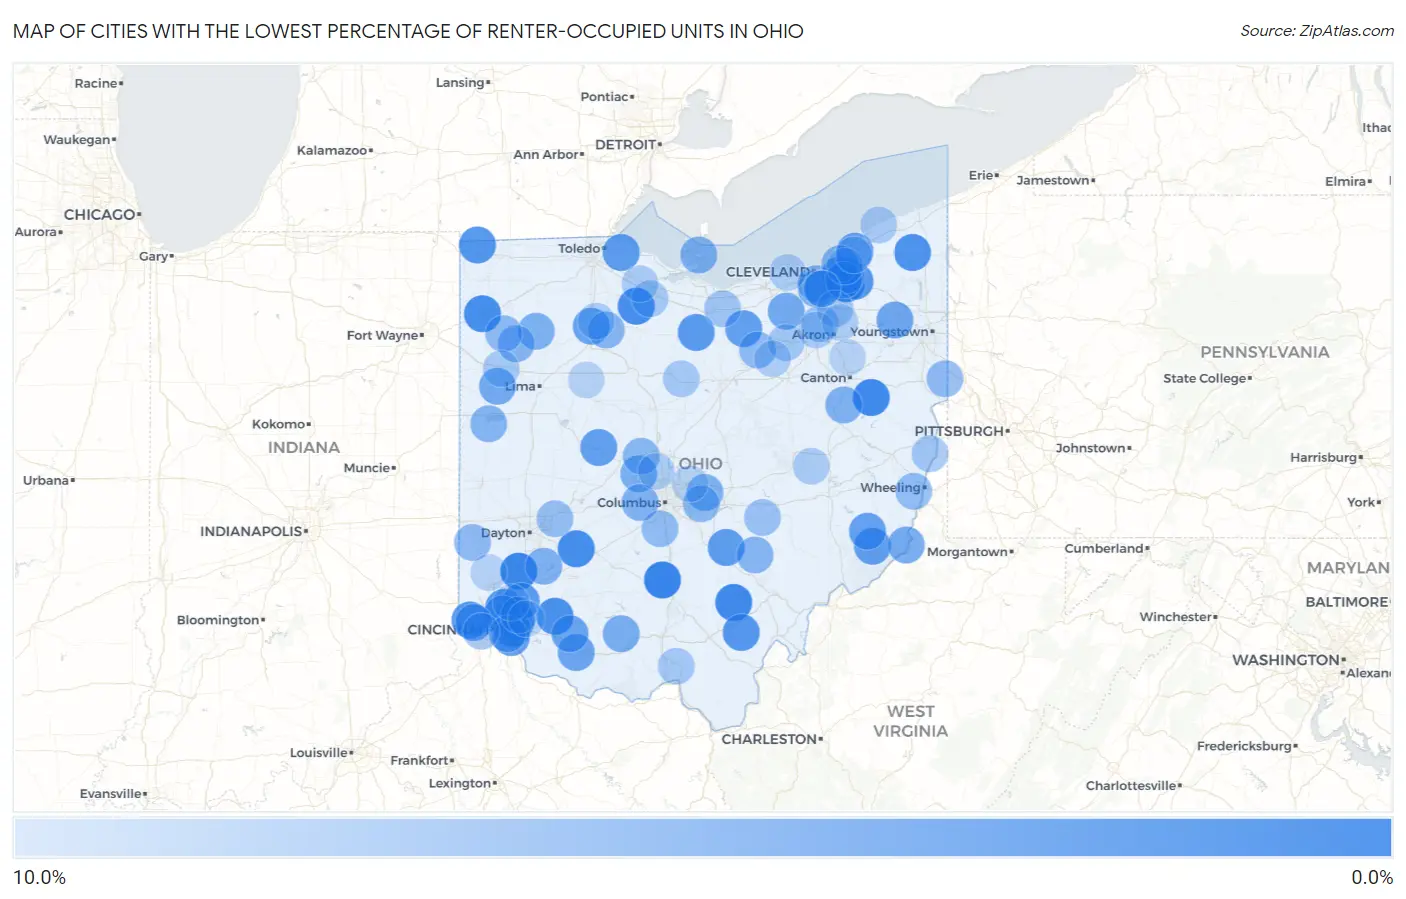
Map of Cities with the Lowest Percentage of Renter-Occupied Units in Ohio
10.0%
0.0%
Cities with the Lowest Percentage of Renter-Occupied Units in Ohio
| City | % Renter-Occupied | vs State | vs National | |
| 1. | Andersonville | 0.58% | 33.2%(-32.6)#1 | 35.2%(-34.6)#18 |
| 2. | Hunter | 0.72% | 33.2%(-32.5)#2 | 35.2%(-34.5)#31 |
| 3. | Zaleski | 1.1% | 33.2%(-32.1)#3 | 35.2%(-34.1)#71 |
| 4. | Lake Mohawk | 1.1% | 33.2%(-32.1)#4 | 35.2%(-34.1)#74 |
| 5. | Bentleyville | 1.2% | 33.2%(-32.0)#5 | 35.2%(-34.0)#83 |
| 6. | Shawnee Hills | 1.4% | 33.2%(-31.8)#6 | 35.2%(-33.8)#106 |
| 7. | Cecil | 1.4% | 33.2%(-31.8)#7 | 35.2%(-33.8)#107 |
| 8. | Burgoon | 1.5% | 33.2%(-31.7)#8 | 35.2%(-33.7)#125 |
| 9. | Lake Lorelei | 1.7% | 33.2%(-31.5)#9 | 35.2%(-33.5)#162 |
| 10. | Roaming Shores | 1.8% | 33.2%(-31.3)#10 | 35.2%(-33.3)#185 |
| 11. | Lake Seneca | 2.3% | 33.2%(-30.9)#11 | 35.2%(-32.9)#275 |
| 12. | Terrace Park | 2.3% | 33.2%(-30.9)#12 | 35.2%(-32.9)#290 |
| 13. | Evendale | 2.3% | 33.2%(-30.9)#13 | 35.2%(-32.9)#292 |
| 14. | Miami Heights | 2.4% | 33.2%(-30.8)#14 | 35.2%(-32.8)#312 |
| 15. | Pepper Pike | 2.4% | 33.2%(-30.8)#15 | 35.2%(-32.8)#313 |
| 16. | Wilkesville | 2.5% | 33.2%(-30.7)#16 | 35.2%(-32.7)#344 |
| 17. | The Village Of Indian Hill | 2.5% | 33.2%(-30.7)#17 | 35.2%(-32.7)#362 |
| 18. | South Russell | 2.5% | 33.2%(-30.7)#18 | 35.2%(-32.7)#365 |
| 19. | Holiday Lakes | 2.7% | 33.2%(-30.5)#19 | 35.2%(-32.5)#413 |
| 20. | Dry Run | 2.8% | 33.2%(-30.4)#20 | 35.2%(-32.4)#431 |
| 21. | Curtice | 2.9% | 33.2%(-30.3)#21 | 35.2%(-32.3)#457 |
| 22. | Loveland Park | 2.9% | 33.2%(-30.3)#22 | 35.2%(-32.3)#465 |
| 23. | Hide A Way Hills | 3.0% | 33.2%(-30.2)#23 | 35.2%(-32.2)#507 |
| 24. | Graysville | 3.1% | 33.2%(-30.1)#24 | 35.2%(-32.1)#549 |
| 25. | Amberley | 3.2% | 33.2%(-30.0)#25 | 35.2%(-32.0)#569 |
| 26. | East Liberty | 3.2% | 33.2%(-29.9)#26 | 35.2%(-31.9)#598 |
| 27. | Rochester | 3.3% | 33.2%(-29.9)#27 | 35.2%(-31.9)#608 |
| 28. | Coldstream | 3.4% | 33.2%(-29.8)#28 | 35.2%(-31.8)#633 |
| 29. | Lewisville | 3.4% | 33.2%(-29.8)#29 | 35.2%(-31.8)#640 |
| 30. | Reno Beach | 3.5% | 33.2%(-29.7)#30 | 35.2%(-31.7)#666 |
| 31. | Kirtland Hills | 3.5% | 33.2%(-29.7)#31 | 35.2%(-31.7)#672 |
| 32. | Mack | 3.7% | 33.2%(-29.5)#32 | 35.2%(-31.5)#735 |
| 33. | Lake Waynoka | 3.7% | 33.2%(-29.4)#33 | 35.2%(-31.4)#762 |
| 34. | Buford | 3.7% | 33.2%(-29.4)#34 | 35.2%(-31.4)#766 |
| 35. | Van Buren | 3.8% | 33.2%(-29.4)#35 | 35.2%(-31.4)#778 |
| 36. | South Canal | 4.0% | 33.2%(-29.2)#36 | 35.2%(-31.2)#850 |
| 37. | Elgin | 4.3% | 33.2%(-28.9)#37 | 35.2%(-30.9)#924 |
| 38. | Valley City | 4.3% | 33.2%(-28.8)#38 | 35.2%(-30.9)#945 |
| 39. | Hannibal | 4.5% | 33.2%(-28.7)#39 | 35.2%(-30.7)#992 |
| 40. | Salem Heights | 4.6% | 33.2%(-28.6)#40 | 35.2%(-30.6)#1,055 |
| 41. | Sinking Spring | 4.7% | 33.2%(-28.5)#41 | 35.2%(-30.5)#1,078 |
| 42. | New California | 4.8% | 33.2%(-28.4)#42 | 35.2%(-30.4)#1,133 |
| 43. | Hunting Valley | 4.9% | 33.2%(-28.3)#43 | 35.2%(-30.3)#1,180 |
| 44. | Miller City | 4.9% | 33.2%(-28.3)#44 | 35.2%(-30.3)#1,190 |
| 45. | Seven Hills | 4.9% | 33.2%(-28.2)#45 | 35.2%(-30.2)#1,201 |
| 46. | Corwin | 5.0% | 33.2%(-28.2)#46 | 35.2%(-30.2)#1,234 |
| 47. | Beechwood Trails | 5.1% | 33.2%(-28.1)#47 | 35.2%(-30.1)#1,261 |
| 48. | Kelleys Island | 5.1% | 33.2%(-28.1)#48 | 35.2%(-30.1)#1,266 |
| 49. | Zoar | 5.1% | 33.2%(-28.1)#49 | 35.2%(-30.1)#1,267 |
| 50. | Lake Darby | 5.1% | 33.2%(-28.0)#50 | 35.2%(-30.0)#1,277 |
| 51. | Brooklyn Heights | 5.2% | 33.2%(-28.0)#51 | 35.2%(-30.0)#1,304 |
| 52. | Highland Heights | 5.3% | 33.2%(-27.9)#52 | 35.2%(-29.9)#1,342 |
| 53. | Arcadia | 5.4% | 33.2%(-27.7)#53 | 35.2%(-29.7)#1,401 |
| 54. | Cloverdale | 5.5% | 33.2%(-27.7)#54 | 35.2%(-29.7)#1,412 |
| 55. | Montezuma | 5.5% | 33.2%(-27.7)#55 | 35.2%(-29.7)#1,414 |
| 56. | Independence | 5.5% | 33.2%(-27.7)#56 | 35.2%(-29.7)#1,438 |
| 57. | Shawnee | 5.6% | 33.2%(-27.6)#57 | 35.2%(-29.6)#1,478 |
| 58. | Hamburg | 5.6% | 33.2%(-27.6)#58 | 35.2%(-29.6)#1,481 |
| 59. | Moreland Hills | 5.6% | 33.2%(-27.6)#59 | 35.2%(-29.6)#1,492 |
| 60. | Etna | 5.7% | 33.2%(-27.5)#60 | 35.2%(-29.5)#1,521 |
| 61. | Ostrander | 5.8% | 33.2%(-27.4)#61 | 35.2%(-29.4)#1,550 |
| 62. | Negley | 6.0% | 33.2%(-27.2)#62 | 35.2%(-29.2)#1,646 |
| 63. | Melrose | 6.0% | 33.2%(-27.2)#63 | 35.2%(-29.2)#1,647 |
| 64. | Lake Lakengren | 6.0% | 33.2%(-27.1)#64 | 35.2%(-29.2)#1,655 |
| 65. | Cinnamon Lake | 6.1% | 33.2%(-27.1)#65 | 35.2%(-29.1)#1,664 |
| 66. | Neffs | 6.2% | 33.2%(-27.0)#66 | 35.2%(-29.0)#1,722 |
| 67. | Commercial Point | 6.2% | 33.2%(-26.9)#67 | 35.2%(-28.9)#1,729 |
| 68. | Holiday Valley | 6.5% | 33.2%(-26.7)#68 | 35.2%(-28.7)#1,841 |
| 69. | Bass Lake | 6.7% | 33.2%(-26.5)#69 | 35.2%(-28.5)#1,905 |
| 70. | Montrose Ghent | 6.8% | 33.2%(-26.4)#70 | 35.2%(-28.4)#1,958 |
| 71. | Fultonham | 6.8% | 33.2%(-26.4)#71 | 35.2%(-28.4)#1,960 |
| 72. | Collins | 7.0% | 33.2%(-26.1)#72 | 35.2%(-28.1)#2,079 |
| 73. | Delhi Hills | 7.1% | 33.2%(-26.0)#73 | 35.2%(-28.0)#2,122 |
| 74. | Gates Mills | 7.2% | 33.2%(-26.0)#74 | 35.2%(-28.0)#2,158 |
| 75. | New Alexandria | 7.2% | 33.2%(-26.0)#75 | 35.2%(-28.0)#2,163 |
| 76. | Gomer | 7.2% | 33.2%(-26.0)#76 | 35.2%(-28.0)#2,169 |
| 77. | Westfield Center | 7.2% | 33.2%(-25.9)#77 | 35.2%(-27.9)#2,175 |
| 78. | Boston Heights | 7.3% | 33.2%(-25.9)#78 | 35.2%(-27.9)#2,205 |
| 79. | Kirtland | 7.4% | 33.2%(-25.8)#79 | 35.2%(-27.8)#2,242 |
| 80. | Clarktown | 7.4% | 33.2%(-25.8)#80 | 35.2%(-27.8)#2,251 |
| 81. | North Robinson | 7.4% | 33.2%(-25.8)#81 | 35.2%(-27.8)#2,255 |
| 82. | Valley View | 7.5% | 33.2%(-25.7)#82 | 35.2%(-27.7)#2,288 |
| 83. | Middle Point | 7.5% | 33.2%(-25.7)#83 | 35.2%(-27.7)#2,309 |
| 84. | Ballville | 7.6% | 33.2%(-25.5)#84 | 35.2%(-27.6)#2,362 |
| 85. | Camp Dennison | 7.7% | 33.2%(-25.5)#85 | 35.2%(-27.5)#2,380 |
| 86. | North Perry | 7.7% | 33.2%(-25.4)#86 | 35.2%(-27.4)#2,427 |
| 87. | Pigeon Creek | 7.8% | 33.2%(-25.4)#87 | 35.2%(-27.4)#2,449 |
| 88. | Plainfield | 7.9% | 33.2%(-25.3)#88 | 35.2%(-27.3)#2,489 |
| 89. | Lindsey | 7.9% | 33.2%(-25.3)#89 | 35.2%(-27.3)#2,494 |
| 90. | Bairdstown | 7.9% | 33.2%(-25.3)#90 | 35.2%(-27.3)#2,504 |
| 91. | Bay Village | 8.0% | 33.2%(-25.2)#91 | 35.2%(-27.2)#2,529 |
| 92. | Powell | 8.0% | 33.2%(-25.2)#92 | 35.2%(-27.2)#2,530 |
| 93. | Congress | 8.0% | 33.2%(-25.2)#93 | 35.2%(-27.2)#2,544 |
| 94. | Silver Lake | 8.1% | 33.2%(-25.1)#94 | 35.2%(-27.1)#2,585 |
| 95. | Brecon | 8.3% | 33.2%(-24.9)#95 | 35.2%(-26.9)#2,674 |
| 96. | Day Heights | 8.4% | 33.2%(-24.7)#96 | 35.2%(-26.7)#2,753 |
| 97. | Seven Mile | 8.5% | 33.2%(-24.7)#97 | 35.2%(-26.7)#2,760 |
| 98. | Greentown | 8.5% | 33.2%(-24.7)#98 | 35.2%(-26.7)#2,763 |
| 99. | Dola | 8.5% | 33.2%(-24.7)#99 | 35.2%(-26.7)#2,768 |
| 100. | New Albany | 8.5% | 33.2%(-24.7)#100 | 35.2%(-26.7)#2,774 |
Common Questions
What are the Top 10 Cities with the Lowest Percentage of Renter-Occupied Units in Ohio?
Top 10 Cities with the Lowest Percentage of Renter-Occupied Units in Ohio are:
#1
0.58%
#2
0.72%
#3
1.1%
#4
1.1%
#5
1.2%
#6
1.4%
#7
1.4%
#8
1.5%
#9
1.7%
#10
1.8%
What city has the Lowest Percentage of Renter-Occupied Units in Ohio?
Andersonville has the Lowest Percentage of Renter-Occupied Units in Ohio with 0.58%.
What is the Percentage of Renter-Occupied Units in the State of Ohio?
Percentage of Renter-Occupied Units in Ohio is 33.2%.
What is the Percentage of Renter-Occupied Units in the United States?
Percentage of Renter-Occupied Units in the United States is 35.2%.