Hill Country Village, TX Map & Demographics
Hill Country Village Map
Hill Country Village Overview
$149,928
PER CAPITA INCOME
$250,001
AVG FAMILY INCOME
$244,000
AVG HOUSEHOLD INCOME
41.8%
WAGE / INCOME GAP [ % ]
58.2¢/ $1
WAGE / INCOME GAP [ $ ]
0.55
INEQUALITY / GINI INDEX
802
TOTAL POPULATION
425
MALE POPULATION
377
FEMALE POPULATION
112.73
MALES / 100 FEMALES
88.71
FEMALES / 100 MALES
50.6
MEDIAN AGE
3.3
AVG FAMILY SIZE
3.0
AVG HOUSEHOLD SIZE
413
LABOR FORCE [ PEOPLE ]
60.6%
PERCENT IN LABOR FORCE
2.2%
UNEMPLOYMENT RATE
Hill Country Village Area Codes
Income in Hill Country Village
Income Overview in Hill Country Village
Per Capita Income in Hill Country Village is $149,928, while median incomes of families and households are $250,001 and $244,000 respectively.
| Characteristic | Number | Measure |
| Per Capita Income | 802 | $149,928 |
| Median Family Income | 226 | $250,001 |
| Mean Family Income | 226 | $442,225 |
| Median Household Income | 266 | $244,000 |
| Mean Household Income | 266 | $425,416 |
| Income Deficit | 226 | $0 |
| Wage / Income Gap (%) | 802 | 41.78% |
| Wage / Income Gap ($) | 802 | 58.22¢ per $1 |
| Gini / Inequality Index | 802 | 0.55 |
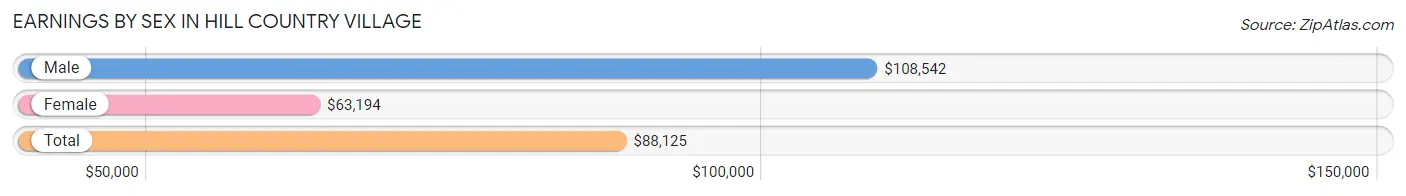
Earnings by Sex in Hill Country Village
Average Earnings in Hill Country Village are $88,125, $108,542 for men and $63,194 for women, a difference of 41.8%.
| Sex | Number | Average Earnings |
| Male | 279 (61.9%) | $108,542 |
| Female | 172 (38.1%) | $63,194 |
| Total | 451 (100.0%) | $88,125 |
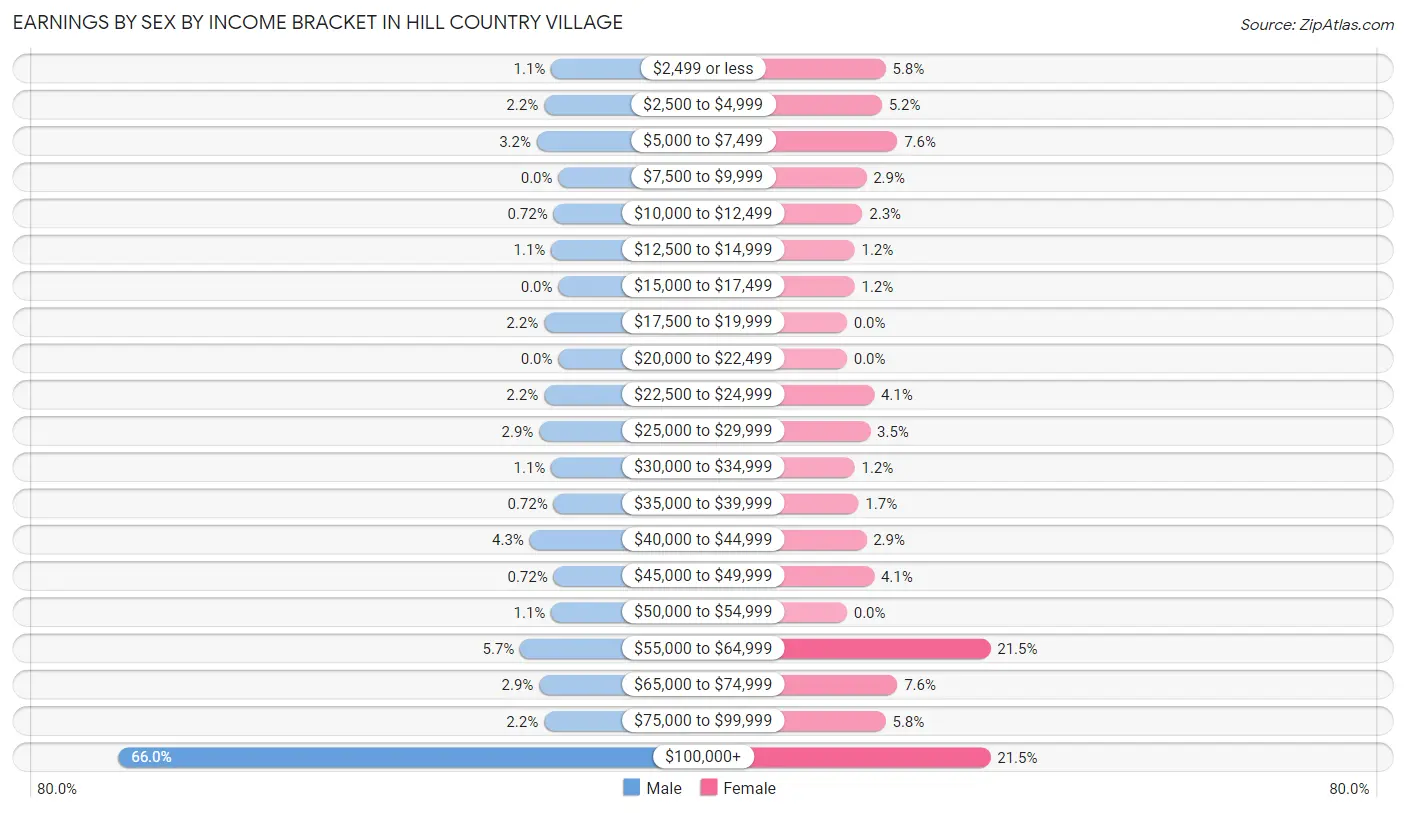
Earnings by Sex by Income Bracket in Hill Country Village
The most common earnings brackets in Hill Country Village are $100,000+ for men (184 | 65.9%) and $55,000 to $64,999 for women (37 | 21.5%).
| Income | Male | Female |
| $2,499 or less | 3 (1.1%) | 10 (5.8%) |
| $2,500 to $4,999 | 6 (2.1%) | 9 (5.2%) |
| $5,000 to $7,499 | 9 (3.2%) | 13 (7.6%) |
| $7,500 to $9,999 | 0 (0.0%) | 5 (2.9%) |
| $10,000 to $12,499 | 2 (0.7%) | 4 (2.3%) |
| $12,500 to $14,999 | 3 (1.1%) | 2 (1.2%) |
| $15,000 to $17,499 | 0 (0.0%) | 2 (1.2%) |
| $17,500 to $19,999 | 6 (2.1%) | 0 (0.0%) |
| $20,000 to $22,499 | 0 (0.0%) | 0 (0.0%) |
| $22,500 to $24,999 | 6 (2.1%) | 7 (4.1%) |
| $25,000 to $29,999 | 8 (2.9%) | 6 (3.5%) |
| $30,000 to $34,999 | 3 (1.1%) | 2 (1.2%) |
| $35,000 to $39,999 | 2 (0.7%) | 3 (1.7%) |
| $40,000 to $44,999 | 12 (4.3%) | 5 (2.9%) |
| $45,000 to $49,999 | 2 (0.7%) | 7 (4.1%) |
| $50,000 to $54,999 | 3 (1.1%) | 0 (0.0%) |
| $55,000 to $64,999 | 16 (5.7%) | 37 (21.5%) |
| $65,000 to $74,999 | 8 (2.9%) | 13 (7.6%) |
| $75,000 to $99,999 | 6 (2.1%) | 10 (5.8%) |
| $100,000+ | 184 (65.9%) | 37 (21.5%) |
| Total | 279 (100.0%) | 172 (100.0%) |
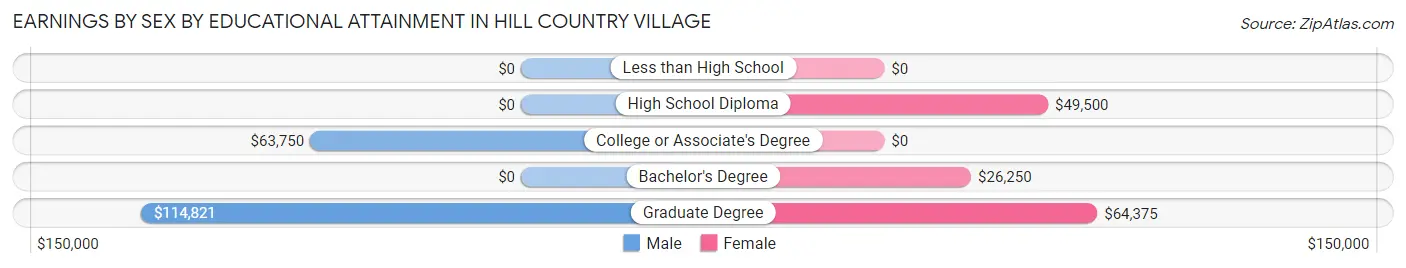
Earnings by Sex by Educational Attainment in Hill Country Village
Average earnings in Hill Country Village are $112,679 for men and $63,889 for women, a difference of 43.3%. Men with an educational attainment of graduate degree enjoy the highest average annual earnings of $114,821, while those with college or associate's degree education earn the least with $63,750. Women with an educational attainment of graduate degree earn the most with the average annual earnings of $64,375, while those with bachelor's degree education have the smallest earnings of $26,250.
| Educational Attainment | Male Income | Female Income |
| Less than High School | - | - |
| High School Diploma | - | - |
| College or Associate's Degree | $63,750 | $0 |
| Bachelor's Degree | - | - |
| Graduate Degree | $114,821 | $64,375 |
| Total | $112,679 | $63,889 |
Family Income in Hill Country Village
Family Income Brackets in Hill Country Village
According to the Hill Country Village family income data, there are 140 families falling into the $200,000+ income range, which is the most common income bracket and makes up 62.0% of all families. Conversely, the $10,000 to $14,999 income bracket is the least frequent group with only 2 families (0.9%) belonging to this category.
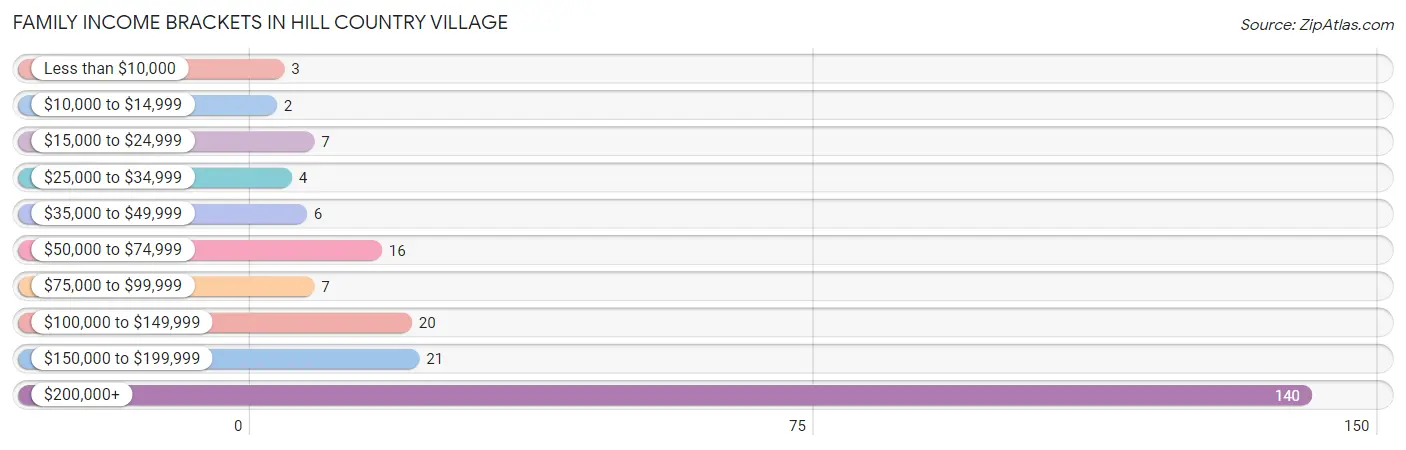
| Income Bracket | # Families | % Families |
| Less than $10,000 | 3 | 1.3% |
| $10,000 to $14,999 | 2 | 0.9% |
| $15,000 to $24,999 | 7 | 3.1% |
| $25,000 to $34,999 | 4 | 1.8% |
| $35,000 to $49,999 | 6 | 2.7% |
| $50,000 to $74,999 | 16 | 7.1% |
| $75,000 to $99,999 | 7 | 3.1% |
| $100,000 to $149,999 | 20 | 8.8% |
| $150,000 to $199,999 | 21 | 9.3% |
| $200,000+ | 140 | 61.9% |
Family Income by Famaliy Size in Hill Country Village
2-person families (120 | 53.1%) account for the highest median family income in Hill Country Village with $250,001 per family, while 2-person families (120 | 53.1%) have the highest median income of $125,000 per family member.
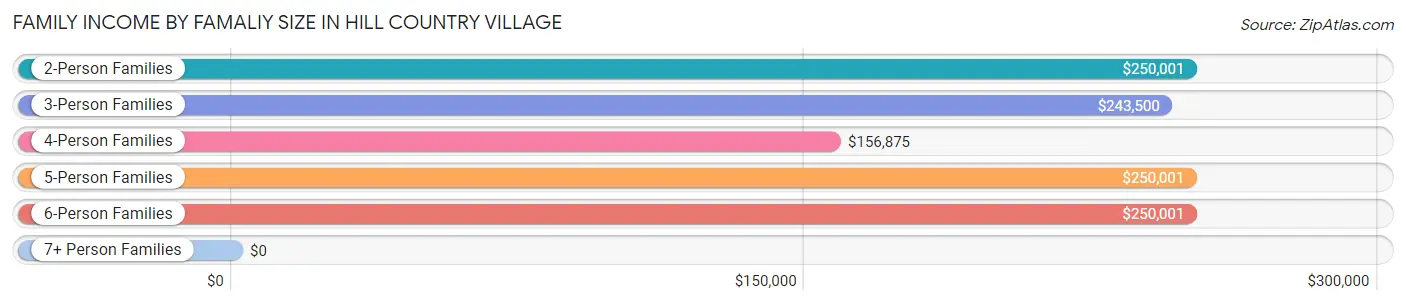
| Income Bracket | # Families | Median Income |
| 2-Person Families | 120 (53.1%) | $250,001 |
| 3-Person Families | 52 (23.0%) | $243,500 |
| 4-Person Families | 25 (11.1%) | $156,875 |
| 5-Person Families | 24 (10.6%) | $250,001 |
| 6-Person Families | 4 (1.8%) | $250,001 |
| 7+ Person Families | 1 (0.4%) | $0 |
| Total | 226 (100.0%) | $250,001 |
Family Income by Number of Earners in Hill Country Village
The median family income in Hill Country Village is $250,001, with families comprising 2 earners (75) having the highest median family income of $250,001, while families with no earners (20) have the lowest median family income of $108,750, accounting for 33.2% and 8.8% of families, respectively.
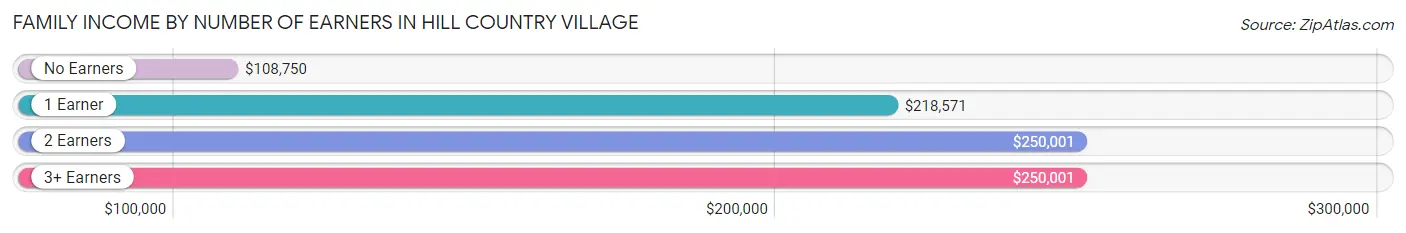
| Number of Earners | # Families | Median Income |
| No Earners | 20 (8.8%) | $108,750 |
| 1 Earner | 98 (43.4%) | $218,571 |
| 2 Earners | 75 (33.2%) | $250,001 |
| 3+ Earners | 33 (14.6%) | $250,001 |
| Total | 226 (100.0%) | $250,001 |
Household Income in Hill Country Village
Household Income Brackets in Hill Country Village
With 157 households falling in the category, the $200,000+ income range is the most frequent in Hill Country Village, accounting for 59.0% of all households. In contrast, only 2 households (0.7%) fall into the $10,000 to $14,999 income bracket, making it the least populous group.
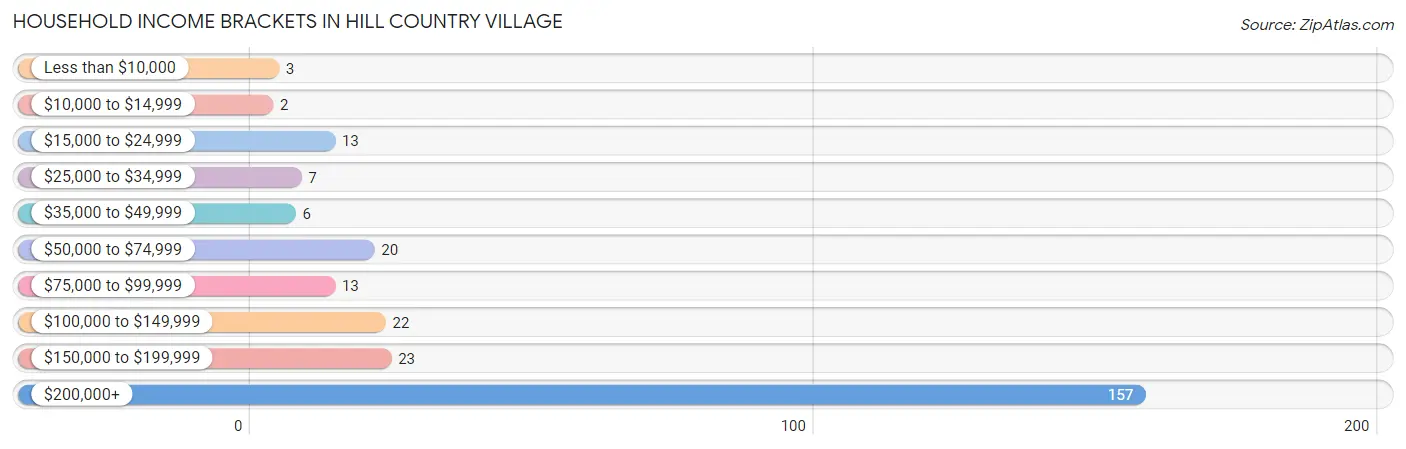
| Income Bracket | # Households | % Households |
| Less than $10,000 | 3 | 1.1% |
| $10,000 to $14,999 | 2 | 0.8% |
| $15,000 to $24,999 | 13 | 4.9% |
| $25,000 to $34,999 | 7 | 2.6% |
| $35,000 to $49,999 | 6 | 2.3% |
| $50,000 to $74,999 | 20 | 7.5% |
| $75,000 to $99,999 | 13 | 4.9% |
| $100,000 to $149,999 | 22 | 8.3% |
| $150,000 to $199,999 | 23 | 8.6% |
| $200,000+ | 157 | 59.0% |
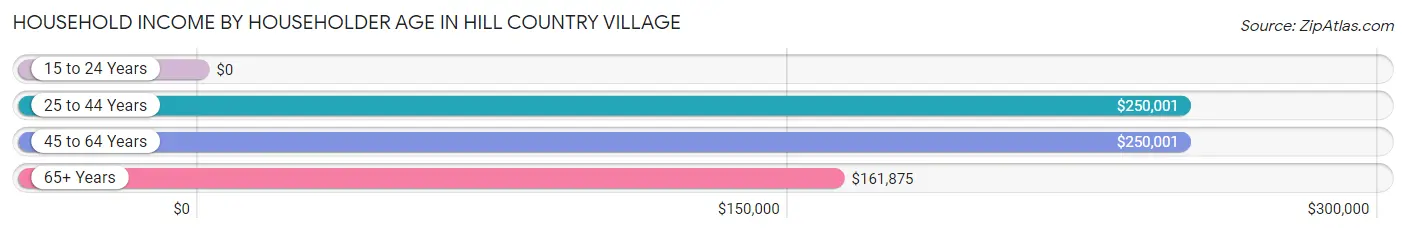
Household Income by Householder Age in Hill Country Village
The median household income in Hill Country Village is $244,000, with the highest median household income of $250,001 found in the 25 to 44 years age bracket for the primary householder. A total of 33 households (12.4%) fall into this category.
| Income Bracket | # Households | Median Income |
| 15 to 24 Years | 0 (0.0%) | $0 |
| 25 to 44 Years | 33 (12.4%) | $250,001 |
| 45 to 64 Years | 96 (36.1%) | $250,001 |
| 65+ Years | 137 (51.5%) | $161,875 |
| Total | 266 (100.0%) | $244,000 |
Poverty in Hill Country Village
Income Below Poverty by Sex and Age in Hill Country Village
With 3.8% poverty level for males and 2.1% for females among the residents of Hill Country Village, 12 to 14 year old males and 35 to 44 year old females are the most vulnerable to poverty, with 2 males (28.6%) and 3 females (10.7%) in their respective age groups living below the poverty level.
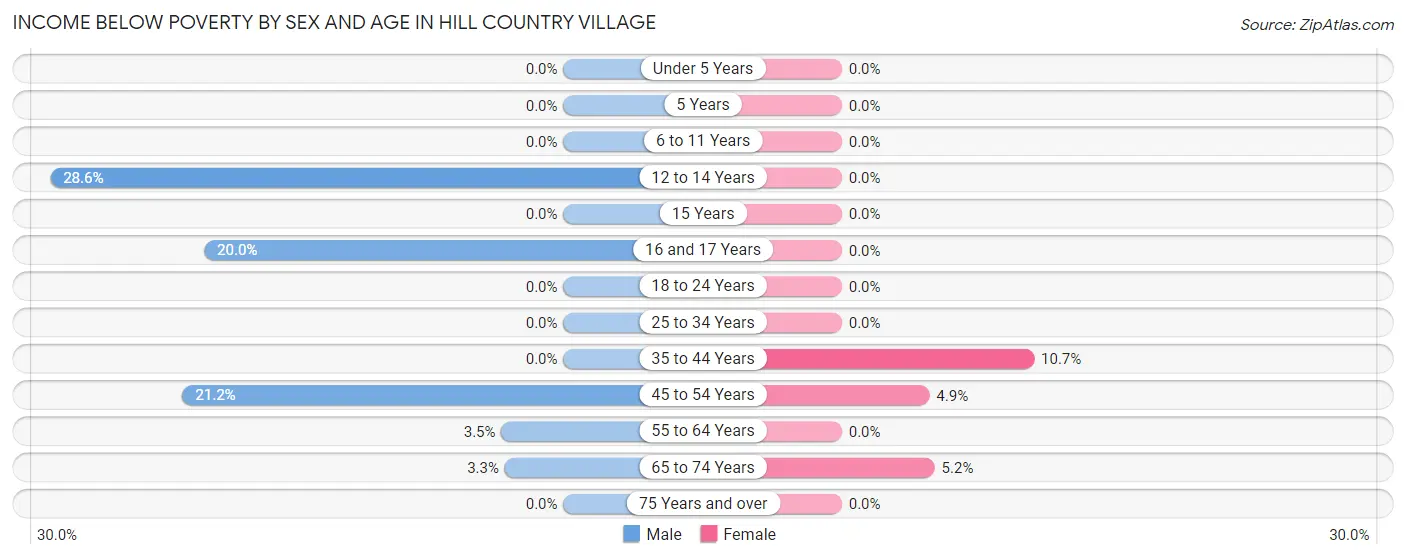
| Age Bracket | Male | Female |
| Under 5 Years | 0 (0.0%) | 0 (0.0%) |
| 5 Years | 0 (0.0%) | 0 (0.0%) |
| 6 to 11 Years | 0 (0.0%) | 0 (0.0%) |
| 12 to 14 Years | 2 (28.6%) | 0 (0.0%) |
| 15 Years | 0 (0.0%) | 0 (0.0%) |
| 16 and 17 Years | 2 (20.0%) | 0 (0.0%) |
| 18 to 24 Years | 0 (0.0%) | 0 (0.0%) |
| 25 to 34 Years | 0 (0.0%) | 0 (0.0%) |
| 35 to 44 Years | 0 (0.0%) | 3 (10.7%) |
| 45 to 54 Years | 7 (21.2%) | 2 (4.9%) |
| 55 to 64 Years | 2 (3.5%) | 0 (0.0%) |
| 65 to 74 Years | 3 (3.3%) | 3 (5.2%) |
| 75 Years and over | 0 (0.0%) | 0 (0.0%) |
| Total | 16 (3.8%) | 8 (2.1%) |
Income Above Poverty by Sex and Age in Hill Country Village
According to the poverty statistics in Hill Country Village, males aged under 5 years and females aged under 5 years are the age groups that are most secure financially, with 100.0% of males and 100.0% of females in these age groups living above the poverty line.
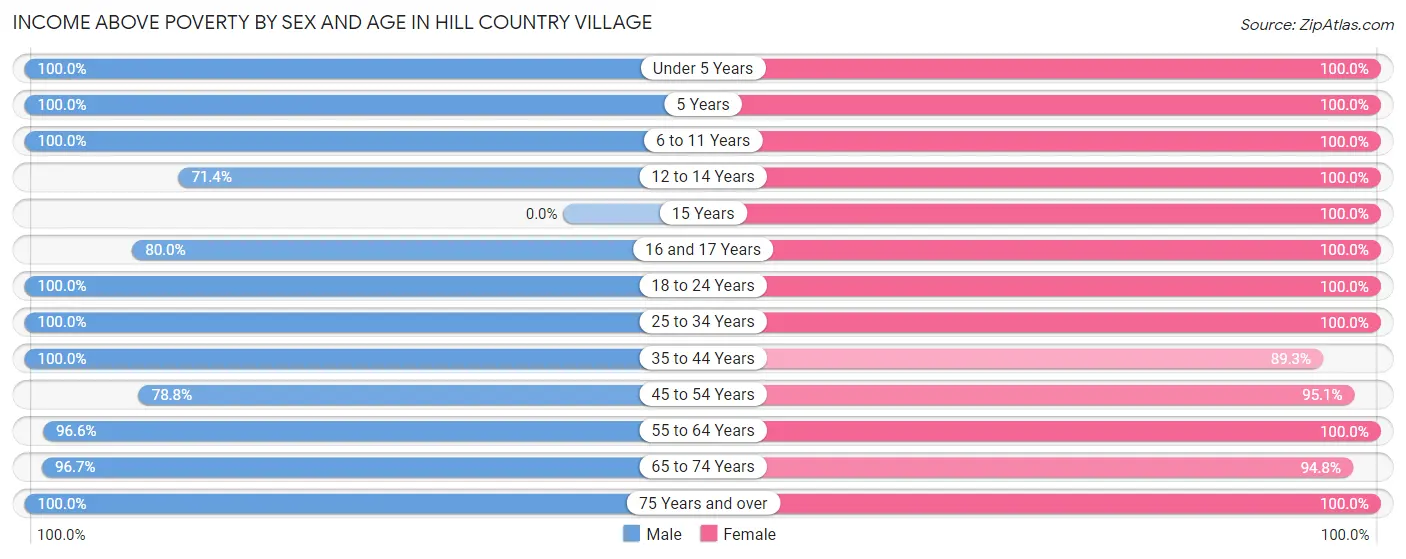
| Age Bracket | Male | Female |
| Under 5 Years | 51 (100.0%) | 16 (100.0%) |
| 5 Years | 1 (100.0%) | 4 (100.0%) |
| 6 to 11 Years | 14 (100.0%) | 17 (100.0%) |
| 12 to 14 Years | 5 (71.4%) | 7 (100.0%) |
| 15 Years | 0 (0.0%) | 1 (100.0%) |
| 16 and 17 Years | 8 (80.0%) | 7 (100.0%) |
| 18 to 24 Years | 12 (100.0%) | 29 (100.0%) |
| 25 to 34 Years | 80 (100.0%) | 51 (100.0%) |
| 35 to 44 Years | 29 (100.0%) | 25 (89.3%) |
| 45 to 54 Years | 26 (78.8%) | 39 (95.1%) |
| 55 to 64 Years | 56 (96.6%) | 76 (100.0%) |
| 65 to 74 Years | 89 (96.7%) | 55 (94.8%) |
| 75 Years and over | 38 (100.0%) | 40 (100.0%) |
| Total | 409 (96.2%) | 367 (97.9%) |
Income Below Poverty Among Married-Couple Families in Hill Country Village
The poverty statistics for married-couple families in Hill Country Village show that 2.4% or 5 of the total 210 families live below the poverty line. Families with 1 or 2 children have the highest poverty rate of 4.2%, comprising of 2 families. On the other hand, families with 3 or 4 children have the lowest poverty rate of 0.0%, which includes 0 families.
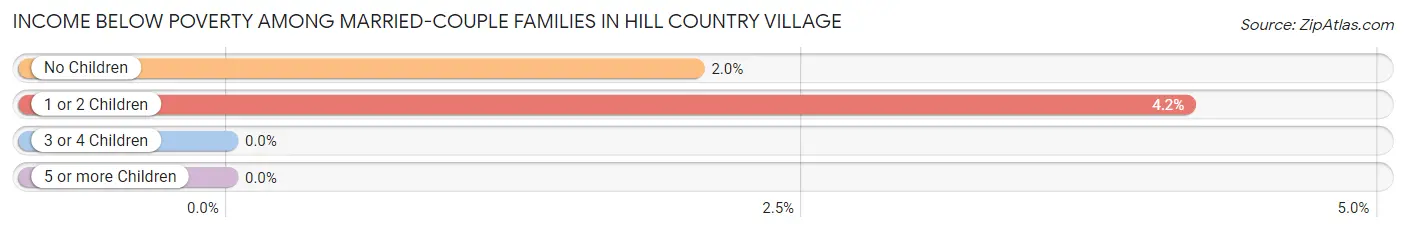
| Children | Above Poverty | Below Poverty |
| No Children | 145 (98.0%) | 3 (2.0%) |
| 1 or 2 Children | 46 (95.8%) | 2 (4.2%) |
| 3 or 4 Children | 13 (100.0%) | 0 (0.0%) |
| 5 or more Children | 1 (100.0%) | 0 (0.0%) |
| Total | 205 (97.6%) | 5 (2.4%) |
Income Below Poverty Among Single-Parent Households in Hill Country Village
| Children | Single Father | Single Mother |
| No Children | 0 (0.0%) | 0 (0.0%) |
| 1 or 2 Children | 0 (0.0%) | 0 (0.0%) |
| 3 or 4 Children | 0 (0.0%) | 0 (0.0%) |
| 5 or more Children | 0 (0.0%) | 0 (0.0%) |
| Total | 0 (0.0%) | 0 (0.0%) |
Income Below Poverty Among Married-Couple vs Single-Parent Households in Hill Country Village
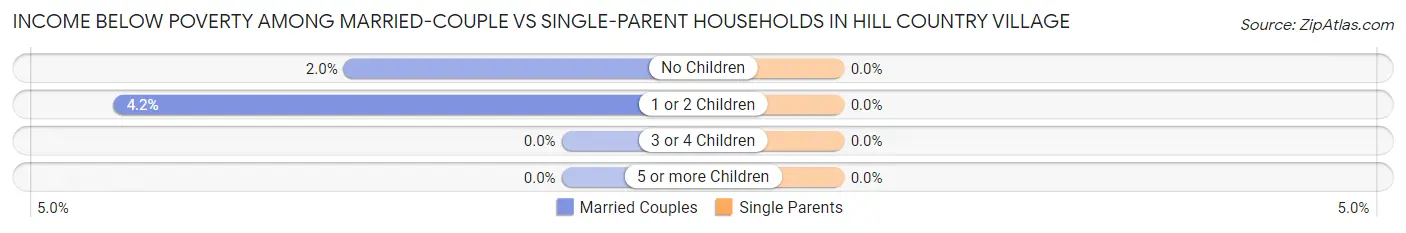
| Children | Married-Couple Families | Single-Parent Households |
| No Children | 3 (2.0%) | 0 (0.0%) |
| 1 or 2 Children | 2 (4.2%) | 0 (0.0%) |
| 3 or 4 Children | 0 (0.0%) | 0 (0.0%) |
| 5 or more Children | 0 (0.0%) | 0 (0.0%) |
| Total | 5 (2.4%) | 0 (0.0%) |
Race in Hill Country Village
The most populous races in Hill Country Village are White / Caucasian (610 | 76.1%), Black / African American (132 | 16.5%), and Hispanic or Latino (102 | 12.7%).
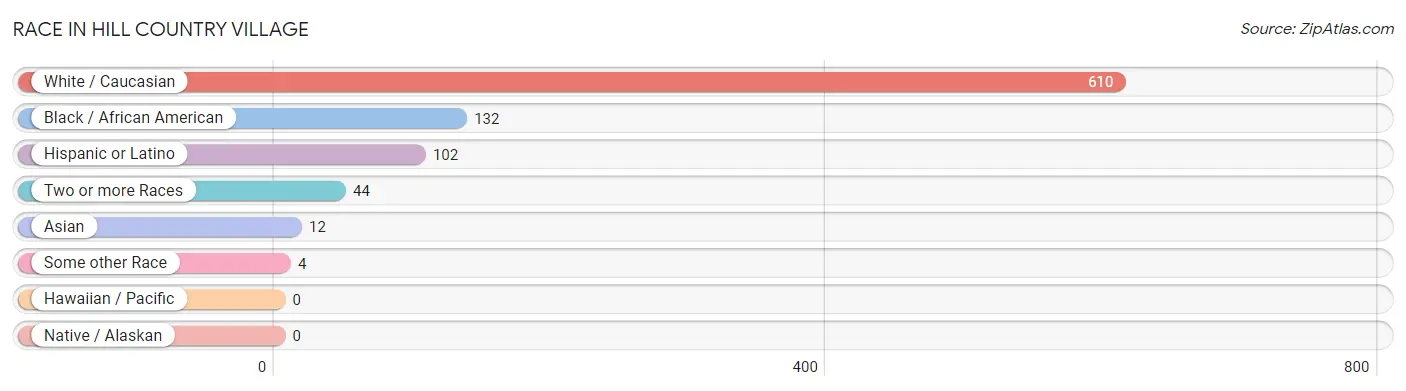
| Race | # Population | % Population |
| Asian | 12 | 1.5% |
| Black / African American | 132 | 16.5% |
| Hawaiian / Pacific | 0 | 0.0% |
| Hispanic or Latino | 102 | 12.7% |
| Native / Alaskan | 0 | 0.0% |
| White / Caucasian | 610 | 76.1% |
| Two or more Races | 44 | 5.5% |
| Some other Race | 4 | 0.5% |
| Total | 802 | 100.0% |
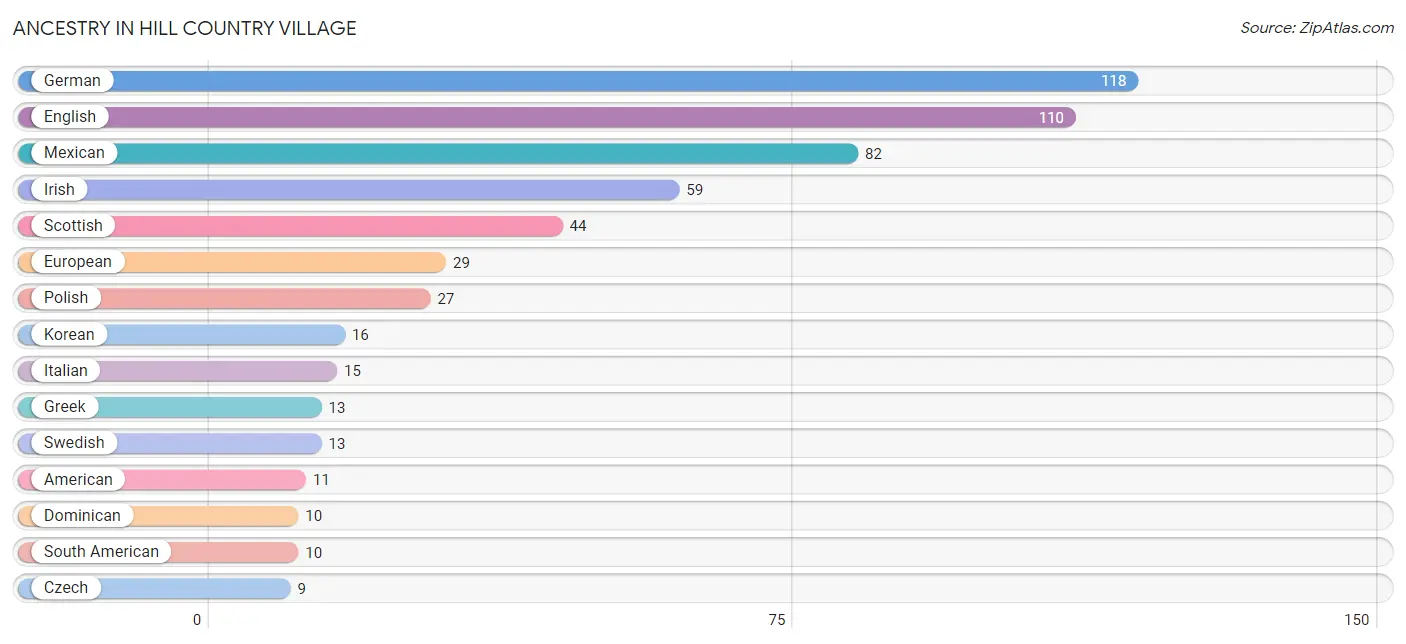
Ancestry in Hill Country Village
The most populous ancestries reported in Hill Country Village are German (118 | 14.7%), English (110 | 13.7%), Mexican (82 | 10.2%), Irish (59 | 7.4%), and Scottish (44 | 5.5%), together accounting for 51.5% of all Hill Country Village residents.
| Ancestry | # Population | % Population |
| Alsatian | 2 | 0.3% |
| American | 11 | 1.4% |
| Arab | 4 | 0.5% |
| Austrian | 1 | 0.1% |
| Bhutanese | 1 | 0.1% |
| British | 3 | 0.4% |
| Burmese | 1 | 0.1% |
| Chippewa | 4 | 0.5% |
| Colombian | 4 | 0.5% |
| Czech | 9 | 1.1% |
| Czechoslovakian | 3 | 0.4% |
| Dominican | 10 | 1.3% |
| Dutch | 2 | 0.3% |
| Eastern European | 4 | 0.5% |
| English | 110 | 13.7% |
| European | 29 | 3.6% |
| Filipino | 6 | 0.7% |
| French | 6 | 0.7% |
| French Canadian | 7 | 0.9% |
| German | 118 | 14.7% |
| Greek | 13 | 1.6% |
| Indian (Asian) | 8 | 1.0% |
| Iranian | 2 | 0.3% |
| Irish | 59 | 7.4% |
| Italian | 15 | 1.9% |
| Korean | 16 | 2.0% |
| Lebanese | 4 | 0.5% |
| Mexican | 82 | 10.2% |
| Norwegian | 4 | 0.5% |
| Osage | 2 | 0.3% |
| Pakistani | 4 | 0.5% |
| Polish | 27 | 3.4% |
| Russian | 6 | 0.7% |
| Scotch-Irish | 8 | 1.0% |
| Scottish | 44 | 5.5% |
| Slovak | 1 | 0.1% |
| South American | 10 | 1.3% |
| Swedish | 13 | 1.6% |
| Swiss | 3 | 0.4% |
| Thai | 4 | 0.5% |
| Venezuelan | 6 | 0.7% |
| Welsh | 1 | 0.1% | View All 42 Rows |
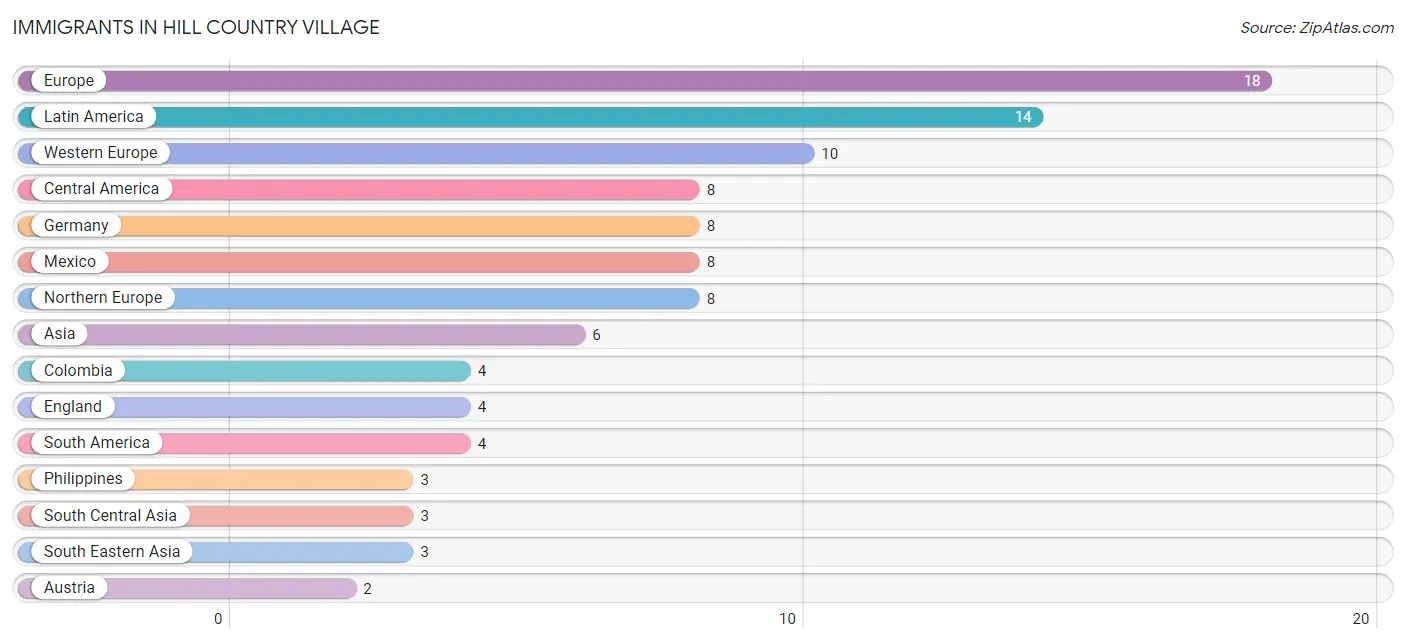
Immigrants in Hill Country Village
The most numerous immigrant groups reported in Hill Country Village came from Europe (18 | 2.2%), Latin America (14 | 1.8%), Western Europe (10 | 1.3%), Central America (8 | 1.0%), and Germany (8 | 1.0%), together accounting for 7.2% of all Hill Country Village residents.
| Immigration Origin | # Population | % Population |
| Asia | 6 | 0.7% |
| Austria | 2 | 0.3% |
| Caribbean | 2 | 0.3% |
| Central America | 8 | 1.0% |
| Colombia | 4 | 0.5% |
| Dominican Republic | 2 | 0.3% |
| England | 4 | 0.5% |
| Europe | 18 | 2.2% |
| Germany | 8 | 1.0% |
| India | 1 | 0.1% |
| Iran | 2 | 0.3% |
| Latin America | 14 | 1.8% |
| Mexico | 8 | 1.0% |
| Northern Europe | 8 | 1.0% |
| Philippines | 3 | 0.4% |
| South America | 4 | 0.5% |
| South Central Asia | 3 | 0.4% |
| South Eastern Asia | 3 | 0.4% |
| Western Europe | 10 | 1.3% | View All 19 Rows |
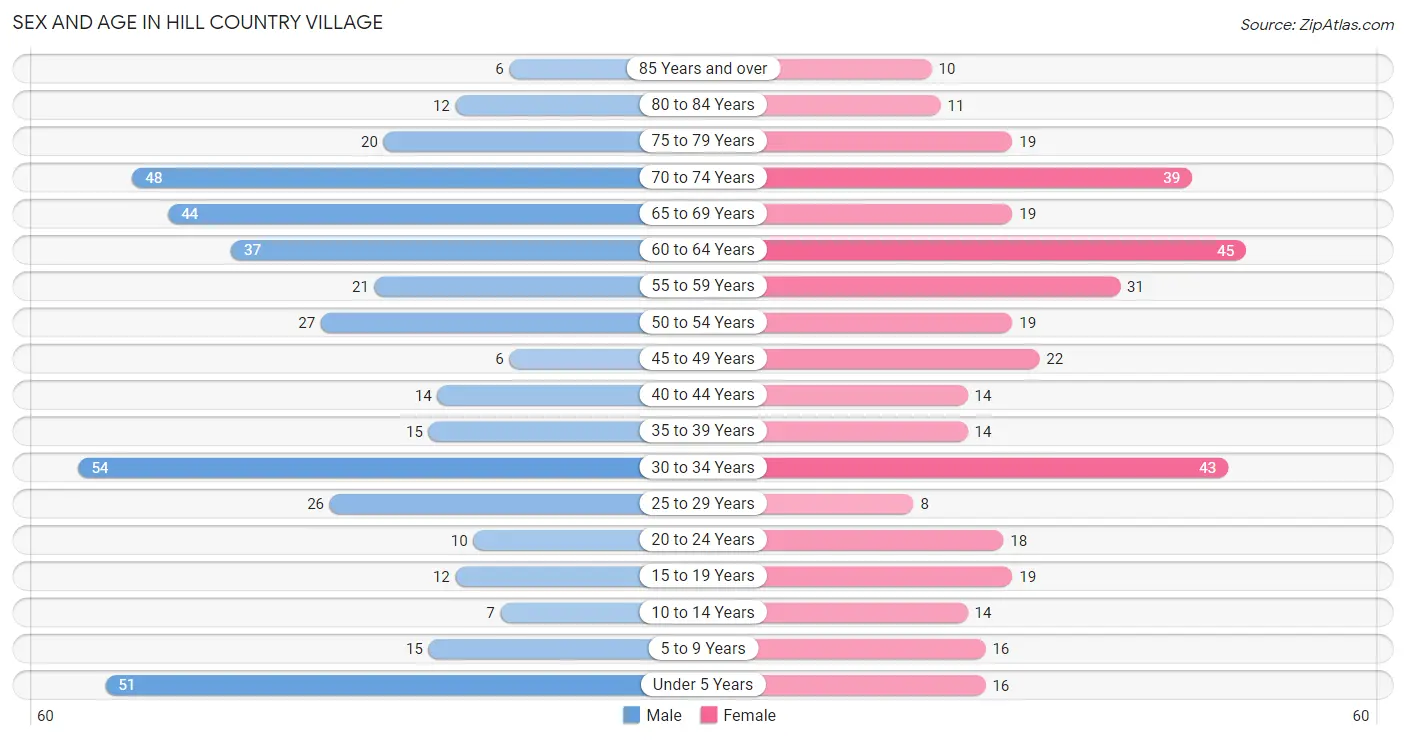
Sex and Age in Hill Country Village
Sex and Age in Hill Country Village
The most populous age groups in Hill Country Village are 30 to 34 Years (54 | 12.7%) for men and 60 to 64 Years (45 | 11.9%) for women.
| Age Bracket | Male | Female |
| Under 5 Years | 51 (12.0%) | 16 (4.2%) |
| 5 to 9 Years | 15 (3.5%) | 16 (4.2%) |
| 10 to 14 Years | 7 (1.7%) | 14 (3.7%) |
| 15 to 19 Years | 12 (2.8%) | 19 (5.0%) |
| 20 to 24 Years | 10 (2.4%) | 18 (4.8%) |
| 25 to 29 Years | 26 (6.1%) | 8 (2.1%) |
| 30 to 34 Years | 54 (12.7%) | 43 (11.4%) |
| 35 to 39 Years | 15 (3.5%) | 14 (3.7%) |
| 40 to 44 Years | 14 (3.3%) | 14 (3.7%) |
| 45 to 49 Years | 6 (1.4%) | 22 (5.8%) |
| 50 to 54 Years | 27 (6.4%) | 19 (5.0%) |
| 55 to 59 Years | 21 (4.9%) | 31 (8.2%) |
| 60 to 64 Years | 37 (8.7%) | 45 (11.9%) |
| 65 to 69 Years | 44 (10.3%) | 19 (5.0%) |
| 70 to 74 Years | 48 (11.3%) | 39 (10.3%) |
| 75 to 79 Years | 20 (4.7%) | 19 (5.0%) |
| 80 to 84 Years | 12 (2.8%) | 11 (2.9%) |
| 85 Years and over | 6 (1.4%) | 10 (2.6%) |
| Total | 425 (100.0%) | 377 (100.0%) |
Families and Households in Hill Country Village
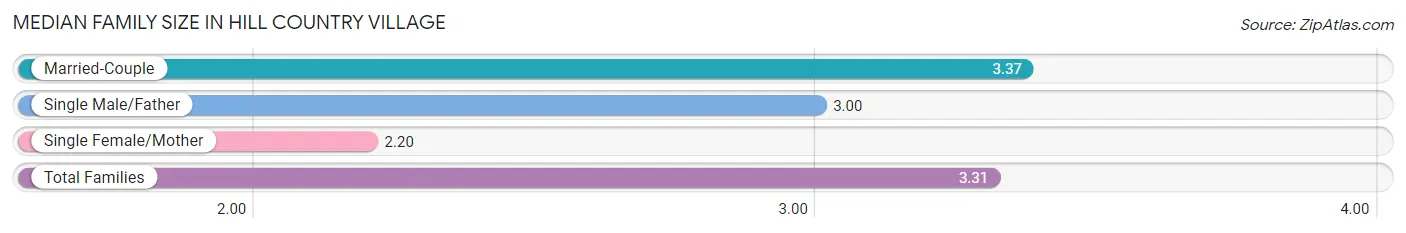
Median Family Size in Hill Country Village
The median family size in Hill Country Village is 3.31 persons per family, with married-couple families (210 | 92.9%) accounting for the largest median family size of 3.37 persons per family. On the other hand, single female/mother families (10 | 4.4%) represent the smallest median family size with 2.20 persons per family.
| Family Type | # Families | Family Size |
| Married-Couple | 210 (92.9%) | 3.37 |
| Single Male/Father | 6 (2.6%) | 3.00 |
| Single Female/Mother | 10 (4.4%) | 2.20 |
| Total Families | 226 (100.0%) | 3.31 |
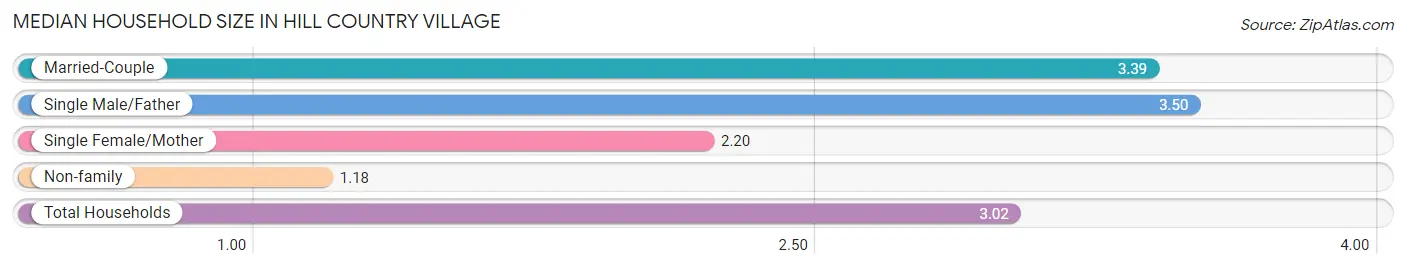
Median Household Size in Hill Country Village
The median household size in Hill Country Village is 3.02 persons per household, with single male/father households (6 | 2.3%) accounting for the largest median household size of 3.5 persons per household. non-family households (40 | 15.0%) represent the smallest median household size with 1.18 persons per household.
| Household Type | # Households | Household Size |
| Married-Couple | 210 (78.9%) | 3.39 |
| Single Male/Father | 6 (2.3%) | 3.50 |
| Single Female/Mother | 10 (3.8%) | 2.20 |
| Non-family | 40 (15.0%) | 1.18 |
| Total Households | 266 (100.0%) | 3.02 |
Household Size by Marriage Status in Hill Country Village
Out of a total of 266 households in Hill Country Village, 226 (85.0%) are family households, while 40 (15.0%) are nonfamily households. The most numerous type of family households are 2-person households, comprising 118, and the most common type of nonfamily households are 1-person households, comprising 34.
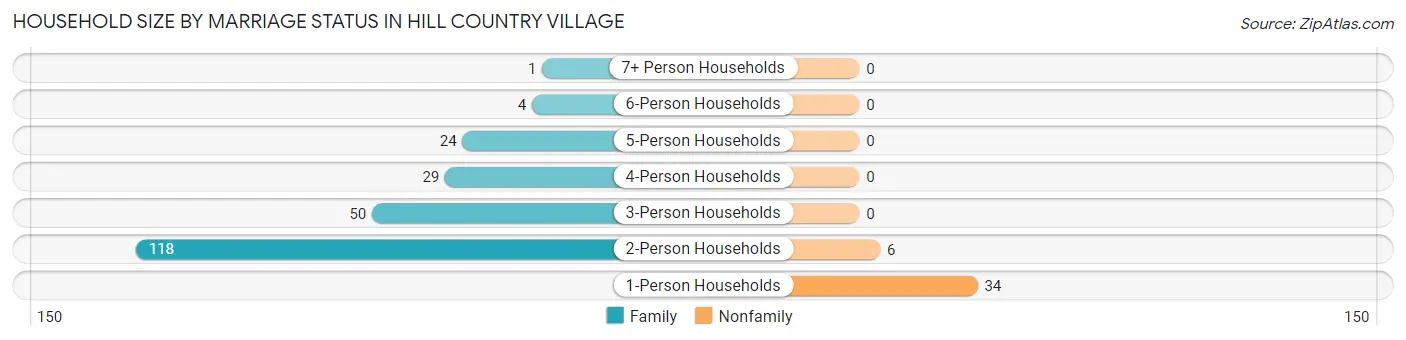
| Household Size | Family Households | Nonfamily Households |
| 1-Person Households | - | 34 (12.8%) |
| 2-Person Households | 118 (44.4%) | 6 (2.3%) |
| 3-Person Households | 50 (18.8%) | 0 (0.0%) |
| 4-Person Households | 29 (10.9%) | 0 (0.0%) |
| 5-Person Households | 24 (9.0%) | 0 (0.0%) |
| 6-Person Households | 4 (1.5%) | 0 (0.0%) |
| 7+ Person Households | 1 (0.4%) | 0 (0.0%) |
| Total | 226 (85.0%) | 40 (15.0%) |
Female Fertility in Hill Country Village
Fertility by Age in Hill Country Village
Average fertility rate in Hill Country Village is 57.0 births per 1,000 women. Women in the age bracket of 20 to 34 years have the highest fertility rate with 87.0 births per 1,000 women. Women in the age bracket of 20 to 34 years acount for 75.0% of all women with births.
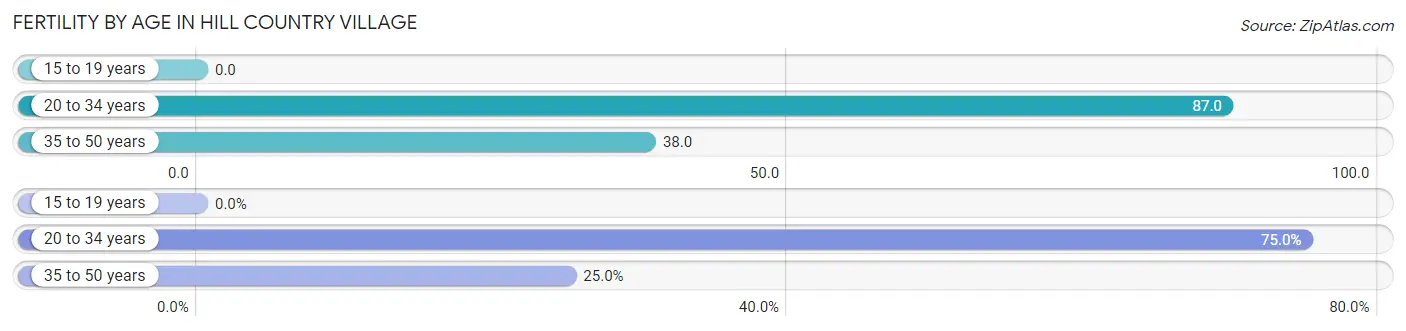
| Age Bracket | Women with Births | Births / 1,000 Women |
| 15 to 19 years | 0 (0.0%) | 0.0 |
| 20 to 34 years | 6 (75.0%) | 87.0 |
| 35 to 50 years | 2 (25.0%) | 38.0 |
| Total | 8 (100.0%) | 57.0 |
Fertility by Age by Marriage Status in Hill Country Village
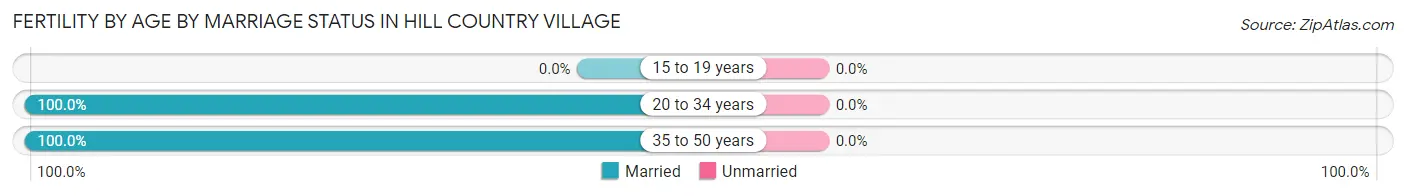
| Age Bracket | Married | Unmarried |
| 15 to 19 years | 0 (0.0%) | 0 (0.0%) |
| 20 to 34 years | 6 (100.0%) | 0 (0.0%) |
| 35 to 50 years | 2 (100.0%) | 0 (0.0%) |
| Total | 8 (100.0%) | 0 (0.0%) |
Fertility by Education in Hill Country Village
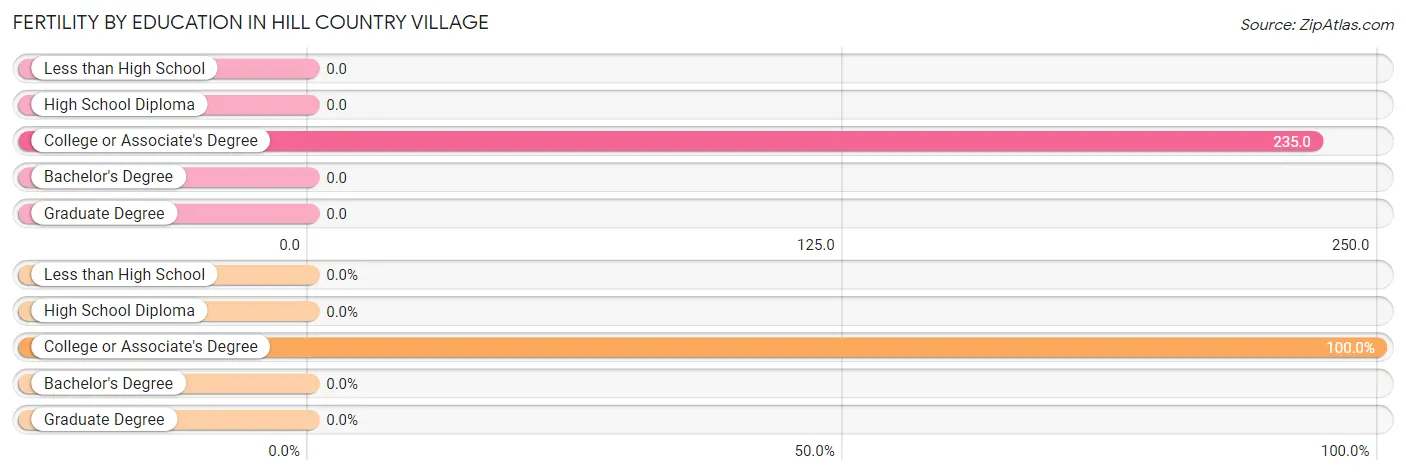
| Educational Attainment | Women with Births | Births / 1,000 Women |
| Less than High School | 0 (0.0%) | 0.0 |
| High School Diploma | 0 (0.0%) | 0.0 |
| College or Associate's Degree | 8 (100.0%) | 235.0 |
| Bachelor's Degree | 0 (0.0%) | 0.0 |
| Graduate Degree | 0 (0.0%) | 0.0 |
| Total | 8 (100.0%) | 57.0 |
Fertility by Education by Marriage Status in Hill Country Village
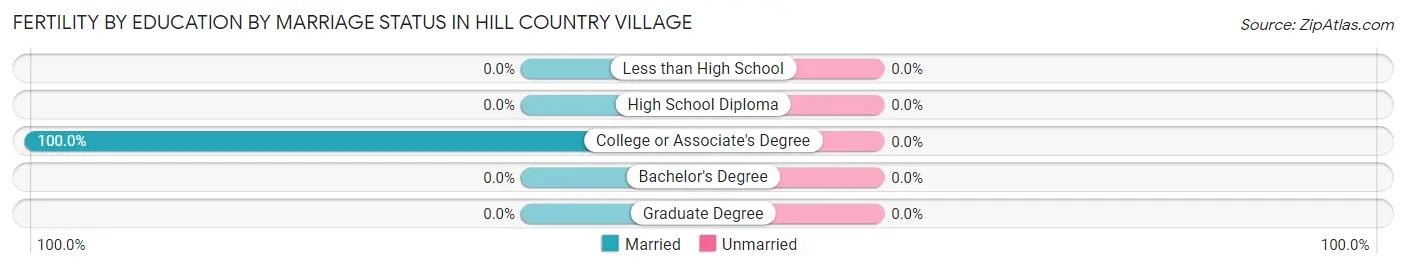
| Educational Attainment | Married | Unmarried |
| Less than High School | 0 (0.0%) | 0 (0.0%) |
| High School Diploma | 0 (0.0%) | 0 (0.0%) |
| College or Associate's Degree | 8 (100.0%) | 0 (0.0%) |
| Bachelor's Degree | 0 (0.0%) | 0 (0.0%) |
| Graduate Degree | 0 (0.0%) | 0 (0.0%) |
| Total | 8 (100.0%) | 0 (0.0%) |
Employment Characteristics in Hill Country Village
Employment by Class of Employer in Hill Country Village
Among the 402 employed individuals in Hill Country Village, private company employees (206 | 51.2%), self-employed (incorporated) (104 | 25.9%), and self-employed (not incorporated) (37 | 9.2%) make up the most common classes of employment.
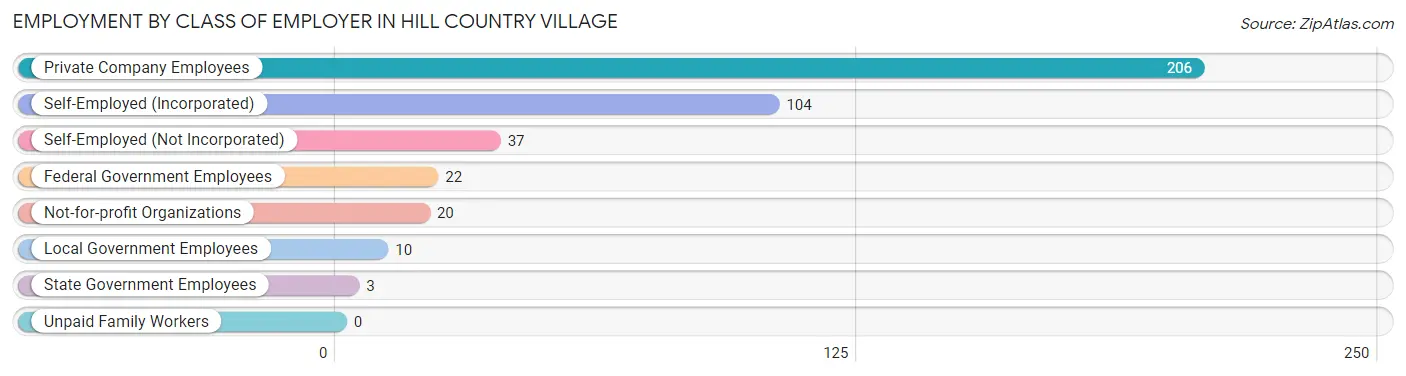
| Employer Class | # Employees | % Employees |
| Private Company Employees | 206 | 51.2% |
| Self-Employed (Incorporated) | 104 | 25.9% |
| Self-Employed (Not Incorporated) | 37 | 9.2% |
| Not-for-profit Organizations | 20 | 5.0% |
| Local Government Employees | 10 | 2.5% |
| State Government Employees | 3 | 0.7% |
| Federal Government Employees | 22 | 5.5% |
| Unpaid Family Workers | 0 | 0.0% |
| Total | 402 | 100.0% |
Employment Status by Age in Hill Country Village
According to the labor force statistics for Hill Country Village, out of the total population over 16 years of age (682), 60.6% or 413 individuals are in the labor force, with 2.2% or 9 of them unemployed. The age group with the highest labor force participation rate is 30 to 34 years, with 88.7% or 86 individuals in the labor force. Within the labor force, the 20 to 24 years age range has the highest percentage of unemployed individuals, with 34.8% or 8 of them being unemployed.
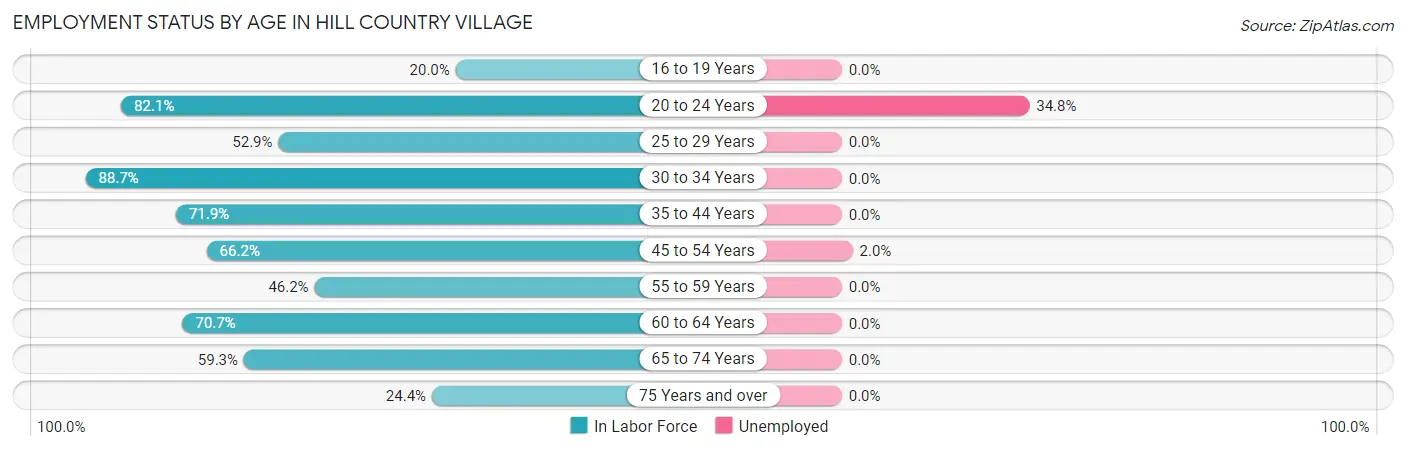
| Age Bracket | In Labor Force | Unemployed |
| 16 to 19 Years | 6 (20.0%) | 0 (0.0%) |
| 20 to 24 Years | 23 (82.1%) | 8 (34.8%) |
| 25 to 29 Years | 18 (52.9%) | 0 (0.0%) |
| 30 to 34 Years | 86 (88.7%) | 0 (0.0%) |
| 35 to 44 Years | 41 (71.9%) | 0 (0.0%) |
| 45 to 54 Years | 49 (66.2%) | 1 (2.0%) |
| 55 to 59 Years | 24 (46.2%) | 0 (0.0%) |
| 60 to 64 Years | 58 (70.7%) | 0 (0.0%) |
| 65 to 74 Years | 89 (59.3%) | 0 (0.0%) |
| 75 Years and over | 19 (24.4%) | 0 (0.0%) |
| Total | 413 (60.6%) | 9 (2.2%) |
Employment Status by Educational Attainment in Hill Country Village
According to labor force statistics for Hill Country Village, 69.7% of individuals (276) out of the total population between 25 and 64 years of age (396) are in the labor force, with 0.4% or 1 of them being unemployed. The group with the highest labor force participation rate are those with the educational attainment of bachelor's degree or higher, with 78.1% or 214 individuals in the labor force. Within the labor force, individuals with less than high school education have the highest percentage of unemployment, with 100.0% or 1 of them being unemployed.
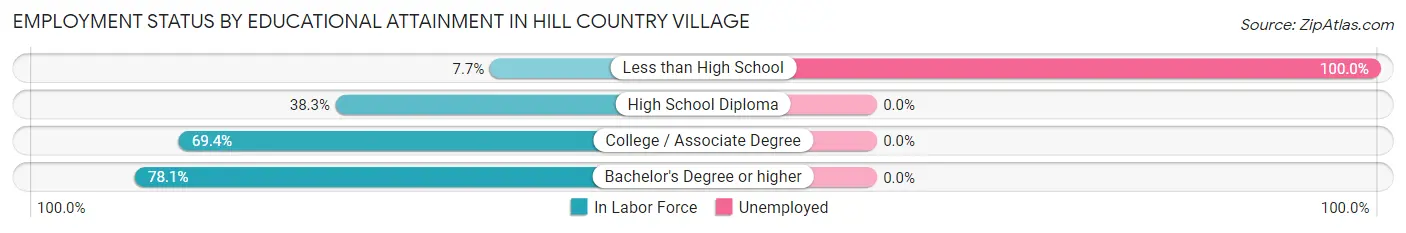
| Educational Attainment | In Labor Force | Unemployed |
| Less than High School | 1 (7.7%) | 13 (100.0%) |
| High School Diploma | 18 (38.3%) | 0 (0.0%) |
| College / Associate Degree | 43 (69.4%) | 0 (0.0%) |
| Bachelor's Degree or higher | 214 (78.1%) | 0 (0.0%) |
| Total | 276 (69.7%) | 2 (0.4%) |
Employment Occupations by Sex in Hill Country Village
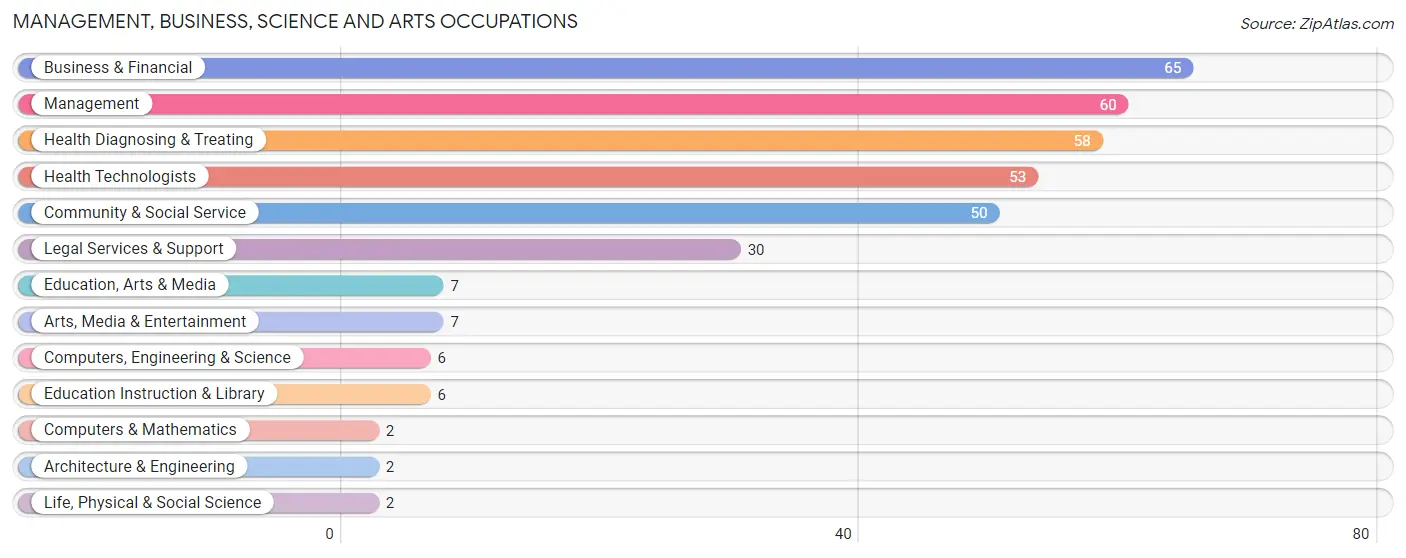
Management, Business, Science and Arts Occupations
The most common Management, Business, Science and Arts occupations in Hill Country Village are Business & Financial (65 | 16.4%), Management (60 | 15.1%), Health Diagnosing & Treating (58 | 14.6%), Health Technologists (53 | 13.4%), and Community & Social Service (50 | 12.6%).
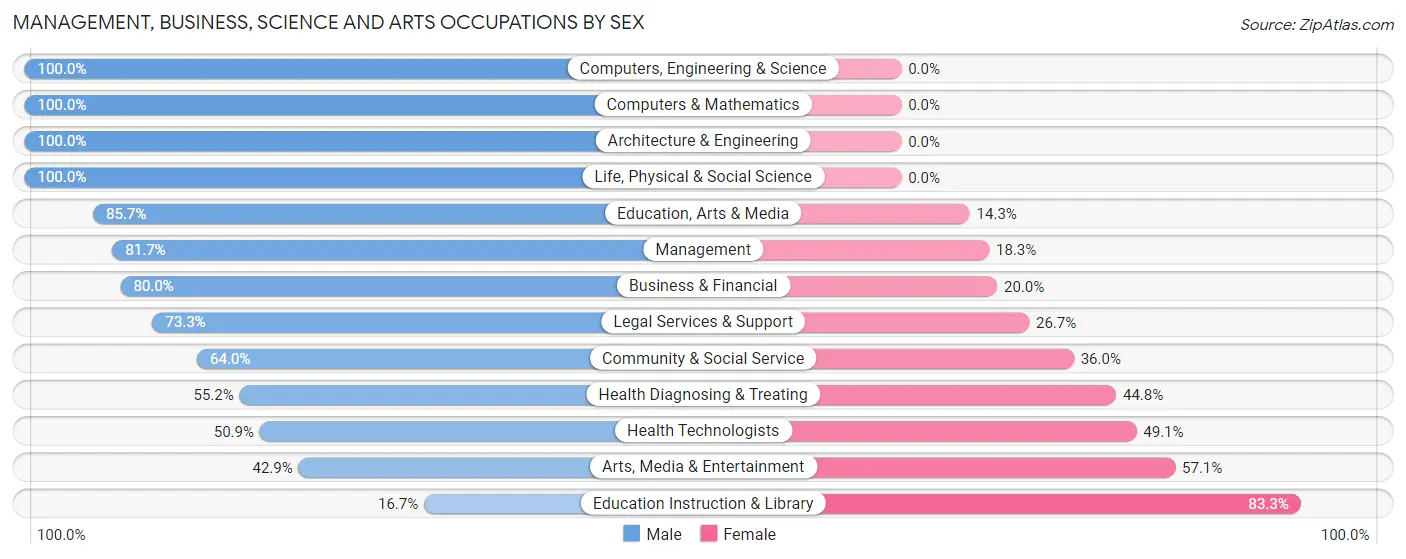
Management, Business, Science and Arts Occupations by Sex
Within the Management, Business, Science and Arts occupations in Hill Country Village, the most male-oriented occupations are Computers, Engineering & Science (100.0%), Computers & Mathematics (100.0%), and Architecture & Engineering (100.0%), while the most female-oriented occupations are Education Instruction & Library (83.3%), Arts, Media & Entertainment (57.1%), and Health Technologists (49.1%).
| Occupation | Male | Female |
| Management | 49 (81.7%) | 11 (18.3%) |
| Business & Financial | 52 (80.0%) | 13 (20.0%) |
| Computers, Engineering & Science | 6 (100.0%) | 0 (0.0%) |
| Computers & Mathematics | 2 (100.0%) | 0 (0.0%) |
| Architecture & Engineering | 2 (100.0%) | 0 (0.0%) |
| Life, Physical & Social Science | 2 (100.0%) | 0 (0.0%) |
| Community & Social Service | 32 (64.0%) | 18 (36.0%) |
| Education, Arts & Media | 6 (85.7%) | 1 (14.3%) |
| Legal Services & Support | 22 (73.3%) | 8 (26.7%) |
| Education Instruction & Library | 1 (16.7%) | 5 (83.3%) |
| Arts, Media & Entertainment | 3 (42.9%) | 4 (57.1%) |
| Health Diagnosing & Treating | 32 (55.2%) | 26 (44.8%) |
| Health Technologists | 27 (50.9%) | 26 (49.1%) |
| Total (Category) | 171 (71.6%) | 68 (28.4%) |
| Total (Overall) | 248 (62.5%) | 149 (37.5%) |
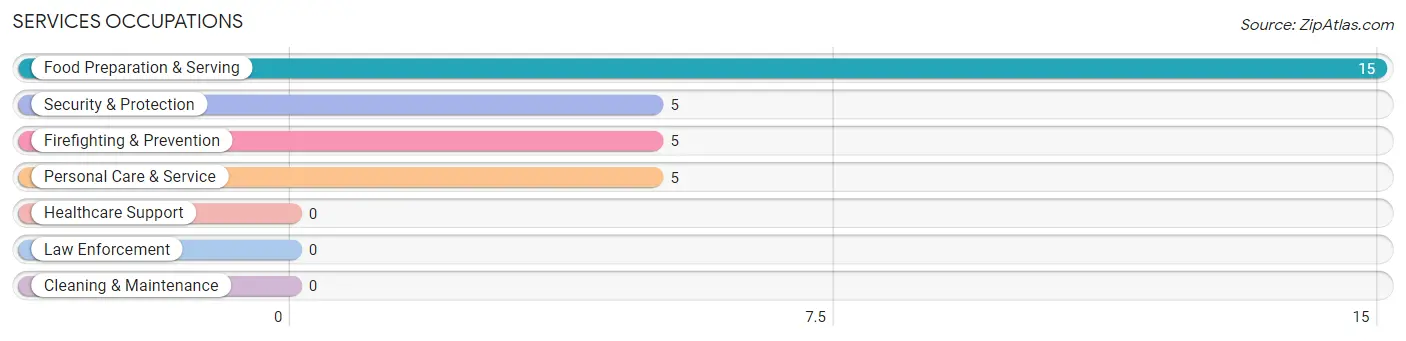
Services Occupations
The most common Services occupations in Hill Country Village are Food Preparation & Serving (15 | 3.8%), Security & Protection (5 | 1.3%), Firefighting & Prevention (5 | 1.3%), and Personal Care & Service (5 | 1.3%).
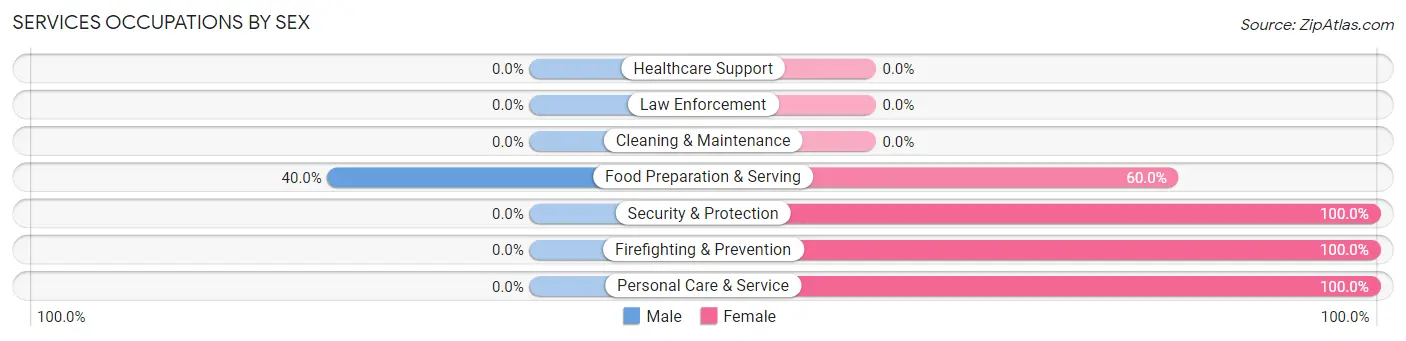
Services Occupations by Sex
| Occupation | Male | Female |
| Healthcare Support | 0 (0.0%) | 0 (0.0%) |
| Security & Protection | 0 (0.0%) | 5 (100.0%) |
| Firefighting & Prevention | 0 (0.0%) | 5 (100.0%) |
| Law Enforcement | 0 (0.0%) | 0 (0.0%) |
| Food Preparation & Serving | 6 (40.0%) | 9 (60.0%) |
| Cleaning & Maintenance | 0 (0.0%) | 0 (0.0%) |
| Personal Care & Service | 0 (0.0%) | 5 (100.0%) |
| Total (Category) | 6 (24.0%) | 19 (76.0%) |
| Total (Overall) | 248 (62.5%) | 149 (37.5%) |
Sales and Office Occupations
The most common Sales and Office occupations in Hill Country Village are Office & Administration (66 | 16.6%), and Sales & Related (56 | 14.1%).
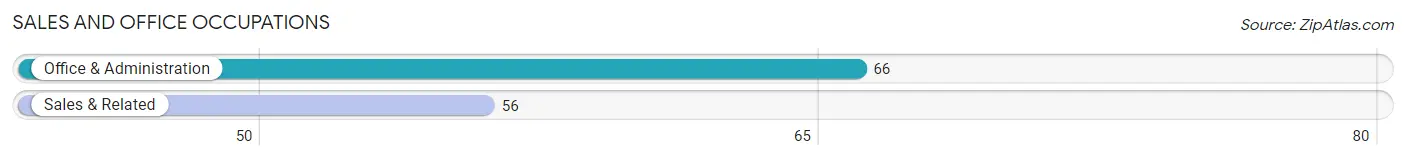
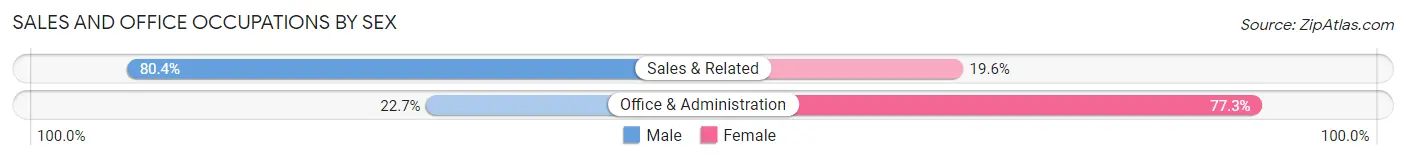
Sales and Office Occupations by Sex
| Occupation | Male | Female |
| Sales & Related | 45 (80.4%) | 11 (19.6%) |
| Office & Administration | 15 (22.7%) | 51 (77.3%) |
| Total (Category) | 60 (49.2%) | 62 (50.8%) |
| Total (Overall) | 248 (62.5%) | 149 (37.5%) |
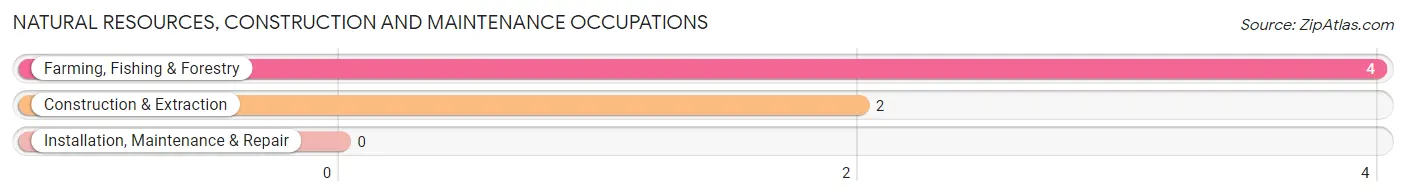
Natural Resources, Construction and Maintenance Occupations
The most common Natural Resources, Construction and Maintenance occupations in Hill Country Village are Farming, Fishing & Forestry (4 | 1.0%), and Construction & Extraction (2 | 0.5%).
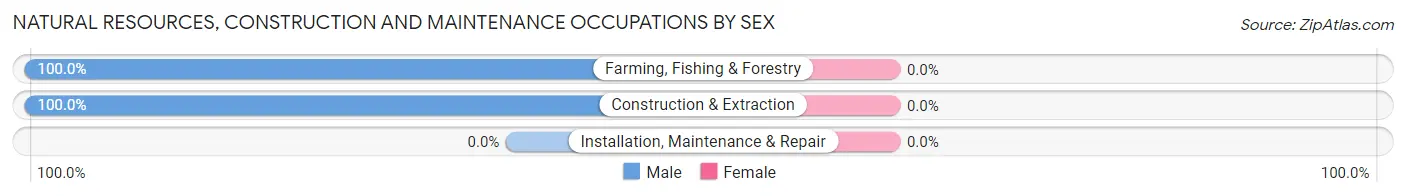
Natural Resources, Construction and Maintenance Occupations by Sex
| Occupation | Male | Female |
| Farming, Fishing & Forestry | 4 (100.0%) | 0 (0.0%) |
| Construction & Extraction | 2 (100.0%) | 0 (0.0%) |
| Installation, Maintenance & Repair | 0 (0.0%) | 0 (0.0%) |
| Total (Category) | 6 (100.0%) | 0 (0.0%) |
| Total (Overall) | 248 (62.5%) | 149 (37.5%) |
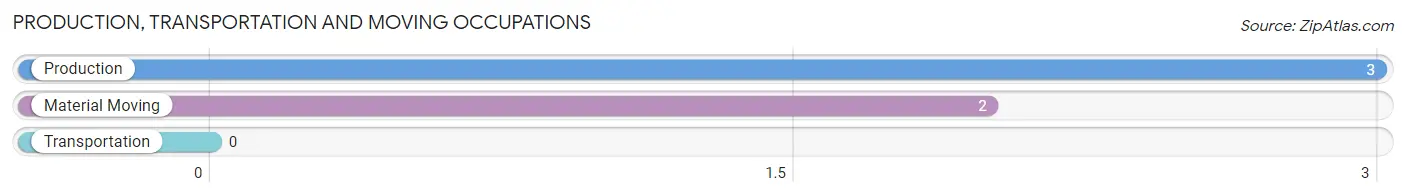
Production, Transportation and Moving Occupations
The most common Production, Transportation and Moving occupations in Hill Country Village are Production (3 | 0.8%), and Material Moving (2 | 0.5%).
Production, Transportation and Moving Occupations by Sex
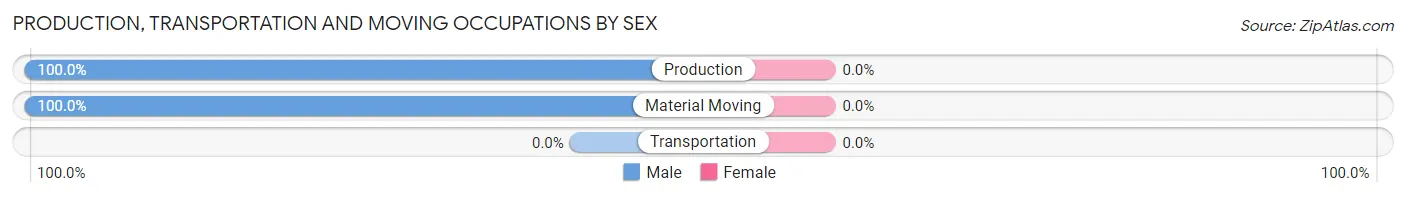
| Occupation | Male | Female |
| Production | 3 (100.0%) | 0 (0.0%) |
| Transportation | 0 (0.0%) | 0 (0.0%) |
| Material Moving | 2 (100.0%) | 0 (0.0%) |
| Total (Category) | 5 (100.0%) | 0 (0.0%) |
| Total (Overall) | 248 (62.5%) | 149 (37.5%) |
Employment Industries by Sex in Hill Country Village
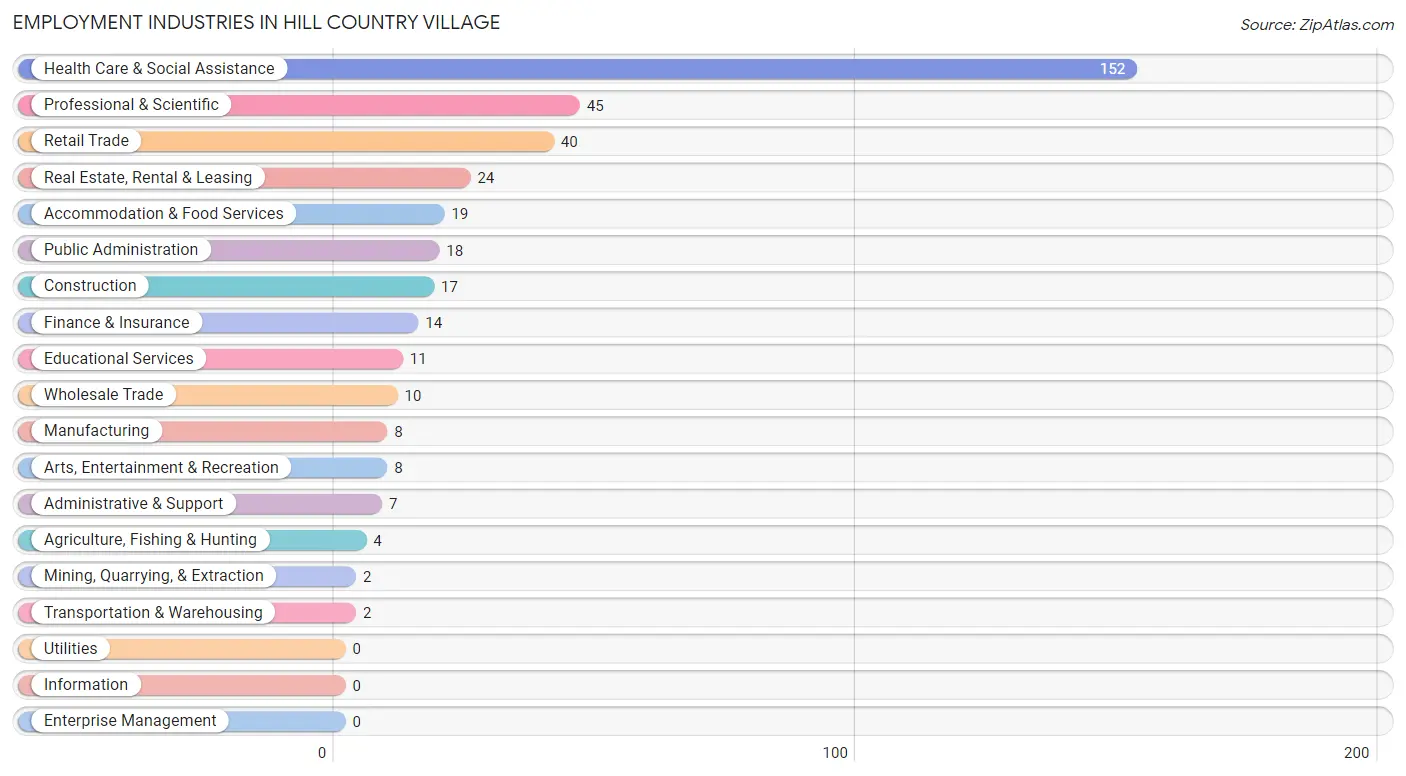
Employment Industries in Hill Country Village
The major employment industries in Hill Country Village include Health Care & Social Assistance (152 | 38.3%), Professional & Scientific (45 | 11.3%), Retail Trade (40 | 10.1%), Real Estate, Rental & Leasing (24 | 6.0%), and Accommodation & Food Services (19 | 4.8%).
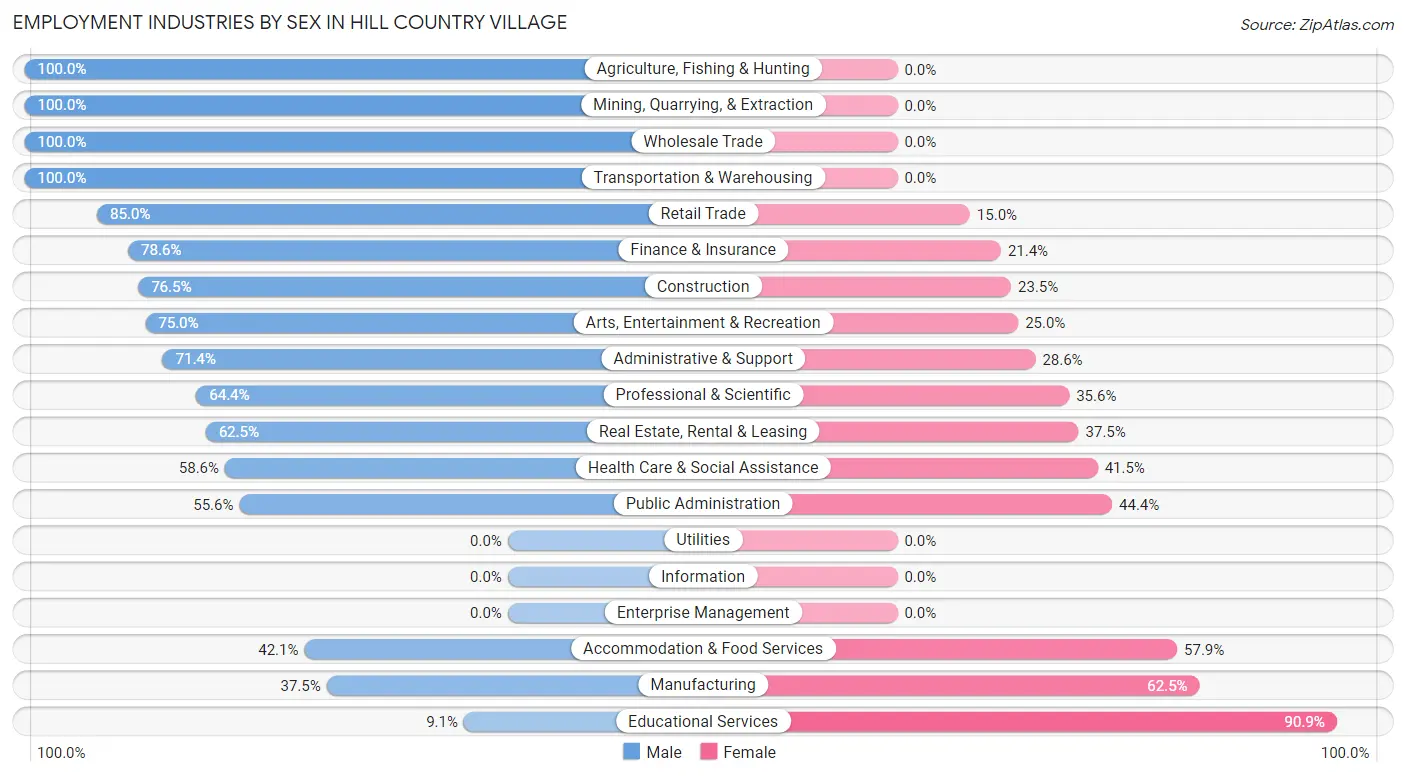
Employment Industries by Sex in Hill Country Village
The Hill Country Village industries that see more men than women are Agriculture, Fishing & Hunting (100.0%), Mining, Quarrying, & Extraction (100.0%), and Wholesale Trade (100.0%), whereas the industries that tend to have a higher number of women are Educational Services (90.9%), Manufacturing (62.5%), and Accommodation & Food Services (57.9%).
| Industry | Male | Female |
| Agriculture, Fishing & Hunting | 4 (100.0%) | 0 (0.0%) |
| Mining, Quarrying, & Extraction | 2 (100.0%) | 0 (0.0%) |
| Construction | 13 (76.5%) | 4 (23.5%) |
| Manufacturing | 3 (37.5%) | 5 (62.5%) |
| Wholesale Trade | 10 (100.0%) | 0 (0.0%) |
| Retail Trade | 34 (85.0%) | 6 (15.0%) |
| Transportation & Warehousing | 2 (100.0%) | 0 (0.0%) |
| Utilities | 0 (0.0%) | 0 (0.0%) |
| Information | 0 (0.0%) | 0 (0.0%) |
| Finance & Insurance | 11 (78.6%) | 3 (21.4%) |
| Real Estate, Rental & Leasing | 15 (62.5%) | 9 (37.5%) |
| Professional & Scientific | 29 (64.4%) | 16 (35.6%) |
| Enterprise Management | 0 (0.0%) | 0 (0.0%) |
| Administrative & Support | 5 (71.4%) | 2 (28.6%) |
| Educational Services | 1 (9.1%) | 10 (90.9%) |
| Health Care & Social Assistance | 89 (58.6%) | 63 (41.4%) |
| Arts, Entertainment & Recreation | 6 (75.0%) | 2 (25.0%) |
| Accommodation & Food Services | 8 (42.1%) | 11 (57.9%) |
| Public Administration | 10 (55.6%) | 8 (44.4%) |
| Total | 248 (62.5%) | 149 (37.5%) |
Education in Hill Country Village
School Enrollment in Hill Country Village
The most common levels of schooling among the 162 students in Hill Country Village are graduate / professional (42 | 25.9%), college / undergraduate (37 | 22.8%), and elementary school (27 | 16.7%).
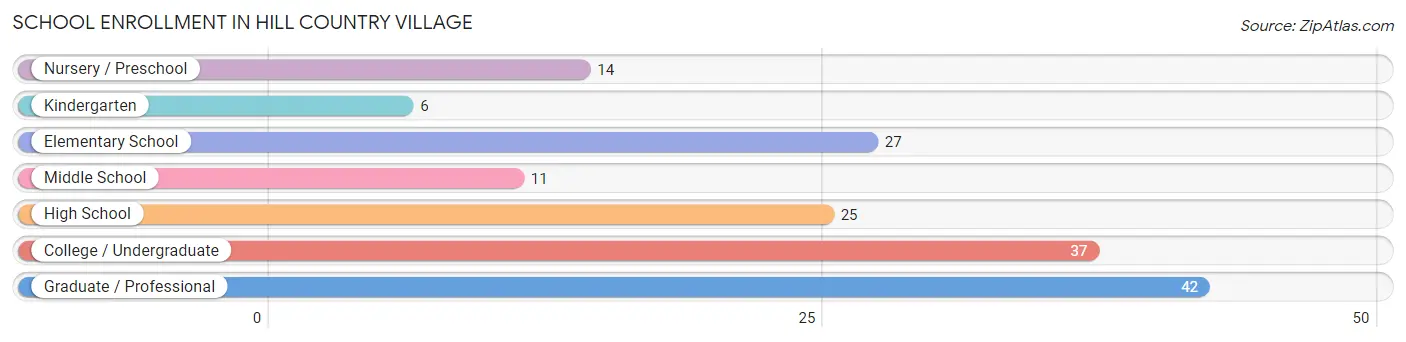
| School Level | # Students | % Students |
| Nursery / Preschool | 14 | 8.6% |
| Kindergarten | 6 | 3.7% |
| Elementary School | 27 | 16.7% |
| Middle School | 11 | 6.8% |
| High School | 25 | 15.4% |
| College / Undergraduate | 37 | 22.8% |
| Graduate / Professional | 42 | 25.9% |
| Total | 162 | 100.0% |
School Enrollment by Age by Funding Source in Hill Country Village
Out of a total of 162 students who are enrolled in schools in Hill Country Village, 59 (36.4%) attend a private institution, while the remaining 103 (63.6%) are enrolled in public schools. The age group of 3 to 4 year olds has the highest likelihood of being enrolled in private schools, with 7 (63.6% in the age bracket) enrolled. Conversely, the age group of 25 to 34 year olds has the lowest likelihood of being enrolled in a private school, with 46 (95.8% in the age bracket) attending a public institution.
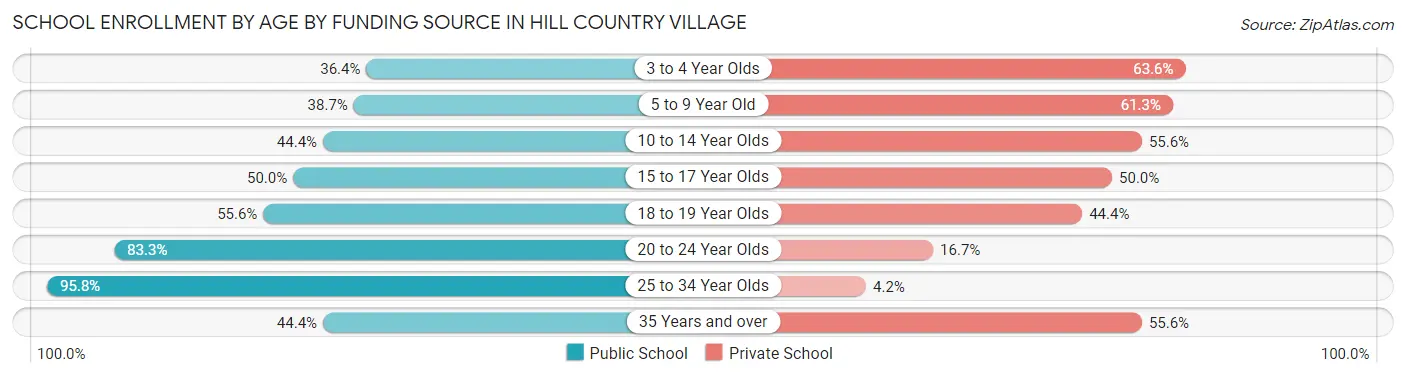
| Age Bracket | Public School | Private School |
| 3 to 4 Year Olds | 4 (36.4%) | 7 (63.6%) |
| 5 to 9 Year Old | 12 (38.7%) | 19 (61.3%) |
| 10 to 14 Year Olds | 8 (44.4%) | 10 (55.6%) |
| 15 to 17 Year Olds | 9 (50.0%) | 9 (50.0%) |
| 18 to 19 Year Olds | 5 (55.6%) | 4 (44.4%) |
| 20 to 24 Year Olds | 15 (83.3%) | 3 (16.7%) |
| 25 to 34 Year Olds | 46 (95.8%) | 2 (4.2%) |
| 35 Years and over | 4 (44.4%) | 5 (55.6%) |
| Total | 103 (63.6%) | 59 (36.4%) |
Educational Attainment by Field of Study in Hill Country Village
Business (92 | 18.4%), bio, nature & agricultural (89 | 17.8%), science & technology (74 | 14.8%), psychology (52 | 10.4%), and education (39 | 7.8%) are the most common fields of study among 501 individuals in Hill Country Village who have obtained a bachelor's degree or higher.
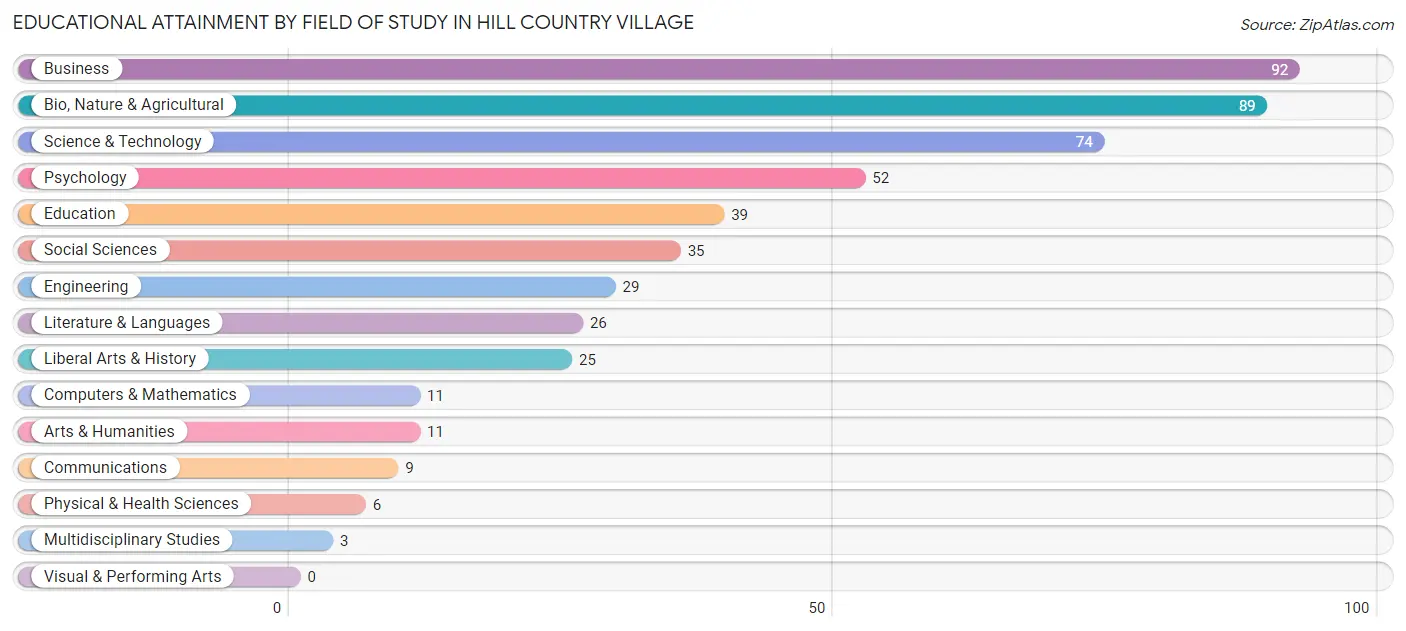
| Field of Study | # Graduates | % Graduates |
| Computers & Mathematics | 11 | 2.2% |
| Bio, Nature & Agricultural | 89 | 17.8% |
| Physical & Health Sciences | 6 | 1.2% |
| Psychology | 52 | 10.4% |
| Social Sciences | 35 | 7.0% |
| Engineering | 29 | 5.8% |
| Multidisciplinary Studies | 3 | 0.6% |
| Science & Technology | 74 | 14.8% |
| Business | 92 | 18.4% |
| Education | 39 | 7.8% |
| Literature & Languages | 26 | 5.2% |
| Liberal Arts & History | 25 | 5.0% |
| Visual & Performing Arts | 0 | 0.0% |
| Communications | 9 | 1.8% |
| Arts & Humanities | 11 | 2.2% |
| Total | 501 | 100.0% |
Transportation & Commute in Hill Country Village
Vehicle Availability by Sex in Hill Country Village
The most prevalent vehicle ownership categories in Hill Country Village are males with 2 vehicles (80, accounting for 31.4%) and females with 2 vehicles (31, making up 54.4%).
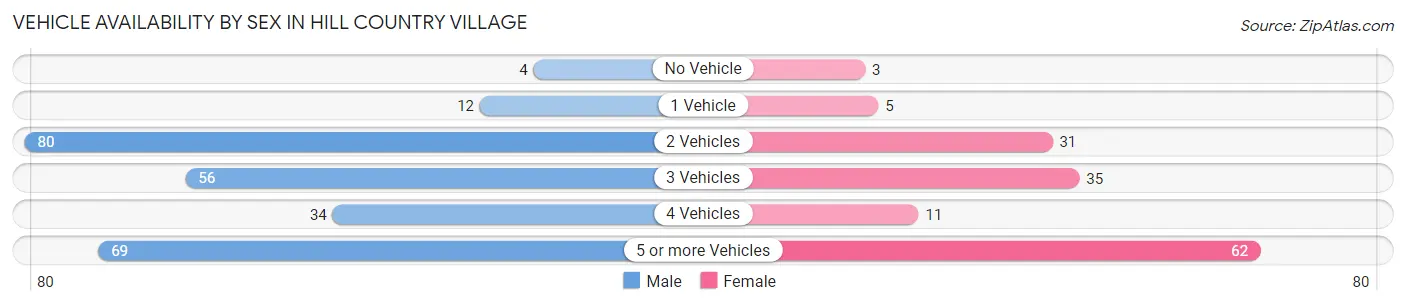
| Vehicles Available | Male | Female |
| No Vehicle | 4 (1.6%) | 3 (2.0%) |
| 1 Vehicle | 12 (4.7%) | 5 (3.4%) |
| 2 Vehicles | 80 (31.4%) | 31 (21.1%) |
| 3 Vehicles | 56 (22.0%) | 35 (23.8%) |
| 4 Vehicles | 34 (13.3%) | 11 (7.5%) |
| 5 or more Vehicles | 69 (27.1%) | 62 (42.2%) |
| Total | 255 (100.0%) | 147 (100.0%) |
Commute Time in Hill Country Village
The most frequently occuring commute durations in Hill Country Village are 15 to 19 minutes (109 commuters, 31.0%), 10 to 14 minutes (75 commuters, 21.4%), and 20 to 24 minutes (62 commuters, 17.7%).
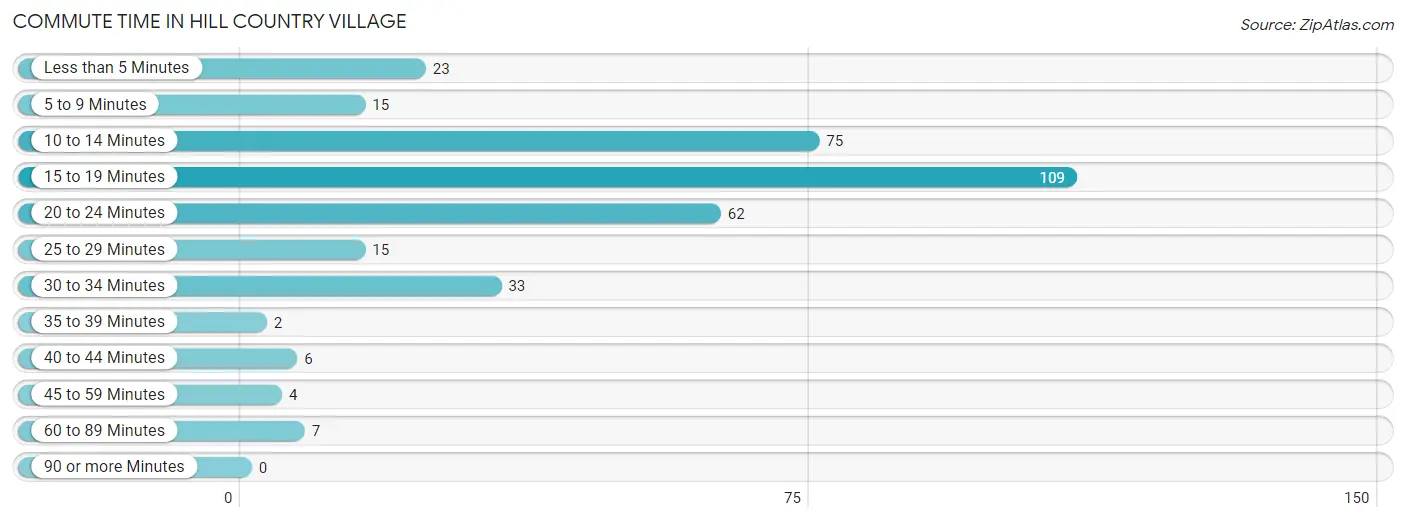
| Commute Time | # Commuters | % Commuters |
| Less than 5 Minutes | 23 | 6.6% |
| 5 to 9 Minutes | 15 | 4.3% |
| 10 to 14 Minutes | 75 | 21.4% |
| 15 to 19 Minutes | 109 | 31.0% |
| 20 to 24 Minutes | 62 | 17.7% |
| 25 to 29 Minutes | 15 | 4.3% |
| 30 to 34 Minutes | 33 | 9.4% |
| 35 to 39 Minutes | 2 | 0.6% |
| 40 to 44 Minutes | 6 | 1.7% |
| 45 to 59 Minutes | 4 | 1.1% |
| 60 to 89 Minutes | 7 | 2.0% |
| 90 or more Minutes | 0 | 0.0% |
Commute Time by Sex in Hill Country Village
The most common commute times in Hill Country Village are 10 to 14 minutes (63 commuters, 27.9%) for males and 15 to 19 minutes (61 commuters, 48.8%) for females.
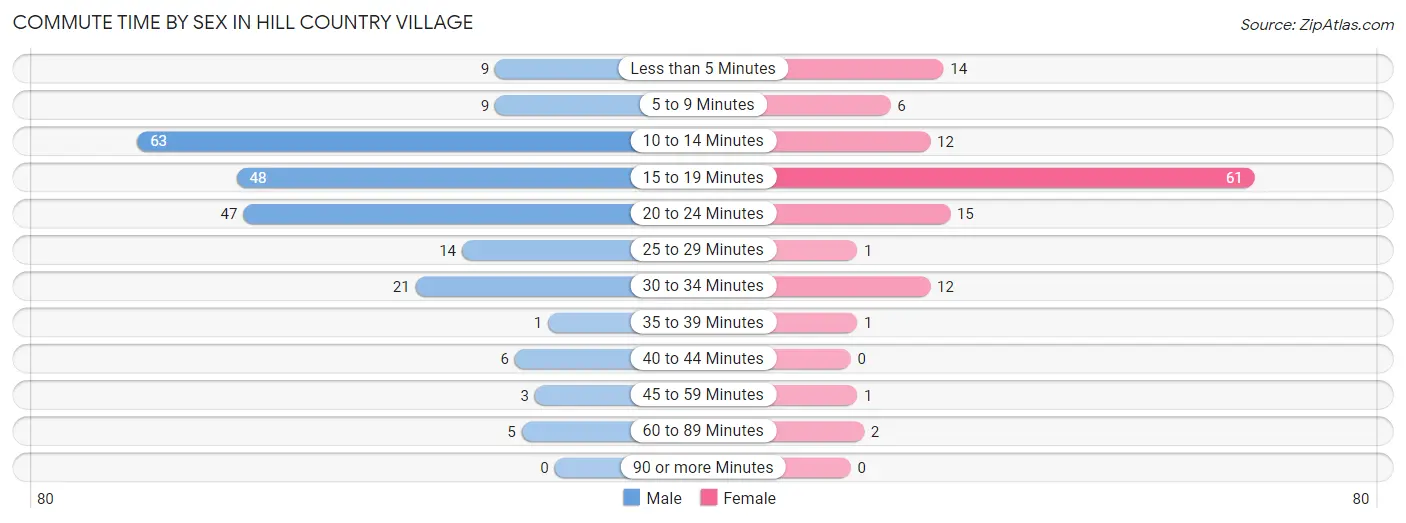
| Commute Time | Male | Female |
| Less than 5 Minutes | 9 (4.0%) | 14 (11.2%) |
| 5 to 9 Minutes | 9 (4.0%) | 6 (4.8%) |
| 10 to 14 Minutes | 63 (27.9%) | 12 (9.6%) |
| 15 to 19 Minutes | 48 (21.2%) | 61 (48.8%) |
| 20 to 24 Minutes | 47 (20.8%) | 15 (12.0%) |
| 25 to 29 Minutes | 14 (6.2%) | 1 (0.8%) |
| 30 to 34 Minutes | 21 (9.3%) | 12 (9.6%) |
| 35 to 39 Minutes | 1 (0.4%) | 1 (0.8%) |
| 40 to 44 Minutes | 6 (2.6%) | 0 (0.0%) |
| 45 to 59 Minutes | 3 (1.3%) | 1 (0.8%) |
| 60 to 89 Minutes | 5 (2.2%) | 2 (1.6%) |
| 90 or more Minutes | 0 (0.0%) | 0 (0.0%) |
Time of Departure to Work by Sex in Hill Country Village
The most frequent times of departure to work in Hill Country Village are 7:30 AM to 7:59 AM (58, 25.7%) for males and 8:00 AM to 8:29 AM (57, 45.6%) for females.
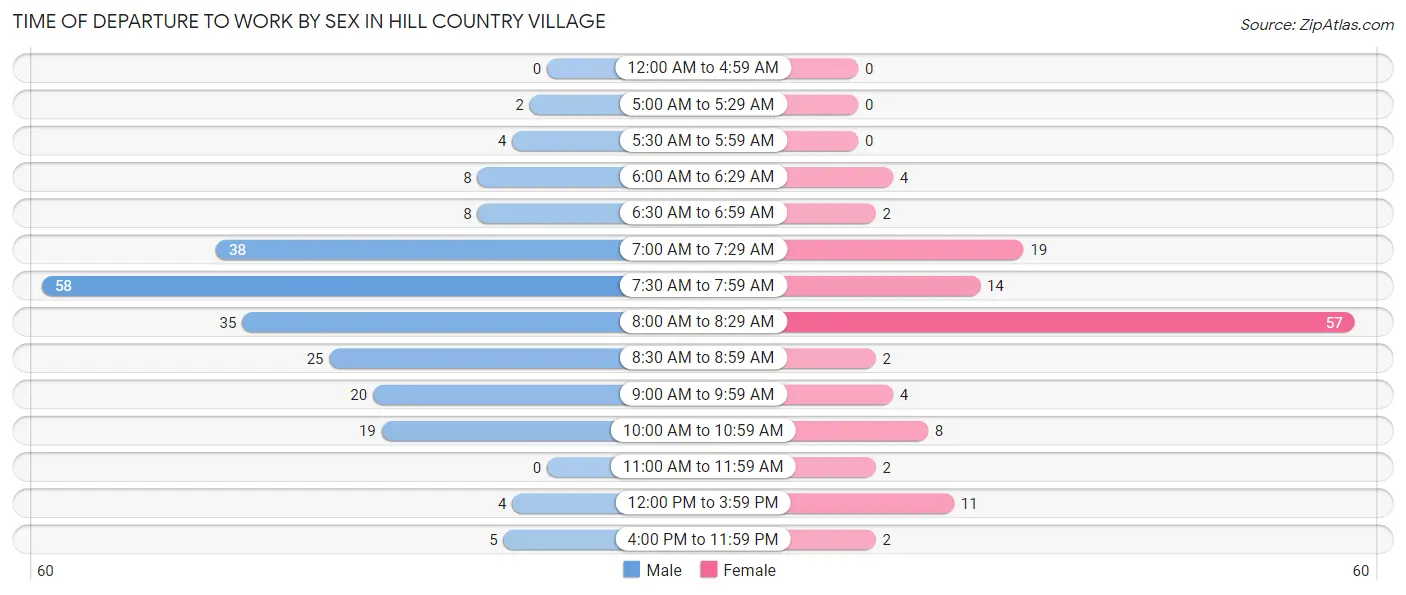
| Time of Departure | Male | Female |
| 12:00 AM to 4:59 AM | 0 (0.0%) | 0 (0.0%) |
| 5:00 AM to 5:29 AM | 2 (0.9%) | 0 (0.0%) |
| 5:30 AM to 5:59 AM | 4 (1.8%) | 0 (0.0%) |
| 6:00 AM to 6:29 AM | 8 (3.5%) | 4 (3.2%) |
| 6:30 AM to 6:59 AM | 8 (3.5%) | 2 (1.6%) |
| 7:00 AM to 7:29 AM | 38 (16.8%) | 19 (15.2%) |
| 7:30 AM to 7:59 AM | 58 (25.7%) | 14 (11.2%) |
| 8:00 AM to 8:29 AM | 35 (15.5%) | 57 (45.6%) |
| 8:30 AM to 8:59 AM | 25 (11.1%) | 2 (1.6%) |
| 9:00 AM to 9:59 AM | 20 (8.8%) | 4 (3.2%) |
| 10:00 AM to 10:59 AM | 19 (8.4%) | 8 (6.4%) |
| 11:00 AM to 11:59 AM | 0 (0.0%) | 2 (1.6%) |
| 12:00 PM to 3:59 PM | 4 (1.8%) | 11 (8.8%) |
| 4:00 PM to 11:59 PM | 5 (2.2%) | 2 (1.6%) |
| Total | 226 (100.0%) | 125 (100.0%) |
Housing Occupancy in Hill Country Village
Occupancy by Ownership in Hill Country Village
Of the total 266 dwellings in Hill Country Village, owner-occupied units account for 264 (99.3%), while renter-occupied units make up 2 (0.7%).
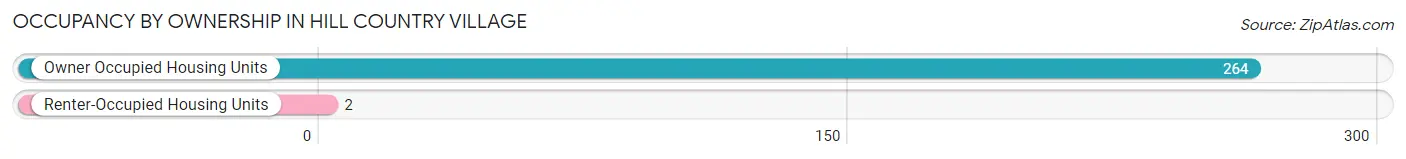
| Occupancy | # Housing Units | % Housing Units |
| Owner Occupied Housing Units | 264 | 99.3% |
| Renter-Occupied Housing Units | 2 | 0.7% |
| Total Occupied Housing Units | 266 | 100.0% |
Occupancy by Household Size in Hill Country Village
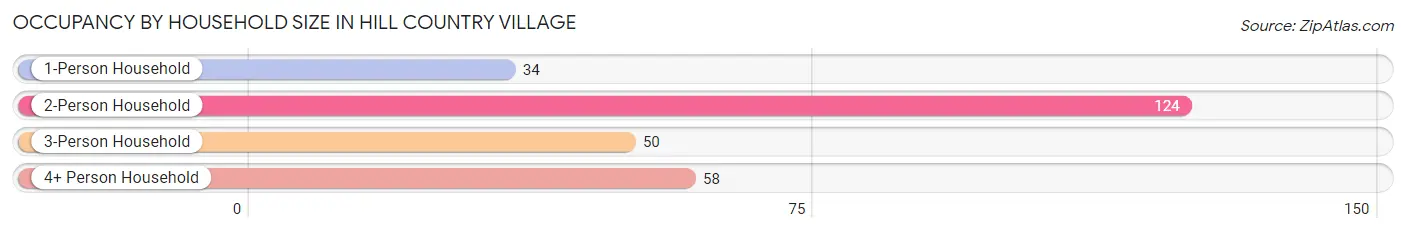
| Household Size | # Housing Units | % Housing Units |
| 1-Person Household | 34 | 12.8% |
| 2-Person Household | 124 | 46.6% |
| 3-Person Household | 50 | 18.8% |
| 4+ Person Household | 58 | 21.8% |
| Total Housing Units | 266 | 100.0% |
Occupancy by Ownership by Household Size in Hill Country Village
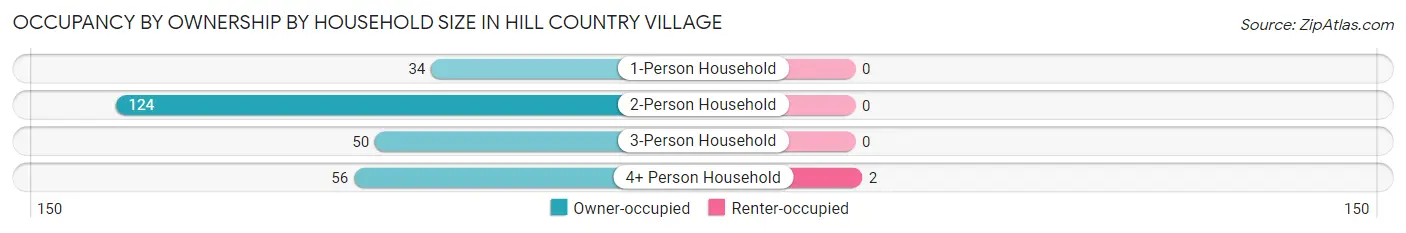
| Household Size | Owner-occupied | Renter-occupied |
| 1-Person Household | 34 (100.0%) | 0 (0.0%) |
| 2-Person Household | 124 (100.0%) | 0 (0.0%) |
| 3-Person Household | 50 (100.0%) | 0 (0.0%) |
| 4+ Person Household | 56 (96.6%) | 2 (3.5%) |
| Total Housing Units | 264 (99.3%) | 2 (0.7%) |
Occupancy by Educational Attainment in Hill Country Village
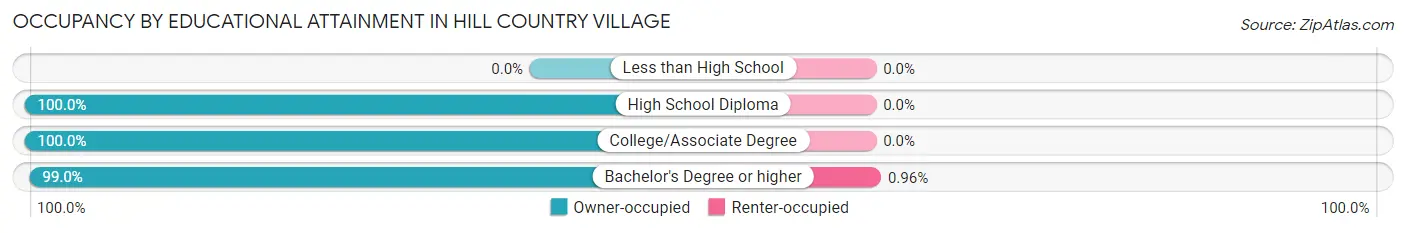
| Household Size | Owner-occupied | Renter-occupied |
| Less than High School | 0 (0.0%) | 0 (0.0%) |
| High School Diploma | 21 (100.0%) | 0 (0.0%) |
| College/Associate Degree | 36 (100.0%) | 0 (0.0%) |
| Bachelor's Degree or higher | 207 (99.0%) | 2 (1.0%) |
Occupancy by Age of Householder in Hill Country Village
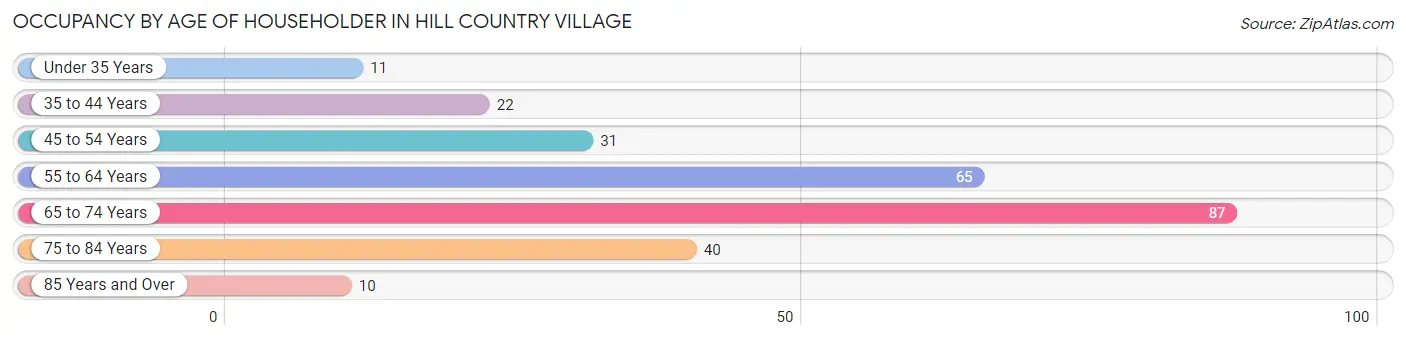
| Age Bracket | # Households | % Households |
| Under 35 Years | 11 | 4.1% |
| 35 to 44 Years | 22 | 8.3% |
| 45 to 54 Years | 31 | 11.7% |
| 55 to 64 Years | 65 | 24.4% |
| 65 to 74 Years | 87 | 32.7% |
| 75 to 84 Years | 40 | 15.0% |
| 85 Years and Over | 10 | 3.8% |
| Total | 266 | 100.0% |
Housing Finances in Hill Country Village
Median Income by Occupancy in Hill Country Village
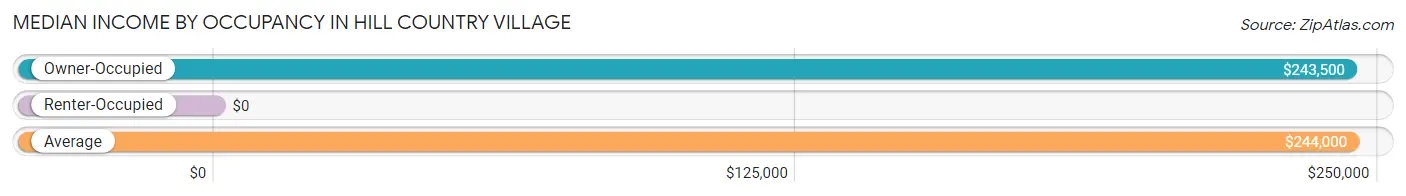
| Occupancy Type | # Households | Median Income |
| Owner-Occupied | 264 (99.3%) | $243,500 |
| Renter-Occupied | 2 (0.7%) | $0 |
| Average | 266 (100.0%) | $244,000 |
Occupancy by Householder Income Bracket in Hill Country Village
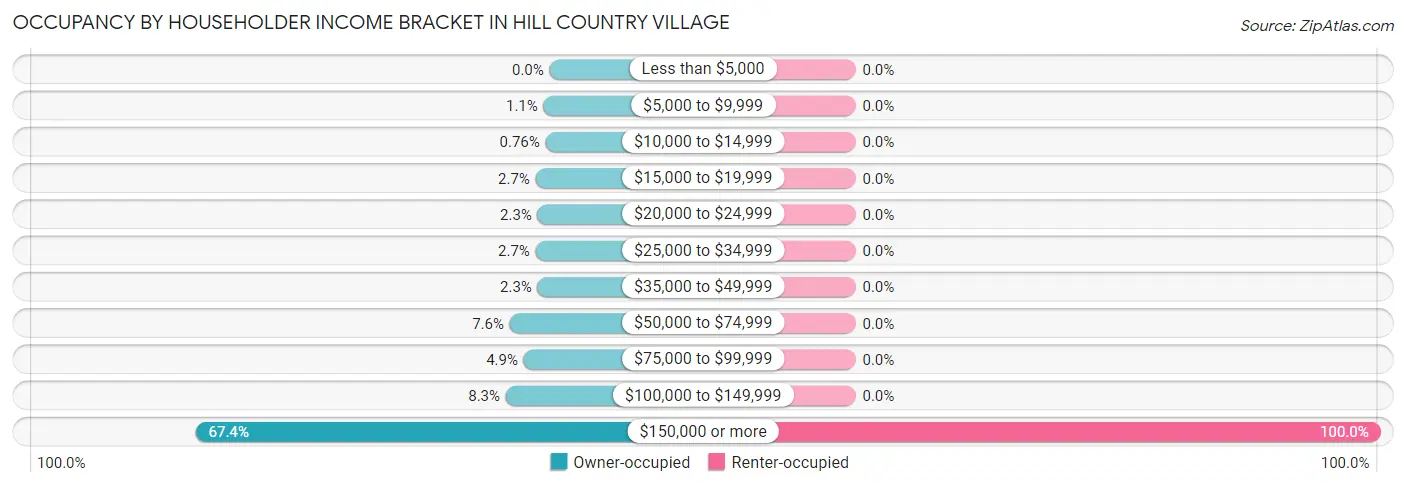
| Income Bracket | Owner-occupied | Renter-occupied |
| Less than $5,000 | 0 (0.0%) | 0 (0.0%) |
| $5,000 to $9,999 | 3 (1.1%) | 0 (0.0%) |
| $10,000 to $14,999 | 2 (0.8%) | 0 (0.0%) |
| $15,000 to $19,999 | 7 (2.6%) | 0 (0.0%) |
| $20,000 to $24,999 | 6 (2.3%) | 0 (0.0%) |
| $25,000 to $34,999 | 7 (2.6%) | 0 (0.0%) |
| $35,000 to $49,999 | 6 (2.3%) | 0 (0.0%) |
| $50,000 to $74,999 | 20 (7.6%) | 0 (0.0%) |
| $75,000 to $99,999 | 13 (4.9%) | 0 (0.0%) |
| $100,000 to $149,999 | 22 (8.3%) | 0 (0.0%) |
| $150,000 or more | 178 (67.4%) | 2 (100.0%) |
| Total | 264 (100.0%) | 2 (100.0%) |
Monthly Housing Cost Tiers in Hill Country Village
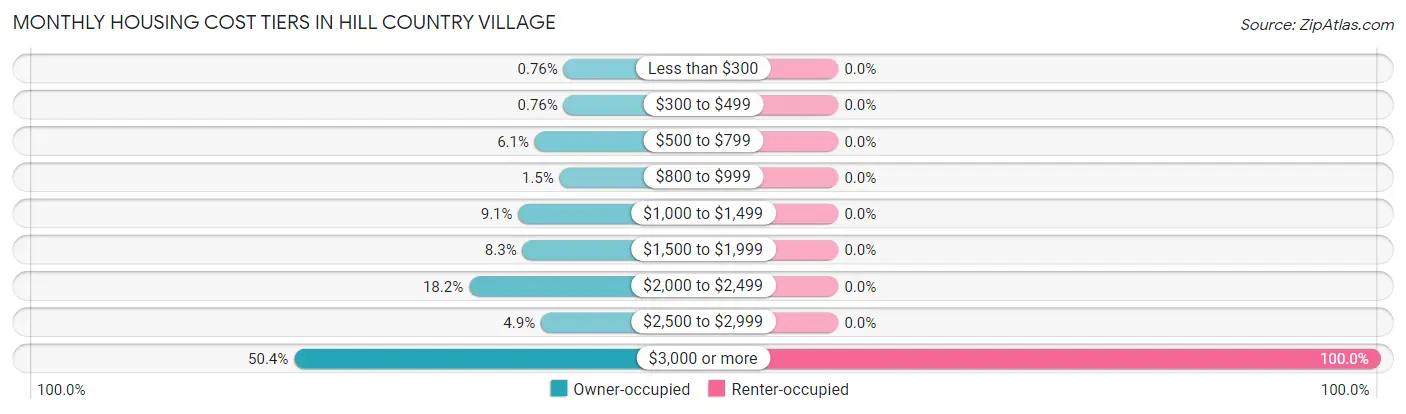
| Monthly Cost | Owner-occupied | Renter-occupied |
| Less than $300 | 2 (0.8%) | 0 (0.0%) |
| $300 to $499 | 2 (0.8%) | 0 (0.0%) |
| $500 to $799 | 16 (6.1%) | 0 (0.0%) |
| $800 to $999 | 4 (1.5%) | 0 (0.0%) |
| $1,000 to $1,499 | 24 (9.1%) | 0 (0.0%) |
| $1,500 to $1,999 | 22 (8.3%) | 0 (0.0%) |
| $2,000 to $2,499 | 48 (18.2%) | 0 (0.0%) |
| $2,500 to $2,999 | 13 (4.9%) | 0 (0.0%) |
| $3,000 or more | 133 (50.4%) | 2 (100.0%) |
| Total | 264 (100.0%) | 2 (100.0%) |
Physical Housing Characteristics in Hill Country Village
Housing Structures in Hill Country Village
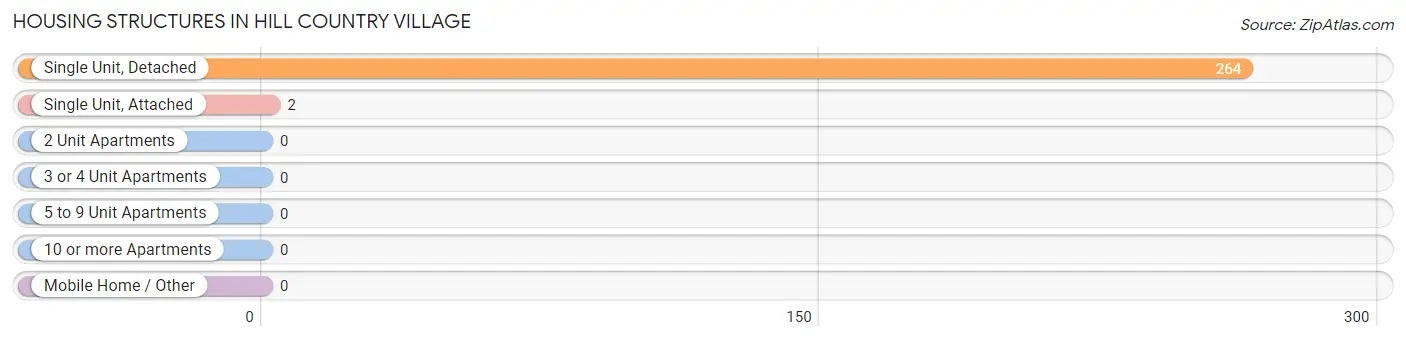
| Structure Type | # Housing Units | % Housing Units |
| Single Unit, Detached | 264 | 99.3% |
| Single Unit, Attached | 2 | 0.7% |
| 2 Unit Apartments | 0 | 0.0% |
| 3 or 4 Unit Apartments | 0 | 0.0% |
| 5 to 9 Unit Apartments | 0 | 0.0% |
| 10 or more Apartments | 0 | 0.0% |
| Mobile Home / Other | 0 | 0.0% |
| Total | 266 | 100.0% |
Housing Structures by Occupancy in Hill Country Village
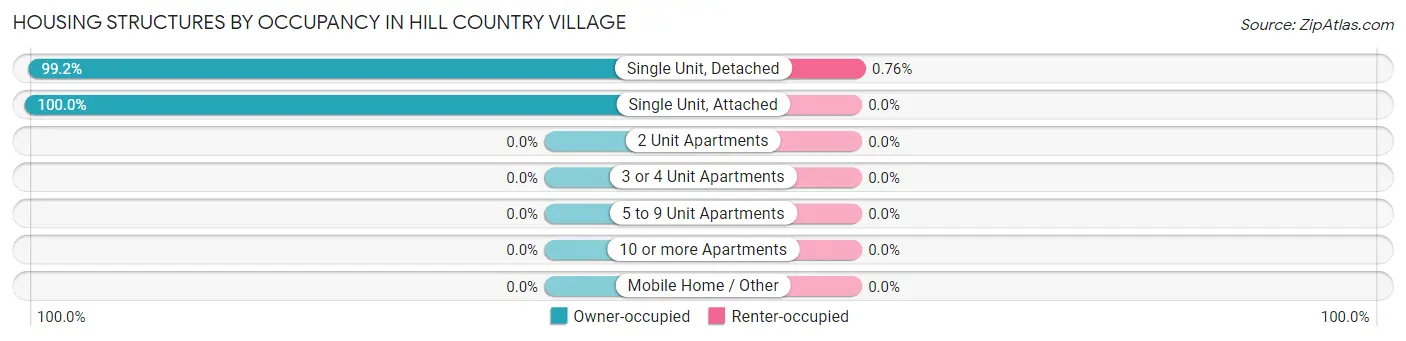
| Structure Type | Owner-occupied | Renter-occupied |
| Single Unit, Detached | 262 (99.2%) | 2 (0.8%) |
| Single Unit, Attached | 2 (100.0%) | 0 (0.0%) |
| 2 Unit Apartments | 0 (0.0%) | 0 (0.0%) |
| 3 or 4 Unit Apartments | 0 (0.0%) | 0 (0.0%) |
| 5 to 9 Unit Apartments | 0 (0.0%) | 0 (0.0%) |
| 10 or more Apartments | 0 (0.0%) | 0 (0.0%) |
| Mobile Home / Other | 0 (0.0%) | 0 (0.0%) |
| Total | 264 (99.3%) | 2 (0.7%) |
Housing Structures by Number of Rooms in Hill Country Village
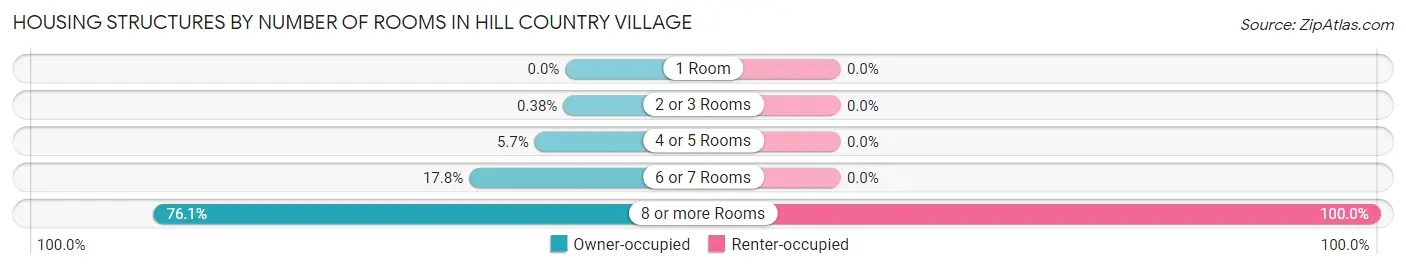
| Number of Rooms | Owner-occupied | Renter-occupied |
| 1 Room | 0 (0.0%) | 0 (0.0%) |
| 2 or 3 Rooms | 1 (0.4%) | 0 (0.0%) |
| 4 or 5 Rooms | 15 (5.7%) | 0 (0.0%) |
| 6 or 7 Rooms | 47 (17.8%) | 0 (0.0%) |
| 8 or more Rooms | 201 (76.1%) | 2 (100.0%) |
| Total | 264 (100.0%) | 2 (100.0%) |
Housing Structure by Heating Type in Hill Country Village
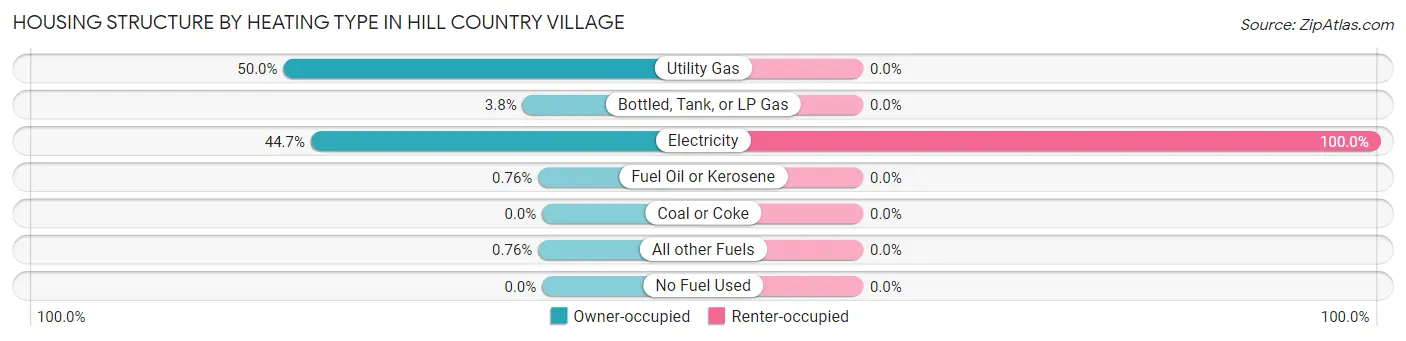
| Heating Type | Owner-occupied | Renter-occupied |
| Utility Gas | 132 (50.0%) | 0 (0.0%) |
| Bottled, Tank, or LP Gas | 10 (3.8%) | 0 (0.0%) |
| Electricity | 118 (44.7%) | 2 (100.0%) |
| Fuel Oil or Kerosene | 2 (0.8%) | 0 (0.0%) |
| Coal or Coke | 0 (0.0%) | 0 (0.0%) |
| All other Fuels | 2 (0.8%) | 0 (0.0%) |
| No Fuel Used | 0 (0.0%) | 0 (0.0%) |
| Total | 264 (100.0%) | 2 (100.0%) |
Household Vehicle Usage in Hill Country Village
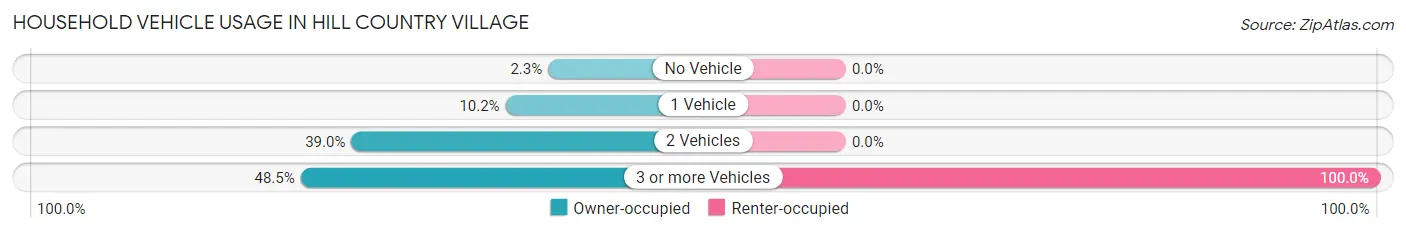
| Vehicles per Household | Owner-occupied | Renter-occupied |
| No Vehicle | 6 (2.3%) | 0 (0.0%) |
| 1 Vehicle | 27 (10.2%) | 0 (0.0%) |
| 2 Vehicles | 103 (39.0%) | 0 (0.0%) |
| 3 or more Vehicles | 128 (48.5%) | 2 (100.0%) |
| Total | 264 (100.0%) | 2 (100.0%) |
Real Estate & Mortgages in Hill Country Village
Real Estate and Mortgage Overview in Hill Country Village
| Characteristic | Without Mortgage | With Mortgage |
| Housing Units | 170 | 94 |
| Median Property Value | $966,700 | $1,180,600 |
| Median Household Income | $196,250 | $76 |
| Monthly Housing Costs | $1,501 | $89 |
| Real Estate Taxes | $10,001 | $0 |
Property Value by Mortgage Status in Hill Country Village
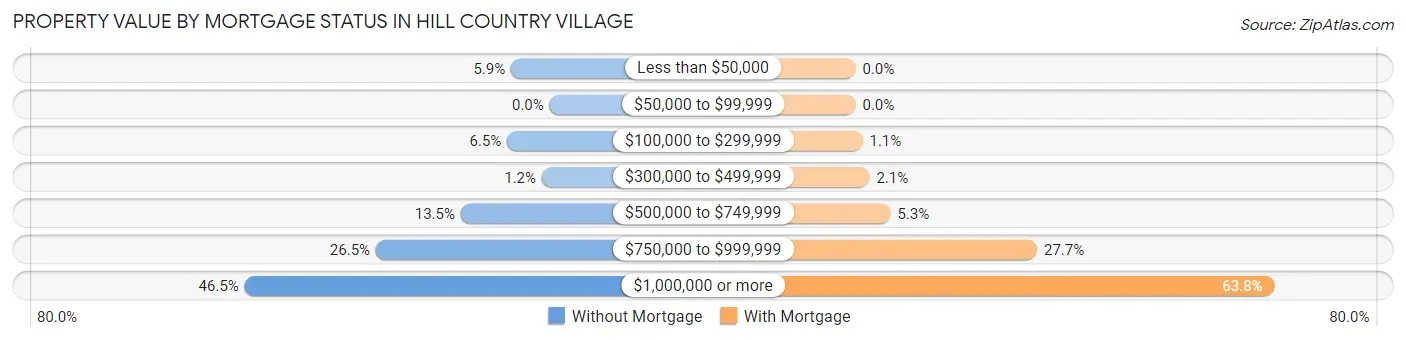
| Property Value | Without Mortgage | With Mortgage |
| Less than $50,000 | 10 (5.9%) | 0 (0.0%) |
| $50,000 to $99,999 | 0 (0.0%) | 0 (0.0%) |
| $100,000 to $299,999 | 11 (6.5%) | 1 (1.1%) |
| $300,000 to $499,999 | 2 (1.2%) | 2 (2.1%) |
| $500,000 to $749,999 | 23 (13.5%) | 5 (5.3%) |
| $750,000 to $999,999 | 45 (26.5%) | 26 (27.7%) |
| $1,000,000 or more | 79 (46.5%) | 60 (63.8%) |
| Total | 170 (100.0%) | 94 (100.0%) |
Household Income by Mortgage Status in Hill Country Village
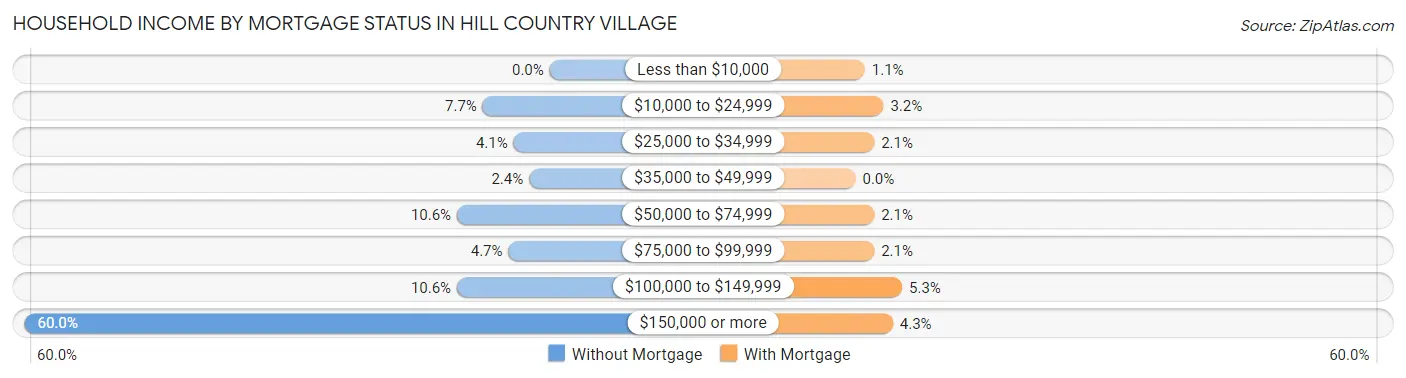
| Household Income | Without Mortgage | With Mortgage |
| Less than $10,000 | 0 (0.0%) | 1 (1.1%) |
| $10,000 to $24,999 | 13 (7.6%) | 3 (3.2%) |
| $25,000 to $34,999 | 7 (4.1%) | 2 (2.1%) |
| $35,000 to $49,999 | 4 (2.4%) | 0 (0.0%) |
| $50,000 to $74,999 | 18 (10.6%) | 2 (2.1%) |
| $75,000 to $99,999 | 8 (4.7%) | 2 (2.1%) |
| $100,000 to $149,999 | 18 (10.6%) | 5 (5.3%) |
| $150,000 or more | 102 (60.0%) | 4 (4.3%) |
| Total | 170 (100.0%) | 94 (100.0%) |
Property Value to Household Income Ratio in Hill Country Village
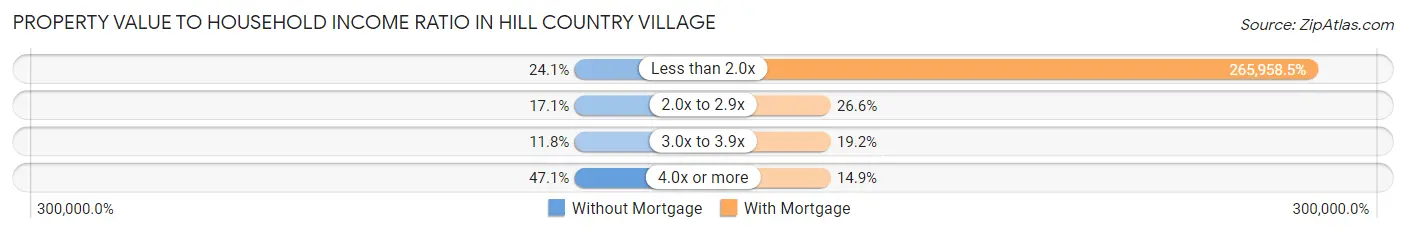
| Value-to-Income Ratio | Without Mortgage | With Mortgage |
| Less than 2.0x | 41 (24.1%) | 250,001 (265,958.5%) |
| 2.0x to 2.9x | 29 (17.1%) | 25 (26.6%) |
| 3.0x to 3.9x | 20 (11.8%) | 18 (19.2%) |
| 4.0x or more | 80 (47.1%) | 14 (14.9%) |
| Total | 170 (100.0%) | 94 (100.0%) |
Real Estate Taxes by Mortgage Status in Hill Country Village
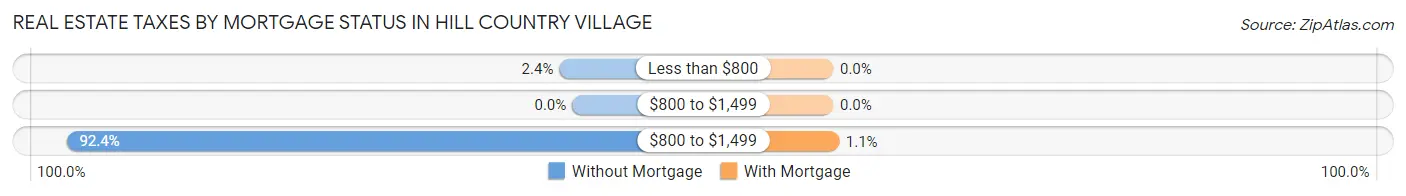
| Property Taxes | Without Mortgage | With Mortgage |
| Less than $800 | 4 (2.4%) | 0 (0.0%) |
| $800 to $1,499 | 0 (0.0%) | 0 (0.0%) |
| $800 to $1,499 | 157 (92.3%) | 1 (1.1%) |
| Total | 170 (100.0%) | 94 (100.0%) |
Health & Disability in Hill Country Village
Health Insurance Coverage by Age in Hill Country Village
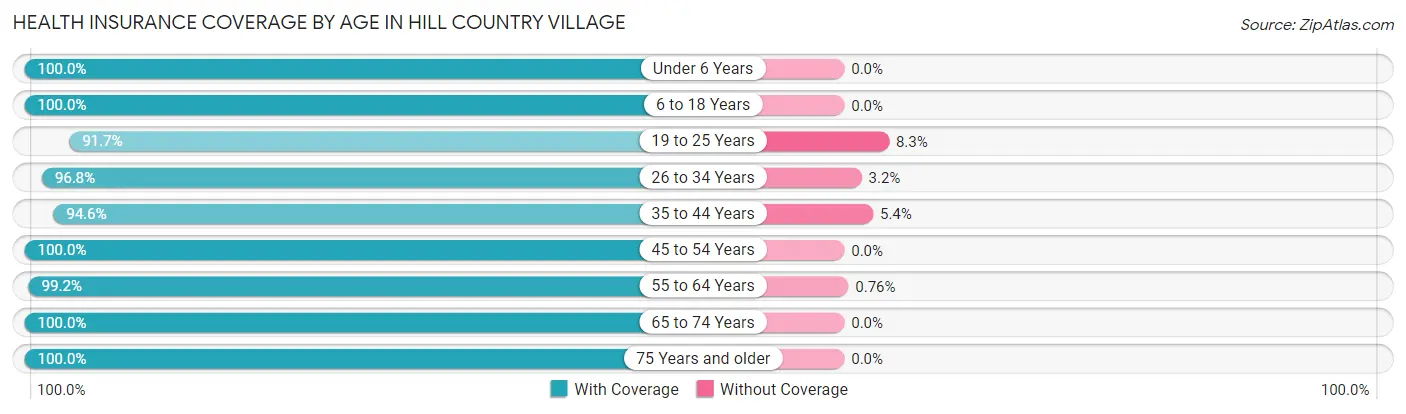
| Age Bracket | With Coverage | Without Coverage |
| Under 6 Years | 72 (100.0%) | 0 (0.0%) |
| 6 to 18 Years | 73 (100.0%) | 0 (0.0%) |
| 19 to 25 Years | 33 (91.7%) | 3 (8.3%) |
| 26 to 34 Years | 120 (96.8%) | 4 (3.2%) |
| 35 to 44 Years | 53 (94.6%) | 3 (5.4%) |
| 45 to 54 Years | 74 (100.0%) | 0 (0.0%) |
| 55 to 64 Years | 131 (99.2%) | 1 (0.8%) |
| 65 to 74 Years | 150 (100.0%) | 0 (0.0%) |
| 75 Years and older | 78 (100.0%) | 0 (0.0%) |
| Total | 784 (98.6%) | 11 (1.4%) |
Health Insurance Coverage by Citizenship Status in Hill Country Village
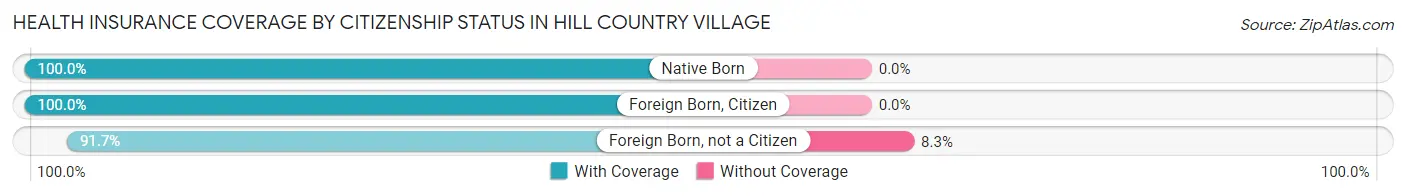
| Citizenship Status | With Coverage | Without Coverage |
| Native Born | 72 (100.0%) | 0 (0.0%) |
| Foreign Born, Citizen | 73 (100.0%) | 0 (0.0%) |
| Foreign Born, not a Citizen | 33 (91.7%) | 3 (8.3%) |
Health Insurance Coverage by Household Income in Hill Country Village
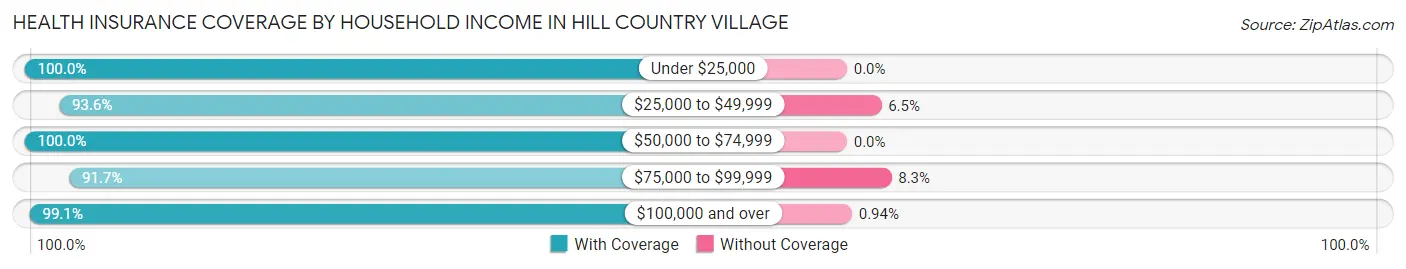
| Household Income | With Coverage | Without Coverage |
| Under $25,000 | 42 (100.0%) | 0 (0.0%) |
| $25,000 to $49,999 | 29 (93.5%) | 2 (6.5%) |
| $50,000 to $74,999 | 50 (100.0%) | 0 (0.0%) |
| $75,000 to $99,999 | 33 (91.7%) | 3 (8.3%) |
| $100,000 and over | 630 (99.1%) | 6 (0.9%) |
Public vs Private Health Insurance Coverage by Age in Hill Country Village
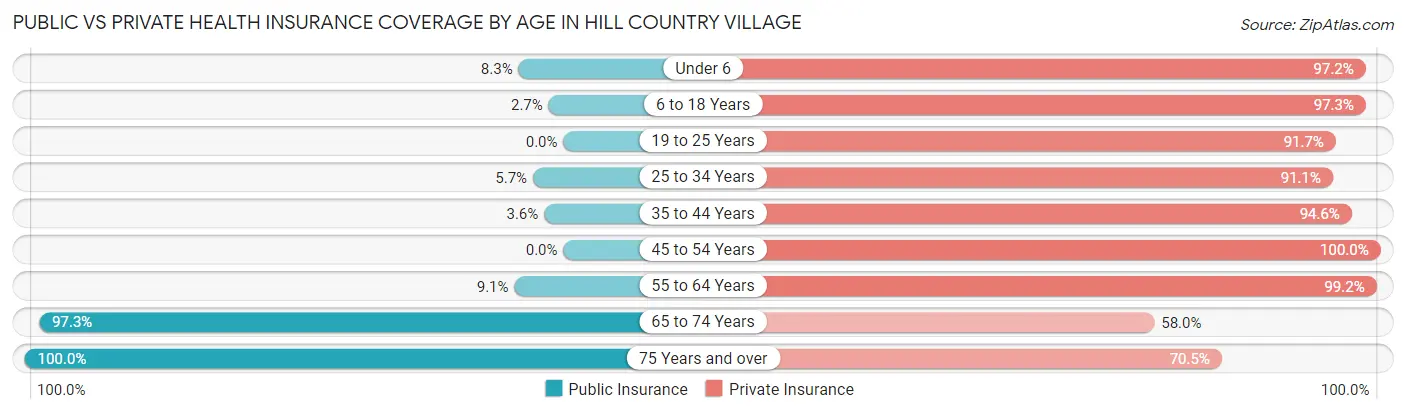
| Age Bracket | Public Insurance | Private Insurance |
| Under 6 | 6 (8.3%) | 70 (97.2%) |
| 6 to 18 Years | 2 (2.7%) | 71 (97.3%) |
| 19 to 25 Years | 0 (0.0%) | 33 (91.7%) |
| 25 to 34 Years | 7 (5.7%) | 113 (91.1%) |
| 35 to 44 Years | 2 (3.6%) | 53 (94.6%) |
| 45 to 54 Years | 0 (0.0%) | 74 (100.0%) |
| 55 to 64 Years | 12 (9.1%) | 131 (99.2%) |
| 65 to 74 Years | 146 (97.3%) | 87 (58.0%) |
| 75 Years and over | 78 (100.0%) | 55 (70.5%) |
| Total | 253 (31.8%) | 687 (86.4%) |
Disability Status by Sex by Age in Hill Country Village
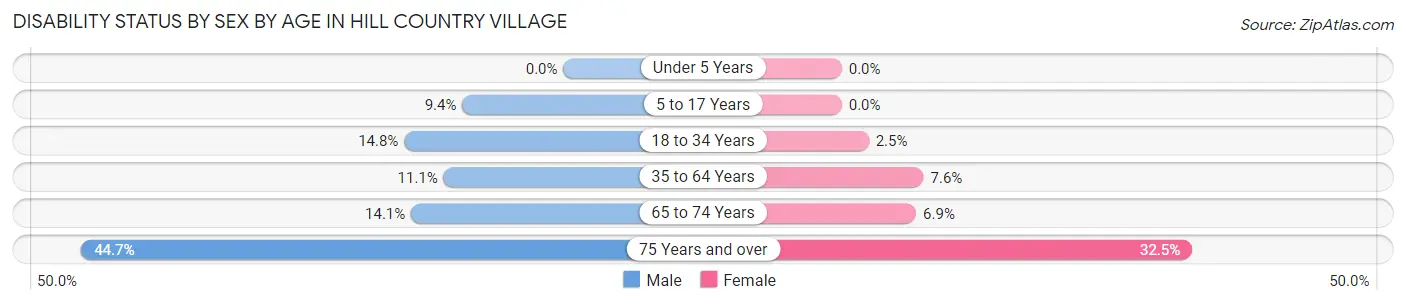
| Age Bracket | Male | Female |
| Under 5 Years | 0 (0.0%) | 0 (0.0%) |
| 5 to 17 Years | 3 (9.4%) | 0 (0.0%) |
| 18 to 34 Years | 13 (14.8%) | 2 (2.5%) |
| 35 to 64 Years | 13 (11.1%) | 11 (7.6%) |
| 65 to 74 Years | 13 (14.1%) | 4 (6.9%) |
| 75 Years and over | 17 (44.7%) | 13 (32.5%) |
Disability Class by Sex by Age in Hill Country Village
Disability Class: Hearing Difficulty
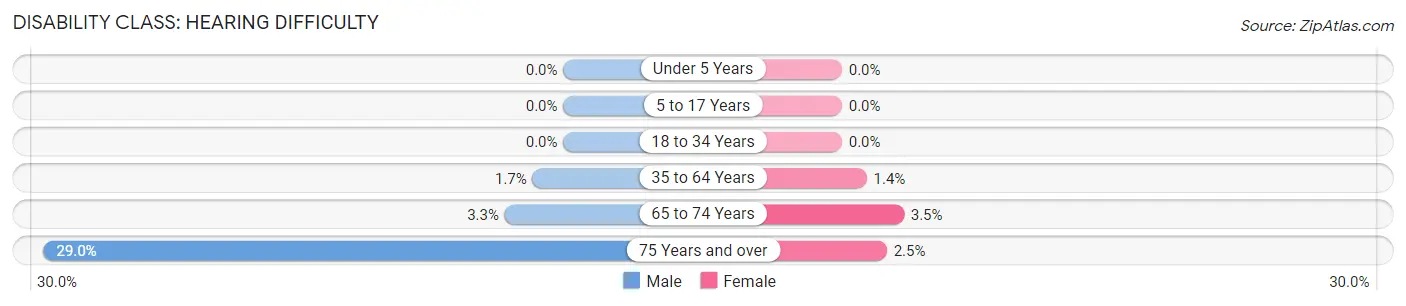
| Age Bracket | Male | Female |
| Under 5 Years | 0 (0.0%) | 0 (0.0%) |
| 5 to 17 Years | 0 (0.0%) | 0 (0.0%) |
| 18 to 34 Years | 0 (0.0%) | 0 (0.0%) |
| 35 to 64 Years | 2 (1.7%) | 2 (1.4%) |
| 65 to 74 Years | 3 (3.3%) | 2 (3.5%) |
| 75 Years and over | 11 (28.9%) | 1 (2.5%) |
Disability Class: Vision Difficulty
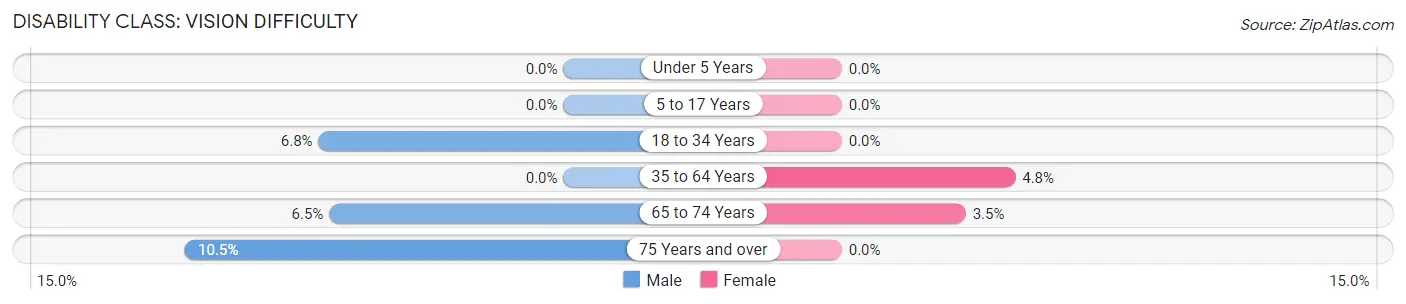
| Age Bracket | Male | Female |
| Under 5 Years | 0 (0.0%) | 0 (0.0%) |
| 5 to 17 Years | 0 (0.0%) | 0 (0.0%) |
| 18 to 34 Years | 6 (6.8%) | 0 (0.0%) |
| 35 to 64 Years | 0 (0.0%) | 7 (4.8%) |
| 65 to 74 Years | 6 (6.5%) | 2 (3.5%) |
| 75 Years and over | 4 (10.5%) | 0 (0.0%) |
Disability Class: Cognitive Difficulty
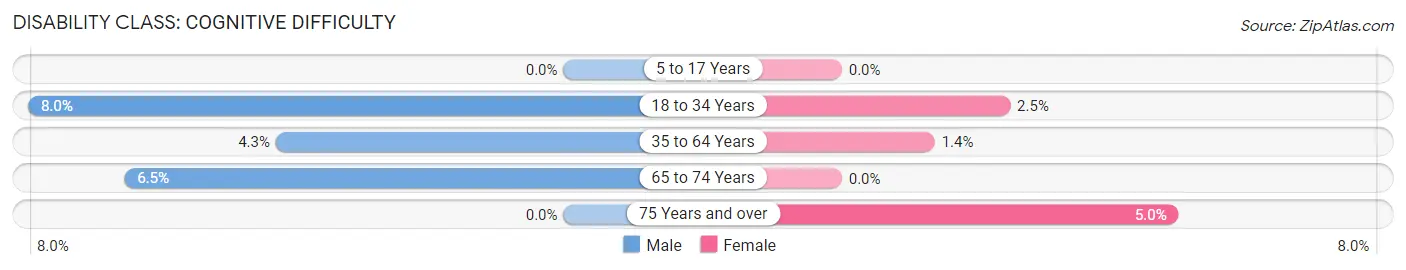
| Age Bracket | Male | Female |
| 5 to 17 Years | 0 (0.0%) | 0 (0.0%) |
| 18 to 34 Years | 7 (8.0%) | 2 (2.5%) |
| 35 to 64 Years | 5 (4.3%) | 2 (1.4%) |
| 65 to 74 Years | 6 (6.5%) | 0 (0.0%) |
| 75 Years and over | 0 (0.0%) | 2 (5.0%) |
Disability Class: Ambulatory Difficulty
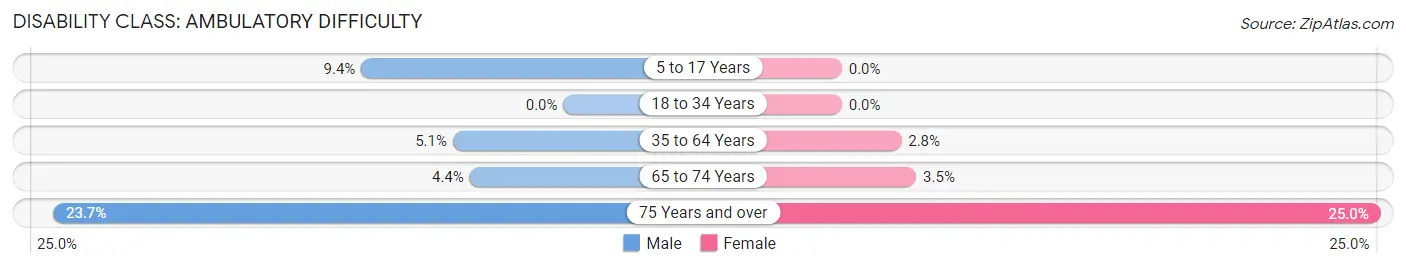
| Age Bracket | Male | Female |
| 5 to 17 Years | 3 (9.4%) | 0 (0.0%) |
| 18 to 34 Years | 0 (0.0%) | 0 (0.0%) |
| 35 to 64 Years | 6 (5.1%) | 4 (2.8%) |
| 65 to 74 Years | 4 (4.3%) | 2 (3.5%) |
| 75 Years and over | 9 (23.7%) | 10 (25.0%) |
Disability Class: Self-Care Difficulty
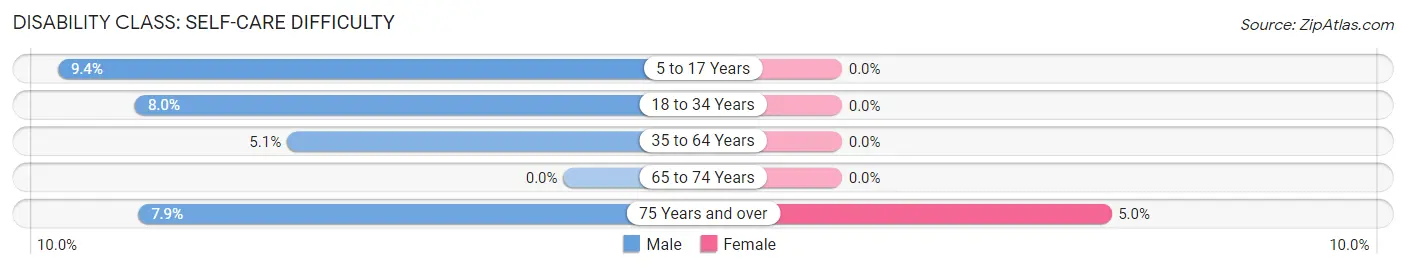
| Age Bracket | Male | Female |
| 5 to 17 Years | 3 (9.4%) | 0 (0.0%) |
| 18 to 34 Years | 7 (8.0%) | 0 (0.0%) |
| 35 to 64 Years | 6 (5.1%) | 0 (0.0%) |
| 65 to 74 Years | 0 (0.0%) | 0 (0.0%) |
| 75 Years and over | 3 (7.9%) | 2 (5.0%) |
Technology Access in Hill Country Village
Computing Device Access in Hill Country Village
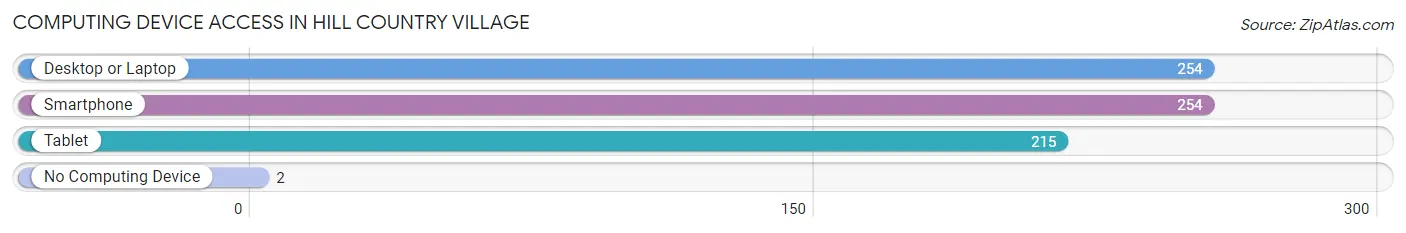
| Device Type | # Households | % Households |
| Desktop or Laptop | 254 | 95.5% |
| Smartphone | 254 | 95.5% |
| Tablet | 215 | 80.8% |
| No Computing Device | 2 | 0.7% |
| Total | 266 | 100.0% |
Internet Access in Hill Country Village
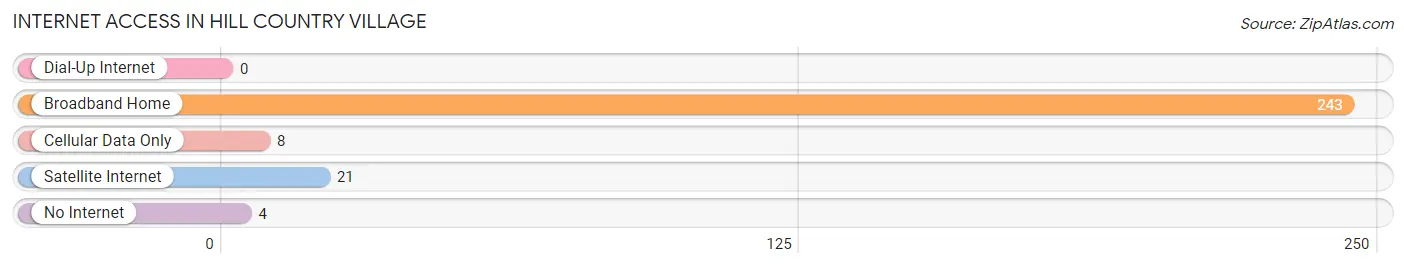
| Internet Type | # Households | % Households |
| Dial-Up Internet | 0 | 0.0% |
| Broadband Home | 243 | 91.3% |
| Cellular Data Only | 8 | 3.0% |
| Satellite Internet | 21 | 7.9% |
| No Internet | 4 | 1.5% |
| Total | 266 | 100.0% |
Hill Country Village Summary
History
Hill Country Village is a small city located in Bexar County, Texas. It is situated in the Hill Country region of the state, just north of San Antonio. The city was founded in the early 1950s by a group of ranchers and farmers who wanted to create a rural community. The city was incorporated in 1956 and has since grown to a population of just over 1,000 people.
The city was named after the Hill Country region of Texas, which is known for its rolling hills and lush vegetation. The area was originally inhabited by Native American tribes, including the Comanche, Apache, and Tonkawa. The first settlers in the area were Spanish missionaries, who established missions in the area in the late 1700s.
In the early 1900s, the area began to be developed for ranching and farming. The city of Hill Country Village was founded in the 1950s by a group of ranchers and farmers who wanted to create a rural community. The city was incorporated in 1956 and has since grown to a population of just over 1,000 people.
Geography
Hill Country Village is located in Bexar County, Texas, just north of San Antonio. The city is situated in the Hill Country region of the state, which is known for its rolling hills and lush vegetation. The area is characterized by a semi-arid climate, with hot summers and mild winters. The average annual temperature is around 70 degrees Fahrenheit.
The city covers an area of just over 1 square mile, with a population density of 1,000 people per square mile. The city is located at an elevation of 830 feet above sea level. The terrain is mostly flat, with some rolling hills in the area.
Economy
The economy of Hill Country Village is largely based on the service industry. The city is home to a variety of businesses, including restaurants, retail stores, and professional services. The city also has a number of small manufacturing companies, which produce a variety of products, including furniture, clothing, and electronics.
The city is also home to a number of educational institutions, including a community college and a private school. The city is served by the San Antonio International Airport, which is located just a few miles away.
Demographics
As of the 2010 census, the population of Hill Country Village was 1,072. The racial makeup of the city was 94.3% White, 0.7% African American, 0.3% Native American, 0.7% Asian, 0.1% Pacific Islander, 2.2% from other races, and 1.9% from two or more races. Hispanic or Latino of any race were 8.2% of the population.
The median household income in Hill Country Village was $68,750, and the median family income was $76,250. The per capita income for the city was $30,945. About 4.3% of families and 5.3% of the population were below the poverty line, including 6.3% of those under age 18 and 4.3% of those age 65 or over.
Common Questions
What is Per Capita Income in Hill Country Village?
Per Capita income in Hill Country Village is $149,928.
What is the Median Family Income in Hill Country Village?
Median Family Income in Hill Country Village is $250,001.
What is the Median Household income in Hill Country Village?
Median Household Income in Hill Country Village is $244,000.
What is Income or Wage Gap in Hill Country Village?
Income or Wage Gap in Hill Country Village is 41.8%.
Women in Hill Country Village earn 58.2 cents for every dollar earned by a man.
What is Inequality or Gini Index in Hill Country Village?
Inequality or Gini Index in Hill Country Village is 0.55.
What is the Total Population of Hill Country Village?
Total Population of Hill Country Village is 802.
What is the Total Male Population of Hill Country Village?
Total Male Population of Hill Country Village is 425.
What is the Total Female Population of Hill Country Village?
Total Female Population of Hill Country Village is 377.
What is the Ratio of Males per 100 Females in Hill Country Village?
There are 112.73 Males per 100 Females in Hill Country Village.
What is the Ratio of Females per 100 Males in Hill Country Village?
There are 88.71 Females per 100 Males in Hill Country Village.
What is the Median Population Age in Hill Country Village?
Median Population Age in Hill Country Village is 50.6 Years.
What is the Average Family Size in Hill Country Village
Average Family Size in Hill Country Village is 3.3 People.
What is the Average Household Size in Hill Country Village
Average Household Size in Hill Country Village is 3.0 People.
How Large is the Labor Force in Hill Country Village?
There are 413 People in the Labor Forcein in Hill Country Village.
What is the Percentage of People in the Labor Force in Hill Country Village?
60.6% of People are in the Labor Force in Hill Country Village.
What is the Unemployment Rate in Hill Country Village?
Unemployment Rate in Hill Country Village is 2.2%.