States with the Highest Inequality / Gini Index
RELATED REPORTS & OPTIONS
Highest Inequality / Gini Index
United States
Compare States
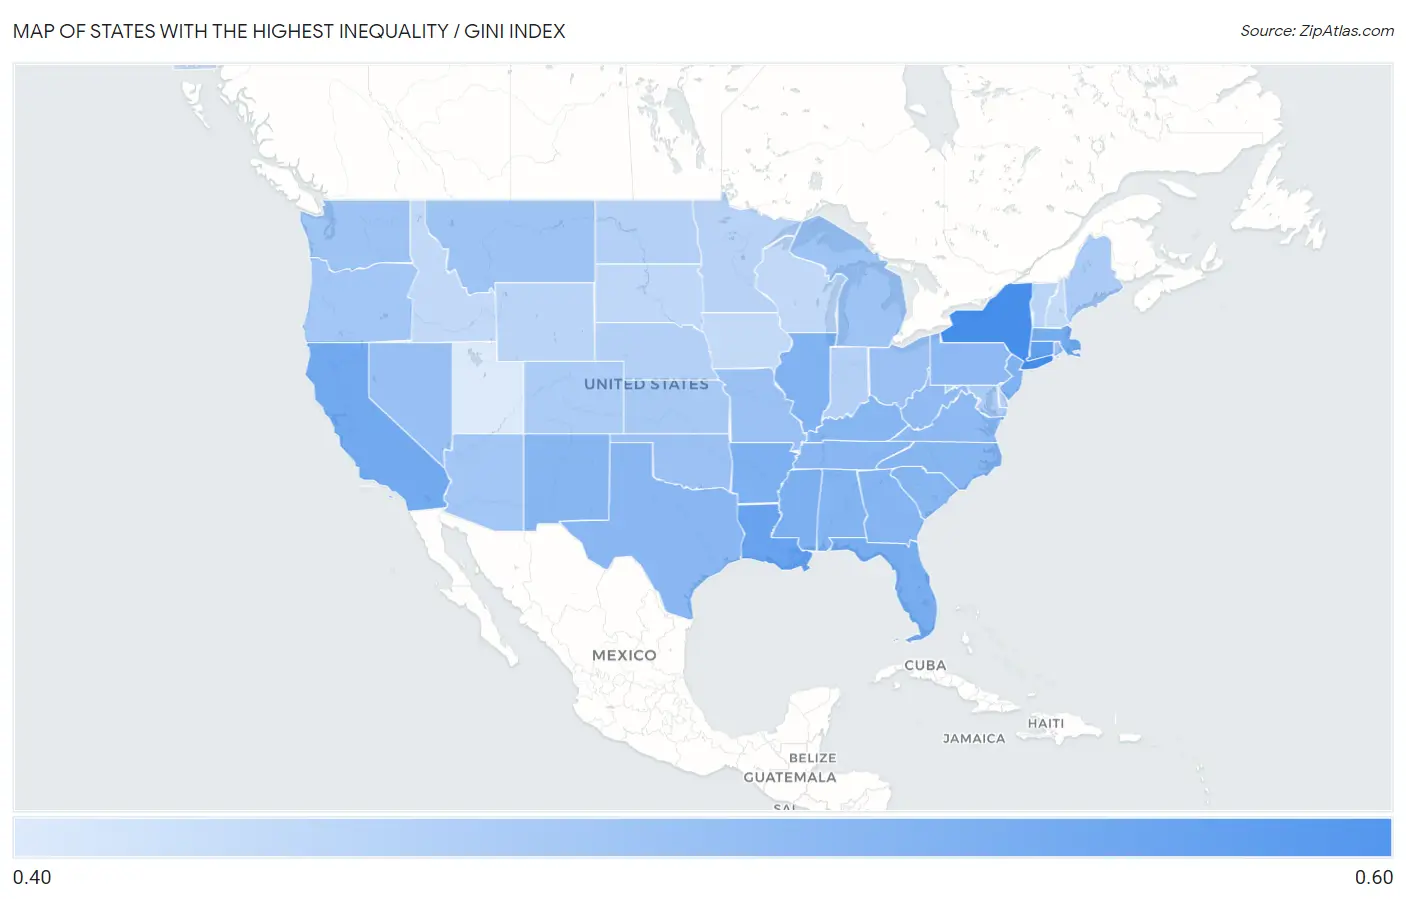
Map of States with the Highest Inequality / Gini Index
0.40
0.60
States with the Highest Inequality / Gini Index in the United States
| State | Inequality / Gini Index | vs State Median | vs National | |
| 1. | New York | 0.51 | 0.47 (+0.049) | 0.48(+0.032) |
| 2. | Connecticut | 0.50 | 0.47 (+0.034) | 0.48(+0.016) |
| 3. | Louisiana | 0.50 | 0.47 (+0.030) | 0.48(+0.012) |
| 4. | California | 0.49 | 0.47 (+0.024) | 0.48(+0.007) |
| 5. | Massachusetts | 0.49 | 0.47 (+0.023) | 0.48(+0.005) |
| 6. | Florida | 0.49 | 0.47 (+0.021) | 0.48(+0.003) |
| 7. | Mississippi | 0.48 | 0.47 (+0.018) | 0.48(+0.001) |
| 8. | Arkansas | 0.48 | 0.47 (+0.017) | 0.48(-0.001) |
| 9. | Illinois | 0.48 | 0.47 (+0.016) | 0.48(-0.002) |
| 10. | New Jersey | 0.48 | 0.47 (+0.016) | 0.48(-0.002) |
| 11. | Alabama | 0.48 | 0.47 (+0.014) | 0.48(-0.003) |
| 12. | Georgia | 0.48 | 0.47 (+0.013) | 0.48(-0.004) |
| 13. | North Carolina | 0.48 | 0.47 (+0.012) | 0.48(-0.006) |
| 14. | South Carolina | 0.48 | 0.47 (+0.012) | 0.48(-0.006) |
| 15. | Kentucky | 0.48 | 0.47 (+0.012) | 0.48(-0.006) |
| 16. | New Mexico | 0.48 | 0.47 (+0.011) | 0.48(-0.006) |
| 17. | Tennessee | 0.48 | 0.47 (+0.011) | 0.48(-0.007) |
| 18. | Texas | 0.48 | 0.47 (+0.011) | 0.48(-0.007) |
| 19. | Pennsylvania | 0.47 | 0.47 (+0.008) | 0.48(-0.010) |
| 20. | Virginia | 0.47 | 0.47 (+0.007) | 0.48(-0.011) |
| 21. | West Virginia | 0.47 | 0.47 (+0.006) | 0.48(-0.011) |
| 22. | Nevada | 0.47 | 0.47 (+0.002) | 0.48(-0.015) |
| 23. | Oklahoma | 0.47 | 0.47 (+0.002) | 0.48(-0.016) |
| 24. | Ohio | 0.47 | 0.47 (+0.001) | 0.48(-0.017) |
| 25. | Missouri | 0.47 | 0.47 (+0.001) | 0.48(-0.017) |
| 26. | Montana | 0.46 | 0.47 (-0.001) | 0.48(-0.019) |
| 27. | Michigan | 0.46 | 0.47 (-0.001) | 0.48(-0.019) |
| 28. | Washington | 0.46 | 0.47 (-0.002) | 0.48(-0.019) |
| 29. | Rhode Island | 0.46 | 0.47 (-0.003) | 0.48(-0.021) |
| 30. | Arizona | 0.46 | 0.47 (-0.004) | 0.48(-0.022) |
| 31. | Oregon | 0.46 | 0.47 (-0.004) | 0.48(-0.022) |
| 32. | Kansas | 0.46 | 0.47 (-0.007) | 0.48(-0.025) |
| 33. | Maine | 0.46 | 0.47 (-0.009) | 0.48(-0.026) |
| 34. | Colorado | 0.46 | 0.47 (-0.009) | 0.48(-0.027) |
| 35. | Maryland | 0.46 | 0.47 (-0.009) | 0.48(-0.027) |
| 36. | Nebraska | 0.45 | 0.47 (-0.013) | 0.48(-0.030) |
| 37. | North Dakota | 0.45 | 0.47 (-0.013) | 0.48(-0.031) |
| 38. | Indiana | 0.45 | 0.47 (-0.014) | 0.48(-0.031) |
| 39. | Delaware | 0.45 | 0.47 (-0.014) | 0.48(-0.032) |
| 40. | Minnesota | 0.45 | 0.47 (-0.016) | 0.48(-0.033) |
| 41. | Vermont | 0.45 | 0.47 (-0.017) | 0.48(-0.034) |
| 42. | Wyoming | 0.45 | 0.47 (-0.018) | 0.48(-0.035) |
| 43. | Hawaii | 0.45 | 0.47 (-0.019) | 0.48(-0.036) |
| 44. | South Dakota | 0.45 | 0.47 (-0.020) | 0.48(-0.038) |
| 45. | Wisconsin | 0.44 | 0.47 (-0.022) | 0.48(-0.039) |
| 46. | Idaho | 0.44 | 0.47 (-0.022) | 0.48(-0.039) |
| 47. | Iowa | 0.44 | 0.47 (-0.022) | 0.48(-0.040) |
| 48. | New Hampshire | 0.44 | 0.47 (-0.023) | 0.48(-0.040) |
| 49. | Alaska | 0.43 | 0.47 (-0.035) | 0.48(-0.052) |
| 50. | Utah | 0.43 | 0.47 (-0.037) | 0.48(-0.054) |
1
Common Questions
What are the Top 10 States with the Highest Inequality / Gini Index in the United States?
Top 10 States with the Highest Inequality / Gini Index in the United States are:
#1
0.51
#2
0.50
#3
0.50
#4
0.49
#5
0.49
#6
0.49
#7
0.48
#8
0.48
#9
0.48
#10
0.48
What state has the Highest Inequality / Gini Index in the United States?
New York has the Highest Inequality / Gini Index in the United States with 0.51.
What is the Inequality / Gini Index in the United States?
Inequality / Gini Index in the United States is 0.48.