Quitman, GA Map & Demographics
Quitman Map
Quitman Overview
$27,583
PER CAPITA INCOME
$41,339
AVG FAMILY INCOME
$20,333
AVG HOUSEHOLD INCOME
23.3%
WAGE / INCOME GAP [ % ]
76.7¢/ $1
WAGE / INCOME GAP [ $ ]
0.69
INEQUALITY / GINI INDEX
4,050
TOTAL POPULATION
1,755
MALE POPULATION
2,295
FEMALE POPULATION
76.47
MALES / 100 FEMALES
130.77
FEMALES / 100 MALES
38.9
MEDIAN AGE
3.8
AVG FAMILY SIZE
2.7
AVG HOUSEHOLD SIZE
1,547
LABOR FORCE [ PEOPLE ]
50.1%
PERCENT IN LABOR FORCE
6.1%
UNEMPLOYMENT RATE
Quitman Zip Codes
Quitman Area Codes
Income in Quitman
Income Overview in Quitman
Per Capita Income in Quitman is $27,583, while median incomes of families and households are $41,339 and $20,333 respectively.
| Characteristic | Number | Measure |
| Per Capita Income | 4,050 | $27,583 |
| Median Family Income | 818 | $41,339 |
| Mean Family Income | 818 | $100,817 |
| Median Household Income | 1,504 | $20,333 |
| Mean Household Income | 1,504 | $64,872 |
| Income Deficit | 818 | $0 |
| Wage / Income Gap (%) | 4,050 | 23.31% |
| Wage / Income Gap ($) | 4,050 | 76.69¢ per $1 |
| Gini / Inequality Index | 4,050 | 0.69 |
Earnings by Sex in Quitman
Average Earnings in Quitman are $27,813, $34,866 for men and $26,739 for women, a difference of 23.3%.
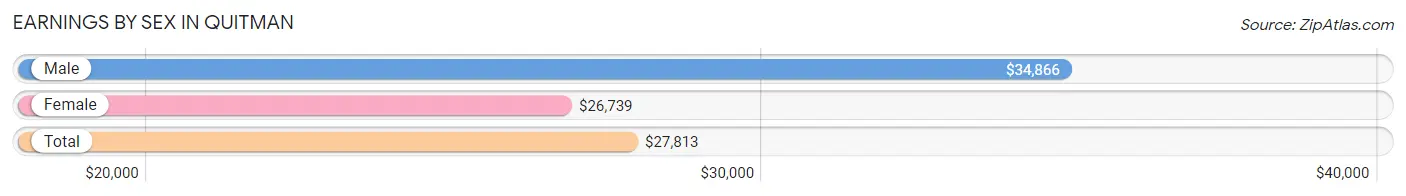
| Sex | Number | Average Earnings |
| Male | 647 (41.0%) | $34,866 |
| Female | 931 (59.0%) | $26,739 |
| Total | 1,578 (100.0%) | $27,813 |
Earnings by Sex by Income Bracket in Quitman
The most common earnings brackets in Quitman are $75,000 to $99,999 for men (148 | 22.9%) and $15,000 to $17,499 for women (183 | 19.7%).
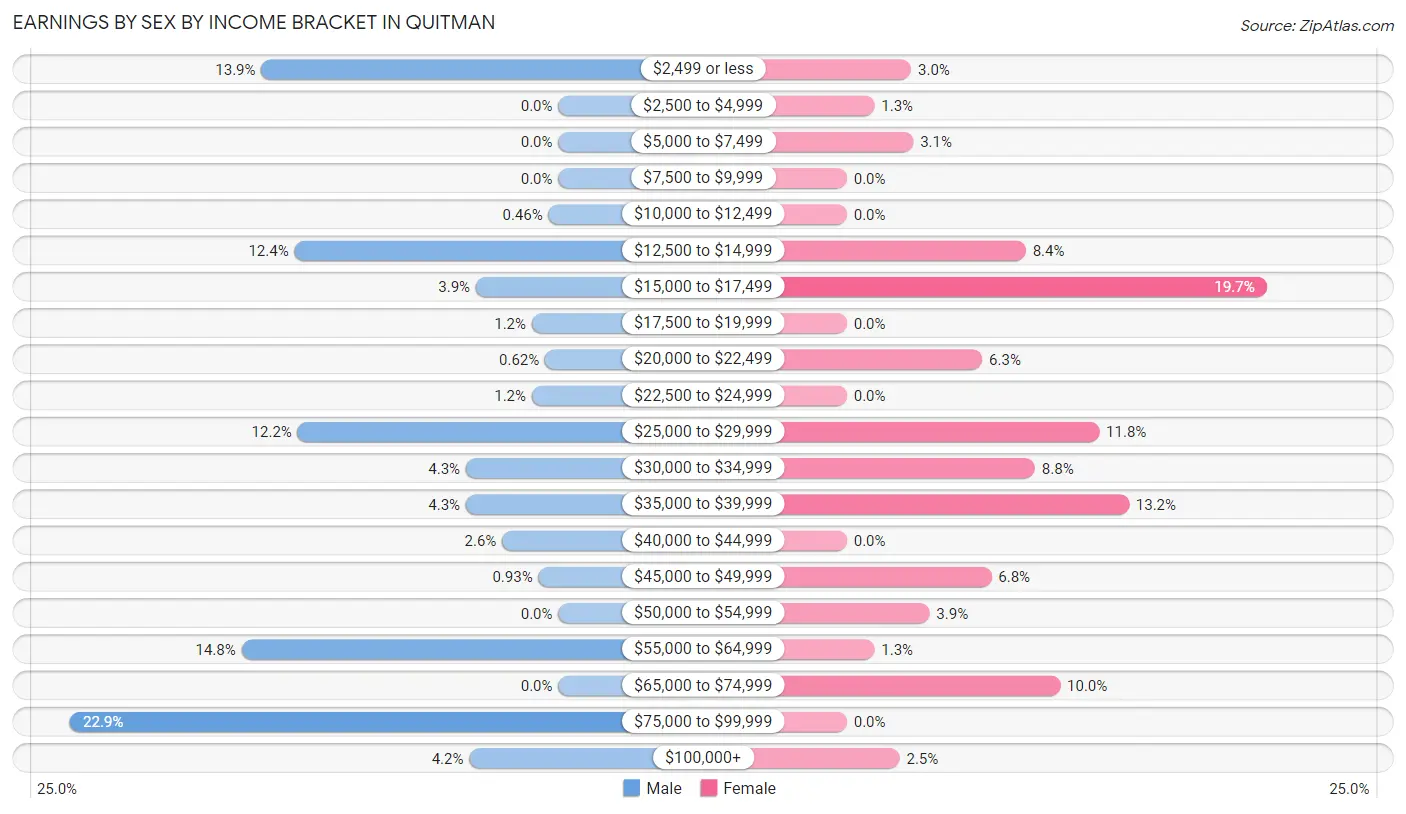
| Income | Male | Female |
| $2,499 or less | 90 (13.9%) | 28 (3.0%) |
| $2,500 to $4,999 | 0 (0.0%) | 12 (1.3%) |
| $5,000 to $7,499 | 0 (0.0%) | 29 (3.1%) |
| $7,500 to $9,999 | 0 (0.0%) | 0 (0.0%) |
| $10,000 to $12,499 | 3 (0.5%) | 0 (0.0%) |
| $12,500 to $14,999 | 80 (12.4%) | 78 (8.4%) |
| $15,000 to $17,499 | 25 (3.9%) | 183 (19.7%) |
| $17,500 to $19,999 | 8 (1.2%) | 0 (0.0%) |
| $20,000 to $22,499 | 4 (0.6%) | 59 (6.3%) |
| $22,500 to $24,999 | 8 (1.2%) | 0 (0.0%) |
| $25,000 to $29,999 | 79 (12.2%) | 110 (11.8%) |
| $30,000 to $34,999 | 28 (4.3%) | 82 (8.8%) |
| $35,000 to $39,999 | 28 (4.3%) | 123 (13.2%) |
| $40,000 to $44,999 | 17 (2.6%) | 0 (0.0%) |
| $45,000 to $49,999 | 6 (0.9%) | 63 (6.8%) |
| $50,000 to $54,999 | 0 (0.0%) | 36 (3.9%) |
| $55,000 to $64,999 | 96 (14.8%) | 12 (1.3%) |
| $65,000 to $74,999 | 0 (0.0%) | 93 (10.0%) |
| $75,000 to $99,999 | 148 (22.9%) | 0 (0.0%) |
| $100,000+ | 27 (4.2%) | 23 (2.5%) |
| Total | 647 (100.0%) | 931 (100.0%) |
Earnings by Sex by Educational Attainment in Quitman
Average earnings in Quitman are $35,179 for men and $26,830 for women, a difference of 23.7%. Men with an educational attainment of bachelor's degree enjoy the highest average annual earnings of $93,433, while those with college or associate's degree education earn the least with $58,021. Women with an educational attainment of less than high school earn the most with the average annual earnings of $35,605, while those with bachelor's degree education have the smallest earnings of $13,942.
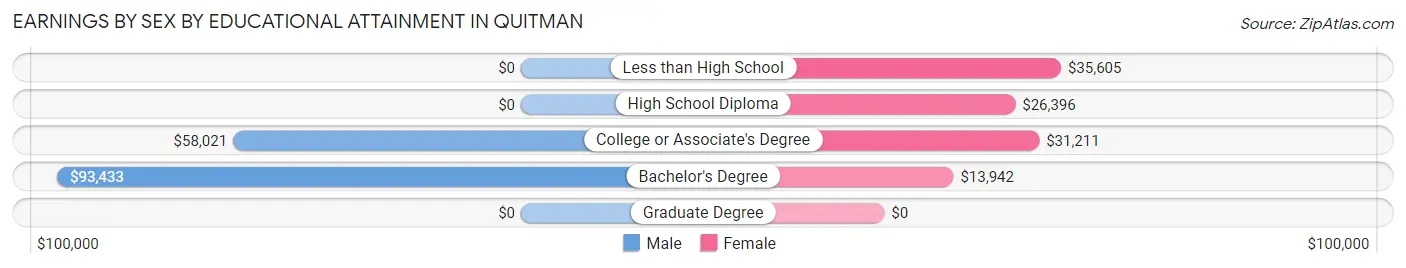
| Educational Attainment | Male Income | Female Income |
| Less than High School | - | - |
| High School Diploma | - | - |
| College or Associate's Degree | $58,021 | $31,211 |
| Bachelor's Degree | $93,433 | $13,942 |
| Graduate Degree | - | - |
| Total | $35,179 | $26,830 |
Family Income in Quitman
Family Income Brackets in Quitman
According to the Quitman family income data, there are 143 families falling into the $15,000 to $24,999 income range, which is the most common income bracket and makes up 17.5% of all families.
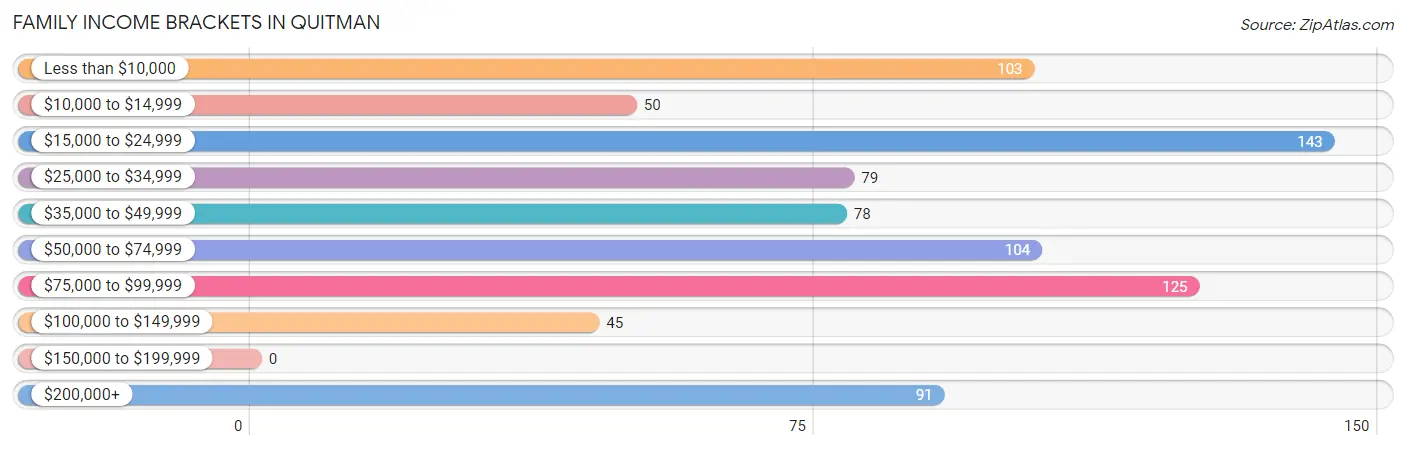
| Income Bracket | # Families | % Families |
| Less than $10,000 | 103 | 12.6% |
| $10,000 to $14,999 | 50 | 6.1% |
| $15,000 to $24,999 | 143 | 17.5% |
| $25,000 to $34,999 | 79 | 9.7% |
| $35,000 to $49,999 | 78 | 9.5% |
| $50,000 to $74,999 | 104 | 12.7% |
| $75,000 to $99,999 | 125 | 15.3% |
| $100,000 to $149,999 | 45 | 5.5% |
| $150,000 to $199,999 | 0 | 0.0% |
| $200,000+ | 91 | 11.1% |
Family Income by Famaliy Size in Quitman
2-person families (354 | 43.3%) account for the highest median family income in Quitman with $43,542 per family, while 2-person families (354 | 43.3%) have the highest median income of $21,771 per family member.
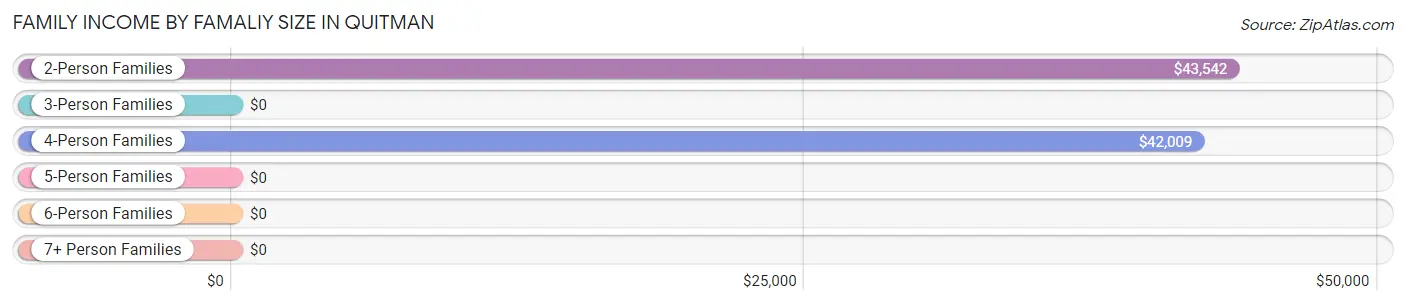
| Income Bracket | # Families | Median Income |
| 2-Person Families | 354 (43.3%) | $43,542 |
| 3-Person Families | 214 (26.2%) | $0 |
| 4-Person Families | 127 (15.5%) | $42,009 |
| 5-Person Families | 88 (10.8%) | $0 |
| 6-Person Families | 35 (4.3%) | $0 |
| 7+ Person Families | 0 (0.0%) | $0 |
| Total | 818 (100.0%) | $41,339 |
Family Income by Number of Earners in Quitman
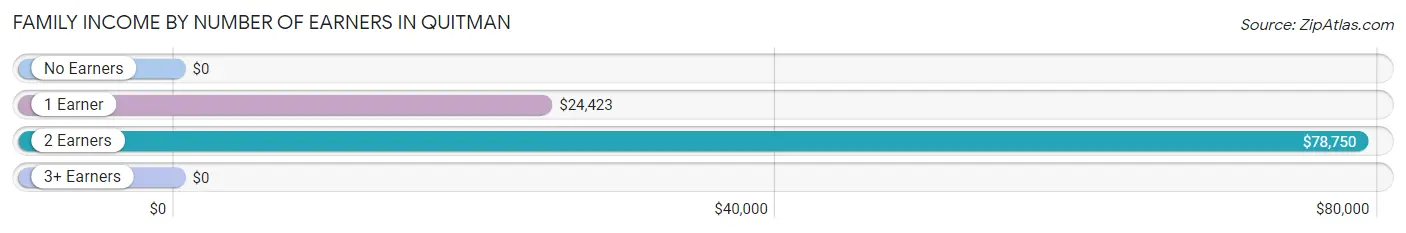
| Number of Earners | # Families | Median Income |
| No Earners | 250 (30.6%) | $0 |
| 1 Earner | 224 (27.4%) | $24,423 |
| 2 Earners | 320 (39.1%) | $78,750 |
| 3+ Earners | 24 (2.9%) | $0 |
| Total | 818 (100.0%) | $41,339 |
Household Income in Quitman
Household Income Brackets in Quitman
With 325 households falling in the category, the $15,000 to $24,999 income range is the most frequent in Quitman, accounting for 21.6% of all households. In contrast, only 8 households (0.5%) fall into the $150,000 to $199,999 income bracket, making it the least populous group.
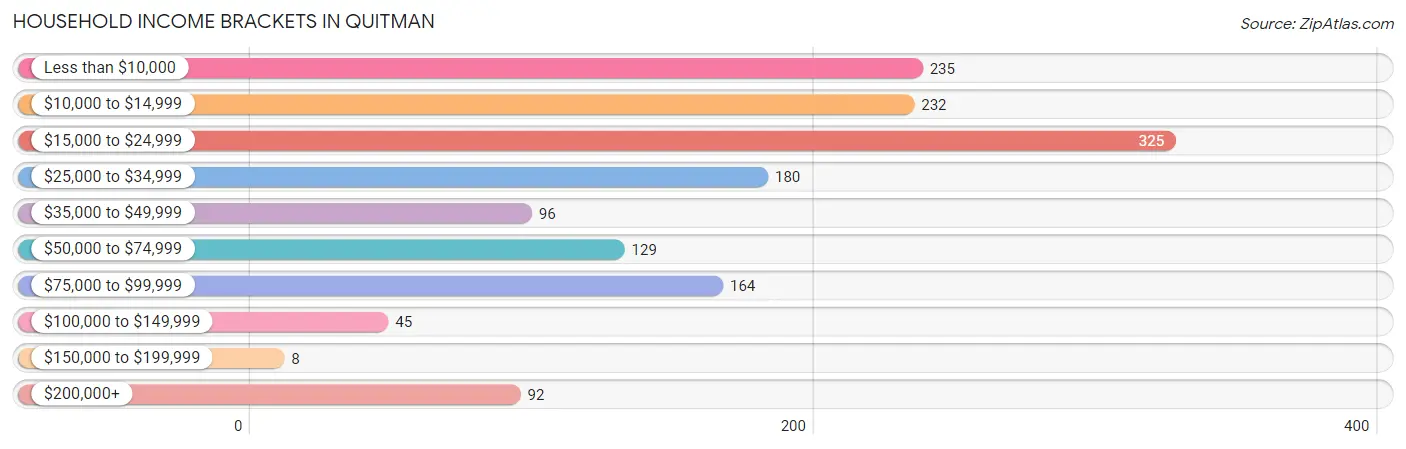
| Income Bracket | # Households | % Households |
| Less than $10,000 | 235 | 15.6% |
| $10,000 to $14,999 | 232 | 15.4% |
| $15,000 to $24,999 | 325 | 21.6% |
| $25,000 to $34,999 | 180 | 12.0% |
| $35,000 to $49,999 | 96 | 6.4% |
| $50,000 to $74,999 | 129 | 8.6% |
| $75,000 to $99,999 | 164 | 10.9% |
| $100,000 to $149,999 | 45 | 3.0% |
| $150,000 to $199,999 | 8 | 0.5% |
| $200,000+ | 92 | 6.1% |
Household Income by Householder Age in Quitman
The median household income in Quitman is $20,333, with the highest median household income of $33,158 found in the 45 to 64 years age bracket for the primary householder. A total of 686 households (45.6%) fall into this category.
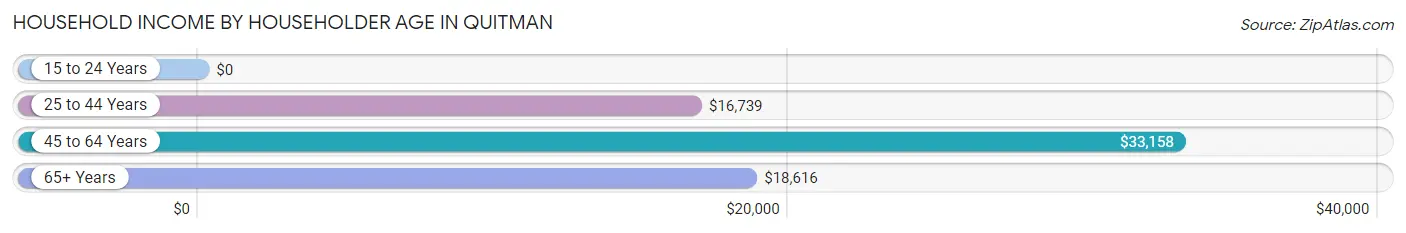
| Income Bracket | # Households | Median Income |
| 15 to 24 Years | 0 (0.0%) | $0 |
| 25 to 44 Years | 271 (18.0%) | $16,739 |
| 45 to 64 Years | 686 (45.6%) | $33,158 |
| 65+ Years | 547 (36.4%) | $18,616 |
| Total | 1,504 (100.0%) | $20,333 |
Poverty in Quitman
Income Below Poverty by Sex and Age in Quitman
With 35.5% poverty level for males and 43.7% for females among the residents of Quitman, under 5 year old males and 65 to 74 year old females are the most vulnerable to poverty, with 127 males (74.7%) and 204 females (63.0%) in their respective age groups living below the poverty level.
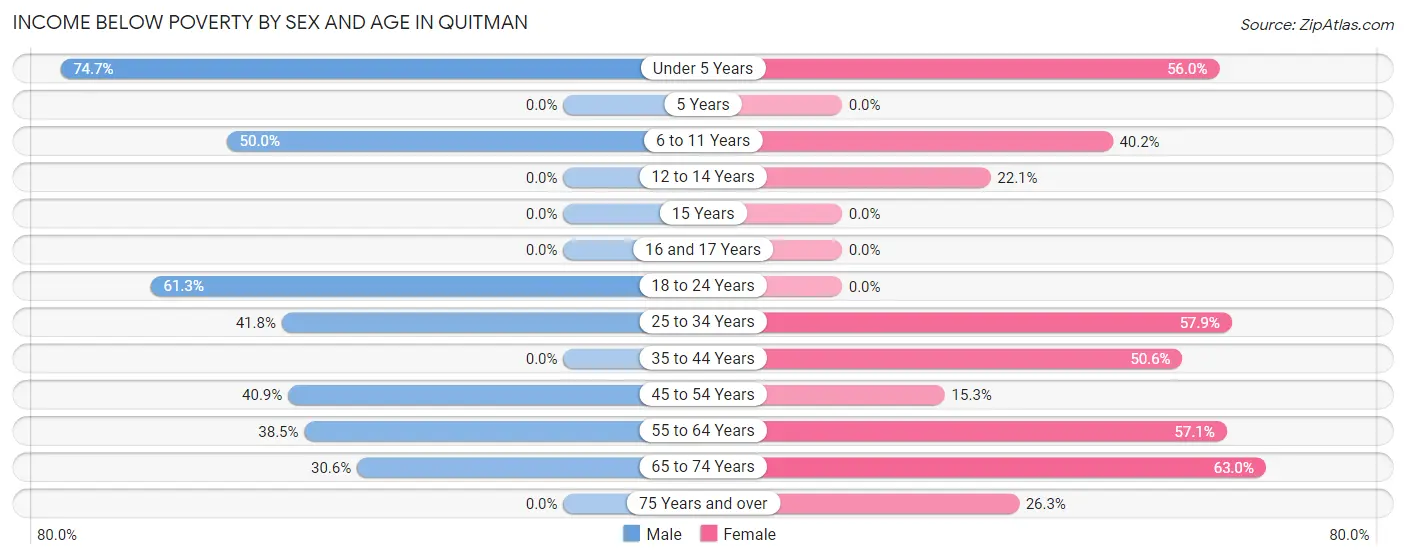
| Age Bracket | Male | Female |
| Under 5 Years | 127 (74.7%) | 102 (56.0%) |
| 5 Years | 0 (0.0%) | 0 (0.0%) |
| 6 to 11 Years | 89 (50.0%) | 86 (40.2%) |
| 12 to 14 Years | 0 (0.0%) | 15 (22.1%) |
| 15 Years | 0 (0.0%) | 0 (0.0%) |
| 16 and 17 Years | 0 (0.0%) | 0 (0.0%) |
| 18 to 24 Years | 76 (61.3%) | 0 (0.0%) |
| 25 to 34 Years | 92 (41.8%) | 209 (57.9%) |
| 35 to 44 Years | 0 (0.0%) | 87 (50.6%) |
| 45 to 54 Years | 47 (40.9%) | 53 (15.3%) |
| 55 to 64 Years | 105 (38.5%) | 216 (57.1%) |
| 65 to 74 Years | 68 (30.6%) | 204 (63.0%) |
| 75 Years and over | 0 (0.0%) | 31 (26.3%) |
| Total | 604 (35.5%) | 1,003 (43.7%) |
Income Above Poverty by Sex and Age in Quitman
According to the poverty statistics in Quitman, males aged 12 to 14 years and females aged 16 and 17 years are the age groups that are most secure financially, with 100.0% of males and 100.0% of females in these age groups living above the poverty line.
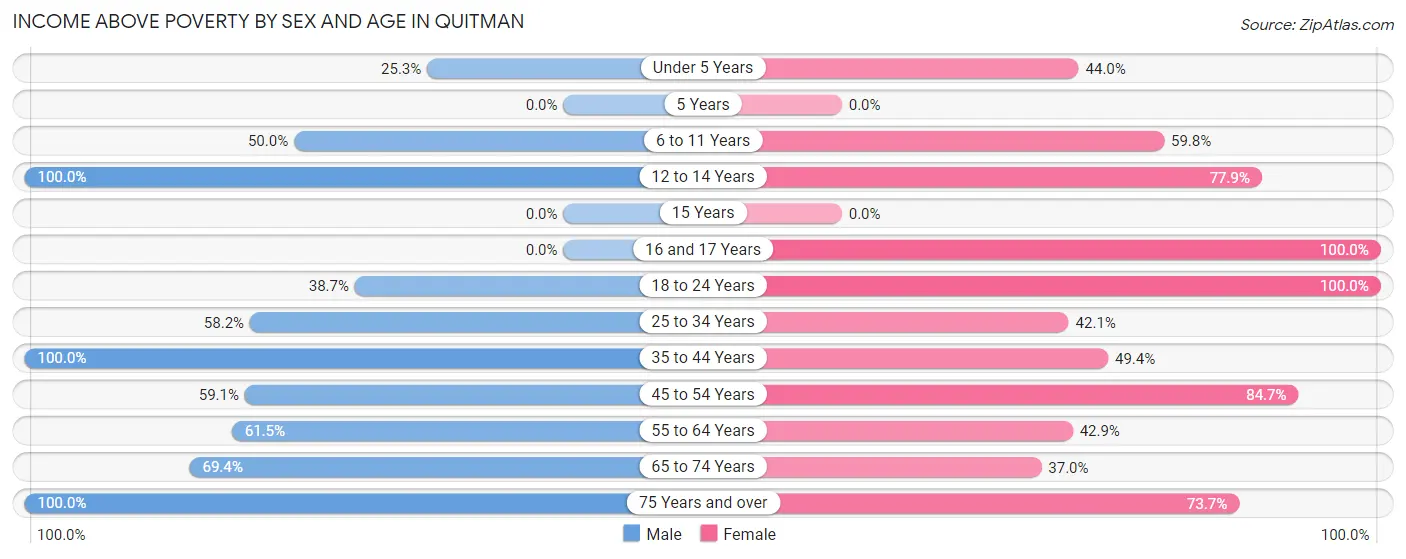
| Age Bracket | Male | Female |
| Under 5 Years | 43 (25.3%) | 80 (44.0%) |
| 5 Years | 0 (0.0%) | 0 (0.0%) |
| 6 to 11 Years | 89 (50.0%) | 128 (59.8%) |
| 12 to 14 Years | 151 (100.0%) | 53 (77.9%) |
| 15 Years | 0 (0.0%) | 0 (0.0%) |
| 16 and 17 Years | 0 (0.0%) | 52 (100.0%) |
| 18 to 24 Years | 48 (38.7%) | 79 (100.0%) |
| 25 to 34 Years | 128 (58.2%) | 152 (42.1%) |
| 35 to 44 Years | 204 (100.0%) | 85 (49.4%) |
| 45 to 54 Years | 68 (59.1%) | 294 (84.7%) |
| 55 to 64 Years | 168 (61.5%) | 162 (42.9%) |
| 65 to 74 Years | 154 (69.4%) | 120 (37.0%) |
| 75 Years and over | 43 (100.0%) | 87 (73.7%) |
| Total | 1,096 (64.5%) | 1,292 (56.3%) |
Income Below Poverty Among Married-Couple Families in Quitman
The poverty statistics for married-couple families in Quitman show that 13.7% or 49 of the total 359 families live below the poverty line. Families with 3 or 4 children have the highest poverty rate of 26.3%, comprising of 10 families. On the other hand, families with 1 or 2 children have the lowest poverty rate of 0.0%, which includes 0 families.
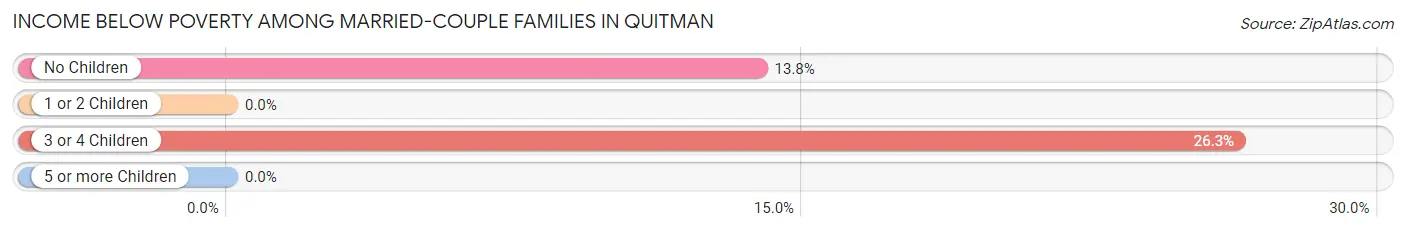
| Children | Above Poverty | Below Poverty |
| No Children | 243 (86.2%) | 39 (13.8%) |
| 1 or 2 Children | 39 (100.0%) | 0 (0.0%) |
| 3 or 4 Children | 28 (73.7%) | 10 (26.3%) |
| 5 or more Children | 0 (0.0%) | 0 (0.0%) |
| Total | 310 (86.4%) | 49 (13.7%) |
Income Below Poverty Among Single-Parent Households in Quitman
According to the poverty data in Quitman, 41.8% or 28 single-father households and 54.1% or 212 single-mother households are living below the poverty line. Among single-father households, those with 1 or 2 children have the highest poverty rate, with 13 households (65.0%) experiencing poverty. Likewise, among single-mother households, those with 1 or 2 children have the highest poverty rate, with 212 households (80.6%) falling below the poverty line.
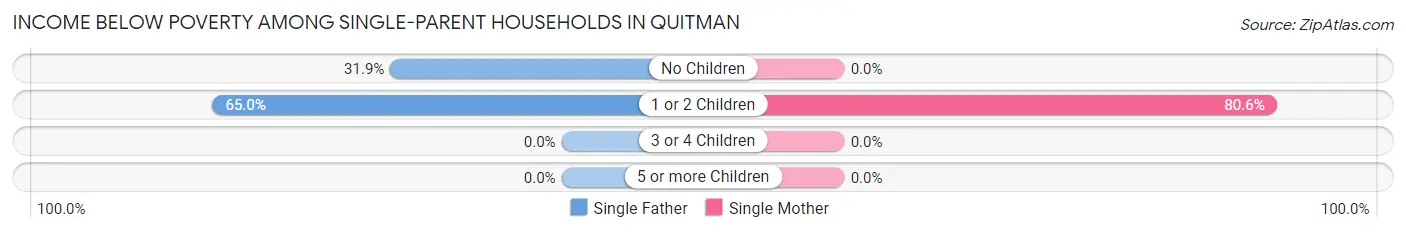
| Children | Single Father | Single Mother |
| No Children | 15 (31.9%) | 0 (0.0%) |
| 1 or 2 Children | 13 (65.0%) | 212 (80.6%) |
| 3 or 4 Children | 0 (0.0%) | 0 (0.0%) |
| 5 or more Children | 0 (0.0%) | 0 (0.0%) |
| Total | 28 (41.8%) | 212 (54.1%) |
Income Below Poverty Among Married-Couple vs Single-Parent Households in Quitman
The poverty data for Quitman shows that 49 of the married-couple family households (13.7%) and 240 of the single-parent households (52.3%) are living below the poverty level. Within the married-couple family households, those with 3 or 4 children have the highest poverty rate, with 10 households (26.3%) falling below the poverty line. Among the single-parent households, those with 1 or 2 children have the highest poverty rate, with 225 household (79.5%) living below poverty.
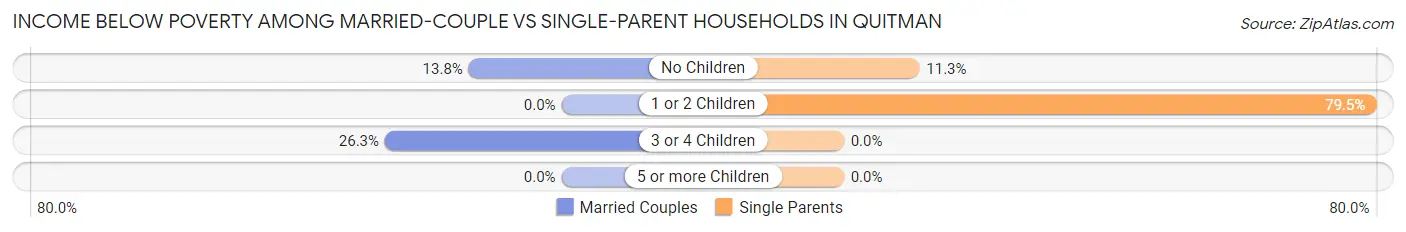
| Children | Married-Couple Families | Single-Parent Households |
| No Children | 39 (13.8%) | 15 (11.3%) |
| 1 or 2 Children | 0 (0.0%) | 225 (79.5%) |
| 3 or 4 Children | 10 (26.3%) | 0 (0.0%) |
| 5 or more Children | 0 (0.0%) | 0 (0.0%) |
| Total | 49 (13.7%) | 240 (52.3%) |
Race in Quitman
The most populous races in Quitman are Black / African American (3,022 | 74.6%), White / Caucasian (1,003 | 24.8%), and Hispanic or Latino (100 | 2.5%).
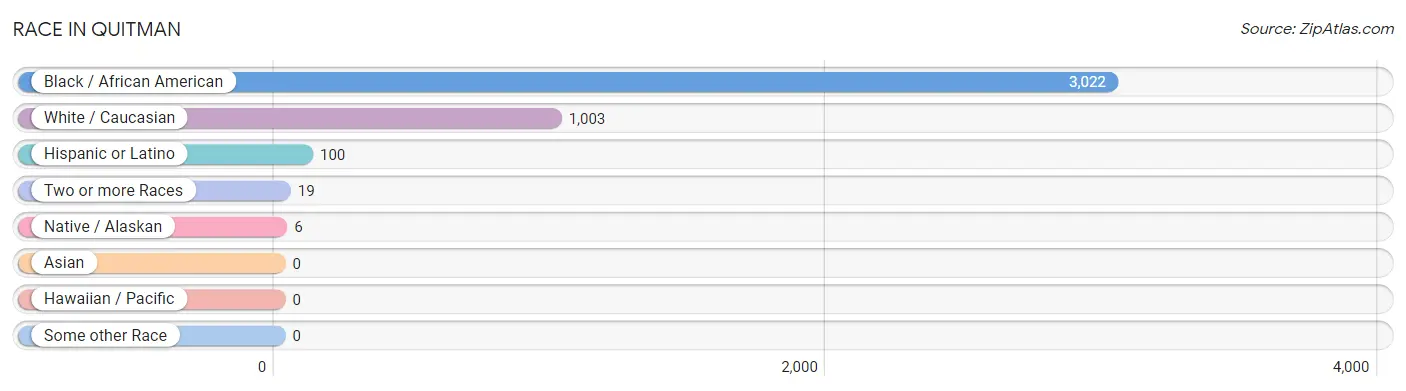
| Race | # Population | % Population |
| Asian | 0 | 0.0% |
| Black / African American | 3,022 | 74.6% |
| Hawaiian / Pacific | 0 | 0.0% |
| Hispanic or Latino | 100 | 2.5% |
| Native / Alaskan | 6 | 0.2% |
| White / Caucasian | 1,003 | 24.8% |
| Two or more Races | 19 | 0.5% |
| Some other Race | 0 | 0.0% |
| Total | 4,050 | 100.0% |
Ancestry in Quitman
The most populous ancestries reported in Quitman are German (151 | 3.7%), French (150 | 3.7%), English (135 | 3.3%), Puerto Rican (100 | 2.5%), and Italian (99 | 2.4%), together accounting for 15.7% of all Quitman residents.
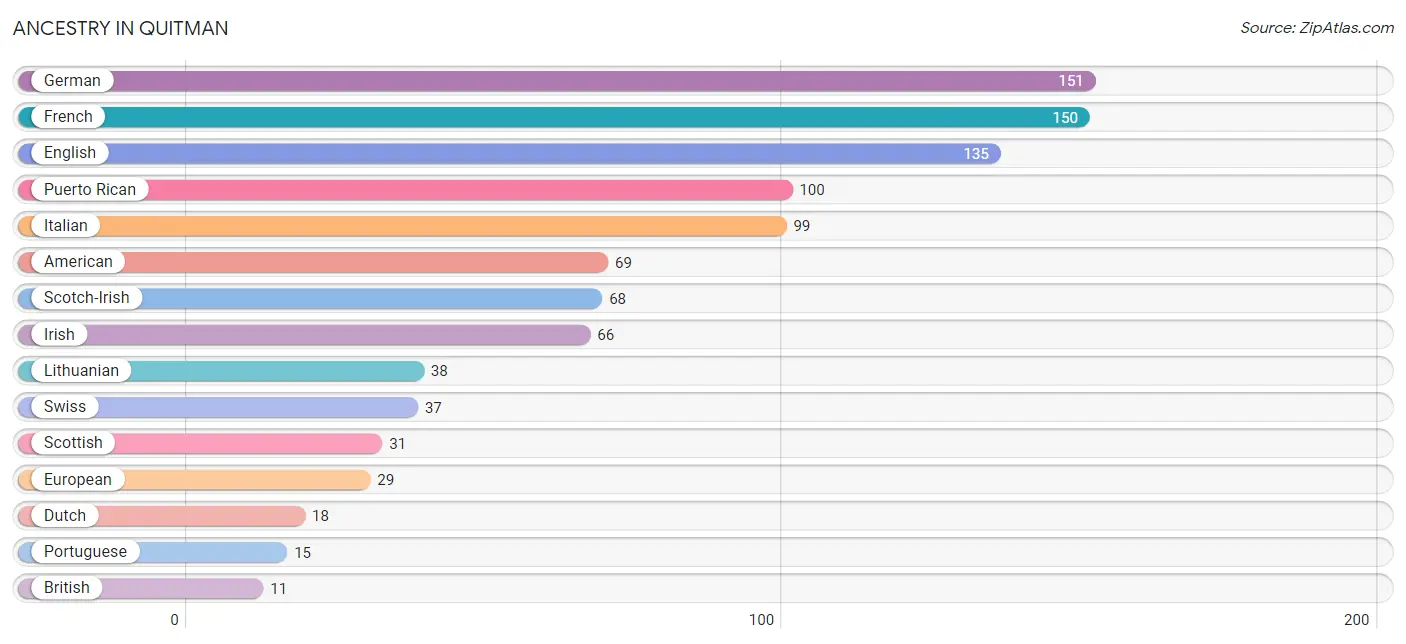
| Ancestry | # Population | % Population |
| American | 69 | 1.7% |
| British | 11 | 0.3% |
| Dutch | 18 | 0.4% |
| English | 135 | 3.3% |
| European | 29 | 0.7% |
| French | 150 | 3.7% |
| German | 151 | 3.7% |
| Irish | 66 | 1.6% |
| Italian | 99 | 2.4% |
| Jamaican | 10 | 0.3% |
| Lithuanian | 38 | 0.9% |
| Polish | 9 | 0.2% |
| Portuguese | 15 | 0.4% |
| Puerto Rican | 100 | 2.5% |
| Scotch-Irish | 68 | 1.7% |
| Scottish | 31 | 0.8% |
| Swiss | 37 | 0.9% | View All 17 Rows |
Immigrants in Quitman
The most numerous immigrant groups reported in Quitman came from England (11 | 0.3%), Europe (11 | 0.3%), Northern Europe (11 | 0.3%), Caribbean (10 | 0.3%), and Jamaica (10 | 0.3%), together accounting for 1.3% of all Quitman residents.
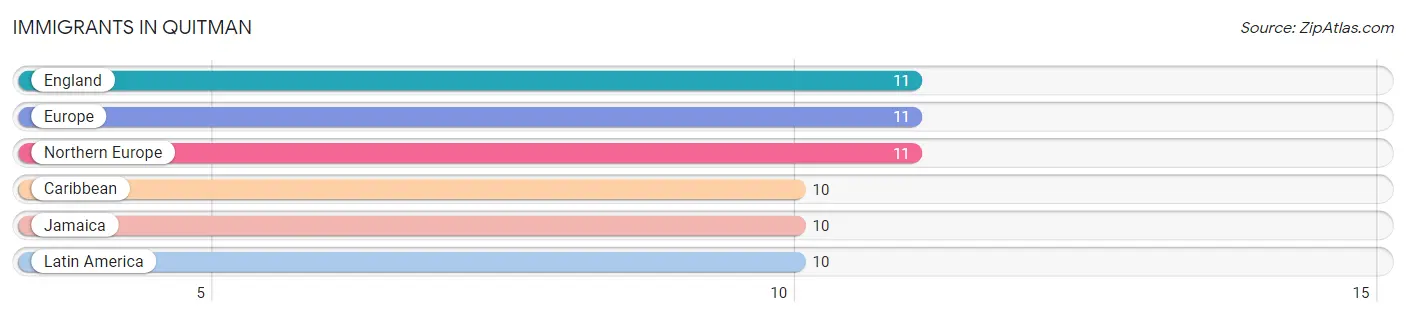
| Immigration Origin | # Population | % Population |
| Caribbean | 10 | 0.3% |
| England | 11 | 0.3% |
| Europe | 11 | 0.3% |
| Jamaica | 10 | 0.3% |
| Latin America | 10 | 0.3% |
| Northern Europe | 11 | 0.3% | View All 6 Rows |
Sex and Age in Quitman
Sex and Age in Quitman
The most populous age groups in Quitman are 10 to 14 Years (248 | 14.1%) for men and 30 to 34 Years (233 | 10.2%) for women.
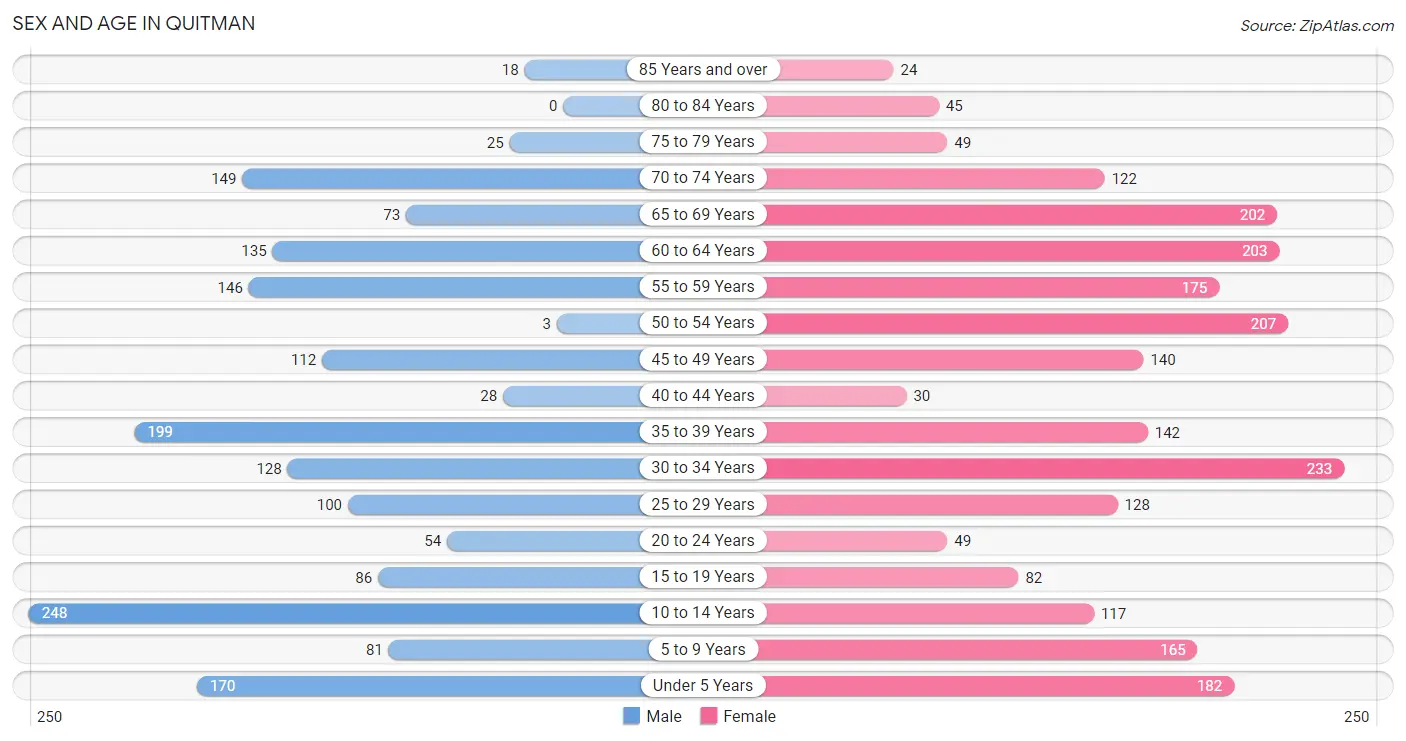
| Age Bracket | Male | Female |
| Under 5 Years | 170 (9.7%) | 182 (7.9%) |
| 5 to 9 Years | 81 (4.6%) | 165 (7.2%) |
| 10 to 14 Years | 248 (14.1%) | 117 (5.1%) |
| 15 to 19 Years | 86 (4.9%) | 82 (3.6%) |
| 20 to 24 Years | 54 (3.1%) | 49 (2.1%) |
| 25 to 29 Years | 100 (5.7%) | 128 (5.6%) |
| 30 to 34 Years | 128 (7.3%) | 233 (10.2%) |
| 35 to 39 Years | 199 (11.3%) | 142 (6.2%) |
| 40 to 44 Years | 28 (1.6%) | 30 (1.3%) |
| 45 to 49 Years | 112 (6.4%) | 140 (6.1%) |
| 50 to 54 Years | 3 (0.2%) | 207 (9.0%) |
| 55 to 59 Years | 146 (8.3%) | 175 (7.6%) |
| 60 to 64 Years | 135 (7.7%) | 203 (8.8%) |
| 65 to 69 Years | 73 (4.2%) | 202 (8.8%) |
| 70 to 74 Years | 149 (8.5%) | 122 (5.3%) |
| 75 to 79 Years | 25 (1.4%) | 49 (2.1%) |
| 80 to 84 Years | 0 (0.0%) | 45 (2.0%) |
| 85 Years and over | 18 (1.0%) | 24 (1.1%) |
| Total | 1,755 (100.0%) | 2,295 (100.0%) |
Families and Households in Quitman
Median Family Size in Quitman
The median family size in Quitman is 3.82 persons per family, with single male/father families (67 | 8.2%) accounting for the largest median family size of 5.73 persons per family. On the other hand, married-couple families (359 | 43.9%) represent the smallest median family size with 2.97 persons per family.
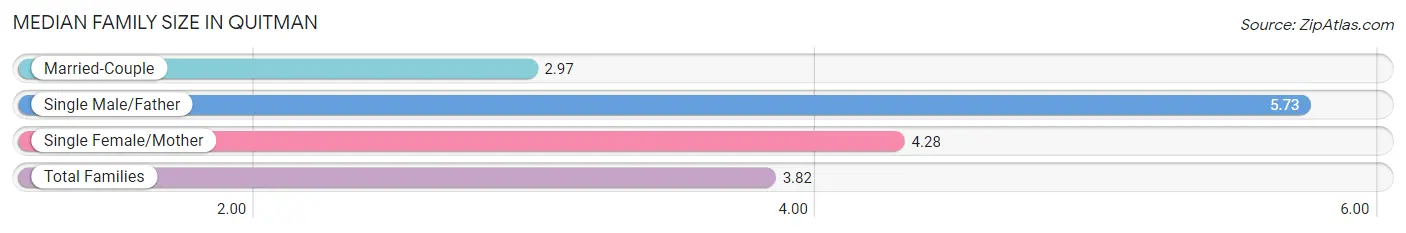
| Family Type | # Families | Family Size |
| Married-Couple | 359 (43.9%) | 2.97 |
| Single Male/Father | 67 (8.2%) | 5.73 |
| Single Female/Mother | 392 (47.9%) | 4.28 |
| Total Families | 818 (100.0%) | 3.82 |
Median Household Size in Quitman
The median household size in Quitman is 2.66 persons per household, with single male/father households (67 | 4.4%) accounting for the largest median household size of 5.73 persons per household. non-family households (686 | 45.6%) represent the smallest median household size with 1.15 persons per household.
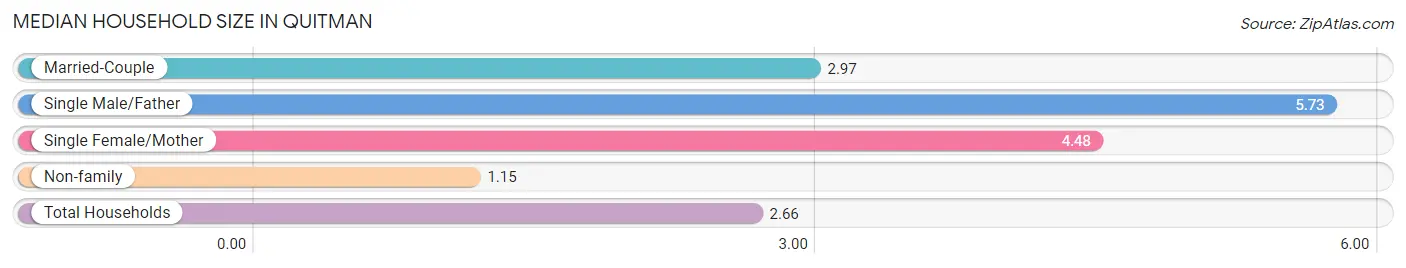
| Household Type | # Households | Household Size |
| Married-Couple | 359 (23.9%) | 2.97 |
| Single Male/Father | 67 (4.4%) | 5.73 |
| Single Female/Mother | 392 (26.1%) | 4.48 |
| Non-family | 686 (45.6%) | 1.15 |
| Total Households | 1,504 (100.0%) | 2.66 |
Household Size by Marriage Status in Quitman
Out of a total of 1,504 households in Quitman, 818 (54.4%) are family households, while 686 (45.6%) are nonfamily households. The most numerous type of family households are 2-person households, comprising 354, and the most common type of nonfamily households are 1-person households, comprising 652.
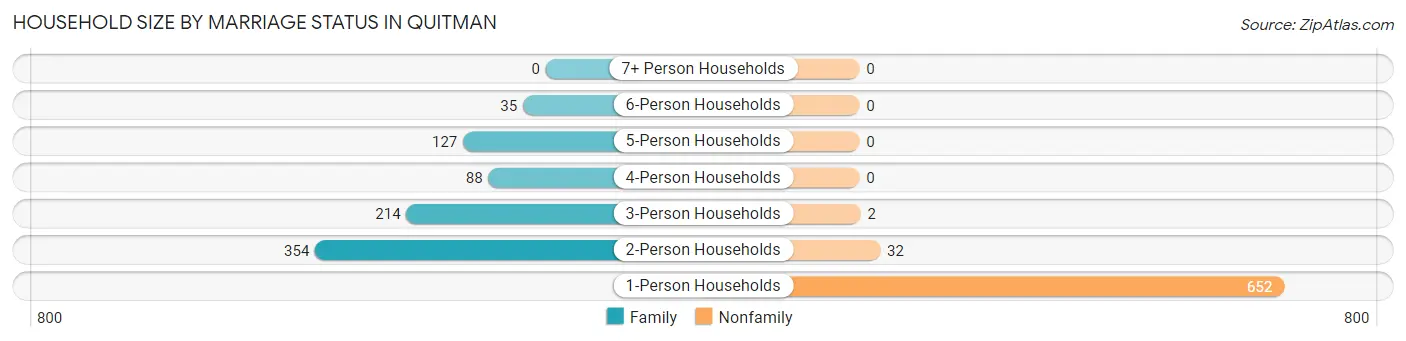
| Household Size | Family Households | Nonfamily Households |
| 1-Person Households | - | 652 (43.3%) |
| 2-Person Households | 354 (23.5%) | 32 (2.1%) |
| 3-Person Households | 214 (14.2%) | 2 (0.1%) |
| 4-Person Households | 88 (5.9%) | 0 (0.0%) |
| 5-Person Households | 127 (8.4%) | 0 (0.0%) |
| 6-Person Households | 35 (2.3%) | 0 (0.0%) |
| 7+ Person Households | 0 (0.0%) | 0 (0.0%) |
| Total | 818 (54.4%) | 686 (45.6%) |
Female Fertility in Quitman
Fertility by Age in Quitman
Average fertility rate in Quitman is 13.0 births per 1,000 women. Women in the age bracket of 35 to 50 years have the highest fertility rate with 33.0 births per 1,000 women. Women in the age bracket of 35 to 50 years acount for 100.0% of all women with births.
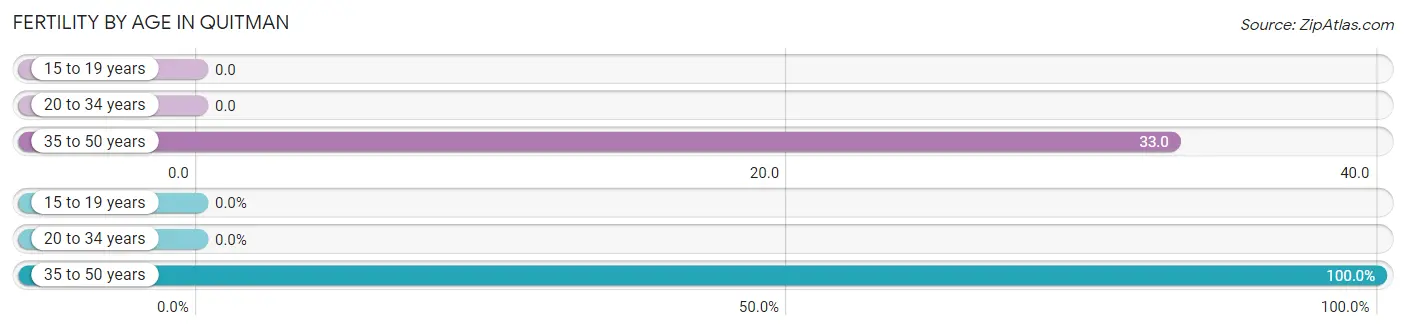
| Age Bracket | Women with Births | Births / 1,000 Women |
| 15 to 19 years | 0 (0.0%) | 0.0 |
| 20 to 34 years | 0 (0.0%) | 0.0 |
| 35 to 50 years | 11 (100.0%) | 33.0 |
| Total | 11 (100.0%) | 13.0 |
Fertility by Age by Marriage Status in Quitman
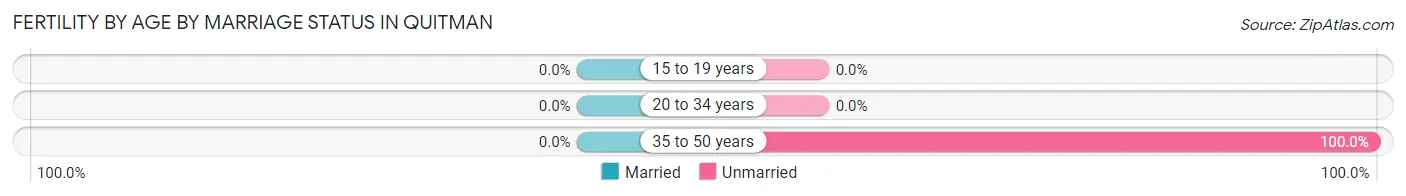
| Age Bracket | Married | Unmarried |
| 15 to 19 years | 0 (0.0%) | 0 (0.0%) |
| 20 to 34 years | 0 (0.0%) | 0 (0.0%) |
| 35 to 50 years | 0 (0.0%) | 11 (100.0%) |
| Total | 0 (0.0%) | 11 (100.0%) |
Fertility by Education in Quitman
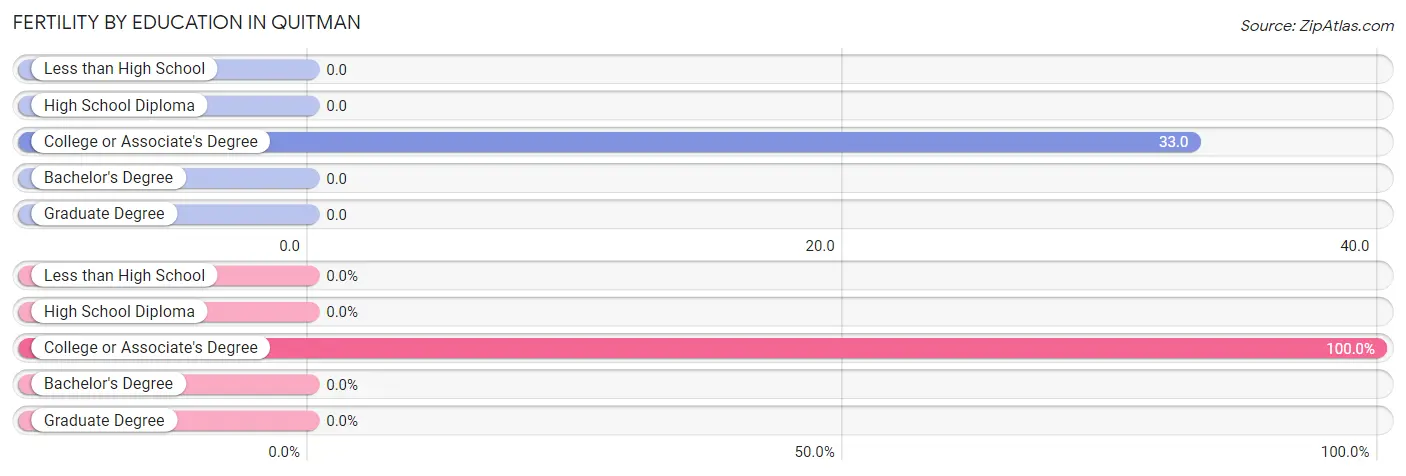
| Educational Attainment | Women with Births | Births / 1,000 Women |
| Less than High School | 0 (0.0%) | 0.0 |
| High School Diploma | 0 (0.0%) | 0.0 |
| College or Associate's Degree | 11 (100.0%) | 33.0 |
| Bachelor's Degree | 0 (0.0%) | 0.0 |
| Graduate Degree | 0 (0.0%) | 0.0 |
| Total | 11 (100.0%) | 13.0 |
Fertility by Education by Marriage Status in Quitman
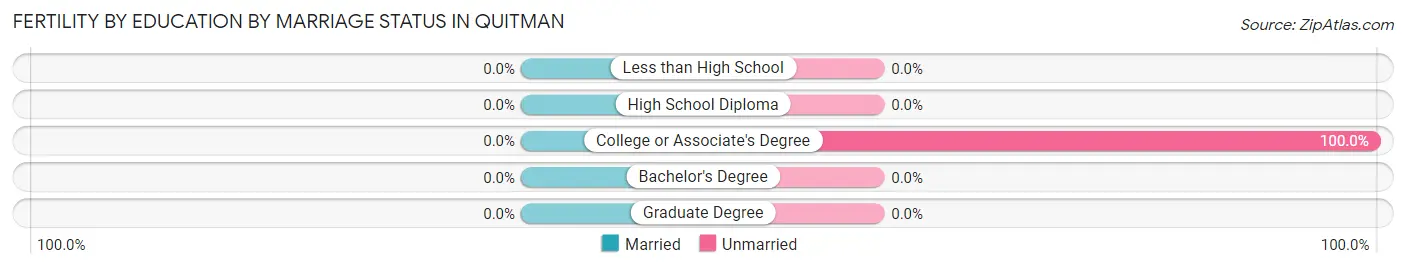
| Educational Attainment | Married | Unmarried |
| Less than High School | 0 (0.0%) | 0 (0.0%) |
| High School Diploma | 0 (0.0%) | 0 (0.0%) |
| College or Associate's Degree | 0 (0.0%) | 11 (100.0%) |
| Bachelor's Degree | 0 (0.0%) | 0 (0.0%) |
| Graduate Degree | 0 (0.0%) | 0 (0.0%) |
| Total | 0 (0.0%) | 11 (100.0%) |
Employment Characteristics in Quitman
Employment by Class of Employer in Quitman
Among the 1,375 employed individuals in Quitman, private company employees (831 | 60.4%), self-employed (not incorporated) (235 | 17.1%), and state government employees (109 | 7.9%) make up the most common classes of employment.
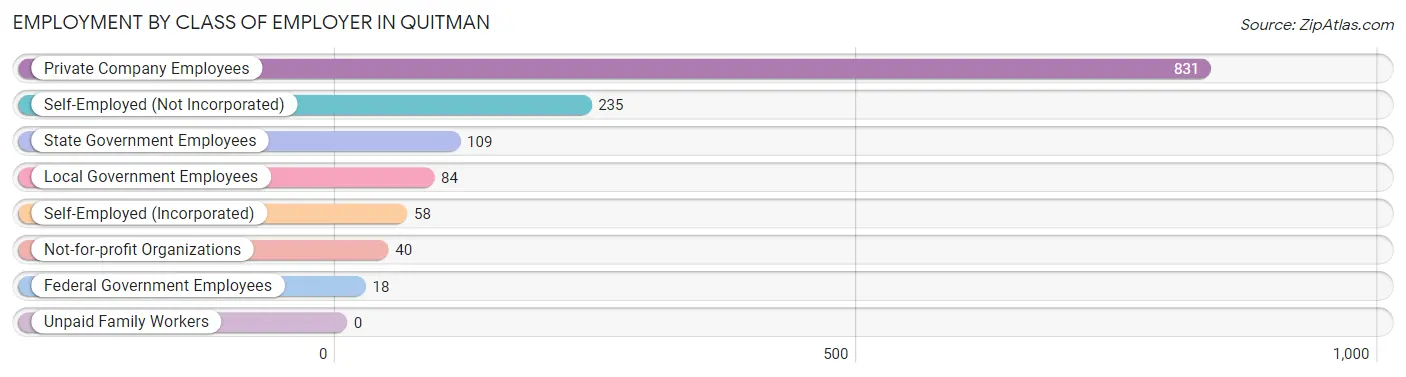
| Employer Class | # Employees | % Employees |
| Private Company Employees | 831 | 60.4% |
| Self-Employed (Incorporated) | 58 | 4.2% |
| Self-Employed (Not Incorporated) | 235 | 17.1% |
| Not-for-profit Organizations | 40 | 2.9% |
| Local Government Employees | 84 | 6.1% |
| State Government Employees | 109 | 7.9% |
| Federal Government Employees | 18 | 1.3% |
| Unpaid Family Workers | 0 | 0.0% |
| Total | 1,375 | 100.0% |
Employment Status by Age in Quitman
According to the labor force statistics for Quitman, out of the total population over 16 years of age (3,087), 50.1% or 1,547 individuals are in the labor force, with 6.1% or 94 of them unemployed. The age group with the highest labor force participation rate is 35 to 44 years, with 94.2% or 376 individuals in the labor force. Within the labor force, the 16 to 19 years age range has the highest percentage of unemployed individuals, with 100.0% or 48 of them being unemployed.
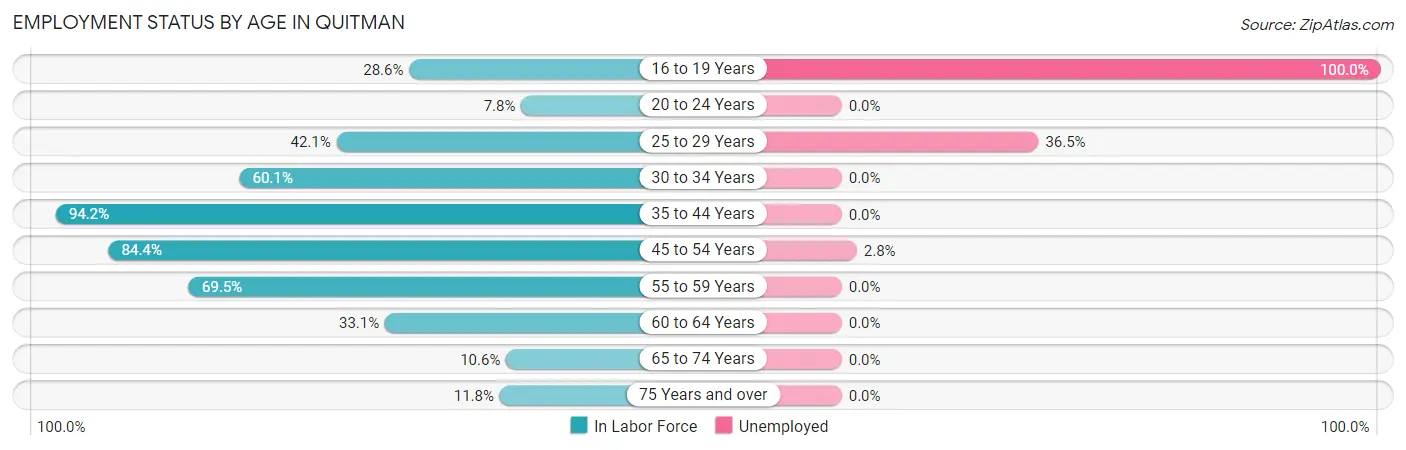
| Age Bracket | In Labor Force | Unemployed |
| 16 to 19 Years | 48 (28.6%) | 48 (100.0%) |
| 20 to 24 Years | 8 (7.8%) | 0 (0.0%) |
| 25 to 29 Years | 96 (42.1%) | 35 (36.5%) |
| 30 to 34 Years | 217 (60.1%) | 0 (0.0%) |
| 35 to 44 Years | 376 (94.2%) | 0 (0.0%) |
| 45 to 54 Years | 390 (84.4%) | 11 (2.8%) |
| 55 to 59 Years | 223 (69.5%) | 0 (0.0%) |
| 60 to 64 Years | 112 (33.1%) | 0 (0.0%) |
| 65 to 74 Years | 58 (10.6%) | 0 (0.0%) |
| 75 Years and over | 19 (11.8%) | 0 (0.0%) |
| Total | 1,547 (50.1%) | 94 (6.1%) |
Employment Status by Educational Attainment in Quitman
According to labor force statistics for Quitman, 67.0% of individuals (1,413) out of the total population between 25 and 64 years of age (2,109) are in the labor force, with 3.3% or 47 of them being unemployed. The group with the highest labor force participation rate are those with the educational attainment of bachelor's degree or higher, with 97.6% or 284 individuals in the labor force. Within the labor force, individuals with high school diploma education have the highest percentage of unemployment, with 6.3% or 35 of them being unemployed.
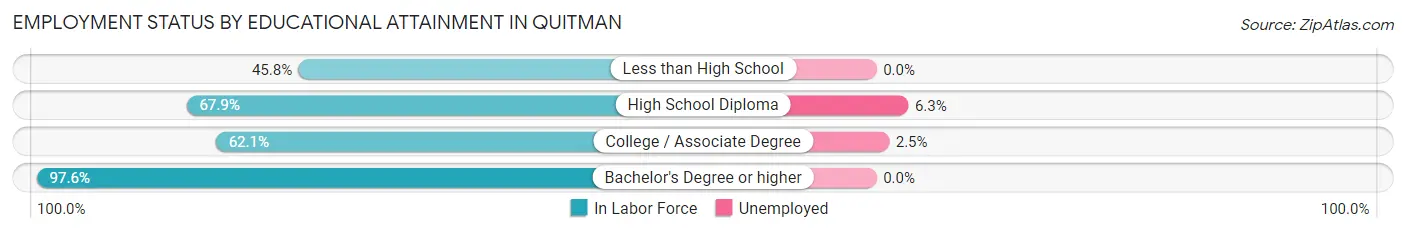
| Educational Attainment | In Labor Force | Unemployed |
| Less than High School | 132 (45.8%) | 0 (0.0%) |
| High School Diploma | 557 (67.9%) | 52 (6.3%) |
| College / Associate Degree | 441 (62.1%) | 18 (2.5%) |
| Bachelor's Degree or higher | 284 (97.6%) | 0 (0.0%) |
| Total | 1,413 (67.0%) | 70 (3.3%) |
Employment Occupations by Sex in Quitman
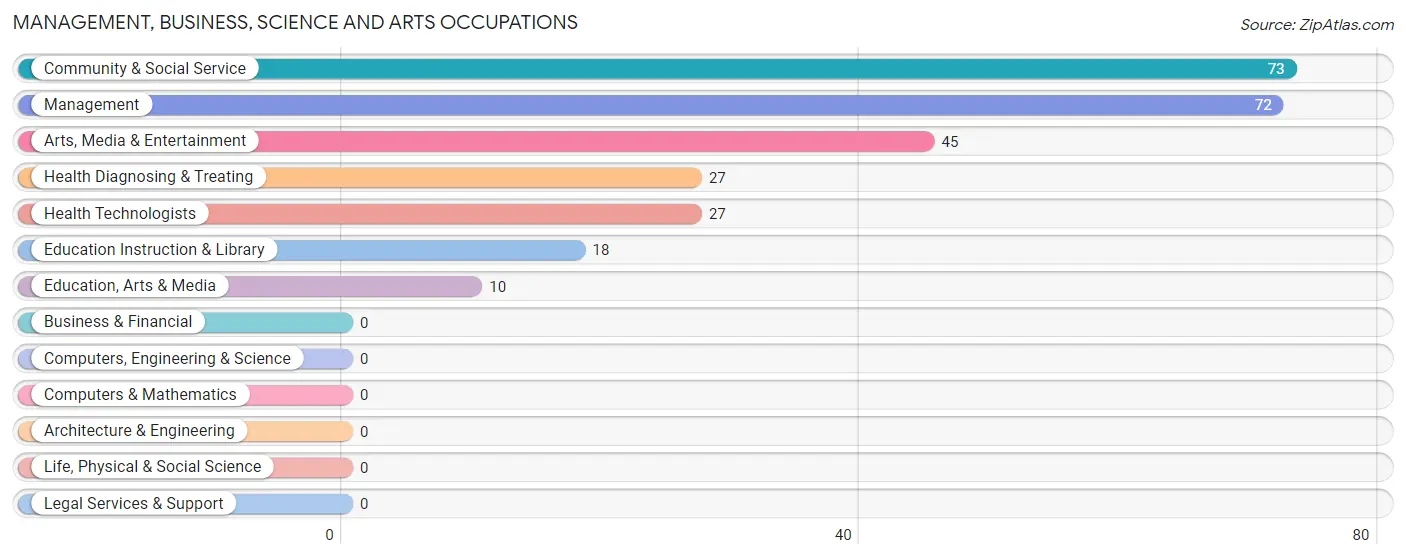
Management, Business, Science and Arts Occupations
The most common Management, Business, Science and Arts occupations in Quitman are Community & Social Service (73 | 5.0%), Management (72 | 5.0%), Arts, Media & Entertainment (45 | 3.1%), Health Diagnosing & Treating (27 | 1.9%), and Health Technologists (27 | 1.9%).
Management, Business, Science and Arts Occupations by Sex
Within the Management, Business, Science and Arts occupations in Quitman, the most male-oriented occupations are Education, Arts & Media (100.0%), Management (77.8%), and Community & Social Service (37.0%), while the most female-oriented occupations are Health Diagnosing & Treating (100.0%), Health Technologists (100.0%), and Arts, Media & Entertainment (75.6%).
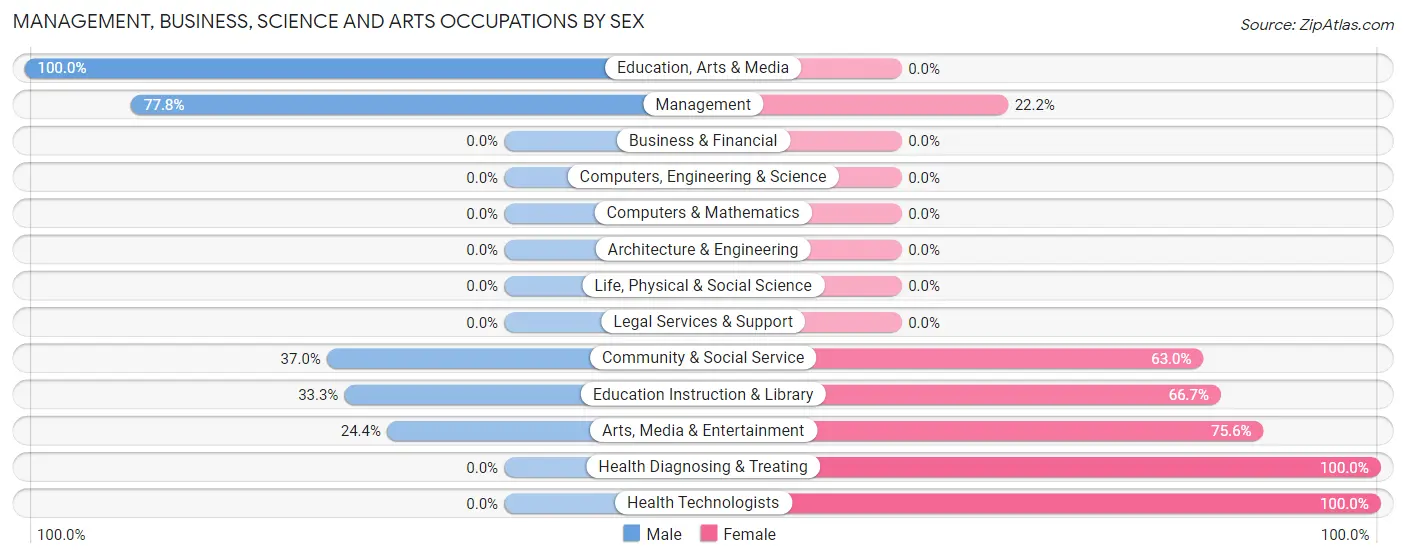
| Occupation | Male | Female |
| Management | 56 (77.8%) | 16 (22.2%) |
| Business & Financial | 0 (0.0%) | 0 (0.0%) |
| Computers, Engineering & Science | 0 (0.0%) | 0 (0.0%) |
| Computers & Mathematics | 0 (0.0%) | 0 (0.0%) |
| Architecture & Engineering | 0 (0.0%) | 0 (0.0%) |
| Life, Physical & Social Science | 0 (0.0%) | 0 (0.0%) |
| Community & Social Service | 27 (37.0%) | 46 (63.0%) |
| Education, Arts & Media | 10 (100.0%) | 0 (0.0%) |
| Legal Services & Support | 0 (0.0%) | 0 (0.0%) |
| Education Instruction & Library | 6 (33.3%) | 12 (66.7%) |
| Arts, Media & Entertainment | 11 (24.4%) | 34 (75.6%) |
| Health Diagnosing & Treating | 0 (0.0%) | 27 (100.0%) |
| Health Technologists | 0 (0.0%) | 27 (100.0%) |
| Total (Category) | 83 (48.3%) | 89 (51.7%) |
| Total (Overall) | 595 (40.9%) | 858 (59.1%) |
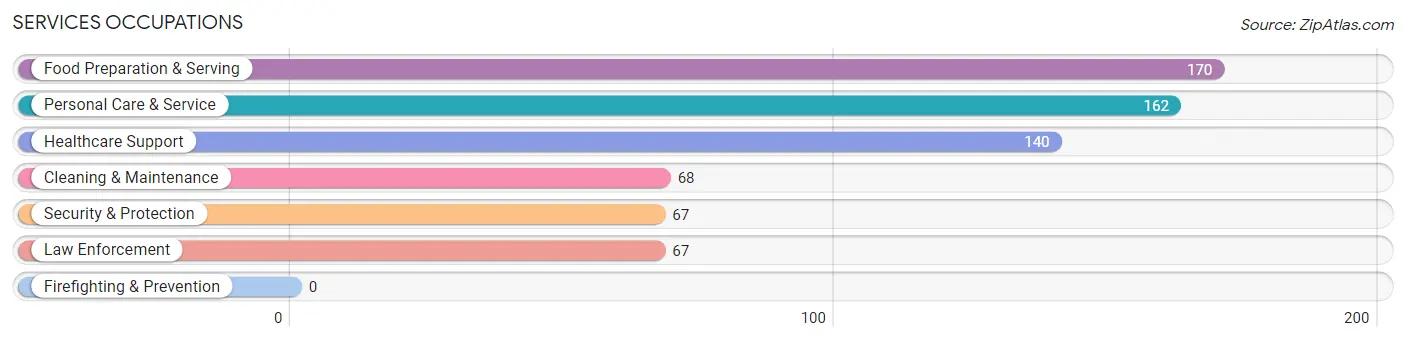
Services Occupations
The most common Services occupations in Quitman are Food Preparation & Serving (170 | 11.7%), Personal Care & Service (162 | 11.2%), Healthcare Support (140 | 9.6%), Cleaning & Maintenance (68 | 4.7%), and Security & Protection (67 | 4.6%).
Services Occupations by Sex
Within the Services occupations in Quitman, the most male-oriented occupations are Cleaning & Maintenance (100.0%), Personal Care & Service (100.0%), and Security & Protection (80.6%), while the most female-oriented occupations are Healthcare Support (100.0%), Food Preparation & Serving (72.4%), and Security & Protection (19.4%).
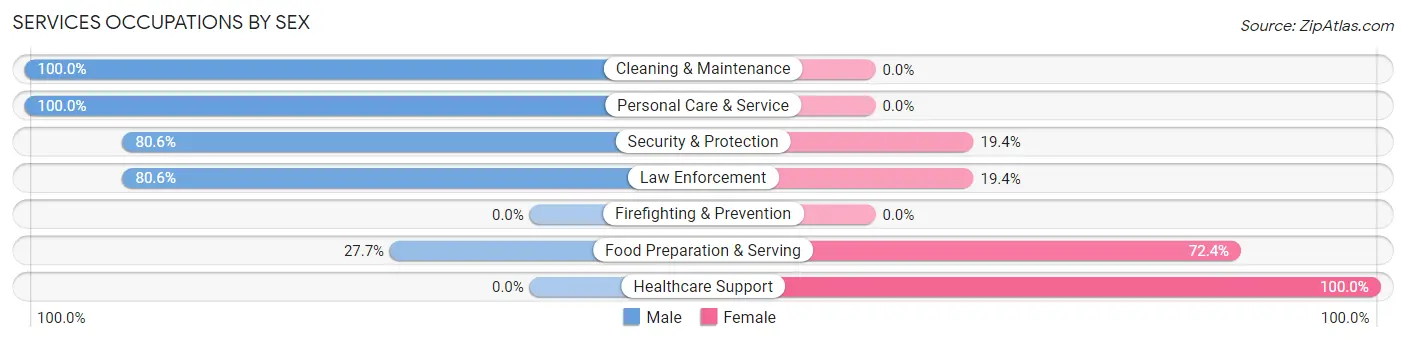
| Occupation | Male | Female |
| Healthcare Support | 0 (0.0%) | 140 (100.0%) |
| Security & Protection | 54 (80.6%) | 13 (19.4%) |
| Firefighting & Prevention | 0 (0.0%) | 0 (0.0%) |
| Law Enforcement | 54 (80.6%) | 13 (19.4%) |
| Food Preparation & Serving | 47 (27.7%) | 123 (72.4%) |
| Cleaning & Maintenance | 68 (100.0%) | 0 (0.0%) |
| Personal Care & Service | 162 (100.0%) | 0 (0.0%) |
| Total (Category) | 331 (54.5%) | 276 (45.5%) |
| Total (Overall) | 595 (40.9%) | 858 (59.1%) |
Sales and Office Occupations
The most common Sales and Office occupations in Quitman are Office & Administration (90 | 6.2%), and Sales & Related (54 | 3.7%).
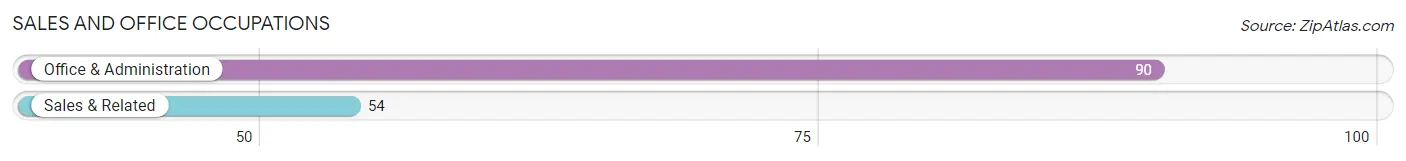
Sales and Office Occupations by Sex
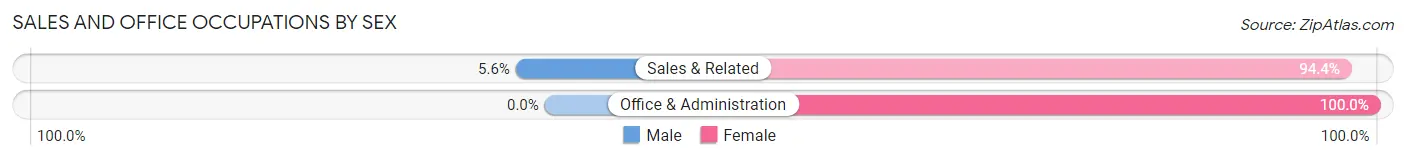
| Occupation | Male | Female |
| Sales & Related | 3 (5.6%) | 51 (94.4%) |
| Office & Administration | 0 (0.0%) | 90 (100.0%) |
| Total (Category) | 3 (2.1%) | 141 (97.9%) |
| Total (Overall) | 595 (40.9%) | 858 (59.1%) |
Natural Resources, Construction and Maintenance Occupations
The most common Natural Resources, Construction and Maintenance occupations in Quitman are Installation, Maintenance & Repair (111 | 7.6%), and Construction & Extraction (17 | 1.2%).
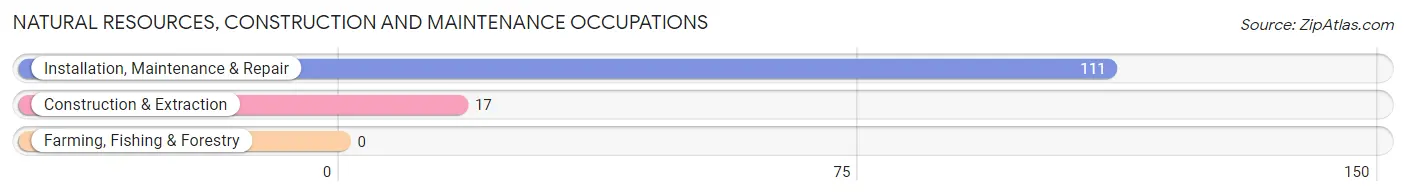
Natural Resources, Construction and Maintenance Occupations by Sex
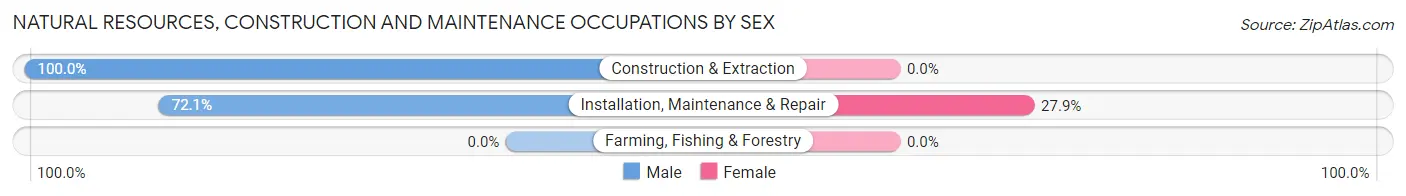
| Occupation | Male | Female |
| Farming, Fishing & Forestry | 0 (0.0%) | 0 (0.0%) |
| Construction & Extraction | 17 (100.0%) | 0 (0.0%) |
| Installation, Maintenance & Repair | 80 (72.1%) | 31 (27.9%) |
| Total (Category) | 97 (75.8%) | 31 (24.2%) |
| Total (Overall) | 595 (40.9%) | 858 (59.1%) |
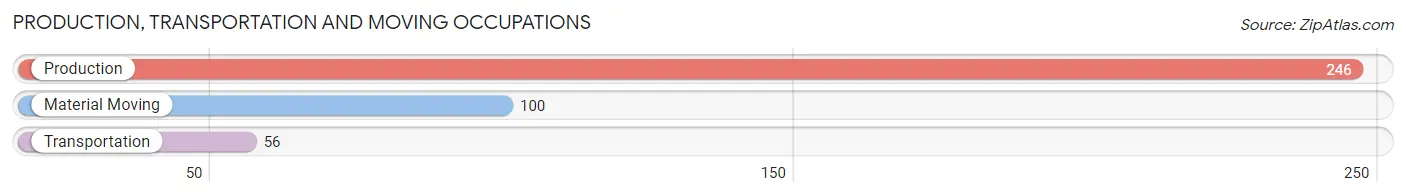
Production, Transportation and Moving Occupations
The most common Production, Transportation and Moving occupations in Quitman are Production (246 | 16.9%), Material Moving (100 | 6.9%), and Transportation (56 | 3.8%).
Production, Transportation and Moving Occupations by Sex
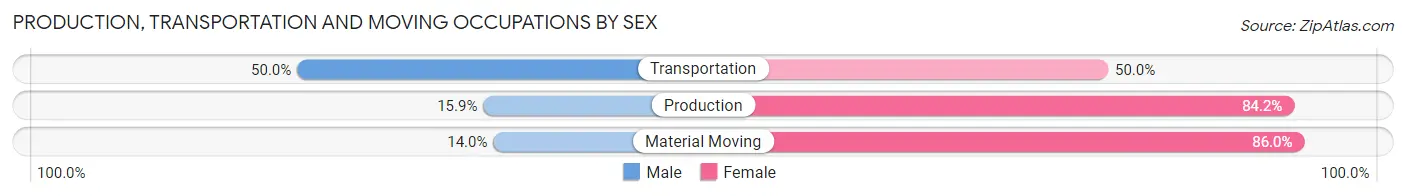
| Occupation | Male | Female |
| Production | 39 (15.9%) | 207 (84.2%) |
| Transportation | 28 (50.0%) | 28 (50.0%) |
| Material Moving | 14 (14.0%) | 86 (86.0%) |
| Total (Category) | 81 (20.2%) | 321 (79.8%) |
| Total (Overall) | 595 (40.9%) | 858 (59.1%) |
Employment Industries by Sex in Quitman
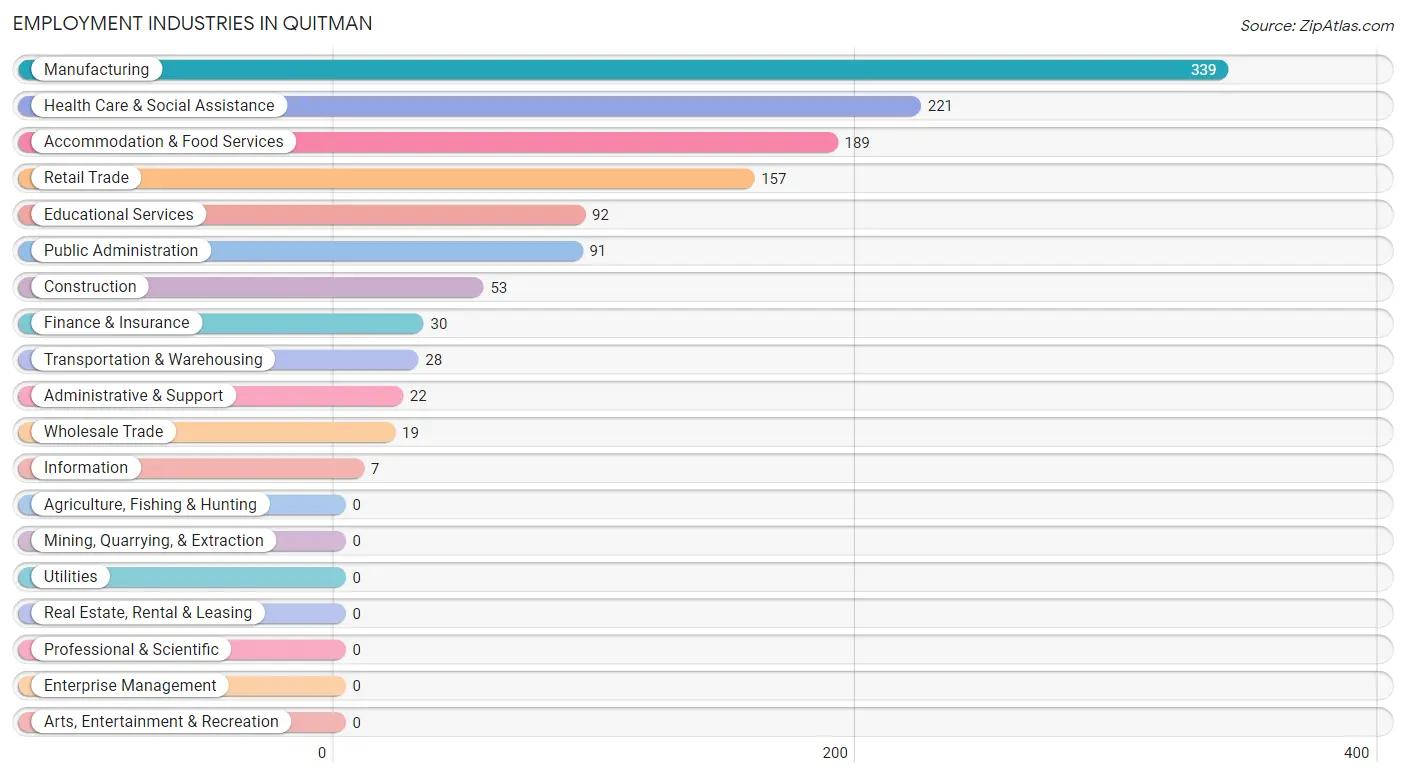
Employment Industries in Quitman
The major employment industries in Quitman include Manufacturing (339 | 23.3%), Health Care & Social Assistance (221 | 15.2%), Accommodation & Food Services (189 | 13.0%), Retail Trade (157 | 10.8%), and Educational Services (92 | 6.3%).
Employment Industries by Sex in Quitman
The Quitman industries that see more men than women are Construction (100.0%), Transportation & Warehousing (100.0%), and Public Administration (85.7%), whereas the industries that tend to have a higher number of women are Wholesale Trade (100.0%), Information (100.0%), and Finance & Insurance (100.0%).
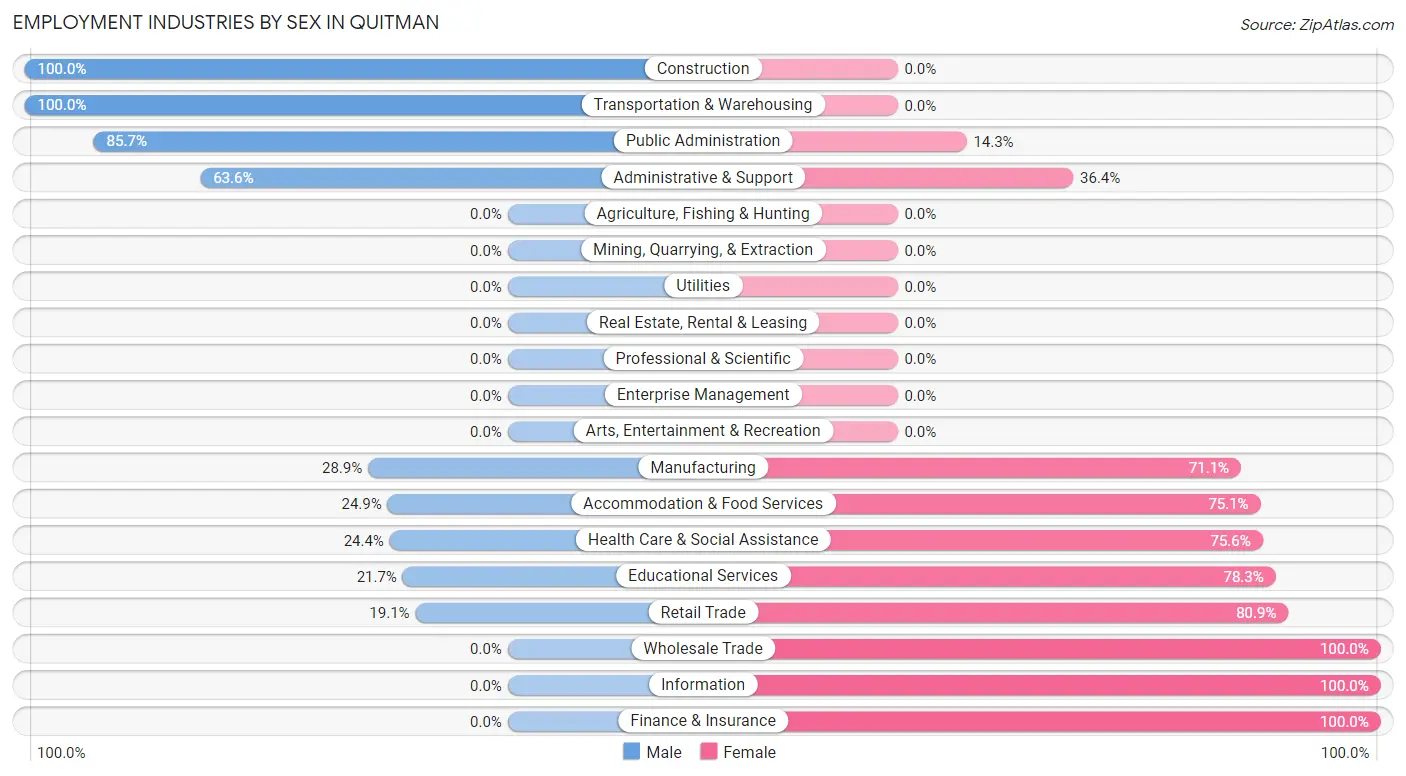
| Industry | Male | Female |
| Agriculture, Fishing & Hunting | 0 (0.0%) | 0 (0.0%) |
| Mining, Quarrying, & Extraction | 0 (0.0%) | 0 (0.0%) |
| Construction | 53 (100.0%) | 0 (0.0%) |
| Manufacturing | 98 (28.9%) | 241 (71.1%) |
| Wholesale Trade | 0 (0.0%) | 19 (100.0%) |
| Retail Trade | 30 (19.1%) | 127 (80.9%) |
| Transportation & Warehousing | 28 (100.0%) | 0 (0.0%) |
| Utilities | 0 (0.0%) | 0 (0.0%) |
| Information | 0 (0.0%) | 7 (100.0%) |
| Finance & Insurance | 0 (0.0%) | 30 (100.0%) |
| Real Estate, Rental & Leasing | 0 (0.0%) | 0 (0.0%) |
| Professional & Scientific | 0 (0.0%) | 0 (0.0%) |
| Enterprise Management | 0 (0.0%) | 0 (0.0%) |
| Administrative & Support | 14 (63.6%) | 8 (36.4%) |
| Educational Services | 20 (21.7%) | 72 (78.3%) |
| Health Care & Social Assistance | 54 (24.4%) | 167 (75.6%) |
| Arts, Entertainment & Recreation | 0 (0.0%) | 0 (0.0%) |
| Accommodation & Food Services | 47 (24.9%) | 142 (75.1%) |
| Public Administration | 78 (85.7%) | 13 (14.3%) |
| Total | 595 (40.9%) | 858 (59.1%) |
Education in Quitman
School Enrollment in Quitman
The most common levels of schooling among the 765 students in Quitman are middle school (264 | 34.5%), elementary school (231 | 30.2%), and high school (144 | 18.8%).
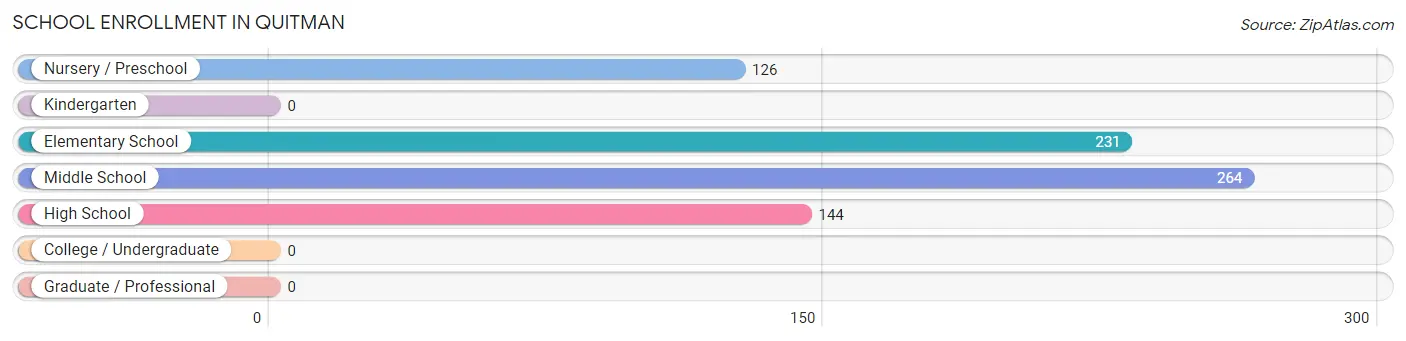
| School Level | # Students | % Students |
| Nursery / Preschool | 126 | 16.5% |
| Kindergarten | 0 | 0.0% |
| Elementary School | 231 | 30.2% |
| Middle School | 264 | 34.5% |
| High School | 144 | 18.8% |
| College / Undergraduate | 0 | 0.0% |
| Graduate / Professional | 0 | 0.0% |
| Total | 765 | 100.0% |
School Enrollment by Age by Funding Source in Quitman
Out of a total of 765 students who are enrolled in schools in Quitman, 8 (1.0%) attend a private institution, while the remaining 757 (99.0%) are enrolled in public schools. The age group of 3 to 4 year olds has the highest likelihood of being enrolled in private schools, with 8 (6.4% in the age bracket) enrolled. Conversely, the age group of 5 to 9 year old has the lowest likelihood of being enrolled in a private school, with 246 (100.0% in the age bracket) attending a public institution.
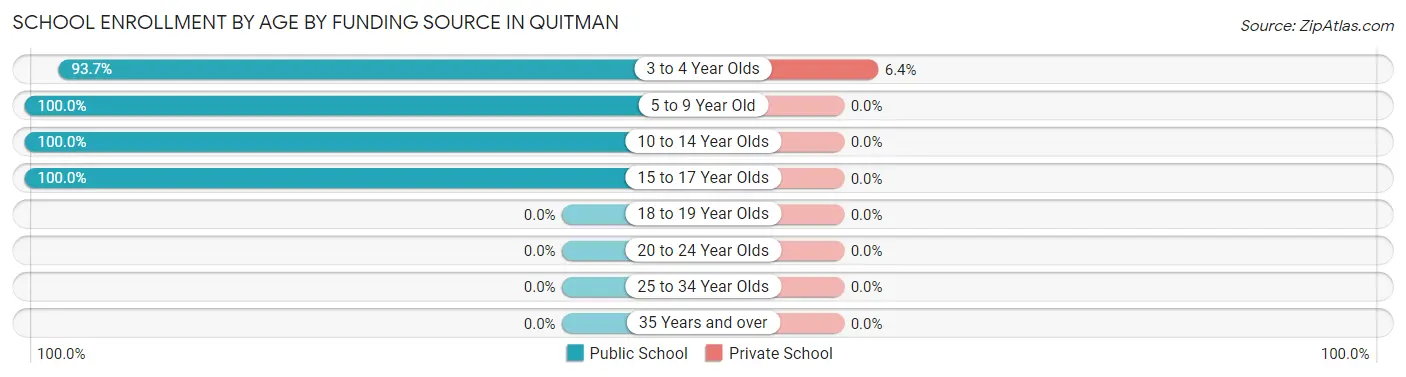
| Age Bracket | Public School | Private School |
| 3 to 4 Year Olds | 118 (93.6%) | 8 (6.4%) |
| 5 to 9 Year Old | 246 (100.0%) | 0 (0.0%) |
| 10 to 14 Year Olds | 341 (100.0%) | 0 (0.0%) |
| 15 to 17 Year Olds | 52 (100.0%) | 0 (0.0%) |
| 18 to 19 Year Olds | 0 (0.0%) | 0 (0.0%) |
| 20 to 24 Year Olds | 0 (0.0%) | 0 (0.0%) |
| 25 to 34 Year Olds | 0 (0.0%) | 0 (0.0%) |
| 35 Years and over | 0 (0.0%) | 0 (0.0%) |
| Total | 757 (99.0%) | 8 (1.0%) |
Educational Attainment by Field of Study in Quitman
Science & technology (92 | 25.8%), social sciences (85 | 23.9%), psychology (64 | 18.0%), education (50 | 14.0%), and liberal arts & history (16 | 4.5%) are the most common fields of study among 356 individuals in Quitman who have obtained a bachelor's degree or higher.
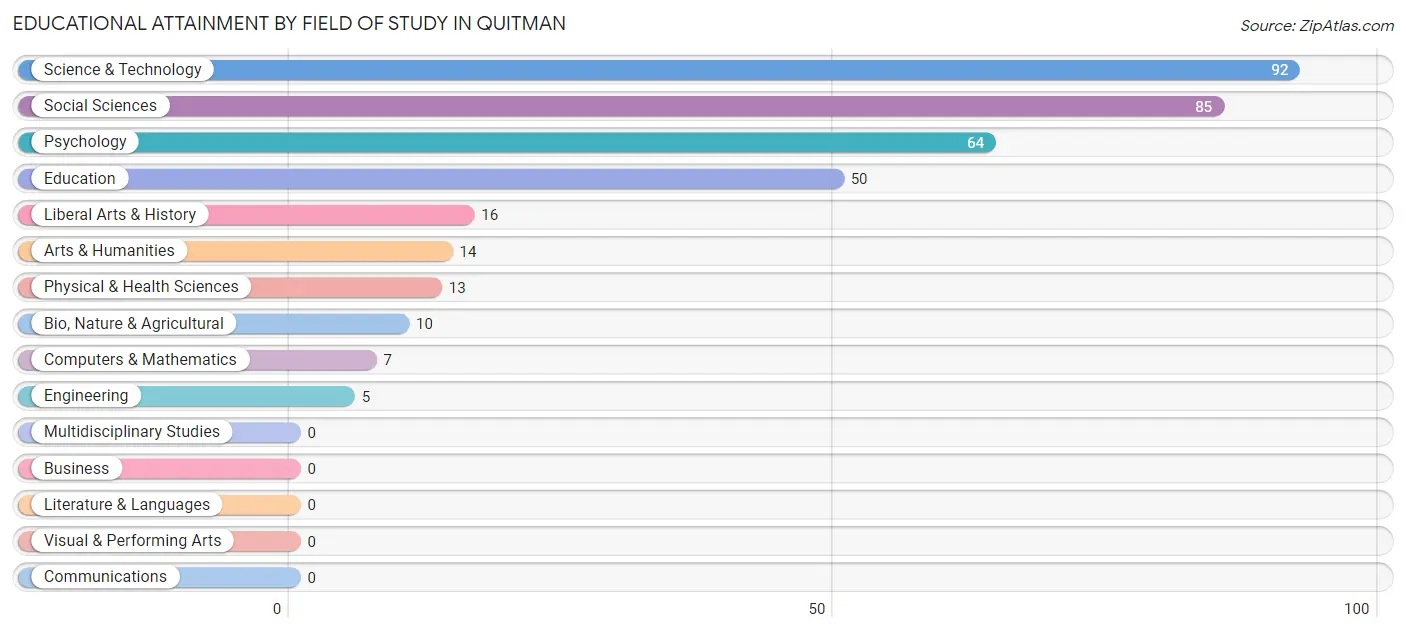
| Field of Study | # Graduates | % Graduates |
| Computers & Mathematics | 7 | 2.0% |
| Bio, Nature & Agricultural | 10 | 2.8% |
| Physical & Health Sciences | 13 | 3.6% |
| Psychology | 64 | 18.0% |
| Social Sciences | 85 | 23.9% |
| Engineering | 5 | 1.4% |
| Multidisciplinary Studies | 0 | 0.0% |
| Science & Technology | 92 | 25.8% |
| Business | 0 | 0.0% |
| Education | 50 | 14.0% |
| Literature & Languages | 0 | 0.0% |
| Liberal Arts & History | 16 | 4.5% |
| Visual & Performing Arts | 0 | 0.0% |
| Communications | 0 | 0.0% |
| Arts & Humanities | 14 | 3.9% |
| Total | 356 | 100.0% |
Transportation & Commute in Quitman
Vehicle Availability by Sex in Quitman
The most prevalent vehicle ownership categories in Quitman are males with 2 vehicles (229, accounting for 38.5%) and females with 2 vehicles (259, making up 29.4%).
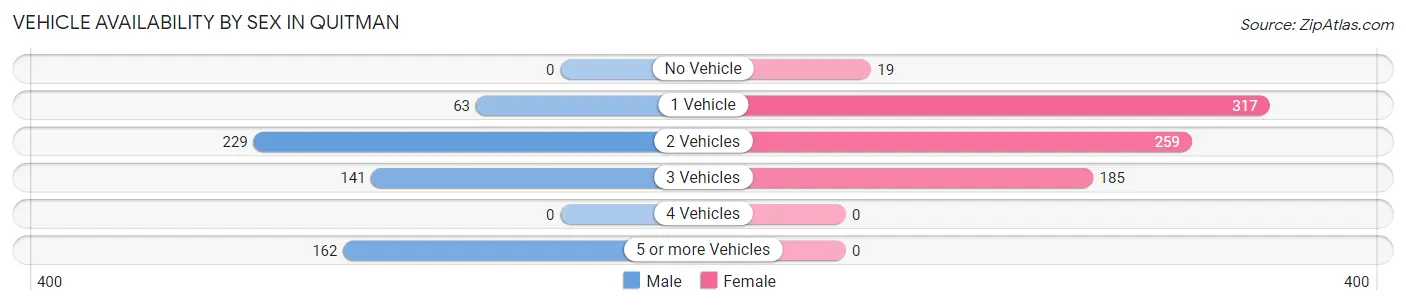
| Vehicles Available | Male | Female |
| No Vehicle | 0 (0.0%) | 19 (2.4%) |
| 1 Vehicle | 63 (10.6%) | 317 (40.6%) |
| 2 Vehicles | 229 (38.5%) | 259 (33.2%) |
| 3 Vehicles | 141 (23.7%) | 185 (23.7%) |
| 4 Vehicles | 0 (0.0%) | 0 (0.0%) |
| 5 or more Vehicles | 162 (27.2%) | 0 (0.0%) |
| Total | 595 (100.0%) | 780 (100.0%) |
Commute Time in Quitman
The most frequently occuring commute durations in Quitman are 30 to 34 minutes (297 commuters, 22.4%), 5 to 9 minutes (293 commuters, 22.1%), and less than 5 minutes (216 commuters, 16.3%).
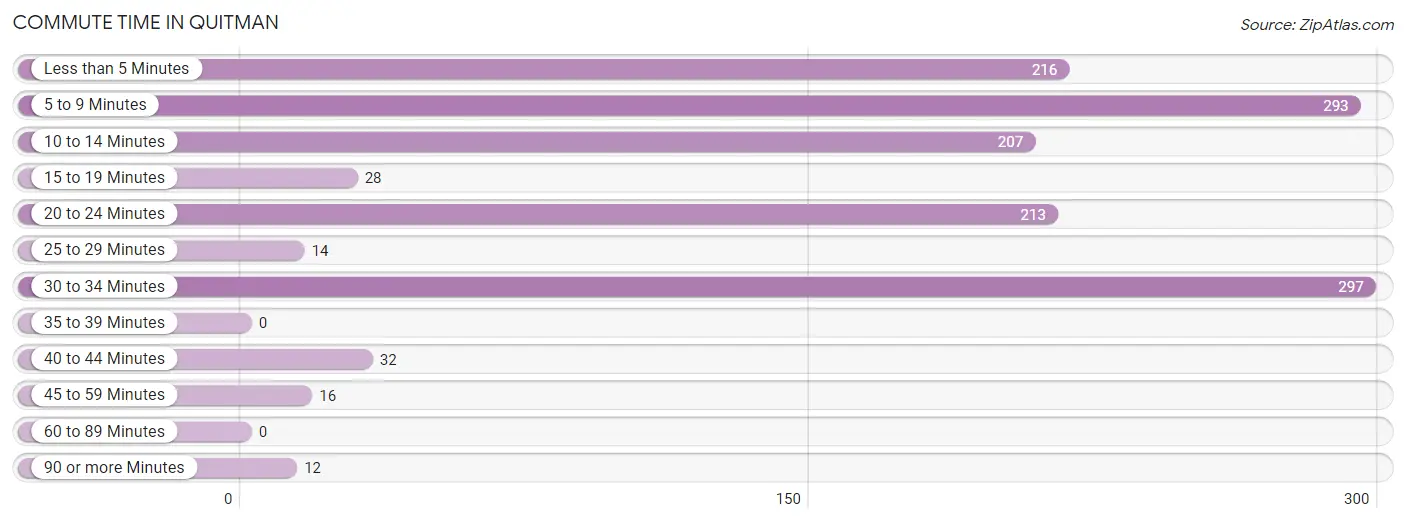
| Commute Time | # Commuters | % Commuters |
| Less than 5 Minutes | 216 | 16.3% |
| 5 to 9 Minutes | 293 | 22.1% |
| 10 to 14 Minutes | 207 | 15.6% |
| 15 to 19 Minutes | 28 | 2.1% |
| 20 to 24 Minutes | 213 | 16.0% |
| 25 to 29 Minutes | 14 | 1.1% |
| 30 to 34 Minutes | 297 | 22.4% |
| 35 to 39 Minutes | 0 | 0.0% |
| 40 to 44 Minutes | 32 | 2.4% |
| 45 to 59 Minutes | 16 | 1.2% |
| 60 to 89 Minutes | 0 | 0.0% |
| 90 or more Minutes | 12 | 0.9% |
Commute Time by Sex in Quitman
The most common commute times in Quitman are less than 5 minutes (216 commuters, 39.4%) for males and 5 to 9 minutes (231 commuters, 29.6%) for females.
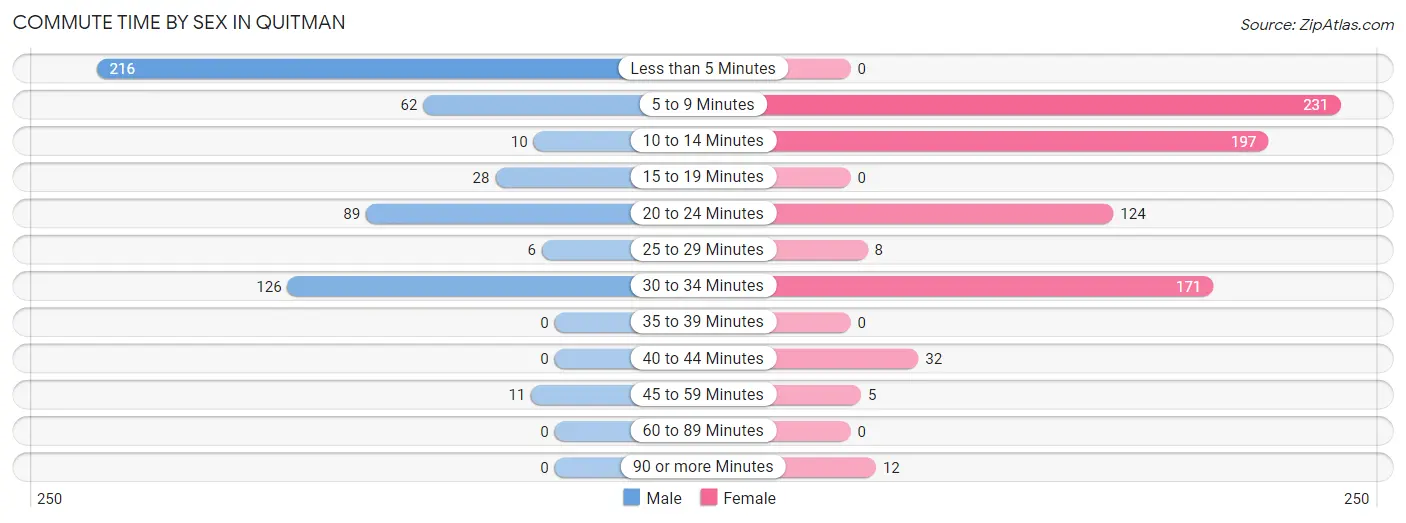
| Commute Time | Male | Female |
| Less than 5 Minutes | 216 (39.4%) | 0 (0.0%) |
| 5 to 9 Minutes | 62 (11.3%) | 231 (29.6%) |
| 10 to 14 Minutes | 10 (1.8%) | 197 (25.3%) |
| 15 to 19 Minutes | 28 (5.1%) | 0 (0.0%) |
| 20 to 24 Minutes | 89 (16.2%) | 124 (15.9%) |
| 25 to 29 Minutes | 6 (1.1%) | 8 (1.0%) |
| 30 to 34 Minutes | 126 (23.0%) | 171 (21.9%) |
| 35 to 39 Minutes | 0 (0.0%) | 0 (0.0%) |
| 40 to 44 Minutes | 0 (0.0%) | 32 (4.1%) |
| 45 to 59 Minutes | 11 (2.0%) | 5 (0.6%) |
| 60 to 89 Minutes | 0 (0.0%) | 0 (0.0%) |
| 90 or more Minutes | 0 (0.0%) | 12 (1.5%) |
Time of Departure to Work by Sex in Quitman
The most frequent times of departure to work in Quitman are 9:00 AM to 9:59 AM (170, 31.0%) for males and 7:00 AM to 7:29 AM (185, 23.7%) for females.
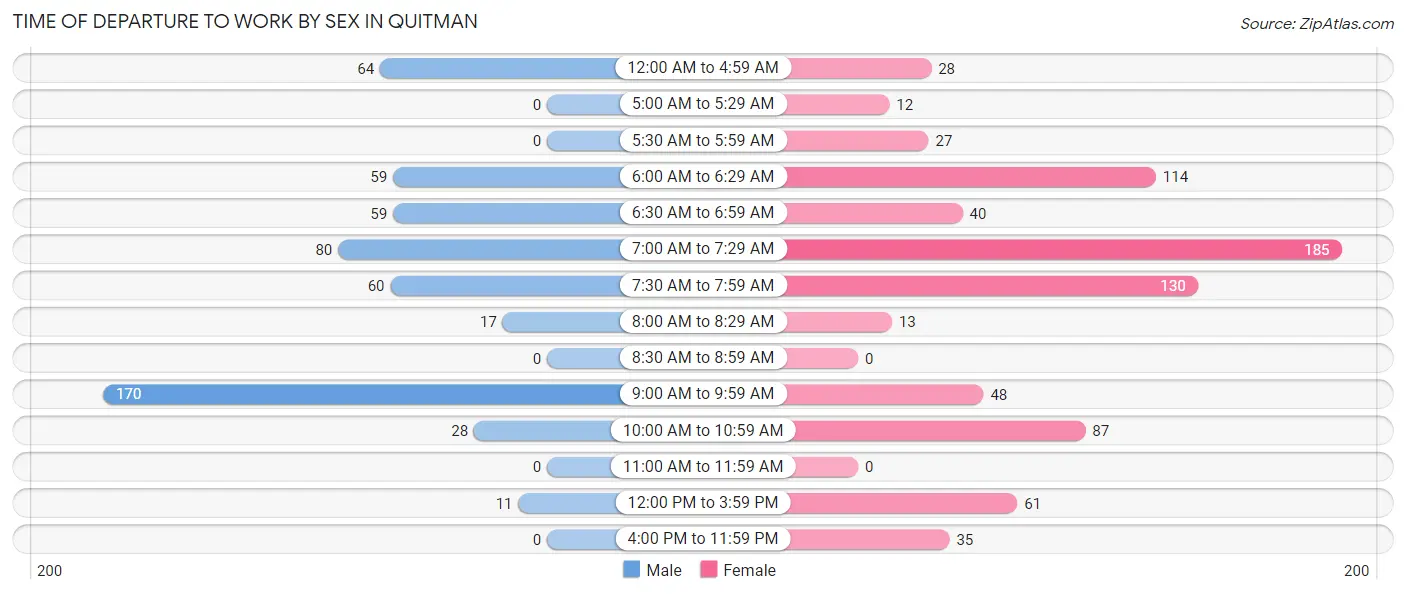
| Time of Departure | Male | Female |
| 12:00 AM to 4:59 AM | 64 (11.7%) | 28 (3.6%) |
| 5:00 AM to 5:29 AM | 0 (0.0%) | 12 (1.5%) |
| 5:30 AM to 5:59 AM | 0 (0.0%) | 27 (3.5%) |
| 6:00 AM to 6:29 AM | 59 (10.8%) | 114 (14.6%) |
| 6:30 AM to 6:59 AM | 59 (10.8%) | 40 (5.1%) |
| 7:00 AM to 7:29 AM | 80 (14.6%) | 185 (23.7%) |
| 7:30 AM to 7:59 AM | 60 (11.0%) | 130 (16.7%) |
| 8:00 AM to 8:29 AM | 17 (3.1%) | 13 (1.7%) |
| 8:30 AM to 8:59 AM | 0 (0.0%) | 0 (0.0%) |
| 9:00 AM to 9:59 AM | 170 (31.0%) | 48 (6.1%) |
| 10:00 AM to 10:59 AM | 28 (5.1%) | 87 (11.2%) |
| 11:00 AM to 11:59 AM | 0 (0.0%) | 0 (0.0%) |
| 12:00 PM to 3:59 PM | 11 (2.0%) | 61 (7.8%) |
| 4:00 PM to 11:59 PM | 0 (0.0%) | 35 (4.5%) |
| Total | 548 (100.0%) | 780 (100.0%) |
Housing Occupancy in Quitman
Occupancy by Ownership in Quitman
Of the total 1,504 dwellings in Quitman, owner-occupied units account for 733 (48.7%), while renter-occupied units make up 771 (51.3%).
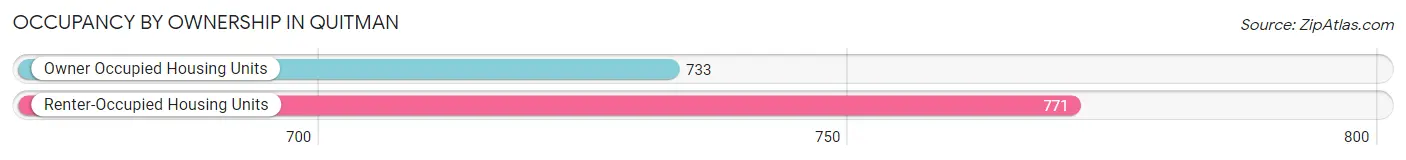
| Occupancy | # Housing Units | % Housing Units |
| Owner Occupied Housing Units | 733 | 48.7% |
| Renter-Occupied Housing Units | 771 | 51.3% |
| Total Occupied Housing Units | 1,504 | 100.0% |
Occupancy by Household Size in Quitman
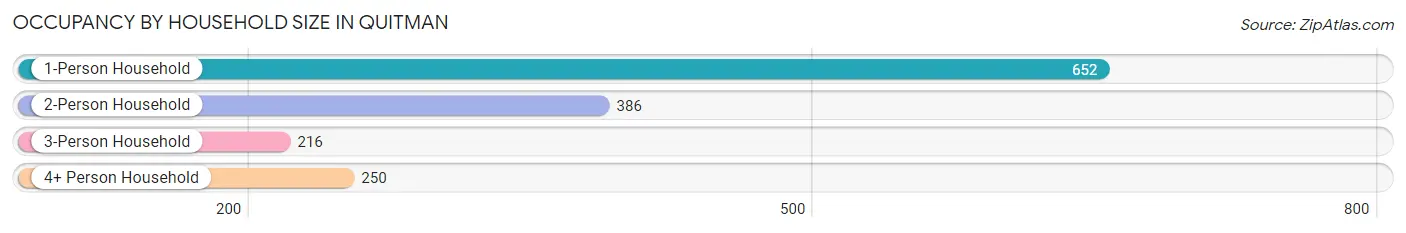
| Household Size | # Housing Units | % Housing Units |
| 1-Person Household | 652 | 43.3% |
| 2-Person Household | 386 | 25.7% |
| 3-Person Household | 216 | 14.4% |
| 4+ Person Household | 250 | 16.6% |
| Total Housing Units | 1,504 | 100.0% |
Occupancy by Ownership by Household Size in Quitman
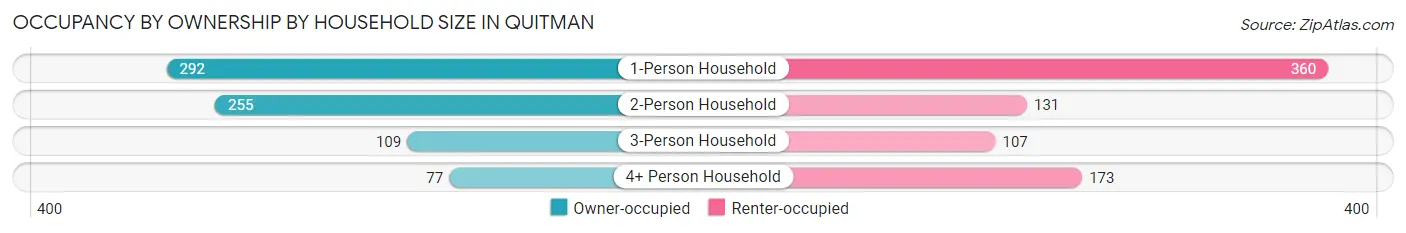
| Household Size | Owner-occupied | Renter-occupied |
| 1-Person Household | 292 (44.8%) | 360 (55.2%) |
| 2-Person Household | 255 (66.1%) | 131 (33.9%) |
| 3-Person Household | 109 (50.5%) | 107 (49.5%) |
| 4+ Person Household | 77 (30.8%) | 173 (69.2%) |
| Total Housing Units | 733 (48.7%) | 771 (51.3%) |
Occupancy by Educational Attainment in Quitman
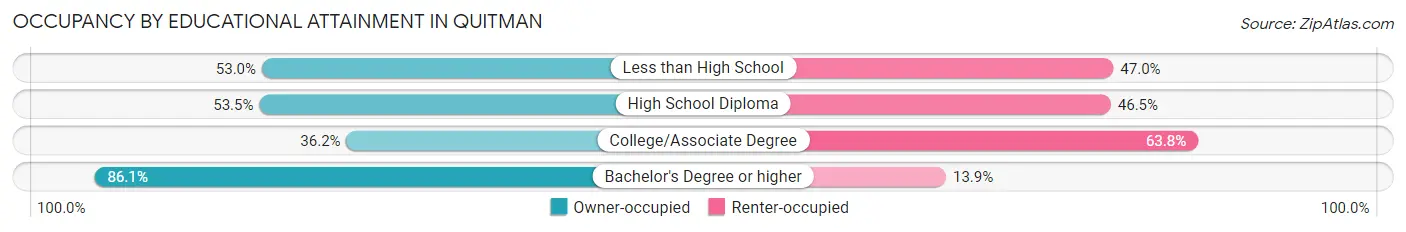
| Household Size | Owner-occupied | Renter-occupied |
| Less than High School | 161 (53.0%) | 143 (47.0%) |
| High School Diploma | 270 (53.5%) | 235 (46.5%) |
| College/Associate Degree | 215 (36.2%) | 379 (63.8%) |
| Bachelor's Degree or higher | 87 (86.1%) | 14 (13.9%) |
Occupancy by Age of Householder in Quitman
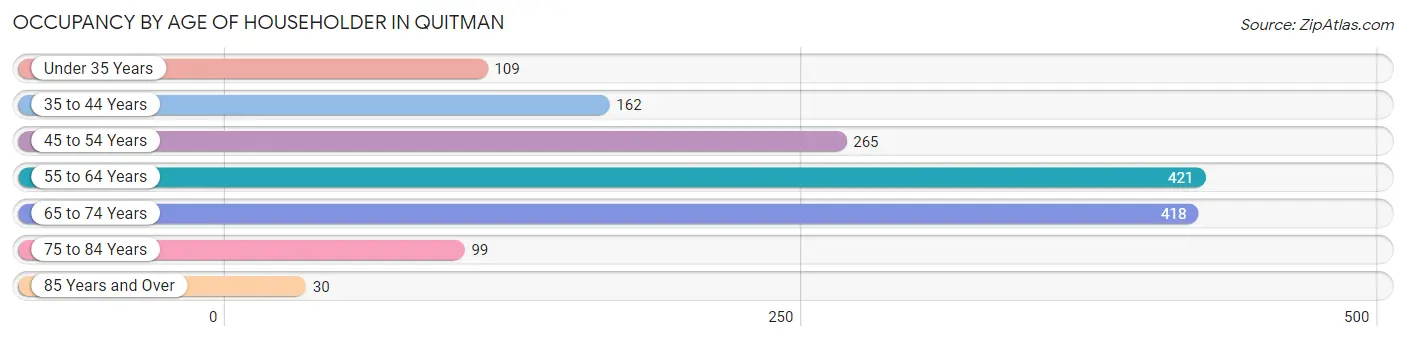
| Age Bracket | # Households | % Households |
| Under 35 Years | 109 | 7.2% |
| 35 to 44 Years | 162 | 10.8% |
| 45 to 54 Years | 265 | 17.6% |
| 55 to 64 Years | 421 | 28.0% |
| 65 to 74 Years | 418 | 27.8% |
| 75 to 84 Years | 99 | 6.6% |
| 85 Years and Over | 30 | 2.0% |
| Total | 1,504 | 100.0% |
Housing Finances in Quitman
Median Income by Occupancy in Quitman
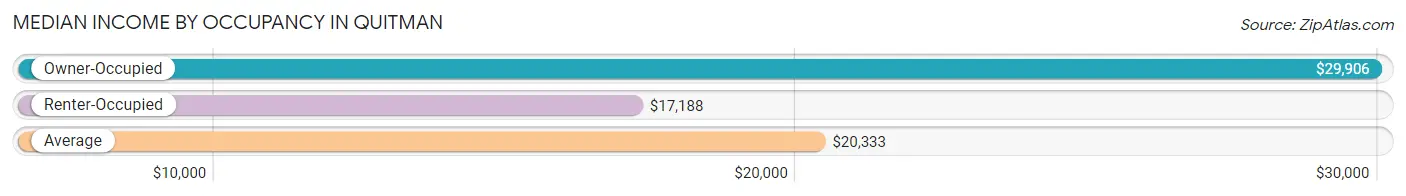
| Occupancy Type | # Households | Median Income |
| Owner-Occupied | 733 (48.7%) | $29,906 |
| Renter-Occupied | 771 (51.3%) | $17,188 |
| Average | 1,504 (100.0%) | $20,333 |
Occupancy by Householder Income Bracket in Quitman
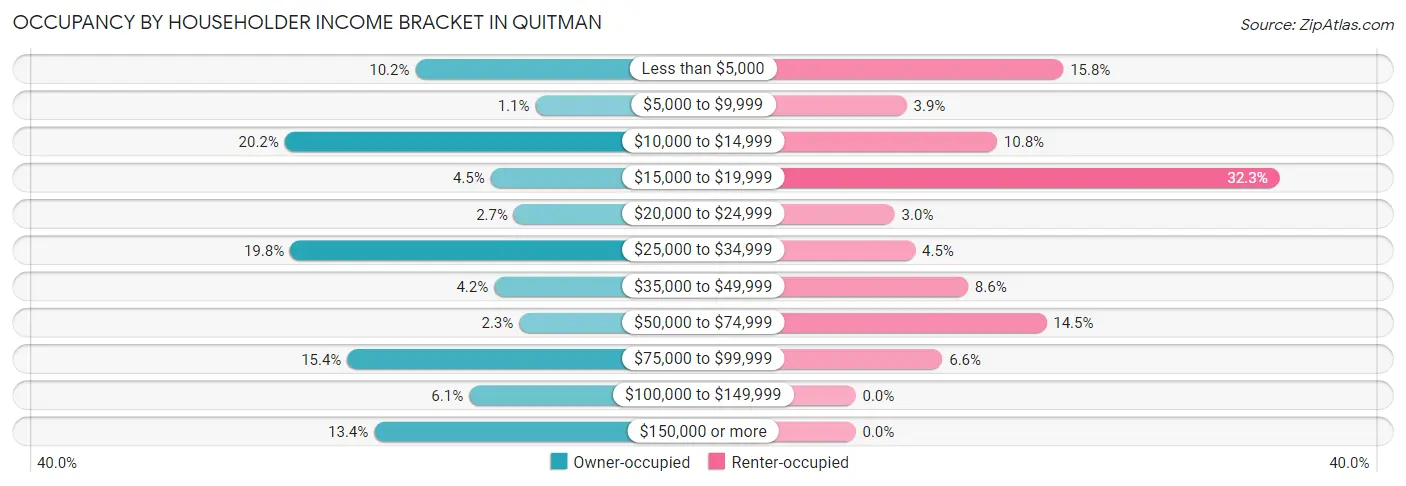
| Income Bracket | Owner-occupied | Renter-occupied |
| Less than $5,000 | 75 (10.2%) | 122 (15.8%) |
| $5,000 to $9,999 | 8 (1.1%) | 30 (3.9%) |
| $10,000 to $14,999 | 148 (20.2%) | 83 (10.8%) |
| $15,000 to $19,999 | 33 (4.5%) | 249 (32.3%) |
| $20,000 to $24,999 | 20 (2.7%) | 23 (3.0%) |
| $25,000 to $34,999 | 145 (19.8%) | 35 (4.5%) |
| $35,000 to $49,999 | 31 (4.2%) | 66 (8.6%) |
| $50,000 to $74,999 | 17 (2.3%) | 112 (14.5%) |
| $75,000 to $99,999 | 113 (15.4%) | 51 (6.6%) |
| $100,000 to $149,999 | 45 (6.1%) | 0 (0.0%) |
| $150,000 or more | 98 (13.4%) | 0 (0.0%) |
| Total | 733 (100.0%) | 771 (100.0%) |
Monthly Housing Cost Tiers in Quitman
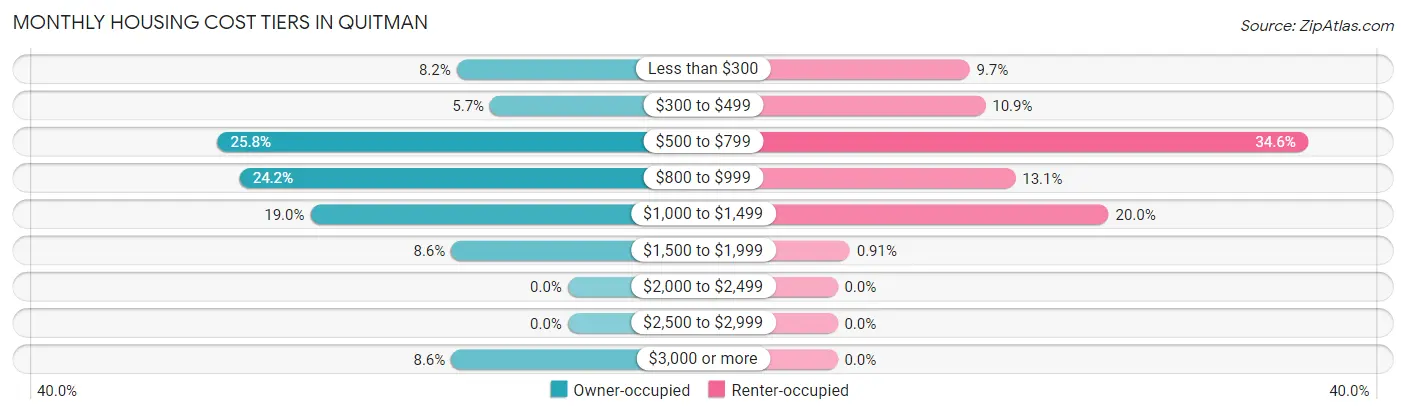
| Monthly Cost | Owner-occupied | Renter-occupied |
| Less than $300 | 60 (8.2%) | 75 (9.7%) |
| $300 to $499 | 42 (5.7%) | 84 (10.9%) |
| $500 to $799 | 189 (25.8%) | 267 (34.6%) |
| $800 to $999 | 177 (24.1%) | 101 (13.1%) |
| $1,000 to $1,499 | 139 (19.0%) | 154 (20.0%) |
| $1,500 to $1,999 | 63 (8.6%) | 7 (0.9%) |
| $2,000 to $2,499 | 0 (0.0%) | 0 (0.0%) |
| $2,500 to $2,999 | 0 (0.0%) | 0 (0.0%) |
| $3,000 or more | 63 (8.6%) | 0 (0.0%) |
| Total | 733 (100.0%) | 771 (100.0%) |
Physical Housing Characteristics in Quitman
Housing Structures in Quitman
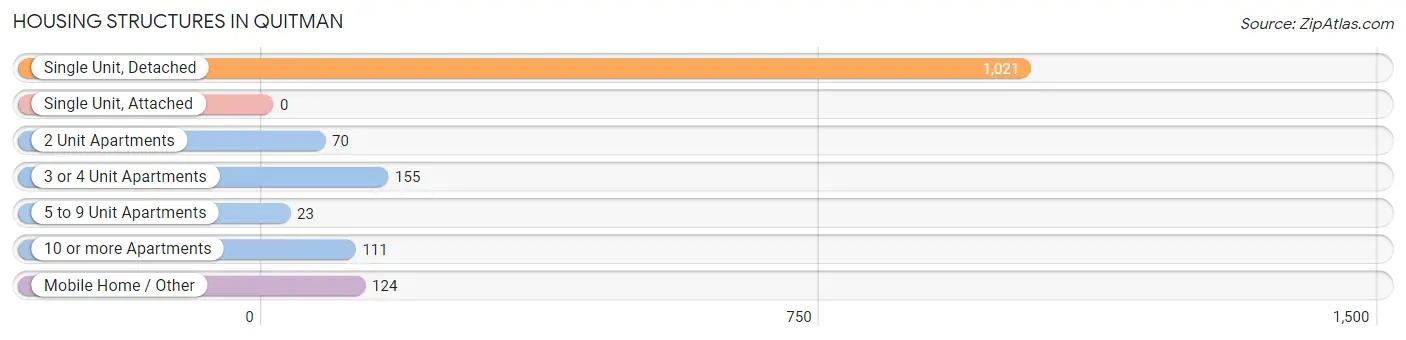
| Structure Type | # Housing Units | % Housing Units |
| Single Unit, Detached | 1,021 | 67.9% |
| Single Unit, Attached | 0 | 0.0% |
| 2 Unit Apartments | 70 | 4.6% |
| 3 or 4 Unit Apartments | 155 | 10.3% |
| 5 to 9 Unit Apartments | 23 | 1.5% |
| 10 or more Apartments | 111 | 7.4% |
| Mobile Home / Other | 124 | 8.2% |
| Total | 1,504 | 100.0% |
Housing Structures by Occupancy in Quitman
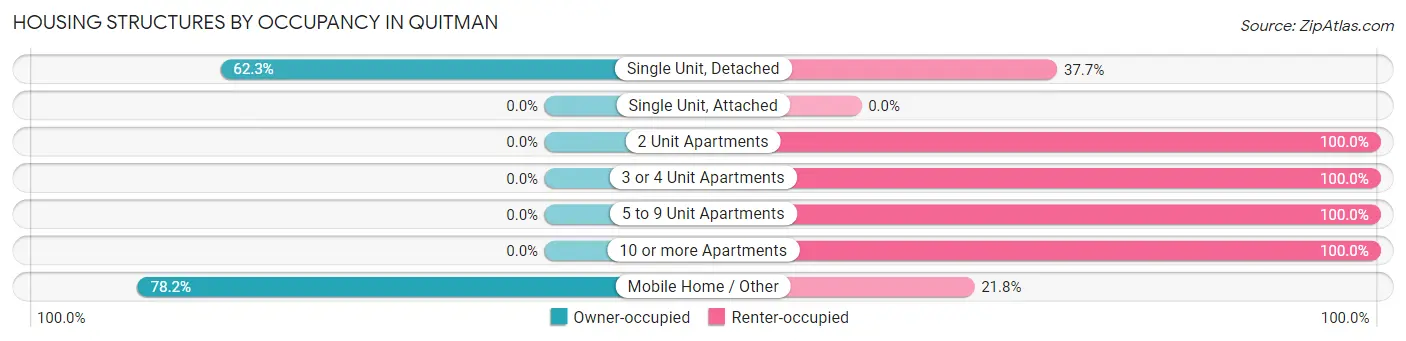
| Structure Type | Owner-occupied | Renter-occupied |
| Single Unit, Detached | 636 (62.3%) | 385 (37.7%) |
| Single Unit, Attached | 0 (0.0%) | 0 (0.0%) |
| 2 Unit Apartments | 0 (0.0%) | 70 (100.0%) |
| 3 or 4 Unit Apartments | 0 (0.0%) | 155 (100.0%) |
| 5 to 9 Unit Apartments | 0 (0.0%) | 23 (100.0%) |
| 10 or more Apartments | 0 (0.0%) | 111 (100.0%) |
| Mobile Home / Other | 97 (78.2%) | 27 (21.8%) |
| Total | 733 (48.7%) | 771 (51.3%) |
Housing Structures by Number of Rooms in Quitman
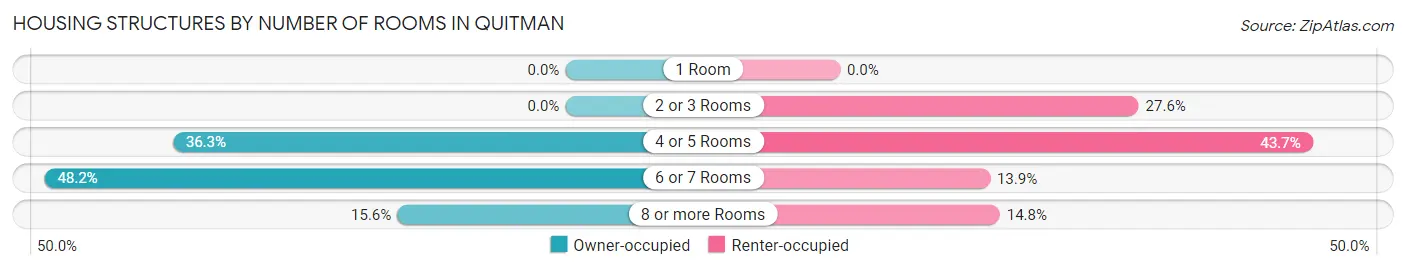
| Number of Rooms | Owner-occupied | Renter-occupied |
| 1 Room | 0 (0.0%) | 0 (0.0%) |
| 2 or 3 Rooms | 0 (0.0%) | 213 (27.6%) |
| 4 or 5 Rooms | 266 (36.3%) | 337 (43.7%) |
| 6 or 7 Rooms | 353 (48.2%) | 107 (13.9%) |
| 8 or more Rooms | 114 (15.5%) | 114 (14.8%) |
| Total | 733 (100.0%) | 771 (100.0%) |
Housing Structure by Heating Type in Quitman
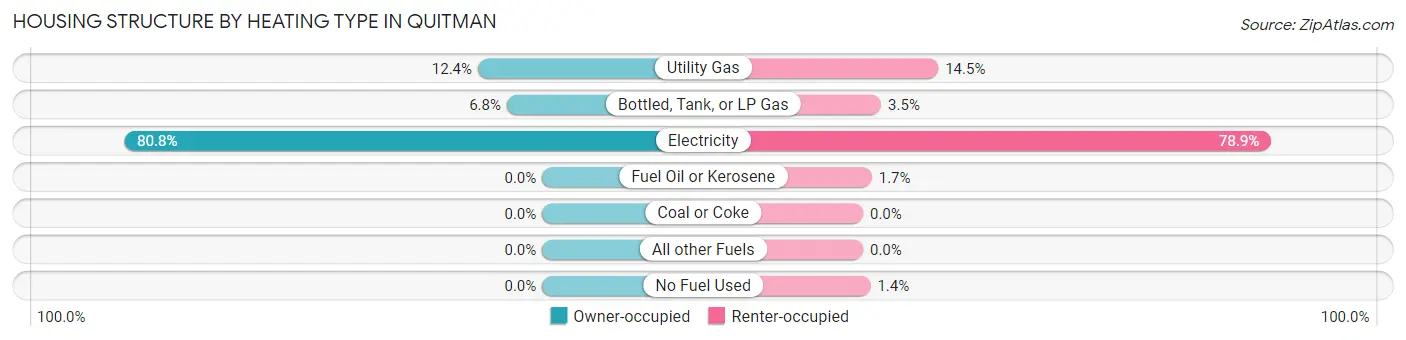
| Heating Type | Owner-occupied | Renter-occupied |
| Utility Gas | 91 (12.4%) | 112 (14.5%) |
| Bottled, Tank, or LP Gas | 50 (6.8%) | 27 (3.5%) |
| Electricity | 592 (80.8%) | 608 (78.9%) |
| Fuel Oil or Kerosene | 0 (0.0%) | 13 (1.7%) |
| Coal or Coke | 0 (0.0%) | 0 (0.0%) |
| All other Fuels | 0 (0.0%) | 0 (0.0%) |
| No Fuel Used | 0 (0.0%) | 11 (1.4%) |
| Total | 733 (100.0%) | 771 (100.0%) |
Household Vehicle Usage in Quitman
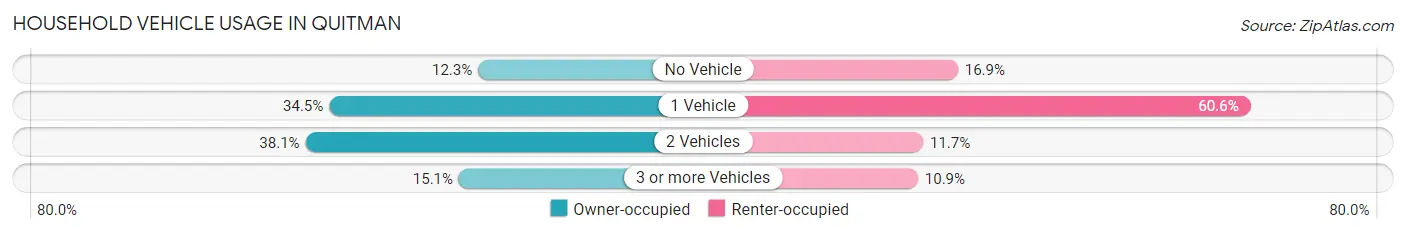
| Vehicles per Household | Owner-occupied | Renter-occupied |
| No Vehicle | 90 (12.3%) | 130 (16.9%) |
| 1 Vehicle | 253 (34.5%) | 467 (60.6%) |
| 2 Vehicles | 279 (38.1%) | 90 (11.7%) |
| 3 or more Vehicles | 111 (15.1%) | 84 (10.9%) |
| Total | 733 (100.0%) | 771 (100.0%) |
Real Estate & Mortgages in Quitman
Real Estate and Mortgage Overview in Quitman
| Characteristic | Without Mortgage | With Mortgage |
| Housing Units | 297 | 436 |
| Median Property Value | $140,800 | $133,800 |
| Median Household Income | $26,733 | $56 |
| Monthly Housing Costs | $593 | $63 |
| Real Estate Taxes | $1,603 | $29 |
Property Value by Mortgage Status in Quitman
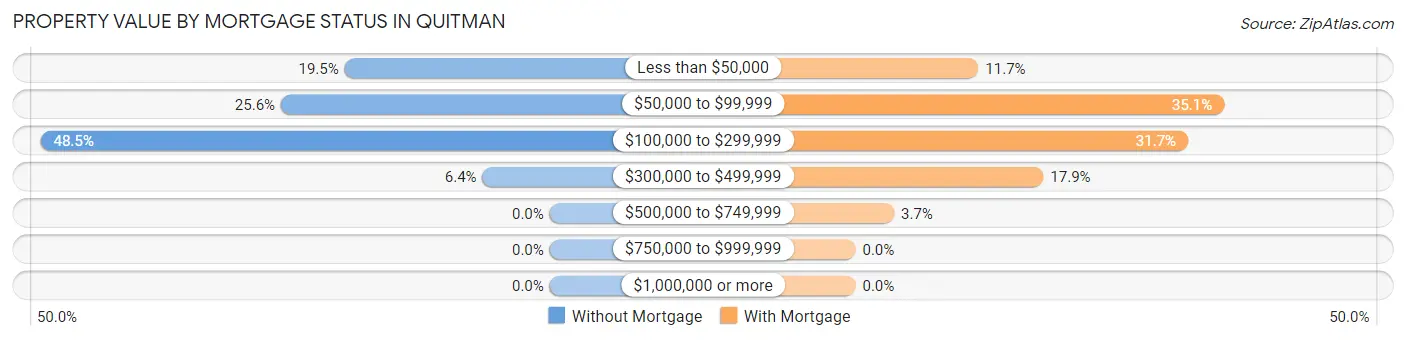
| Property Value | Without Mortgage | With Mortgage |
| Less than $50,000 | 58 (19.5%) | 51 (11.7%) |
| $50,000 to $99,999 | 76 (25.6%) | 153 (35.1%) |
| $100,000 to $299,999 | 144 (48.5%) | 138 (31.7%) |
| $300,000 to $499,999 | 19 (6.4%) | 78 (17.9%) |
| $500,000 to $749,999 | 0 (0.0%) | 16 (3.7%) |
| $750,000 to $999,999 | 0 (0.0%) | 0 (0.0%) |
| $1,000,000 or more | 0 (0.0%) | 0 (0.0%) |
| Total | 297 (100.0%) | 436 (100.0%) |
Household Income by Mortgage Status in Quitman
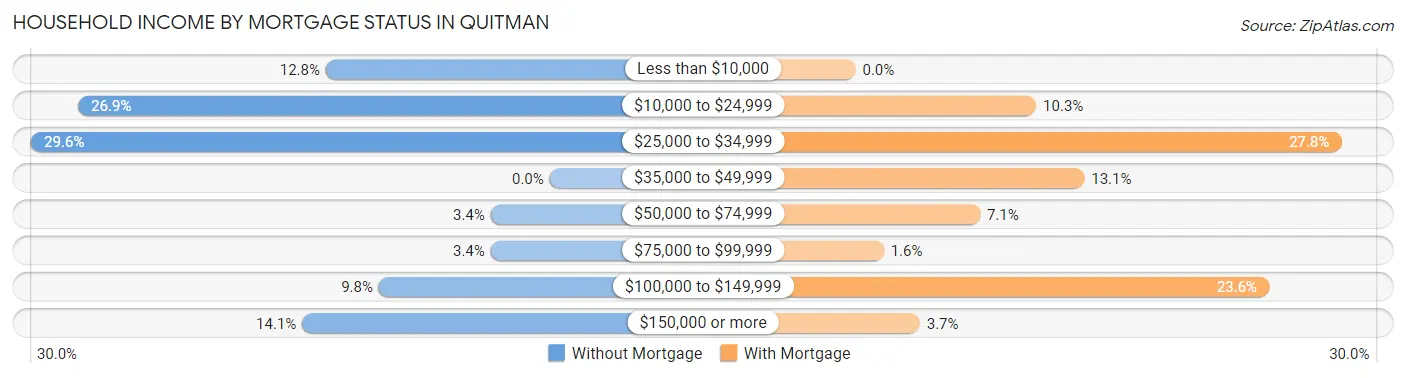
| Household Income | Without Mortgage | With Mortgage |
| Less than $10,000 | 38 (12.8%) | 0 (0.0%) |
| $10,000 to $24,999 | 80 (26.9%) | 45 (10.3%) |
| $25,000 to $34,999 | 88 (29.6%) | 121 (27.8%) |
| $35,000 to $49,999 | 0 (0.0%) | 57 (13.1%) |
| $50,000 to $74,999 | 10 (3.4%) | 31 (7.1%) |
| $75,000 to $99,999 | 10 (3.4%) | 7 (1.6%) |
| $100,000 to $149,999 | 29 (9.8%) | 103 (23.6%) |
| $150,000 or more | 42 (14.1%) | 16 (3.7%) |
| Total | 297 (100.0%) | 436 (100.0%) |
Property Value to Household Income Ratio in Quitman
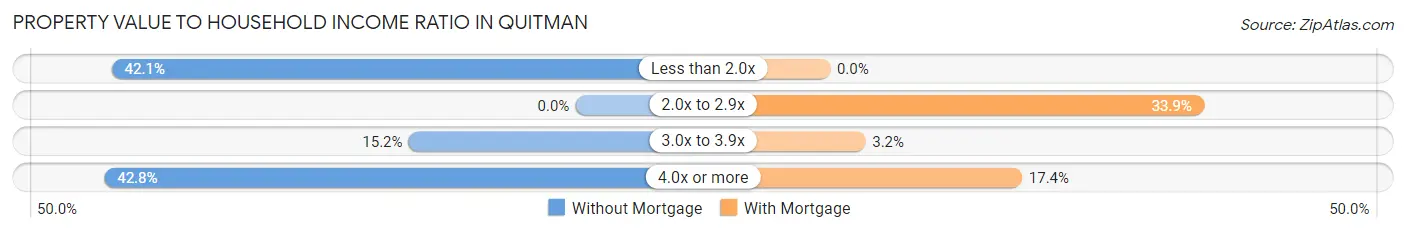
| Value-to-Income Ratio | Without Mortgage | With Mortgage |
| Less than 2.0x | 125 (42.1%) | 0 (0.0%) |
| 2.0x to 2.9x | 0 (0.0%) | 148 (33.9%) |
| 3.0x to 3.9x | 45 (15.1%) | 14 (3.2%) |
| 4.0x or more | 127 (42.8%) | 76 (17.4%) |
| Total | 297 (100.0%) | 436 (100.0%) |
Real Estate Taxes by Mortgage Status in Quitman
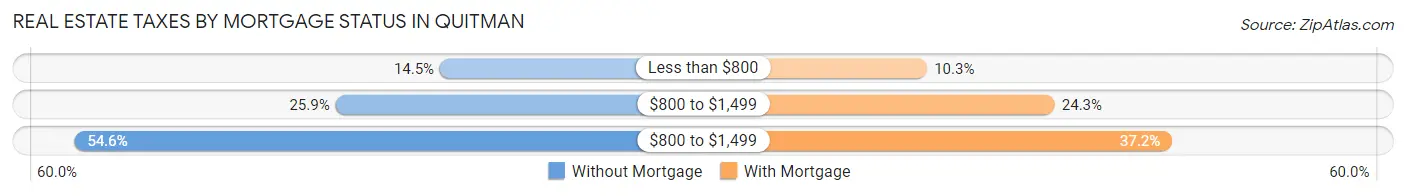
| Property Taxes | Without Mortgage | With Mortgage |
| Less than $800 | 43 (14.5%) | 45 (10.3%) |
| $800 to $1,499 | 77 (25.9%) | 106 (24.3%) |
| $800 to $1,499 | 162 (54.5%) | 162 (37.2%) |
| Total | 297 (100.0%) | 436 (100.0%) |
Health & Disability in Quitman
Health Insurance Coverage by Age in Quitman
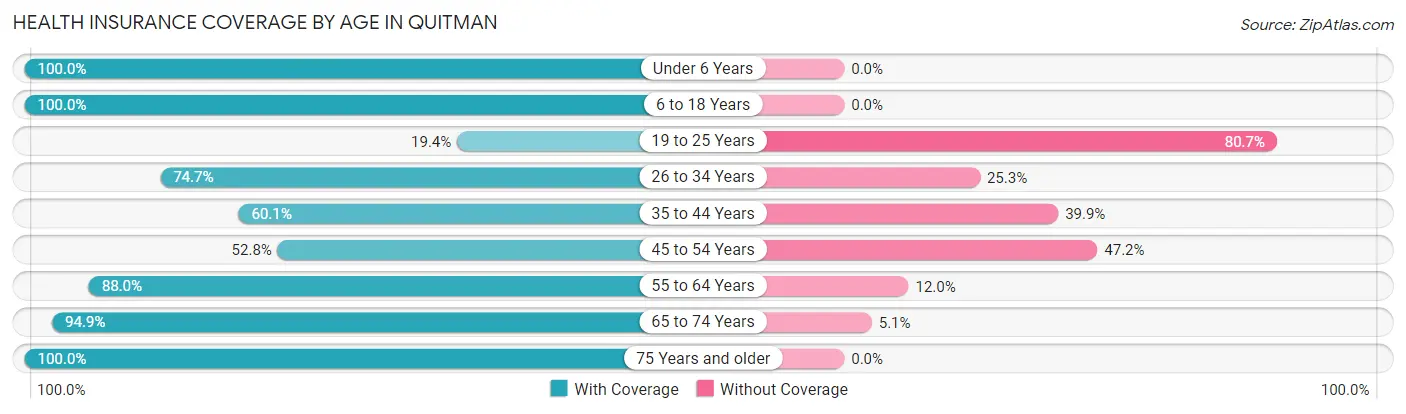
| Age Bracket | With Coverage | Without Coverage |
| Under 6 Years | 352 (100.0%) | 0 (0.0%) |
| 6 to 18 Years | 711 (100.0%) | 0 (0.0%) |
| 19 to 25 Years | 30 (19.4%) | 125 (80.6%) |
| 26 to 34 Years | 434 (74.7%) | 147 (25.3%) |
| 35 to 44 Years | 226 (60.1%) | 150 (39.9%) |
| 45 to 54 Years | 244 (52.8%) | 218 (47.2%) |
| 55 to 64 Years | 573 (88.0%) | 78 (12.0%) |
| 65 to 74 Years | 518 (94.9%) | 28 (5.1%) |
| 75 Years and older | 161 (100.0%) | 0 (0.0%) |
| Total | 3,249 (81.3%) | 746 (18.7%) |
Health Insurance Coverage by Citizenship Status in Quitman
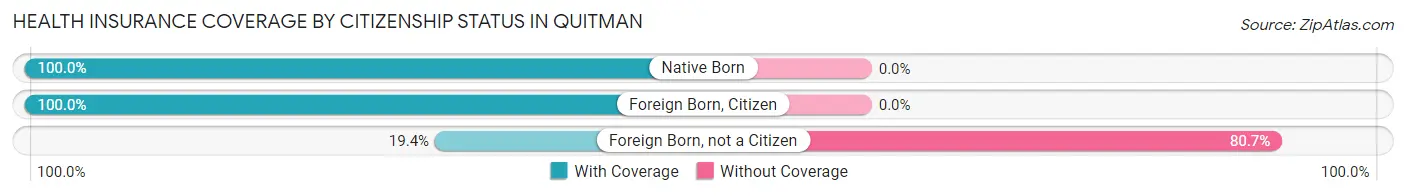
| Citizenship Status | With Coverage | Without Coverage |
| Native Born | 352 (100.0%) | 0 (0.0%) |
| Foreign Born, Citizen | 711 (100.0%) | 0 (0.0%) |
| Foreign Born, not a Citizen | 30 (19.4%) | 125 (80.6%) |
Health Insurance Coverage by Household Income in Quitman
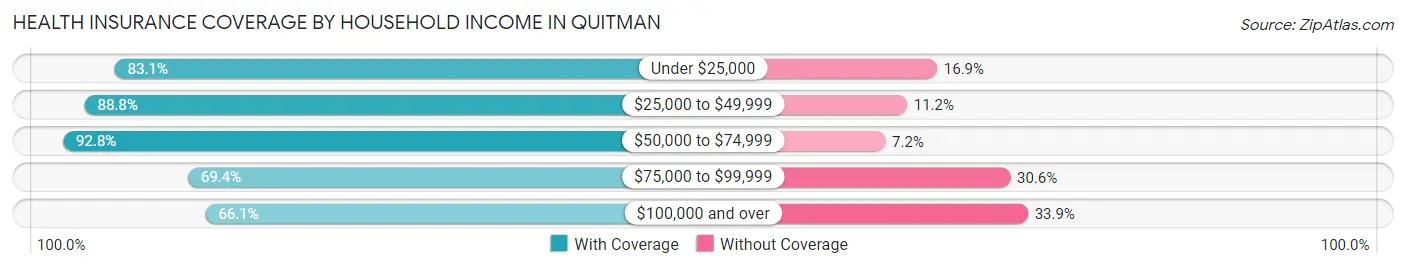
| Household Income | With Coverage | Without Coverage |
| Under $25,000 | 1,369 (83.1%) | 278 (16.9%) |
| $25,000 to $49,999 | 592 (88.8%) | 75 (11.2%) |
| $50,000 to $74,999 | 543 (92.8%) | 42 (7.2%) |
| $75,000 to $99,999 | 429 (69.4%) | 189 (30.6%) |
| $100,000 and over | 316 (66.1%) | 162 (33.9%) |
Public vs Private Health Insurance Coverage by Age in Quitman
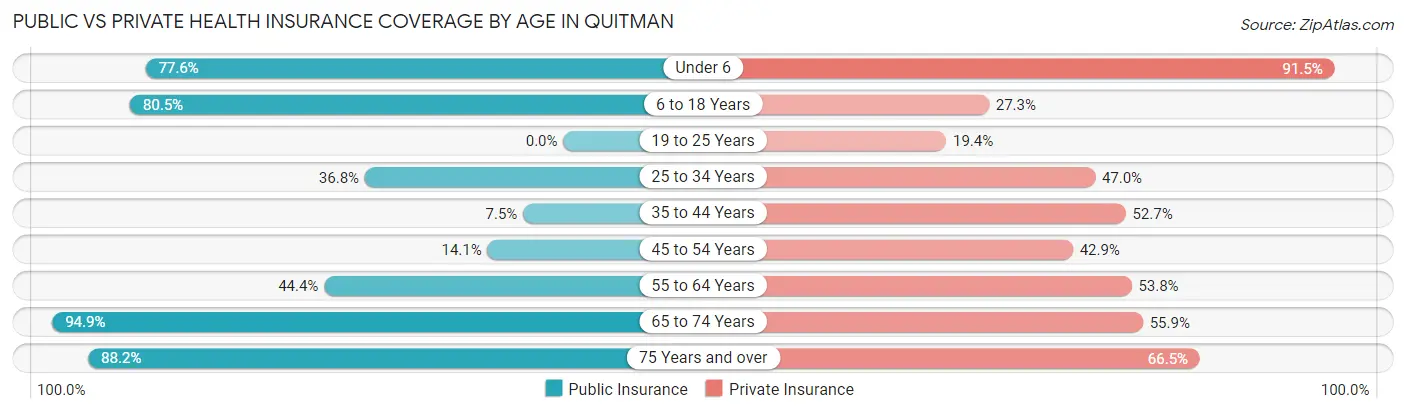
| Age Bracket | Public Insurance | Private Insurance |
| Under 6 | 273 (77.6%) | 322 (91.5%) |
| 6 to 18 Years | 572 (80.4%) | 194 (27.3%) |
| 19 to 25 Years | 0 (0.0%) | 30 (19.4%) |
| 25 to 34 Years | 214 (36.8%) | 273 (47.0%) |
| 35 to 44 Years | 28 (7.4%) | 198 (52.7%) |
| 45 to 54 Years | 65 (14.1%) | 198 (42.9%) |
| 55 to 64 Years | 289 (44.4%) | 350 (53.8%) |
| 65 to 74 Years | 518 (94.9%) | 305 (55.9%) |
| 75 Years and over | 142 (88.2%) | 107 (66.5%) |
| Total | 2,101 (52.6%) | 1,977 (49.5%) |
Disability Status by Sex by Age in Quitman
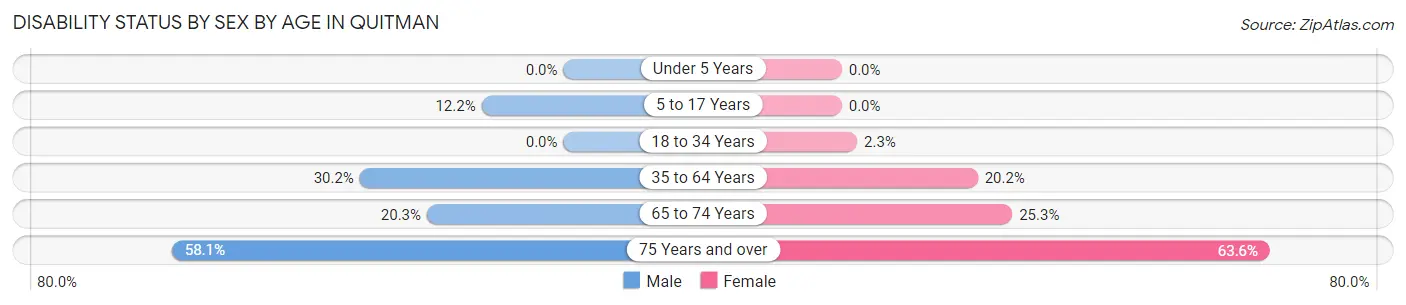
| Age Bracket | Male | Female |
| Under 5 Years | 0 (0.0%) | 0 (0.0%) |
| 5 to 17 Years | 40 (12.2%) | 0 (0.0%) |
| 18 to 34 Years | 0 (0.0%) | 10 (2.3%) |
| 35 to 64 Years | 179 (30.2%) | 181 (20.2%) |
| 65 to 74 Years | 45 (20.3%) | 82 (25.3%) |
| 75 Years and over | 25 (58.1%) | 75 (63.6%) |
Disability Class by Sex by Age in Quitman
Disability Class: Hearing Difficulty
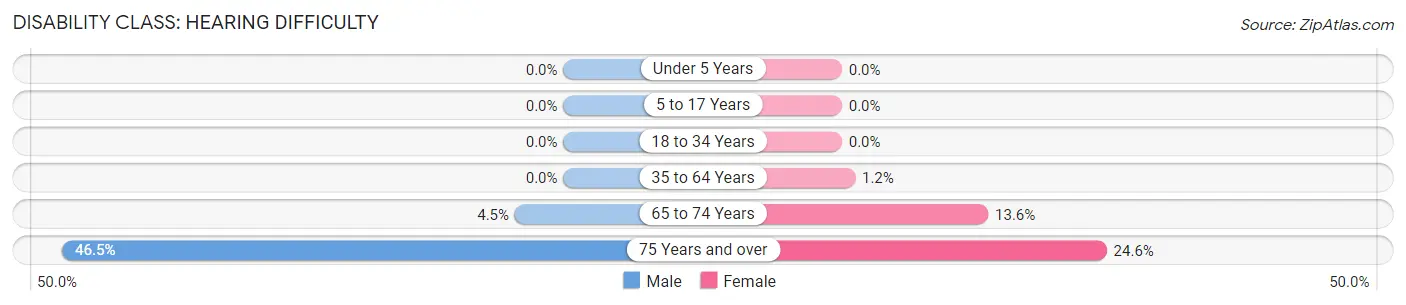
| Age Bracket | Male | Female |
| Under 5 Years | 0 (0.0%) | 0 (0.0%) |
| 5 to 17 Years | 0 (0.0%) | 0 (0.0%) |
| 18 to 34 Years | 0 (0.0%) | 0 (0.0%) |
| 35 to 64 Years | 0 (0.0%) | 11 (1.2%) |
| 65 to 74 Years | 10 (4.5%) | 44 (13.6%) |
| 75 Years and over | 20 (46.5%) | 29 (24.6%) |
Disability Class: Vision Difficulty
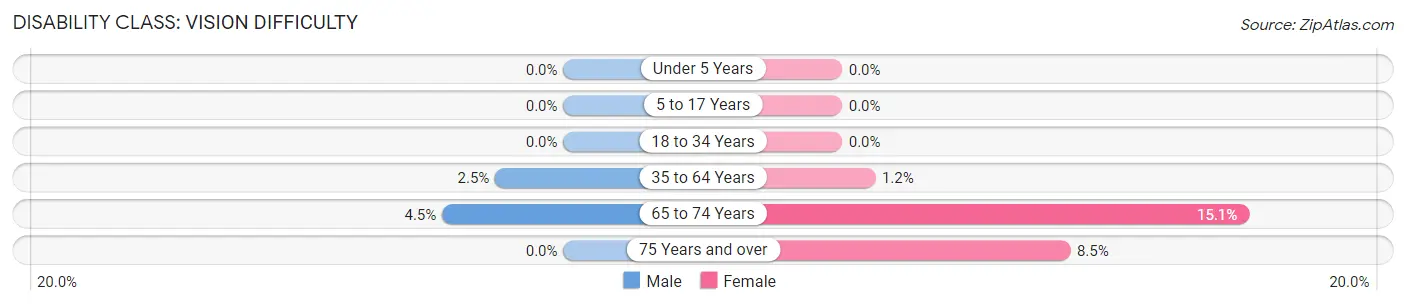
| Age Bracket | Male | Female |
| Under 5 Years | 0 (0.0%) | 0 (0.0%) |
| 5 to 17 Years | 0 (0.0%) | 0 (0.0%) |
| 18 to 34 Years | 0 (0.0%) | 0 (0.0%) |
| 35 to 64 Years | 15 (2.5%) | 11 (1.2%) |
| 65 to 74 Years | 10 (4.5%) | 49 (15.1%) |
| 75 Years and over | 0 (0.0%) | 10 (8.5%) |
Disability Class: Cognitive Difficulty
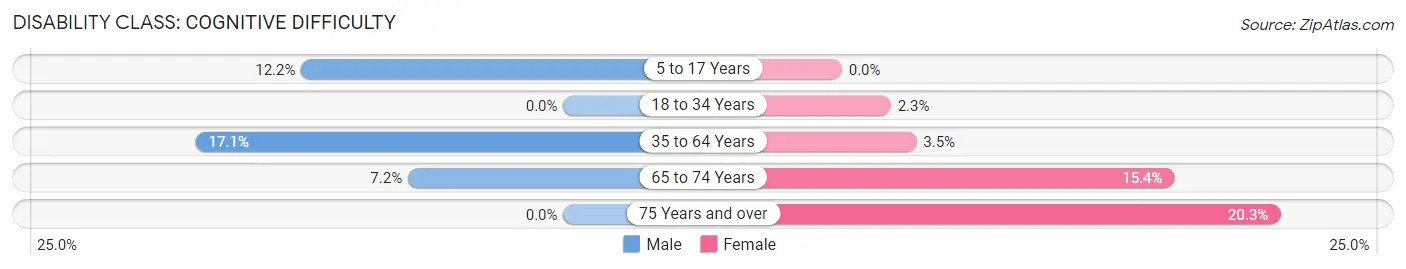
| Age Bracket | Male | Female |
| 5 to 17 Years | 40 (12.2%) | 0 (0.0%) |
| 18 to 34 Years | 0 (0.0%) | 10 (2.3%) |
| 35 to 64 Years | 101 (17.1%) | 31 (3.5%) |
| 65 to 74 Years | 16 (7.2%) | 50 (15.4%) |
| 75 Years and over | 0 (0.0%) | 24 (20.3%) |
Disability Class: Ambulatory Difficulty
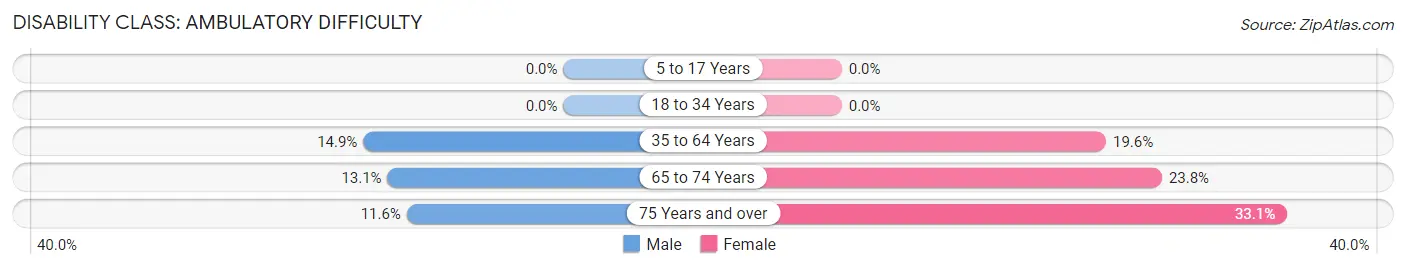
| Age Bracket | Male | Female |
| 5 to 17 Years | 0 (0.0%) | 0 (0.0%) |
| 18 to 34 Years | 0 (0.0%) | 0 (0.0%) |
| 35 to 64 Years | 88 (14.9%) | 176 (19.6%) |
| 65 to 74 Years | 29 (13.1%) | 77 (23.8%) |
| 75 Years and over | 5 (11.6%) | 39 (33.1%) |
Disability Class: Self-Care Difficulty
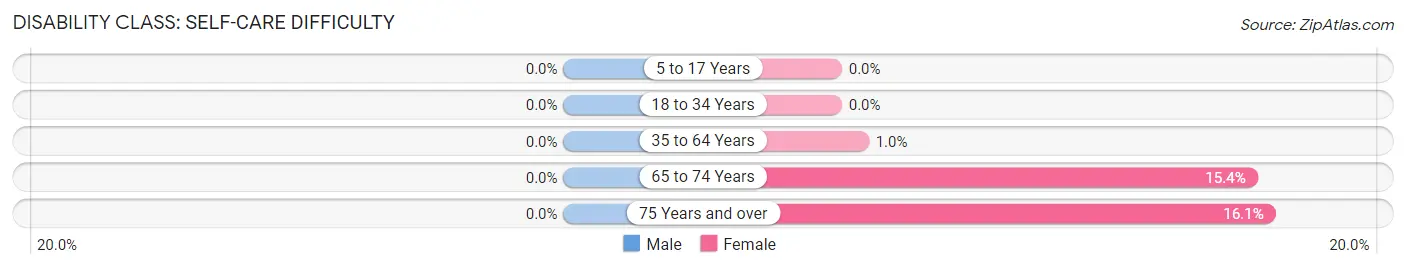
| Age Bracket | Male | Female |
| 5 to 17 Years | 0 (0.0%) | 0 (0.0%) |
| 18 to 34 Years | 0 (0.0%) | 0 (0.0%) |
| 35 to 64 Years | 0 (0.0%) | 9 (1.0%) |
| 65 to 74 Years | 0 (0.0%) | 50 (15.4%) |
| 75 Years and over | 0 (0.0%) | 19 (16.1%) |
Technology Access in Quitman
Computing Device Access in Quitman
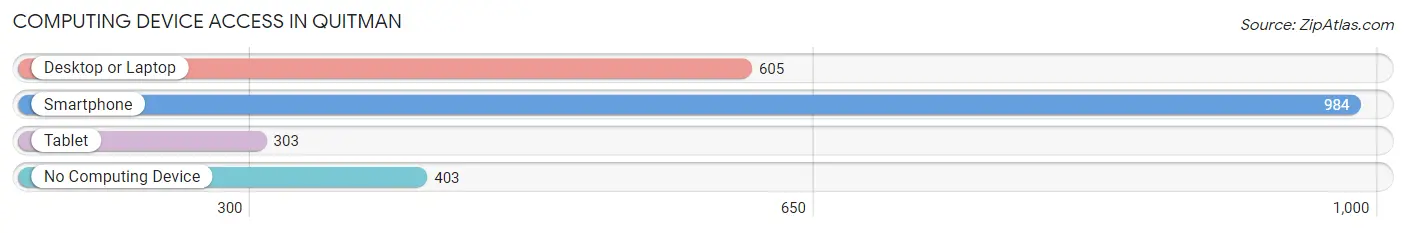
| Device Type | # Households | % Households |
| Desktop or Laptop | 605 | 40.2% |
| Smartphone | 984 | 65.4% |
| Tablet | 303 | 20.2% |
| No Computing Device | 403 | 26.8% |
| Total | 1,504 | 100.0% |
Internet Access in Quitman
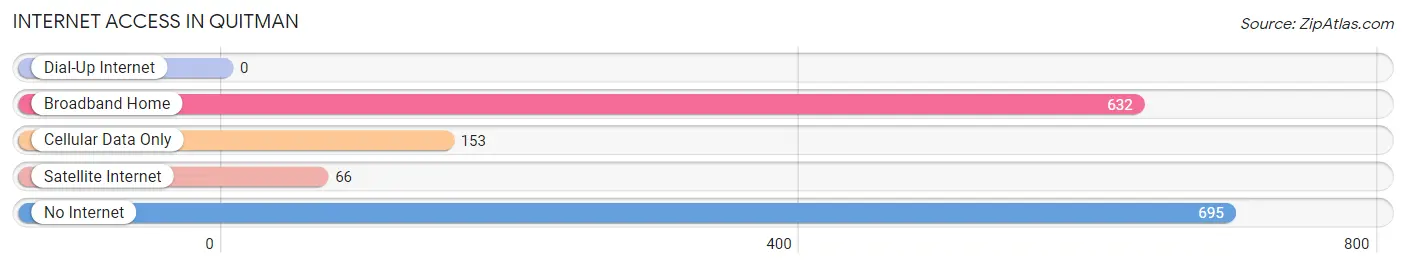
| Internet Type | # Households | % Households |
| Dial-Up Internet | 0 | 0.0% |
| Broadband Home | 632 | 42.0% |
| Cellular Data Only | 153 | 10.2% |
| Satellite Internet | 66 | 4.4% |
| No Internet | 695 | 46.2% |
| Total | 1,504 | 100.0% |
Quitman Summary
Quitman, Georgia is a small city located in Brooks County, Georgia. It is the county seat of Brooks County and is located about 30 miles south of Valdosta, Georgia. The population of Quitman was 2,541 at the 2010 census.
History
Quitman was founded in 1824 and named after General John A. Quitman, a hero of the War of 1812. The city was incorporated in 1854 and was the county seat of Brooks County. The city was a major railroad hub in the late 19th century and early 20th century. The city was also the site of a major battle during the Civil War.
Geography
Quitman is located at 31°45'25" North, 83°45'25" West (31.756944, -83.756944). The city is situated in the southeastern corner of Brooks County, near the border with Lowndes County. The city is located about 30 miles south of Valdosta, Georgia. The city has a total area of 4.2 square miles, all of which is land.
Economy
Quitman’s economy is largely based on agriculture and manufacturing. The city is home to several manufacturing plants, including a paper mill, a wood products plant, and a poultry processing plant. The city also has a number of retail stores and restaurants.
Demographics
As of the 2010 census, there were 2,541 people, 1,039 households, and 645 families residing in the city. The population density was 605.2 people per square mile. The racial makeup of the city was 57.2% White, 39.3% African American, 0.2% Native American, 0.7% Asian, 0.1% Pacific Islander, 1.2% from other races, and 1.4% from two or more races. Hispanic or Latino of any race were 2.7% of the population.
The median income for a household in the city was $25,938, and the median income for a family was $31,250. Males had a median income of $27,500 versus $20,000 for females. The per capita income for the city was $14,845. About 22.2% of families and 25.2% of the population were below the poverty line, including 36.2% of those under age 18 and 16.2% of those age 65 or over.
Common Questions
What is Per Capita Income in Quitman?
Per Capita income in Quitman is $27,583.
What is the Median Family Income in Quitman?
Median Family Income in Quitman is $41,339.
What is the Median Household income in Quitman?
Median Household Income in Quitman is $20,333.
What is Income or Wage Gap in Quitman?
Income or Wage Gap in Quitman is 23.3%.
Women in Quitman earn 76.7 cents for every dollar earned by a man.
What is Inequality or Gini Index in Quitman?
Inequality or Gini Index in Quitman is 0.69.
What is the Total Population of Quitman?
Total Population of Quitman is 4,050.
What is the Total Male Population of Quitman?
Total Male Population of Quitman is 1,755.
What is the Total Female Population of Quitman?
Total Female Population of Quitman is 2,295.
What is the Ratio of Males per 100 Females in Quitman?
There are 76.47 Males per 100 Females in Quitman.
What is the Ratio of Females per 100 Males in Quitman?
There are 130.77 Females per 100 Males in Quitman.
What is the Median Population Age in Quitman?
Median Population Age in Quitman is 38.9 Years.
What is the Average Family Size in Quitman
Average Family Size in Quitman is 3.8 People.
What is the Average Household Size in Quitman
Average Household Size in Quitman is 2.7 People.
How Large is the Labor Force in Quitman?
There are 1,547 People in the Labor Forcein in Quitman.
What is the Percentage of People in the Labor Force in Quitman?
50.1% of People are in the Labor Force in Quitman.
What is the Unemployment Rate in Quitman?
Unemployment Rate in Quitman is 6.1%.