Chilton, TX Map & Demographics
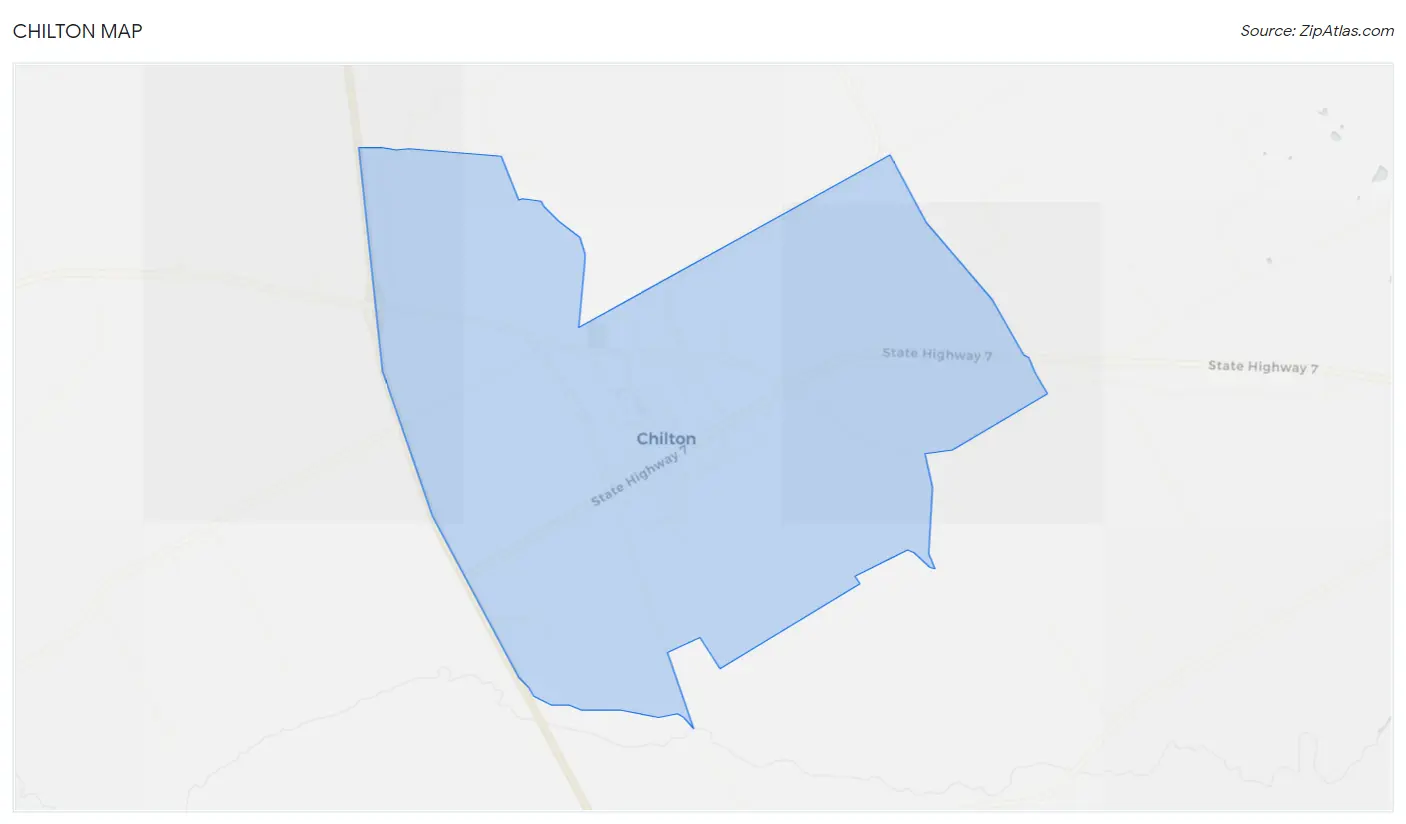
Chilton Map
Chilton Overview
$101,759
PER CAPITA INCOME
$31,250
AVG FAMILY INCOME
$32,895
AVG HOUSEHOLD INCOME
$21,261
FAMILY INCOME DEFICIT
0.72
INEQUALITY / GINI INDEX
1,095
TOTAL POPULATION
366
MALE POPULATION
729
FEMALE POPULATION
50.21
MALES / 100 FEMALES
199.18
FEMALES / 100 MALES
35.9
MEDIAN AGE
3.8
AVG FAMILY SIZE
3.9
AVG HOUSEHOLD SIZE
526
LABOR FORCE [ PEOPLE ]
65.5%
PERCENT IN LABOR FORCE
28.3%
UNEMPLOYMENT RATE
Chilton Zip Codes
Chilton Area Codes
Income in Chilton
Income Overview in Chilton
Per Capita Income in Chilton is $101,759, while median incomes of families and households are $31,250 and $32,895 respectively.
| Characteristic | Number | Measure |
| Per Capita Income | 1,095 | $101,759 |
| Median Family Income | 234 | $31,250 |
| Mean Family Income | 234 | $73,578 |
| Median Household Income | 282 | $32,895 |
| Mean Household Income | 282 | $104,802 |
| Income Deficit | 234 | $21,261 |
| Wage / Income Gap (%) | 1,095 | 0.00% |
| Wage / Income Gap ($) | 1,095 | 100.00¢ per $1 |
| Gini / Inequality Index | 1,095 | 0.72 |
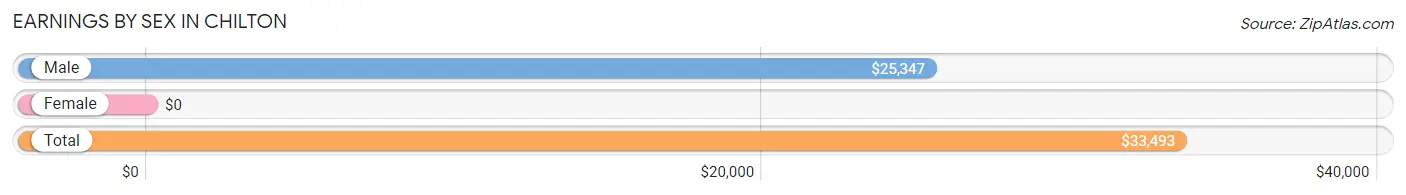
Earnings by Sex in Chilton
| Sex | Number | Average Earnings |
| Male | 219 (43.0%) | $25,347 |
| Female | 290 (57.0%) | $0 |
| Total | 509 (100.0%) | $33,493 |
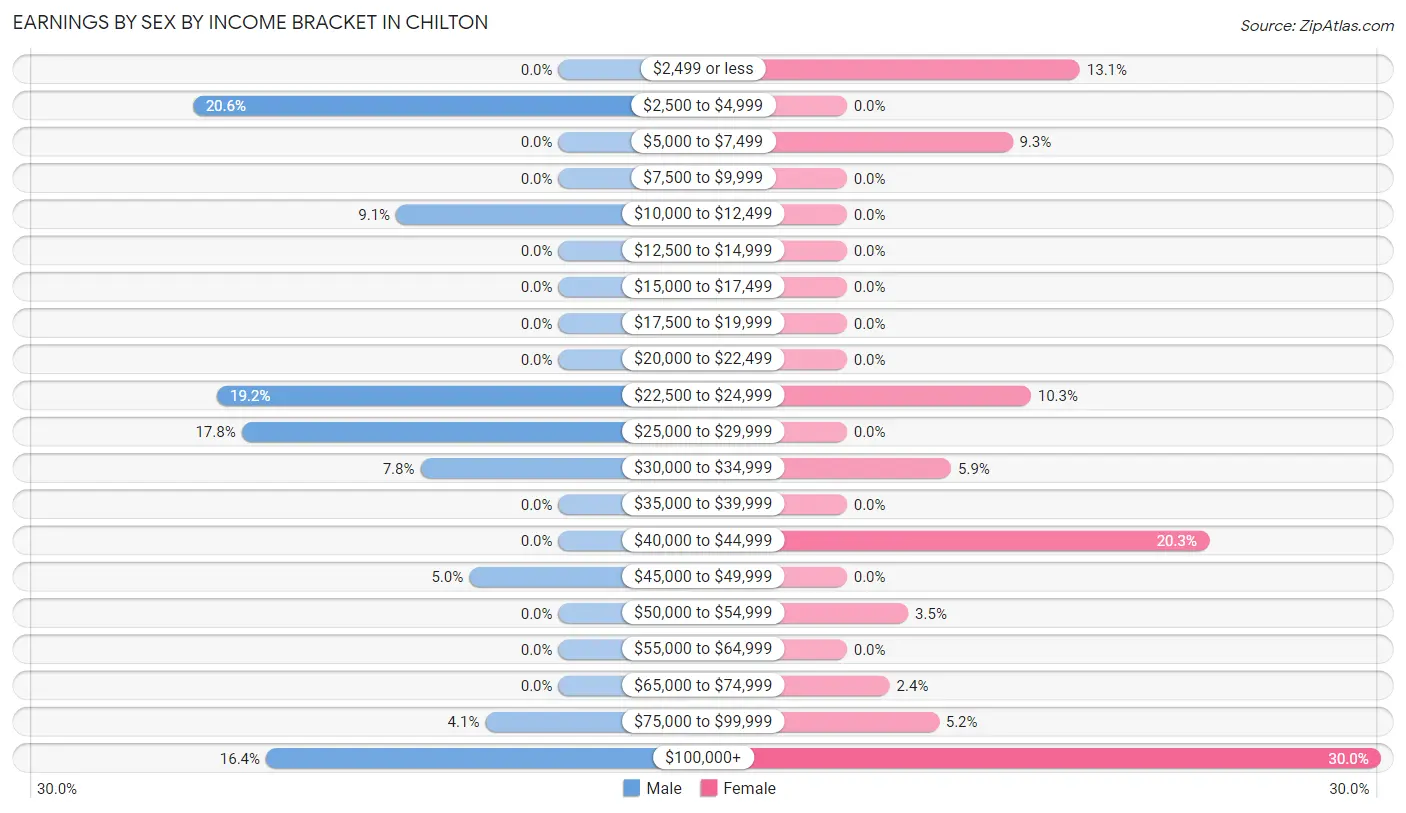
Earnings by Sex by Income Bracket in Chilton
The most common earnings brackets in Chilton are $2,500 to $4,999 for men (45 | 20.5%) and $100,000+ for women (87 | 30.0%).
| Income | Male | Female |
| $2,499 or less | 0 (0.0%) | 38 (13.1%) |
| $2,500 to $4,999 | 45 (20.5%) | 0 (0.0%) |
| $5,000 to $7,499 | 0 (0.0%) | 27 (9.3%) |
| $7,500 to $9,999 | 0 (0.0%) | 0 (0.0%) |
| $10,000 to $12,499 | 20 (9.1%) | 0 (0.0%) |
| $12,500 to $14,999 | 0 (0.0%) | 0 (0.0%) |
| $15,000 to $17,499 | 0 (0.0%) | 0 (0.0%) |
| $17,500 to $19,999 | 0 (0.0%) | 0 (0.0%) |
| $20,000 to $22,499 | 0 (0.0%) | 0 (0.0%) |
| $22,500 to $24,999 | 42 (19.2%) | 30 (10.3%) |
| $25,000 to $29,999 | 39 (17.8%) | 0 (0.0%) |
| $30,000 to $34,999 | 17 (7.8%) | 17 (5.9%) |
| $35,000 to $39,999 | 0 (0.0%) | 0 (0.0%) |
| $40,000 to $44,999 | 0 (0.0%) | 59 (20.3%) |
| $45,000 to $49,999 | 11 (5.0%) | 0 (0.0%) |
| $50,000 to $54,999 | 0 (0.0%) | 10 (3.5%) |
| $55,000 to $64,999 | 0 (0.0%) | 0 (0.0%) |
| $65,000 to $74,999 | 0 (0.0%) | 7 (2.4%) |
| $75,000 to $99,999 | 9 (4.1%) | 15 (5.2%) |
| $100,000+ | 36 (16.4%) | 87 (30.0%) |
| Total | 219 (100.0%) | 290 (100.0%) |
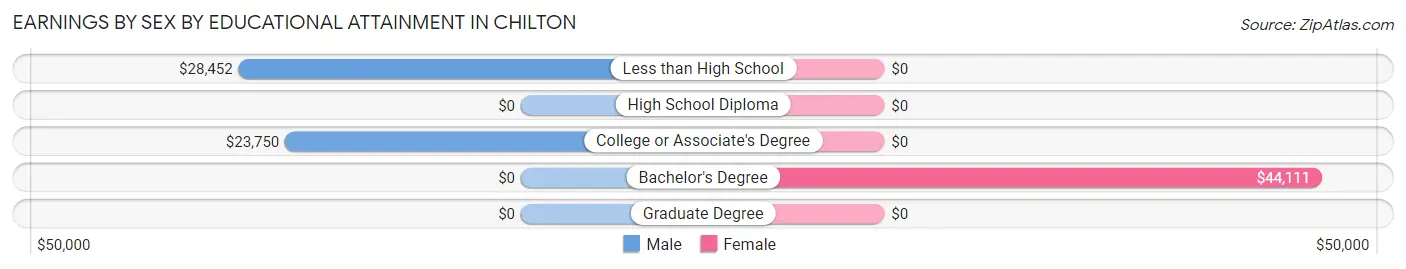
Earnings by Sex by Educational Attainment in Chilton
| Educational Attainment | Male Income | Female Income |
| Less than High School | $28,452 | $0 |
| High School Diploma | - | - |
| College or Associate's Degree | $23,750 | $0 |
| Bachelor's Degree | - | - |
| Graduate Degree | - | - |
| Total | $29,405 | $0 |
Family Income in Chilton
Family Income Brackets in Chilton
According to the Chilton family income data, there are 62 families falling into the less than $10,000 income range, which is the most common income bracket and makes up 26.5% of all families.
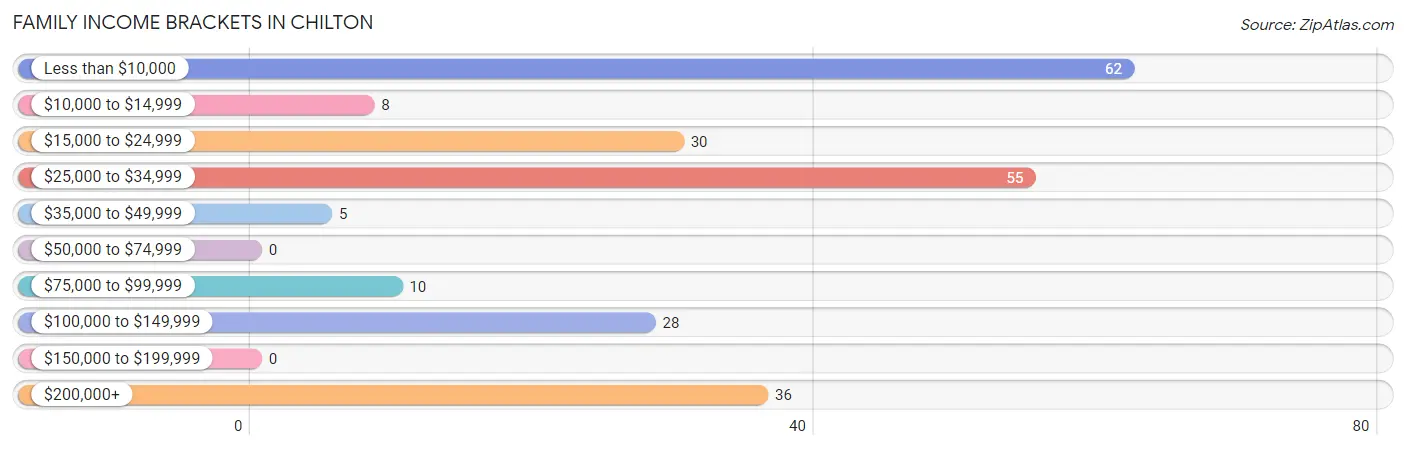
| Income Bracket | # Families | % Families |
| Less than $10,000 | 62 | 26.5% |
| $10,000 to $14,999 | 8 | 3.4% |
| $15,000 to $24,999 | 30 | 12.8% |
| $25,000 to $34,999 | 55 | 23.5% |
| $35,000 to $49,999 | 5 | 2.1% |
| $50,000 to $74,999 | 0 | 0.0% |
| $75,000 to $99,999 | 10 | 4.3% |
| $100,000 to $149,999 | 28 | 12.0% |
| $150,000 to $199,999 | 0 | 0.0% |
| $200,000+ | 36 | 15.4% |
Family Income by Famaliy Size in Chilton
2-person families (93 | 39.7%) account for the highest median family income in Chilton with $2,499 per family, while 2-person families (93 | 39.7%) have the highest median income of $1,250 per family member.
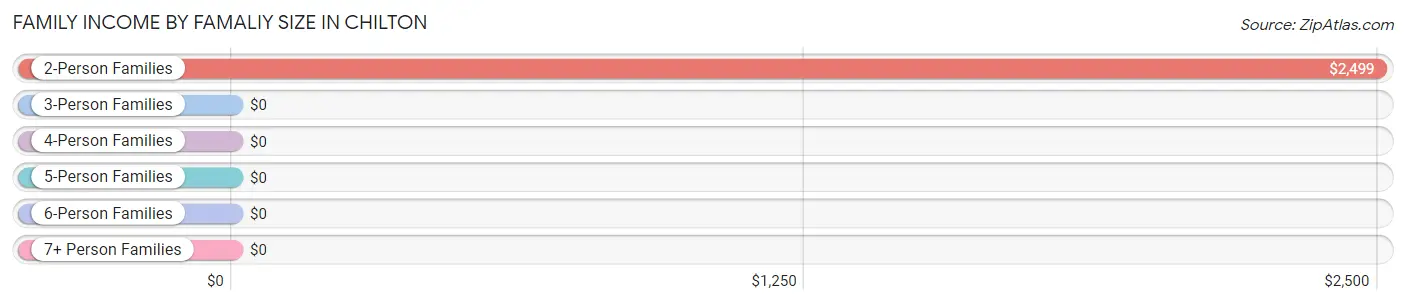
| Income Bracket | # Families | Median Income |
| 2-Person Families | 93 (39.7%) | $2,499 |
| 3-Person Families | 70 (29.9%) | $0 |
| 4-Person Families | 25 (10.7%) | $0 |
| 5-Person Families | 20 (8.6%) | $0 |
| 6-Person Families | 0 (0.0%) | $0 |
| 7+ Person Families | 26 (11.1%) | $0 |
| Total | 234 (100.0%) | $31,250 |
Family Income by Number of Earners in Chilton
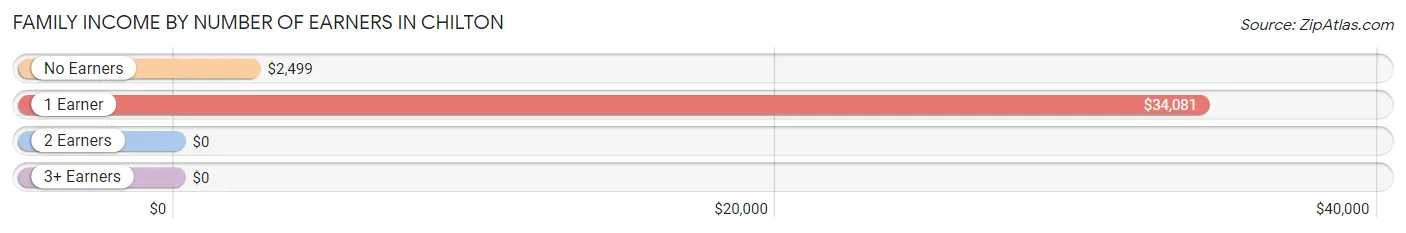
| Number of Earners | # Families | Median Income |
| No Earners | 66 (28.2%) | $2,499 |
| 1 Earner | 77 (32.9%) | $34,081 |
| 2 Earners | 91 (38.9%) | $0 |
| 3+ Earners | 0 (0.0%) | $0 |
| Total | 234 (100.0%) | $31,250 |
Household Income in Chilton
Household Income Brackets in Chilton
With 67 households falling in the category, the $25,000 to $34,999 income range is the most frequent in Chilton, accounting for 23.8% of all households.
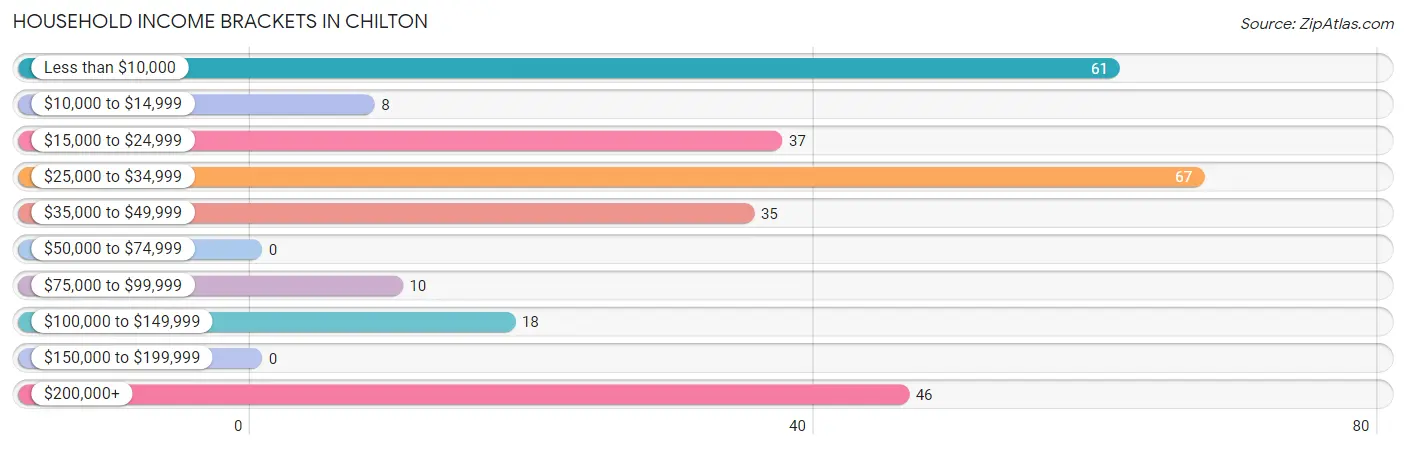
| Income Bracket | # Households | % Households |
| Less than $10,000 | 61 | 21.6% |
| $10,000 to $14,999 | 8 | 2.8% |
| $15,000 to $24,999 | 37 | 13.1% |
| $25,000 to $34,999 | 67 | 23.8% |
| $35,000 to $49,999 | 35 | 12.4% |
| $50,000 to $74,999 | 0 | 0.0% |
| $75,000 to $99,999 | 10 | 3.5% |
| $100,000 to $149,999 | 18 | 6.4% |
| $150,000 to $199,999 | 0 | 0.0% |
| $200,000+ | 46 | 16.3% |
Household Income by Householder Age in Chilton
The median household income in Chilton is $32,895, with the highest median household income of $34,926 found in the 25 to 44 years age bracket for the primary householder. A total of 49 households (17.4%) fall into this category.
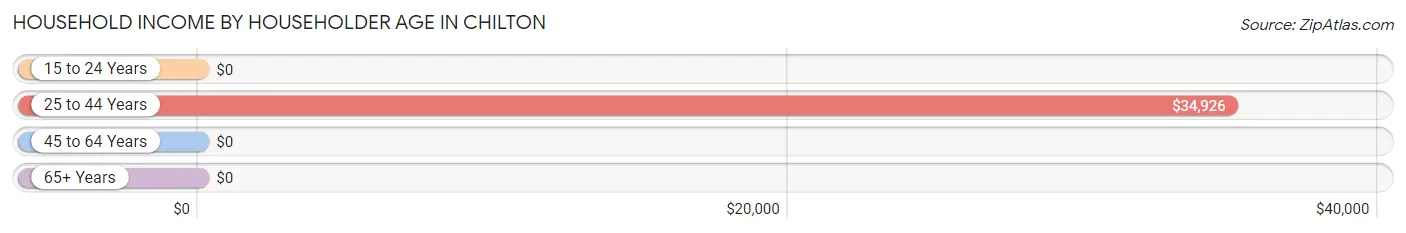
| Income Bracket | # Households | Median Income |
| 15 to 24 Years | 0 (0.0%) | $0 |
| 25 to 44 Years | 49 (17.4%) | $34,926 |
| 45 to 64 Years | 134 (47.5%) | $0 |
| 65+ Years | 99 (35.1%) | $0 |
| Total | 282 (100.0%) | $32,895 |
Poverty in Chilton
Income Below Poverty by Sex and Age in Chilton
With 33.9% poverty level for males and 21.5% for females among the residents of Chilton, 15 year old males and 15 year old females are the most vulnerable to poverty, with 16 males (100.0%) and 11 females (100.0%) in their respective age groups living below the poverty level.
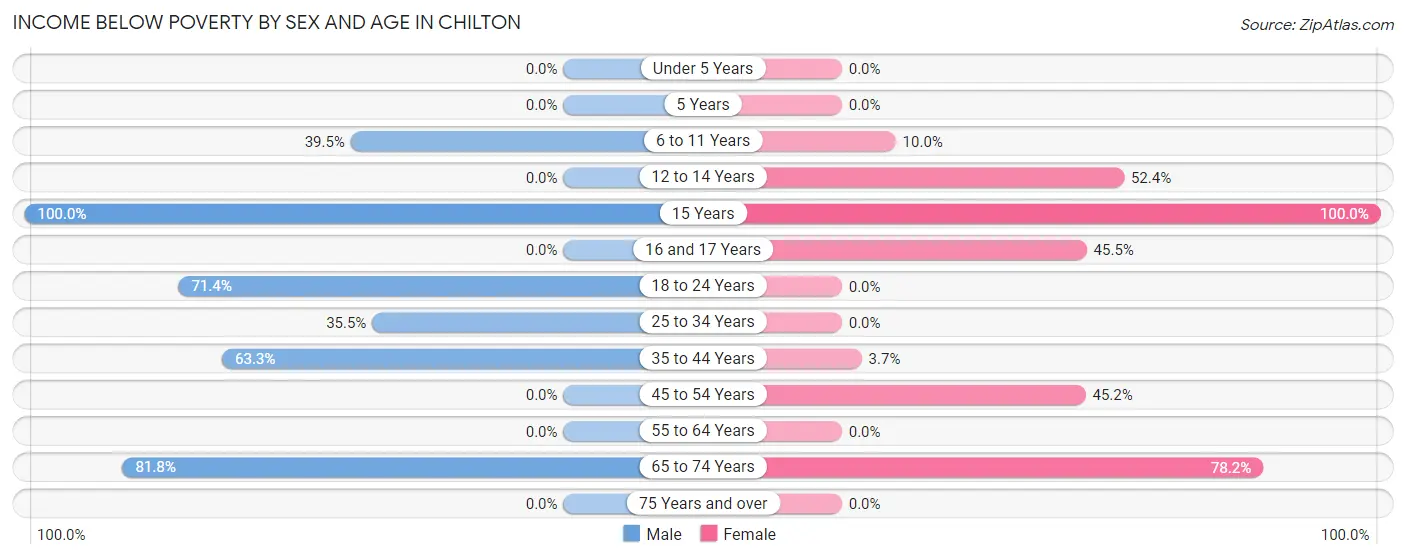
| Age Bracket | Male | Female |
| Under 5 Years | 0 (0.0%) | 0 (0.0%) |
| 5 Years | 0 (0.0%) | 0 (0.0%) |
| 6 to 11 Years | 15 (39.5%) | 9 (10.0%) |
| 12 to 14 Years | 0 (0.0%) | 33 (52.4%) |
| 15 Years | 16 (100.0%) | 11 (100.0%) |
| 16 and 17 Years | 0 (0.0%) | 15 (45.5%) |
| 18 to 24 Years | 45 (71.4%) | 0 (0.0%) |
| 25 to 34 Years | 11 (35.5%) | 0 (0.0%) |
| 35 to 44 Years | 19 (63.3%) | 8 (3.7%) |
| 45 to 54 Years | 0 (0.0%) | 38 (45.2%) |
| 55 to 64 Years | 0 (0.0%) | 0 (0.0%) |
| 65 to 74 Years | 18 (81.8%) | 43 (78.2%) |
| 75 Years and over | 0 (0.0%) | 0 (0.0%) |
| Total | 124 (33.9%) | 157 (21.5%) |
Income Above Poverty by Sex and Age in Chilton
According to the poverty statistics in Chilton, males aged under 5 years and females aged under 5 years are the age groups that are most secure financially, with 100.0% of males and 100.0% of females in these age groups living above the poverty line.
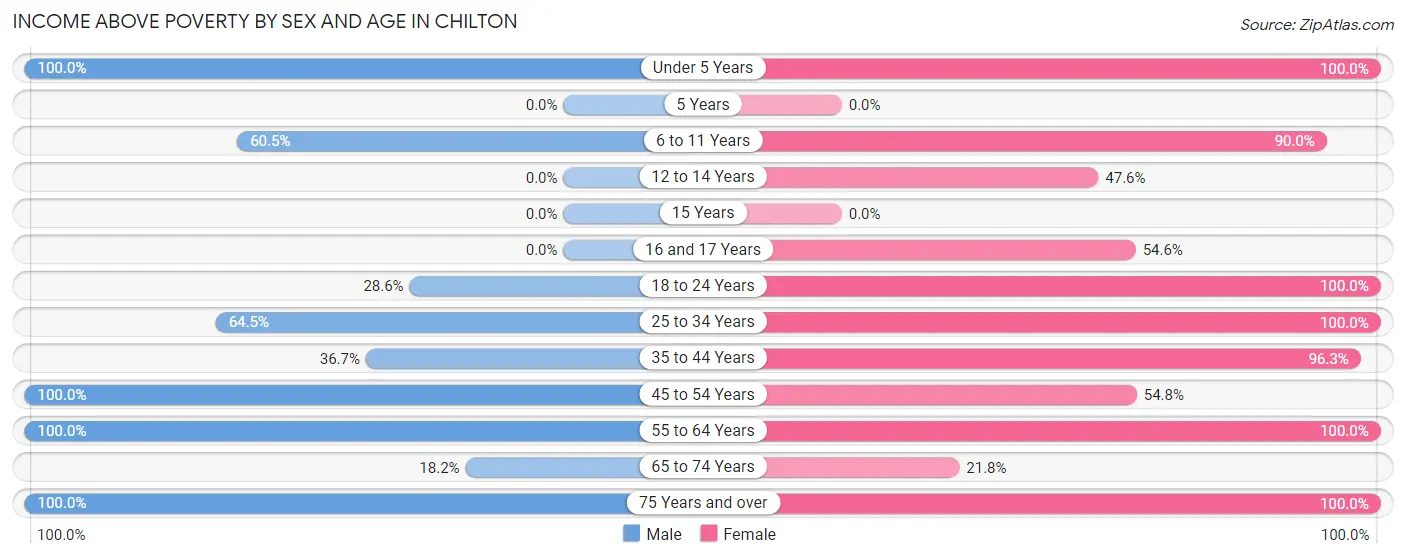
| Age Bracket | Male | Female |
| Under 5 Years | 10 (100.0%) | 64 (100.0%) |
| 5 Years | 0 (0.0%) | 0 (0.0%) |
| 6 to 11 Years | 23 (60.5%) | 81 (90.0%) |
| 12 to 14 Years | 0 (0.0%) | 30 (47.6%) |
| 15 Years | 0 (0.0%) | 0 (0.0%) |
| 16 and 17 Years | 0 (0.0%) | 18 (54.5%) |
| 18 to 24 Years | 18 (28.6%) | 15 (100.0%) |
| 25 to 34 Years | 20 (64.5%) | 17 (100.0%) |
| 35 to 44 Years | 11 (36.7%) | 209 (96.3%) |
| 45 to 54 Years | 48 (100.0%) | 46 (54.8%) |
| 55 to 64 Years | 62 (100.0%) | 69 (100.0%) |
| 65 to 74 Years | 4 (18.2%) | 12 (21.8%) |
| 75 Years and over | 46 (100.0%) | 11 (100.0%) |
| Total | 242 (66.1%) | 572 (78.5%) |
Income Below Poverty Among Married-Couple Families in Chilton
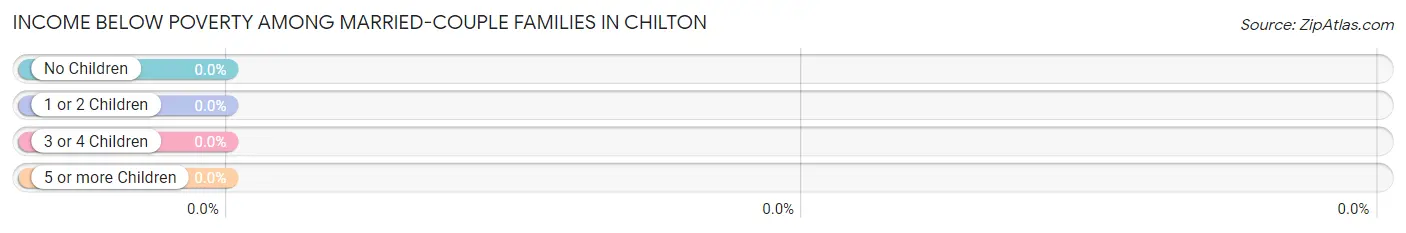
| Children | Above Poverty | Below Poverty |
| No Children | 53 (100.0%) | 0 (0.0%) |
| 1 or 2 Children | 28 (100.0%) | 0 (0.0%) |
| 3 or 4 Children | 0 (0.0%) | 0 (0.0%) |
| 5 or more Children | 26 (100.0%) | 0 (0.0%) |
| Total | 107 (100.0%) | 0 (0.0%) |
Income Below Poverty Among Single-Parent Households in Chilton
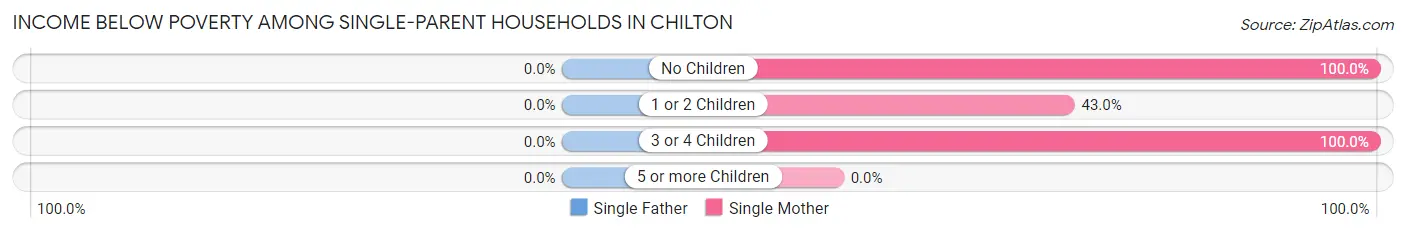
| Children | Single Father | Single Mother |
| No Children | 0 (0.0%) | 7 (100.0%) |
| 1 or 2 Children | 0 (0.0%) | 43 (43.0%) |
| 3 or 4 Children | 0 (0.0%) | 20 (100.0%) |
| 5 or more Children | 0 (0.0%) | 0 (0.0%) |
| Total | 0 (0.0%) | 70 (55.1%) |
Income Below Poverty Among Married-Couple vs Single-Parent Households in Chilton
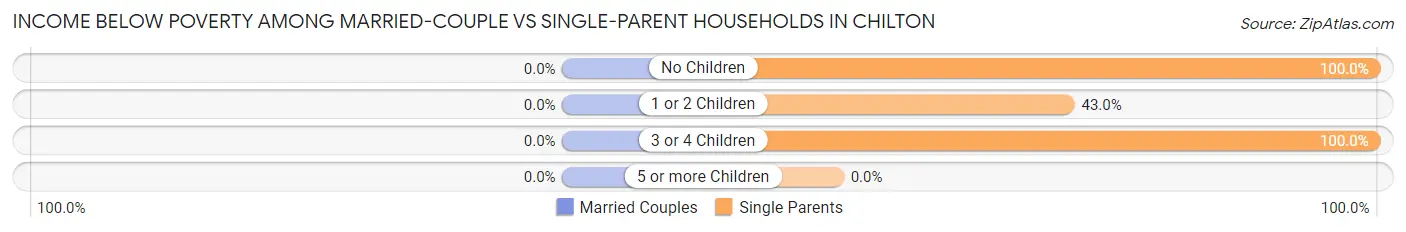
| Children | Married-Couple Families | Single-Parent Households |
| No Children | 0 (0.0%) | 7 (100.0%) |
| 1 or 2 Children | 0 (0.0%) | 43 (43.0%) |
| 3 or 4 Children | 0 (0.0%) | 20 (100.0%) |
| 5 or more Children | 0 (0.0%) | 0 (0.0%) |
| Total | 0 (0.0%) | 70 (55.1%) |
Race in Chilton
The most populous races in Chilton are Hispanic or Latino (563 | 51.4%), Black / African American (316 | 28.9%), and Two or more Races (264 | 24.1%).
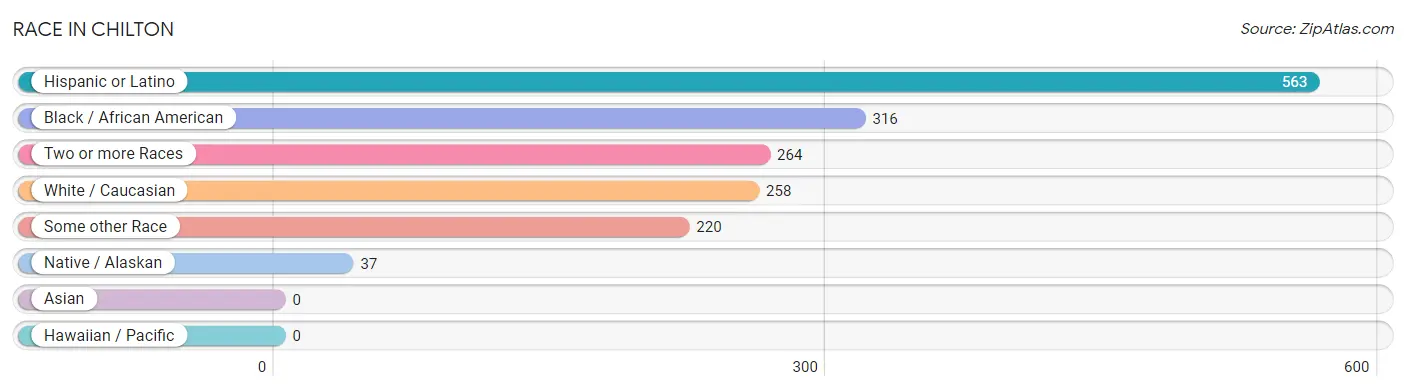
| Race | # Population | % Population |
| Asian | 0 | 0.0% |
| Black / African American | 316 | 28.9% |
| Hawaiian / Pacific | 0 | 0.0% |
| Hispanic or Latino | 563 | 51.4% |
| Native / Alaskan | 37 | 3.4% |
| White / Caucasian | 258 | 23.6% |
| Two or more Races | 264 | 24.1% |
| Some other Race | 220 | 20.1% |
| Total | 1,095 | 100.0% |
Ancestry in Chilton
The most populous ancestries reported in Chilton are Mexican (502 | 45.8%), American (78 | 7.1%), Central American (61 | 5.6%), Salvadoran (61 | 5.6%), and German (59 | 5.4%), together accounting for 69.5% of all Chilton residents.
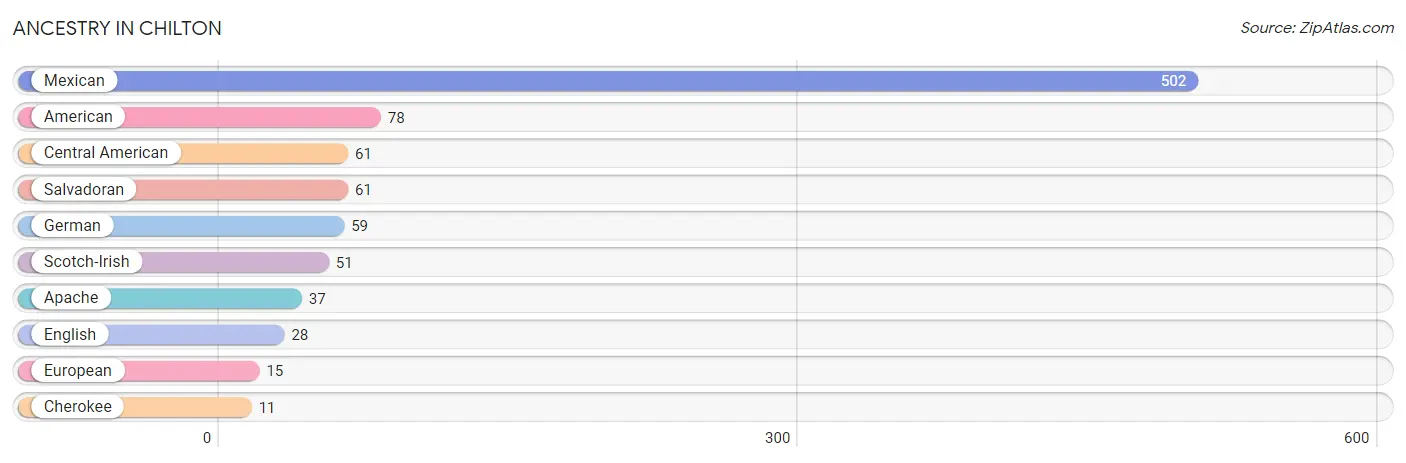
| Ancestry | # Population | % Population |
| American | 78 | 7.1% |
| Apache | 37 | 3.4% |
| Central American | 61 | 5.6% |
| Cherokee | 11 | 1.0% |
| English | 28 | 2.6% |
| European | 15 | 1.4% |
| German | 59 | 5.4% |
| Mexican | 502 | 45.8% |
| Salvadoran | 61 | 5.6% |
| Scotch-Irish | 51 | 4.7% | View All 10 Rows |
Immigrants in Chilton
The most numerous immigrant groups reported in Chilton came from Central America (153 | 14.0%), Latin America (153 | 14.0%), Mexico (117 | 10.7%), El Salvador (36 | 3.3%), and Europe (9 | 0.8%), together accounting for 42.7% of all Chilton residents.
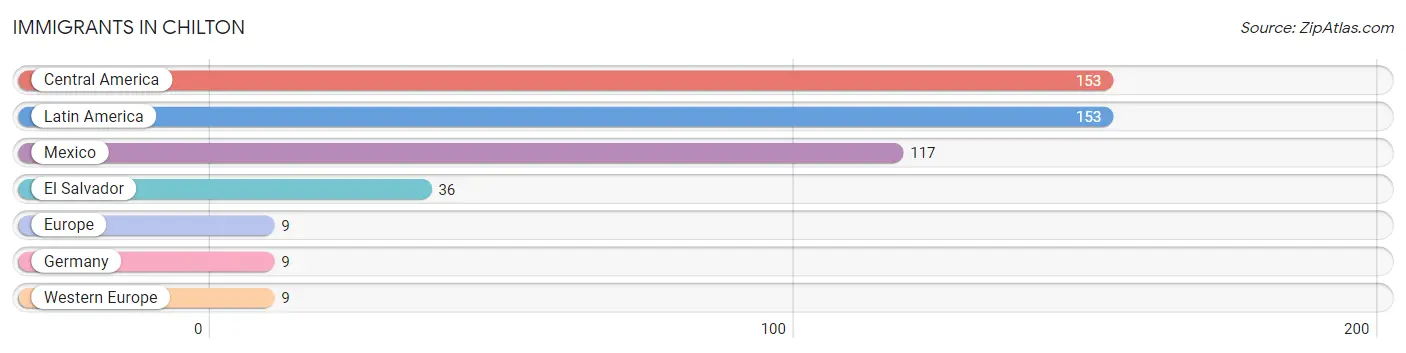
| Immigration Origin | # Population | % Population |
| Central America | 153 | 14.0% |
| El Salvador | 36 | 3.3% |
| Europe | 9 | 0.8% |
| Germany | 9 | 0.8% |
| Latin America | 153 | 14.0% |
| Mexico | 117 | 10.7% |
| Western Europe | 9 | 0.8% | View All 7 Rows |
Sex and Age in Chilton
Sex and Age in Chilton
The most populous age groups in Chilton are 15 to 19 Years (61 | 16.7%) for men and 35 to 39 Years (131 | 18.0%) for women.
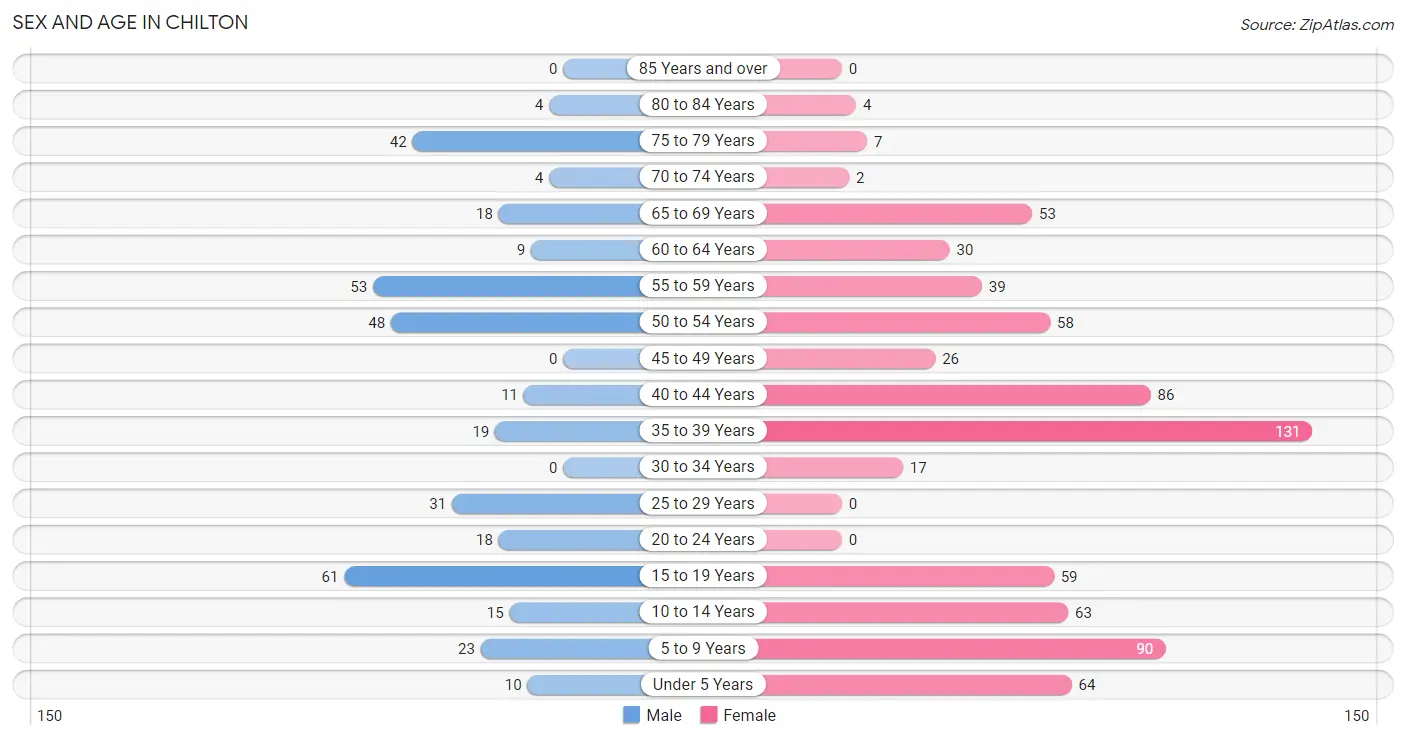
| Age Bracket | Male | Female |
| Under 5 Years | 10 (2.7%) | 64 (8.8%) |
| 5 to 9 Years | 23 (6.3%) | 90 (12.3%) |
| 10 to 14 Years | 15 (4.1%) | 63 (8.6%) |
| 15 to 19 Years | 61 (16.7%) | 59 (8.1%) |
| 20 to 24 Years | 18 (4.9%) | 0 (0.0%) |
| 25 to 29 Years | 31 (8.5%) | 0 (0.0%) |
| 30 to 34 Years | 0 (0.0%) | 17 (2.3%) |
| 35 to 39 Years | 19 (5.2%) | 131 (18.0%) |
| 40 to 44 Years | 11 (3.0%) | 86 (11.8%) |
| 45 to 49 Years | 0 (0.0%) | 26 (3.6%) |
| 50 to 54 Years | 48 (13.1%) | 58 (8.0%) |
| 55 to 59 Years | 53 (14.5%) | 39 (5.3%) |
| 60 to 64 Years | 9 (2.5%) | 30 (4.1%) |
| 65 to 69 Years | 18 (4.9%) | 53 (7.3%) |
| 70 to 74 Years | 4 (1.1%) | 2 (0.3%) |
| 75 to 79 Years | 42 (11.5%) | 7 (1.0%) |
| 80 to 84 Years | 4 (1.1%) | 4 (0.5%) |
| 85 Years and over | 0 (0.0%) | 0 (0.0%) |
| Total | 366 (100.0%) | 729 (100.0%) |
Families and Households in Chilton
Median Family Size in Chilton
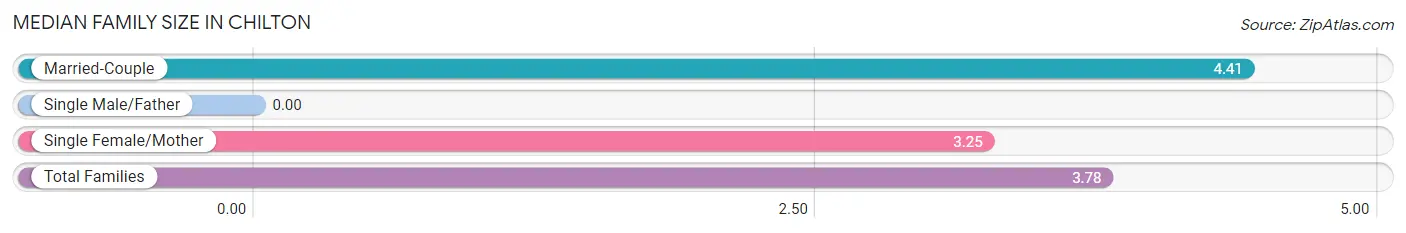
| Family Type | # Families | Family Size |
| Married-Couple | 107 (45.7%) | 4.41 |
| Single Male/Father | 0 (0.0%) | - |
| Single Female/Mother | 127 (54.3%) | 3.25 |
| Total Families | 234 (100.0%) | 3.78 |
Median Household Size in Chilton
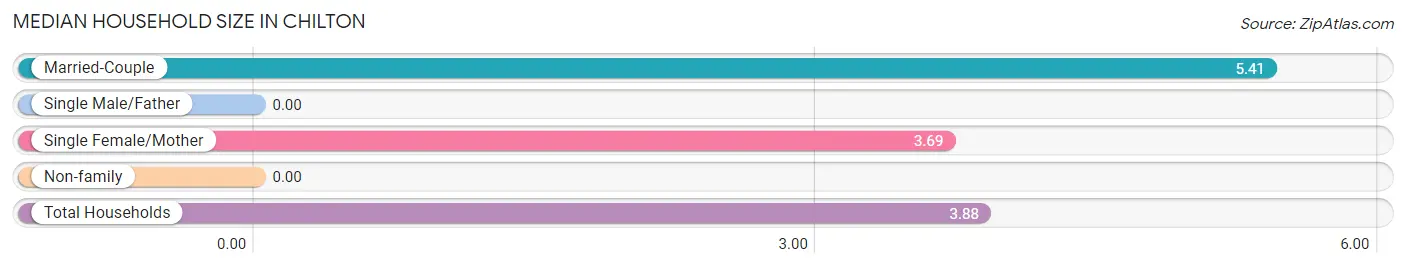
| Household Type | # Households | Household Size |
| Married-Couple | 107 (37.9%) | 5.41 |
| Single Male/Father | 0 (0.0%) | - |
| Single Female/Mother | 127 (45.0%) | 3.69 |
| Non-family | 48 (17.0%) | - |
| Total Households | 282 (100.0%) | 3.88 |
Household Size by Marriage Status in Chilton
Out of a total of 282 households in Chilton, 234 (83.0%) are family households, while 48 (17.0%) are nonfamily households. The most numerous type of family households are 2-person households, comprising 86, and the most common type of nonfamily households are 1-person households, comprising 48.
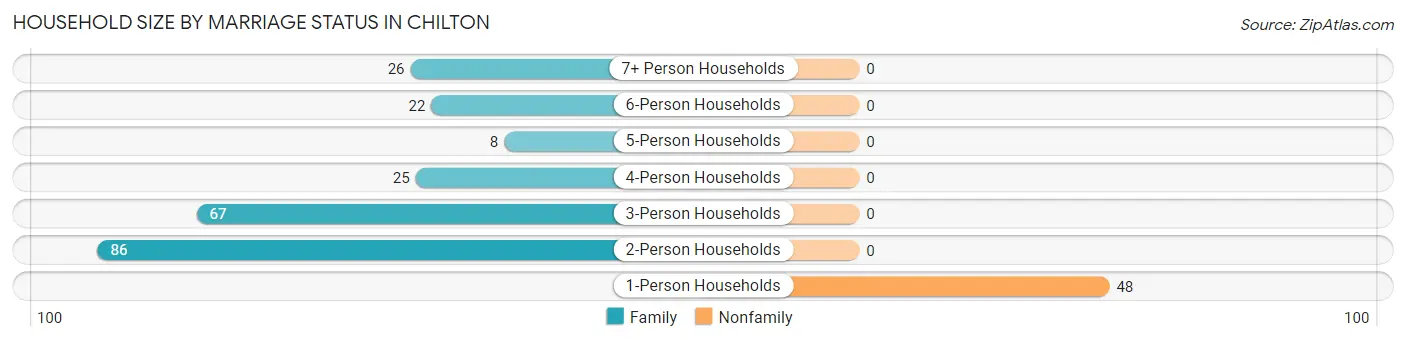
| Household Size | Family Households | Nonfamily Households |
| 1-Person Households | - | 48 (17.0%) |
| 2-Person Households | 86 (30.5%) | 0 (0.0%) |
| 3-Person Households | 67 (23.8%) | 0 (0.0%) |
| 4-Person Households | 25 (8.9%) | 0 (0.0%) |
| 5-Person Households | 8 (2.8%) | 0 (0.0%) |
| 6-Person Households | 22 (7.8%) | 0 (0.0%) |
| 7+ Person Households | 26 (9.2%) | 0 (0.0%) |
| Total | 234 (83.0%) | 48 (17.0%) |
Female Fertility in Chilton
Fertility by Age in Chilton
Average fertility rate in Chilton is 82.0 births per 1,000 women. Women in the age bracket of 35 to 50 years have the highest fertility rate with 107.0 births per 1,000 women. Women in the age bracket of 35 to 50 years acount for 100.0% of all women with births.
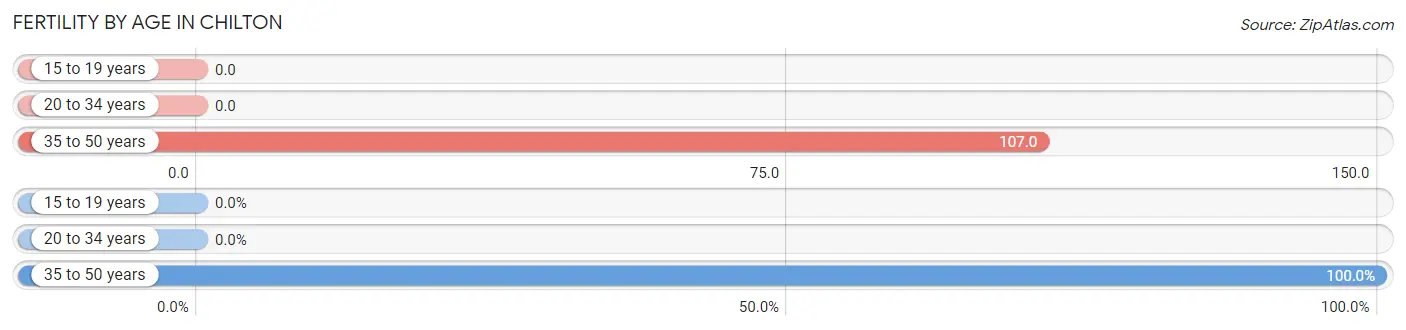
| Age Bracket | Women with Births | Births / 1,000 Women |
| 15 to 19 years | 0 (0.0%) | 0.0 |
| 20 to 34 years | 0 (0.0%) | 0.0 |
| 35 to 50 years | 26 (100.0%) | 107.0 |
| Total | 26 (100.0%) | 82.0 |
Fertility by Age by Marriage Status in Chilton
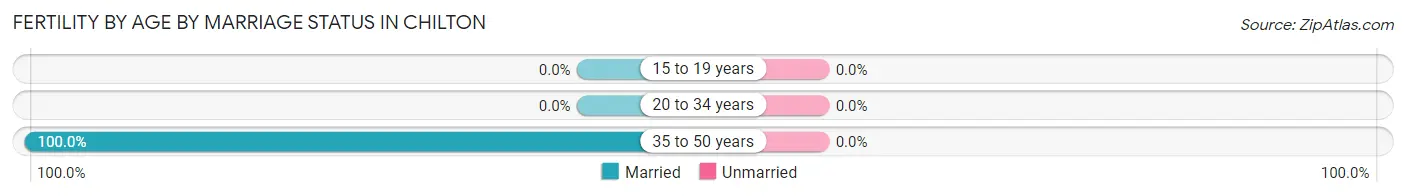
| Age Bracket | Married | Unmarried |
| 15 to 19 years | 0 (0.0%) | 0 (0.0%) |
| 20 to 34 years | 0 (0.0%) | 0 (0.0%) |
| 35 to 50 years | 26 (100.0%) | 0 (0.0%) |
| Total | 26 (100.0%) | 0 (0.0%) |
Fertility by Education in Chilton
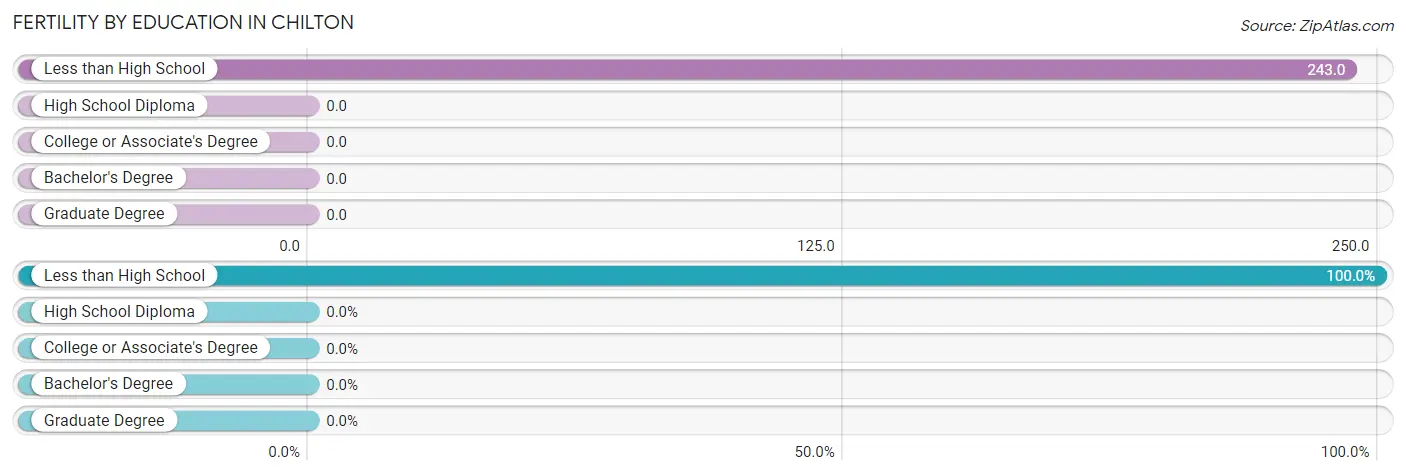
| Educational Attainment | Women with Births | Births / 1,000 Women |
| Less than High School | 26 (100.0%) | 243.0 |
| High School Diploma | 0 (0.0%) | 0.0 |
| College or Associate's Degree | 0 (0.0%) | 0.0 |
| Bachelor's Degree | 0 (0.0%) | 0.0 |
| Graduate Degree | 0 (0.0%) | 0.0 |
| Total | 26 (100.0%) | 82.0 |
Fertility by Education by Marriage Status in Chilton
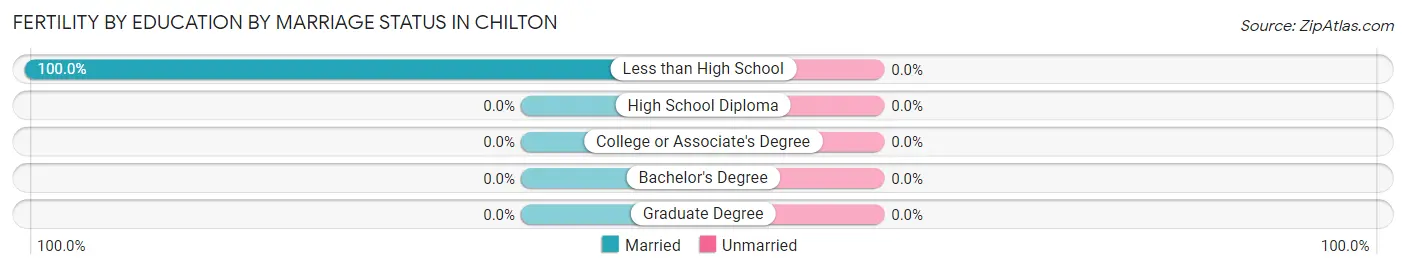
| Educational Attainment | Married | Unmarried |
| Less than High School | 26 (100.0%) | 0 (0.0%) |
| High School Diploma | 0 (0.0%) | 0 (0.0%) |
| College or Associate's Degree | 0 (0.0%) | 0 (0.0%) |
| Bachelor's Degree | 0 (0.0%) | 0 (0.0%) |
| Graduate Degree | 0 (0.0%) | 0 (0.0%) |
| Total | 26 (100.0%) | 0 (0.0%) |
Employment Characteristics in Chilton
Employment by Class of Employer in Chilton
Among the 358 employed individuals in Chilton, private company employees (189 | 52.8%), federal government employees (68 | 19.0%), and local government employees (56 | 15.6%) make up the most common classes of employment.
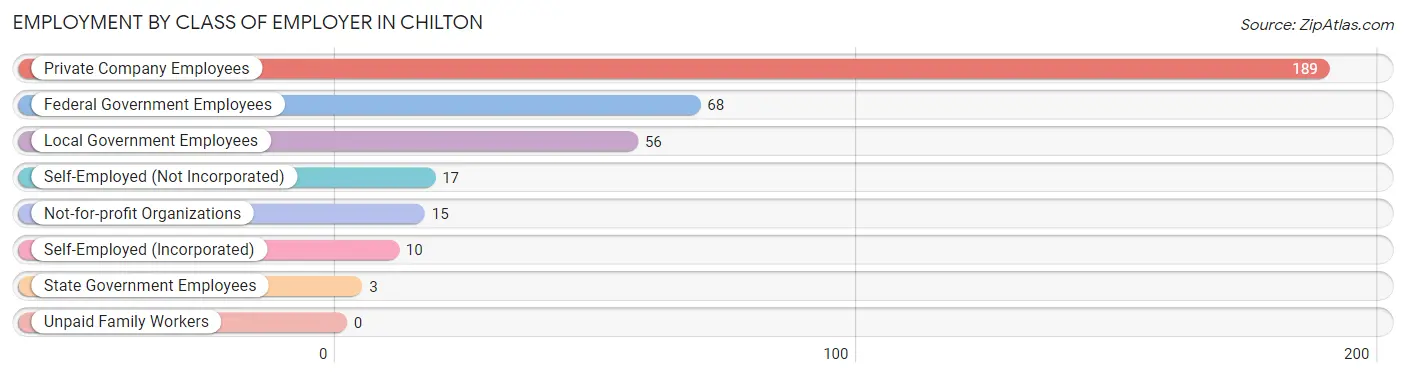
| Employer Class | # Employees | % Employees |
| Private Company Employees | 189 | 52.8% |
| Self-Employed (Incorporated) | 10 | 2.8% |
| Self-Employed (Not Incorporated) | 17 | 4.8% |
| Not-for-profit Organizations | 15 | 4.2% |
| Local Government Employees | 56 | 15.6% |
| State Government Employees | 3 | 0.8% |
| Federal Government Employees | 68 | 19.0% |
| Unpaid Family Workers | 0 | 0.0% |
| Total | 358 | 100.0% |
Employment Status by Age in Chilton
According to the labor force statistics for Chilton, out of the total population over 16 years of age (803), 65.5% or 526 individuals are in the labor force, with 28.3% or 149 of them unemployed. The age group with the highest labor force participation rate is 20 to 24 years, with 100.0% or 18 individuals in the labor force. Within the labor force, the 16 to 19 years age range has the highest percentage of unemployed individuals, with 75.0% or 45 of them being unemployed.
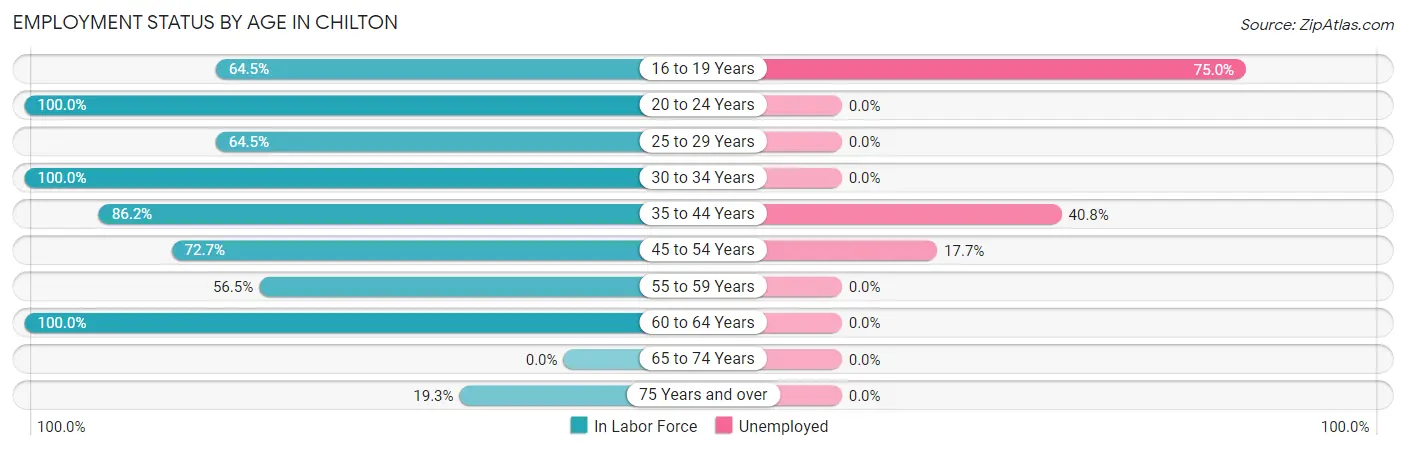
| Age Bracket | In Labor Force | Unemployed |
| 16 to 19 Years | 60 (64.5%) | 45 (75.0%) |
| 20 to 24 Years | 18 (100.0%) | 0 (0.0%) |
| 25 to 29 Years | 20 (64.5%) | 0 (0.0%) |
| 30 to 34 Years | 17 (100.0%) | 0 (0.0%) |
| 35 to 44 Years | 213 (86.2%) | 87 (40.8%) |
| 45 to 54 Years | 96 (72.7%) | 17 (17.7%) |
| 55 to 59 Years | 52 (56.5%) | 0 (0.0%) |
| 60 to 64 Years | 39 (100.0%) | 0 (0.0%) |
| 65 to 74 Years | 0 (0.0%) | 0 (0.0%) |
| 75 Years and over | 11 (19.3%) | 0 (0.0%) |
| Total | 526 (65.5%) | 149 (28.3%) |
Employment Status by Educational Attainment in Chilton
According to labor force statistics for Chilton, 78.3% of individuals (437) out of the total population between 25 and 64 years of age (558) are in the labor force, with 23.8% or 104 of them being unemployed. The group with the highest labor force participation rate are those with the educational attainment of college / associate degree, with 95.4% or 146 individuals in the labor force. Within the labor force, individuals with college / associate degree education have the highest percentage of unemployment, with 59.6% or 87 of them being unemployed.
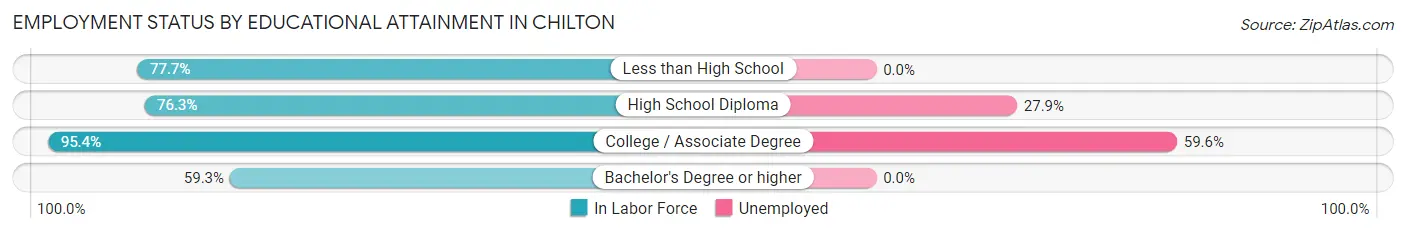
| Educational Attainment | In Labor Force | Unemployed |
| Less than High School | 157 (77.7%) | 0 (0.0%) |
| High School Diploma | 61 (76.3%) | 22 (27.9%) |
| College / Associate Degree | 146 (95.4%) | 91 (59.6%) |
| Bachelor's Degree or higher | 73 (59.3%) | 0 (0.0%) |
| Total | 437 (78.3%) | 133 (23.8%) |
Employment Occupations by Sex in Chilton
Management, Business, Science and Arts Occupations
The most common Management, Business, Science and Arts occupations in Chilton are Community & Social Service (15 | 4.0%), Education Instruction & Library (15 | 4.0%), Business & Financial (10 | 2.6%), Health Diagnosing & Treating (10 | 2.6%), and Health Technologists (10 | 2.6%).
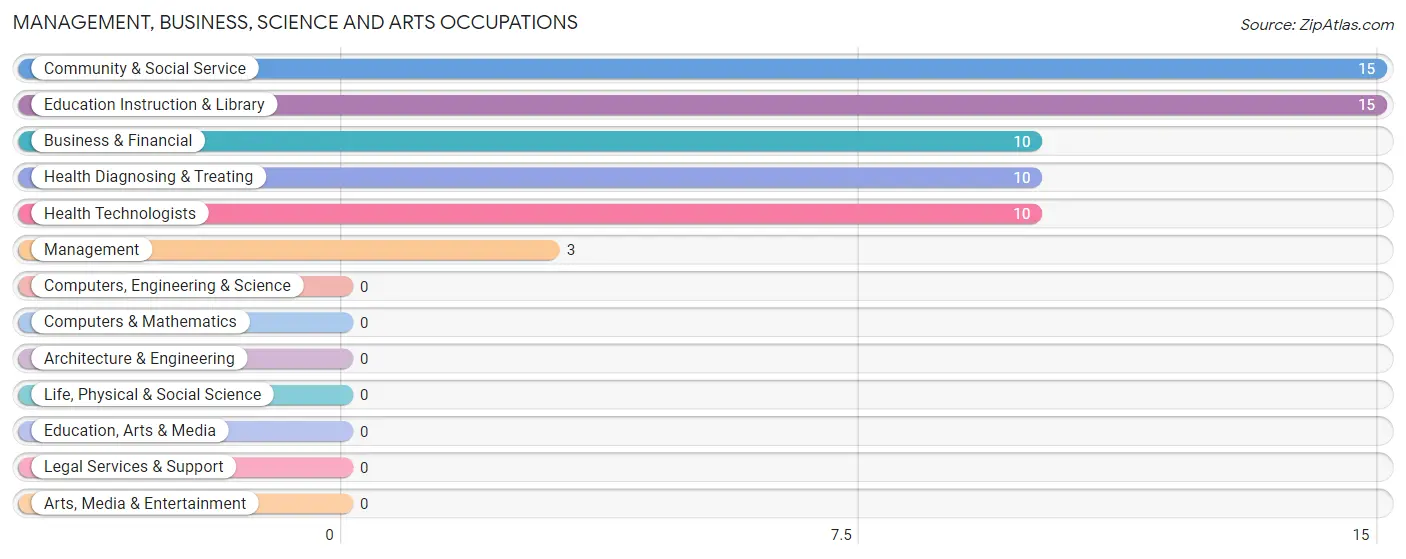
Management, Business, Science and Arts Occupations by Sex
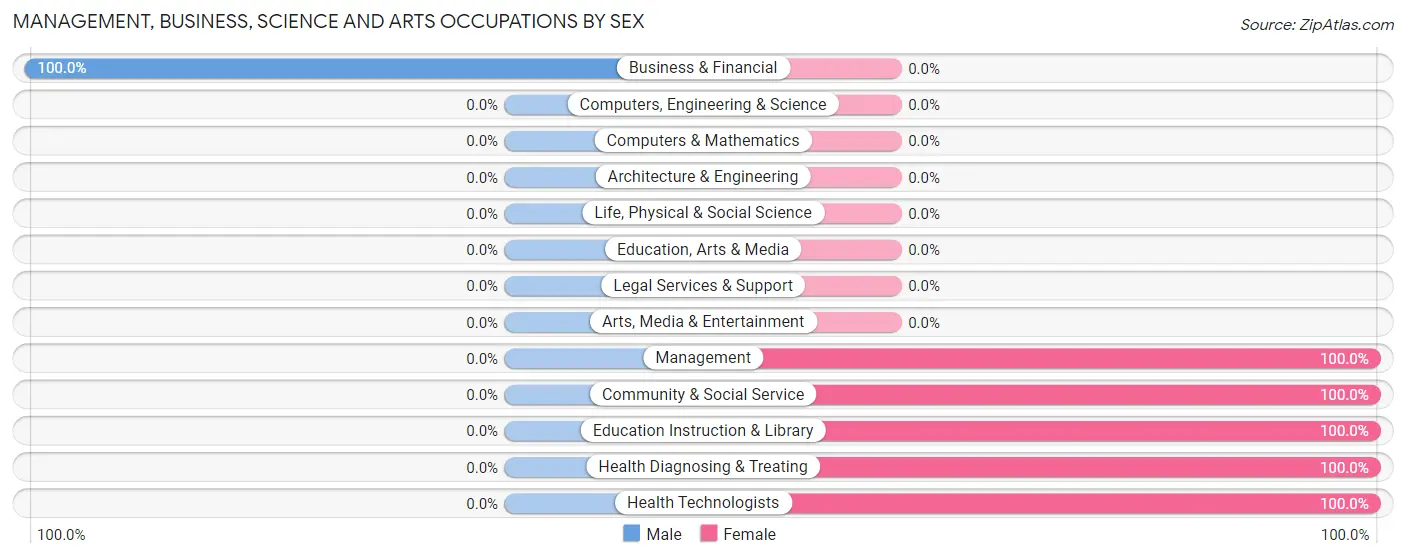
| Occupation | Male | Female |
| Management | 0 (0.0%) | 3 (100.0%) |
| Business & Financial | 10 (100.0%) | 0 (0.0%) |
| Computers, Engineering & Science | 0 (0.0%) | 0 (0.0%) |
| Computers & Mathematics | 0 (0.0%) | 0 (0.0%) |
| Architecture & Engineering | 0 (0.0%) | 0 (0.0%) |
| Life, Physical & Social Science | 0 (0.0%) | 0 (0.0%) |
| Community & Social Service | 0 (0.0%) | 15 (100.0%) |
| Education, Arts & Media | 0 (0.0%) | 0 (0.0%) |
| Legal Services & Support | 0 (0.0%) | 0 (0.0%) |
| Education Instruction & Library | 0 (0.0%) | 15 (100.0%) |
| Arts, Media & Entertainment | 0 (0.0%) | 0 (0.0%) |
| Health Diagnosing & Treating | 0 (0.0%) | 10 (100.0%) |
| Health Technologists | 0 (0.0%) | 10 (100.0%) |
| Total (Category) | 10 (26.3%) | 28 (73.7%) |
| Total (Overall) | 174 (46.2%) | 203 (53.8%) |
Services Occupations
The most common Services occupations in Chilton are Cleaning & Maintenance (128 | 34.0%), and Personal Care & Service (15 | 4.0%).
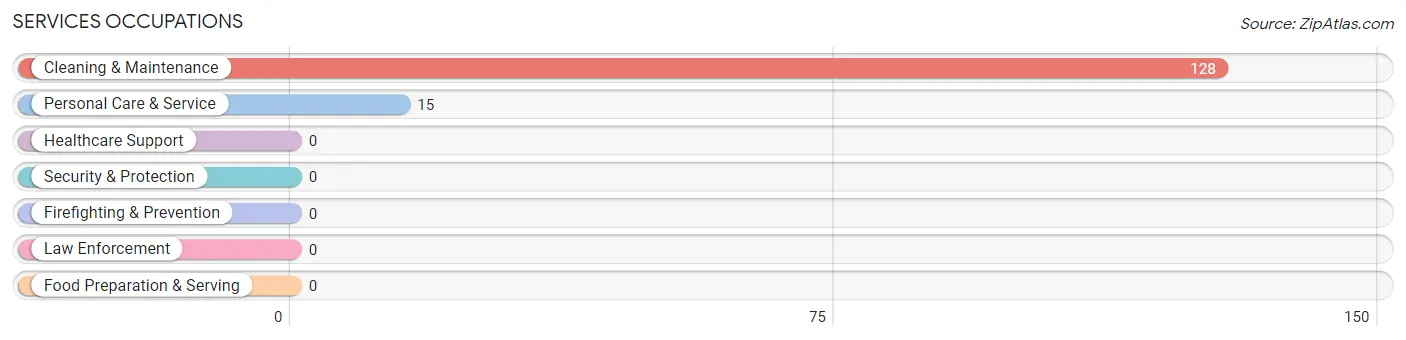
Services Occupations by Sex
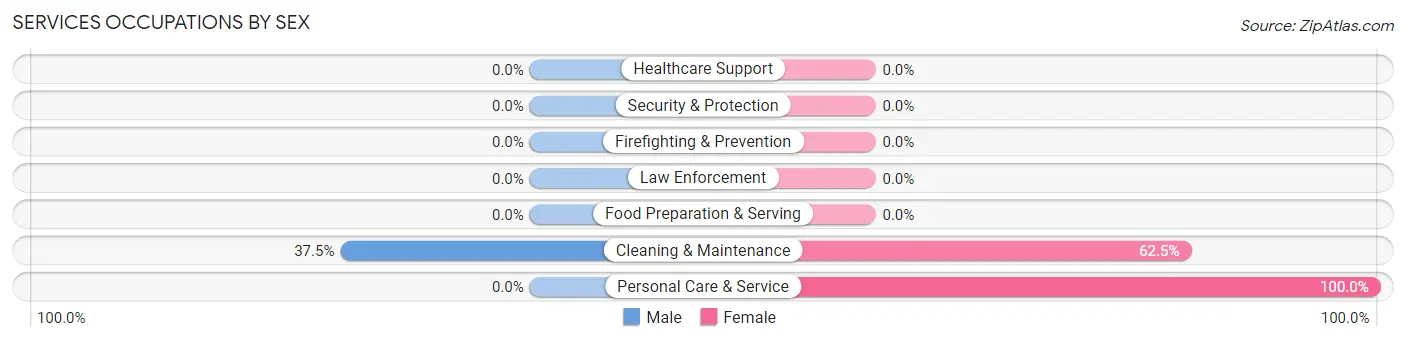
| Occupation | Male | Female |
| Healthcare Support | 0 (0.0%) | 0 (0.0%) |
| Security & Protection | 0 (0.0%) | 0 (0.0%) |
| Firefighting & Prevention | 0 (0.0%) | 0 (0.0%) |
| Law Enforcement | 0 (0.0%) | 0 (0.0%) |
| Food Preparation & Serving | 0 (0.0%) | 0 (0.0%) |
| Cleaning & Maintenance | 48 (37.5%) | 80 (62.5%) |
| Personal Care & Service | 0 (0.0%) | 15 (100.0%) |
| Total (Category) | 48 (33.6%) | 95 (66.4%) |
| Total (Overall) | 174 (46.2%) | 203 (53.8%) |
Sales and Office Occupations
The most common Sales and Office occupations in Chilton are Office & Administration (82 | 21.7%), and Sales & Related (18 | 4.8%).
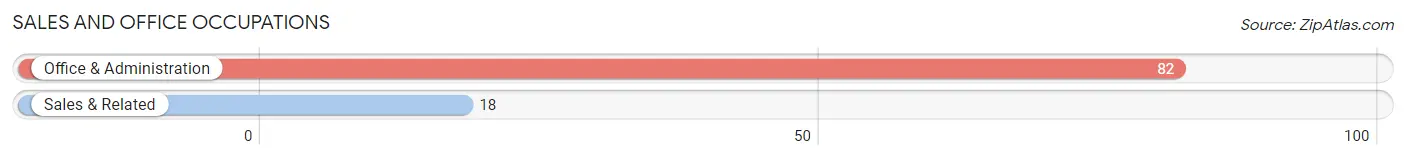
Sales and Office Occupations by Sex
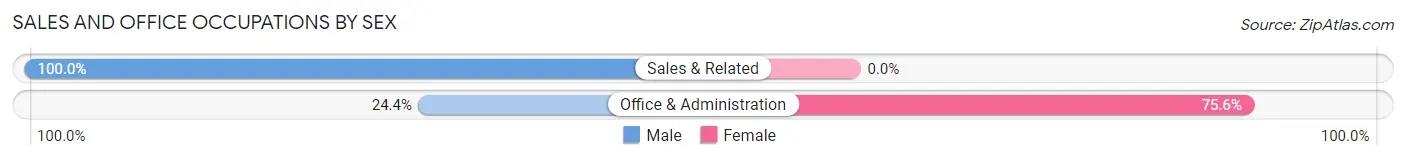
| Occupation | Male | Female |
| Sales & Related | 18 (100.0%) | 0 (0.0%) |
| Office & Administration | 20 (24.4%) | 62 (75.6%) |
| Total (Category) | 38 (38.0%) | 62 (62.0%) |
| Total (Overall) | 174 (46.2%) | 203 (53.8%) |
Natural Resources, Construction and Maintenance Occupations
The most common Natural Resources, Construction and Maintenance occupations in Chilton are , and Construction & Extraction (47 | 12.5%).
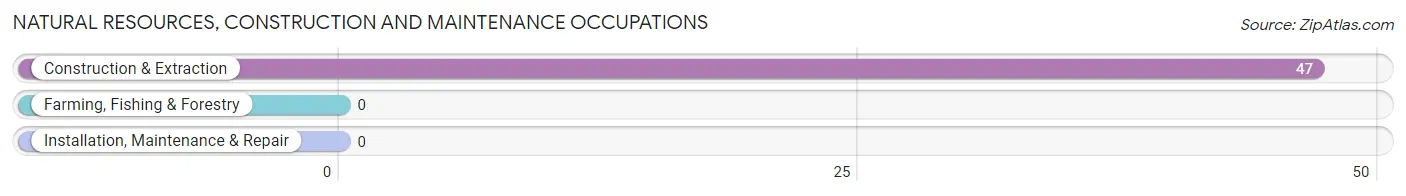
Natural Resources, Construction and Maintenance Occupations by Sex
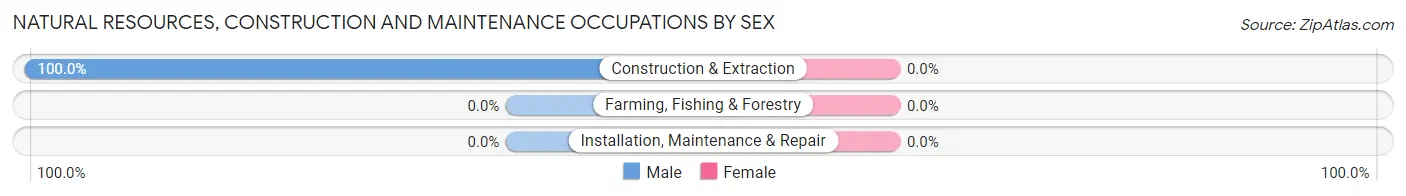
| Occupation | Male | Female |
| Farming, Fishing & Forestry | 0 (0.0%) | 0 (0.0%) |
| Construction & Extraction | 47 (100.0%) | 0 (0.0%) |
| Installation, Maintenance & Repair | 0 (0.0%) | 0 (0.0%) |
| Total (Category) | 47 (100.0%) | 0 (0.0%) |
| Total (Overall) | 174 (46.2%) | 203 (53.8%) |
Production, Transportation and Moving Occupations
The most common Production, Transportation and Moving occupations in Chilton are Transportation (31 | 8.2%), Material Moving (14 | 3.7%), and Production (4 | 1.1%).
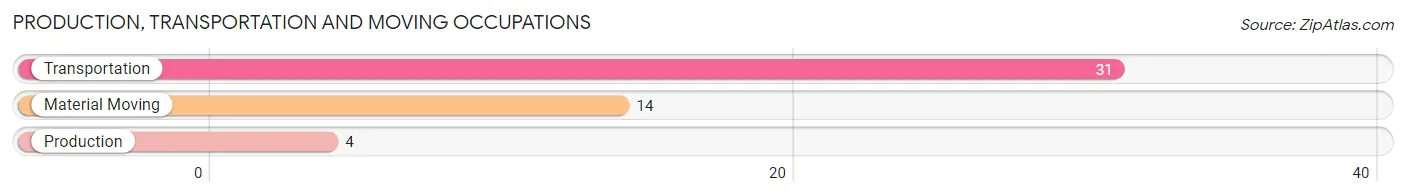
Production, Transportation and Moving Occupations by Sex
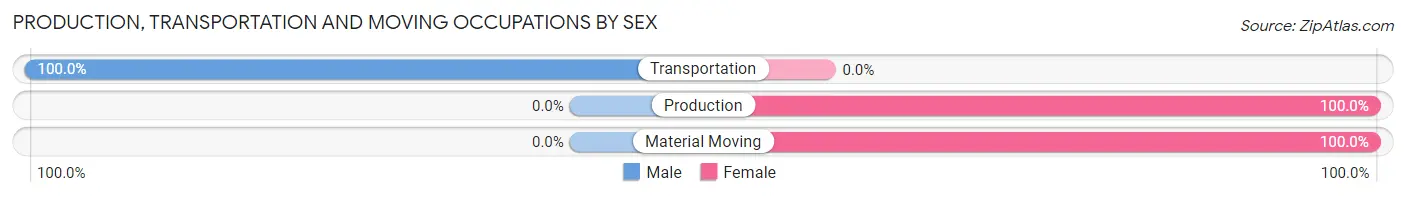
| Occupation | Male | Female |
| Production | 0 (0.0%) | 4 (100.0%) |
| Transportation | 31 (100.0%) | 0 (0.0%) |
| Material Moving | 0 (0.0%) | 14 (100.0%) |
| Total (Category) | 31 (63.3%) | 18 (36.7%) |
| Total (Overall) | 174 (46.2%) | 203 (53.8%) |
Employment Industries by Sex in Chilton
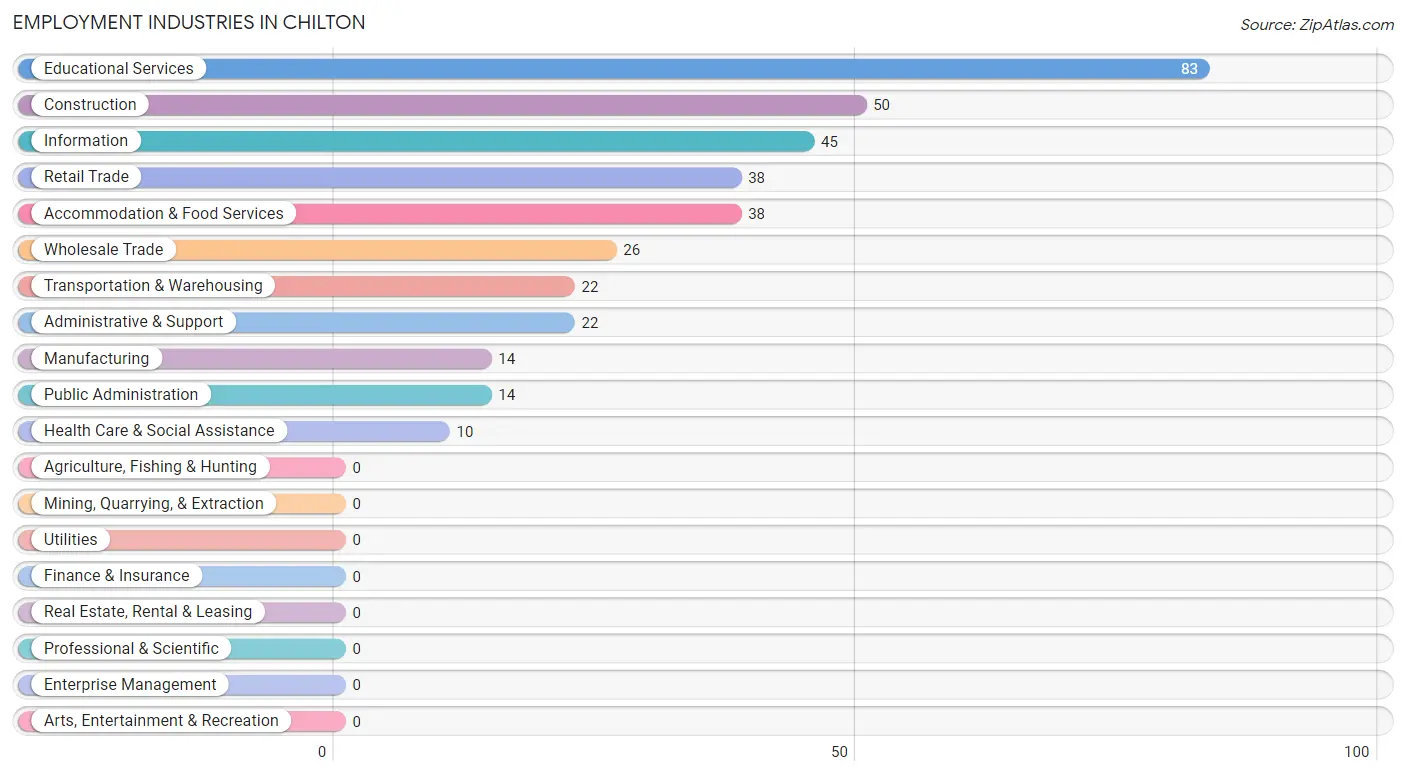
Employment Industries in Chilton
The major employment industries in Chilton include Educational Services (83 | 22.0%), Construction (50 | 13.3%), Information (45 | 11.9%), Retail Trade (38 | 10.1%), and Accommodation & Food Services (38 | 10.1%).
Employment Industries by Sex in Chilton
The Chilton industries that see more men than women are Retail Trade (100.0%), Transportation & Warehousing (100.0%), and Administrative & Support (100.0%), whereas the industries that tend to have a higher number of women are Information (100.0%), Educational Services (100.0%), and Health Care & Social Assistance (100.0%).
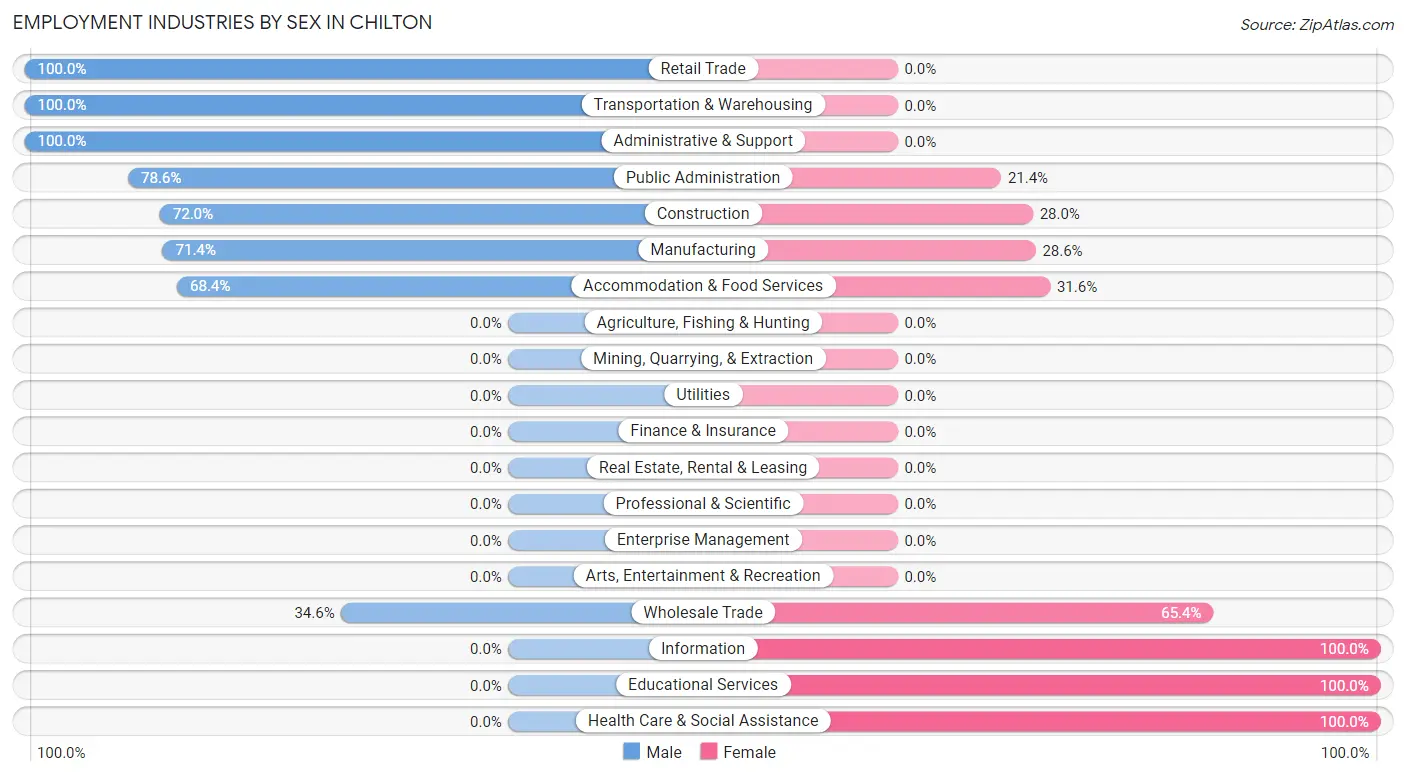
| Industry | Male | Female |
| Agriculture, Fishing & Hunting | 0 (0.0%) | 0 (0.0%) |
| Mining, Quarrying, & Extraction | 0 (0.0%) | 0 (0.0%) |
| Construction | 36 (72.0%) | 14 (28.0%) |
| Manufacturing | 10 (71.4%) | 4 (28.6%) |
| Wholesale Trade | 9 (34.6%) | 17 (65.4%) |
| Retail Trade | 38 (100.0%) | 0 (0.0%) |
| Transportation & Warehousing | 22 (100.0%) | 0 (0.0%) |
| Utilities | 0 (0.0%) | 0 (0.0%) |
| Information | 0 (0.0%) | 45 (100.0%) |
| Finance & Insurance | 0 (0.0%) | 0 (0.0%) |
| Real Estate, Rental & Leasing | 0 (0.0%) | 0 (0.0%) |
| Professional & Scientific | 0 (0.0%) | 0 (0.0%) |
| Enterprise Management | 0 (0.0%) | 0 (0.0%) |
| Administrative & Support | 22 (100.0%) | 0 (0.0%) |
| Educational Services | 0 (0.0%) | 83 (100.0%) |
| Health Care & Social Assistance | 0 (0.0%) | 10 (100.0%) |
| Arts, Entertainment & Recreation | 0 (0.0%) | 0 (0.0%) |
| Accommodation & Food Services | 26 (68.4%) | 12 (31.6%) |
| Public Administration | 11 (78.6%) | 3 (21.4%) |
| Total | 174 (46.2%) | 203 (53.8%) |
Education in Chilton
School Enrollment in Chilton
The most common levels of schooling among the 368 students in Chilton are elementary school (113 | 30.7%), middle school (94 | 25.5%), and college / undergraduate (87 | 23.6%).
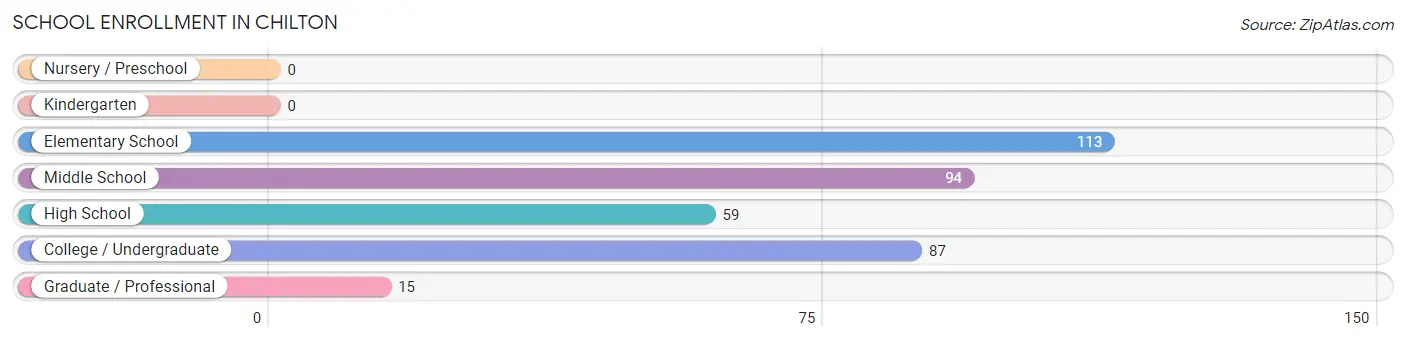
| School Level | # Students | % Students |
| Nursery / Preschool | 0 | 0.0% |
| Kindergarten | 0 | 0.0% |
| Elementary School | 113 | 30.7% |
| Middle School | 94 | 25.5% |
| High School | 59 | 16.0% |
| College / Undergraduate | 87 | 23.6% |
| Graduate / Professional | 15 | 4.1% |
| Total | 368 | 100.0% |
School Enrollment by Age by Funding Source in Chilton
Out of a total of 368 students who are enrolled in schools in Chilton, 42 (11.4%) attend a private institution, while the remaining 326 (88.6%) are enrolled in public schools. The age group of 15 to 17 year olds has the highest likelihood of being enrolled in private schools, with 18 (30.0% in the age bracket) enrolled. Conversely, the age group of 5 to 9 year old has the lowest likelihood of being enrolled in a private school, with 113 (100.0% in the age bracket) attending a public institution.
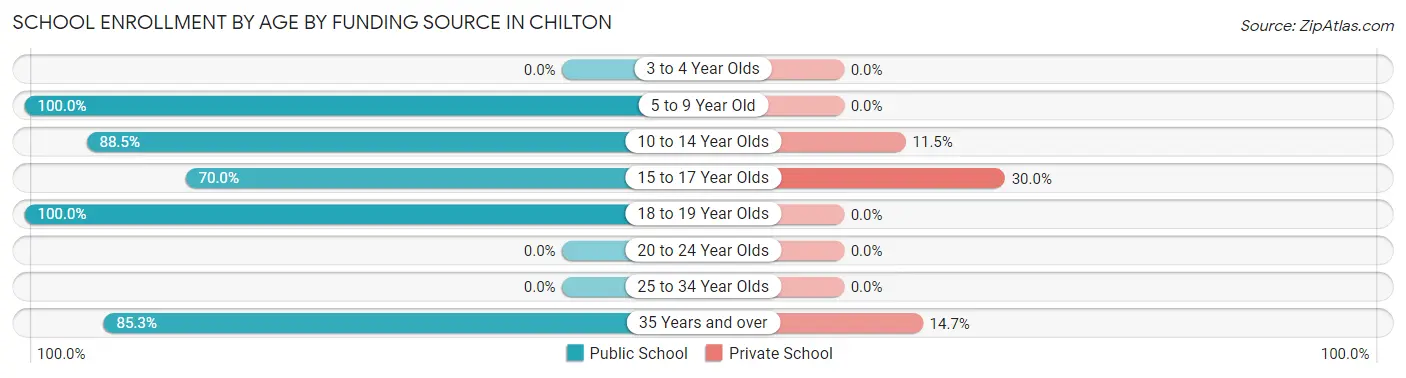
| Age Bracket | Public School | Private School |
| 3 to 4 Year Olds | 0 (0.0%) | 0 (0.0%) |
| 5 to 9 Year Old | 113 (100.0%) | 0 (0.0%) |
| 10 to 14 Year Olds | 69 (88.5%) | 9 (11.5%) |
| 15 to 17 Year Olds | 42 (70.0%) | 18 (30.0%) |
| 18 to 19 Year Olds | 15 (100.0%) | 0 (0.0%) |
| 20 to 24 Year Olds | 0 (0.0%) | 0 (0.0%) |
| 25 to 34 Year Olds | 0 (0.0%) | 0 (0.0%) |
| 35 Years and over | 87 (85.3%) | 15 (14.7%) |
| Total | 326 (88.6%) | 42 (11.4%) |
Educational Attainment by Field of Study in Chilton
Liberal arts & history (70 | 50.0%), education (25 | 17.9%), business (17 | 12.1%), literature & languages (15 | 10.7%), and arts & humanities (13 | 9.3%) are the most common fields of study among 140 individuals in Chilton who have obtained a bachelor's degree or higher.
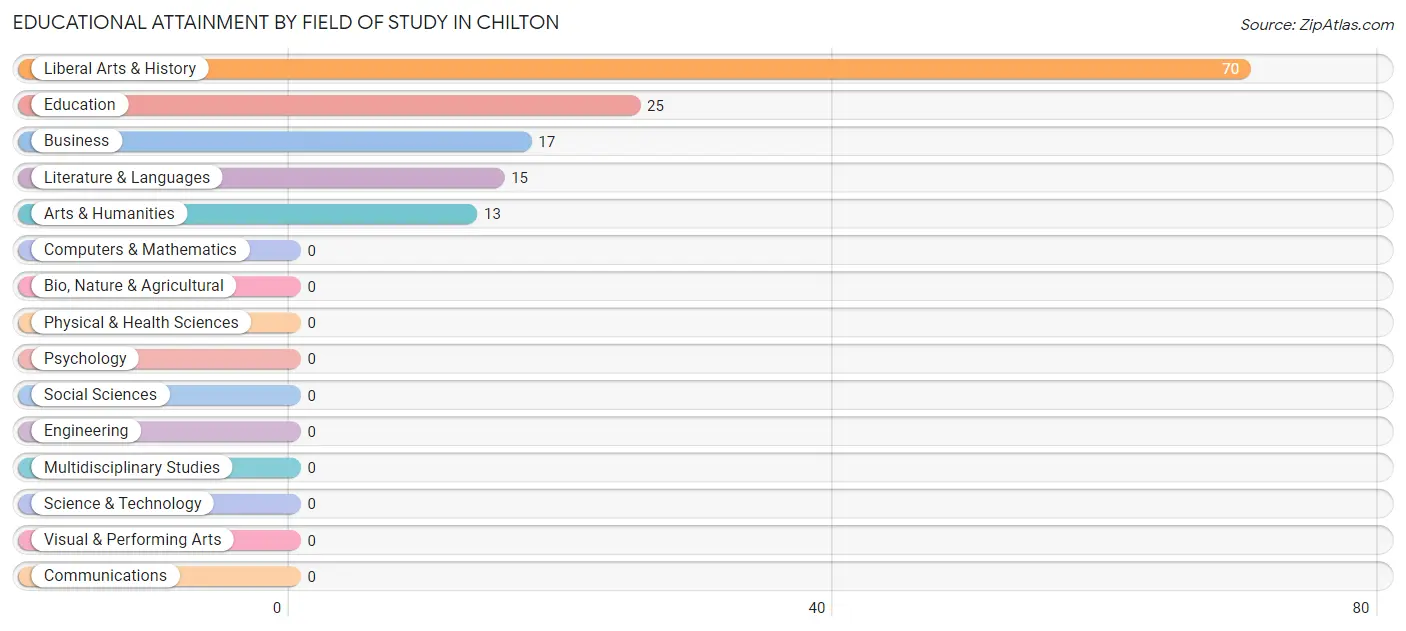
| Field of Study | # Graduates | % Graduates |
| Computers & Mathematics | 0 | 0.0% |
| Bio, Nature & Agricultural | 0 | 0.0% |
| Physical & Health Sciences | 0 | 0.0% |
| Psychology | 0 | 0.0% |
| Social Sciences | 0 | 0.0% |
| Engineering | 0 | 0.0% |
| Multidisciplinary Studies | 0 | 0.0% |
| Science & Technology | 0 | 0.0% |
| Business | 17 | 12.1% |
| Education | 25 | 17.9% |
| Literature & Languages | 15 | 10.7% |
| Liberal Arts & History | 70 | 50.0% |
| Visual & Performing Arts | 0 | 0.0% |
| Communications | 0 | 0.0% |
| Arts & Humanities | 13 | 9.3% |
| Total | 140 | 100.0% |
Transportation & Commute in Chilton
Vehicle Availability by Sex in Chilton
The most prevalent vehicle ownership categories in Chilton are males with 2 vehicles (64, accounting for 41.3%) and females with 2 vehicles (22, making up 31.5%).
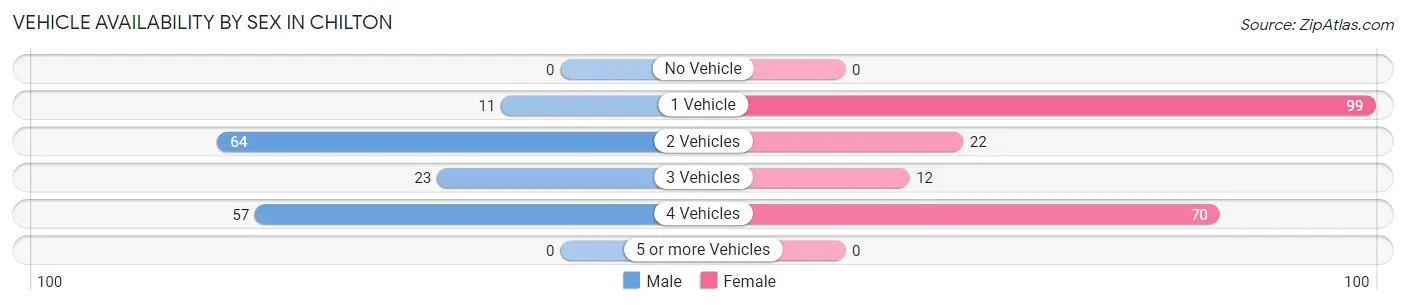
| Vehicles Available | Male | Female |
| No Vehicle | 0 (0.0%) | 0 (0.0%) |
| 1 Vehicle | 11 (7.1%) | 99 (48.8%) |
| 2 Vehicles | 64 (41.3%) | 22 (10.8%) |
| 3 Vehicles | 23 (14.8%) | 12 (5.9%) |
| 4 Vehicles | 57 (36.8%) | 70 (34.5%) |
| 5 or more Vehicles | 0 (0.0%) | 0 (0.0%) |
| Total | 155 (100.0%) | 203 (100.0%) |
Commute Time in Chilton
The most frequently occuring commute durations in Chilton are 30 to 34 minutes (116 commuters, 32.4%), 15 to 19 minutes (71 commuters, 19.8%), and 5 to 9 minutes (67 commuters, 18.7%).
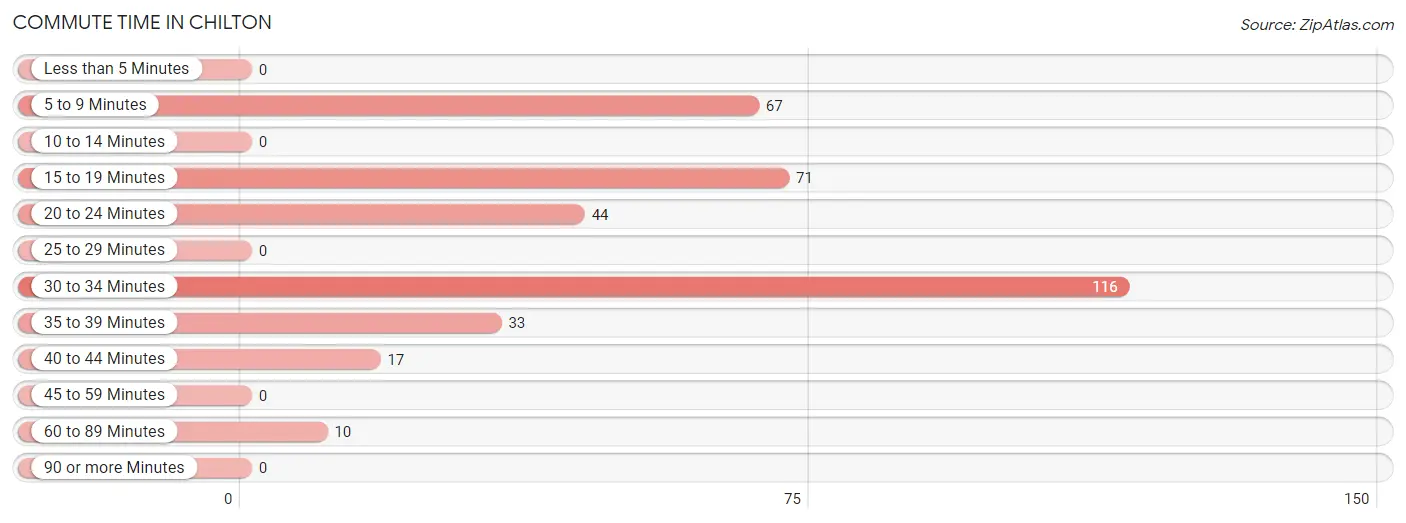
| Commute Time | # Commuters | % Commuters |
| Less than 5 Minutes | 0 | 0.0% |
| 5 to 9 Minutes | 67 | 18.7% |
| 10 to 14 Minutes | 0 | 0.0% |
| 15 to 19 Minutes | 71 | 19.8% |
| 20 to 24 Minutes | 44 | 12.3% |
| 25 to 29 Minutes | 0 | 0.0% |
| 30 to 34 Minutes | 116 | 32.4% |
| 35 to 39 Minutes | 33 | 9.2% |
| 40 to 44 Minutes | 17 | 4.8% |
| 45 to 59 Minutes | 0 | 0.0% |
| 60 to 89 Minutes | 10 | 2.8% |
| 90 or more Minutes | 0 | 0.0% |
Commute Time by Sex in Chilton
The most common commute times in Chilton are 5 to 9 minutes (67 commuters, 43.2%) for males and 30 to 34 minutes (105 commuters, 51.7%) for females.
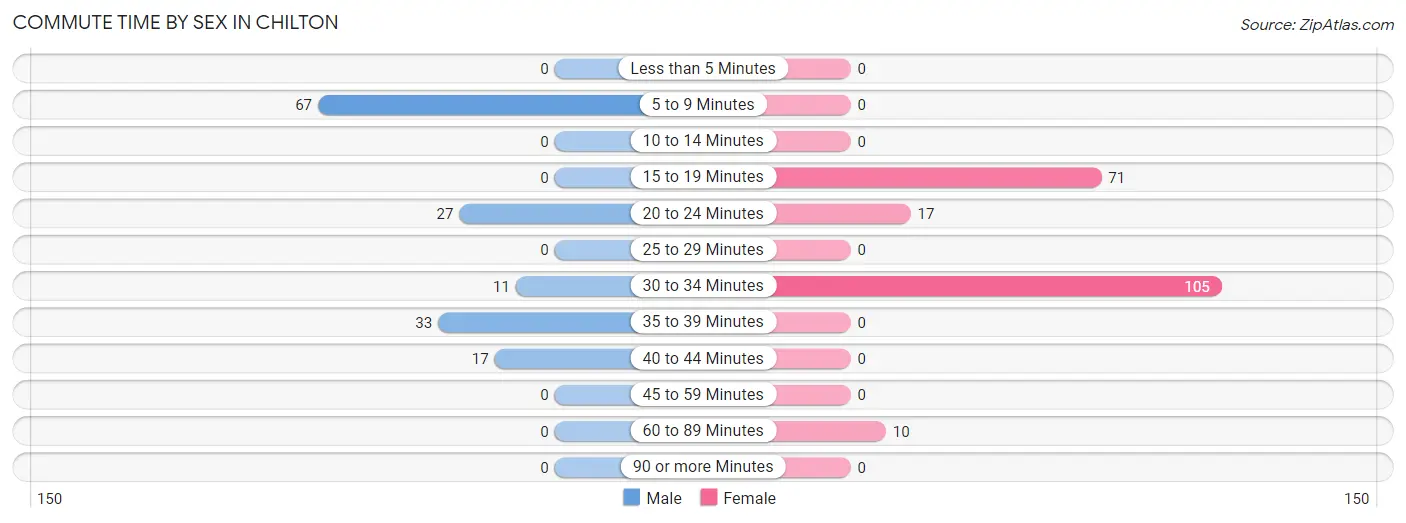
| Commute Time | Male | Female |
| Less than 5 Minutes | 0 (0.0%) | 0 (0.0%) |
| 5 to 9 Minutes | 67 (43.2%) | 0 (0.0%) |
| 10 to 14 Minutes | 0 (0.0%) | 0 (0.0%) |
| 15 to 19 Minutes | 0 (0.0%) | 71 (35.0%) |
| 20 to 24 Minutes | 27 (17.4%) | 17 (8.4%) |
| 25 to 29 Minutes | 0 (0.0%) | 0 (0.0%) |
| 30 to 34 Minutes | 11 (7.1%) | 105 (51.7%) |
| 35 to 39 Minutes | 33 (21.3%) | 0 (0.0%) |
| 40 to 44 Minutes | 17 (11.0%) | 0 (0.0%) |
| 45 to 59 Minutes | 0 (0.0%) | 0 (0.0%) |
| 60 to 89 Minutes | 0 (0.0%) | 10 (4.9%) |
| 90 or more Minutes | 0 (0.0%) | 0 (0.0%) |
Time of Departure to Work by Sex in Chilton
The most frequent times of departure to work in Chilton are 8:00 AM to 8:29 AM (64, 41.3%) for males and 7:30 AM to 7:59 AM (85, 41.9%) for females.
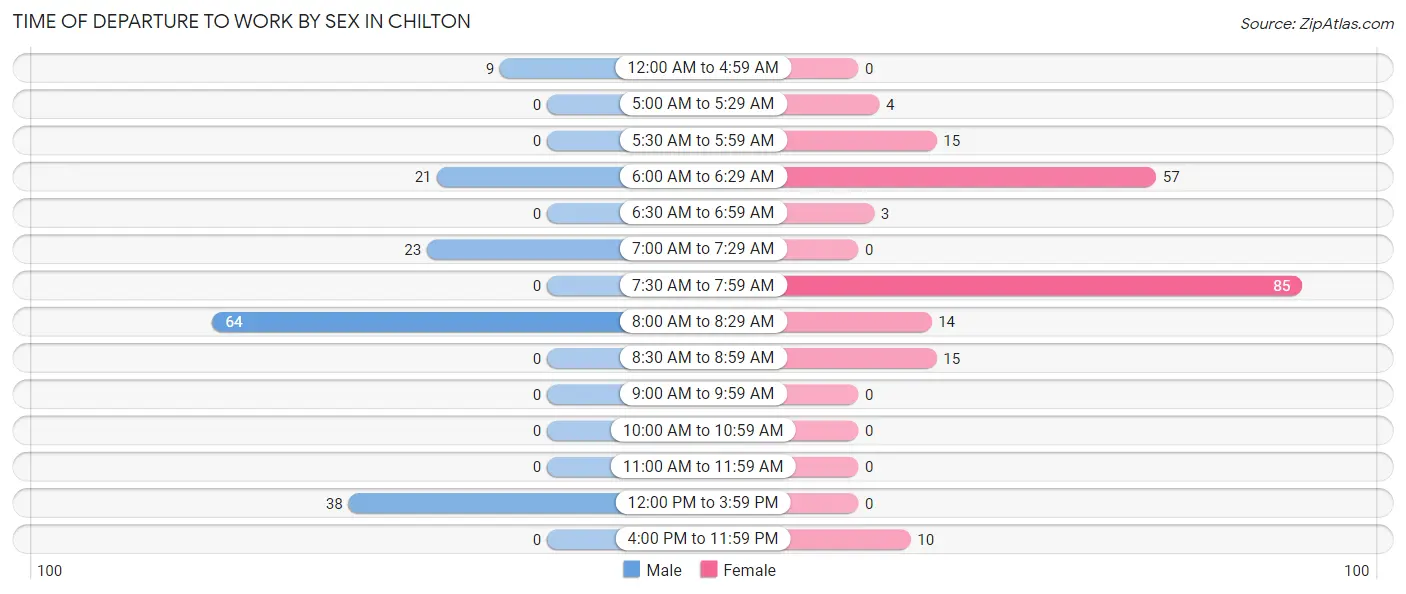
| Time of Departure | Male | Female |
| 12:00 AM to 4:59 AM | 9 (5.8%) | 0 (0.0%) |
| 5:00 AM to 5:29 AM | 0 (0.0%) | 4 (2.0%) |
| 5:30 AM to 5:59 AM | 0 (0.0%) | 15 (7.4%) |
| 6:00 AM to 6:29 AM | 21 (13.6%) | 57 (28.1%) |
| 6:30 AM to 6:59 AM | 0 (0.0%) | 3 (1.5%) |
| 7:00 AM to 7:29 AM | 23 (14.8%) | 0 (0.0%) |
| 7:30 AM to 7:59 AM | 0 (0.0%) | 85 (41.9%) |
| 8:00 AM to 8:29 AM | 64 (41.3%) | 14 (6.9%) |
| 8:30 AM to 8:59 AM | 0 (0.0%) | 15 (7.4%) |
| 9:00 AM to 9:59 AM | 0 (0.0%) | 0 (0.0%) |
| 10:00 AM to 10:59 AM | 0 (0.0%) | 0 (0.0%) |
| 11:00 AM to 11:59 AM | 0 (0.0%) | 0 (0.0%) |
| 12:00 PM to 3:59 PM | 38 (24.5%) | 0 (0.0%) |
| 4:00 PM to 11:59 PM | 0 (0.0%) | 10 (4.9%) |
| Total | 155 (100.0%) | 203 (100.0%) |
Housing Occupancy in Chilton
Occupancy by Ownership in Chilton
Of the total 282 dwellings in Chilton, owner-occupied units account for 214 (75.9%), while renter-occupied units make up 68 (24.1%).
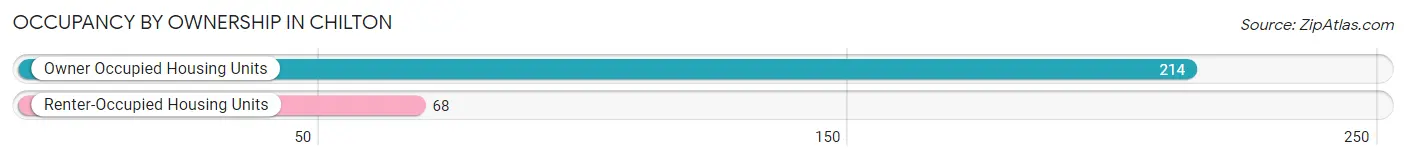
| Occupancy | # Housing Units | % Housing Units |
| Owner Occupied Housing Units | 214 | 75.9% |
| Renter-Occupied Housing Units | 68 | 24.1% |
| Total Occupied Housing Units | 282 | 100.0% |
Occupancy by Household Size in Chilton
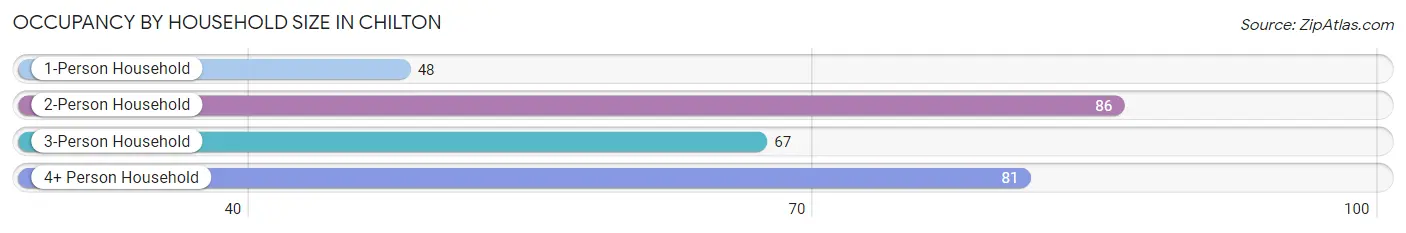
| Household Size | # Housing Units | % Housing Units |
| 1-Person Household | 48 | 17.0% |
| 2-Person Household | 86 | 30.5% |
| 3-Person Household | 67 | 23.8% |
| 4+ Person Household | 81 | 28.7% |
| Total Housing Units | 282 | 100.0% |
Occupancy by Ownership by Household Size in Chilton
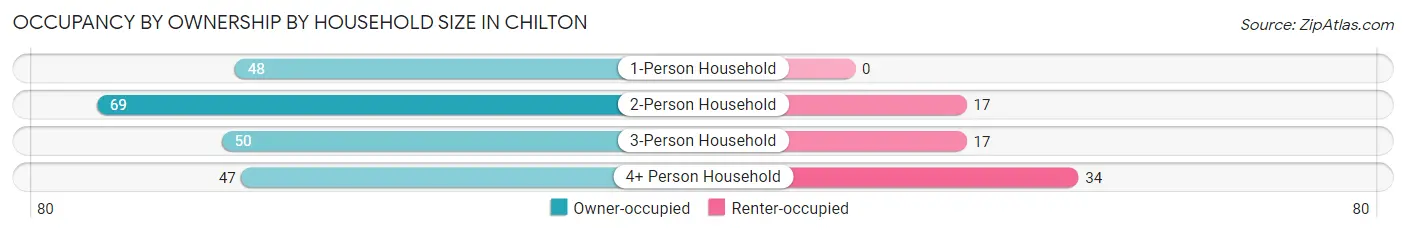
| Household Size | Owner-occupied | Renter-occupied |
| 1-Person Household | 48 (100.0%) | 0 (0.0%) |
| 2-Person Household | 69 (80.2%) | 17 (19.8%) |
| 3-Person Household | 50 (74.6%) | 17 (25.4%) |
| 4+ Person Household | 47 (58.0%) | 34 (42.0%) |
| Total Housing Units | 214 (75.9%) | 68 (24.1%) |
Occupancy by Educational Attainment in Chilton
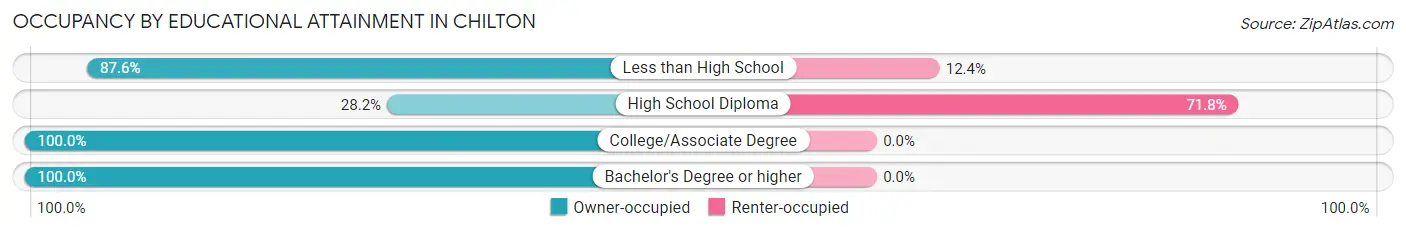
| Household Size | Owner-occupied | Renter-occupied |
| Less than High School | 120 (87.6%) | 17 (12.4%) |
| High School Diploma | 20 (28.2%) | 51 (71.8%) |
| College/Associate Degree | 26 (100.0%) | 0 (0.0%) |
| Bachelor's Degree or higher | 48 (100.0%) | 0 (0.0%) |
Occupancy by Age of Householder in Chilton
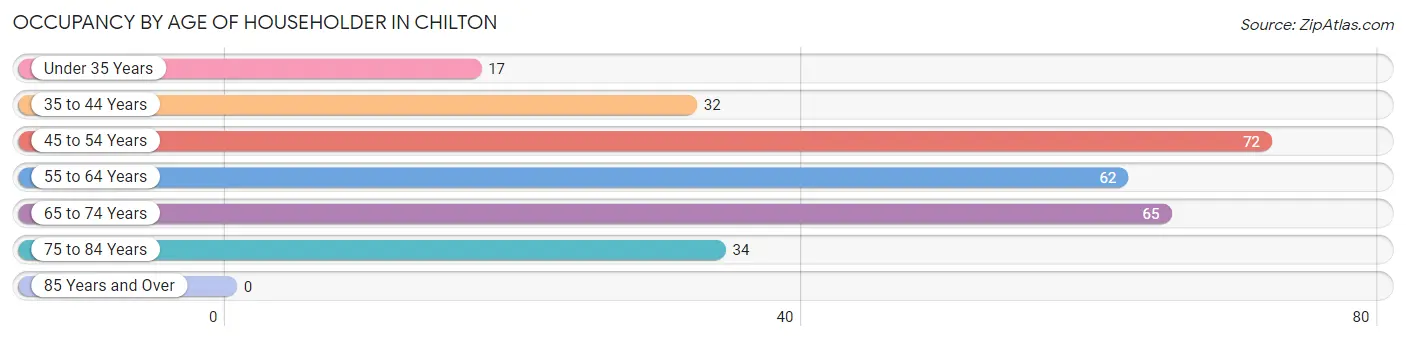
| Age Bracket | # Households | % Households |
| Under 35 Years | 17 | 6.0% |
| 35 to 44 Years | 32 | 11.4% |
| 45 to 54 Years | 72 | 25.5% |
| 55 to 64 Years | 62 | 22.0% |
| 65 to 74 Years | 65 | 23.1% |
| 75 to 84 Years | 34 | 12.1% |
| 85 Years and Over | 0 | 0.0% |
| Total | 282 | 100.0% |
Housing Finances in Chilton
Median Income by Occupancy in Chilton
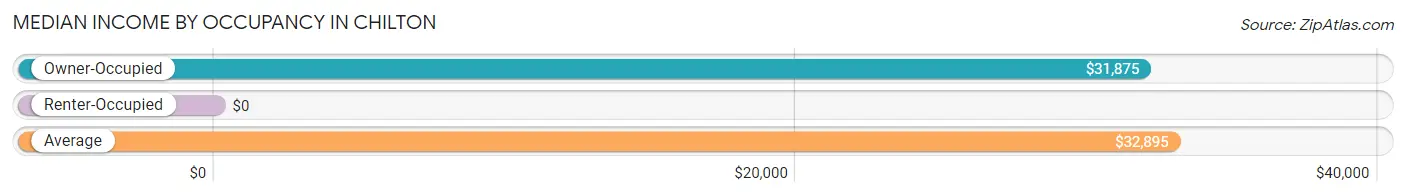
| Occupancy Type | # Households | Median Income |
| Owner-Occupied | 214 (75.9%) | $31,875 |
| Renter-Occupied | 68 (24.1%) | $0 |
| Average | 282 (100.0%) | $32,895 |
Occupancy by Householder Income Bracket in Chilton
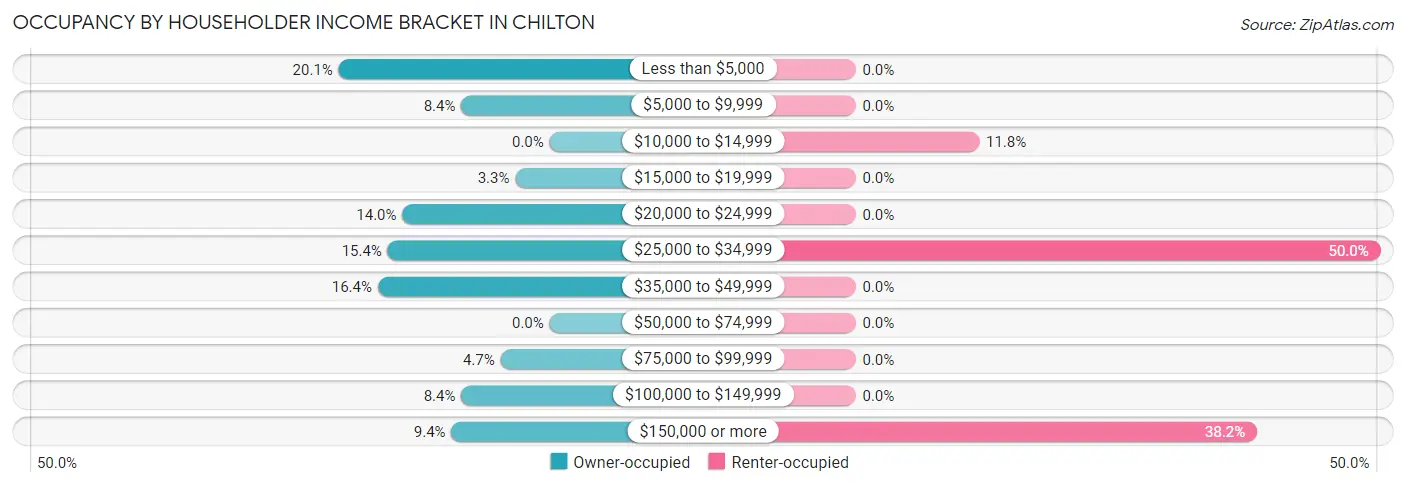
| Income Bracket | Owner-occupied | Renter-occupied |
| Less than $5,000 | 43 (20.1%) | 0 (0.0%) |
| $5,000 to $9,999 | 18 (8.4%) | 0 (0.0%) |
| $10,000 to $14,999 | 0 (0.0%) | 8 (11.8%) |
| $15,000 to $19,999 | 7 (3.3%) | 0 (0.0%) |
| $20,000 to $24,999 | 30 (14.0%) | 0 (0.0%) |
| $25,000 to $34,999 | 33 (15.4%) | 34 (50.0%) |
| $35,000 to $49,999 | 35 (16.4%) | 0 (0.0%) |
| $50,000 to $74,999 | 0 (0.0%) | 0 (0.0%) |
| $75,000 to $99,999 | 10 (4.7%) | 0 (0.0%) |
| $100,000 to $149,999 | 18 (8.4%) | 0 (0.0%) |
| $150,000 or more | 20 (9.3%) | 26 (38.2%) |
| Total | 214 (100.0%) | 68 (100.0%) |
Monthly Housing Cost Tiers in Chilton
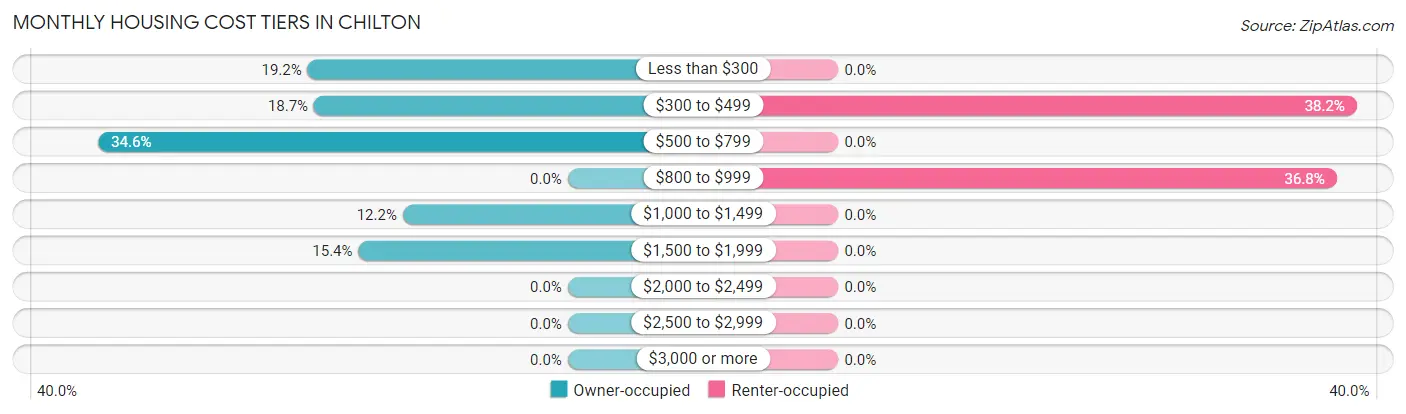
| Monthly Cost | Owner-occupied | Renter-occupied |
| Less than $300 | 41 (19.2%) | 0 (0.0%) |
| $300 to $499 | 40 (18.7%) | 26 (38.2%) |
| $500 to $799 | 74 (34.6%) | 0 (0.0%) |
| $800 to $999 | 0 (0.0%) | 25 (36.8%) |
| $1,000 to $1,499 | 26 (12.1%) | 0 (0.0%) |
| $1,500 to $1,999 | 33 (15.4%) | 0 (0.0%) |
| $2,000 to $2,499 | 0 (0.0%) | 0 (0.0%) |
| $2,500 to $2,999 | 0 (0.0%) | 0 (0.0%) |
| $3,000 or more | 0 (0.0%) | 0 (0.0%) |
| Total | 214 (100.0%) | 68 (100.0%) |
Physical Housing Characteristics in Chilton
Housing Structures in Chilton
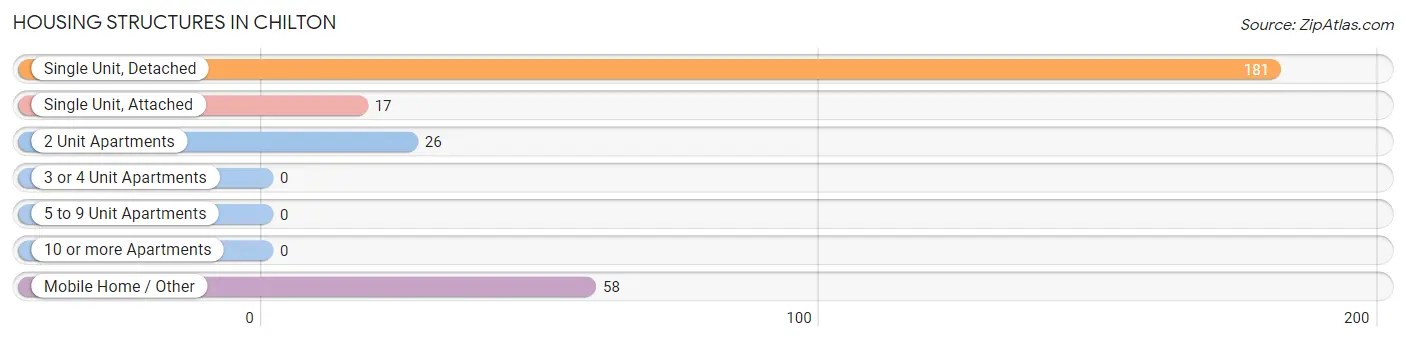
| Structure Type | # Housing Units | % Housing Units |
| Single Unit, Detached | 181 | 64.2% |
| Single Unit, Attached | 17 | 6.0% |
| 2 Unit Apartments | 26 | 9.2% |
| 3 or 4 Unit Apartments | 0 | 0.0% |
| 5 to 9 Unit Apartments | 0 | 0.0% |
| 10 or more Apartments | 0 | 0.0% |
| Mobile Home / Other | 58 | 20.6% |
| Total | 282 | 100.0% |
Housing Structures by Occupancy in Chilton
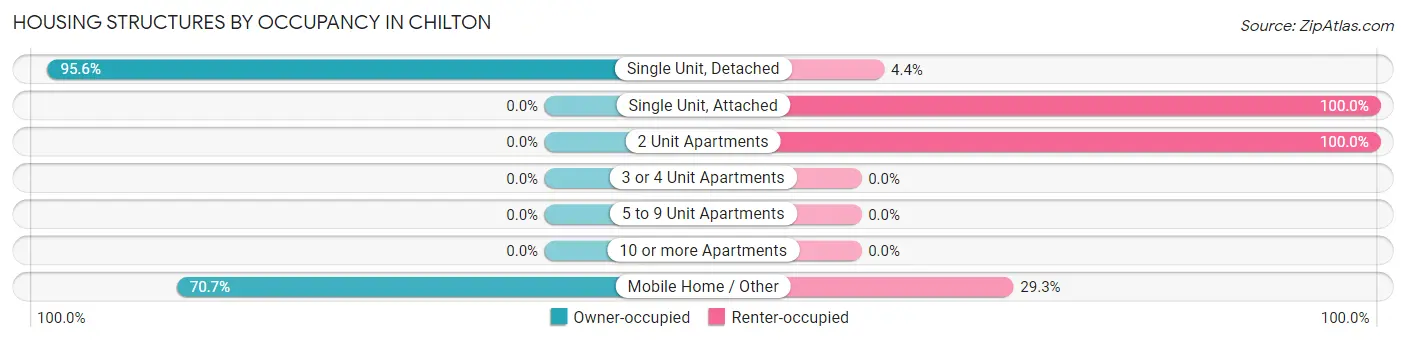
| Structure Type | Owner-occupied | Renter-occupied |
| Single Unit, Detached | 173 (95.6%) | 8 (4.4%) |
| Single Unit, Attached | 0 (0.0%) | 17 (100.0%) |
| 2 Unit Apartments | 0 (0.0%) | 26 (100.0%) |
| 3 or 4 Unit Apartments | 0 (0.0%) | 0 (0.0%) |
| 5 to 9 Unit Apartments | 0 (0.0%) | 0 (0.0%) |
| 10 or more Apartments | 0 (0.0%) | 0 (0.0%) |
| Mobile Home / Other | 41 (70.7%) | 17 (29.3%) |
| Total | 214 (75.9%) | 68 (24.1%) |
Housing Structures by Number of Rooms in Chilton
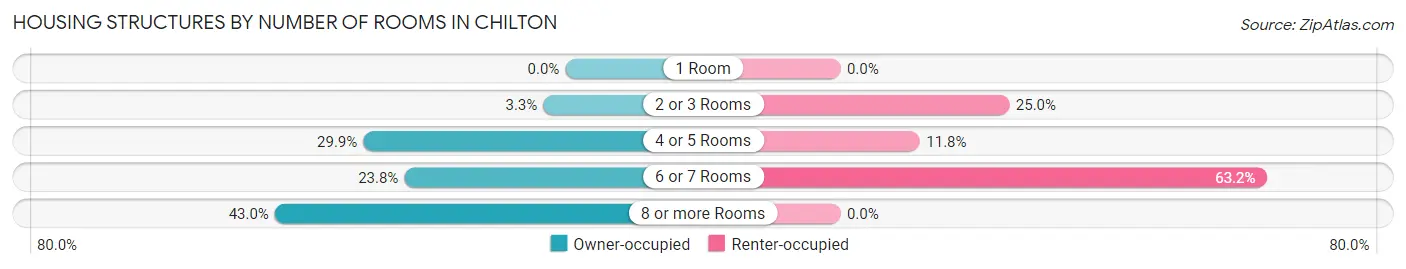
| Number of Rooms | Owner-occupied | Renter-occupied |
| 1 Room | 0 (0.0%) | 0 (0.0%) |
| 2 or 3 Rooms | 7 (3.3%) | 17 (25.0%) |
| 4 or 5 Rooms | 64 (29.9%) | 8 (11.8%) |
| 6 or 7 Rooms | 51 (23.8%) | 43 (63.2%) |
| 8 or more Rooms | 92 (43.0%) | 0 (0.0%) |
| Total | 214 (100.0%) | 68 (100.0%) |
Housing Structure by Heating Type in Chilton
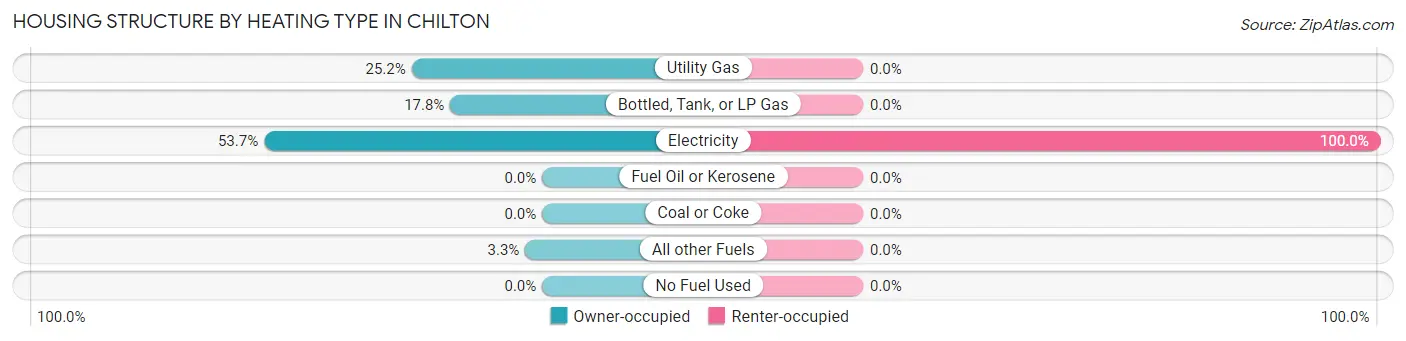
| Heating Type | Owner-occupied | Renter-occupied |
| Utility Gas | 54 (25.2%) | 0 (0.0%) |
| Bottled, Tank, or LP Gas | 38 (17.8%) | 0 (0.0%) |
| Electricity | 115 (53.7%) | 68 (100.0%) |
| Fuel Oil or Kerosene | 0 (0.0%) | 0 (0.0%) |
| Coal or Coke | 0 (0.0%) | 0 (0.0%) |
| All other Fuels | 7 (3.3%) | 0 (0.0%) |
| No Fuel Used | 0 (0.0%) | 0 (0.0%) |
| Total | 214 (100.0%) | 68 (100.0%) |
Household Vehicle Usage in Chilton
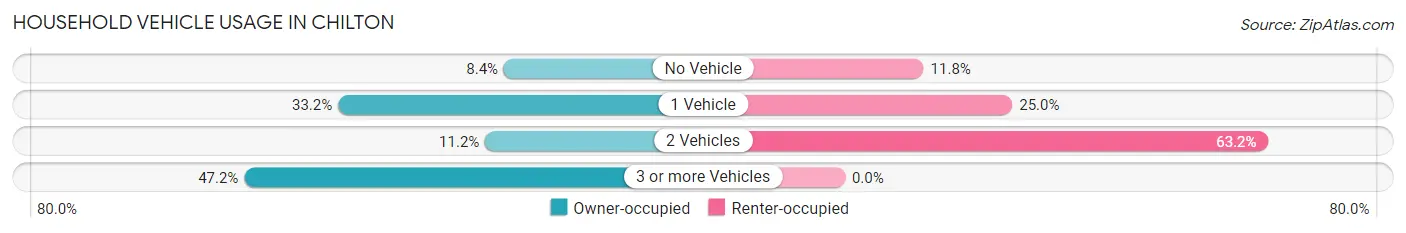
| Vehicles per Household | Owner-occupied | Renter-occupied |
| No Vehicle | 18 (8.4%) | 8 (11.8%) |
| 1 Vehicle | 71 (33.2%) | 17 (25.0%) |
| 2 Vehicles | 24 (11.2%) | 43 (63.2%) |
| 3 or more Vehicles | 101 (47.2%) | 0 (0.0%) |
| Total | 214 (100.0%) | 68 (100.0%) |
Real Estate & Mortgages in Chilton
Real Estate and Mortgage Overview in Chilton
| Characteristic | Without Mortgage | With Mortgage |
| Housing Units | 170 | 44 |
| Median Property Value | - | - |
| Median Household Income | $33,095 | $0 |
| Monthly Housing Costs | $540 | $0 |
| Real Estate Taxes | $1,341 | $0 |
Property Value by Mortgage Status in Chilton
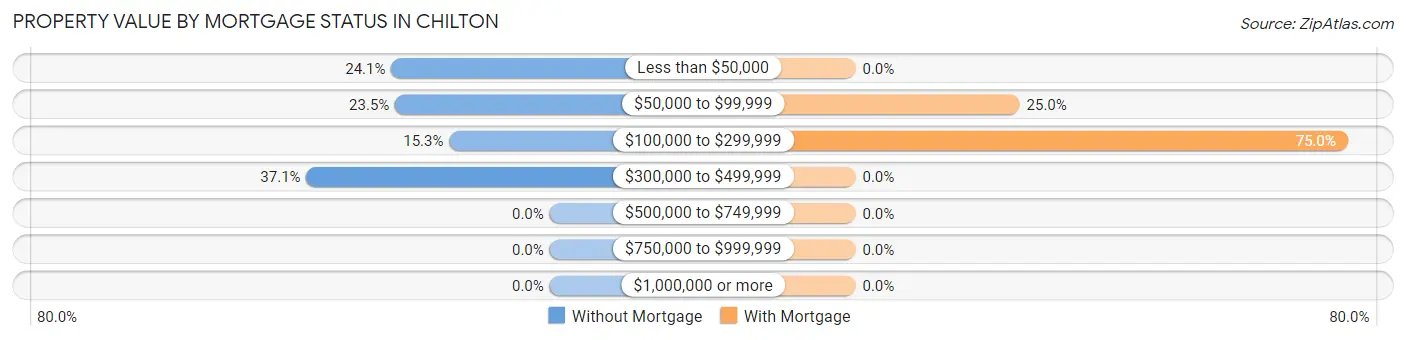
| Property Value | Without Mortgage | With Mortgage |
| Less than $50,000 | 41 (24.1%) | 0 (0.0%) |
| $50,000 to $99,999 | 40 (23.5%) | 11 (25.0%) |
| $100,000 to $299,999 | 26 (15.3%) | 33 (75.0%) |
| $300,000 to $499,999 | 63 (37.1%) | 0 (0.0%) |
| $500,000 to $749,999 | 0 (0.0%) | 0 (0.0%) |
| $750,000 to $999,999 | 0 (0.0%) | 0 (0.0%) |
| $1,000,000 or more | 0 (0.0%) | 0 (0.0%) |
| Total | 170 (100.0%) | 44 (100.0%) |
Household Income by Mortgage Status in Chilton
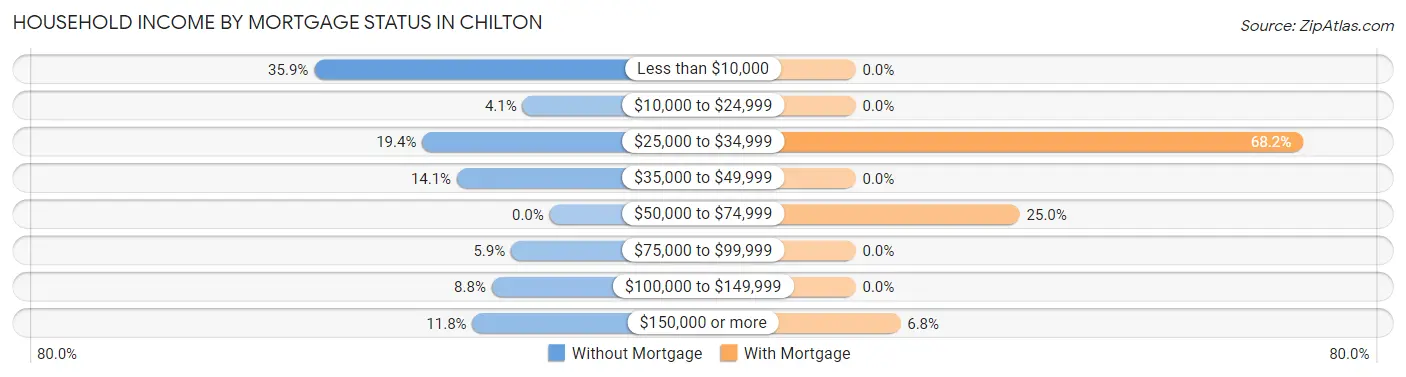
| Household Income | Without Mortgage | With Mortgage |
| Less than $10,000 | 61 (35.9%) | 0 (0.0%) |
| $10,000 to $24,999 | 7 (4.1%) | 0 (0.0%) |
| $25,000 to $34,999 | 33 (19.4%) | 30 (68.2%) |
| $35,000 to $49,999 | 24 (14.1%) | 0 (0.0%) |
| $50,000 to $74,999 | 0 (0.0%) | 11 (25.0%) |
| $75,000 to $99,999 | 10 (5.9%) | 0 (0.0%) |
| $100,000 to $149,999 | 15 (8.8%) | 0 (0.0%) |
| $150,000 or more | 20 (11.8%) | 3 (6.8%) |
| Total | 170 (100.0%) | 44 (100.0%) |
Property Value to Household Income Ratio in Chilton
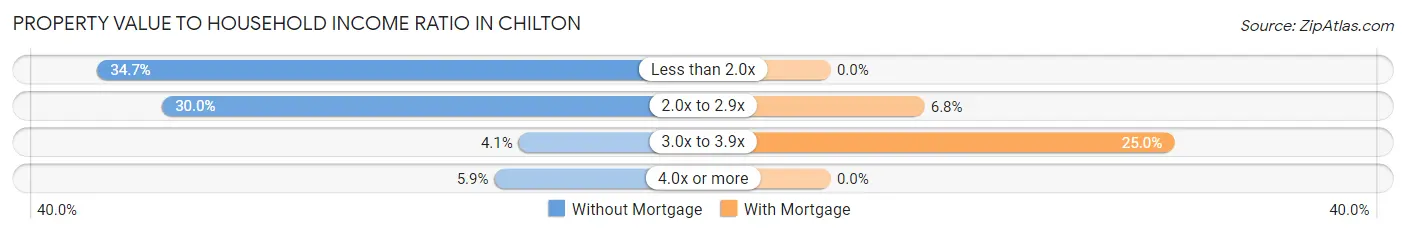
| Value-to-Income Ratio | Without Mortgage | With Mortgage |
| Less than 2.0x | 59 (34.7%) | 0 (0.0%) |
| 2.0x to 2.9x | 51 (30.0%) | 3 (6.8%) |
| 3.0x to 3.9x | 7 (4.1%) | 11 (25.0%) |
| 4.0x or more | 10 (5.9%) | 0 (0.0%) |
| Total | 170 (100.0%) | 44 (100.0%) |
Real Estate Taxes by Mortgage Status in Chilton
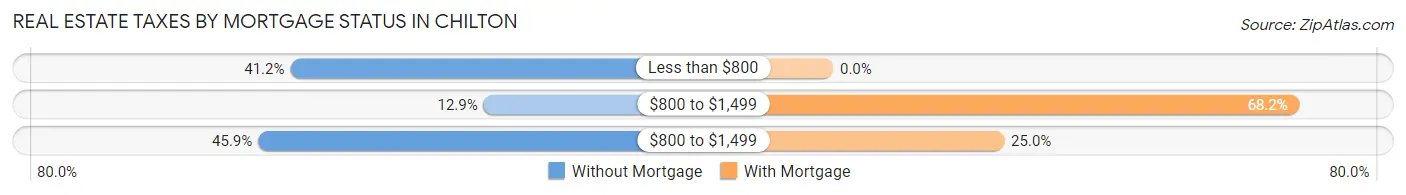
| Property Taxes | Without Mortgage | With Mortgage |
| Less than $800 | 70 (41.2%) | 0 (0.0%) |
| $800 to $1,499 | 22 (12.9%) | 30 (68.2%) |
| $800 to $1,499 | 78 (45.9%) | 11 (25.0%) |
| Total | 170 (100.0%) | 44 (100.0%) |
Health & Disability in Chilton
Health Insurance Coverage by Age in Chilton
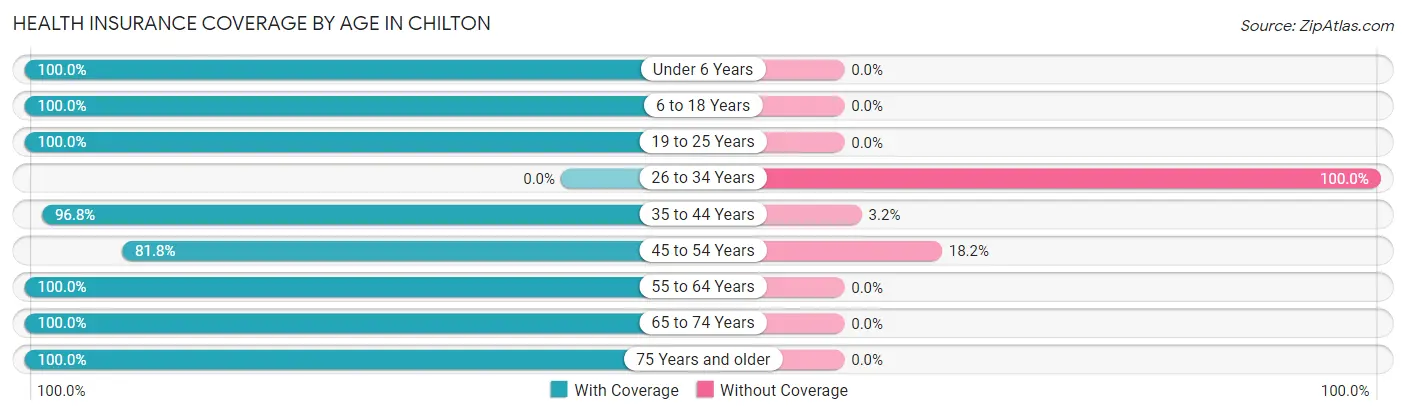
| Age Bracket | With Coverage | Without Coverage |
| Under 6 Years | 74 (100.0%) | 0 (0.0%) |
| 6 to 18 Years | 266 (100.0%) | 0 (0.0%) |
| 19 to 25 Years | 63 (100.0%) | 0 (0.0%) |
| 26 to 34 Years | 0 (0.0%) | 48 (100.0%) |
| 35 to 44 Years | 239 (96.8%) | 8 (3.2%) |
| 45 to 54 Years | 108 (81.8%) | 24 (18.2%) |
| 55 to 64 Years | 131 (100.0%) | 0 (0.0%) |
| 65 to 74 Years | 77 (100.0%) | 0 (0.0%) |
| 75 Years and older | 57 (100.0%) | 0 (0.0%) |
| Total | 1,015 (92.7%) | 80 (7.3%) |
Health Insurance Coverage by Citizenship Status in Chilton
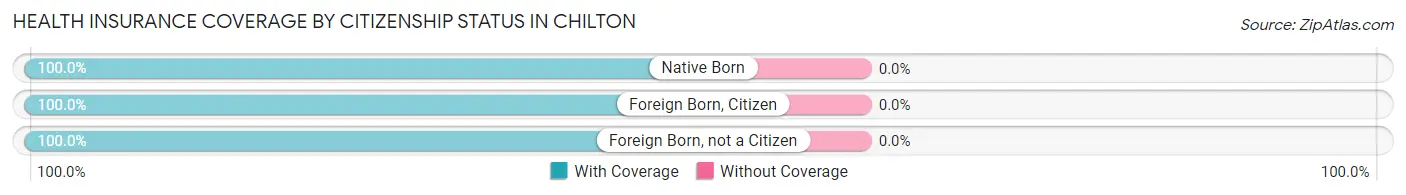
| Citizenship Status | With Coverage | Without Coverage |
| Native Born | 74 (100.0%) | 0 (0.0%) |
| Foreign Born, Citizen | 266 (100.0%) | 0 (0.0%) |
| Foreign Born, not a Citizen | 63 (100.0%) | 0 (0.0%) |
Health Insurance Coverage by Household Income in Chilton
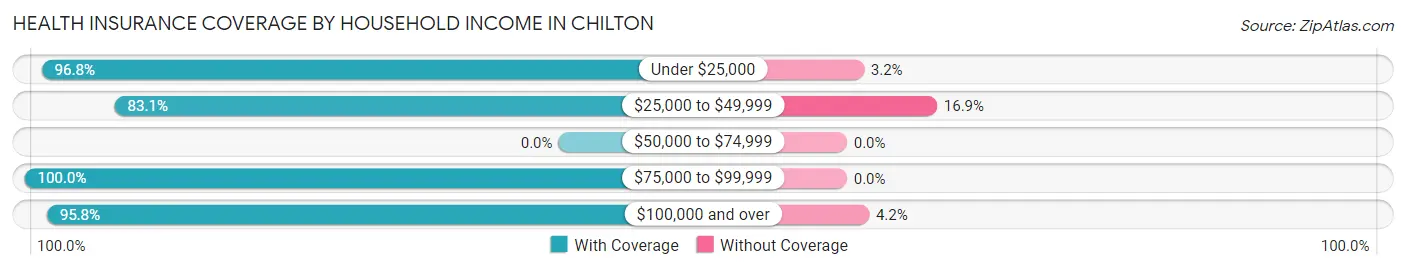
| Household Income | With Coverage | Without Coverage |
| Under $25,000 | 242 (96.8%) | 8 (3.2%) |
| $25,000 to $49,999 | 256 (83.1%) | 52 (16.9%) |
| $50,000 to $74,999 | 0 (0.0%) | 0 (0.0%) |
| $75,000 to $99,999 | 56 (100.0%) | 0 (0.0%) |
| $100,000 and over | 461 (95.8%) | 20 (4.2%) |
Public vs Private Health Insurance Coverage by Age in Chilton
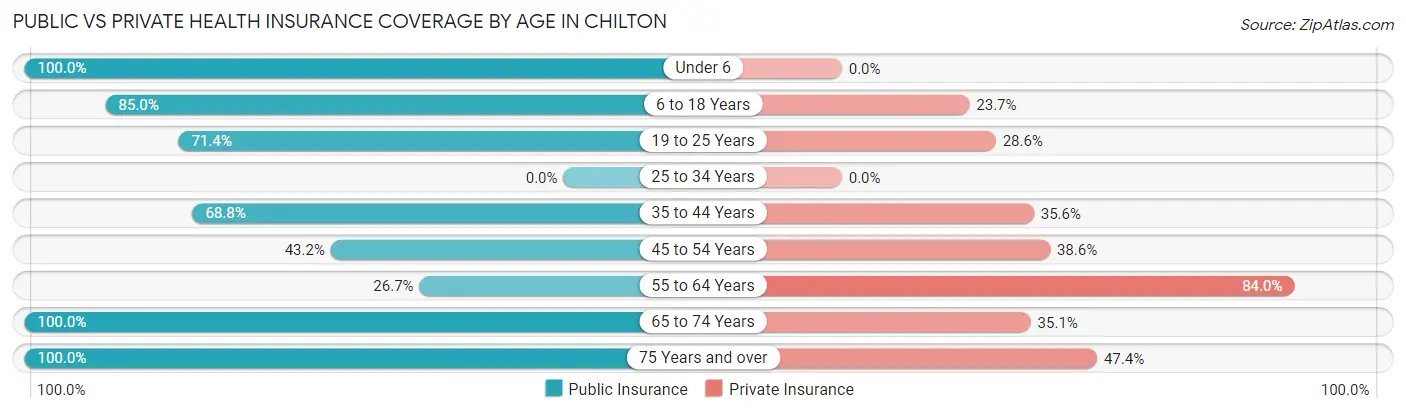
| Age Bracket | Public Insurance | Private Insurance |
| Under 6 | 74 (100.0%) | 0 (0.0%) |
| 6 to 18 Years | 226 (85.0%) | 63 (23.7%) |
| 19 to 25 Years | 45 (71.4%) | 18 (28.6%) |
| 25 to 34 Years | 0 (0.0%) | 0 (0.0%) |
| 35 to 44 Years | 170 (68.8%) | 88 (35.6%) |
| 45 to 54 Years | 57 (43.2%) | 51 (38.6%) |
| 55 to 64 Years | 35 (26.7%) | 110 (84.0%) |
| 65 to 74 Years | 77 (100.0%) | 27 (35.1%) |
| 75 Years and over | 57 (100.0%) | 27 (47.4%) |
| Total | 741 (67.7%) | 384 (35.1%) |
Disability Status by Sex by Age in Chilton
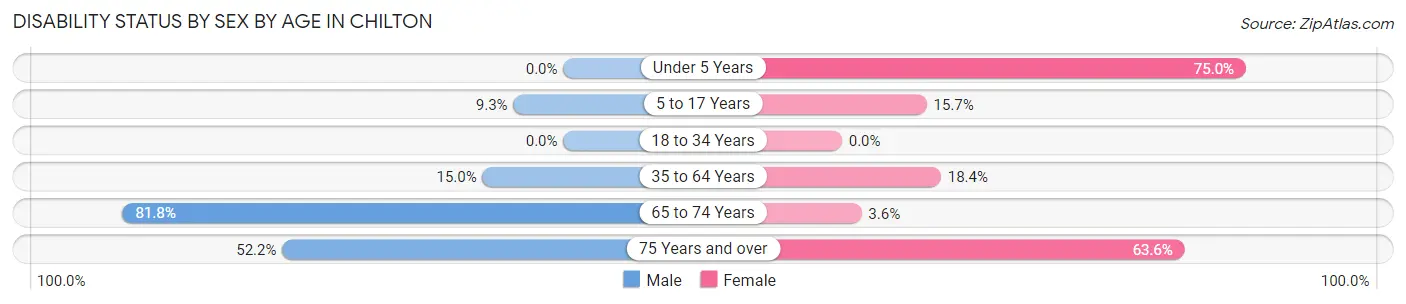
| Age Bracket | Male | Female |
| Under 5 Years | 0 (0.0%) | 48 (75.0%) |
| 5 to 17 Years | 5 (9.3%) | 31 (15.7%) |
| 18 to 34 Years | 0 (0.0%) | 0 (0.0%) |
| 35 to 64 Years | 21 (15.0%) | 68 (18.4%) |
| 65 to 74 Years | 18 (81.8%) | 2 (3.6%) |
| 75 Years and over | 24 (52.2%) | 7 (63.6%) |
Disability Class by Sex by Age in Chilton
Disability Class: Hearing Difficulty
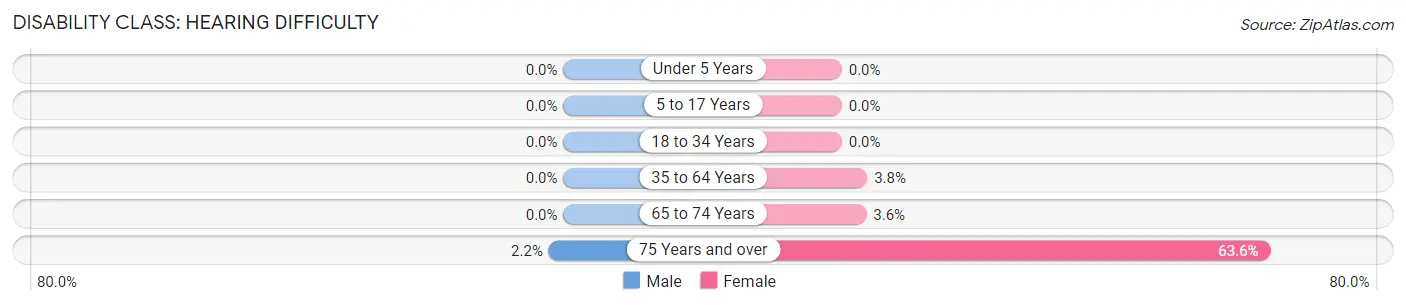
| Age Bracket | Male | Female |
| Under 5 Years | 0 (0.0%) | 0 (0.0%) |
| 5 to 17 Years | 0 (0.0%) | 0 (0.0%) |
| 18 to 34 Years | 0 (0.0%) | 0 (0.0%) |
| 35 to 64 Years | 0 (0.0%) | 14 (3.8%) |
| 65 to 74 Years | 0 (0.0%) | 2 (3.6%) |
| 75 Years and over | 1 (2.2%) | 7 (63.6%) |
Disability Class: Vision Difficulty
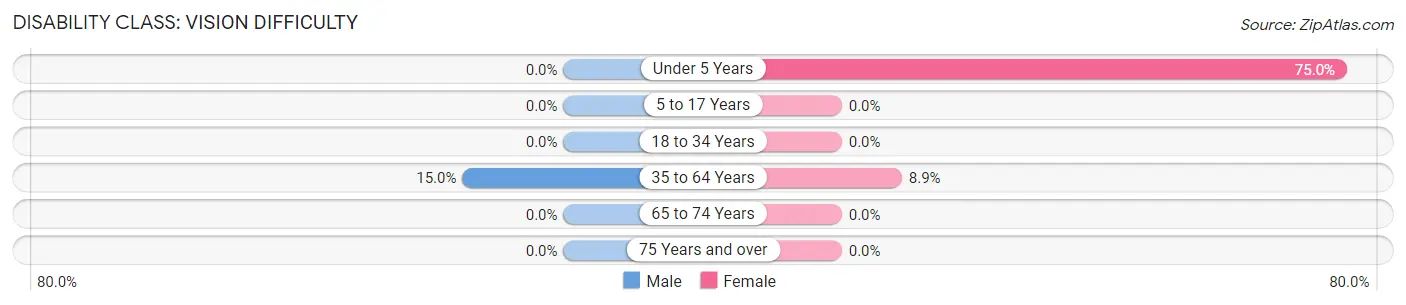
| Age Bracket | Male | Female |
| Under 5 Years | 0 (0.0%) | 48 (75.0%) |
| 5 to 17 Years | 0 (0.0%) | 0 (0.0%) |
| 18 to 34 Years | 0 (0.0%) | 0 (0.0%) |
| 35 to 64 Years | 21 (15.0%) | 33 (8.9%) |
| 65 to 74 Years | 0 (0.0%) | 0 (0.0%) |
| 75 Years and over | 0 (0.0%) | 0 (0.0%) |
Disability Class: Cognitive Difficulty
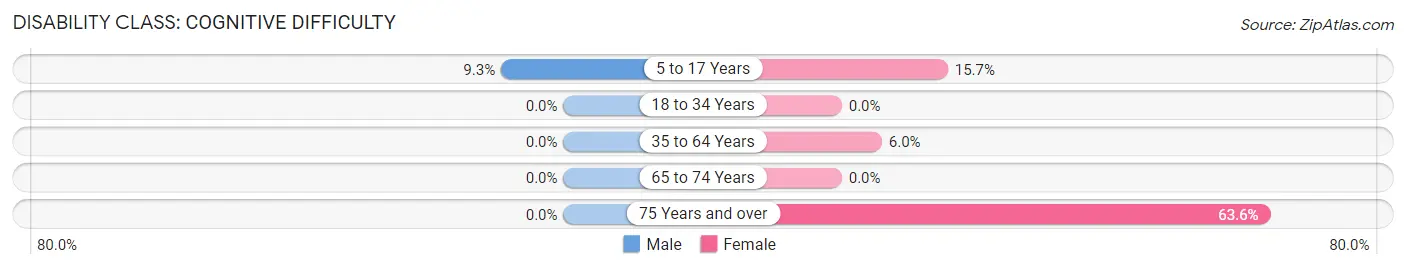
| Age Bracket | Male | Female |
| 5 to 17 Years | 5 (9.3%) | 31 (15.7%) |
| 18 to 34 Years | 0 (0.0%) | 0 (0.0%) |
| 35 to 64 Years | 0 (0.0%) | 22 (5.9%) |
| 65 to 74 Years | 0 (0.0%) | 0 (0.0%) |
| 75 Years and over | 0 (0.0%) | 7 (63.6%) |
Disability Class: Ambulatory Difficulty
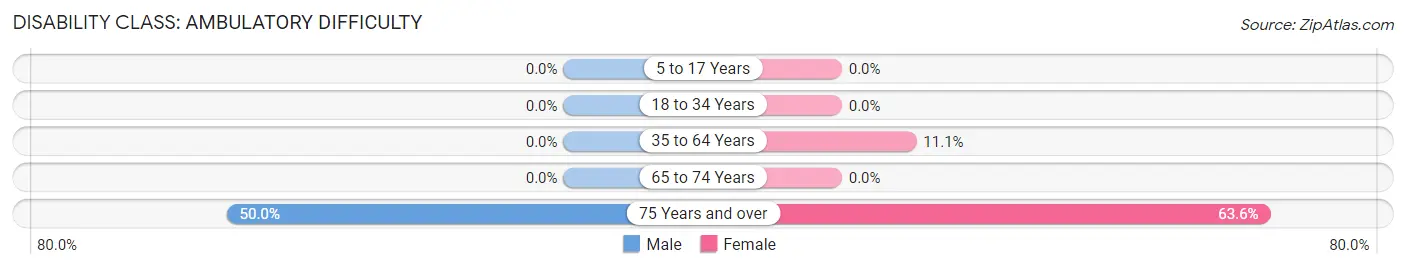
| Age Bracket | Male | Female |
| 5 to 17 Years | 0 (0.0%) | 0 (0.0%) |
| 18 to 34 Years | 0 (0.0%) | 0 (0.0%) |
| 35 to 64 Years | 0 (0.0%) | 41 (11.1%) |
| 65 to 74 Years | 0 (0.0%) | 0 (0.0%) |
| 75 Years and over | 23 (50.0%) | 7 (63.6%) |
Disability Class: Self-Care Difficulty
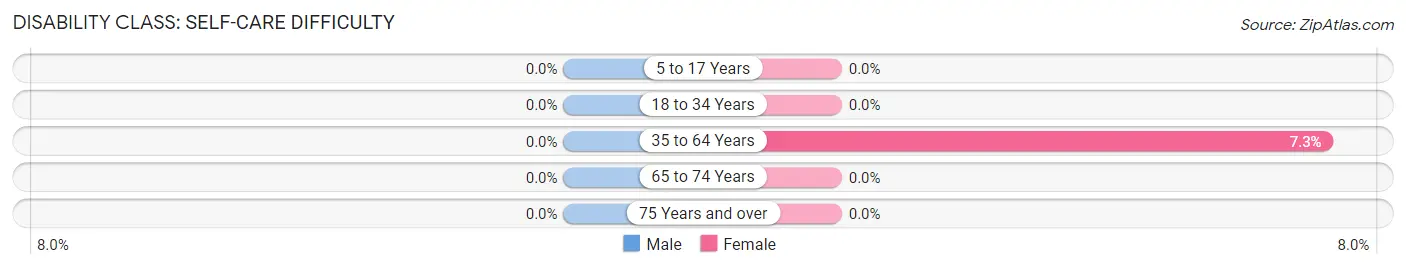
| Age Bracket | Male | Female |
| 5 to 17 Years | 0 (0.0%) | 0 (0.0%) |
| 18 to 34 Years | 0 (0.0%) | 0 (0.0%) |
| 35 to 64 Years | 0 (0.0%) | 27 (7.3%) |
| 65 to 74 Years | 0 (0.0%) | 0 (0.0%) |
| 75 Years and over | 0 (0.0%) | 0 (0.0%) |
Technology Access in Chilton
Computing Device Access in Chilton
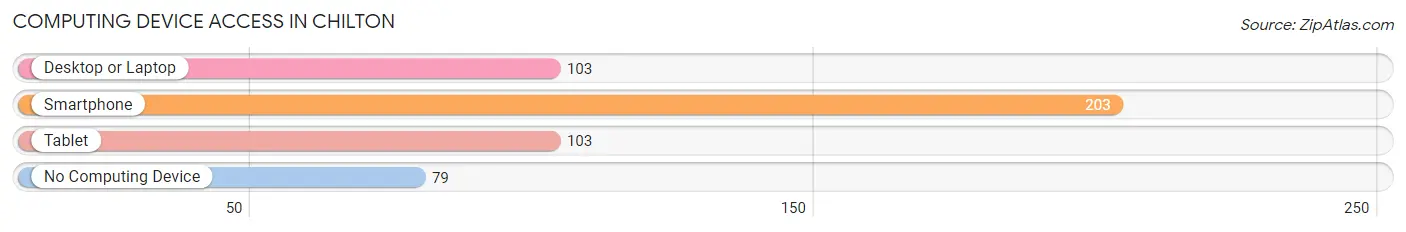
| Device Type | # Households | % Households |
| Desktop or Laptop | 103 | 36.5% |
| Smartphone | 203 | 72.0% |
| Tablet | 103 | 36.5% |
| No Computing Device | 79 | 28.0% |
| Total | 282 | 100.0% |
Internet Access in Chilton
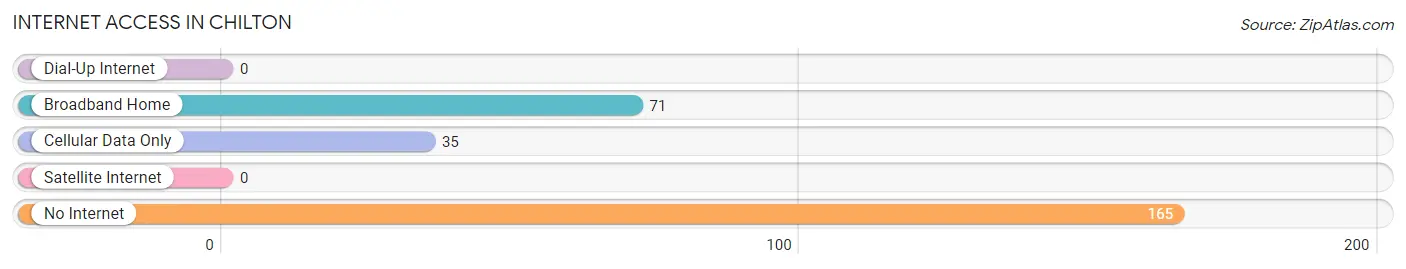
| Internet Type | # Households | % Households |
| Dial-Up Internet | 0 | 0.0% |
| Broadband Home | 71 | 25.2% |
| Cellular Data Only | 35 | 12.4% |
| Satellite Internet | 0 | 0.0% |
| No Internet | 165 | 58.5% |
| Total | 282 | 100.0% |
Chilton Summary
Chilton is a small town located in the state of Texas, in the United States. It is situated in the county of Falls, and is part of the Waco Metropolitan Statistical Area. The town has a population of around 1,000 people, and is known for its rural charm and friendly atmosphere.
History
Chilton was founded in 1876 by a group of settlers from the nearby town of Marlin. The town was named after a local rancher, John Chilton, who had donated the land for the settlement. The town quickly grew, and by the early 1900s, it had become a thriving agricultural center. The town was home to several cotton gins, a cottonseed oil mill, and a number of other businesses.
In the early 1900s, the town was also home to a number of churches, including the First Baptist Church, which was founded in 1877. The town also had a school, which was established in 1883.
Geography
Chilton is located in the eastern part of Falls County, in the central part of Texas. It is situated at the intersection of State Highway 6 and Farm to Market Road 935. The town is located about 25 miles south of Waco, and about 50 miles north of Austin.
The town is situated in a rural area, and is surrounded by rolling hills and farmland. The town is located in the Brazos River Valley, and is part of the Blackland Prairie region of Texas.
Economy
The economy of Chilton is largely based on agriculture. The town is home to several farms, which produce a variety of crops, including cotton, corn, and hay. The town is also home to a number of businesses, including a feed store, a hardware store, and a grocery store.
Demographics
As of the 2010 census, the population of Chilton was 1,000 people. The racial makeup of the town was 94.2% White, 0.7% African American, 0.3% Native American, 0.2% Asian, and 4.6% from other races. The median household income was $37,500, and the median family income was $41,250.
The town is served by the Chilton Independent School District, which includes one elementary school, one middle school, and one high school. The town is also home to a number of churches, including the First Baptist Church, which was founded in 1877.
Conclusion
Chilton is a small town located in the state of Texas, in the United States. It is situated in the county of Falls, and is part of the Waco Metropolitan Statistical Area. The town has a population of around 1,000 people, and is known for its rural charm and friendly atmosphere. The economy of Chilton is largely based on agriculture, and the town is served by the Chilton Independent School District. The town is also home to a number of churches, including the First Baptist Church, which was founded in 1877.
Common Questions
What is Per Capita Income in Chilton?
Per Capita income in Chilton is $101,759.
What is the Median Family Income in Chilton?
Median Family Income in Chilton is $31,250.
What is the Median Household income in Chilton?
Median Household Income in Chilton is $32,895.
What is Family Income Deficit in Chilton?
Family Income Deficit in Chilton is $21,261.
Families that are below poverty line in Chilton earn $21,261 less on average than the poverty threshold level.
What is Inequality or Gini Index in Chilton?
Inequality or Gini Index in Chilton is 0.72.
What is the Total Population of Chilton?
Total Population of Chilton is 1,095.
What is the Total Male Population of Chilton?
Total Male Population of Chilton is 366.
What is the Total Female Population of Chilton?
Total Female Population of Chilton is 729.
What is the Ratio of Males per 100 Females in Chilton?
There are 50.21 Males per 100 Females in Chilton.
What is the Ratio of Females per 100 Males in Chilton?
There are 199.18 Females per 100 Males in Chilton.
What is the Median Population Age in Chilton?
Median Population Age in Chilton is 35.9 Years.
What is the Average Family Size in Chilton
Average Family Size in Chilton is 3.8 People.
What is the Average Household Size in Chilton
Average Household Size in Chilton is 3.9 People.
How Large is the Labor Force in Chilton?
There are 526 People in the Labor Forcein in Chilton.
What is the Percentage of People in the Labor Force in Chilton?
65.5% of People are in the Labor Force in Chilton.
What is the Unemployment Rate in Chilton?
Unemployment Rate in Chilton is 28.3%.