Inavale, NE Map & Demographics
Inavale Map
Inavale Overview
$113,898
PER CAPITA INCOME
$55,500
AVG FAMILY INCOME
$55,250
AVG HOUSEHOLD INCOME
0.80
INEQUALITY / GINI INDEX
50
TOTAL POPULATION
16
MALE POPULATION
34
FEMALE POPULATION
47.06
MALES / 100 FEMALES
212.50
FEMALES / 100 MALES
64.1
MEDIAN AGE
1.7
AVG FAMILY SIZE
1.7
AVG HOUSEHOLD SIZE
32
LABOR FORCE [ PEOPLE ]
64.0%
PERCENT IN LABOR FORCE
Inavale Zip Codes
Inavale Area Codes
Income in Inavale
Income Overview in Inavale
Per Capita Income in Inavale is $113,898, while median incomes of families and households are $55,500 and $55,250 respectively.
| Characteristic | Number | Measure |
| Per Capita Income | 50 | $113,898 |
| Median Family Income | 28 | $55,500 |
| Mean Family Income | 28 | $291,954 |
| Median Household Income | 30 | $55,250 |
| Mean Household Income | 30 | $273,497 |
| Income Deficit | 28 | $0 |
| Wage / Income Gap (%) | 50 | 0.00% |
| Wage / Income Gap ($) | 50 | 100.00¢ per $1 |
| Gini / Inequality Index | 50 | 0.80 |
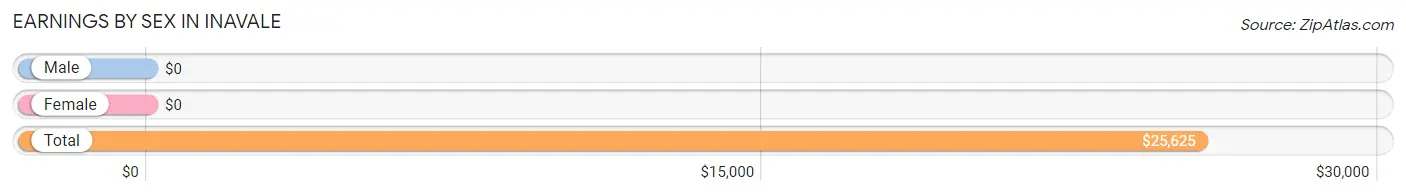
Earnings by Sex in Inavale
| Sex | Number | Average Earnings |
| Male | 16 (48.5%) | $0 |
| Female | 17 (51.5%) | $0 |
| Total | 33 (100.0%) | $25,625 |
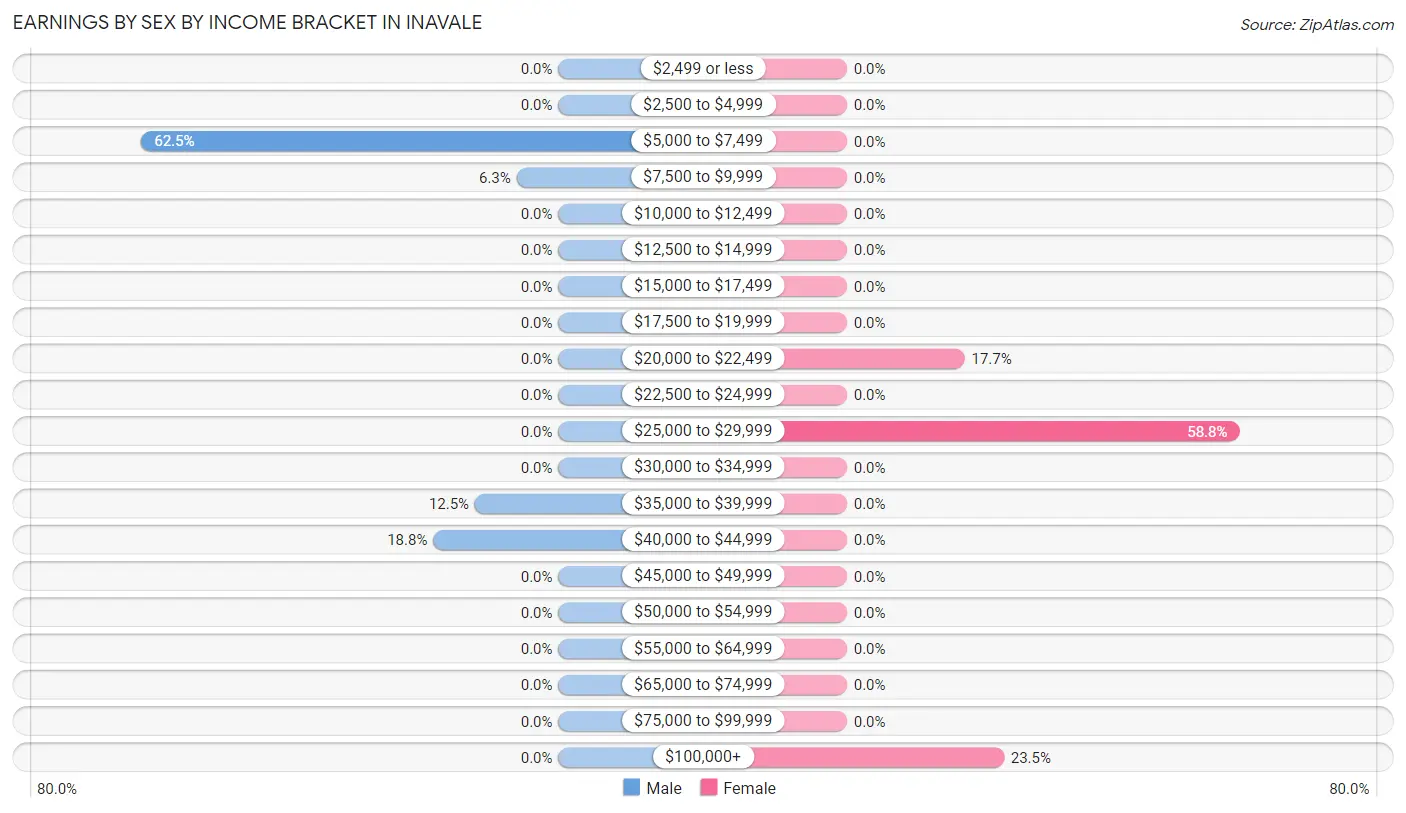
Earnings by Sex by Income Bracket in Inavale
The most common earnings brackets in Inavale are $5,000 to $7,499 for men (10 | 62.5%) and $25,000 to $29,999 for women (10 | 58.8%).
| Income | Male | Female |
| $2,499 or less | 0 (0.0%) | 0 (0.0%) |
| $2,500 to $4,999 | 0 (0.0%) | 0 (0.0%) |
| $5,000 to $7,499 | 10 (62.5%) | 0 (0.0%) |
| $7,500 to $9,999 | 1 (6.2%) | 0 (0.0%) |
| $10,000 to $12,499 | 0 (0.0%) | 0 (0.0%) |
| $12,500 to $14,999 | 0 (0.0%) | 0 (0.0%) |
| $15,000 to $17,499 | 0 (0.0%) | 0 (0.0%) |
| $17,500 to $19,999 | 0 (0.0%) | 0 (0.0%) |
| $20,000 to $22,499 | 0 (0.0%) | 3 (17.6%) |
| $22,500 to $24,999 | 0 (0.0%) | 0 (0.0%) |
| $25,000 to $29,999 | 0 (0.0%) | 10 (58.8%) |
| $30,000 to $34,999 | 0 (0.0%) | 0 (0.0%) |
| $35,000 to $39,999 | 2 (12.5%) | 0 (0.0%) |
| $40,000 to $44,999 | 3 (18.8%) | 0 (0.0%) |
| $45,000 to $49,999 | 0 (0.0%) | 0 (0.0%) |
| $50,000 to $54,999 | 0 (0.0%) | 0 (0.0%) |
| $55,000 to $64,999 | 0 (0.0%) | 0 (0.0%) |
| $65,000 to $74,999 | 0 (0.0%) | 0 (0.0%) |
| $75,000 to $99,999 | 0 (0.0%) | 0 (0.0%) |
| $100,000+ | 0 (0.0%) | 4 (23.5%) |
| Total | 16 (100.0%) | 17 (100.0%) |
Earnings by Sex by Educational Attainment in Inavale
| Educational Attainment | Male Income | Female Income |
| Less than High School | - | - |
| High School Diploma | - | - |
| College or Associate's Degree | - | - |
| Bachelor's Degree | - | - |
| Graduate Degree | - | - |
| Total | - | - |
Family Income in Inavale
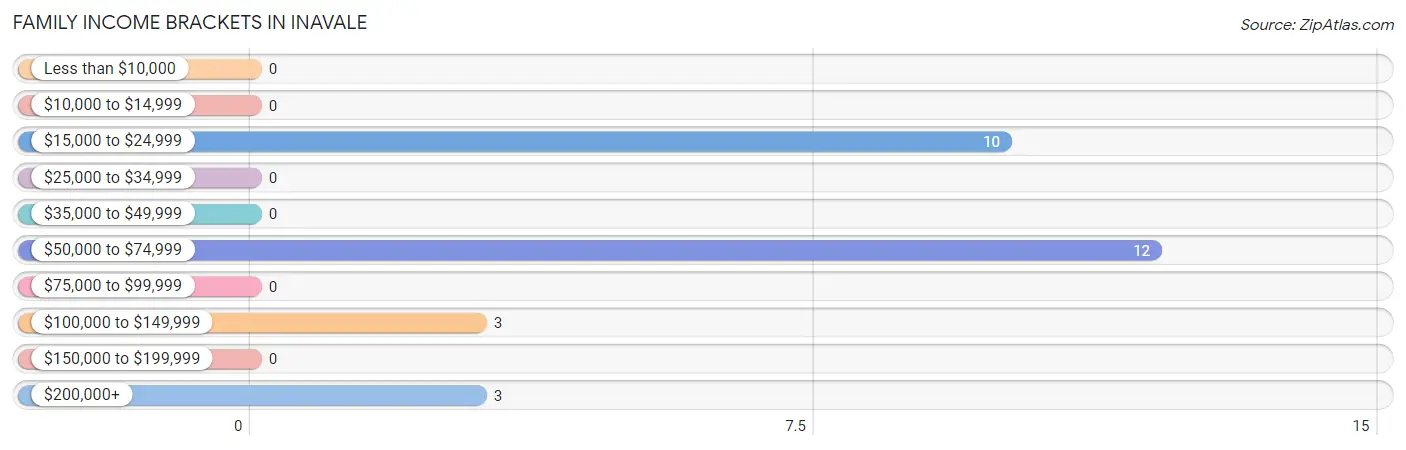
Family Income Brackets in Inavale
According to the Inavale family income data, there are 12 families falling into the $50,000 to $74,999 income range, which is the most common income bracket and makes up 42.9% of all families.
| Income Bracket | # Families | % Families |
| Less than $10,000 | 0 | 0.0% |
| $10,000 to $14,999 | 0 | 0.0% |
| $15,000 to $24,999 | 10 | 35.7% |
| $25,000 to $34,999 | 0 | 0.0% |
| $35,000 to $49,999 | 0 | 0.0% |
| $50,000 to $74,999 | 12 | 42.9% |
| $75,000 to $99,999 | 0 | 0.0% |
| $100,000 to $149,999 | 3 | 10.7% |
| $150,000 to $199,999 | 0 | 0.0% |
| $200,000+ | 3 | 10.7% |
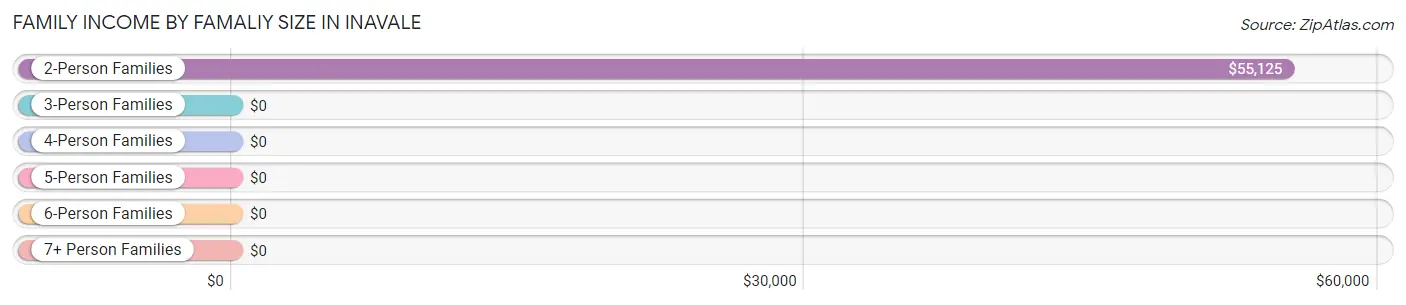
Family Income by Famaliy Size in Inavale
2-person families (25 | 89.3%) account for the highest median family income in Inavale with $55,125 per family, while 2-person families (25 | 89.3%) have the highest median income of $27,562 per family member.
| Income Bracket | # Families | Median Income |
| 2-Person Families | 25 (89.3%) | $55,125 |
| 3-Person Families | 3 (10.7%) | $0 |
| 4-Person Families | 0 (0.0%) | $0 |
| 5-Person Families | 0 (0.0%) | $0 |
| 6-Person Families | 0 (0.0%) | $0 |
| 7+ Person Families | 0 (0.0%) | $0 |
| Total | 28 (100.0%) | $55,500 |
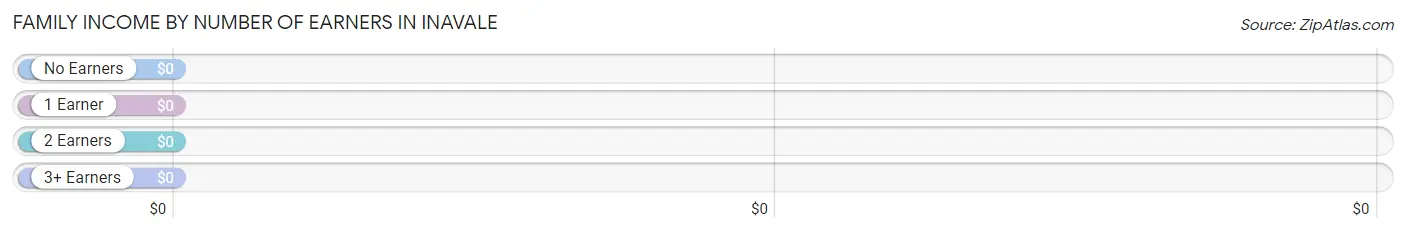
Family Income by Number of Earners in Inavale
| Number of Earners | # Families | Median Income |
| No Earners | 0 (0.0%) | $0 |
| 1 Earner | 22 (78.6%) | $0 |
| 2 Earners | 3 (10.7%) | $0 |
| 3+ Earners | 3 (10.7%) | $0 |
| Total | 28 (100.0%) | $55,500 |
Household Income in Inavale
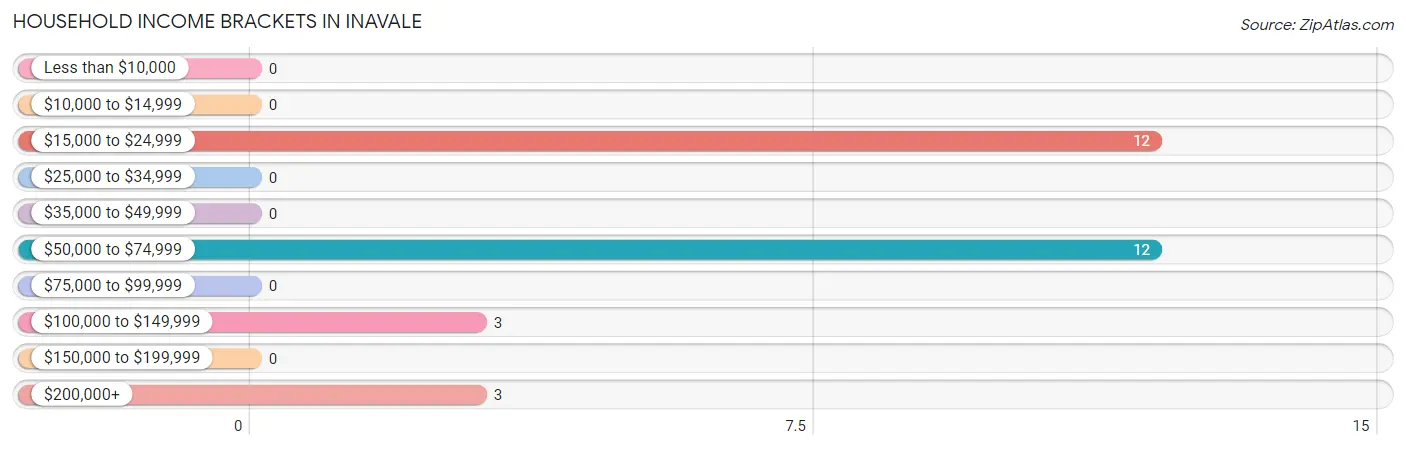
Household Income Brackets in Inavale
With 12 households falling in the category, the $15,000 to $24,999 income range is the most frequent in Inavale, accounting for 40.0% of all households.
| Income Bracket | # Households | % Households |
| Less than $10,000 | 0 | 0.0% |
| $10,000 to $14,999 | 0 | 0.0% |
| $15,000 to $24,999 | 12 | 40.0% |
| $25,000 to $34,999 | 0 | 0.0% |
| $35,000 to $49,999 | 0 | 0.0% |
| $50,000 to $74,999 | 12 | 40.0% |
| $75,000 to $99,999 | 0 | 0.0% |
| $100,000 to $149,999 | 3 | 10.0% |
| $150,000 to $199,999 | 0 | 0.0% |
| $200,000+ | 3 | 10.0% |
Household Income by Householder Age in Inavale
| Income Bracket | # Households | Median Income |
| 15 to 24 Years | 0 (0.0%) | $0 |
| 25 to 44 Years | 0 (0.0%) | $0 |
| 45 to 64 Years | 20 (66.7%) | $0 |
| 65+ Years | 10 (33.3%) | $0 |
| Total | 30 (100.0%) | $55,250 |
Poverty in Inavale
Income Below Poverty by Sex and Age in Inavale
With 62.5% poverty level for males and 23.5% for females among the residents of Inavale, 55 to 64 year old males and 45 to 54 year old females are the most vulnerable to poverty, with 10 males (100.0%) and 8 females (88.9%) in their respective age groups living below the poverty level.
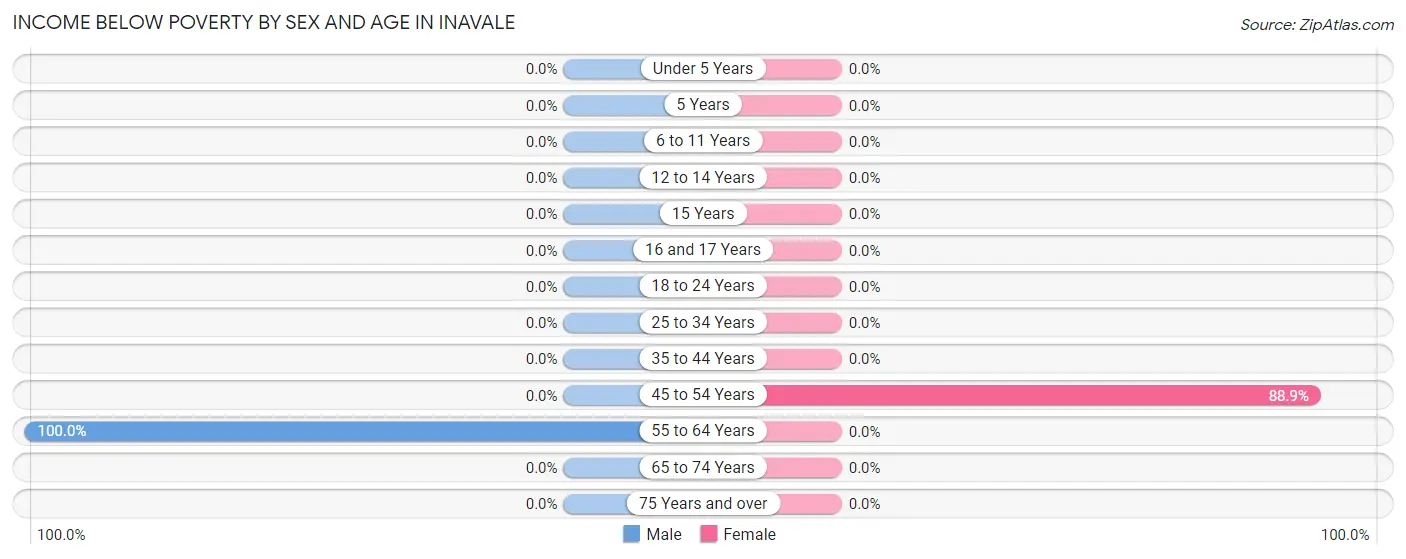
| Age Bracket | Male | Female |
| Under 5 Years | 0 (0.0%) | 0 (0.0%) |
| 5 Years | 0 (0.0%) | 0 (0.0%) |
| 6 to 11 Years | 0 (0.0%) | 0 (0.0%) |
| 12 to 14 Years | 0 (0.0%) | 0 (0.0%) |
| 15 Years | 0 (0.0%) | 0 (0.0%) |
| 16 and 17 Years | 0 (0.0%) | 0 (0.0%) |
| 18 to 24 Years | 0 (0.0%) | 0 (0.0%) |
| 25 to 34 Years | 0 (0.0%) | 0 (0.0%) |
| 35 to 44 Years | 0 (0.0%) | 0 (0.0%) |
| 45 to 54 Years | 0 (0.0%) | 8 (88.9%) |
| 55 to 64 Years | 10 (100.0%) | 0 (0.0%) |
| 65 to 74 Years | 0 (0.0%) | 0 (0.0%) |
| 75 Years and over | 0 (0.0%) | 0 (0.0%) |
| Total | 10 (62.5%) | 8 (23.5%) |
Income Above Poverty by Sex and Age in Inavale
According to the poverty statistics in Inavale, males aged 35 to 44 years and females aged 55 to 64 years are the age groups that are most secure financially, with 100.0% of males and 100.0% of females in these age groups living above the poverty line.
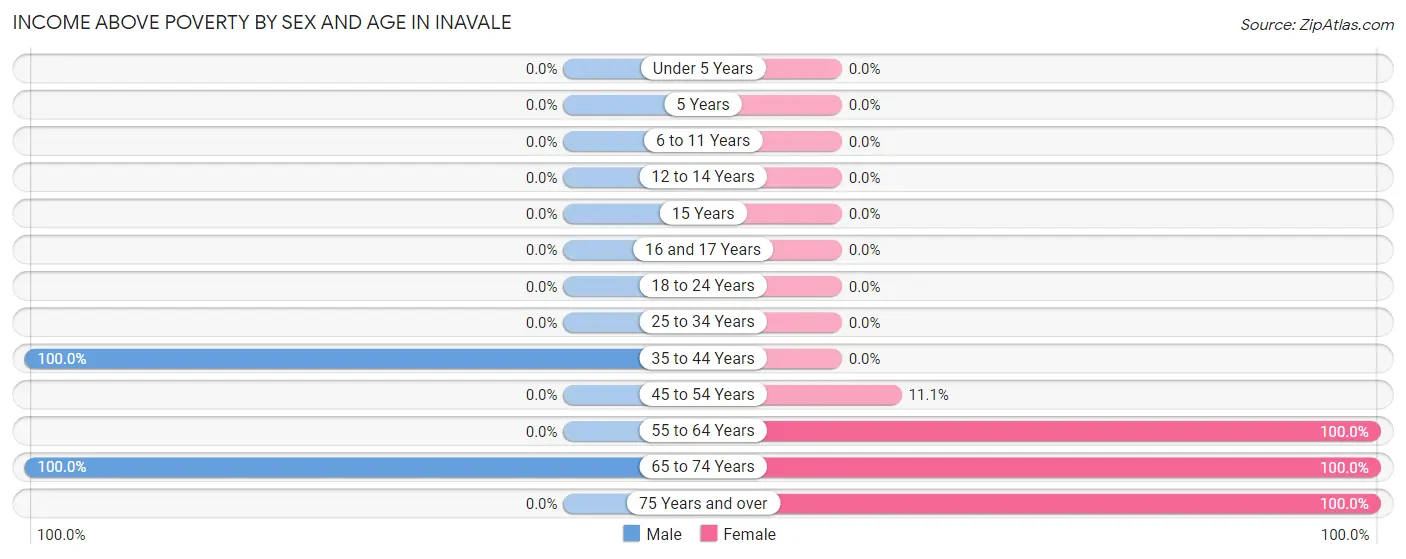
| Age Bracket | Male | Female |
| Under 5 Years | 0 (0.0%) | 0 (0.0%) |
| 5 Years | 0 (0.0%) | 0 (0.0%) |
| 6 to 11 Years | 0 (0.0%) | 0 (0.0%) |
| 12 to 14 Years | 0 (0.0%) | 0 (0.0%) |
| 15 Years | 0 (0.0%) | 0 (0.0%) |
| 16 and 17 Years | 0 (0.0%) | 0 (0.0%) |
| 18 to 24 Years | 0 (0.0%) | 0 (0.0%) |
| 25 to 34 Years | 0 (0.0%) | 0 (0.0%) |
| 35 to 44 Years | 2 (100.0%) | 0 (0.0%) |
| 45 to 54 Years | 0 (0.0%) | 1 (11.1%) |
| 55 to 64 Years | 0 (0.0%) | 13 (100.0%) |
| 65 to 74 Years | 4 (100.0%) | 9 (100.0%) |
| 75 Years and over | 0 (0.0%) | 3 (100.0%) |
| Total | 6 (37.5%) | 26 (76.5%) |
Income Below Poverty Among Married-Couple Families in Inavale
The poverty statistics for married-couple families in Inavale show that 66.7% or 10 of the total 15 families live below the poverty line. Families with no children have the highest poverty rate of 66.7%, comprising of 10 families. On the other hand, families with no children have the lowest poverty rate of 66.7%, which includes 10 families.
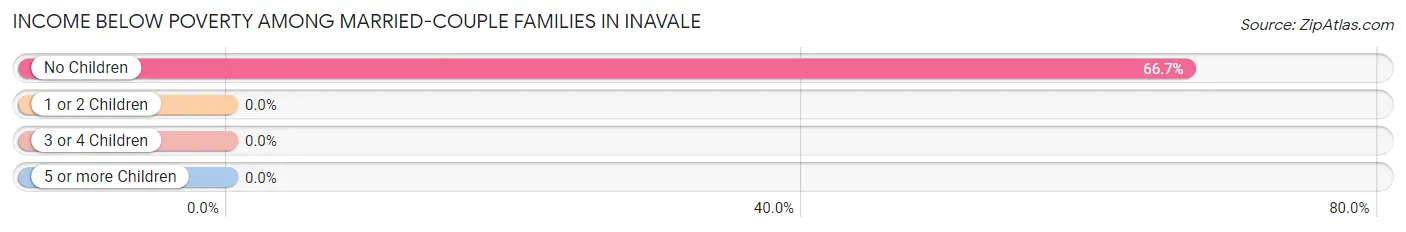
| Children | Above Poverty | Below Poverty |
| No Children | 5 (33.3%) | 10 (66.7%) |
| 1 or 2 Children | 0 (0.0%) | 0 (0.0%) |
| 3 or 4 Children | 0 (0.0%) | 0 (0.0%) |
| 5 or more Children | 0 (0.0%) | 0 (0.0%) |
| Total | 5 (33.3%) | 10 (66.7%) |
Income Below Poverty Among Single-Parent Households in Inavale
| Children | Single Father | Single Mother |
| No Children | 0 (0.0%) | 0 (0.0%) |
| 1 or 2 Children | 0 (0.0%) | 0 (0.0%) |
| 3 or 4 Children | 0 (0.0%) | 0 (0.0%) |
| 5 or more Children | 0 (0.0%) | 0 (0.0%) |
| Total | 0 (0.0%) | 0 (0.0%) |
Income Below Poverty Among Married-Couple vs Single-Parent Households in Inavale
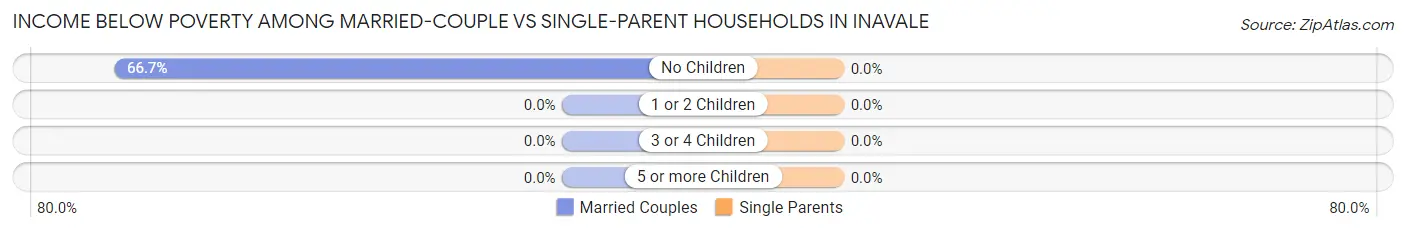
| Children | Married-Couple Families | Single-Parent Households |
| No Children | 10 (66.7%) | 0 (0.0%) |
| 1 or 2 Children | 0 (0.0%) | 0 (0.0%) |
| 3 or 4 Children | 0 (0.0%) | 0 (0.0%) |
| 5 or more Children | 0 (0.0%) | 0 (0.0%) |
| Total | 10 (66.7%) | 0 (0.0%) |
Race in Inavale
The most populous races in Inavale are , and White / Caucasian (50 | 100.0%).
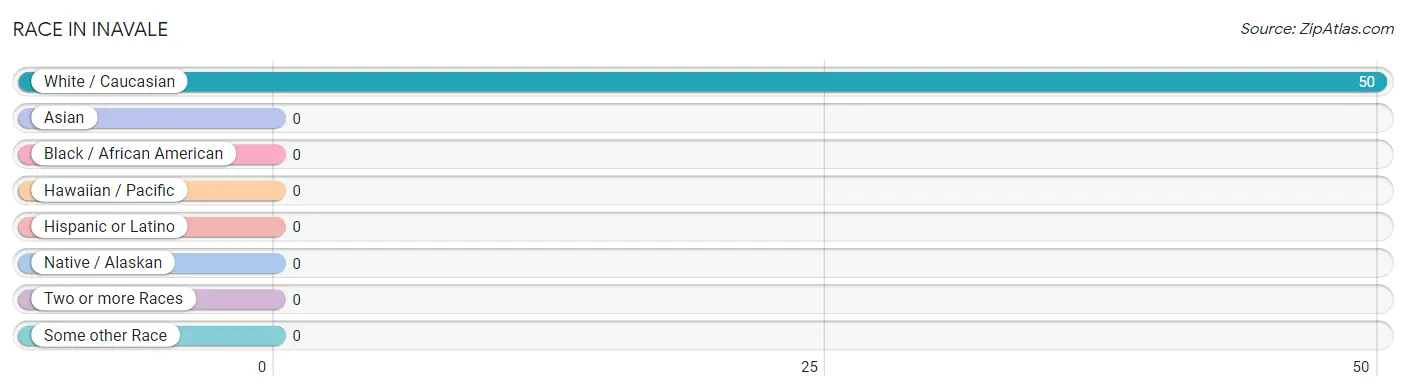
| Race | # Population | % Population |
| Asian | 0 | 0.0% |
| Black / African American | 0 | 0.0% |
| Hawaiian / Pacific | 0 | 0.0% |
| Hispanic or Latino | 0 | 0.0% |
| Native / Alaskan | 0 | 0.0% |
| White / Caucasian | 50 | 100.0% |
| Two or more Races | 0 | 0.0% |
| Some other Race | 0 | 0.0% |
| Total | 50 | 100.0% |
Ancestry in Inavale
The most populous ancestries reported in Inavale are German (25 | 50.0%), Swedish (25 | 50.0%), Danish (15 | 30.0%), Irish (15 | 30.0%), and American (4 | 8.0%), together accounting for 168.0% of all Inavale residents.
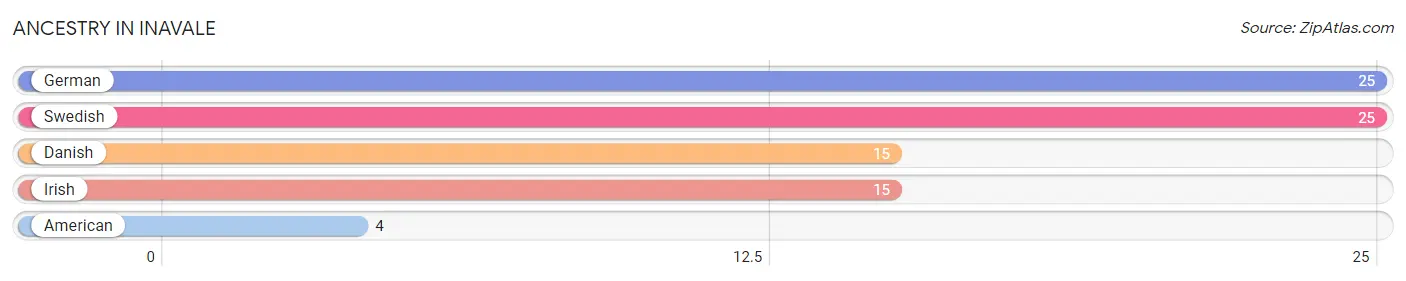
| Ancestry | # Population | % Population |
| American | 4 | 8.0% |
| Danish | 15 | 30.0% |
| German | 25 | 50.0% |
| Irish | 15 | 30.0% |
| Swedish | 25 | 50.0% | View All 5 Rows |
Immigrants in Inavale

| Immigration Origin | # Population | % Population | View All 0 Rows |
Sex and Age in Inavale
Sex and Age in Inavale
The most populous age groups in Inavale are 60 to 64 Years (10 | 62.5%) for men and 60 to 64 Years (13 | 38.2%) for women.
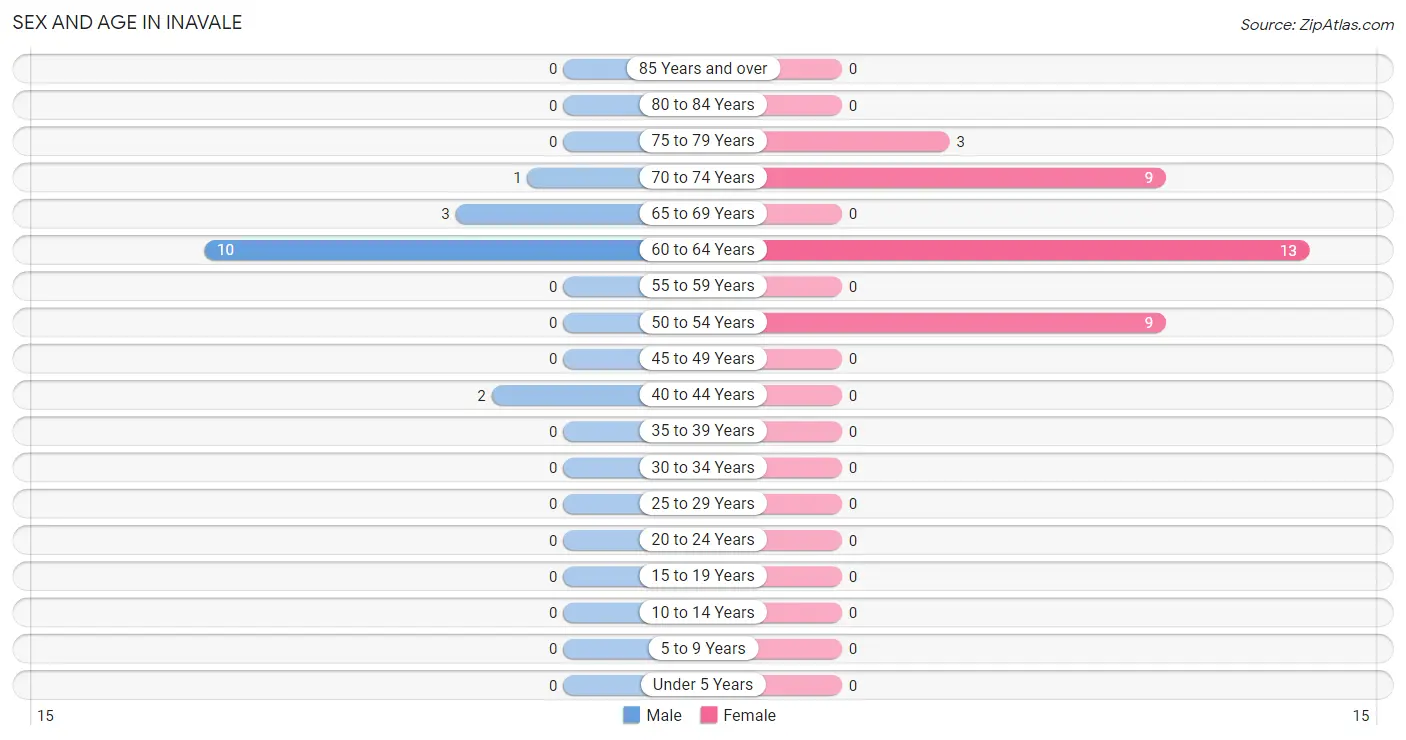
| Age Bracket | Male | Female |
| Under 5 Years | 0 (0.0%) | 0 (0.0%) |
| 5 to 9 Years | 0 (0.0%) | 0 (0.0%) |
| 10 to 14 Years | 0 (0.0%) | 0 (0.0%) |
| 15 to 19 Years | 0 (0.0%) | 0 (0.0%) |
| 20 to 24 Years | 0 (0.0%) | 0 (0.0%) |
| 25 to 29 Years | 0 (0.0%) | 0 (0.0%) |
| 30 to 34 Years | 0 (0.0%) | 0 (0.0%) |
| 35 to 39 Years | 0 (0.0%) | 0 (0.0%) |
| 40 to 44 Years | 2 (12.5%) | 0 (0.0%) |
| 45 to 49 Years | 0 (0.0%) | 0 (0.0%) |
| 50 to 54 Years | 0 (0.0%) | 9 (26.5%) |
| 55 to 59 Years | 0 (0.0%) | 0 (0.0%) |
| 60 to 64 Years | 10 (62.5%) | 13 (38.2%) |
| 65 to 69 Years | 3 (18.8%) | 0 (0.0%) |
| 70 to 74 Years | 1 (6.2%) | 9 (26.5%) |
| 75 to 79 Years | 0 (0.0%) | 3 (8.8%) |
| 80 to 84 Years | 0 (0.0%) | 0 (0.0%) |
| 85 Years and over | 0 (0.0%) | 0 (0.0%) |
| Total | 16 (100.0%) | 34 (100.0%) |
Families and Households in Inavale
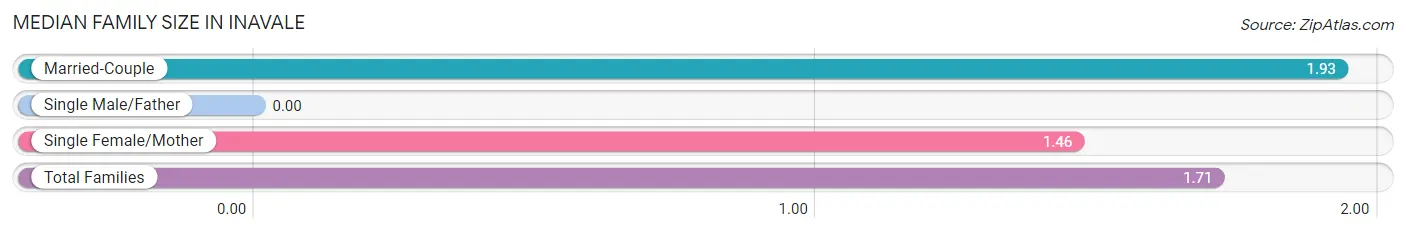
Median Family Size in Inavale
| Family Type | # Families | Family Size |
| Married-Couple | 15 (53.6%) | 1.93 |
| Single Male/Father | 0 (0.0%) | - |
| Single Female/Mother | 13 (46.4%) | 1.46 |
| Total Families | 28 (100.0%) | 1.71 |
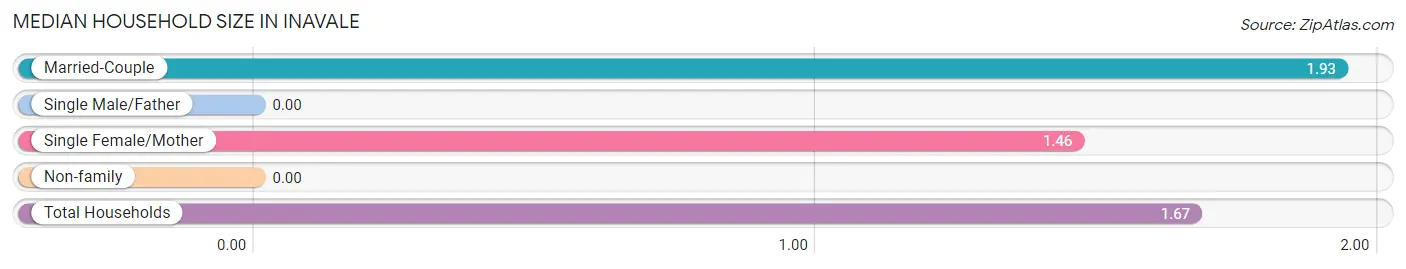
Median Household Size in Inavale
| Household Type | # Households | Household Size |
| Married-Couple | 15 (50.0%) | 1.93 |
| Single Male/Father | 0 (0.0%) | - |
| Single Female/Mother | 13 (43.3%) | 1.46 |
| Non-family | 2 (6.7%) | - |
| Total Households | 30 (100.0%) | 1.67 |
Household Size by Marriage Status in Inavale
Out of a total of 30 households in Inavale, 28 (93.3%) are family households, while 2 (6.7%) are nonfamily households. The most numerous type of family households are 2-person households, comprising 25, and the most common type of nonfamily households are 1-person households, comprising 2.
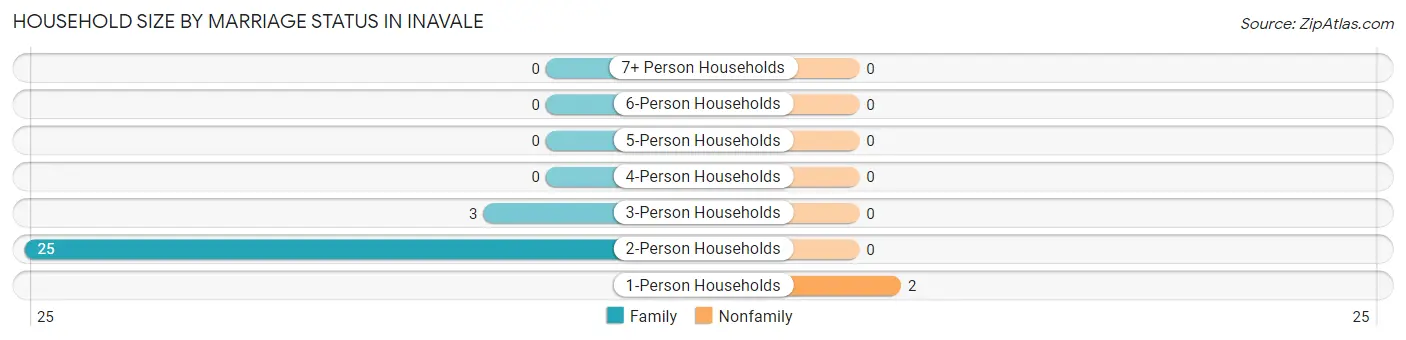
| Household Size | Family Households | Nonfamily Households |
| 1-Person Households | - | 2 (6.7%) |
| 2-Person Households | 25 (83.3%) | 0 (0.0%) |
| 3-Person Households | 3 (10.0%) | 0 (0.0%) |
| 4-Person Households | 0 (0.0%) | 0 (0.0%) |
| 5-Person Households | 0 (0.0%) | 0 (0.0%) |
| 6-Person Households | 0 (0.0%) | 0 (0.0%) |
| 7+ Person Households | 0 (0.0%) | 0 (0.0%) |
| Total | 28 (93.3%) | 2 (6.7%) |
Female Fertility in Inavale
Fertility by Age in Inavale
| Age Bracket | Women with Births | Births / 1,000 Women |
| 15 to 19 years | 0 (0.0%) | 0.0 |
| 20 to 34 years | 0 (0.0%) | 0.0 |
| 35 to 50 years | 0 (0.0%) | 0.0 |
| Total | 0 (0.0%) | 0.0 |
Fertility by Age by Marriage Status in Inavale
| Age Bracket | Married | Unmarried |
| 15 to 19 years | 0 (0.0%) | 0 (0.0%) |
| 20 to 34 years | 0 (0.0%) | 0 (0.0%) |
| 35 to 50 years | 0 (0.0%) | 0 (0.0%) |
| Total | 0 (0.0%) | 0 (0.0%) |
Fertility by Education in Inavale
| Educational Attainment | Women with Births | Births / 1,000 Women |
| Less than High School | 0 (0.0%) | 0.0 |
| High School Diploma | 0 (0.0%) | 0.0 |
| College or Associate's Degree | 0 (0.0%) | 0.0 |
| Bachelor's Degree | 0 (0.0%) | 0.0 |
| Graduate Degree | 0 (0.0%) | 0.0 |
| Total | 0 (0.0%) | 0.0 |
Fertility by Education by Marriage Status in Inavale
| Educational Attainment | Married | Unmarried |
| Less than High School | 0 (0.0%) | 0 (0.0%) |
| High School Diploma | 0 (0.0%) | 0 (0.0%) |
| College or Associate's Degree | 0 (0.0%) | 0 (0.0%) |
| Bachelor's Degree | 0 (0.0%) | 0 (0.0%) |
| Graduate Degree | 0 (0.0%) | 0 (0.0%) |
| Total | 0 (0.0%) | 0 (0.0%) |
Employment Characteristics in Inavale
Employment by Class of Employer in Inavale
Among the 30 employed individuals in Inavale, private company employees (27 | 90.0%), and state government employees (3 | 10.0%) make up the most common classes of employment.
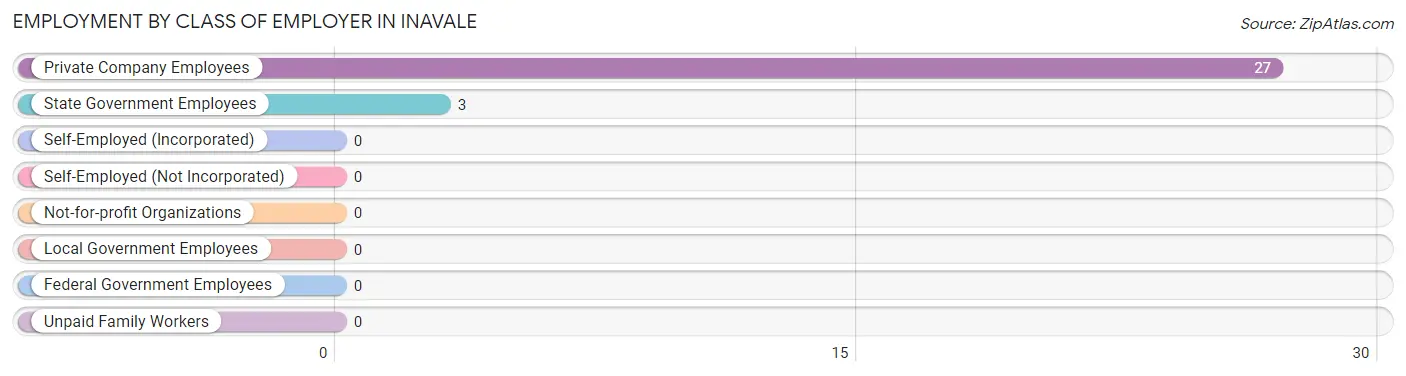
| Employer Class | # Employees | % Employees |
| Private Company Employees | 27 | 90.0% |
| Self-Employed (Incorporated) | 0 | 0.0% |
| Self-Employed (Not Incorporated) | 0 | 0.0% |
| Not-for-profit Organizations | 0 | 0.0% |
| Local Government Employees | 0 | 0.0% |
| State Government Employees | 3 | 10.0% |
| Federal Government Employees | 0 | 0.0% |
| Unpaid Family Workers | 0 | 0.0% |
| Total | 30 | 100.0% |
Employment Status by Age in Inavale
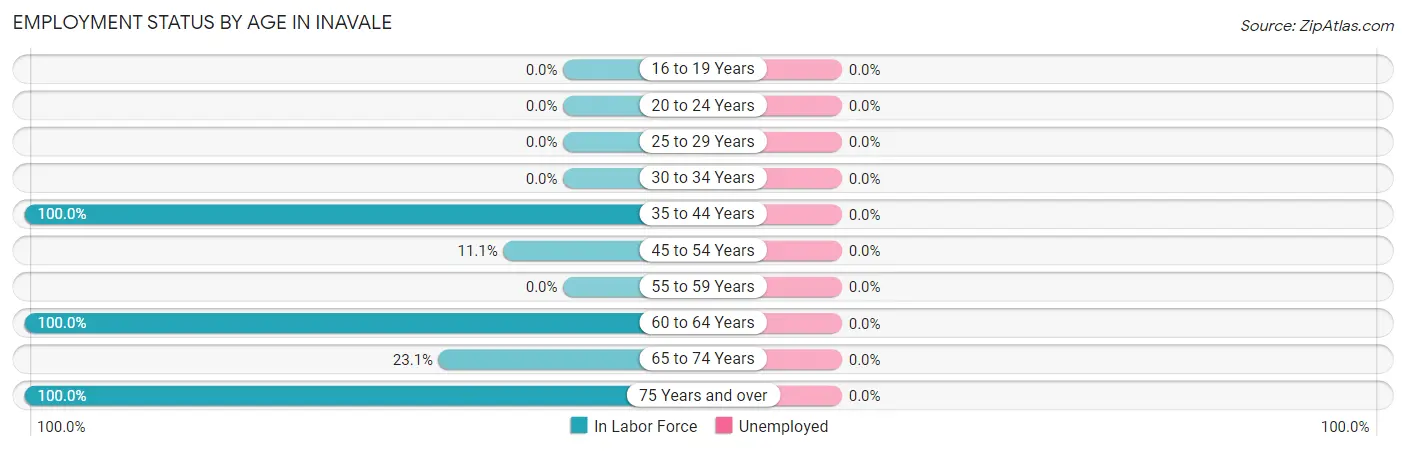
| Age Bracket | In Labor Force | Unemployed |
| 16 to 19 Years | 0 (0.0%) | 0 (0.0%) |
| 20 to 24 Years | 0 (0.0%) | 0 (0.0%) |
| 25 to 29 Years | 0 (0.0%) | 0 (0.0%) |
| 30 to 34 Years | 0 (0.0%) | 0 (0.0%) |
| 35 to 44 Years | 2 (100.0%) | 0 (0.0%) |
| 45 to 54 Years | 1 (11.1%) | 0 (0.0%) |
| 55 to 59 Years | 0 (0.0%) | 0 (0.0%) |
| 60 to 64 Years | 23 (100.0%) | 0 (0.0%) |
| 65 to 74 Years | 3 (23.1%) | 0 (0.0%) |
| 75 Years and over | 3 (100.0%) | 0 (0.0%) |
| Total | 32 (64.0%) | 0 (0.0%) |
Employment Status by Educational Attainment in Inavale
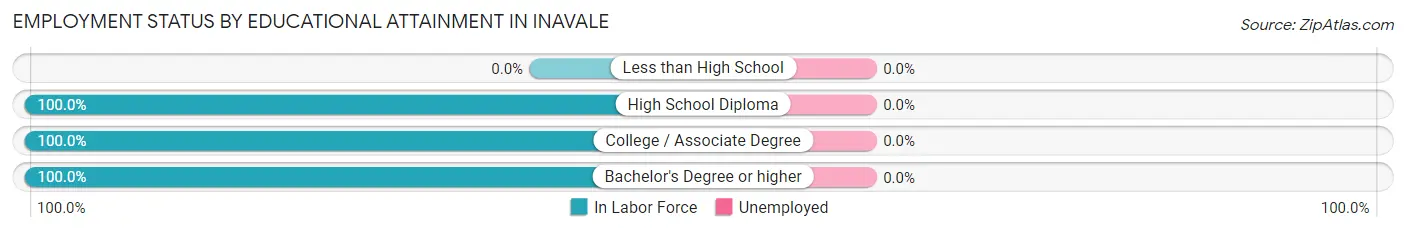
| Educational Attainment | In Labor Force | Unemployed |
| Less than High School | 0 (0.0%) | 0 (0.0%) |
| High School Diploma | 12 (100.0%) | 0 (0.0%) |
| College / Associate Degree | 13 (100.0%) | 0 (0.0%) |
| Bachelor's Degree or higher | 1 (100.0%) | 0 (0.0%) |
| Total | 26 (76.5%) | 0 (0.0%) |
Employment Occupations by Sex in Inavale
Management, Business, Science and Arts Occupations
The most common Management, Business, Science and Arts occupations in Inavale are , and Business & Financial (1 | 3.1%).
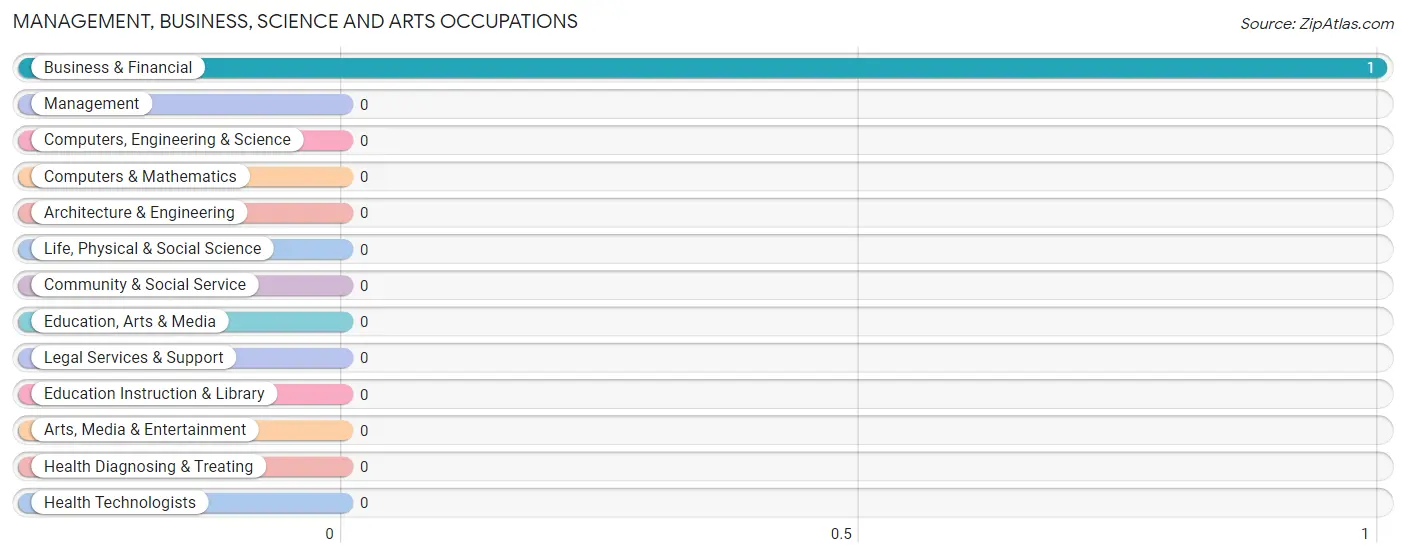
Management, Business, Science and Arts Occupations by Sex
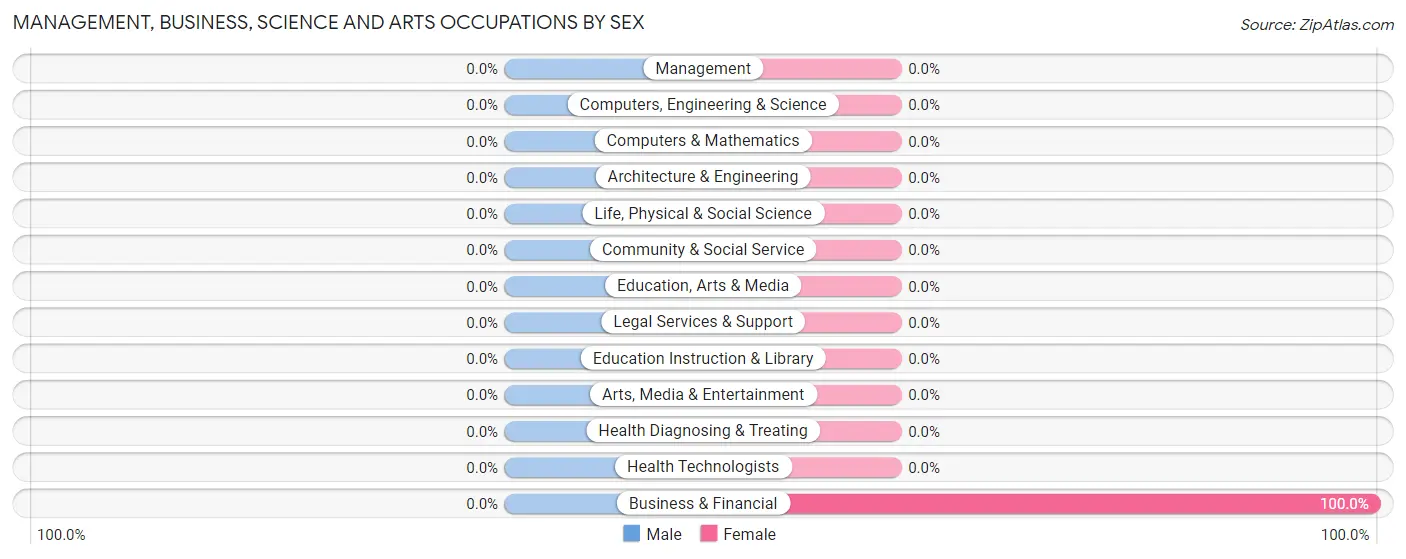
| Occupation | Male | Female |
| Management | 0 (0.0%) | 0 (0.0%) |
| Business & Financial | 0 (0.0%) | 1 (100.0%) |
| Computers, Engineering & Science | 0 (0.0%) | 0 (0.0%) |
| Computers & Mathematics | 0 (0.0%) | 0 (0.0%) |
| Architecture & Engineering | 0 (0.0%) | 0 (0.0%) |
| Life, Physical & Social Science | 0 (0.0%) | 0 (0.0%) |
| Community & Social Service | 0 (0.0%) | 0 (0.0%) |
| Education, Arts & Media | 0 (0.0%) | 0 (0.0%) |
| Legal Services & Support | 0 (0.0%) | 0 (0.0%) |
| Education Instruction & Library | 0 (0.0%) | 0 (0.0%) |
| Arts, Media & Entertainment | 0 (0.0%) | 0 (0.0%) |
| Health Diagnosing & Treating | 0 (0.0%) | 0 (0.0%) |
| Health Technologists | 0 (0.0%) | 0 (0.0%) |
| Total (Category) | 0 (0.0%) | 1 (100.0%) |
| Total (Overall) | 15 (46.9%) | 17 (53.1%) |
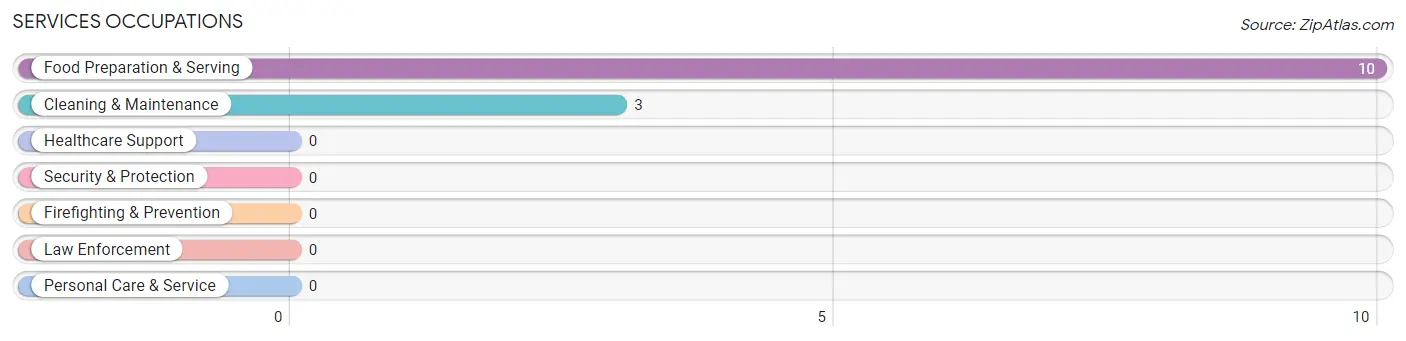
Services Occupations
The most common Services occupations in Inavale are Food Preparation & Serving (10 | 31.2%), and Cleaning & Maintenance (3 | 9.4%).
Services Occupations by Sex
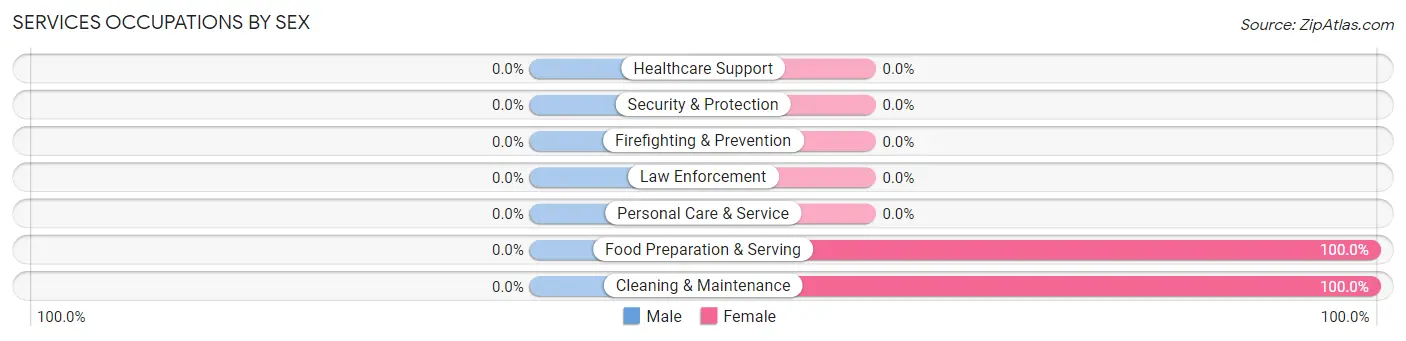
| Occupation | Male | Female |
| Healthcare Support | 0 (0.0%) | 0 (0.0%) |
| Security & Protection | 0 (0.0%) | 0 (0.0%) |
| Firefighting & Prevention | 0 (0.0%) | 0 (0.0%) |
| Law Enforcement | 0 (0.0%) | 0 (0.0%) |
| Food Preparation & Serving | 0 (0.0%) | 10 (100.0%) |
| Cleaning & Maintenance | 0 (0.0%) | 3 (100.0%) |
| Personal Care & Service | 0 (0.0%) | 0 (0.0%) |
| Total (Category) | 0 (0.0%) | 13 (100.0%) |
| Total (Overall) | 15 (46.9%) | 17 (53.1%) |
Sales and Office Occupations
The most common Sales and Office occupations in Inavale are , and Office & Administration (6 | 18.8%).
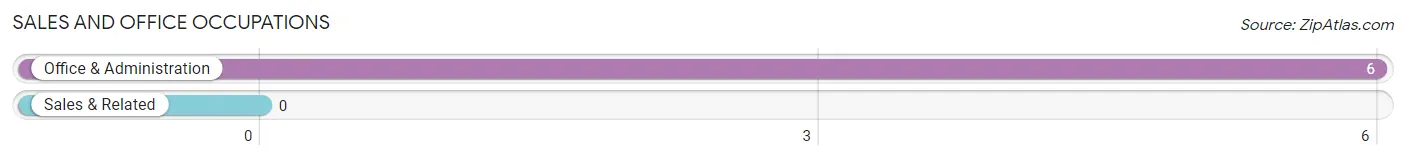
Sales and Office Occupations by Sex
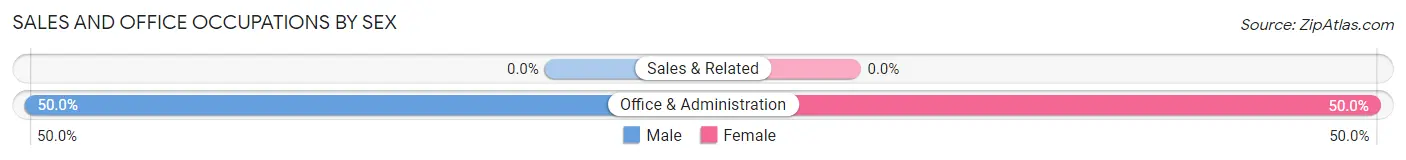
| Occupation | Male | Female |
| Sales & Related | 0 (0.0%) | 0 (0.0%) |
| Office & Administration | 3 (50.0%) | 3 (50.0%) |
| Total (Category) | 3 (50.0%) | 3 (50.0%) |
| Total (Overall) | 15 (46.9%) | 17 (53.1%) |
Natural Resources, Construction and Maintenance Occupations
The most common Natural Resources, Construction and Maintenance occupations in Inavale are Farming, Fishing & Forestry (10 | 31.2%), and Construction & Extraction (2 | 6.2%).
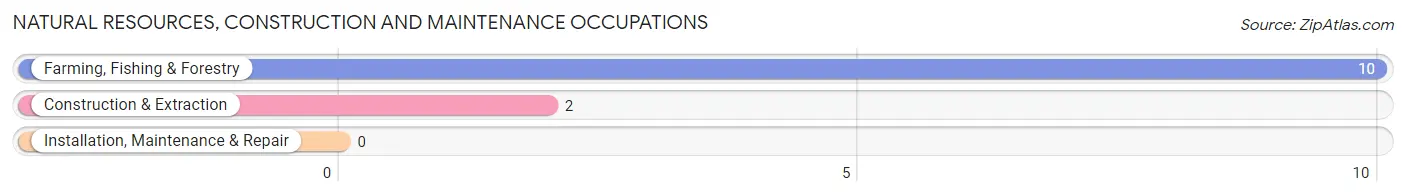
Natural Resources, Construction and Maintenance Occupations by Sex
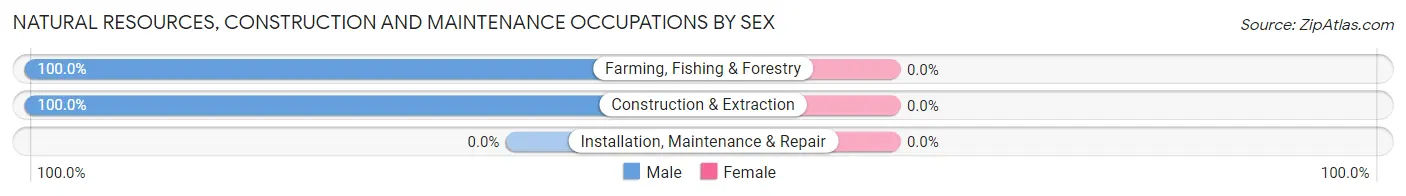
| Occupation | Male | Female |
| Farming, Fishing & Forestry | 10 (100.0%) | 0 (0.0%) |
| Construction & Extraction | 2 (100.0%) | 0 (0.0%) |
| Installation, Maintenance & Repair | 0 (0.0%) | 0 (0.0%) |
| Total (Category) | 12 (100.0%) | 0 (0.0%) |
| Total (Overall) | 15 (46.9%) | 17 (53.1%) |
Production, Transportation and Moving Occupations
Production, Transportation and Moving Occupations by Sex
| Occupation | Male | Female |
| Production | 0 (0.0%) | 0 (0.0%) |
| Transportation | 0 (0.0%) | 0 (0.0%) |
| Material Moving | 0 (0.0%) | 0 (0.0%) |
| Total (Category) | 0 (0.0%) | 0 (0.0%) |
| Total (Overall) | 15 (46.9%) | 17 (53.1%) |
Employment Industries by Sex in Inavale
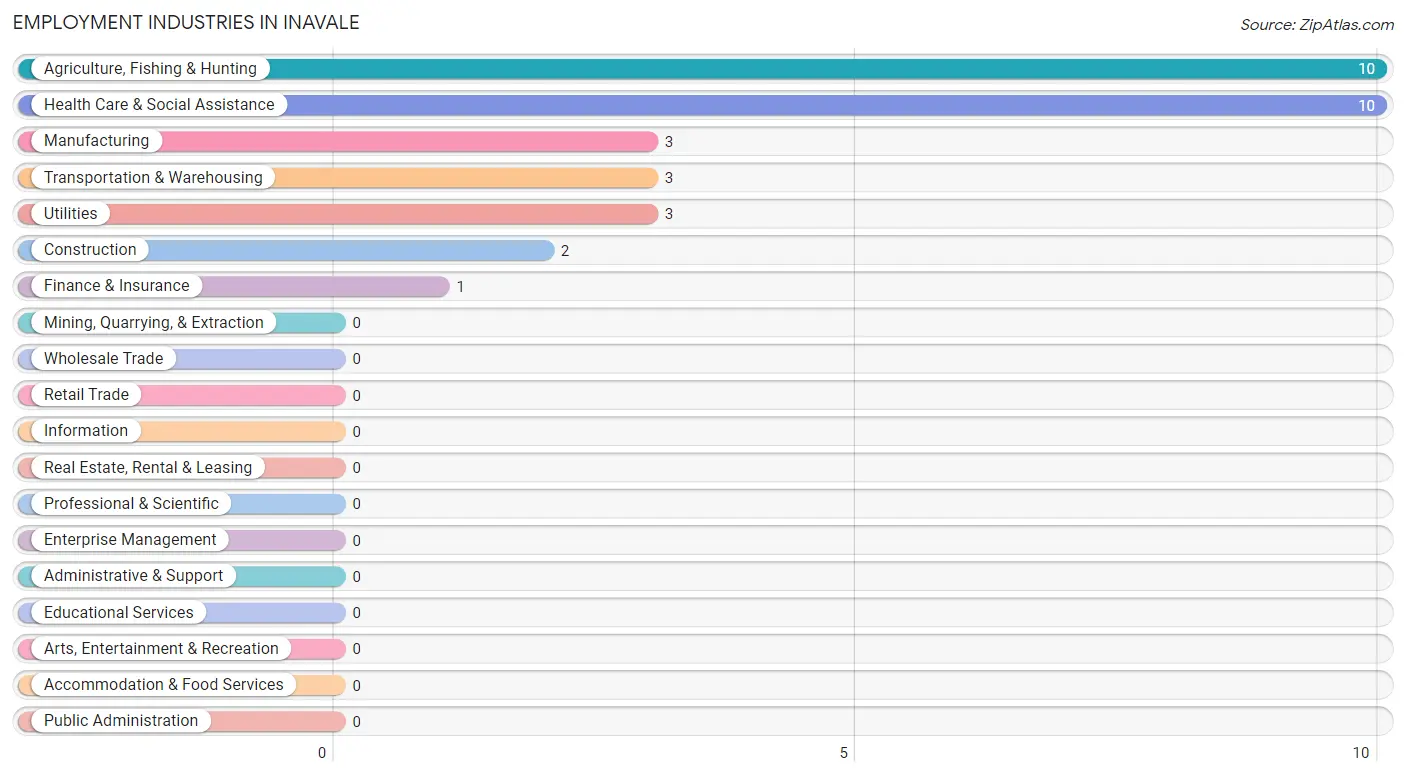
Employment Industries in Inavale
The major employment industries in Inavale include Agriculture, Fishing & Hunting (10 | 31.2%), Health Care & Social Assistance (10 | 31.2%), Manufacturing (3 | 9.4%), Transportation & Warehousing (3 | 9.4%), and Utilities (3 | 9.4%).
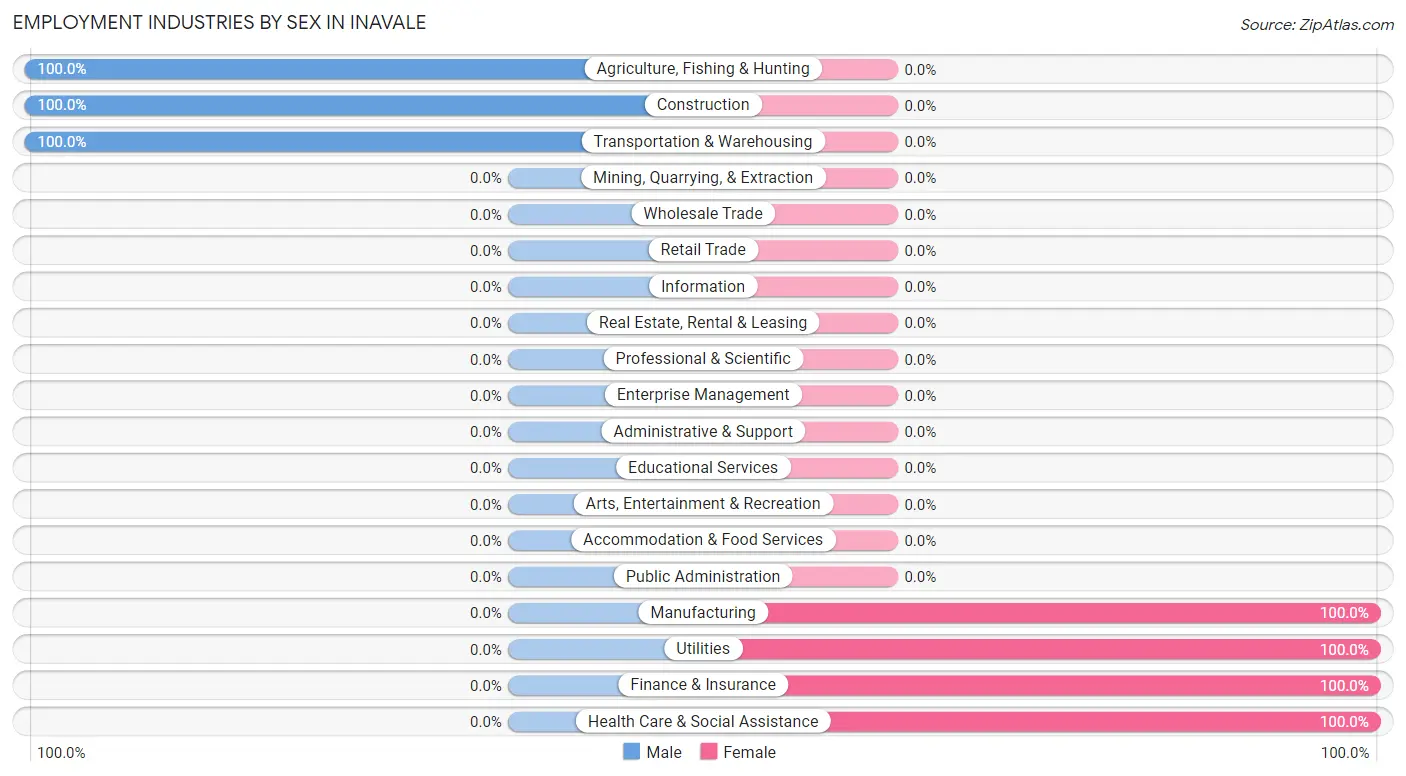
Employment Industries by Sex in Inavale
The Inavale industries that see more men than women are Agriculture, Fishing & Hunting (100.0%), Construction (100.0%), and Transportation & Warehousing (100.0%), whereas the industries that tend to have a higher number of women are Manufacturing (100.0%), Utilities (100.0%), and Finance & Insurance (100.0%).
| Industry | Male | Female |
| Agriculture, Fishing & Hunting | 10 (100.0%) | 0 (0.0%) |
| Mining, Quarrying, & Extraction | 0 (0.0%) | 0 (0.0%) |
| Construction | 2 (100.0%) | 0 (0.0%) |
| Manufacturing | 0 (0.0%) | 3 (100.0%) |
| Wholesale Trade | 0 (0.0%) | 0 (0.0%) |
| Retail Trade | 0 (0.0%) | 0 (0.0%) |
| Transportation & Warehousing | 3 (100.0%) | 0 (0.0%) |
| Utilities | 0 (0.0%) | 3 (100.0%) |
| Information | 0 (0.0%) | 0 (0.0%) |
| Finance & Insurance | 0 (0.0%) | 1 (100.0%) |
| Real Estate, Rental & Leasing | 0 (0.0%) | 0 (0.0%) |
| Professional & Scientific | 0 (0.0%) | 0 (0.0%) |
| Enterprise Management | 0 (0.0%) | 0 (0.0%) |
| Administrative & Support | 0 (0.0%) | 0 (0.0%) |
| Educational Services | 0 (0.0%) | 0 (0.0%) |
| Health Care & Social Assistance | 0 (0.0%) | 10 (100.0%) |
| Arts, Entertainment & Recreation | 0 (0.0%) | 0 (0.0%) |
| Accommodation & Food Services | 0 (0.0%) | 0 (0.0%) |
| Public Administration | 0 (0.0%) | 0 (0.0%) |
| Total | 15 (46.9%) | 17 (53.1%) |
Education in Inavale
School Enrollment in Inavale
| School Level | # Students | % Students |
| Nursery / Preschool | 0 | 0.0% |
| Kindergarten | 0 | 0.0% |
| Elementary School | 0 | 0.0% |
| Middle School | 0 | 0.0% |
| High School | 0 | 0.0% |
| College / Undergraduate | 0 | 0.0% |
| Graduate / Professional | 0 | 0.0% |
| Total | 0 | 0.0% |
School Enrollment by Age by Funding Source in Inavale
| Age Bracket | Public School | Private School |
| 3 to 4 Year Olds | 0 (0.0%) | 0 (0.0%) |
| 5 to 9 Year Old | 0 (0.0%) | 0 (0.0%) |
| 10 to 14 Year Olds | 0 (0.0%) | 0 (0.0%) |
| 15 to 17 Year Olds | 0 (0.0%) | 0 (0.0%) |
| 18 to 19 Year Olds | 0 (0.0%) | 0 (0.0%) |
| 20 to 24 Year Olds | 0 (0.0%) | 0 (0.0%) |
| 25 to 34 Year Olds | 0 (0.0%) | 0 (0.0%) |
| 35 Years and over | 0 (0.0%) | 0 (0.0%) |
| Total | 0 (0.0%) | 0 (0.0%) |
Educational Attainment by Field of Study in Inavale
, and education (1 | 100.0%) are the most common fields of study among 1 individuals in Inavale who have obtained a bachelor's degree or higher.
| Field of Study | # Graduates | % Graduates |
| Computers & Mathematics | 0 | 0.0% |
| Bio, Nature & Agricultural | 0 | 0.0% |
| Physical & Health Sciences | 0 | 0.0% |
| Psychology | 0 | 0.0% |
| Social Sciences | 0 | 0.0% |
| Engineering | 0 | 0.0% |
| Multidisciplinary Studies | 0 | 0.0% |
| Science & Technology | 0 | 0.0% |
| Business | 0 | 0.0% |
| Education | 1 | 100.0% |
| Literature & Languages | 0 | 0.0% |
| Liberal Arts & History | 0 | 0.0% |
| Visual & Performing Arts | 0 | 0.0% |
| Communications | 0 | 0.0% |
| Arts & Humanities | 0 | 0.0% |
| Total | 1 | 100.0% |
Transportation & Commute in Inavale
Vehicle Availability by Sex in Inavale
The most prevalent vehicle ownership categories in Inavale are males with 2 vehicles (10, accounting for 76.9%) and females with 2 vehicles (14, making up 58.8%).
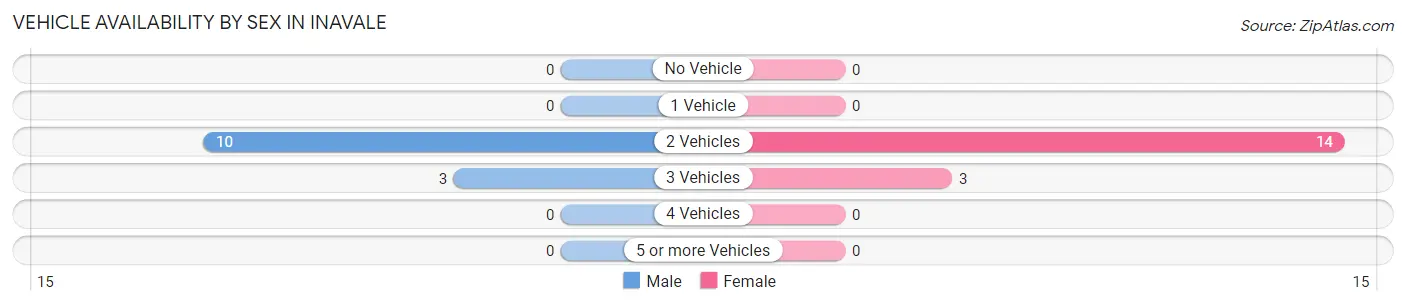
| Vehicles Available | Male | Female |
| No Vehicle | 0 (0.0%) | 0 (0.0%) |
| 1 Vehicle | 0 (0.0%) | 0 (0.0%) |
| 2 Vehicles | 10 (76.9%) | 14 (82.4%) |
| 3 Vehicles | 3 (23.1%) | 3 (17.6%) |
| 4 Vehicles | 0 (0.0%) | 0 (0.0%) |
| 5 or more Vehicles | 0 (0.0%) | 0 (0.0%) |
| Total | 13 (100.0%) | 17 (100.0%) |
Commute Time in Inavale
The most frequently occuring commute durations in Inavale are 10 to 14 minutes (11 commuters, 36.7%), 15 to 19 minutes (10 commuters, 33.3%), and 20 to 24 minutes (6 commuters, 20.0%).
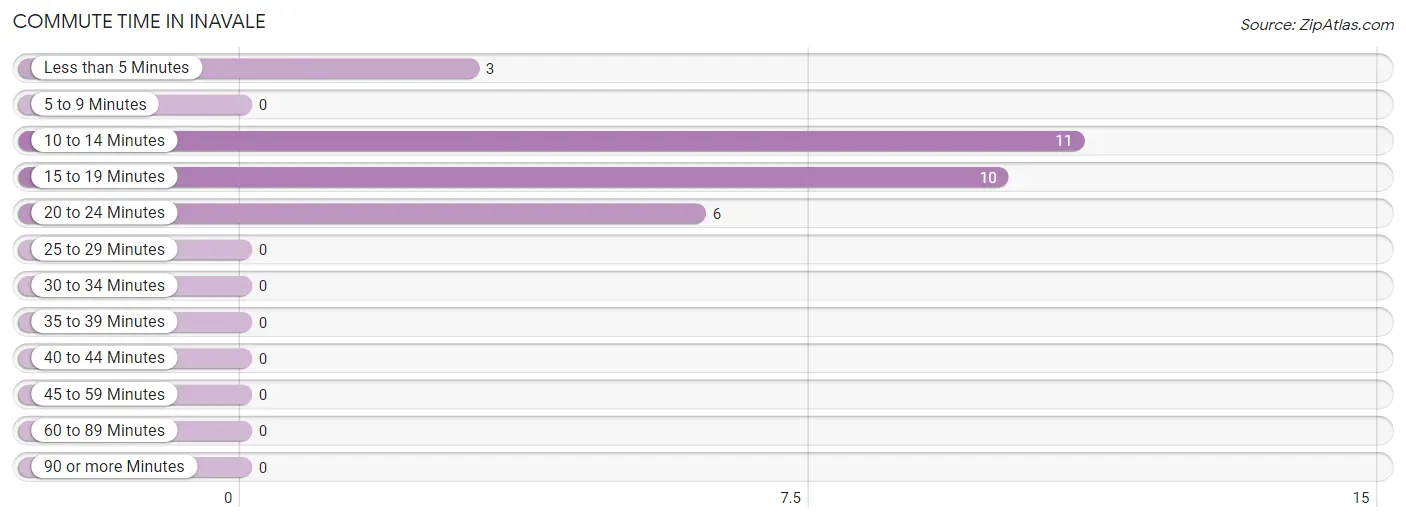
| Commute Time | # Commuters | % Commuters |
| Less than 5 Minutes | 3 | 10.0% |
| 5 to 9 Minutes | 0 | 0.0% |
| 10 to 14 Minutes | 11 | 36.7% |
| 15 to 19 Minutes | 10 | 33.3% |
| 20 to 24 Minutes | 6 | 20.0% |
| 25 to 29 Minutes | 0 | 0.0% |
| 30 to 34 Minutes | 0 | 0.0% |
| 35 to 39 Minutes | 0 | 0.0% |
| 40 to 44 Minutes | 0 | 0.0% |
| 45 to 59 Minutes | 0 | 0.0% |
| 60 to 89 Minutes | 0 | 0.0% |
| 90 or more Minutes | 0 | 0.0% |
Commute Time by Sex in Inavale
The most common commute times in Inavale are 15 to 19 minutes (10 commuters, 76.9%) for males and 10 to 14 minutes (11 commuters, 64.7%) for females.
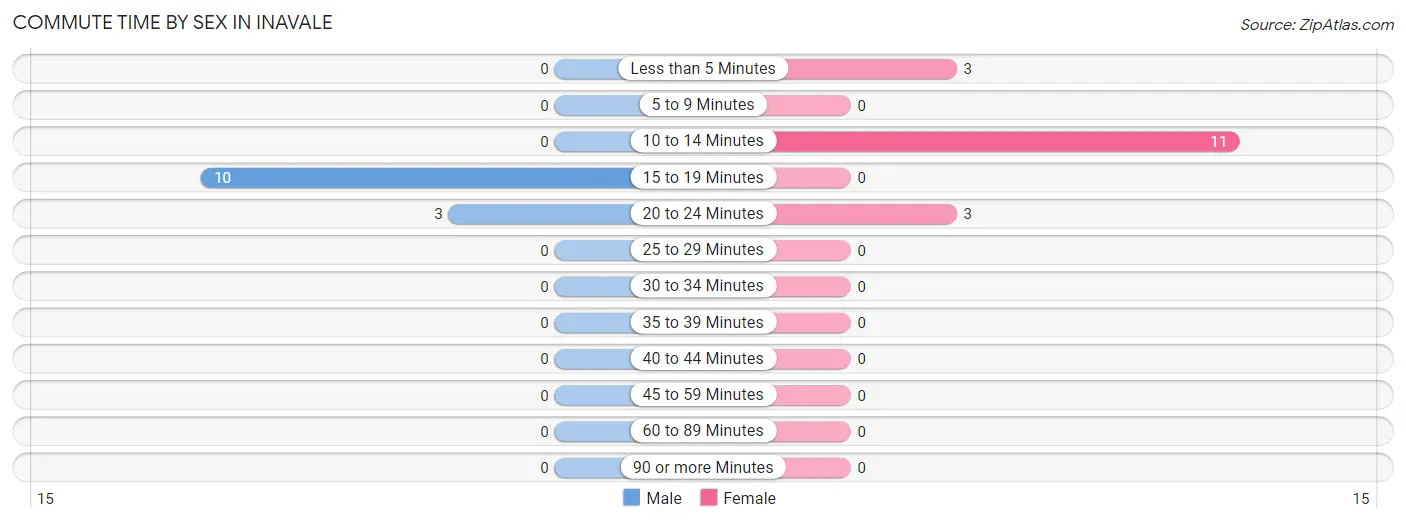
| Commute Time | Male | Female |
| Less than 5 Minutes | 0 (0.0%) | 3 (17.6%) |
| 5 to 9 Minutes | 0 (0.0%) | 0 (0.0%) |
| 10 to 14 Minutes | 0 (0.0%) | 11 (64.7%) |
| 15 to 19 Minutes | 10 (76.9%) | 0 (0.0%) |
| 20 to 24 Minutes | 3 (23.1%) | 3 (17.6%) |
| 25 to 29 Minutes | 0 (0.0%) | 0 (0.0%) |
| 30 to 34 Minutes | 0 (0.0%) | 0 (0.0%) |
| 35 to 39 Minutes | 0 (0.0%) | 0 (0.0%) |
| 40 to 44 Minutes | 0 (0.0%) | 0 (0.0%) |
| 45 to 59 Minutes | 0 (0.0%) | 0 (0.0%) |
| 60 to 89 Minutes | 0 (0.0%) | 0 (0.0%) |
| 90 or more Minutes | 0 (0.0%) | 0 (0.0%) |
Time of Departure to Work by Sex in Inavale
The most frequent times of departure to work in Inavale are 8:00 AM to 8:29 AM (10, 76.9%) for males and 6:00 AM to 6:29 AM (10, 58.8%) for females.
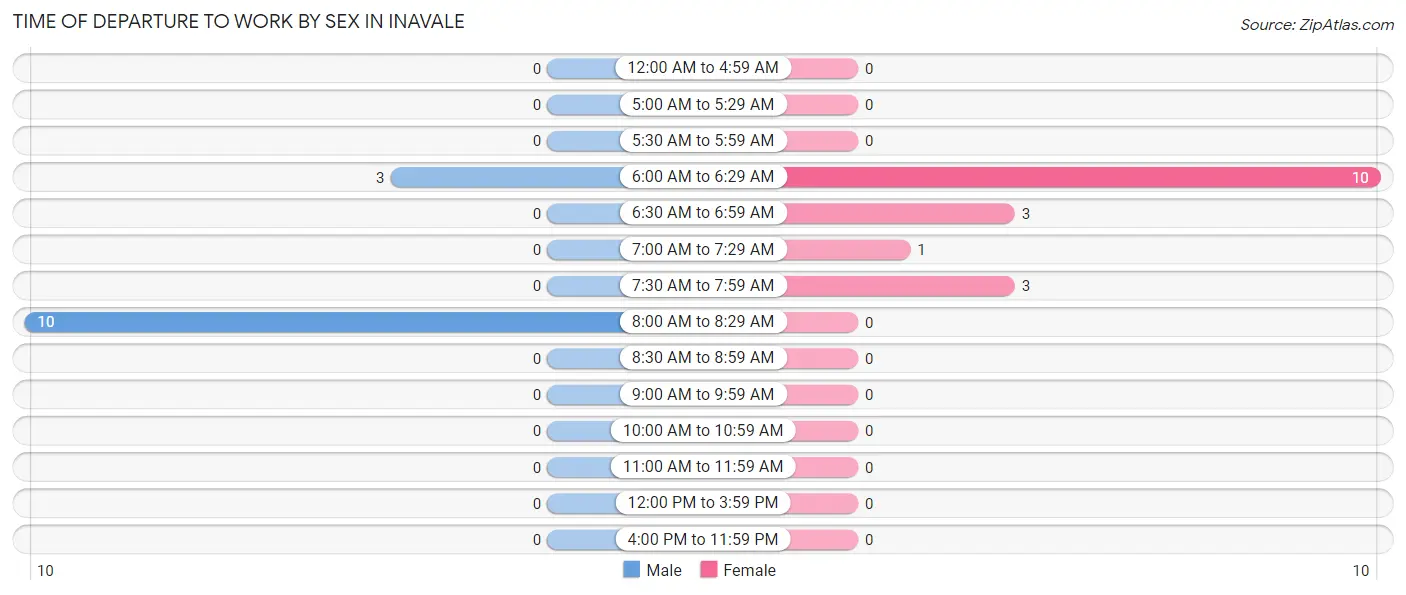
| Time of Departure | Male | Female |
| 12:00 AM to 4:59 AM | 0 (0.0%) | 0 (0.0%) |
| 5:00 AM to 5:29 AM | 0 (0.0%) | 0 (0.0%) |
| 5:30 AM to 5:59 AM | 0 (0.0%) | 0 (0.0%) |
| 6:00 AM to 6:29 AM | 3 (23.1%) | 10 (58.8%) |
| 6:30 AM to 6:59 AM | 0 (0.0%) | 3 (17.6%) |
| 7:00 AM to 7:29 AM | 0 (0.0%) | 1 (5.9%) |
| 7:30 AM to 7:59 AM | 0 (0.0%) | 3 (17.6%) |
| 8:00 AM to 8:29 AM | 10 (76.9%) | 0 (0.0%) |
| 8:30 AM to 8:59 AM | 0 (0.0%) | 0 (0.0%) |
| 9:00 AM to 9:59 AM | 0 (0.0%) | 0 (0.0%) |
| 10:00 AM to 10:59 AM | 0 (0.0%) | 0 (0.0%) |
| 11:00 AM to 11:59 AM | 0 (0.0%) | 0 (0.0%) |
| 12:00 PM to 3:59 PM | 0 (0.0%) | 0 (0.0%) |
| 4:00 PM to 11:59 PM | 0 (0.0%) | 0 (0.0%) |
| Total | 13 (100.0%) | 17 (100.0%) |
Housing Occupancy in Inavale
Occupancy by Ownership in Inavale
Of the total 30 dwellings in Inavale, owner-occupied units account for 20 (66.7%), while renter-occupied units make up 10 (33.3%).
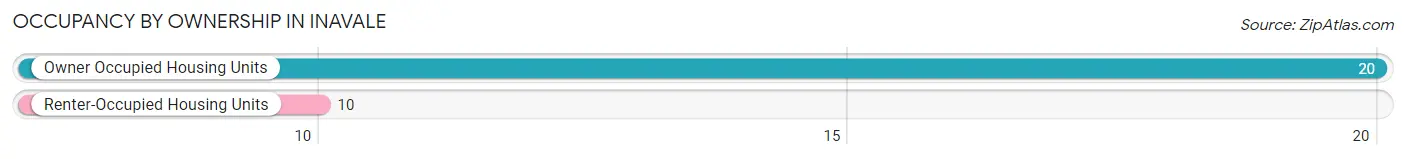
| Occupancy | # Housing Units | % Housing Units |
| Owner Occupied Housing Units | 20 | 66.7% |
| Renter-Occupied Housing Units | 10 | 33.3% |
| Total Occupied Housing Units | 30 | 100.0% |
Occupancy by Household Size in Inavale
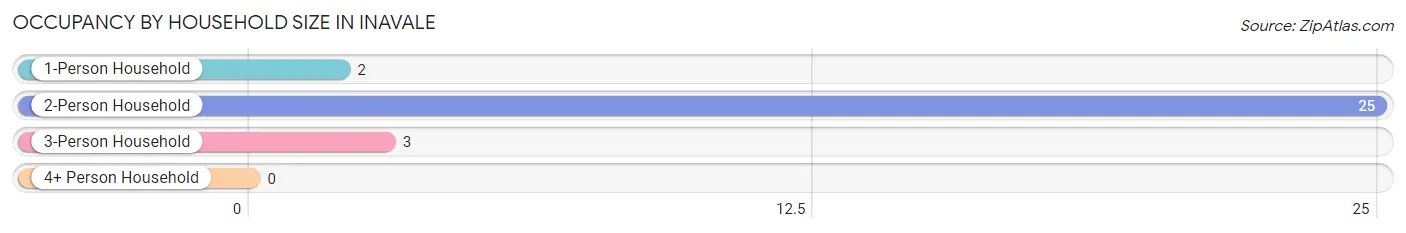
| Household Size | # Housing Units | % Housing Units |
| 1-Person Household | 2 | 6.7% |
| 2-Person Household | 25 | 83.3% |
| 3-Person Household | 3 | 10.0% |
| 4+ Person Household | 0 | 0.0% |
| Total Housing Units | 30 | 100.0% |
Occupancy by Ownership by Household Size in Inavale
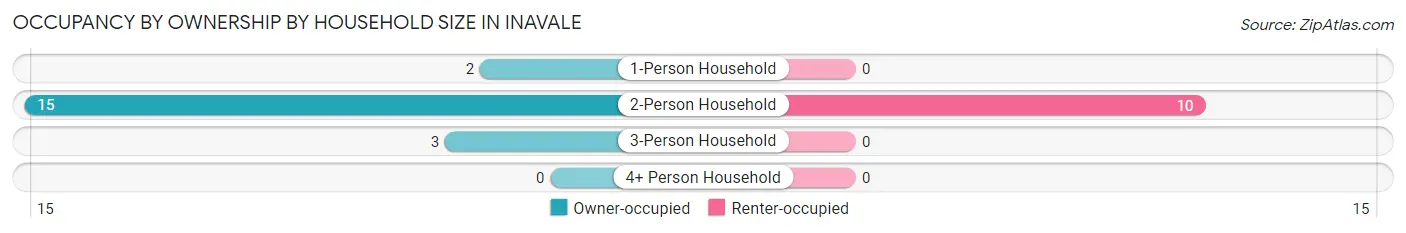
| Household Size | Owner-occupied | Renter-occupied |
| 1-Person Household | 2 (100.0%) | 0 (0.0%) |
| 2-Person Household | 15 (60.0%) | 10 (40.0%) |
| 3-Person Household | 3 (100.0%) | 0 (0.0%) |
| 4+ Person Household | 0 (0.0%) | 0 (0.0%) |
| Total Housing Units | 20 (66.7%) | 10 (33.3%) |
Occupancy by Educational Attainment in Inavale
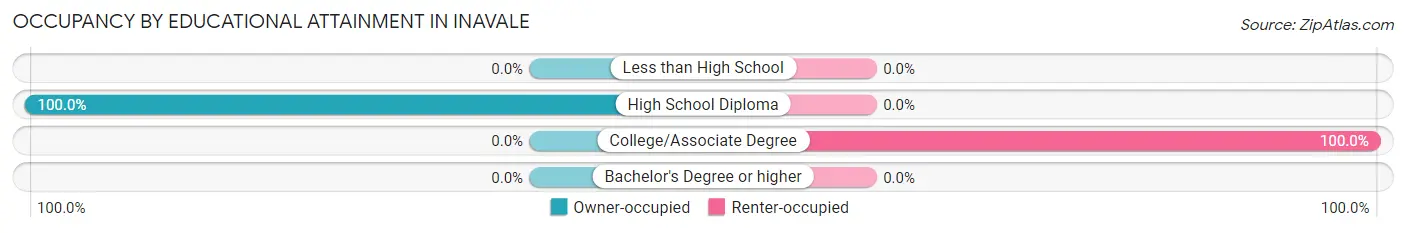
| Household Size | Owner-occupied | Renter-occupied |
| Less than High School | 0 (0.0%) | 0 (0.0%) |
| High School Diploma | 20 (100.0%) | 0 (0.0%) |
| College/Associate Degree | 0 (0.0%) | 10 (100.0%) |
| Bachelor's Degree or higher | 0 (0.0%) | 0 (0.0%) |
Occupancy by Age of Householder in Inavale
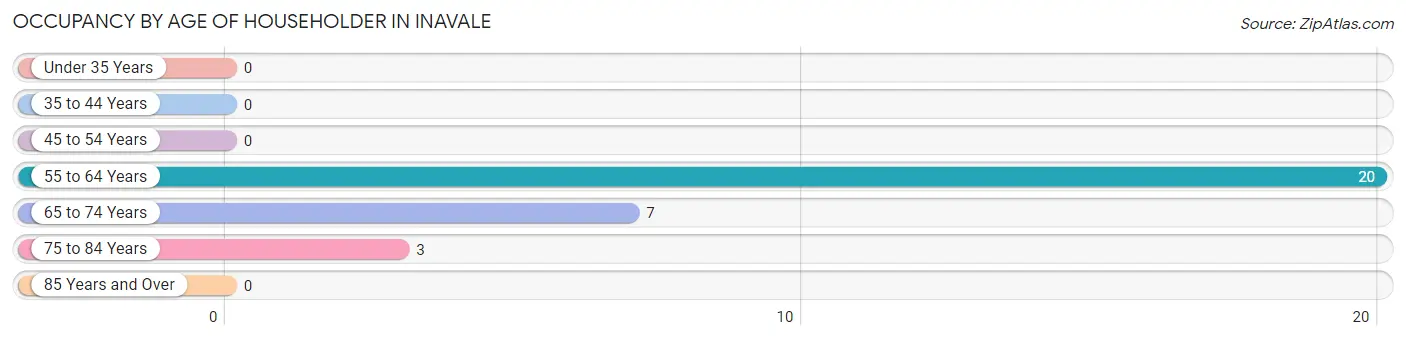
| Age Bracket | # Households | % Households |
| Under 35 Years | 0 | 0.0% |
| 35 to 44 Years | 0 | 0.0% |
| 45 to 54 Years | 0 | 0.0% |
| 55 to 64 Years | 20 | 66.7% |
| 65 to 74 Years | 7 | 23.3% |
| 75 to 84 Years | 3 | 10.0% |
| 85 Years and Over | 0 | 0.0% |
| Total | 30 | 100.0% |
Housing Finances in Inavale
Median Income by Occupancy in Inavale
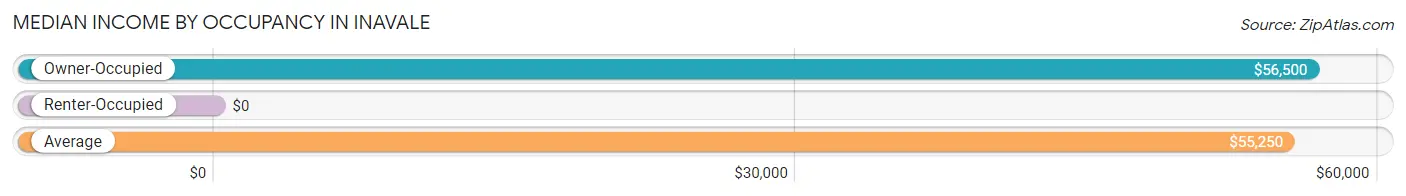
| Occupancy Type | # Households | Median Income |
| Owner-Occupied | 20 (66.7%) | $56,500 |
| Renter-Occupied | 10 (33.3%) | $0 |
| Average | 30 (100.0%) | $55,250 |
Occupancy by Householder Income Bracket in Inavale
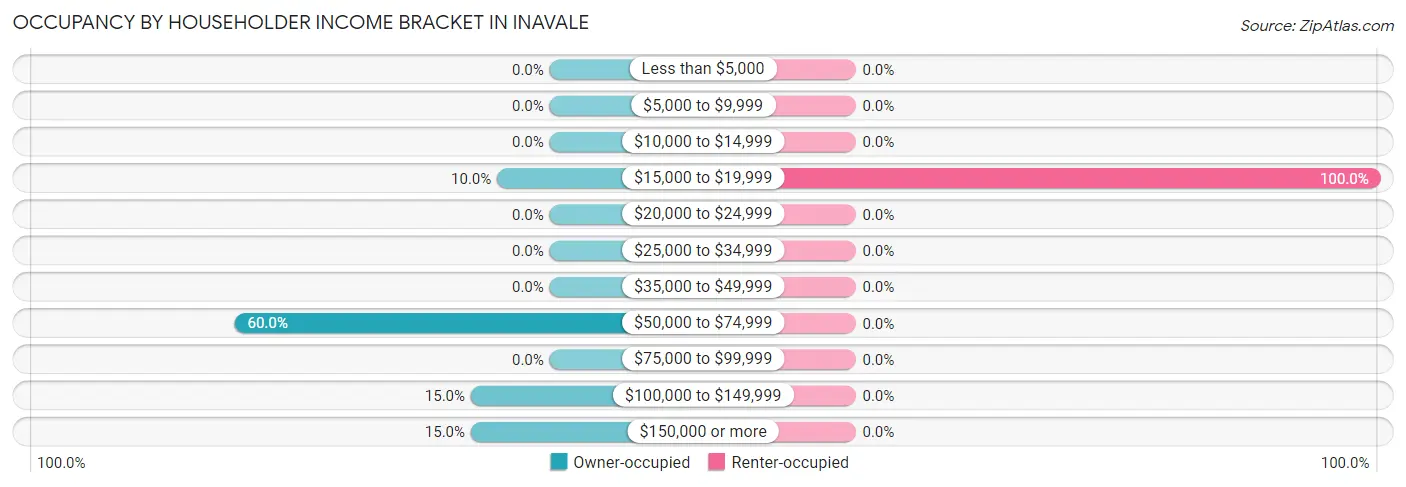
| Income Bracket | Owner-occupied | Renter-occupied |
| Less than $5,000 | 0 (0.0%) | 0 (0.0%) |
| $5,000 to $9,999 | 0 (0.0%) | 0 (0.0%) |
| $10,000 to $14,999 | 0 (0.0%) | 0 (0.0%) |
| $15,000 to $19,999 | 2 (10.0%) | 10 (100.0%) |
| $20,000 to $24,999 | 0 (0.0%) | 0 (0.0%) |
| $25,000 to $34,999 | 0 (0.0%) | 0 (0.0%) |
| $35,000 to $49,999 | 0 (0.0%) | 0 (0.0%) |
| $50,000 to $74,999 | 12 (60.0%) | 0 (0.0%) |
| $75,000 to $99,999 | 0 (0.0%) | 0 (0.0%) |
| $100,000 to $149,999 | 3 (15.0%) | 0 (0.0%) |
| $150,000 or more | 3 (15.0%) | 0 (0.0%) |
| Total | 20 (100.0%) | 10 (100.0%) |
Monthly Housing Cost Tiers in Inavale
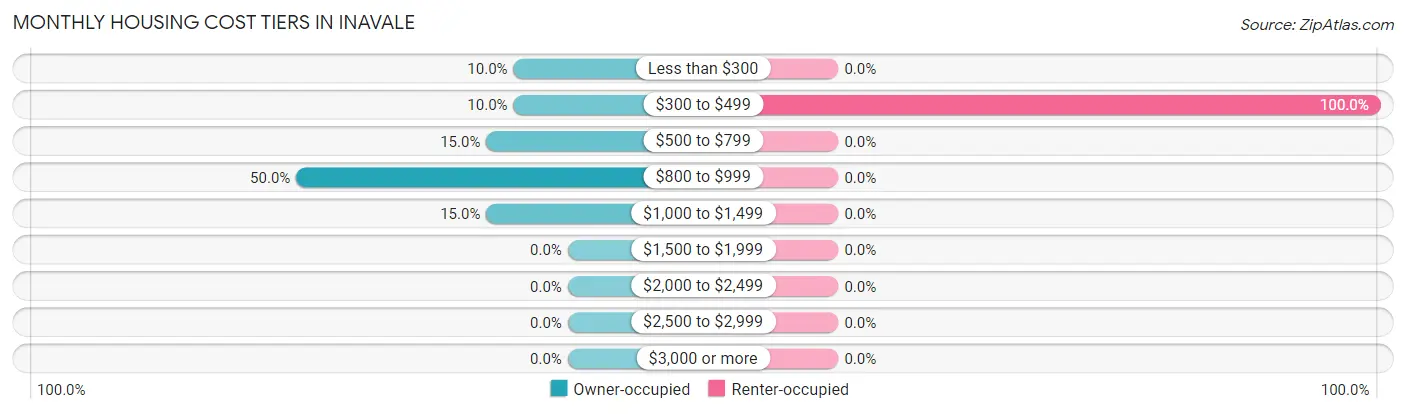
| Monthly Cost | Owner-occupied | Renter-occupied |
| Less than $300 | 2 (10.0%) | 0 (0.0%) |
| $300 to $499 | 2 (10.0%) | 10 (100.0%) |
| $500 to $799 | 3 (15.0%) | 0 (0.0%) |
| $800 to $999 | 10 (50.0%) | 0 (0.0%) |
| $1,000 to $1,499 | 3 (15.0%) | 0 (0.0%) |
| $1,500 to $1,999 | 0 (0.0%) | 0 (0.0%) |
| $2,000 to $2,499 | 0 (0.0%) | 0 (0.0%) |
| $2,500 to $2,999 | 0 (0.0%) | 0 (0.0%) |
| $3,000 or more | 0 (0.0%) | 0 (0.0%) |
| Total | 20 (100.0%) | 10 (100.0%) |
Physical Housing Characteristics in Inavale
Housing Structures in Inavale
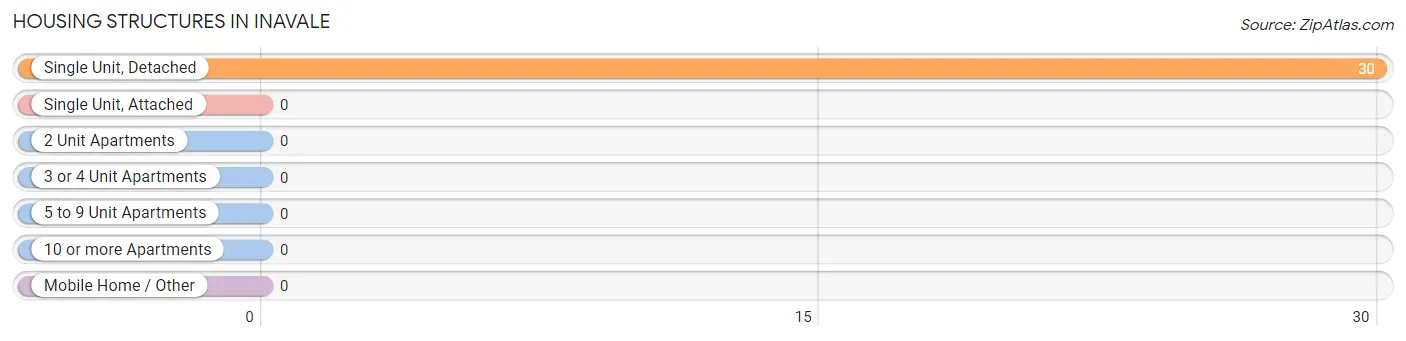
| Structure Type | # Housing Units | % Housing Units |
| Single Unit, Detached | 30 | 100.0% |
| Single Unit, Attached | 0 | 0.0% |
| 2 Unit Apartments | 0 | 0.0% |
| 3 or 4 Unit Apartments | 0 | 0.0% |
| 5 to 9 Unit Apartments | 0 | 0.0% |
| 10 or more Apartments | 0 | 0.0% |
| Mobile Home / Other | 0 | 0.0% |
| Total | 30 | 100.0% |
Housing Structures by Occupancy in Inavale
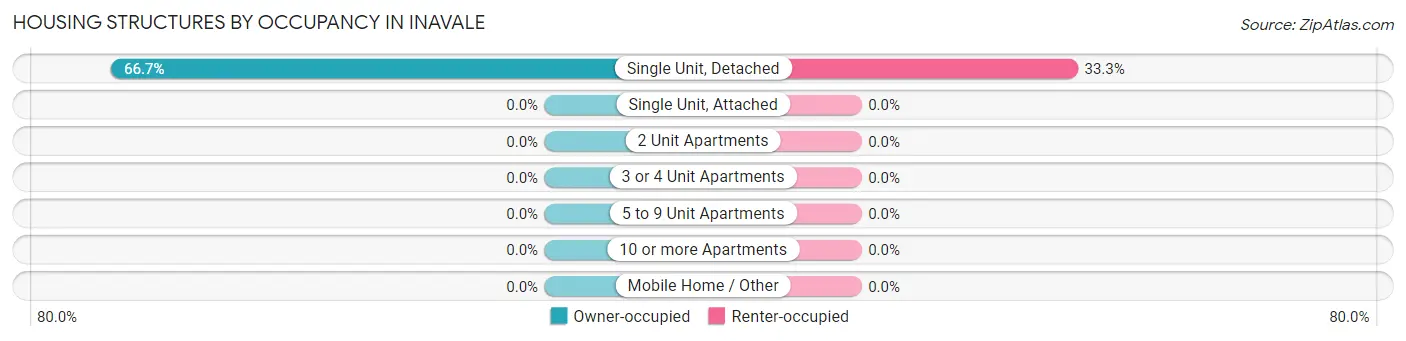
| Structure Type | Owner-occupied | Renter-occupied |
| Single Unit, Detached | 20 (66.7%) | 10 (33.3%) |
| Single Unit, Attached | 0 (0.0%) | 0 (0.0%) |
| 2 Unit Apartments | 0 (0.0%) | 0 (0.0%) |
| 3 or 4 Unit Apartments | 0 (0.0%) | 0 (0.0%) |
| 5 to 9 Unit Apartments | 0 (0.0%) | 0 (0.0%) |
| 10 or more Apartments | 0 (0.0%) | 0 (0.0%) |
| Mobile Home / Other | 0 (0.0%) | 0 (0.0%) |
| Total | 20 (66.7%) | 10 (33.3%) |
Housing Structures by Number of Rooms in Inavale
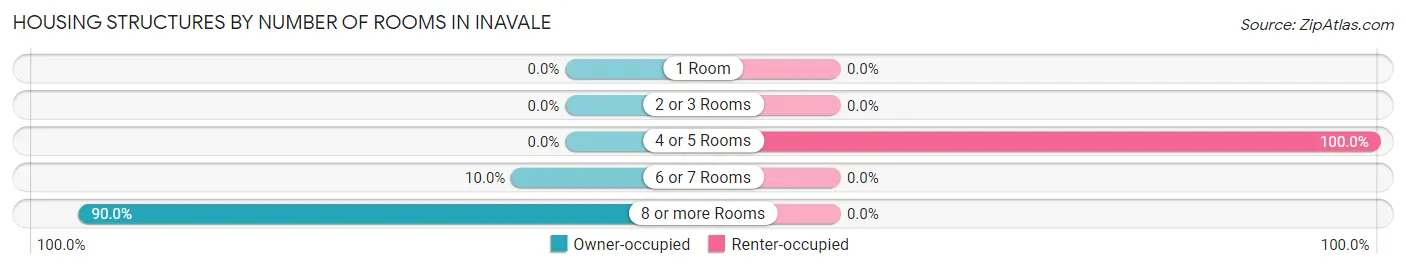
| Number of Rooms | Owner-occupied | Renter-occupied |
| 1 Room | 0 (0.0%) | 0 (0.0%) |
| 2 or 3 Rooms | 0 (0.0%) | 0 (0.0%) |
| 4 or 5 Rooms | 0 (0.0%) | 10 (100.0%) |
| 6 or 7 Rooms | 2 (10.0%) | 0 (0.0%) |
| 8 or more Rooms | 18 (90.0%) | 0 (0.0%) |
| Total | 20 (100.0%) | 10 (100.0%) |
Housing Structure by Heating Type in Inavale
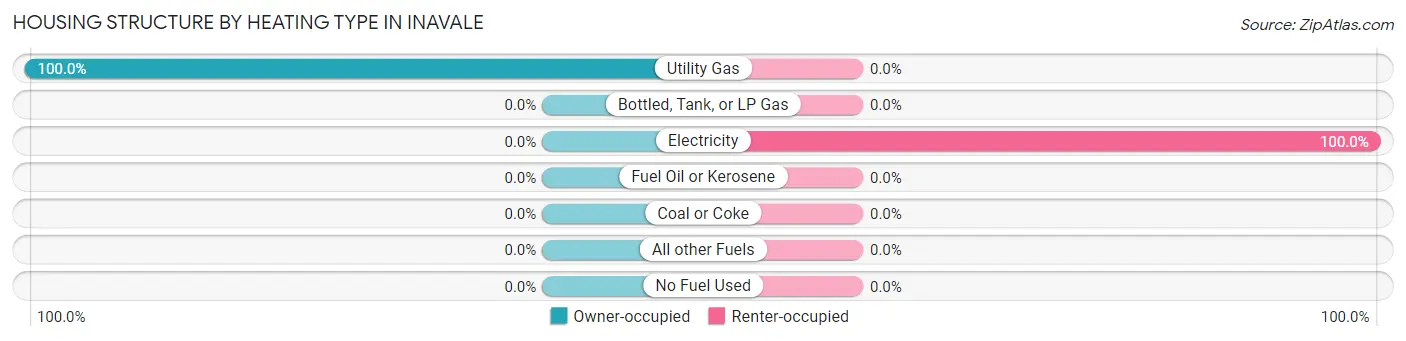
| Heating Type | Owner-occupied | Renter-occupied |
| Utility Gas | 20 (100.0%) | 0 (0.0%) |
| Bottled, Tank, or LP Gas | 0 (0.0%) | 0 (0.0%) |
| Electricity | 0 (0.0%) | 10 (100.0%) |
| Fuel Oil or Kerosene | 0 (0.0%) | 0 (0.0%) |
| Coal or Coke | 0 (0.0%) | 0 (0.0%) |
| All other Fuels | 0 (0.0%) | 0 (0.0%) |
| No Fuel Used | 0 (0.0%) | 0 (0.0%) |
| Total | 20 (100.0%) | 10 (100.0%) |
Household Vehicle Usage in Inavale
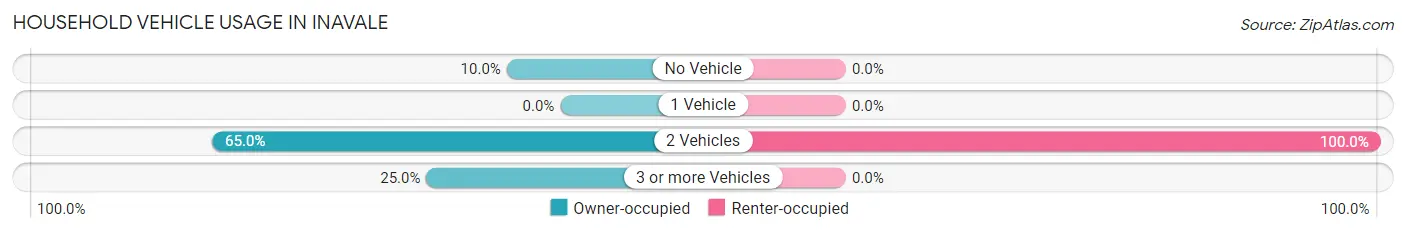
| Vehicles per Household | Owner-occupied | Renter-occupied |
| No Vehicle | 2 (10.0%) | 0 (0.0%) |
| 1 Vehicle | 0 (0.0%) | 0 (0.0%) |
| 2 Vehicles | 13 (65.0%) | 10 (100.0%) |
| 3 or more Vehicles | 5 (25.0%) | 0 (0.0%) |
| Total | 20 (100.0%) | 10 (100.0%) |
Real Estate & Mortgages in Inavale
Real Estate and Mortgage Overview in Inavale
| Characteristic | Without Mortgage | With Mortgage |
| Housing Units | 4 | 16 |
| Median Property Value | - | - |
| Median Household Income | - | - |
| Monthly Housing Costs | - | - |
| Real Estate Taxes | - | - |
Property Value by Mortgage Status in Inavale
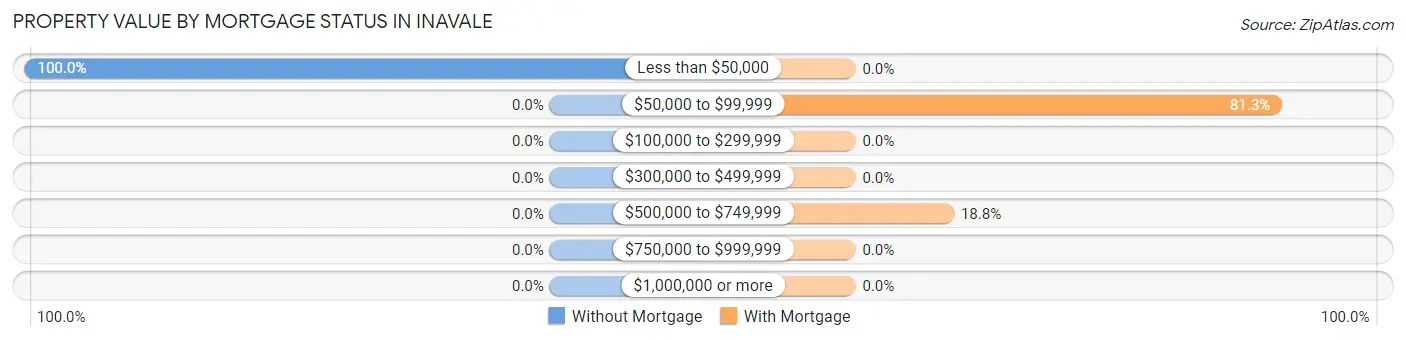
| Property Value | Without Mortgage | With Mortgage |
| Less than $50,000 | 4 (100.0%) | 0 (0.0%) |
| $50,000 to $99,999 | 0 (0.0%) | 13 (81.2%) |
| $100,000 to $299,999 | 0 (0.0%) | 0 (0.0%) |
| $300,000 to $499,999 | 0 (0.0%) | 0 (0.0%) |
| $500,000 to $749,999 | 0 (0.0%) | 3 (18.8%) |
| $750,000 to $999,999 | 0 (0.0%) | 0 (0.0%) |
| $1,000,000 or more | 0 (0.0%) | 0 (0.0%) |
| Total | 4 (100.0%) | 16 (100.0%) |
Household Income by Mortgage Status in Inavale
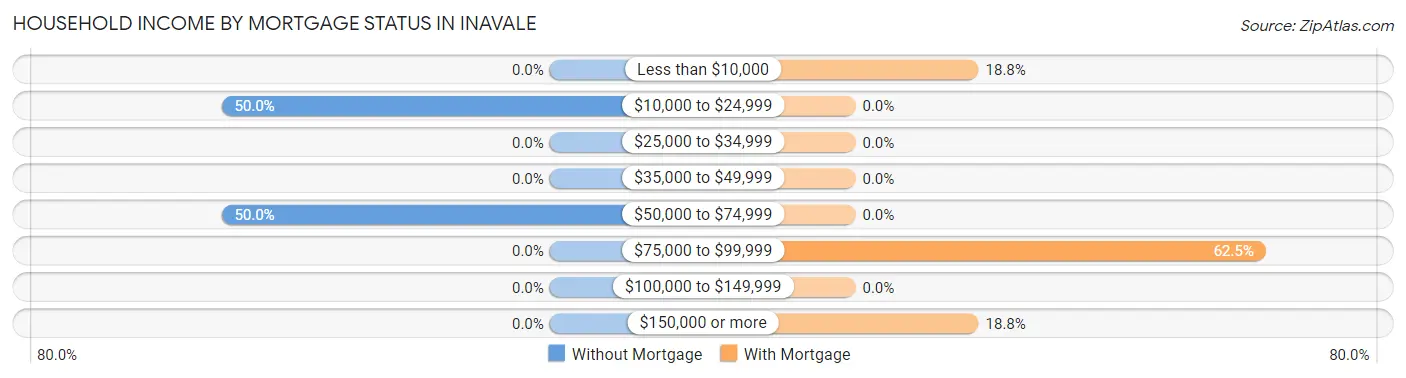
| Household Income | Without Mortgage | With Mortgage |
| Less than $10,000 | 0 (0.0%) | 3 (18.8%) |
| $10,000 to $24,999 | 2 (50.0%) | 0 (0.0%) |
| $25,000 to $34,999 | 0 (0.0%) | 0 (0.0%) |
| $35,000 to $49,999 | 0 (0.0%) | 0 (0.0%) |
| $50,000 to $74,999 | 2 (50.0%) | 0 (0.0%) |
| $75,000 to $99,999 | 0 (0.0%) | 10 (62.5%) |
| $100,000 to $149,999 | 0 (0.0%) | 0 (0.0%) |
| $150,000 or more | 0 (0.0%) | 3 (18.8%) |
| Total | 4 (100.0%) | 16 (100.0%) |
Property Value to Household Income Ratio in Inavale
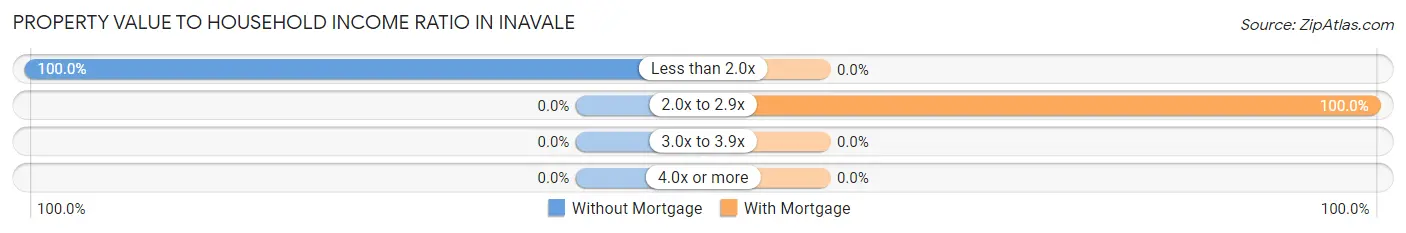
| Value-to-Income Ratio | Without Mortgage | With Mortgage |
| Less than 2.0x | 4 (100.0%) | 0 (0.0%) |
| 2.0x to 2.9x | 0 (0.0%) | 16 (100.0%) |
| 3.0x to 3.9x | 0 (0.0%) | 0 (0.0%) |
| 4.0x or more | 0 (0.0%) | 0 (0.0%) |
| Total | 4 (100.0%) | 16 (100.0%) |
Real Estate Taxes by Mortgage Status in Inavale
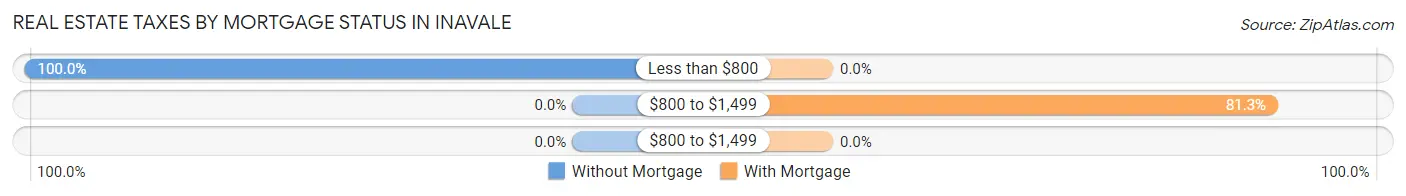
| Property Taxes | Without Mortgage | With Mortgage |
| Less than $800 | 4 (100.0%) | 0 (0.0%) |
| $800 to $1,499 | 0 (0.0%) | 13 (81.2%) |
| $800 to $1,499 | 0 (0.0%) | 0 (0.0%) |
| Total | 4 (100.0%) | 16 (100.0%) |
Health & Disability in Inavale
Health Insurance Coverage by Age in Inavale
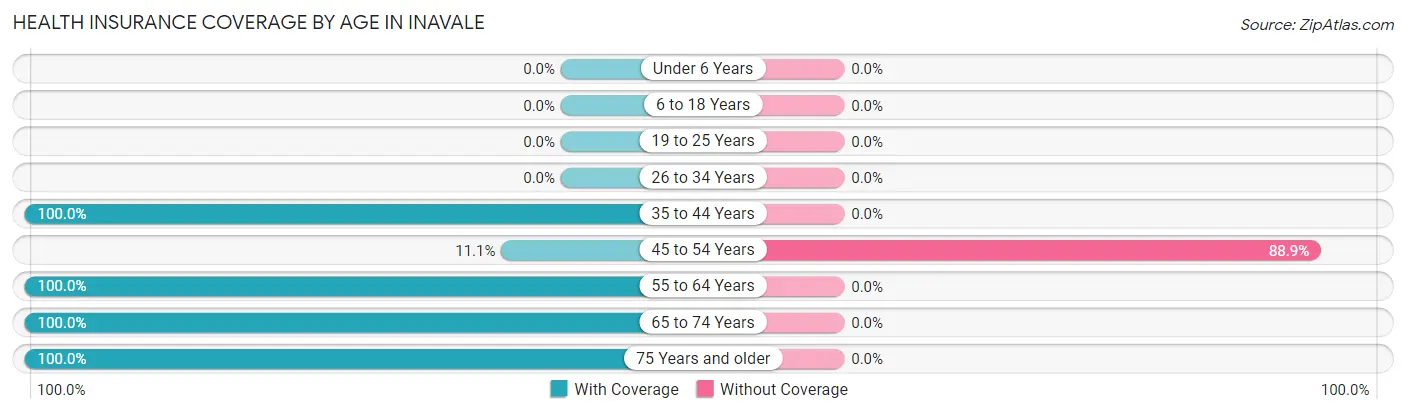
| Age Bracket | With Coverage | Without Coverage |
| Under 6 Years | 0 (0.0%) | 0 (0.0%) |
| 6 to 18 Years | 0 (0.0%) | 0 (0.0%) |
| 19 to 25 Years | 0 (0.0%) | 0 (0.0%) |
| 26 to 34 Years | 0 (0.0%) | 0 (0.0%) |
| 35 to 44 Years | 2 (100.0%) | 0 (0.0%) |
| 45 to 54 Years | 1 (11.1%) | 8 (88.9%) |
| 55 to 64 Years | 23 (100.0%) | 0 (0.0%) |
| 65 to 74 Years | 13 (100.0%) | 0 (0.0%) |
| 75 Years and older | 3 (100.0%) | 0 (0.0%) |
| Total | 42 (84.0%) | 8 (16.0%) |
Health Insurance Coverage by Citizenship Status in Inavale
| Citizenship Status | With Coverage | Without Coverage |
| Native Born | 0 (0.0%) | 0 (0.0%) |
| Foreign Born, Citizen | 0 (0.0%) | 0 (0.0%) |
| Foreign Born, not a Citizen | 0 (0.0%) | 0 (0.0%) |
Health Insurance Coverage by Household Income in Inavale
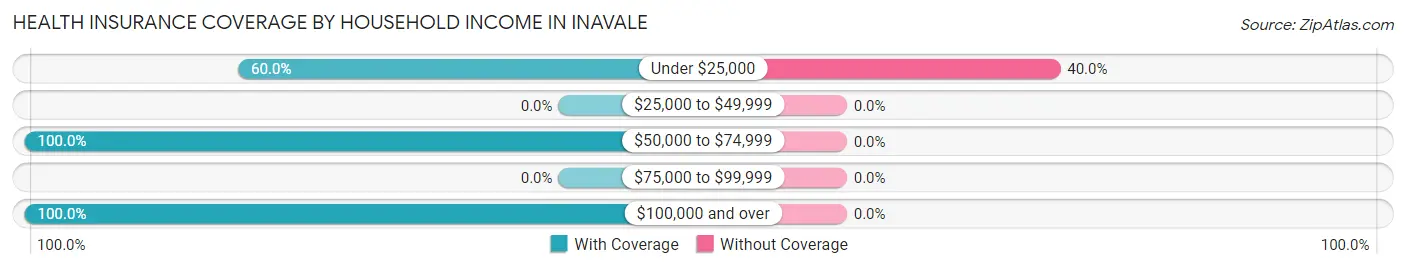
| Household Income | With Coverage | Without Coverage |
| Under $25,000 | 12 (60.0%) | 8 (40.0%) |
| $25,000 to $49,999 | 0 (0.0%) | 0 (0.0%) |
| $50,000 to $74,999 | 18 (100.0%) | 0 (0.0%) |
| $75,000 to $99,999 | 0 (0.0%) | 0 (0.0%) |
| $100,000 and over | 12 (100.0%) | 0 (0.0%) |
Public vs Private Health Insurance Coverage by Age in Inavale
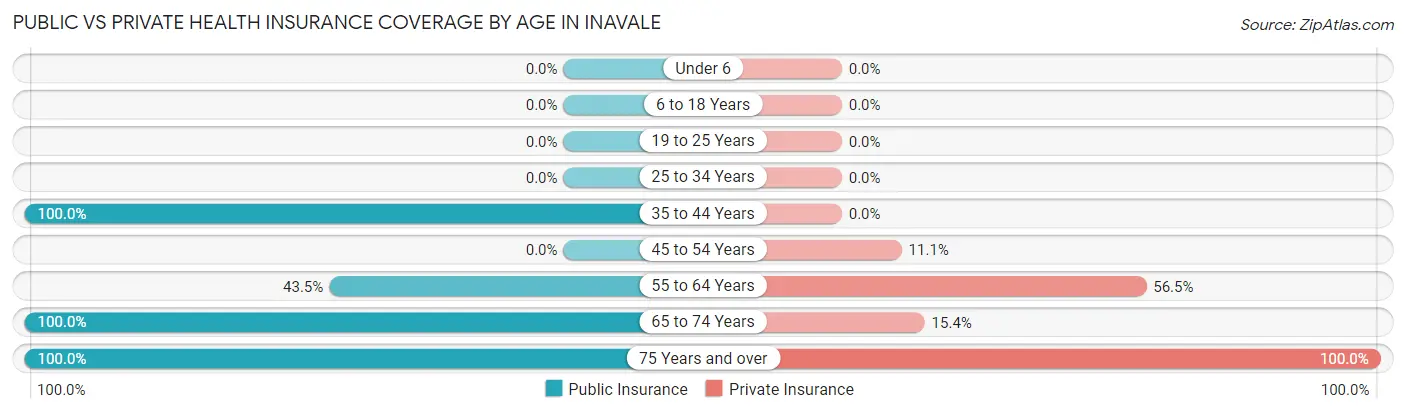
| Age Bracket | Public Insurance | Private Insurance |
| Under 6 | 0 (0.0%) | 0 (0.0%) |
| 6 to 18 Years | 0 (0.0%) | 0 (0.0%) |
| 19 to 25 Years | 0 (0.0%) | 0 (0.0%) |
| 25 to 34 Years | 0 (0.0%) | 0 (0.0%) |
| 35 to 44 Years | 2 (100.0%) | 0 (0.0%) |
| 45 to 54 Years | 0 (0.0%) | 1 (11.1%) |
| 55 to 64 Years | 10 (43.5%) | 13 (56.5%) |
| 65 to 74 Years | 13 (100.0%) | 2 (15.4%) |
| 75 Years and over | 3 (100.0%) | 3 (100.0%) |
| Total | 28 (56.0%) | 19 (38.0%) |
Disability Status by Sex by Age in Inavale
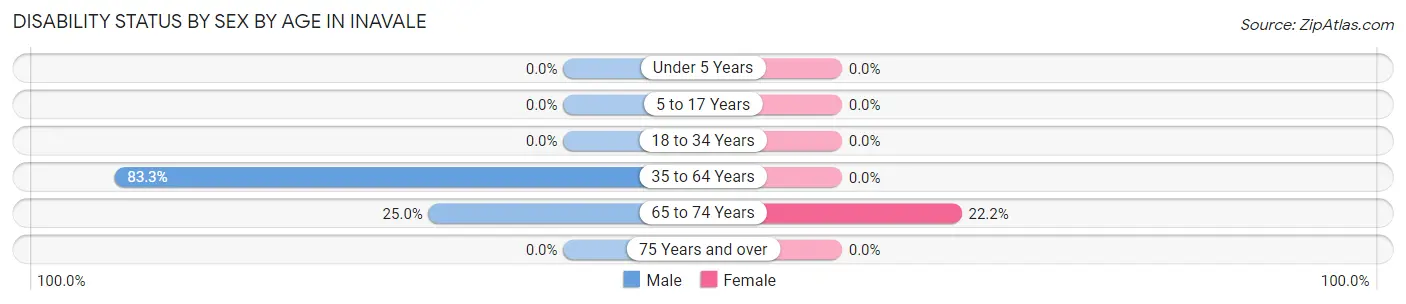
| Age Bracket | Male | Female |
| Under 5 Years | 0 (0.0%) | 0 (0.0%) |
| 5 to 17 Years | 0 (0.0%) | 0 (0.0%) |
| 18 to 34 Years | 0 (0.0%) | 0 (0.0%) |
| 35 to 64 Years | 10 (83.3%) | 0 (0.0%) |
| 65 to 74 Years | 1 (25.0%) | 2 (22.2%) |
| 75 Years and over | 0 (0.0%) | 0 (0.0%) |
Disability Class by Sex by Age in Inavale
Disability Class: Hearing Difficulty
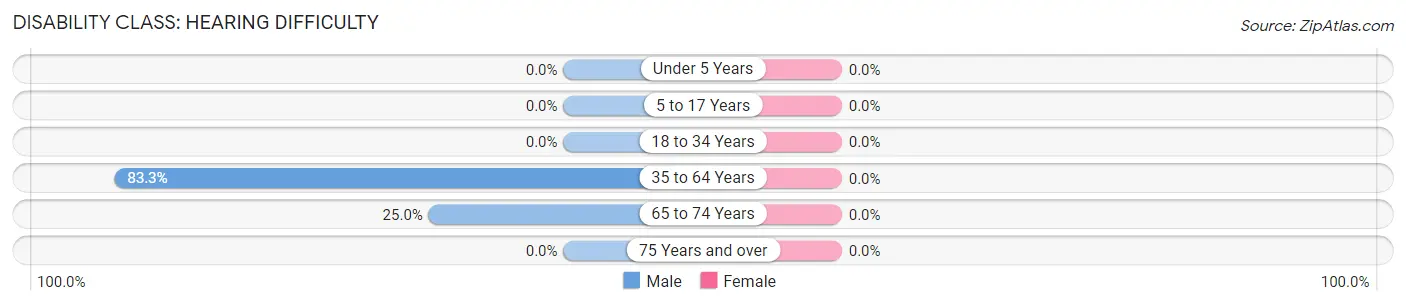
| Age Bracket | Male | Female |
| Under 5 Years | 0 (0.0%) | 0 (0.0%) |
| 5 to 17 Years | 0 (0.0%) | 0 (0.0%) |
| 18 to 34 Years | 0 (0.0%) | 0 (0.0%) |
| 35 to 64 Years | 10 (83.3%) | 0 (0.0%) |
| 65 to 74 Years | 1 (25.0%) | 0 (0.0%) |
| 75 Years and over | 0 (0.0%) | 0 (0.0%) |
Disability Class: Vision Difficulty
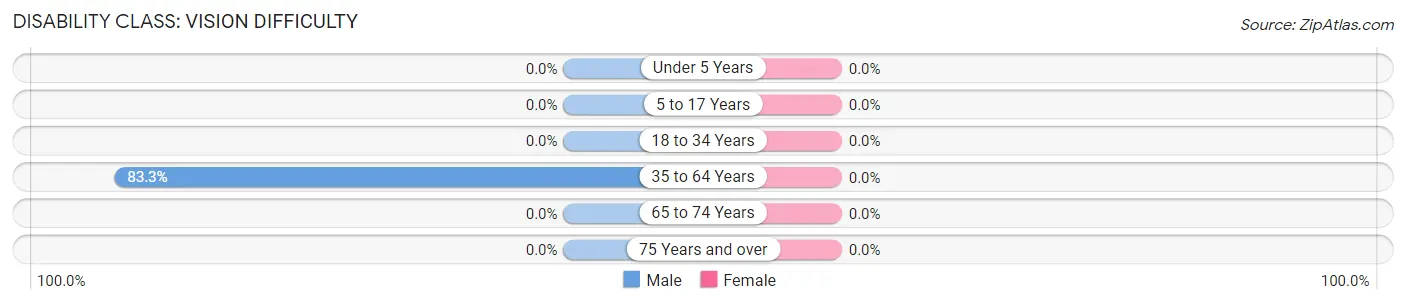
| Age Bracket | Male | Female |
| Under 5 Years | 0 (0.0%) | 0 (0.0%) |
| 5 to 17 Years | 0 (0.0%) | 0 (0.0%) |
| 18 to 34 Years | 0 (0.0%) | 0 (0.0%) |
| 35 to 64 Years | 10 (83.3%) | 0 (0.0%) |
| 65 to 74 Years | 0 (0.0%) | 0 (0.0%) |
| 75 Years and over | 0 (0.0%) | 0 (0.0%) |
Disability Class: Cognitive Difficulty
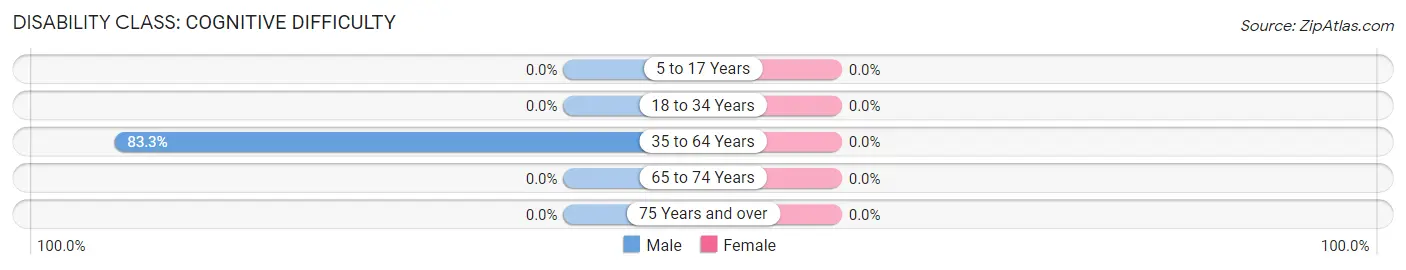
| Age Bracket | Male | Female |
| 5 to 17 Years | 0 (0.0%) | 0 (0.0%) |
| 18 to 34 Years | 0 (0.0%) | 0 (0.0%) |
| 35 to 64 Years | 10 (83.3%) | 0 (0.0%) |
| 65 to 74 Years | 0 (0.0%) | 0 (0.0%) |
| 75 Years and over | 0 (0.0%) | 0 (0.0%) |
Disability Class: Ambulatory Difficulty
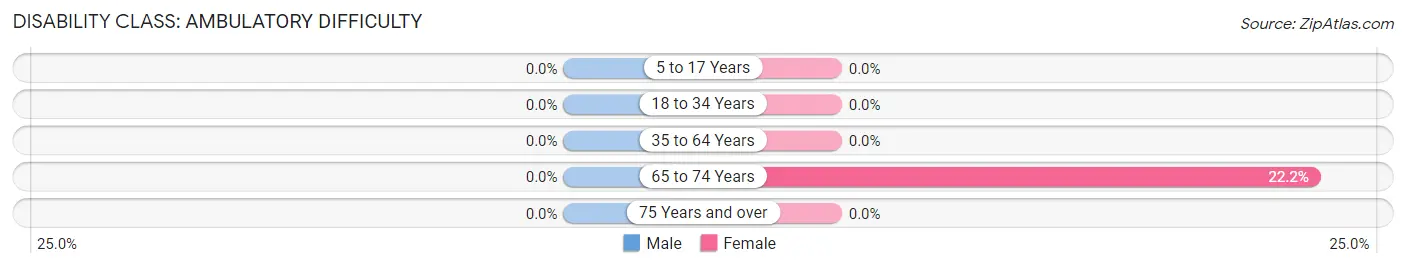
| Age Bracket | Male | Female |
| 5 to 17 Years | 0 (0.0%) | 0 (0.0%) |
| 18 to 34 Years | 0 (0.0%) | 0 (0.0%) |
| 35 to 64 Years | 0 (0.0%) | 0 (0.0%) |
| 65 to 74 Years | 0 (0.0%) | 2 (22.2%) |
| 75 Years and over | 0 (0.0%) | 0 (0.0%) |
Disability Class: Self-Care Difficulty
| Age Bracket | Male | Female |
| 5 to 17 Years | 0 (0.0%) | 0 (0.0%) |
| 18 to 34 Years | 0 (0.0%) | 0 (0.0%) |
| 35 to 64 Years | 0 (0.0%) | 0 (0.0%) |
| 65 to 74 Years | 0 (0.0%) | 0 (0.0%) |
| 75 Years and over | 0 (0.0%) | 0 (0.0%) |
Technology Access in Inavale
Computing Device Access in Inavale
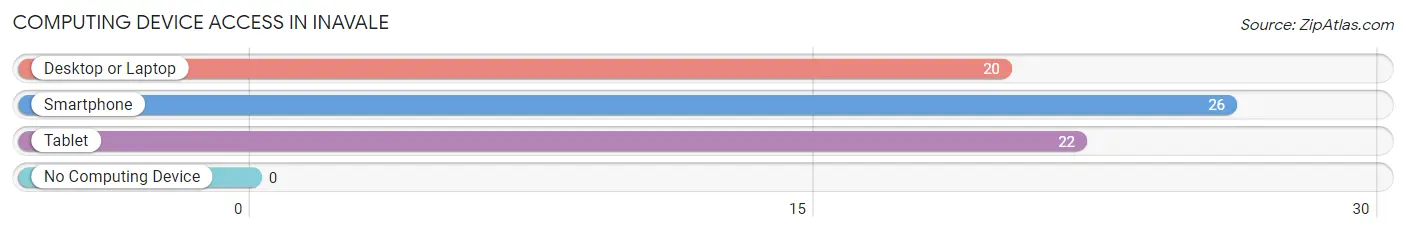
| Device Type | # Households | % Households |
| Desktop or Laptop | 20 | 66.7% |
| Smartphone | 26 | 86.7% |
| Tablet | 22 | 73.3% |
| No Computing Device | 0 | 0.0% |
| Total | 30 | 100.0% |
Internet Access in Inavale
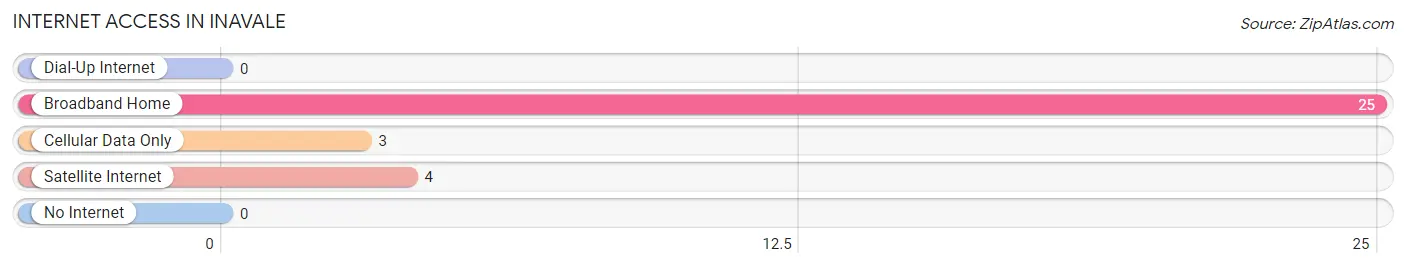
| Internet Type | # Households | % Households |
| Dial-Up Internet | 0 | 0.0% |
| Broadband Home | 25 | 83.3% |
| Cellular Data Only | 3 | 10.0% |
| Satellite Internet | 4 | 13.3% |
| No Internet | 0 | 0.0% |
| Total | 30 | 100.0% |
Inavale Summary
Inavale is a small unincorporated community located in the western part of Nebraska, in the United States. It is situated in the Sandhills region of the state, and is part of the North Platte Micropolitan Statistical Area. The population of Inavale was estimated to be around 200 people in 2020.
History
Inavale was founded in 1887 by a group of settlers from Iowa. The town was named after a nearby creek, which was named by the settlers after a Native American word meaning “valley of the wind”. The town was originally a farming community, and the settlers grew wheat, corn, and other crops.
In the early 1900s, the town began to grow and prosper. A post office was established in 1906, and a school was built in 1908. The town also had a general store, a blacksmith shop, and a hotel.
In the 1920s, the town began to decline. The Great Depression caused many of the town’s businesses to close, and the population began to dwindle. By the 1950s, the population had dropped to around 100 people.
In the late 1970s, the town began to experience a resurgence. The population began to grow again, and new businesses opened. Today, Inavale is a small but thriving community.
Geography
Inavale is located in western Nebraska, in the Sandhills region of the state. It is situated in Lincoln County, and is part of the North Platte Micropolitan Statistical Area. The town is located about 25 miles west of North Platte, and about 50 miles east of Ogallala.
The terrain around Inavale is mostly flat, with some rolling hills. The town is located in the middle of the Sandhills, which are a series of low, sandy hills that cover much of western Nebraska. The area is known for its wide open spaces and beautiful sunsets.
Economy
Inavale’s economy is largely based on agriculture. The town is surrounded by farms and ranches, and many of the town’s residents are employed in the agricultural industry. The town also has a few small businesses, including a general store, a gas station, and a restaurant.
Demographics
Inavale has a population of around 200 people. The town is predominantly white, with a small Hispanic population. The median household income is around $45,000, and the median home value is around $90,000.
Inavale is a small but vibrant community. The town has a strong sense of community, and the residents are friendly and welcoming. The town is a great place to live, work, and raise a family.
Common Questions
What is Per Capita Income in Inavale?
Per Capita income in Inavale is $113,898.
What is the Median Family Income in Inavale?
Median Family Income in Inavale is $55,500.
What is the Median Household income in Inavale?
Median Household Income in Inavale is $55,250.
What is Inequality or Gini Index in Inavale?
Inequality or Gini Index in Inavale is 0.80.
What is the Total Population of Inavale?
Total Population of Inavale is 50.
What is the Total Male Population of Inavale?
Total Male Population of Inavale is 16.
What is the Total Female Population of Inavale?
Total Female Population of Inavale is 34.
What is the Ratio of Males per 100 Females in Inavale?
There are 47.06 Males per 100 Females in Inavale.
What is the Ratio of Females per 100 Males in Inavale?
There are 212.50 Females per 100 Males in Inavale.
What is the Median Population Age in Inavale?
Median Population Age in Inavale is 64.1 Years.
What is the Average Family Size in Inavale
Average Family Size in Inavale is 1.7 People.
What is the Average Household Size in Inavale
Average Household Size in Inavale is 1.7 People.
How Large is the Labor Force in Inavale?
There are 32 People in the Labor Forcein in Inavale.
What is the Percentage of People in the Labor Force in Inavale?
64.0% of People are in the Labor Force in Inavale.