Woodville, TX Map & Demographics
Woodville Map
Woodville Overview
$58,392
PER CAPITA INCOME
$62,321
AVG FAMILY INCOME
$42,778
AVG HOUSEHOLD INCOME
55.3%
WAGE / INCOME GAP [ % ]
44.7¢/ $1
WAGE / INCOME GAP [ $ ]
0.73
INEQUALITY / GINI INDEX
3,081
TOTAL POPULATION
1,393
MALE POPULATION
1,688
FEMALE POPULATION
82.52
MALES / 100 FEMALES
121.18
FEMALES / 100 MALES
37.0
MEDIAN AGE
2.9
AVG FAMILY SIZE
2.4
AVG HOUSEHOLD SIZE
1,441
LABOR FORCE [ PEOPLE ]
59.7%
PERCENT IN LABOR FORCE
7.9%
UNEMPLOYMENT RATE
Woodville Zip Codes
Woodville Area Codes
Income in Woodville
Income Overview in Woodville
Per Capita Income in Woodville is $58,392, while median incomes of families and households are $62,321 and $42,778 respectively.
| Characteristic | Number | Measure |
| Per Capita Income | 3,081 | $58,392 |
| Median Family Income | 849 | $62,321 |
| Mean Family Income | 849 | $173,933 |
| Median Household Income | 1,218 | $42,778 |
| Mean Household Income | 1,218 | $131,660 |
| Income Deficit | 849 | $0 |
| Wage / Income Gap (%) | 3,081 | 55.34% |
| Wage / Income Gap ($) | 3,081 | 44.66¢ per $1 |
| Gini / Inequality Index | 3,081 | 0.73 |
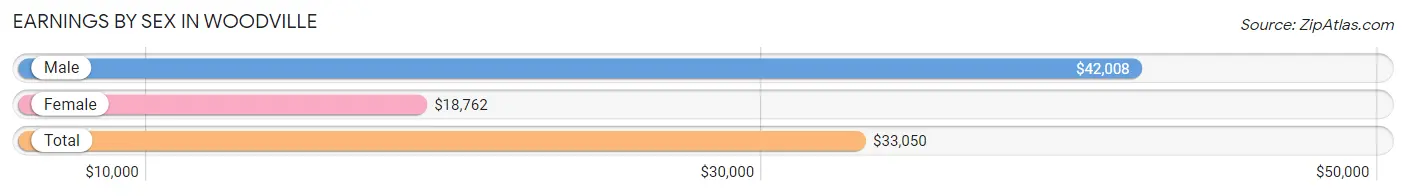
Earnings by Sex in Woodville
Average Earnings in Woodville are $33,050, $42,008 for men and $18,762 for women, a difference of 55.3%.
| Sex | Number | Average Earnings |
| Male | 599 (40.4%) | $42,008 |
| Female | 883 (59.6%) | $18,762 |
| Total | 1,482 (100.0%) | $33,050 |
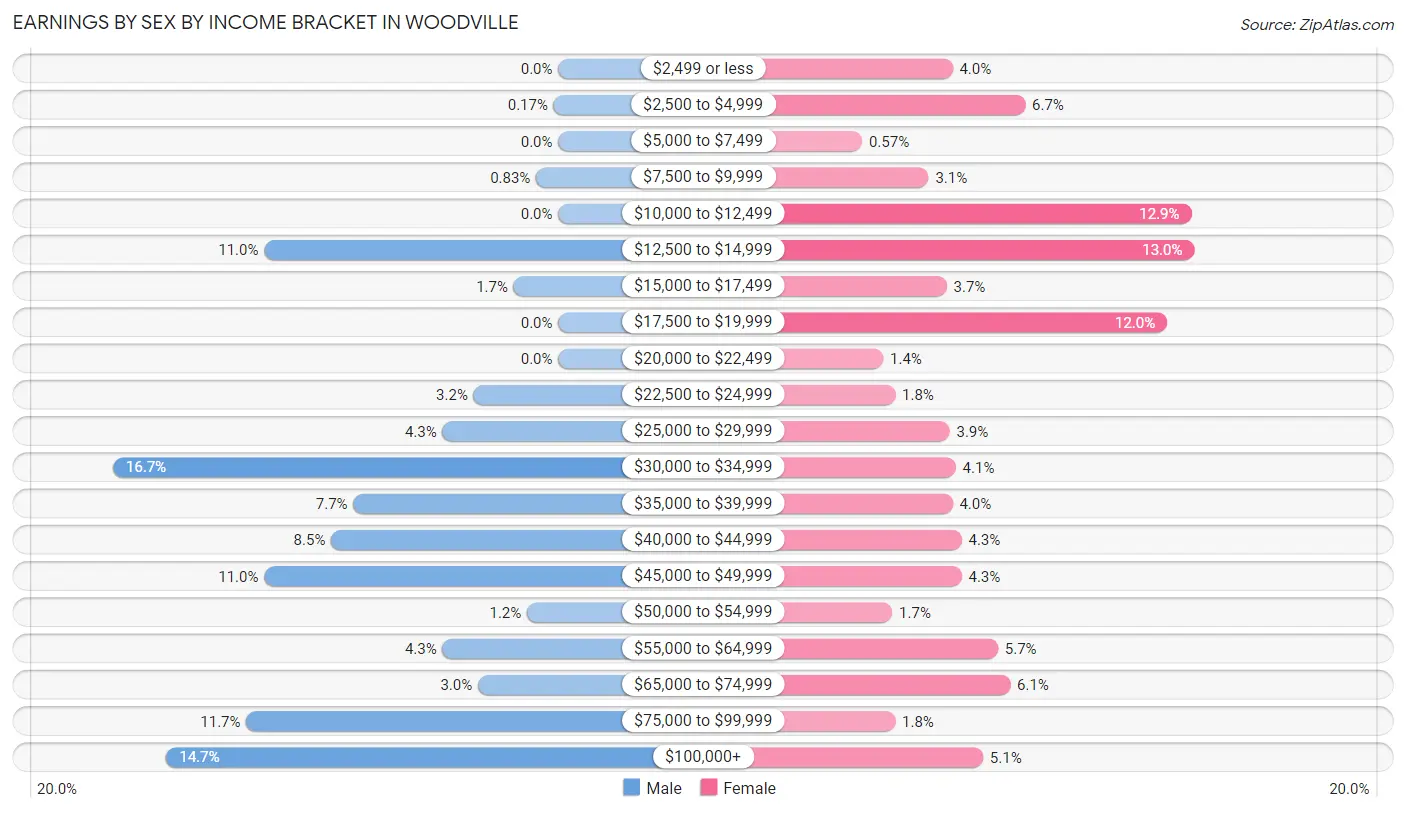
Earnings by Sex by Income Bracket in Woodville
The most common earnings brackets in Woodville are $30,000 to $34,999 for men (100 | 16.7%) and $12,500 to $14,999 for women (115 | 13.0%).
| Income | Male | Female |
| $2,499 or less | 0 (0.0%) | 35 (4.0%) |
| $2,500 to $4,999 | 1 (0.2%) | 59 (6.7%) |
| $5,000 to $7,499 | 0 (0.0%) | 5 (0.6%) |
| $7,500 to $9,999 | 5 (0.8%) | 27 (3.1%) |
| $10,000 to $12,499 | 0 (0.0%) | 114 (12.9%) |
| $12,500 to $14,999 | 66 (11.0%) | 115 (13.0%) |
| $15,000 to $17,499 | 10 (1.7%) | 33 (3.7%) |
| $17,500 to $19,999 | 0 (0.0%) | 106 (12.0%) |
| $20,000 to $22,499 | 0 (0.0%) | 12 (1.4%) |
| $22,500 to $24,999 | 19 (3.2%) | 16 (1.8%) |
| $25,000 to $29,999 | 26 (4.3%) | 34 (3.8%) |
| $30,000 to $34,999 | 100 (16.7%) | 36 (4.1%) |
| $35,000 to $39,999 | 46 (7.7%) | 35 (4.0%) |
| $40,000 to $44,999 | 51 (8.5%) | 38 (4.3%) |
| $45,000 to $49,999 | 66 (11.0%) | 38 (4.3%) |
| $50,000 to $54,999 | 7 (1.2%) | 15 (1.7%) |
| $55,000 to $64,999 | 26 (4.3%) | 50 (5.7%) |
| $65,000 to $74,999 | 18 (3.0%) | 54 (6.1%) |
| $75,000 to $99,999 | 70 (11.7%) | 16 (1.8%) |
| $100,000+ | 88 (14.7%) | 45 (5.1%) |
| Total | 599 (100.0%) | 883 (100.0%) |
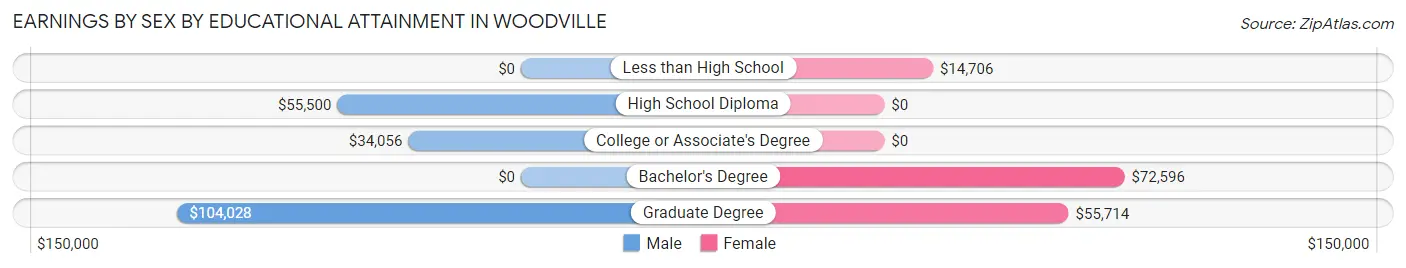
Earnings by Sex by Educational Attainment in Woodville
Average earnings in Woodville are $46,293 for men and $29,519 for women, a difference of 36.2%. Men with an educational attainment of graduate degree enjoy the highest average annual earnings of $104,028, while those with college or associate's degree education earn the least with $34,056. Women with an educational attainment of bachelor's degree earn the most with the average annual earnings of $72,596, while those with less than high school education have the smallest earnings of $14,706.
| Educational Attainment | Male Income | Female Income |
| Less than High School | - | - |
| High School Diploma | $55,500 | $0 |
| College or Associate's Degree | $34,056 | $0 |
| Bachelor's Degree | - | - |
| Graduate Degree | $104,028 | $55,714 |
| Total | $46,293 | $29,519 |
Family Income in Woodville
Family Income Brackets in Woodville
According to the Woodville family income data, there are 193 families falling into the $100,000 to $149,999 income range, which is the most common income bracket and makes up 22.7% of all families. Conversely, the $15,000 to $24,999 income bracket is the least frequent group with only 6 families (0.7%) belonging to this category.
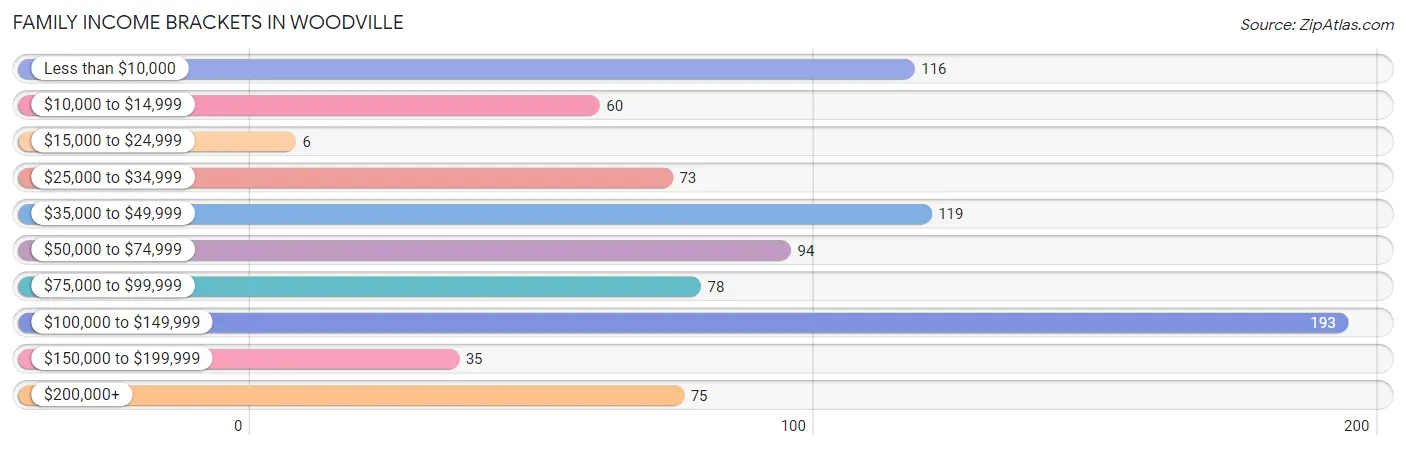
| Income Bracket | # Families | % Families |
| Less than $10,000 | 116 | 13.7% |
| $10,000 to $14,999 | 60 | 7.1% |
| $15,000 to $24,999 | 6 | 0.7% |
| $25,000 to $34,999 | 73 | 8.6% |
| $35,000 to $49,999 | 119 | 14.0% |
| $50,000 to $74,999 | 94 | 11.1% |
| $75,000 to $99,999 | 78 | 9.2% |
| $100,000 to $149,999 | 193 | 22.7% |
| $150,000 to $199,999 | 35 | 4.1% |
| $200,000+ | 75 | 8.8% |
Family Income by Famaliy Size in Woodville
2-person families (360 | 42.4%) account for the highest median family income in Woodville with $106,912 per family, while 2-person families (360 | 42.4%) have the highest median income of $53,456 per family member.
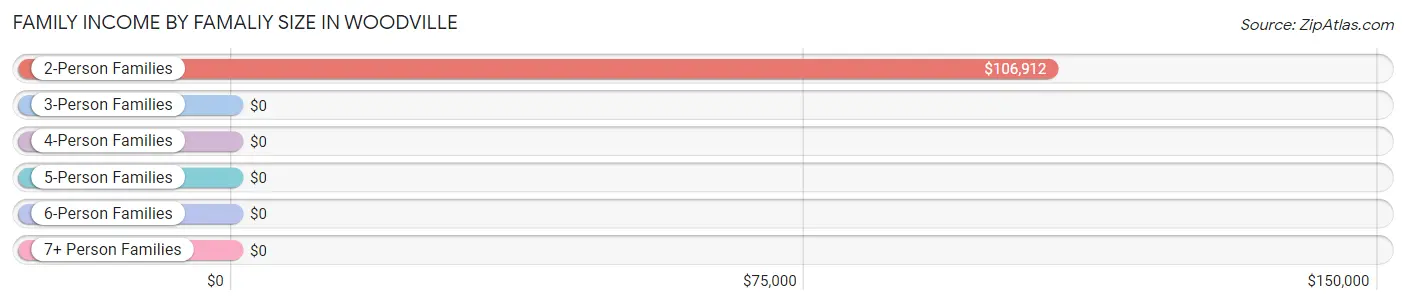
| Income Bracket | # Families | Median Income |
| 2-Person Families | 360 (42.4%) | $106,912 |
| 3-Person Families | 336 (39.6%) | $0 |
| 4-Person Families | 92 (10.8%) | $0 |
| 5-Person Families | 9 (1.1%) | $0 |
| 6-Person Families | 43 (5.1%) | $0 |
| 7+ Person Families | 9 (1.1%) | $0 |
| Total | 849 (100.0%) | $62,321 |
Family Income by Number of Earners in Woodville
The median family income in Woodville is $62,321, with families comprising 3+ earners (40) having the highest median family income of $123,750, while families with no earners (210) have the lowest median family income of $2,499, accounting for 4.7% and 24.7% of families, respectively.
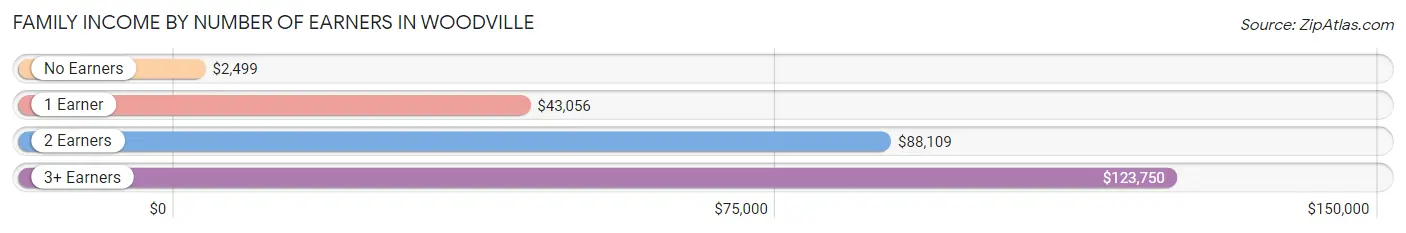
| Number of Earners | # Families | Median Income |
| No Earners | 210 (24.7%) | $2,499 |
| 1 Earner | 252 (29.7%) | $43,056 |
| 2 Earners | 347 (40.9%) | $88,109 |
| 3+ Earners | 40 (4.7%) | $123,750 |
| Total | 849 (100.0%) | $62,321 |
Household Income in Woodville
Household Income Brackets in Woodville
With 192 households falling in the category, the $100,000 to $149,999 income range is the most frequent in Woodville, accounting for 15.8% of all households. In contrast, only 35 households (2.9%) fall into the $150,000 to $199,999 income bracket, making it the least populous group.
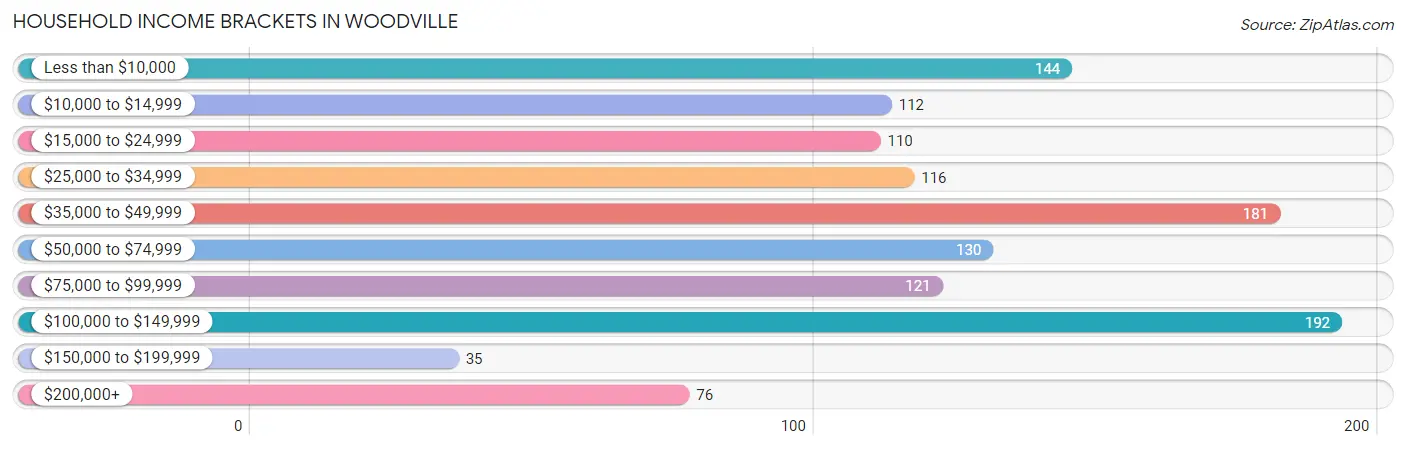
| Income Bracket | # Households | % Households |
| Less than $10,000 | 144 | 11.8% |
| $10,000 to $14,999 | 112 | 9.2% |
| $15,000 to $24,999 | 110 | 9.0% |
| $25,000 to $34,999 | 116 | 9.5% |
| $35,000 to $49,999 | 181 | 14.9% |
| $50,000 to $74,999 | 130 | 10.7% |
| $75,000 to $99,999 | 121 | 9.9% |
| $100,000 to $149,999 | 192 | 15.8% |
| $150,000 to $199,999 | 35 | 2.9% |
| $200,000+ | 76 | 6.2% |
Household Income by Householder Age in Woodville
The median household income in Woodville is $42,778, with the highest median household income of $105,074 found in the 45 to 64 years age bracket for the primary householder. A total of 370 households (30.4%) fall into this category. Meanwhile, the 15 to 24 years age bracket for the primary householder has the lowest median household income of $0, with 54 households (4.4%) in this group.
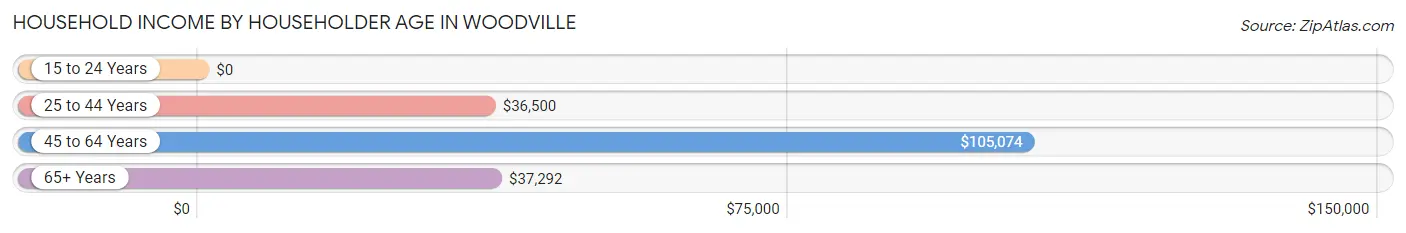
| Income Bracket | # Households | Median Income |
| 15 to 24 Years | 54 (4.4%) | $0 |
| 25 to 44 Years | 522 (42.9%) | $36,500 |
| 45 to 64 Years | 370 (30.4%) | $105,074 |
| 65+ Years | 272 (22.3%) | $37,292 |
| Total | 1,218 (100.0%) | $42,778 |
Poverty in Woodville
Income Below Poverty by Sex and Age in Woodville
With 17.7% poverty level for males and 11.9% for females among the residents of Woodville, 25 to 34 year old males and 6 to 11 year old females are the most vulnerable to poverty, with 116 males (54.7%) and 67 females (49.6%) in their respective age groups living below the poverty level.
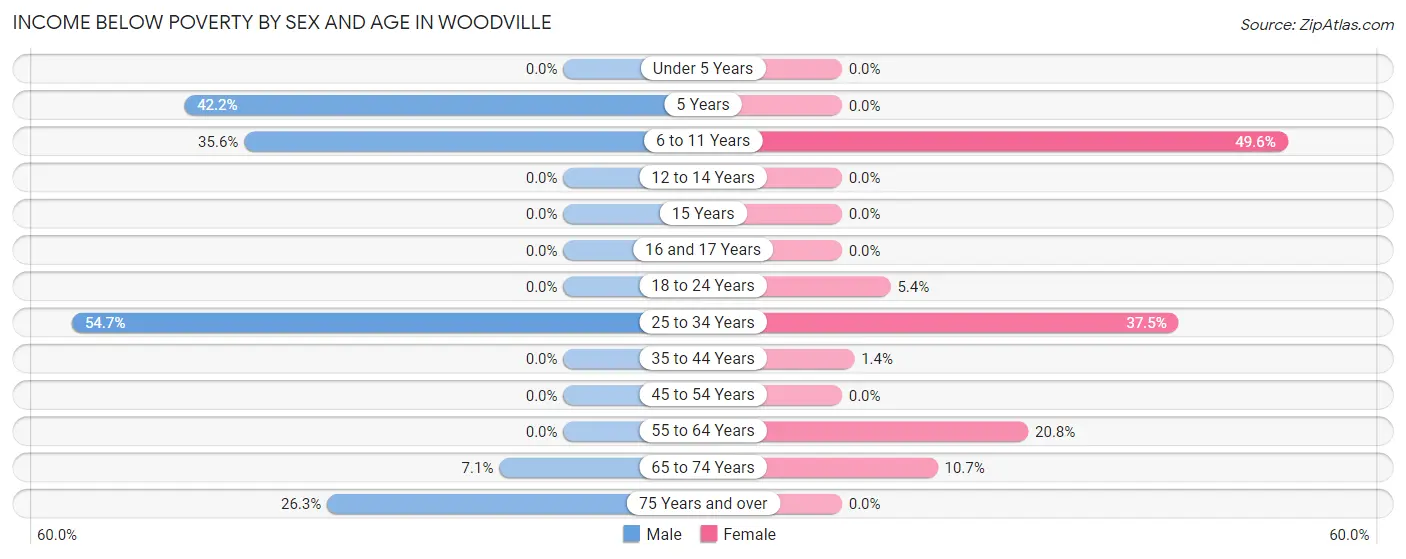
| Age Bracket | Male | Female |
| Under 5 Years | 0 (0.0%) | 0 (0.0%) |
| 5 Years | 19 (42.2%) | 0 (0.0%) |
| 6 to 11 Years | 75 (35.5%) | 67 (49.6%) |
| 12 to 14 Years | 0 (0.0%) | 0 (0.0%) |
| 15 Years | 0 (0.0%) | 0 (0.0%) |
| 16 and 17 Years | 0 (0.0%) | 0 (0.0%) |
| 18 to 24 Years | 0 (0.0%) | 13 (5.4%) |
| 25 to 34 Years | 116 (54.7%) | 60 (37.5%) |
| 35 to 44 Years | 0 (0.0%) | 3 (1.4%) |
| 45 to 54 Years | 0 (0.0%) | 0 (0.0%) |
| 55 to 64 Years | 0 (0.0%) | 22 (20.7%) |
| 65 to 74 Years | 7 (7.1%) | 21 (10.7%) |
| 75 Years and over | 15 (26.3%) | 0 (0.0%) |
| Total | 232 (17.7%) | 186 (11.9%) |
Income Above Poverty by Sex and Age in Woodville
According to the poverty statistics in Woodville, males aged under 5 years and females aged under 5 years are the age groups that are most secure financially, with 100.0% of males and 100.0% of females in these age groups living above the poverty line.
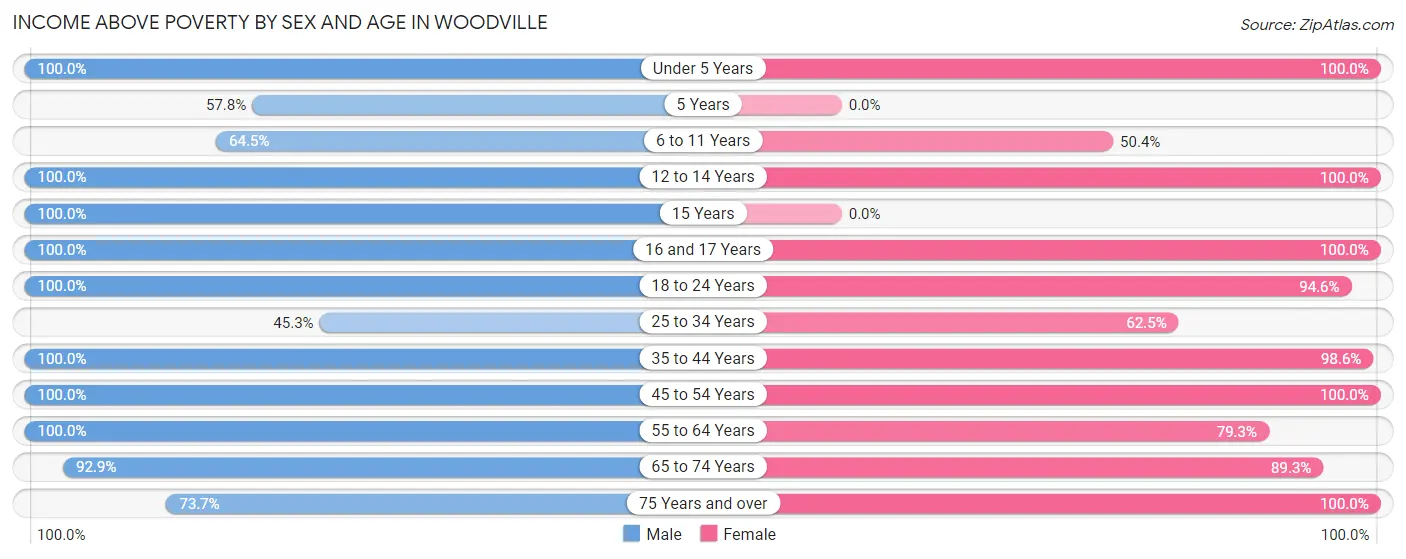
| Age Bracket | Male | Female |
| Under 5 Years | 29 (100.0%) | 64 (100.0%) |
| 5 Years | 26 (57.8%) | 0 (0.0%) |
| 6 to 11 Years | 136 (64.4%) | 68 (50.4%) |
| 12 to 14 Years | 34 (100.0%) | 106 (100.0%) |
| 15 Years | 23 (100.0%) | 0 (0.0%) |
| 16 and 17 Years | 45 (100.0%) | 31 (100.0%) |
| 18 to 24 Years | 98 (100.0%) | 227 (94.6%) |
| 25 to 34 Years | 96 (45.3%) | 100 (62.5%) |
| 35 to 44 Years | 196 (100.0%) | 214 (98.6%) |
| 45 to 54 Years | 134 (100.0%) | 214 (100.0%) |
| 55 to 64 Years | 132 (100.0%) | 84 (79.2%) |
| 65 to 74 Years | 91 (92.9%) | 176 (89.3%) |
| 75 Years and over | 42 (73.7%) | 92 (100.0%) |
| Total | 1,082 (82.3%) | 1,376 (88.1%) |
Income Below Poverty Among Married-Couple Families in Woodville
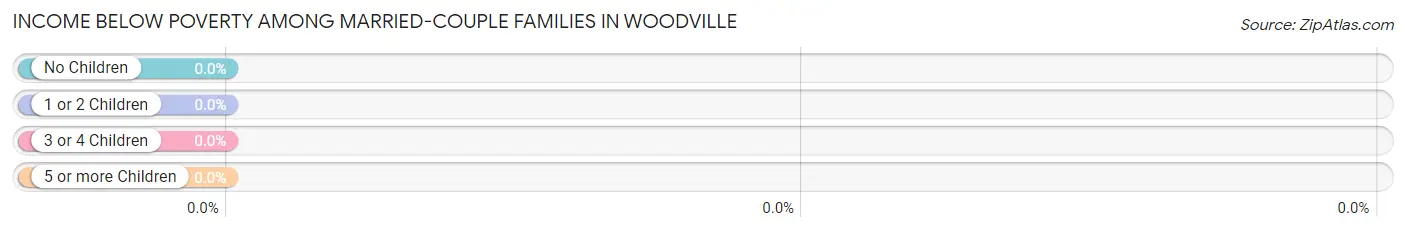
| Children | Above Poverty | Below Poverty |
| No Children | 317 (100.0%) | 0 (0.0%) |
| 1 or 2 Children | 139 (100.0%) | 0 (0.0%) |
| 3 or 4 Children | 10 (100.0%) | 0 (0.0%) |
| 5 or more Children | 9 (100.0%) | 0 (0.0%) |
| Total | 475 (100.0%) | 0 (0.0%) |
Income Below Poverty Among Single-Parent Households in Woodville
According to the poverty data in Woodville, 62.4% or 116 single-father households and 31.9% or 60 single-mother households are living below the poverty line. Among single-father households, those with 1 or 2 children have the highest poverty rate, with 116 households (95.1%) experiencing poverty. Likewise, among single-mother households, those with 1 or 2 children have the highest poverty rate, with 60 households (48.8%) falling below the poverty line.
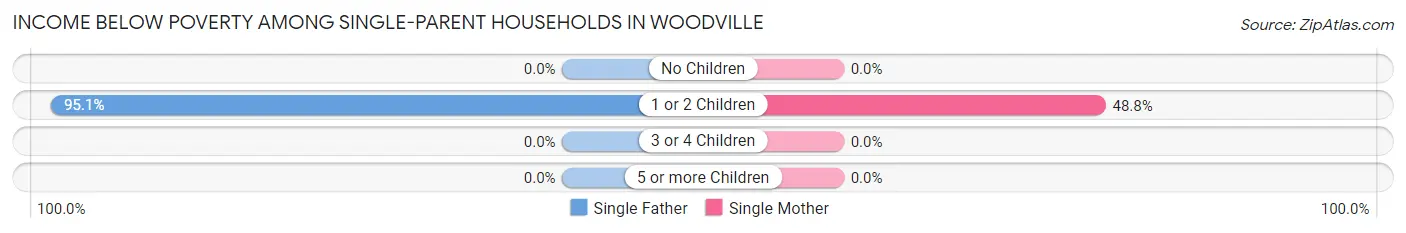
| Children | Single Father | Single Mother |
| No Children | 0 (0.0%) | 0 (0.0%) |
| 1 or 2 Children | 116 (95.1%) | 60 (48.8%) |
| 3 or 4 Children | 0 (0.0%) | 0 (0.0%) |
| 5 or more Children | 0 (0.0%) | 0 (0.0%) |
| Total | 116 (62.4%) | 60 (31.9%) |
Income Below Poverty Among Married-Couple vs Single-Parent Households in Woodville
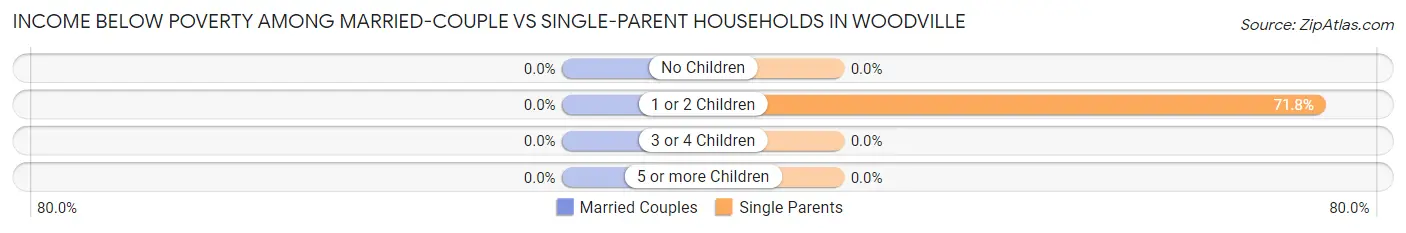
| Children | Married-Couple Families | Single-Parent Households |
| No Children | 0 (0.0%) | 0 (0.0%) |
| 1 or 2 Children | 0 (0.0%) | 176 (71.8%) |
| 3 or 4 Children | 0 (0.0%) | 0 (0.0%) |
| 5 or more Children | 0 (0.0%) | 0 (0.0%) |
| Total | 0 (0.0%) | 176 (47.1%) |
Race in Woodville
The most populous races in Woodville are White / Caucasian (1,884 | 61.2%), Black / African American (859 | 27.9%), and Two or more Races (271 | 8.8%).
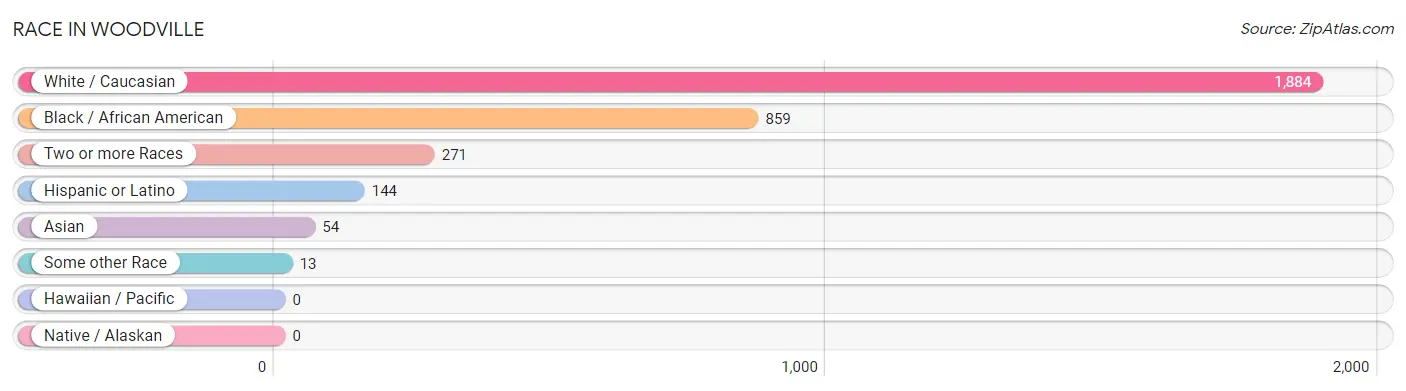
| Race | # Population | % Population |
| Asian | 54 | 1.8% |
| Black / African American | 859 | 27.9% |
| Hawaiian / Pacific | 0 | 0.0% |
| Hispanic or Latino | 144 | 4.7% |
| Native / Alaskan | 0 | 0.0% |
| White / Caucasian | 1,884 | 61.2% |
| Two or more Races | 271 | 8.8% |
| Some other Race | 13 | 0.4% |
| Total | 3,081 | 100.0% |
Ancestry in Woodville
The most populous ancestries reported in Woodville are American (557 | 18.1%), German (420 | 13.6%), English (308 | 10.0%), Mexican (139 | 4.5%), and Irish (135 | 4.4%), together accounting for 50.6% of all Woodville residents.
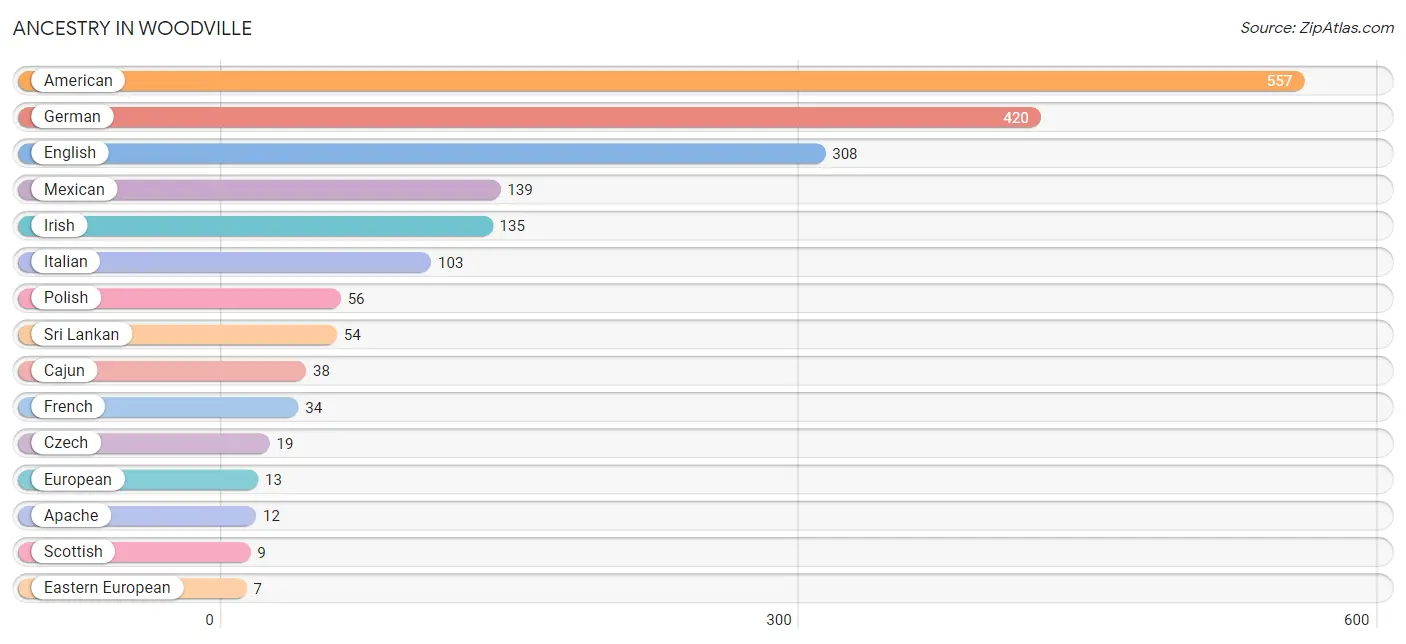
| Ancestry | # Population | % Population |
| African | 3 | 0.1% |
| American | 557 | 18.1% |
| Apache | 12 | 0.4% |
| Cajun | 38 | 1.2% |
| Czech | 19 | 0.6% |
| Dutch | 5 | 0.2% |
| Eastern European | 7 | 0.2% |
| Ecuadorian | 1 | 0.0% |
| English | 308 | 10.0% |
| European | 13 | 0.4% |
| French | 34 | 1.1% |
| French Canadian | 5 | 0.2% |
| German | 420 | 13.6% |
| Irish | 135 | 4.4% |
| Italian | 103 | 3.3% |
| Mexican | 139 | 4.5% |
| Norwegian | 6 | 0.2% |
| Polish | 56 | 1.8% |
| Portuguese | 7 | 0.2% |
| Scotch-Irish | 6 | 0.2% |
| Scottish | 9 | 0.3% |
| South American | 1 | 0.0% |
| Sri Lankan | 54 | 1.8% |
| Subsaharan African | 3 | 0.1% |
| Welsh | 4 | 0.1% | View All 25 Rows |
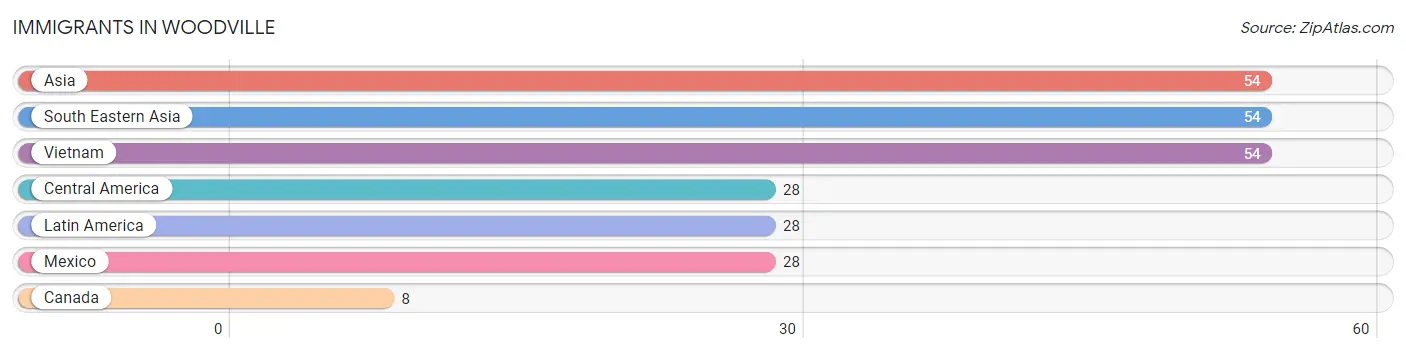
Immigrants in Woodville
The most numerous immigrant groups reported in Woodville came from Asia (54 | 1.8%), South Eastern Asia (54 | 1.8%), Vietnam (54 | 1.8%), Central America (28 | 0.9%), and Latin America (28 | 0.9%), together accounting for 7.1% of all Woodville residents.
| Immigration Origin | # Population | % Population |
| Asia | 54 | 1.8% |
| Canada | 8 | 0.3% |
| Central America | 28 | 0.9% |
| Latin America | 28 | 0.9% |
| Mexico | 28 | 0.9% |
| South Eastern Asia | 54 | 1.8% |
| Vietnam | 54 | 1.8% | View All 7 Rows |
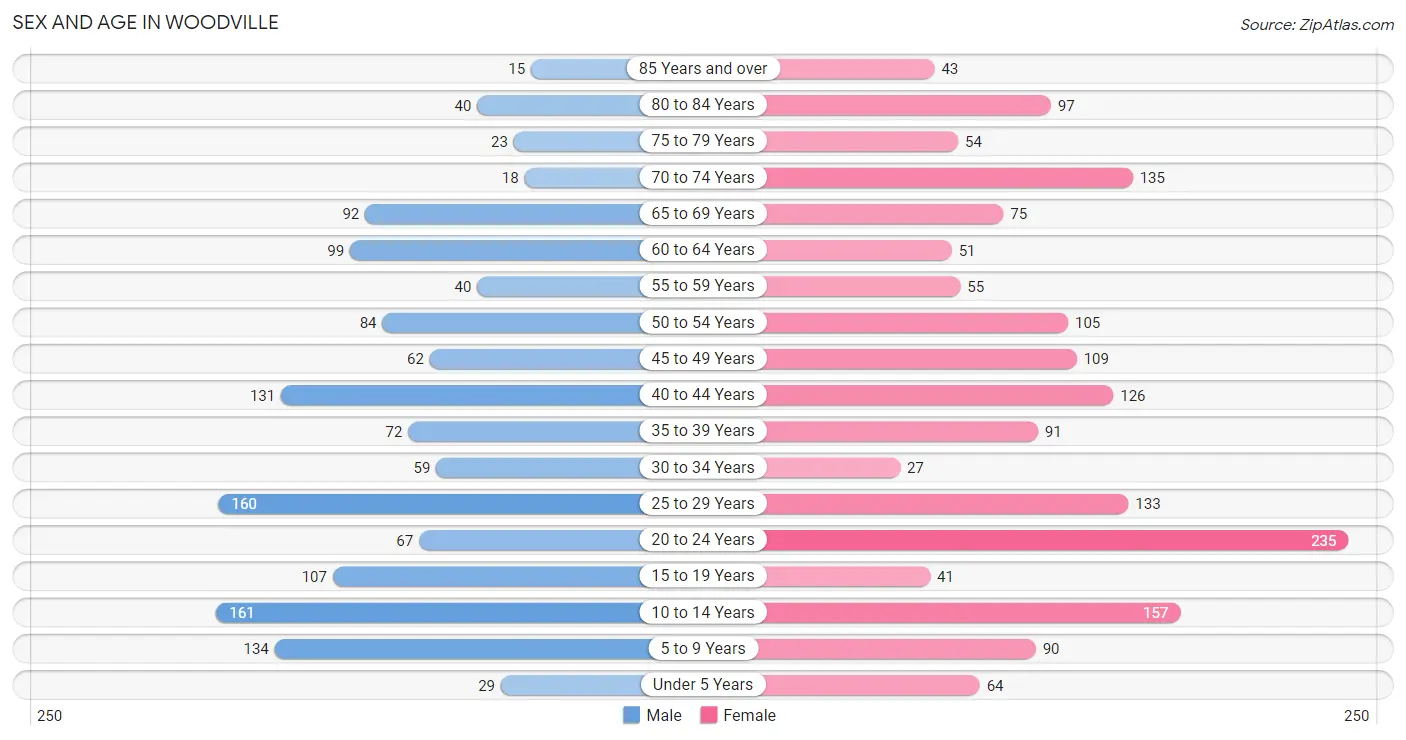
Sex and Age in Woodville
Sex and Age in Woodville
The most populous age groups in Woodville are 10 to 14 Years (161 | 11.6%) for men and 20 to 24 Years (235 | 13.9%) for women.
| Age Bracket | Male | Female |
| Under 5 Years | 29 (2.1%) | 64 (3.8%) |
| 5 to 9 Years | 134 (9.6%) | 90 (5.3%) |
| 10 to 14 Years | 161 (11.6%) | 157 (9.3%) |
| 15 to 19 Years | 107 (7.7%) | 41 (2.4%) |
| 20 to 24 Years | 67 (4.8%) | 235 (13.9%) |
| 25 to 29 Years | 160 (11.5%) | 133 (7.9%) |
| 30 to 34 Years | 59 (4.2%) | 27 (1.6%) |
| 35 to 39 Years | 72 (5.2%) | 91 (5.4%) |
| 40 to 44 Years | 131 (9.4%) | 126 (7.5%) |
| 45 to 49 Years | 62 (4.4%) | 109 (6.5%) |
| 50 to 54 Years | 84 (6.0%) | 105 (6.2%) |
| 55 to 59 Years | 40 (2.9%) | 55 (3.3%) |
| 60 to 64 Years | 99 (7.1%) | 51 (3.0%) |
| 65 to 69 Years | 92 (6.6%) | 75 (4.4%) |
| 70 to 74 Years | 18 (1.3%) | 135 (8.0%) |
| 75 to 79 Years | 23 (1.7%) | 54 (3.2%) |
| 80 to 84 Years | 40 (2.9%) | 97 (5.8%) |
| 85 Years and over | 15 (1.1%) | 43 (2.5%) |
| Total | 1,393 (100.0%) | 1,688 (100.0%) |
Families and Households in Woodville
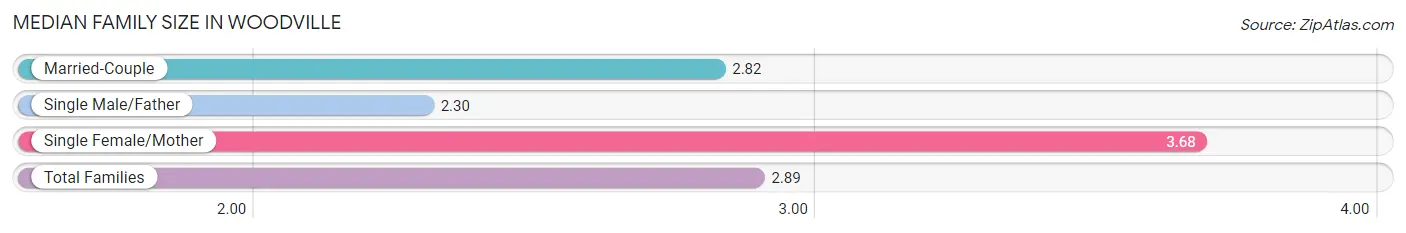
Median Family Size in Woodville
The median family size in Woodville is 2.89 persons per family, with single female/mother families (188 | 22.1%) accounting for the largest median family size of 3.68 persons per family. On the other hand, single male/father families (186 | 21.9%) represent the smallest median family size with 2.30 persons per family.
| Family Type | # Families | Family Size |
| Married-Couple | 475 (55.9%) | 2.82 |
| Single Male/Father | 186 (21.9%) | 2.30 |
| Single Female/Mother | 188 (22.1%) | 3.68 |
| Total Families | 849 (100.0%) | 2.89 |
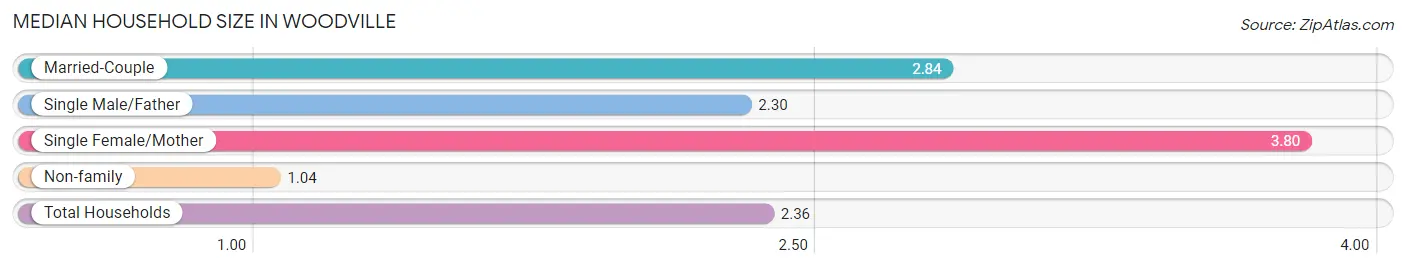
Median Household Size in Woodville
The median household size in Woodville is 2.36 persons per household, with single female/mother households (188 | 15.4%) accounting for the largest median household size of 3.8 persons per household. non-family households (369 | 30.3%) represent the smallest median household size with 1.04 persons per household.
| Household Type | # Households | Household Size |
| Married-Couple | 475 (39.0%) | 2.84 |
| Single Male/Father | 186 (15.3%) | 2.30 |
| Single Female/Mother | 188 (15.4%) | 3.80 |
| Non-family | 369 (30.3%) | 1.04 |
| Total Households | 1,218 (100.0%) | 2.36 |
Household Size by Marriage Status in Woodville
Out of a total of 1,218 households in Woodville, 849 (69.7%) are family households, while 369 (30.3%) are nonfamily households. The most numerous type of family households are 2-person households, comprising 349, and the most common type of nonfamily households are 1-person households, comprising 358.
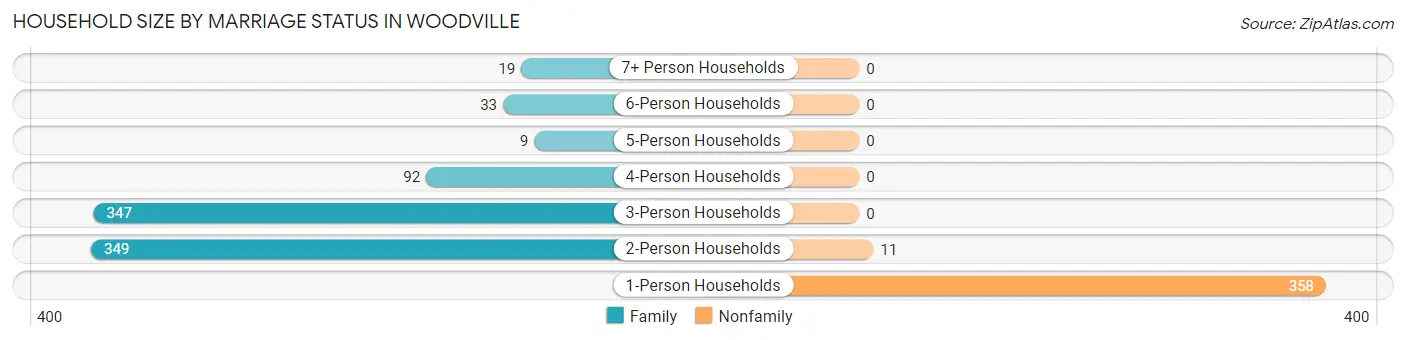
| Household Size | Family Households | Nonfamily Households |
| 1-Person Households | - | 358 (29.4%) |
| 2-Person Households | 349 (28.6%) | 11 (0.9%) |
| 3-Person Households | 347 (28.5%) | 0 (0.0%) |
| 4-Person Households | 92 (7.5%) | 0 (0.0%) |
| 5-Person Households | 9 (0.7%) | 0 (0.0%) |
| 6-Person Households | 33 (2.7%) | 0 (0.0%) |
| 7+ Person Households | 19 (1.6%) | 0 (0.0%) |
| Total | 849 (69.7%) | 369 (30.3%) |
Female Fertility in Woodville
Fertility by Age in Woodville
Average fertility rate in Woodville is 30.0 births per 1,000 women. Women in the age bracket of 35 to 50 years have the highest fertility rate with 34.0 births per 1,000 women. Women in the age bracket of 20 to 34 years acount for 52.2% of all women with births.
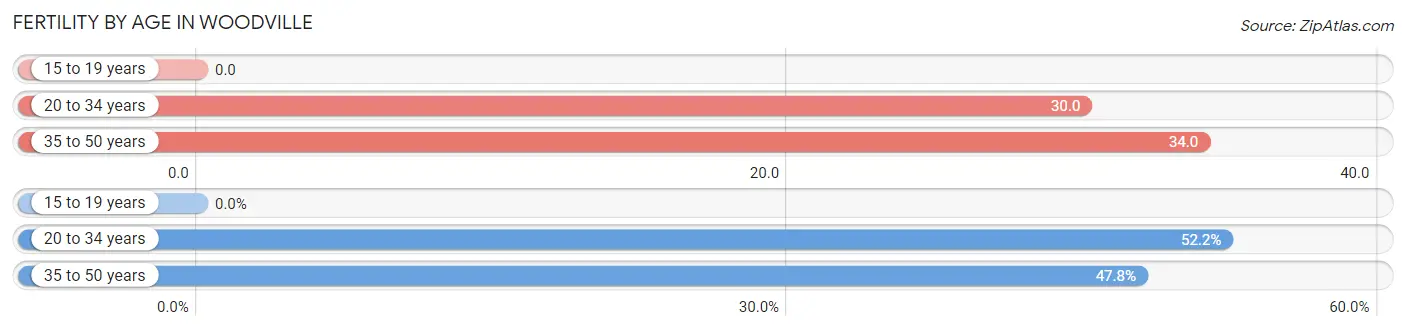
| Age Bracket | Women with Births | Births / 1,000 Women |
| 15 to 19 years | 0 (0.0%) | 0.0 |
| 20 to 34 years | 12 (52.2%) | 30.0 |
| 35 to 50 years | 11 (47.8%) | 34.0 |
| Total | 23 (100.0%) | 30.0 |
Fertility by Age by Marriage Status in Woodville
52.2% of women with births (23) in Woodville are married. The highest percentage of unmarried women with births falls into 35 to 50 years age bracket with 100.0% of them unmarried at the time of birth, while the lowest percentage of unmarried women with births belong to 20 to 34 years age bracket with 0.0% of them unmarried.
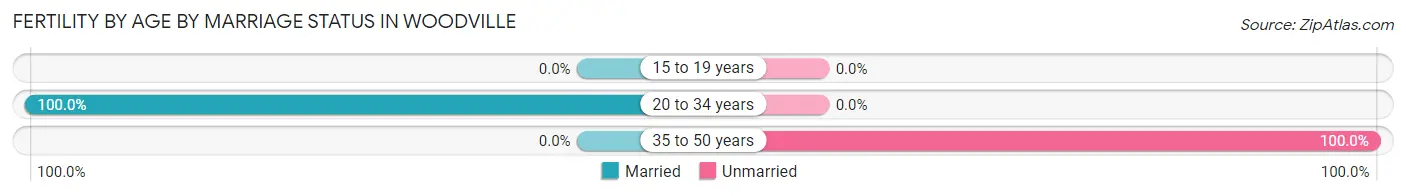
| Age Bracket | Married | Unmarried |
| 15 to 19 years | 0 (0.0%) | 0 (0.0%) |
| 20 to 34 years | 12 (100.0%) | 0 (0.0%) |
| 35 to 50 years | 0 (0.0%) | 11 (100.0%) |
| Total | 12 (52.2%) | 11 (47.8%) |
Fertility by Education in Woodville
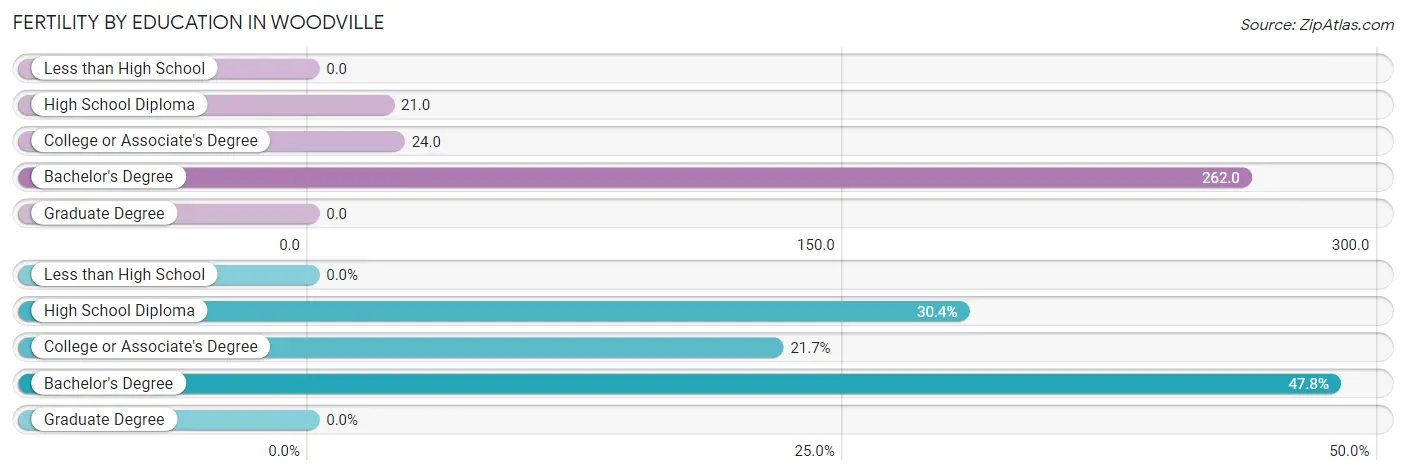
| Educational Attainment | Women with Births | Births / 1,000 Women |
| Less than High School | 0 (0.0%) | 0.0 |
| High School Diploma | 7 (30.4%) | 21.0 |
| College or Associate's Degree | 5 (21.7%) | 24.0 |
| Bachelor's Degree | 11 (47.8%) | 262.0 |
| Graduate Degree | 0 (0.0%) | 0.0 |
| Total | 23 (100.0%) | 30.0 |
Fertility by Education by Marriage Status in Woodville
47.8% of women with births in Woodville are unmarried. Women with the educational attainment of high school diploma are most likely to be married with 100.0% of them married at childbirth, while women with the educational attainment of bachelor's degree are least likely to be married with 100.0% of them unmarried at childbirth.
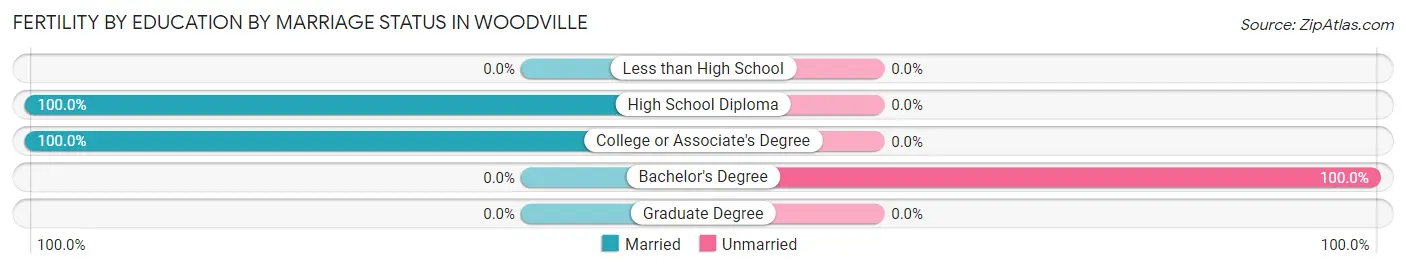
| Educational Attainment | Married | Unmarried |
| Less than High School | 0 (0.0%) | 0 (0.0%) |
| High School Diploma | 7 (100.0%) | 0 (0.0%) |
| College or Associate's Degree | 5 (100.0%) | 0 (0.0%) |
| Bachelor's Degree | 0 (0.0%) | 11 (100.0%) |
| Graduate Degree | 0 (0.0%) | 0 (0.0%) |
| Total | 12 (52.2%) | 11 (47.8%) |
Employment Characteristics in Woodville
Employment by Class of Employer in Woodville
Among the 1,327 employed individuals in Woodville, private company employees (807 | 60.8%), not-for-profit organizations (171 | 12.9%), and local government employees (109 | 8.2%) make up the most common classes of employment.
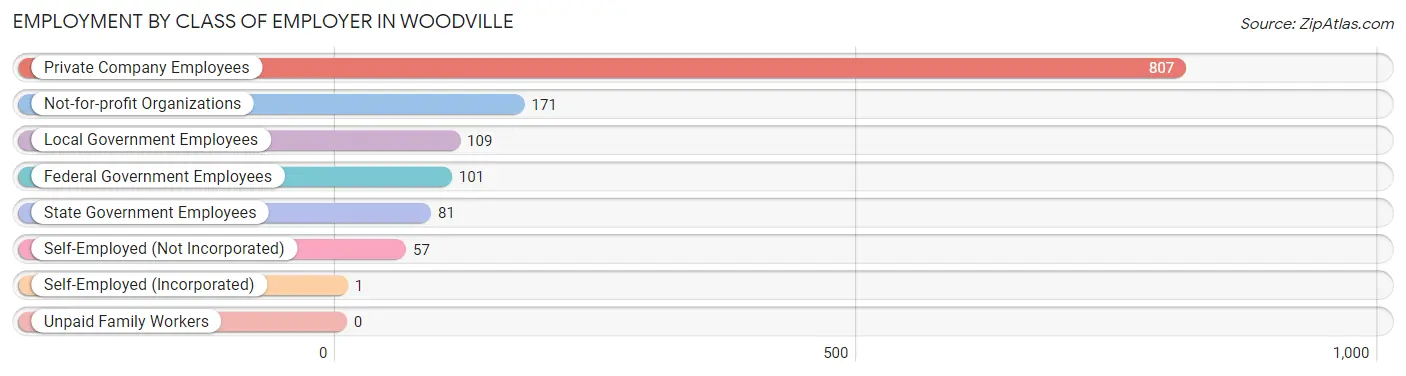
| Employer Class | # Employees | % Employees |
| Private Company Employees | 807 | 60.8% |
| Self-Employed (Incorporated) | 1 | 0.1% |
| Self-Employed (Not Incorporated) | 57 | 4.3% |
| Not-for-profit Organizations | 171 | 12.9% |
| Local Government Employees | 109 | 8.2% |
| State Government Employees | 81 | 6.1% |
| Federal Government Employees | 101 | 7.6% |
| Unpaid Family Workers | 0 | 0.0% |
| Total | 1,327 | 100.0% |
Employment Status by Age in Woodville
According to the labor force statistics for Woodville, out of the total population over 16 years of age (2,413), 59.7% or 1,441 individuals are in the labor force, with 7.9% or 114 of them unemployed. The age group with the highest labor force participation rate is 20 to 24 years, with 97.7% or 295 individuals in the labor force. Within the labor force, the 16 to 19 years age range has the highest percentage of unemployed individuals, with 92.9% or 26 of them being unemployed.

| Age Bracket | In Labor Force | Unemployed |
| 16 to 19 Years | 28 (24.3%) | 26 (92.9%) |
| 20 to 24 Years | 295 (97.7%) | 34 (11.5%) |
| 25 to 29 Years | 123 (42.0%) | 0 (0.0%) |
| 30 to 34 Years | 65 (75.6%) | 0 (0.0%) |
| 35 to 44 Years | 317 (75.5%) | 26 (8.2%) |
| 45 to 54 Years | 306 (85.0%) | 13 (4.2%) |
| 55 to 59 Years | 54 (56.8%) | 0 (0.0%) |
| 60 to 64 Years | 130 (86.7%) | 10 (7.7%) |
| 65 to 74 Years | 111 (34.7%) | 5 (4.5%) |
| 75 Years and over | 12 (4.4%) | 0 (0.0%) |
| Total | 1,441 (59.7%) | 114 (7.9%) |
Employment Status by Educational Attainment in Woodville
According to labor force statistics for Woodville, 70.9% of individuals (995) out of the total population between 25 and 64 years of age (1,404) are in the labor force, with 4.9% or 49 of them being unemployed. The group with the highest labor force participation rate are those with the educational attainment of bachelor's degree or higher, with 93.6% or 162 individuals in the labor force. Within the labor force, individuals with less than high school education have the highest percentage of unemployment, with 21.8% or 26 of them being unemployed.
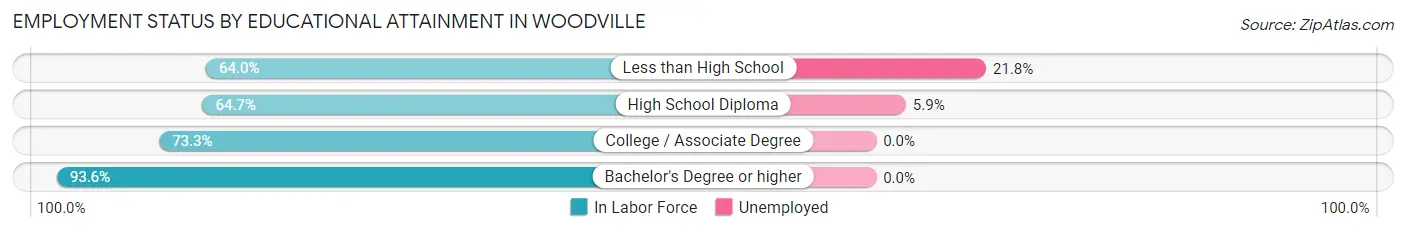
| Educational Attainment | In Labor Force | Unemployed |
| Less than High School | 119 (64.0%) | 41 (21.8%) |
| High School Diploma | 390 (64.7%) | 36 (5.9%) |
| College / Associate Degree | 324 (73.3%) | 0 (0.0%) |
| Bachelor's Degree or higher | 162 (93.6%) | 0 (0.0%) |
| Total | 995 (70.9%) | 69 (4.9%) |
Employment Occupations by Sex in Woodville
Management, Business, Science and Arts Occupations
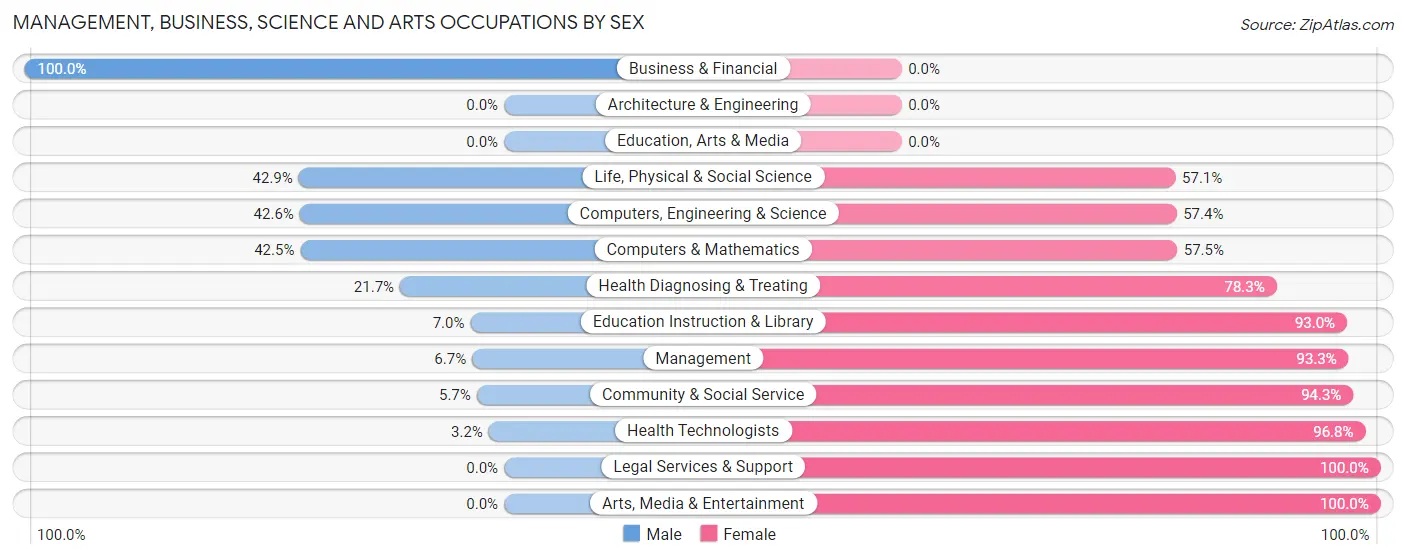
The most common Management, Business, Science and Arts occupations in Woodville are Management (135 | 10.2%), Health Diagnosing & Treating (129 | 9.7%), Health Technologists (94 | 7.1%), Community & Social Service (70 | 5.3%), and Computers, Engineering & Science (61 | 4.6%).
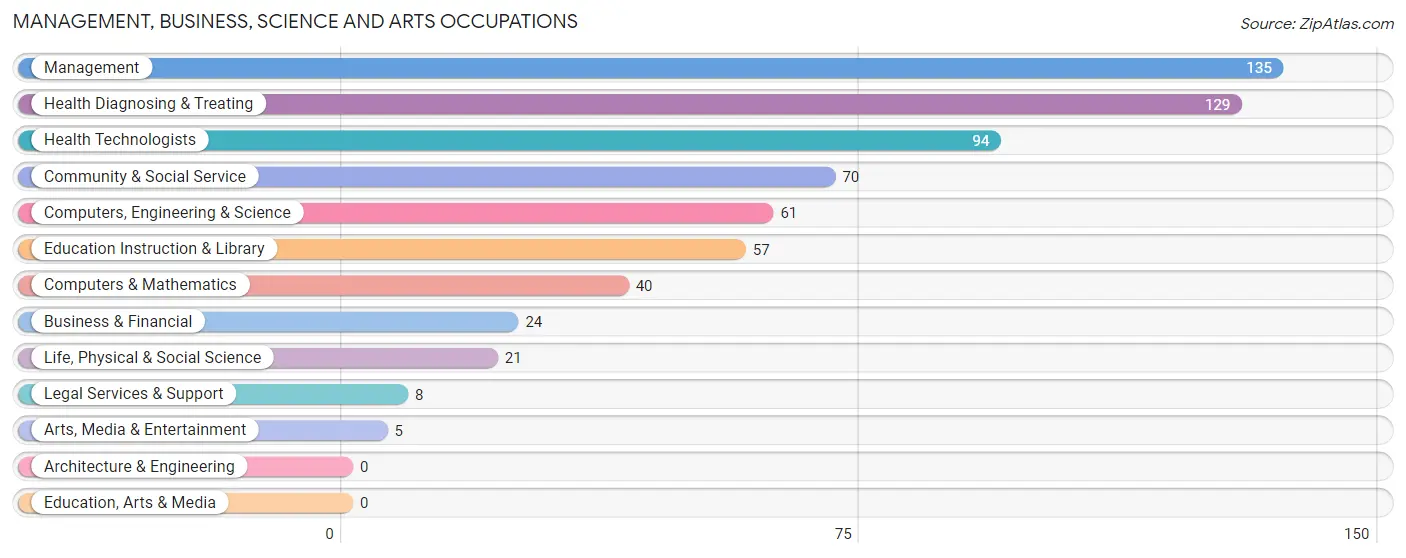
Management, Business, Science and Arts Occupations by Sex
Within the Management, Business, Science and Arts occupations in Woodville, the most male-oriented occupations are Business & Financial (100.0%), Life, Physical & Social Science (42.9%), and Computers, Engineering & Science (42.6%), while the most female-oriented occupations are Legal Services & Support (100.0%), Arts, Media & Entertainment (100.0%), and Health Technologists (96.8%).
| Occupation | Male | Female |
| Management | 9 (6.7%) | 126 (93.3%) |
| Business & Financial | 24 (100.0%) | 0 (0.0%) |
| Computers, Engineering & Science | 26 (42.6%) | 35 (57.4%) |
| Computers & Mathematics | 17 (42.5%) | 23 (57.5%) |
| Architecture & Engineering | 0 (0.0%) | 0 (0.0%) |
| Life, Physical & Social Science | 9 (42.9%) | 12 (57.1%) |
| Community & Social Service | 4 (5.7%) | 66 (94.3%) |
| Education, Arts & Media | 0 (0.0%) | 0 (0.0%) |
| Legal Services & Support | 0 (0.0%) | 8 (100.0%) |
| Education Instruction & Library | 4 (7.0%) | 53 (93.0%) |
| Arts, Media & Entertainment | 0 (0.0%) | 5 (100.0%) |
| Health Diagnosing & Treating | 28 (21.7%) | 101 (78.3%) |
| Health Technologists | 3 (3.2%) | 91 (96.8%) |
| Total (Category) | 91 (21.7%) | 328 (78.3%) |
| Total (Overall) | 520 (39.2%) | 807 (60.8%) |
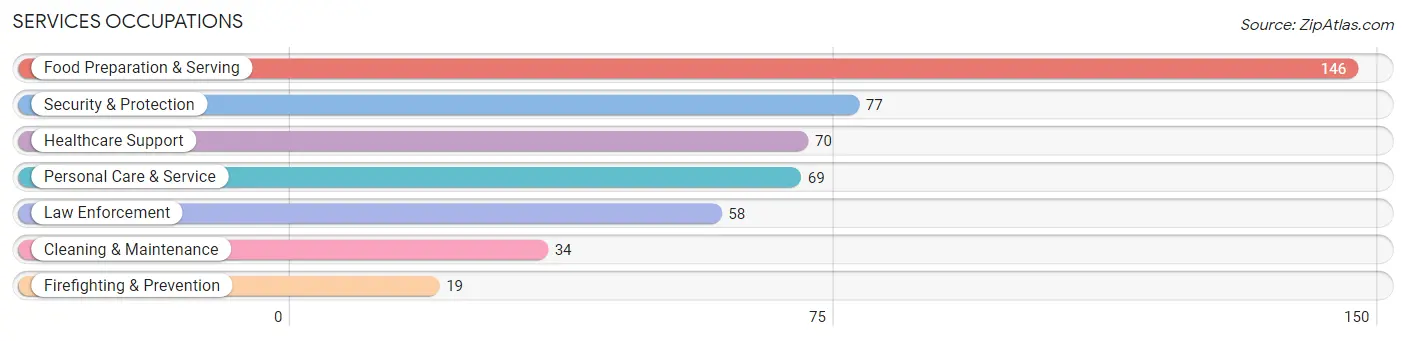
Services Occupations
The most common Services occupations in Woodville are Food Preparation & Serving (146 | 11.0%), Security & Protection (77 | 5.8%), Healthcare Support (70 | 5.3%), Personal Care & Service (69 | 5.2%), and Law Enforcement (58 | 4.4%).
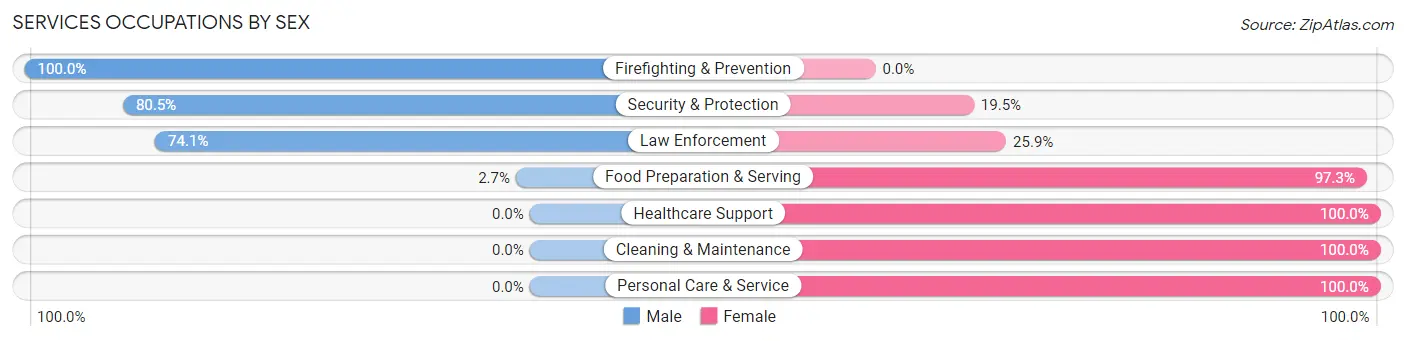
Services Occupations by Sex
Within the Services occupations in Woodville, the most male-oriented occupations are Firefighting & Prevention (100.0%), Security & Protection (80.5%), and Law Enforcement (74.1%), while the most female-oriented occupations are Healthcare Support (100.0%), Cleaning & Maintenance (100.0%), and Personal Care & Service (100.0%).
| Occupation | Male | Female |
| Healthcare Support | 0 (0.0%) | 70 (100.0%) |
| Security & Protection | 62 (80.5%) | 15 (19.5%) |
| Firefighting & Prevention | 19 (100.0%) | 0 (0.0%) |
| Law Enforcement | 43 (74.1%) | 15 (25.9%) |
| Food Preparation & Serving | 4 (2.7%) | 142 (97.3%) |
| Cleaning & Maintenance | 0 (0.0%) | 34 (100.0%) |
| Personal Care & Service | 0 (0.0%) | 69 (100.0%) |
| Total (Category) | 66 (16.7%) | 330 (83.3%) |
| Total (Overall) | 520 (39.2%) | 807 (60.8%) |
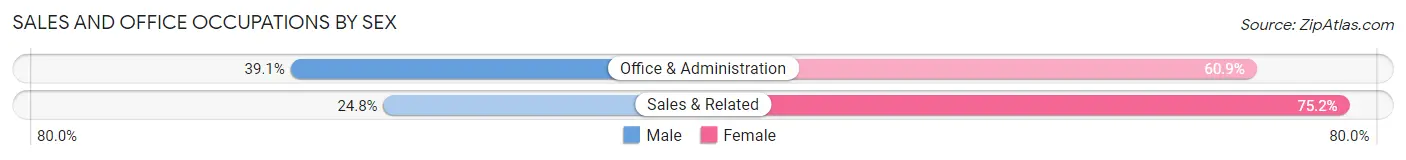
Sales and Office Occupations
The most common Sales and Office occupations in Woodville are Sales & Related (117 | 8.8%), and Office & Administration (87 | 6.6%).

Sales and Office Occupations by Sex
| Occupation | Male | Female |
| Sales & Related | 29 (24.8%) | 88 (75.2%) |
| Office & Administration | 34 (39.1%) | 53 (60.9%) |
| Total (Category) | 63 (30.9%) | 141 (69.1%) |
| Total (Overall) | 520 (39.2%) | 807 (60.8%) |
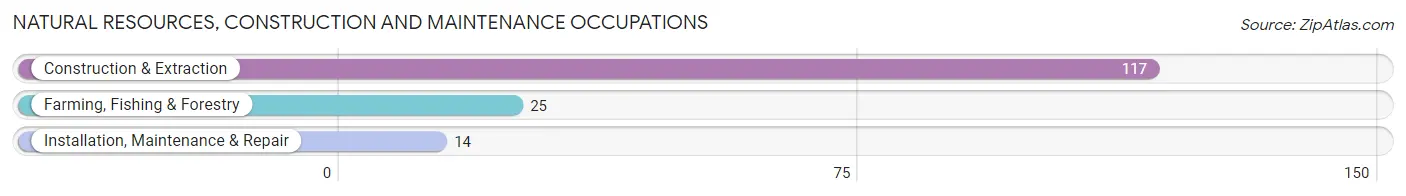
Natural Resources, Construction and Maintenance Occupations
The most common Natural Resources, Construction and Maintenance occupations in Woodville are Construction & Extraction (117 | 8.8%), Farming, Fishing & Forestry (25 | 1.9%), and Installation, Maintenance & Repair (14 | 1.1%).
Natural Resources, Construction and Maintenance Occupations by Sex
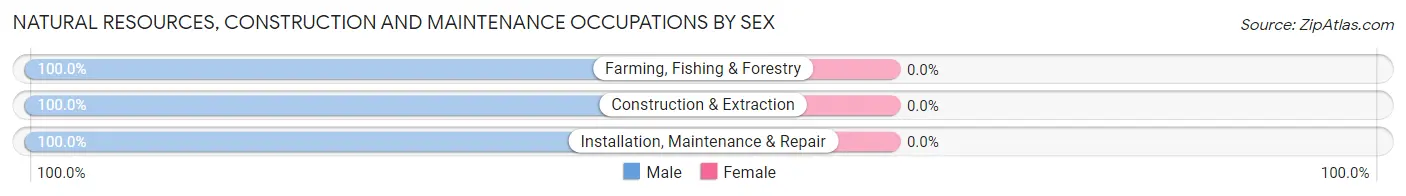
| Occupation | Male | Female |
| Farming, Fishing & Forestry | 25 (100.0%) | 0 (0.0%) |
| Construction & Extraction | 117 (100.0%) | 0 (0.0%) |
| Installation, Maintenance & Repair | 14 (100.0%) | 0 (0.0%) |
| Total (Category) | 156 (100.0%) | 0 (0.0%) |
| Total (Overall) | 520 (39.2%) | 807 (60.8%) |
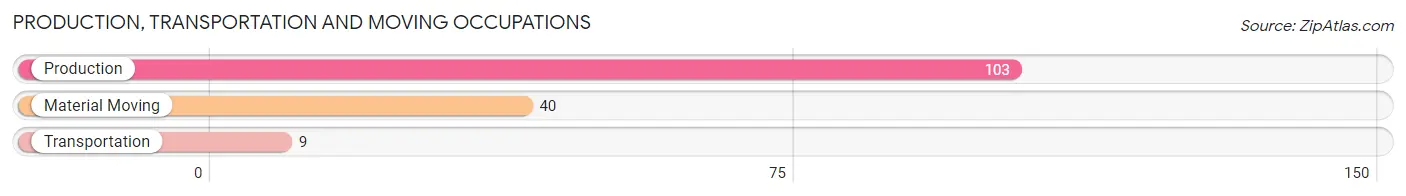
Production, Transportation and Moving Occupations
The most common Production, Transportation and Moving occupations in Woodville are Production (103 | 7.8%), Material Moving (40 | 3.0%), and Transportation (9 | 0.7%).
Production, Transportation and Moving Occupations by Sex
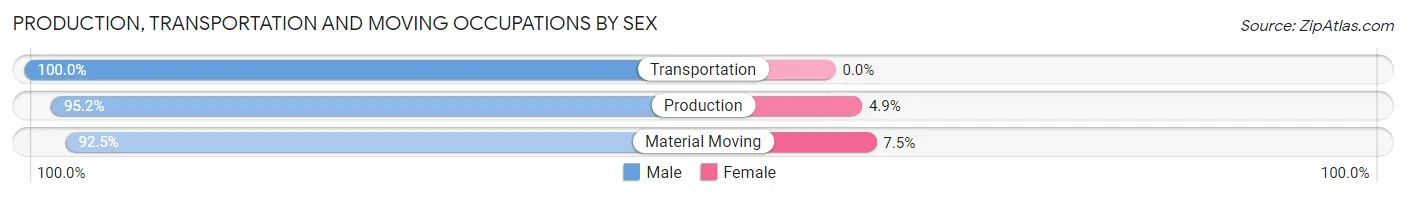
| Occupation | Male | Female |
| Production | 98 (95.2%) | 5 (4.9%) |
| Transportation | 9 (100.0%) | 0 (0.0%) |
| Material Moving | 37 (92.5%) | 3 (7.5%) |
| Total (Category) | 144 (94.7%) | 8 (5.3%) |
| Total (Overall) | 520 (39.2%) | 807 (60.8%) |
Employment Industries by Sex in Woodville
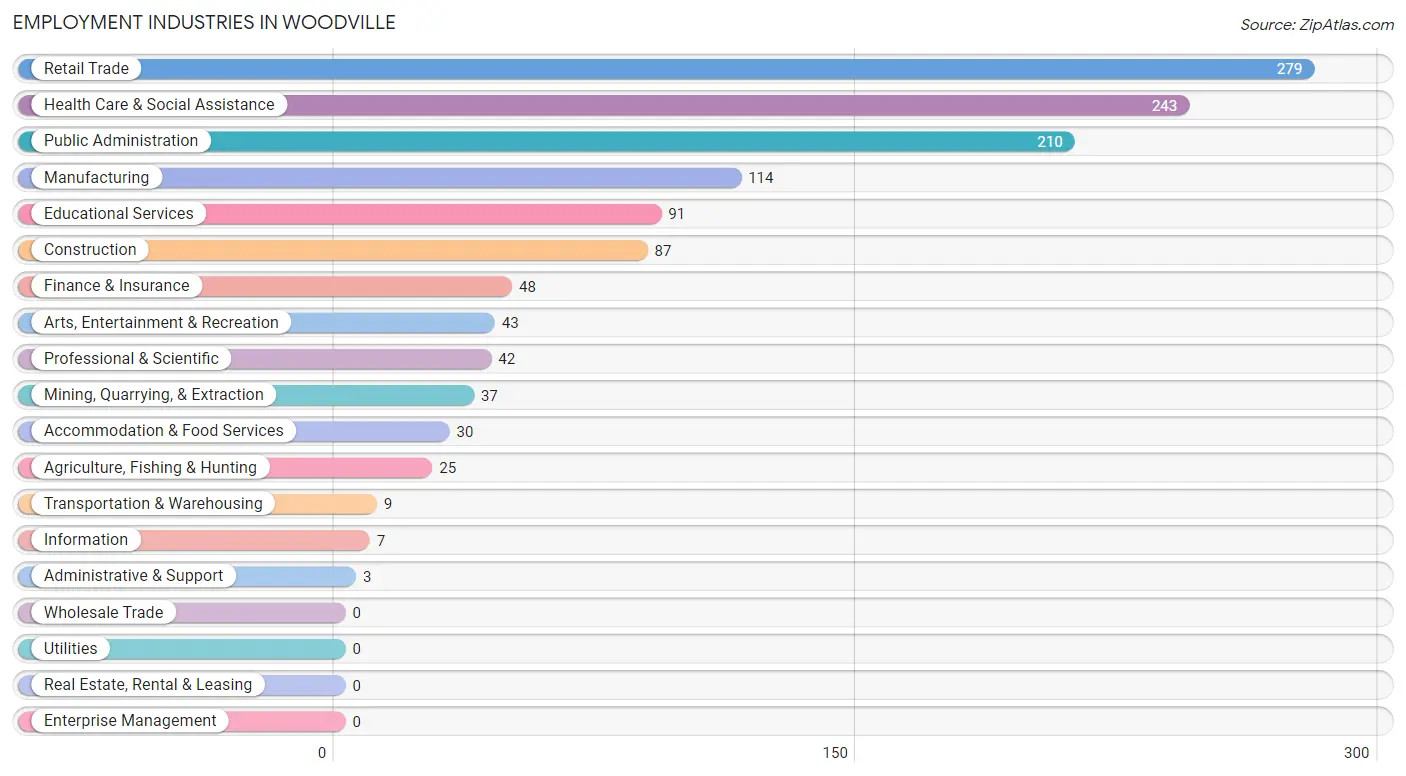
Employment Industries in Woodville
The major employment industries in Woodville include Retail Trade (279 | 21.0%), Health Care & Social Assistance (243 | 18.3%), Public Administration (210 | 15.8%), Manufacturing (114 | 8.6%), and Educational Services (91 | 6.9%).
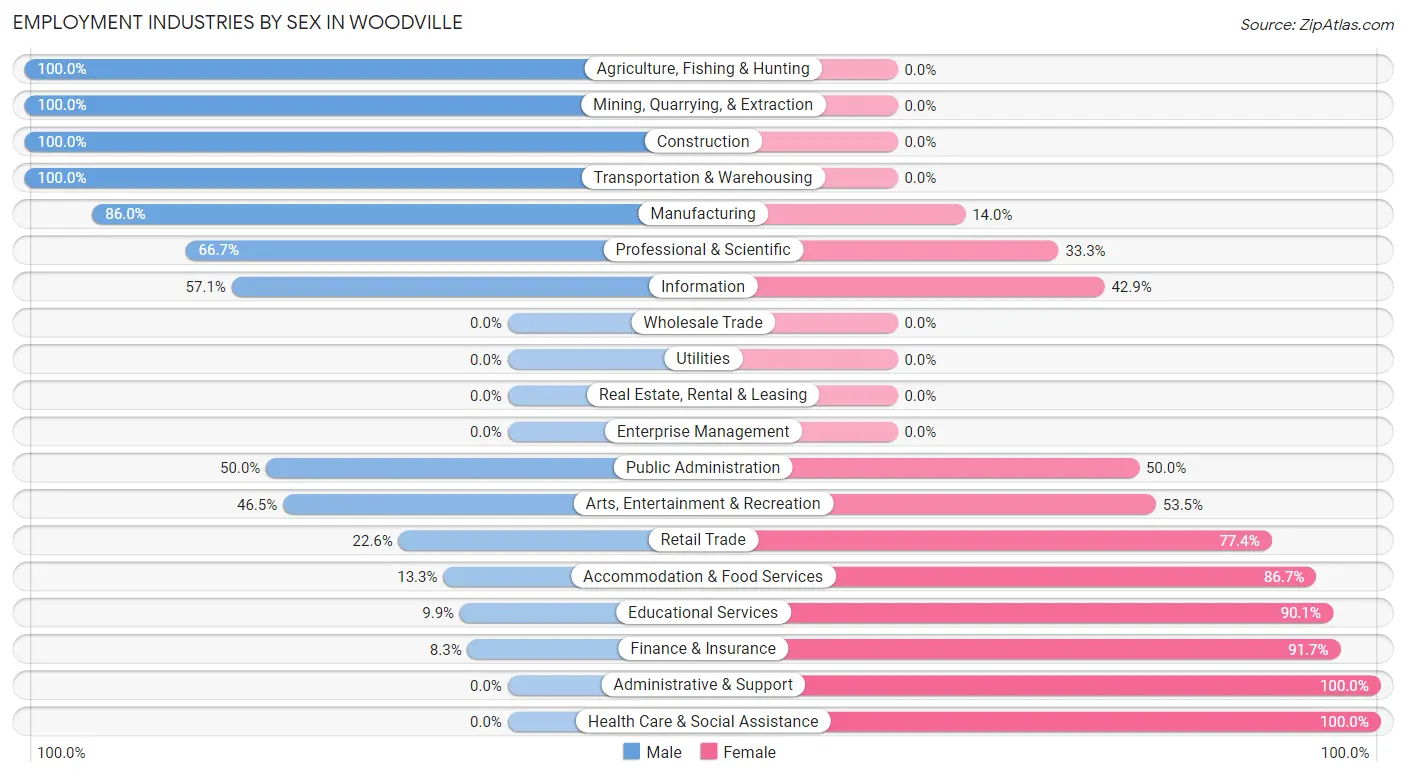
Employment Industries by Sex in Woodville
The Woodville industries that see more men than women are Agriculture, Fishing & Hunting (100.0%), Mining, Quarrying, & Extraction (100.0%), and Construction (100.0%), whereas the industries that tend to have a higher number of women are Administrative & Support (100.0%), Health Care & Social Assistance (100.0%), and Finance & Insurance (91.7%).
| Industry | Male | Female |
| Agriculture, Fishing & Hunting | 25 (100.0%) | 0 (0.0%) |
| Mining, Quarrying, & Extraction | 37 (100.0%) | 0 (0.0%) |
| Construction | 87 (100.0%) | 0 (0.0%) |
| Manufacturing | 98 (86.0%) | 16 (14.0%) |
| Wholesale Trade | 0 (0.0%) | 0 (0.0%) |
| Retail Trade | 63 (22.6%) | 216 (77.4%) |
| Transportation & Warehousing | 9 (100.0%) | 0 (0.0%) |
| Utilities | 0 (0.0%) | 0 (0.0%) |
| Information | 4 (57.1%) | 3 (42.9%) |
| Finance & Insurance | 4 (8.3%) | 44 (91.7%) |
| Real Estate, Rental & Leasing | 0 (0.0%) | 0 (0.0%) |
| Professional & Scientific | 28 (66.7%) | 14 (33.3%) |
| Enterprise Management | 0 (0.0%) | 0 (0.0%) |
| Administrative & Support | 0 (0.0%) | 3 (100.0%) |
| Educational Services | 9 (9.9%) | 82 (90.1%) |
| Health Care & Social Assistance | 0 (0.0%) | 243 (100.0%) |
| Arts, Entertainment & Recreation | 20 (46.5%) | 23 (53.5%) |
| Accommodation & Food Services | 4 (13.3%) | 26 (86.7%) |
| Public Administration | 105 (50.0%) | 105 (50.0%) |
| Total | 520 (39.2%) | 807 (60.8%) |
Education in Woodville
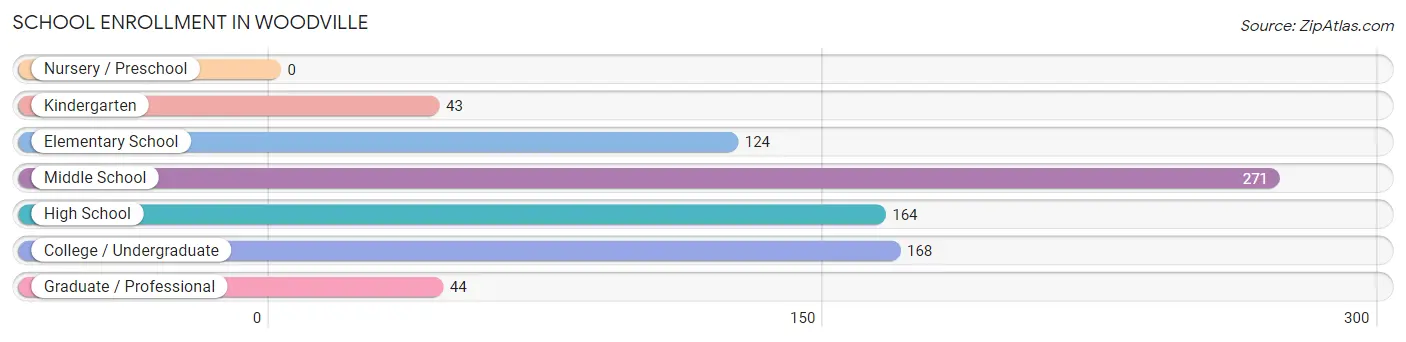
School Enrollment in Woodville
The most common levels of schooling among the 814 students in Woodville are middle school (271 | 33.3%), college / undergraduate (168 | 20.6%), and high school (164 | 20.2%).
| School Level | # Students | % Students |
| Nursery / Preschool | 0 | 0.0% |
| Kindergarten | 43 | 5.3% |
| Elementary School | 124 | 15.2% |
| Middle School | 271 | 33.3% |
| High School | 164 | 20.2% |
| College / Undergraduate | 168 | 20.6% |
| Graduate / Professional | 44 | 5.4% |
| Total | 814 | 100.0% |
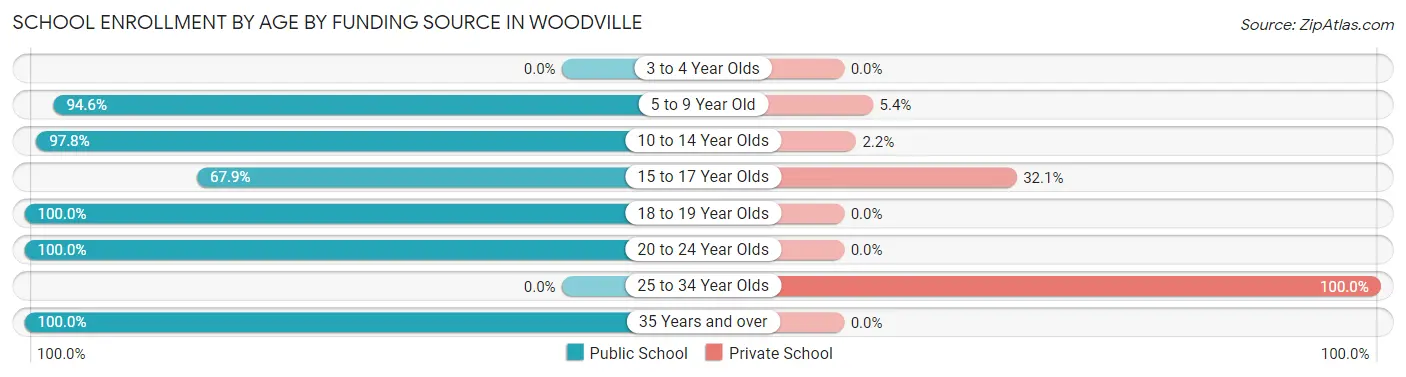
School Enrollment by Age by Funding Source in Woodville
Out of a total of 814 students who are enrolled in schools in Woodville, 62 (7.6%) attend a private institution, while the remaining 752 (92.4%) are enrolled in public schools. The age group of 25 to 34 year olds has the highest likelihood of being enrolled in private schools, with 10 (100.0% in the age bracket) enrolled. Conversely, the age group of 18 to 19 year olds has the lowest likelihood of being enrolled in a private school, with 6 (100.0% in the age bracket) attending a public institution.
| Age Bracket | Public School | Private School |
| 3 to 4 Year Olds | 0 (0.0%) | 0 (0.0%) |
| 5 to 9 Year Old | 158 (94.6%) | 9 (5.4%) |
| 10 to 14 Year Olds | 311 (97.8%) | 7 (2.2%) |
| 15 to 17 Year Olds | 76 (67.9%) | 36 (32.1%) |
| 18 to 19 Year Olds | 6 (100.0%) | 0 (0.0%) |
| 20 to 24 Year Olds | 107 (100.0%) | 0 (0.0%) |
| 25 to 34 Year Olds | 0 (0.0%) | 10 (100.0%) |
| 35 Years and over | 94 (100.0%) | 0 (0.0%) |
| Total | 752 (92.4%) | 62 (7.6%) |
Educational Attainment by Field of Study in Woodville
Education (82 | 27.0%), science & technology (56 | 18.4%), business (51 | 16.8%), bio, nature & agricultural (25 | 8.2%), and social sciences (25 | 8.2%) are the most common fields of study among 304 individuals in Woodville who have obtained a bachelor's degree or higher.
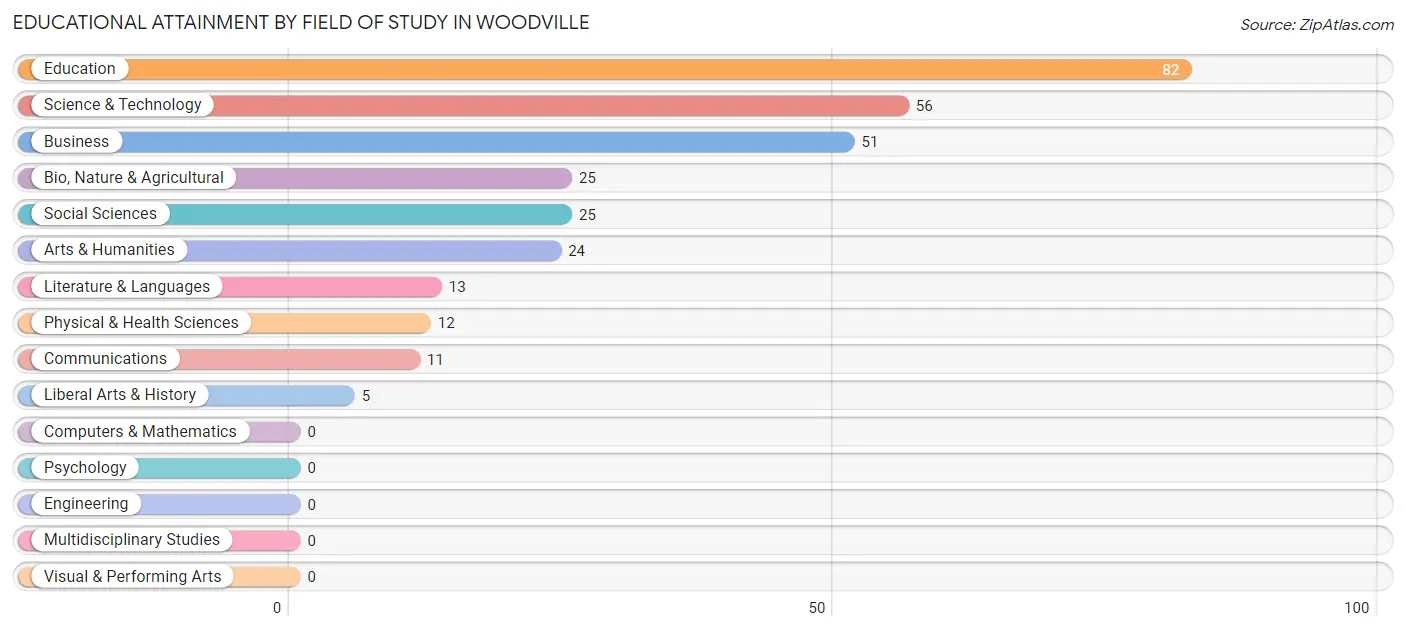
| Field of Study | # Graduates | % Graduates |
| Computers & Mathematics | 0 | 0.0% |
| Bio, Nature & Agricultural | 25 | 8.2% |
| Physical & Health Sciences | 12 | 4.0% |
| Psychology | 0 | 0.0% |
| Social Sciences | 25 | 8.2% |
| Engineering | 0 | 0.0% |
| Multidisciplinary Studies | 0 | 0.0% |
| Science & Technology | 56 | 18.4% |
| Business | 51 | 16.8% |
| Education | 82 | 27.0% |
| Literature & Languages | 13 | 4.3% |
| Liberal Arts & History | 5 | 1.6% |
| Visual & Performing Arts | 0 | 0.0% |
| Communications | 11 | 3.6% |
| Arts & Humanities | 24 | 7.9% |
| Total | 304 | 100.0% |
Transportation & Commute in Woodville
Vehicle Availability by Sex in Woodville
The most prevalent vehicle ownership categories in Woodville are males with 2 vehicles (229, accounting for 44.0%) and females with 2 vehicles (304, making up 28.4%).
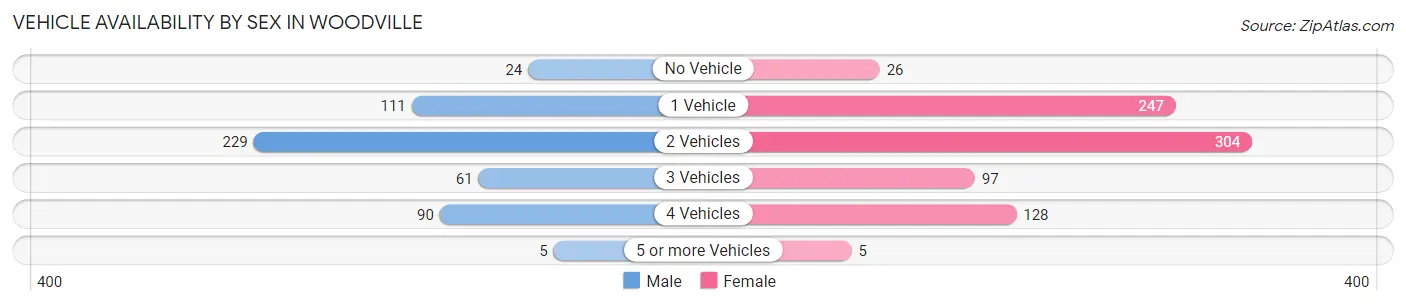
| Vehicles Available | Male | Female |
| No Vehicle | 24 (4.6%) | 26 (3.2%) |
| 1 Vehicle | 111 (21.3%) | 247 (30.6%) |
| 2 Vehicles | 229 (44.0%) | 304 (37.7%) |
| 3 Vehicles | 61 (11.7%) | 97 (12.0%) |
| 4 Vehicles | 90 (17.3%) | 128 (15.9%) |
| 5 or more Vehicles | 5 (1.0%) | 5 (0.6%) |
| Total | 520 (100.0%) | 807 (100.0%) |
Commute Time in Woodville
The most frequently occuring commute durations in Woodville are 5 to 9 minutes (375 commuters, 29.0%), less than 5 minutes (282 commuters, 21.8%), and 60 to 89 minutes (135 commuters, 10.4%).
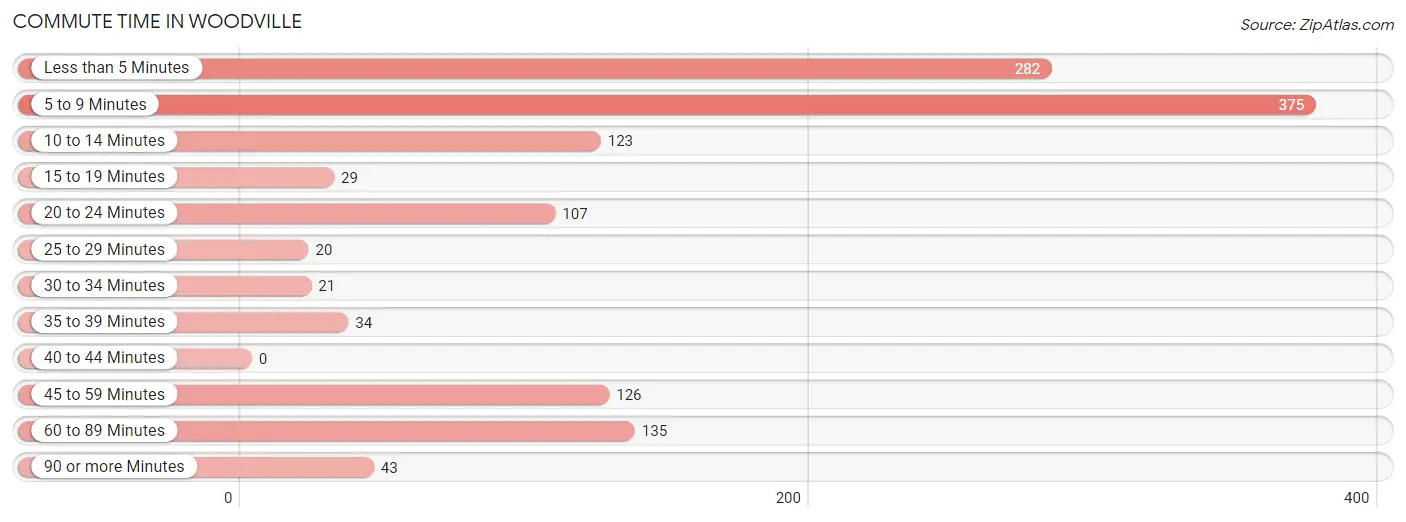
| Commute Time | # Commuters | % Commuters |
| Less than 5 Minutes | 282 | 21.8% |
| 5 to 9 Minutes | 375 | 29.0% |
| 10 to 14 Minutes | 123 | 9.5% |
| 15 to 19 Minutes | 29 | 2.2% |
| 20 to 24 Minutes | 107 | 8.3% |
| 25 to 29 Minutes | 20 | 1.5% |
| 30 to 34 Minutes | 21 | 1.6% |
| 35 to 39 Minutes | 34 | 2.6% |
| 40 to 44 Minutes | 0 | 0.0% |
| 45 to 59 Minutes | 126 | 9.7% |
| 60 to 89 Minutes | 135 | 10.4% |
| 90 or more Minutes | 43 | 3.3% |
Commute Time by Sex in Woodville
The most common commute times in Woodville are 5 to 9 minutes (109 commuters, 21.8%) for males and 5 to 9 minutes (266 commuters, 33.5%) for females.
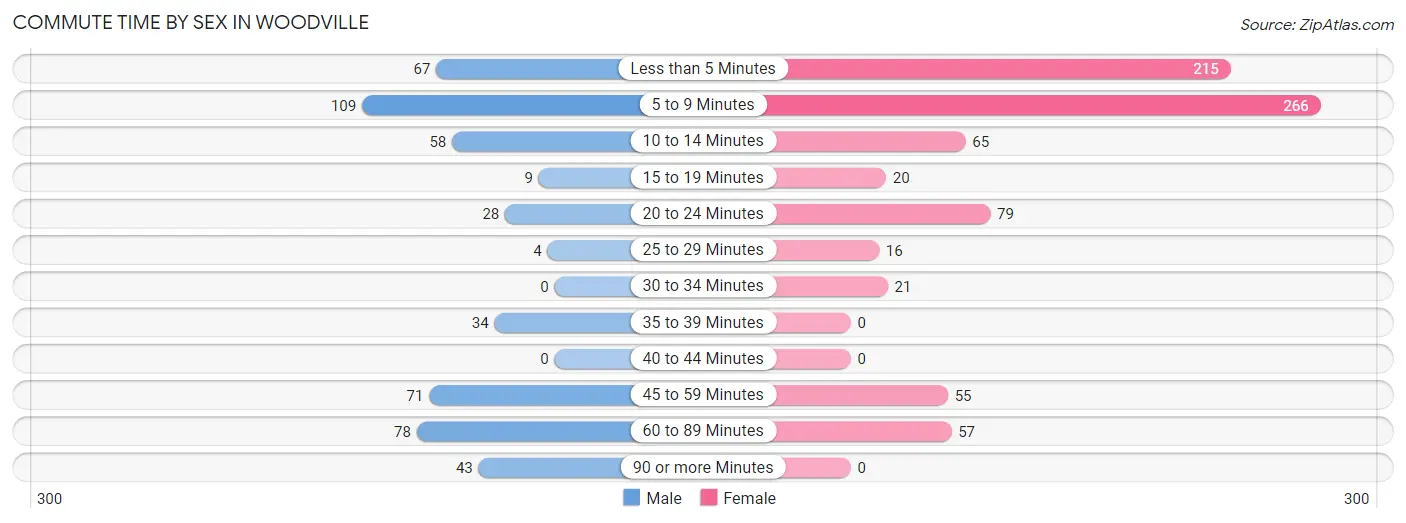
| Commute Time | Male | Female |
| Less than 5 Minutes | 67 (13.4%) | 215 (27.1%) |
| 5 to 9 Minutes | 109 (21.8%) | 266 (33.5%) |
| 10 to 14 Minutes | 58 (11.6%) | 65 (8.2%) |
| 15 to 19 Minutes | 9 (1.8%) | 20 (2.5%) |
| 20 to 24 Minutes | 28 (5.6%) | 79 (10.0%) |
| 25 to 29 Minutes | 4 (0.8%) | 16 (2.0%) |
| 30 to 34 Minutes | 0 (0.0%) | 21 (2.6%) |
| 35 to 39 Minutes | 34 (6.8%) | 0 (0.0%) |
| 40 to 44 Minutes | 0 (0.0%) | 0 (0.0%) |
| 45 to 59 Minutes | 71 (14.2%) | 55 (6.9%) |
| 60 to 89 Minutes | 78 (15.6%) | 57 (7.2%) |
| 90 or more Minutes | 43 (8.6%) | 0 (0.0%) |
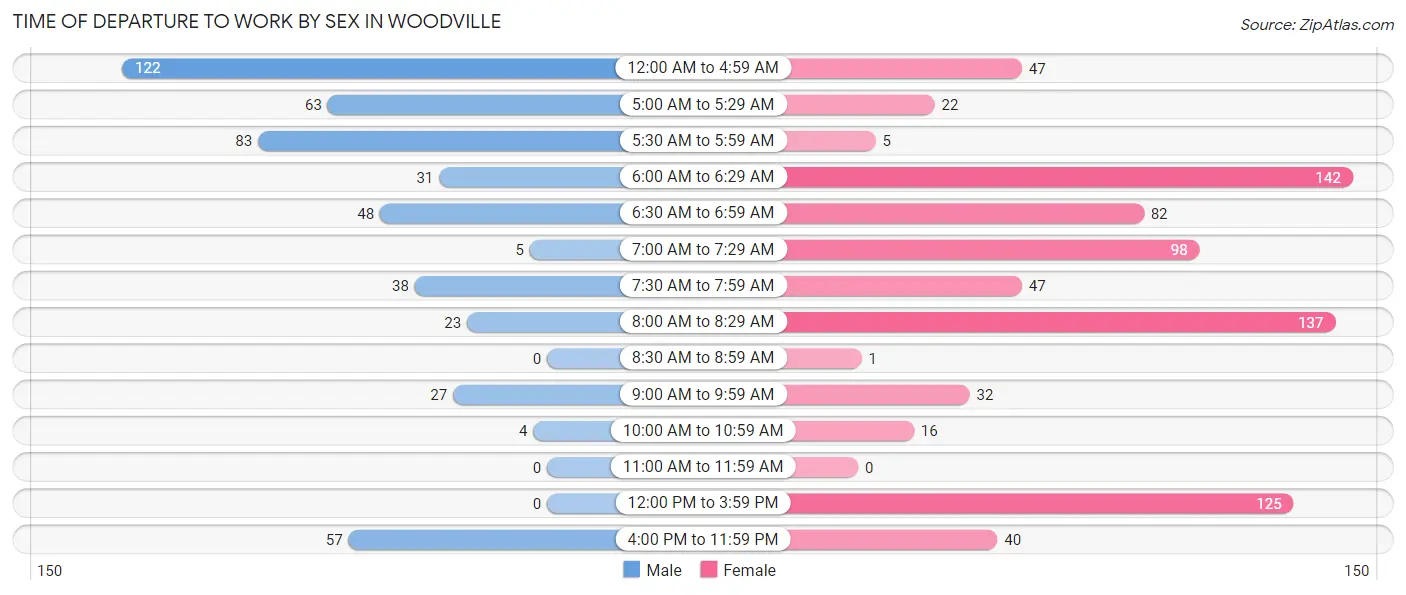
Time of Departure to Work by Sex in Woodville
The most frequent times of departure to work in Woodville are 12:00 AM to 4:59 AM (122, 24.3%) for males and 6:00 AM to 6:29 AM (142, 17.9%) for females.
| Time of Departure | Male | Female |
| 12:00 AM to 4:59 AM | 122 (24.3%) | 47 (5.9%) |
| 5:00 AM to 5:29 AM | 63 (12.6%) | 22 (2.8%) |
| 5:30 AM to 5:59 AM | 83 (16.6%) | 5 (0.6%) |
| 6:00 AM to 6:29 AM | 31 (6.2%) | 142 (17.9%) |
| 6:30 AM to 6:59 AM | 48 (9.6%) | 82 (10.3%) |
| 7:00 AM to 7:29 AM | 5 (1.0%) | 98 (12.3%) |
| 7:30 AM to 7:59 AM | 38 (7.6%) | 47 (5.9%) |
| 8:00 AM to 8:29 AM | 23 (4.6%) | 137 (17.2%) |
| 8:30 AM to 8:59 AM | 0 (0.0%) | 1 (0.1%) |
| 9:00 AM to 9:59 AM | 27 (5.4%) | 32 (4.0%) |
| 10:00 AM to 10:59 AM | 4 (0.8%) | 16 (2.0%) |
| 11:00 AM to 11:59 AM | 0 (0.0%) | 0 (0.0%) |
| 12:00 PM to 3:59 PM | 0 (0.0%) | 125 (15.7%) |
| 4:00 PM to 11:59 PM | 57 (11.4%) | 40 (5.0%) |
| Total | 501 (100.0%) | 794 (100.0%) |
Housing Occupancy in Woodville
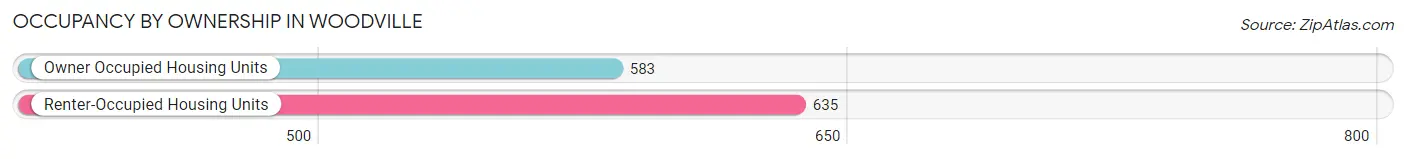
Occupancy by Ownership in Woodville
Of the total 1,218 dwellings in Woodville, owner-occupied units account for 583 (47.9%), while renter-occupied units make up 635 (52.1%).
| Occupancy | # Housing Units | % Housing Units |
| Owner Occupied Housing Units | 583 | 47.9% |
| Renter-Occupied Housing Units | 635 | 52.1% |
| Total Occupied Housing Units | 1,218 | 100.0% |
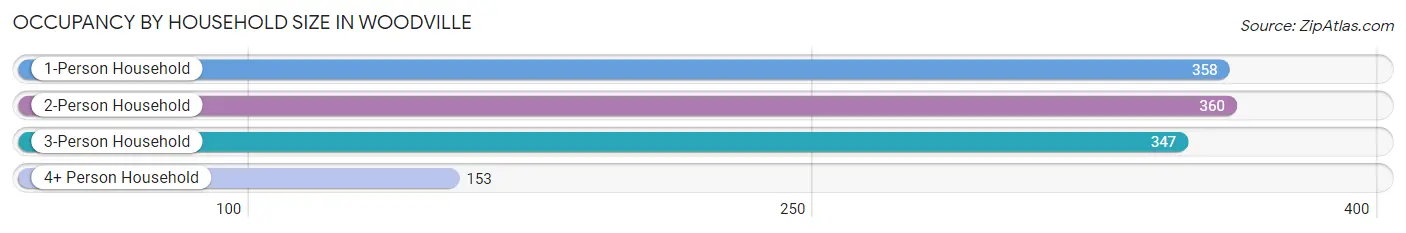
Occupancy by Household Size in Woodville
| Household Size | # Housing Units | % Housing Units |
| 1-Person Household | 358 | 29.4% |
| 2-Person Household | 360 | 29.6% |
| 3-Person Household | 347 | 28.5% |
| 4+ Person Household | 153 | 12.6% |
| Total Housing Units | 1,218 | 100.0% |
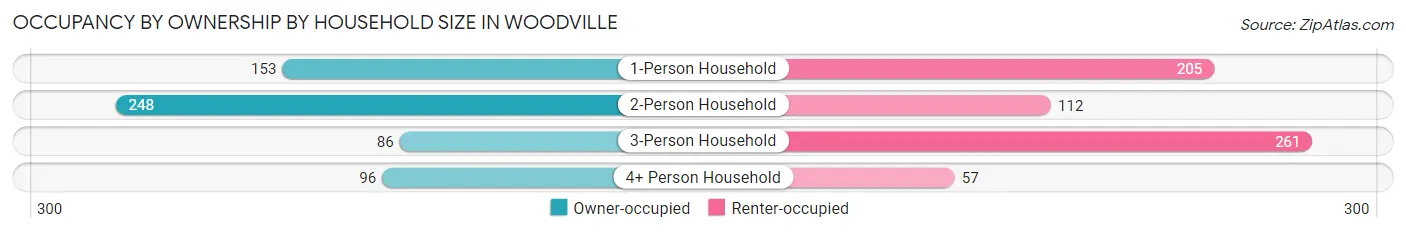
Occupancy by Ownership by Household Size in Woodville
| Household Size | Owner-occupied | Renter-occupied |
| 1-Person Household | 153 (42.7%) | 205 (57.3%) |
| 2-Person Household | 248 (68.9%) | 112 (31.1%) |
| 3-Person Household | 86 (24.8%) | 261 (75.2%) |
| 4+ Person Household | 96 (62.7%) | 57 (37.2%) |
| Total Housing Units | 583 (47.9%) | 635 (52.1%) |
Occupancy by Educational Attainment in Woodville
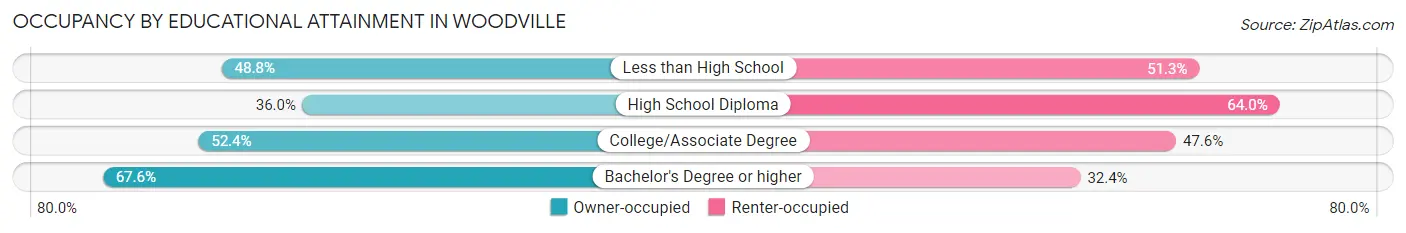
| Household Size | Owner-occupied | Renter-occupied |
| Less than High School | 78 (48.7%) | 82 (51.2%) |
| High School Diploma | 169 (36.0%) | 300 (64.0%) |
| College/Associate Degree | 215 (52.4%) | 195 (47.6%) |
| Bachelor's Degree or higher | 121 (67.6%) | 58 (32.4%) |
Occupancy by Age of Householder in Woodville
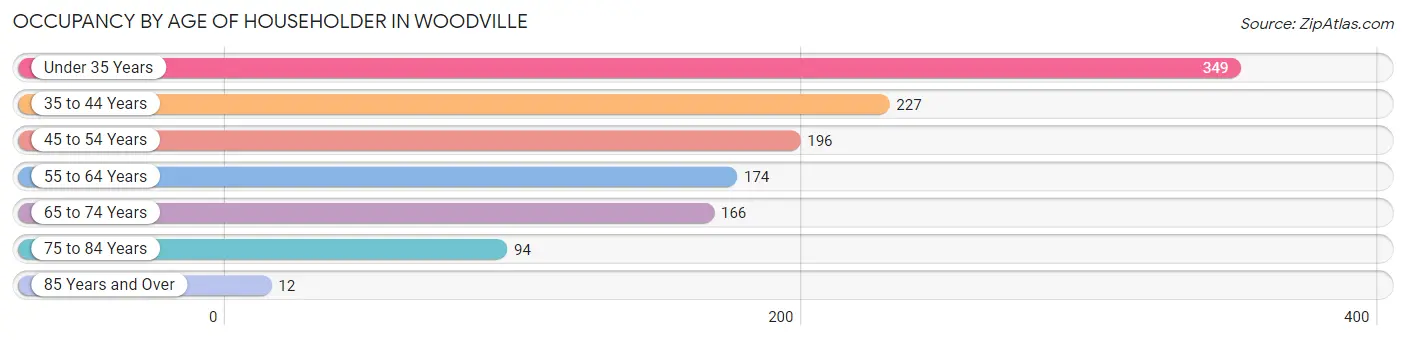
| Age Bracket | # Households | % Households |
| Under 35 Years | 349 | 28.6% |
| 35 to 44 Years | 227 | 18.6% |
| 45 to 54 Years | 196 | 16.1% |
| 55 to 64 Years | 174 | 14.3% |
| 65 to 74 Years | 166 | 13.6% |
| 75 to 84 Years | 94 | 7.7% |
| 85 Years and Over | 12 | 1.0% |
| Total | 1,218 | 100.0% |
Housing Finances in Woodville
Median Income by Occupancy in Woodville
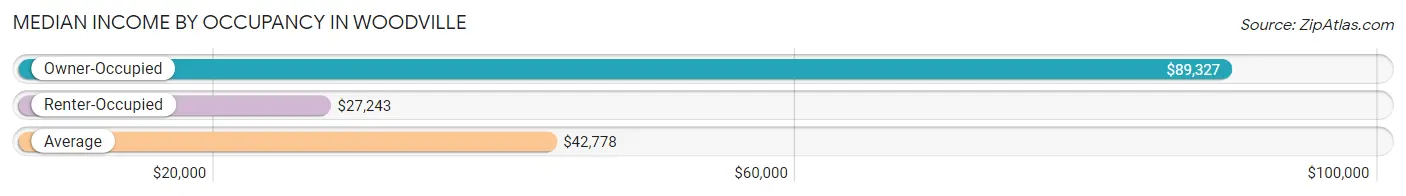
| Occupancy Type | # Households | Median Income |
| Owner-Occupied | 583 (47.9%) | $89,327 |
| Renter-Occupied | 635 (52.1%) | $27,243 |
| Average | 1,218 (100.0%) | $42,778 |
Occupancy by Householder Income Bracket in Woodville
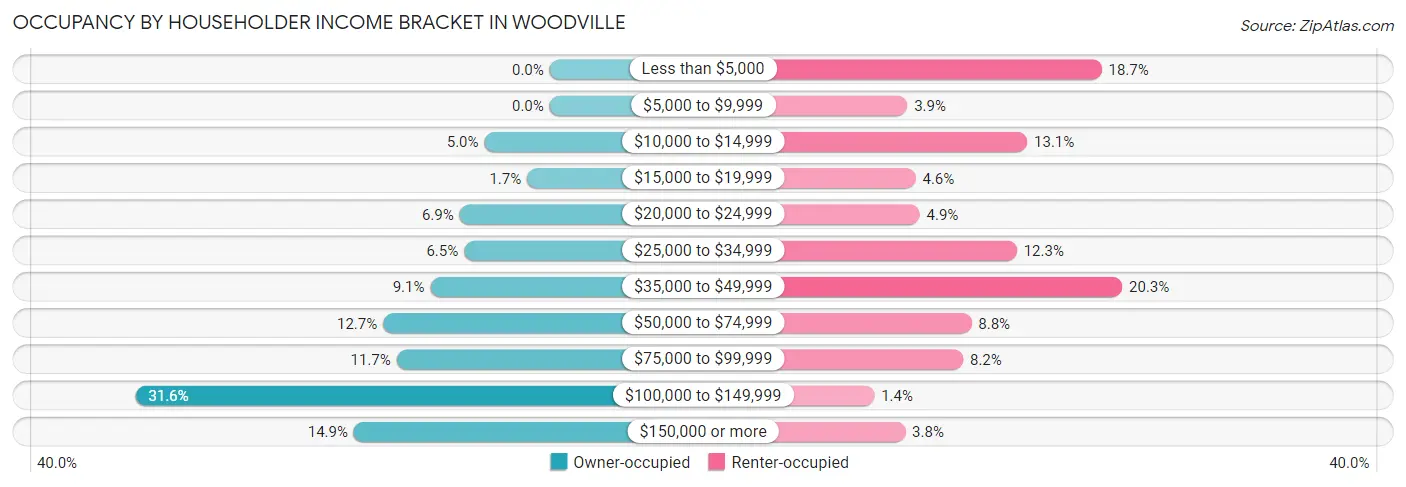
| Income Bracket | Owner-occupied | Renter-occupied |
| Less than $5,000 | 0 (0.0%) | 119 (18.7%) |
| $5,000 to $9,999 | 0 (0.0%) | 25 (3.9%) |
| $10,000 to $14,999 | 29 (5.0%) | 83 (13.1%) |
| $15,000 to $19,999 | 10 (1.7%) | 29 (4.6%) |
| $20,000 to $24,999 | 40 (6.9%) | 31 (4.9%) |
| $25,000 to $34,999 | 38 (6.5%) | 78 (12.3%) |
| $35,000 to $49,999 | 53 (9.1%) | 129 (20.3%) |
| $50,000 to $74,999 | 74 (12.7%) | 56 (8.8%) |
| $75,000 to $99,999 | 68 (11.7%) | 52 (8.2%) |
| $100,000 to $149,999 | 184 (31.6%) | 9 (1.4%) |
| $150,000 or more | 87 (14.9%) | 24 (3.8%) |
| Total | 583 (100.0%) | 635 (100.0%) |
Monthly Housing Cost Tiers in Woodville
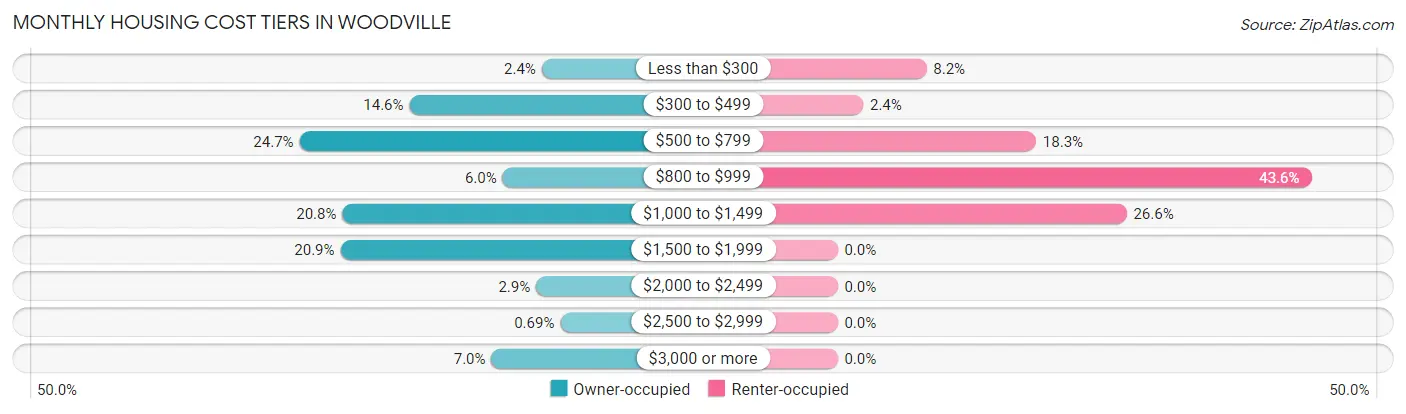
| Monthly Cost | Owner-occupied | Renter-occupied |
| Less than $300 | 14 (2.4%) | 52 (8.2%) |
| $300 to $499 | 85 (14.6%) | 15 (2.4%) |
| $500 to $799 | 144 (24.7%) | 116 (18.3%) |
| $800 to $999 | 35 (6.0%) | 277 (43.6%) |
| $1,000 to $1,499 | 121 (20.7%) | 169 (26.6%) |
| $1,500 to $1,999 | 122 (20.9%) | 0 (0.0%) |
| $2,000 to $2,499 | 17 (2.9%) | 0 (0.0%) |
| $2,500 to $2,999 | 4 (0.7%) | 0 (0.0%) |
| $3,000 or more | 41 (7.0%) | 0 (0.0%) |
| Total | 583 (100.0%) | 635 (100.0%) |
Physical Housing Characteristics in Woodville
Housing Structures in Woodville
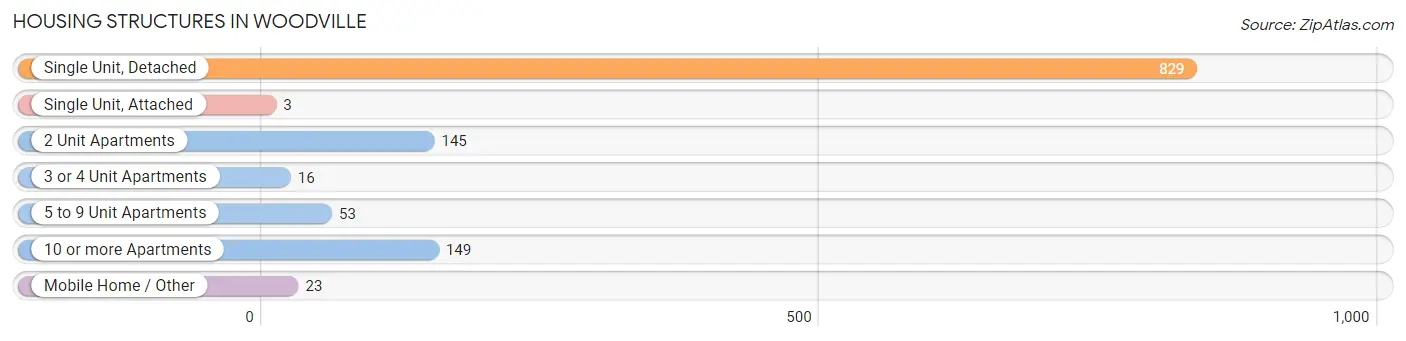
| Structure Type | # Housing Units | % Housing Units |
| Single Unit, Detached | 829 | 68.1% |
| Single Unit, Attached | 3 | 0.3% |
| 2 Unit Apartments | 145 | 11.9% |
| 3 or 4 Unit Apartments | 16 | 1.3% |
| 5 to 9 Unit Apartments | 53 | 4.3% |
| 10 or more Apartments | 149 | 12.2% |
| Mobile Home / Other | 23 | 1.9% |
| Total | 1,218 | 100.0% |
Housing Structures by Occupancy in Woodville
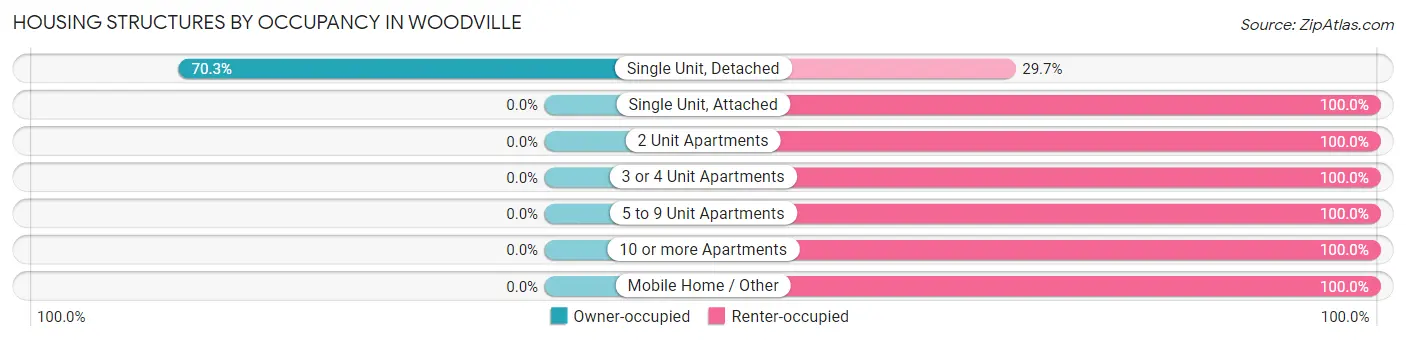
| Structure Type | Owner-occupied | Renter-occupied |
| Single Unit, Detached | 583 (70.3%) | 246 (29.7%) |
| Single Unit, Attached | 0 (0.0%) | 3 (100.0%) |
| 2 Unit Apartments | 0 (0.0%) | 145 (100.0%) |
| 3 or 4 Unit Apartments | 0 (0.0%) | 16 (100.0%) |
| 5 to 9 Unit Apartments | 0 (0.0%) | 53 (100.0%) |
| 10 or more Apartments | 0 (0.0%) | 149 (100.0%) |
| Mobile Home / Other | 0 (0.0%) | 23 (100.0%) |
| Total | 583 (47.9%) | 635 (52.1%) |
Housing Structures by Number of Rooms in Woodville
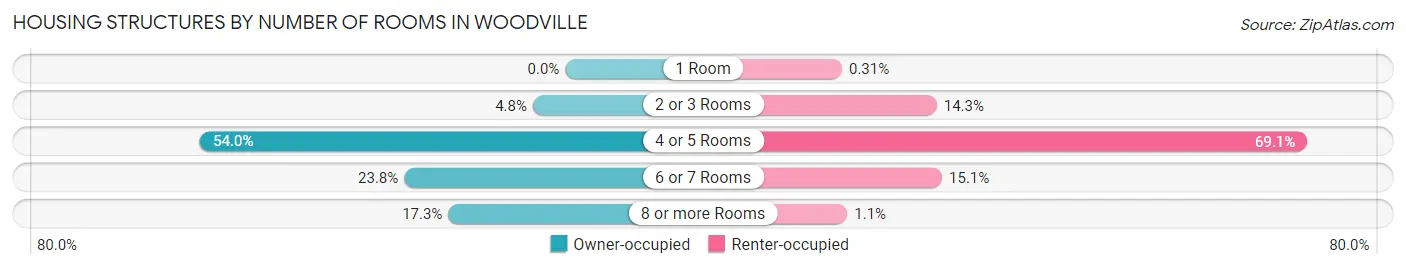
| Number of Rooms | Owner-occupied | Renter-occupied |
| 1 Room | 0 (0.0%) | 2 (0.3%) |
| 2 or 3 Rooms | 28 (4.8%) | 91 (14.3%) |
| 4 or 5 Rooms | 315 (54.0%) | 439 (69.1%) |
| 6 or 7 Rooms | 139 (23.8%) | 96 (15.1%) |
| 8 or more Rooms | 101 (17.3%) | 7 (1.1%) |
| Total | 583 (100.0%) | 635 (100.0%) |
Housing Structure by Heating Type in Woodville
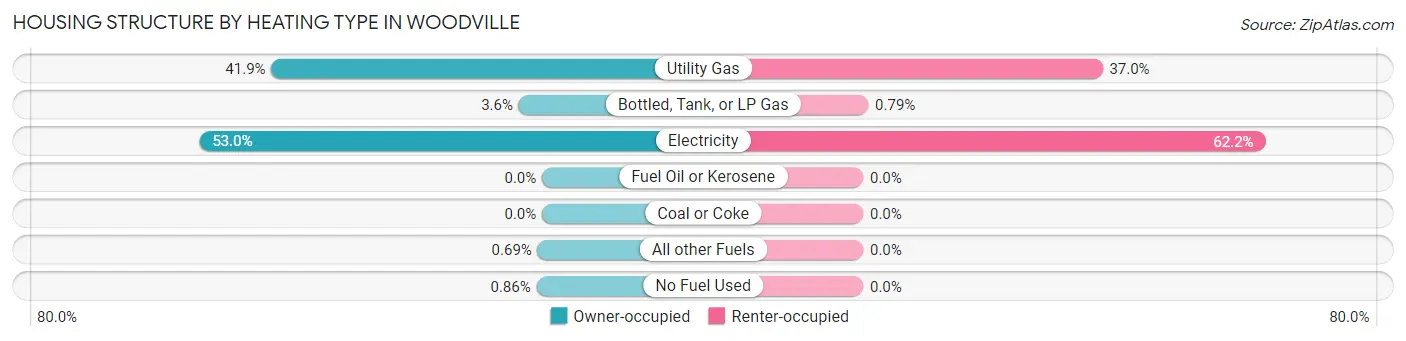
| Heating Type | Owner-occupied | Renter-occupied |
| Utility Gas | 244 (41.8%) | 235 (37.0%) |
| Bottled, Tank, or LP Gas | 21 (3.6%) | 5 (0.8%) |
| Electricity | 309 (53.0%) | 395 (62.2%) |
| Fuel Oil or Kerosene | 0 (0.0%) | 0 (0.0%) |
| Coal or Coke | 0 (0.0%) | 0 (0.0%) |
| All other Fuels | 4 (0.7%) | 0 (0.0%) |
| No Fuel Used | 5 (0.9%) | 0 (0.0%) |
| Total | 583 (100.0%) | 635 (100.0%) |
Household Vehicle Usage in Woodville
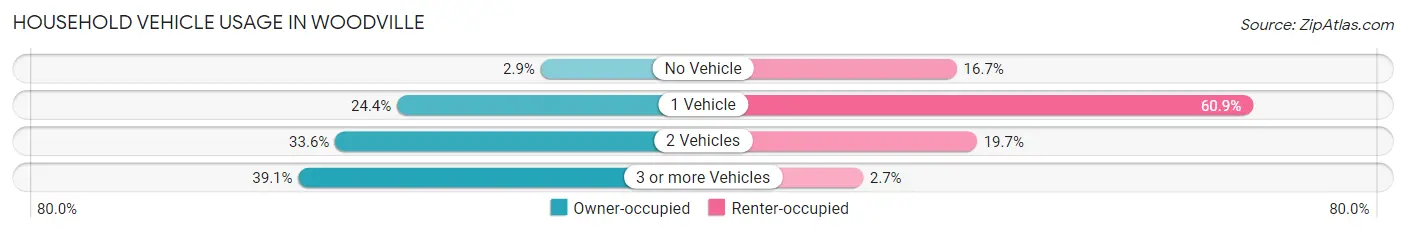
| Vehicles per Household | Owner-occupied | Renter-occupied |
| No Vehicle | 17 (2.9%) | 106 (16.7%) |
| 1 Vehicle | 142 (24.4%) | 387 (60.9%) |
| 2 Vehicles | 196 (33.6%) | 125 (19.7%) |
| 3 or more Vehicles | 228 (39.1%) | 17 (2.7%) |
| Total | 583 (100.0%) | 635 (100.0%) |
Real Estate & Mortgages in Woodville
Real Estate and Mortgage Overview in Woodville
| Characteristic | Without Mortgage | With Mortgage |
| Housing Units | 273 | 310 |
| Median Property Value | $159,600 | $177,000 |
| Median Household Income | $53,375 | $47 |
| Monthly Housing Costs | $582 | $0 |
| Real Estate Taxes | $2,213 | $4 |
Property Value by Mortgage Status in Woodville
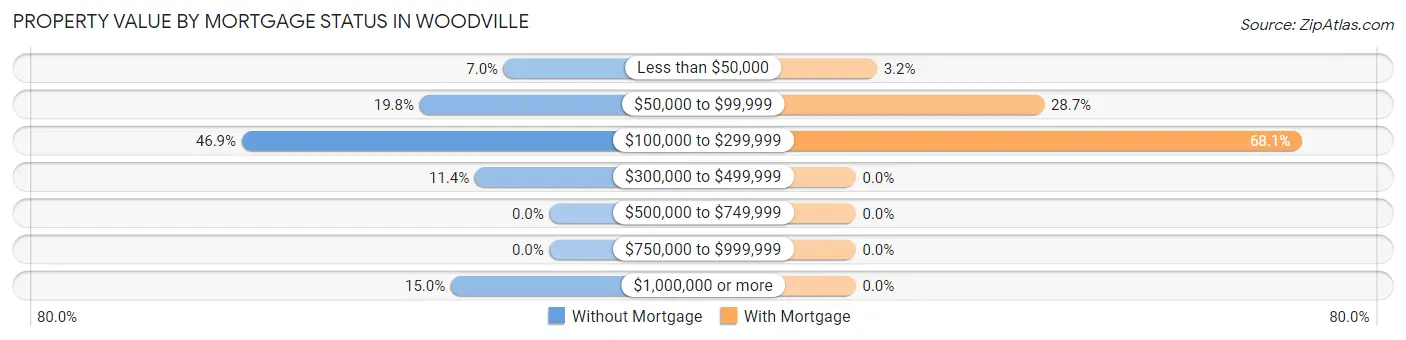
| Property Value | Without Mortgage | With Mortgage |
| Less than $50,000 | 19 (7.0%) | 10 (3.2%) |
| $50,000 to $99,999 | 54 (19.8%) | 89 (28.7%) |
| $100,000 to $299,999 | 128 (46.9%) | 211 (68.1%) |
| $300,000 to $499,999 | 31 (11.4%) | 0 (0.0%) |
| $500,000 to $749,999 | 0 (0.0%) | 0 (0.0%) |
| $750,000 to $999,999 | 0 (0.0%) | 0 (0.0%) |
| $1,000,000 or more | 41 (15.0%) | 0 (0.0%) |
| Total | 273 (100.0%) | 310 (100.0%) |
Household Income by Mortgage Status in Woodville
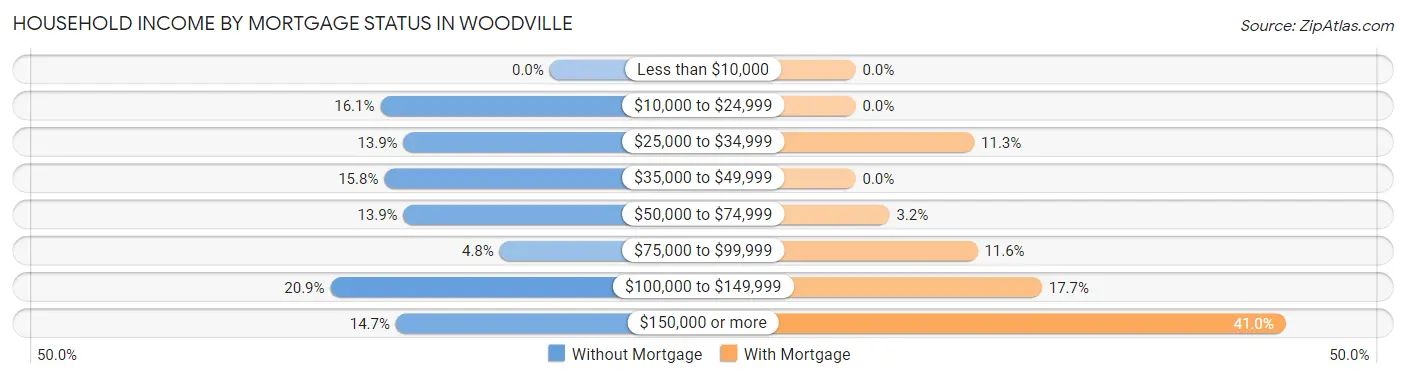
| Household Income | Without Mortgage | With Mortgage |
| Less than $10,000 | 0 (0.0%) | 0 (0.0%) |
| $10,000 to $24,999 | 44 (16.1%) | 0 (0.0%) |
| $25,000 to $34,999 | 38 (13.9%) | 35 (11.3%) |
| $35,000 to $49,999 | 43 (15.8%) | 0 (0.0%) |
| $50,000 to $74,999 | 38 (13.9%) | 10 (3.2%) |
| $75,000 to $99,999 | 13 (4.8%) | 36 (11.6%) |
| $100,000 to $149,999 | 57 (20.9%) | 55 (17.7%) |
| $150,000 or more | 40 (14.6%) | 127 (41.0%) |
| Total | 273 (100.0%) | 310 (100.0%) |
Property Value to Household Income Ratio in Woodville
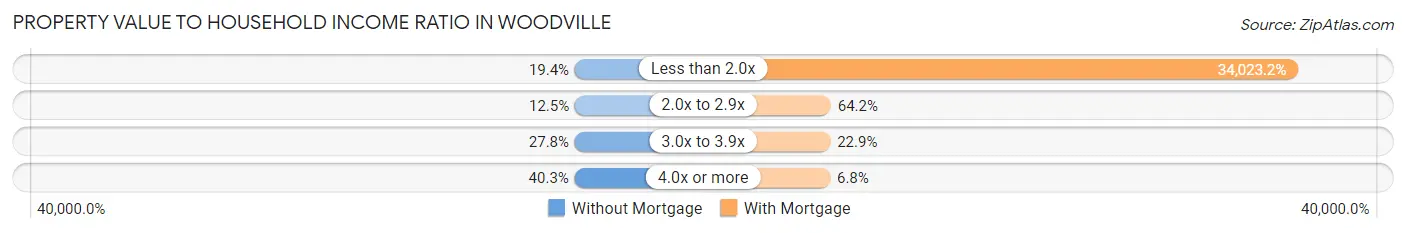
| Value-to-Income Ratio | Without Mortgage | With Mortgage |
| Less than 2.0x | 53 (19.4%) | 105,472 (34,023.2%) |
| 2.0x to 2.9x | 34 (12.4%) | 199 (64.2%) |
| 3.0x to 3.9x | 76 (27.8%) | 71 (22.9%) |
| 4.0x or more | 110 (40.3%) | 21 (6.8%) |
| Total | 273 (100.0%) | 310 (100.0%) |
Real Estate Taxes by Mortgage Status in Woodville
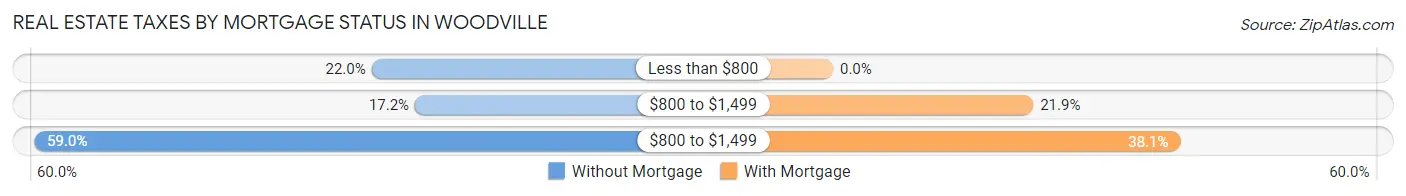
| Property Taxes | Without Mortgage | With Mortgage |
| Less than $800 | 60 (22.0%) | 0 (0.0%) |
| $800 to $1,499 | 47 (17.2%) | 68 (21.9%) |
| $800 to $1,499 | 161 (59.0%) | 118 (38.1%) |
| Total | 273 (100.0%) | 310 (100.0%) |
Health & Disability in Woodville
Health Insurance Coverage by Age in Woodville
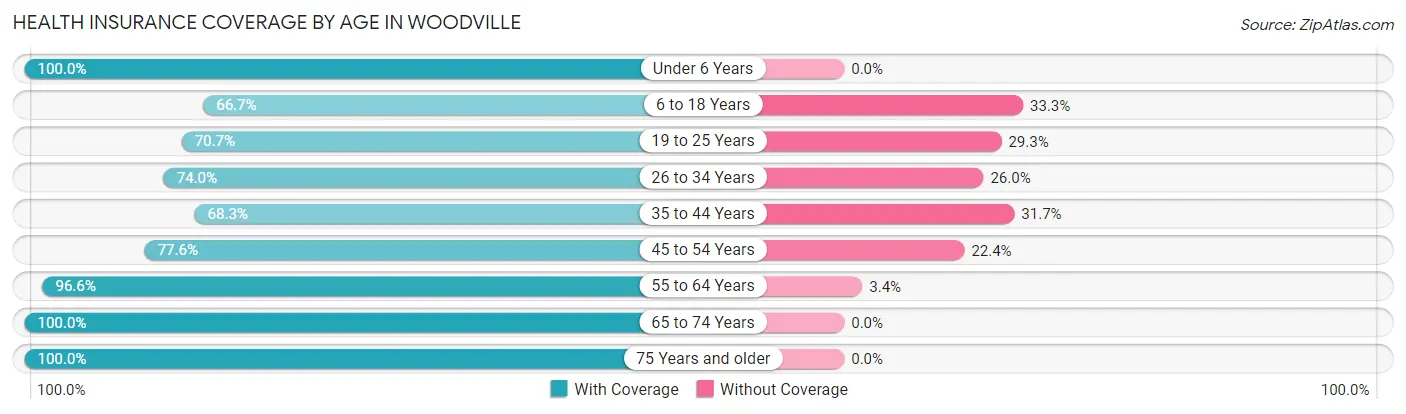
| Age Bracket | With Coverage | Without Coverage |
| Under 6 Years | 138 (100.0%) | 0 (0.0%) |
| 6 to 18 Years | 414 (66.7%) | 207 (33.3%) |
| 19 to 25 Years | 275 (70.7%) | 114 (29.3%) |
| 26 to 34 Years | 211 (74.0%) | 74 (26.0%) |
| 35 to 44 Years | 282 (68.3%) | 131 (31.7%) |
| 45 to 54 Years | 270 (77.6%) | 78 (22.4%) |
| 55 to 64 Years | 230 (96.6%) | 8 (3.4%) |
| 65 to 74 Years | 295 (100.0%) | 0 (0.0%) |
| 75 Years and older | 149 (100.0%) | 0 (0.0%) |
| Total | 2,264 (78.7%) | 612 (21.3%) |
Health Insurance Coverage by Citizenship Status in Woodville

| Citizenship Status | With Coverage | Without Coverage |
| Native Born | 138 (100.0%) | 0 (0.0%) |
| Foreign Born, Citizen | 414 (66.7%) | 207 (33.3%) |
| Foreign Born, not a Citizen | 275 (70.7%) | 114 (29.3%) |
Health Insurance Coverage by Household Income in Woodville
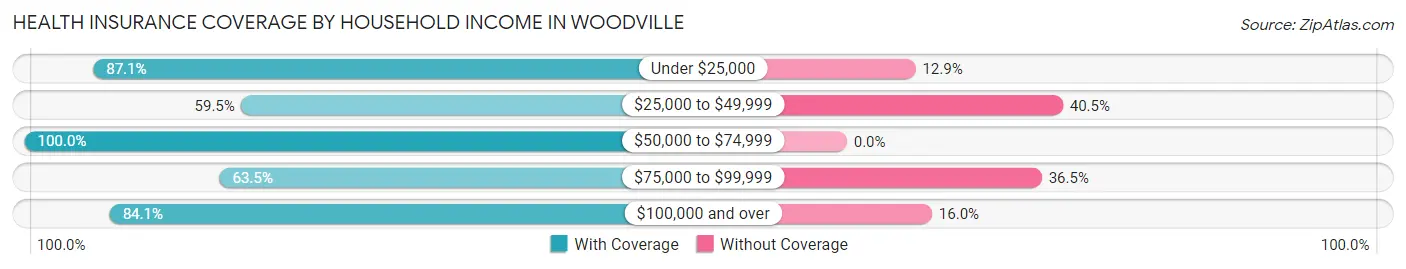
| Household Income | With Coverage | Without Coverage |
| Under $25,000 | 467 (87.1%) | 69 (12.9%) |
| $25,000 to $49,999 | 428 (59.5%) | 291 (40.5%) |
| $50,000 to $74,999 | 419 (100.0%) | 0 (0.0%) |
| $75,000 to $99,999 | 186 (63.5%) | 107 (36.5%) |
| $100,000 and over | 764 (84.1%) | 145 (16.0%) |
Public vs Private Health Insurance Coverage by Age in Woodville
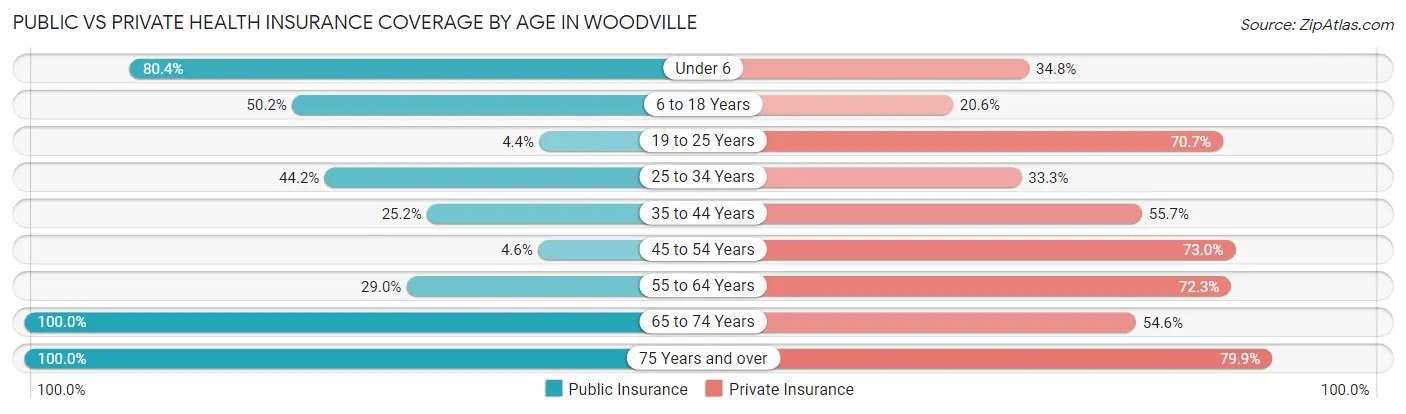
| Age Bracket | Public Insurance | Private Insurance |
| Under 6 | 111 (80.4%) | 48 (34.8%) |
| 6 to 18 Years | 312 (50.2%) | 128 (20.6%) |
| 19 to 25 Years | 17 (4.4%) | 275 (70.7%) |
| 25 to 34 Years | 126 (44.2%) | 95 (33.3%) |
| 35 to 44 Years | 104 (25.2%) | 230 (55.7%) |
| 45 to 54 Years | 16 (4.6%) | 254 (73.0%) |
| 55 to 64 Years | 69 (29.0%) | 172 (72.3%) |
| 65 to 74 Years | 295 (100.0%) | 161 (54.6%) |
| 75 Years and over | 149 (100.0%) | 119 (79.9%) |
| Total | 1,199 (41.7%) | 1,482 (51.5%) |
Disability Status by Sex by Age in Woodville
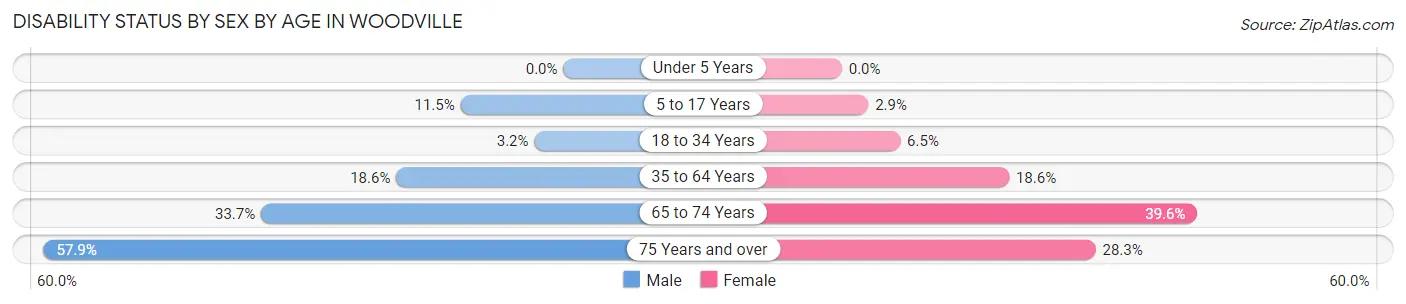
| Age Bracket | Male | Female |
| Under 5 Years | 0 (0.0%) | 0 (0.0%) |
| 5 to 17 Years | 41 (11.5%) | 8 (2.9%) |
| 18 to 34 Years | 10 (3.2%) | 26 (6.5%) |
| 35 to 64 Years | 86 (18.6%) | 100 (18.6%) |
| 65 to 74 Years | 33 (33.7%) | 78 (39.6%) |
| 75 Years and over | 33 (57.9%) | 26 (28.3%) |
Disability Class by Sex by Age in Woodville
Disability Class: Hearing Difficulty
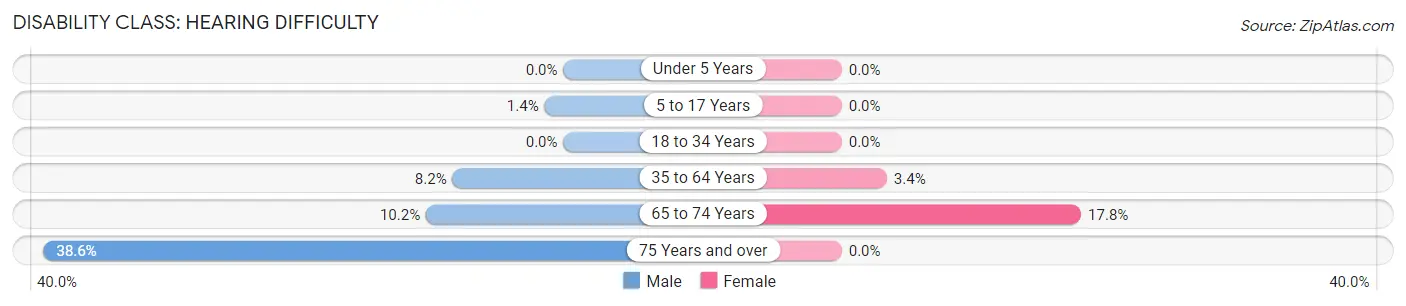
| Age Bracket | Male | Female |
| Under 5 Years | 0 (0.0%) | 0 (0.0%) |
| 5 to 17 Years | 5 (1.4%) | 0 (0.0%) |
| 18 to 34 Years | 0 (0.0%) | 0 (0.0%) |
| 35 to 64 Years | 38 (8.2%) | 18 (3.4%) |
| 65 to 74 Years | 10 (10.2%) | 35 (17.8%) |
| 75 Years and over | 22 (38.6%) | 0 (0.0%) |
Disability Class: Vision Difficulty
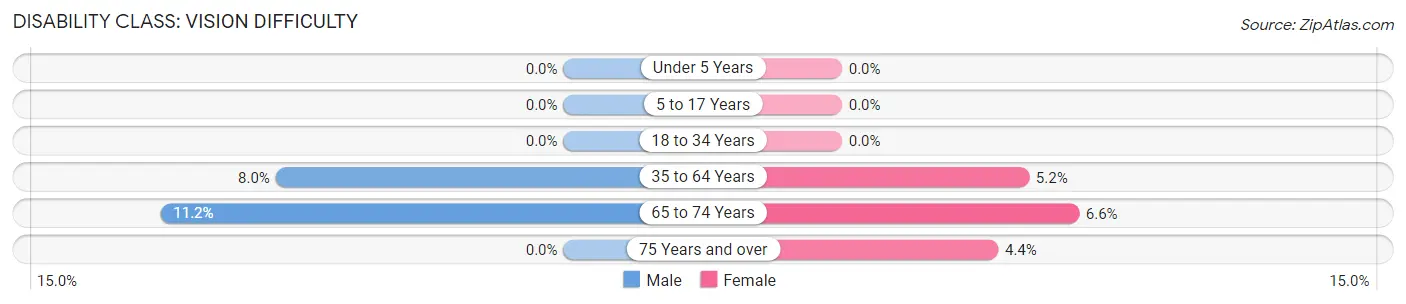
| Age Bracket | Male | Female |
| Under 5 Years | 0 (0.0%) | 0 (0.0%) |
| 5 to 17 Years | 0 (0.0%) | 0 (0.0%) |
| 18 to 34 Years | 0 (0.0%) | 0 (0.0%) |
| 35 to 64 Years | 37 (8.0%) | 28 (5.2%) |
| 65 to 74 Years | 11 (11.2%) | 13 (6.6%) |
| 75 Years and over | 0 (0.0%) | 4 (4.3%) |
Disability Class: Cognitive Difficulty
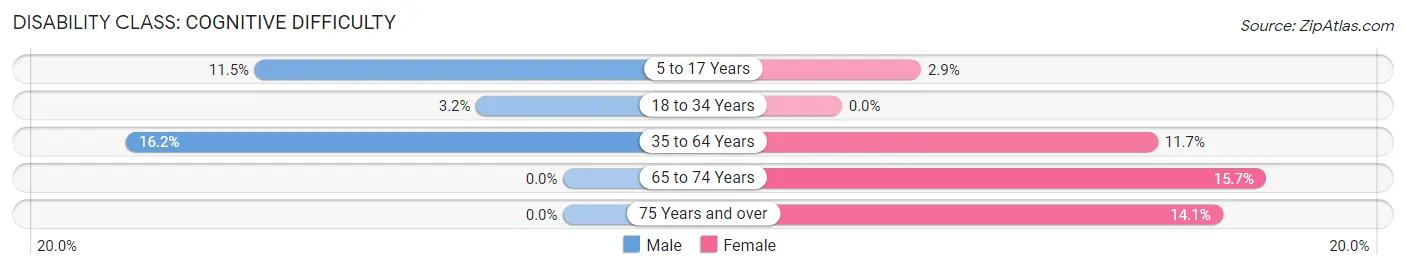
| Age Bracket | Male | Female |
| 5 to 17 Years | 41 (11.5%) | 8 (2.9%) |
| 18 to 34 Years | 10 (3.2%) | 0 (0.0%) |
| 35 to 64 Years | 75 (16.2%) | 63 (11.7%) |
| 65 to 74 Years | 0 (0.0%) | 31 (15.7%) |
| 75 Years and over | 0 (0.0%) | 13 (14.1%) |
Disability Class: Ambulatory Difficulty
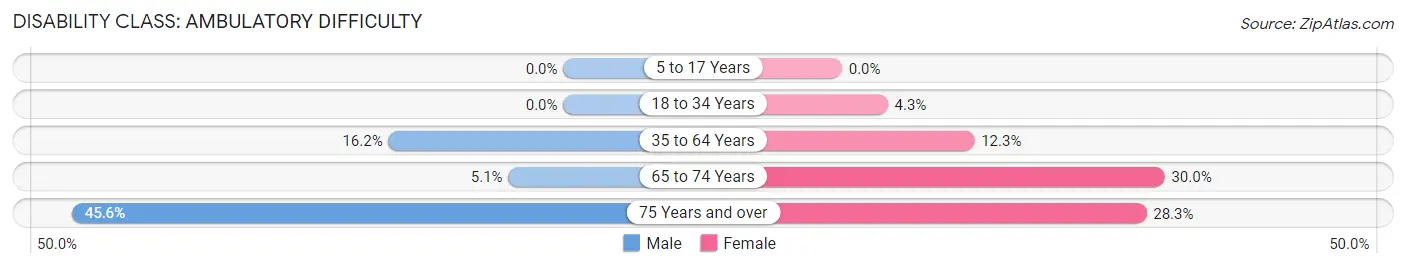
| Age Bracket | Male | Female |
| 5 to 17 Years | 0 (0.0%) | 0 (0.0%) |
| 18 to 34 Years | 0 (0.0%) | 17 (4.3%) |
| 35 to 64 Years | 75 (16.2%) | 66 (12.3%) |
| 65 to 74 Years | 5 (5.1%) | 59 (29.9%) |
| 75 Years and over | 26 (45.6%) | 26 (28.3%) |
Disability Class: Self-Care Difficulty
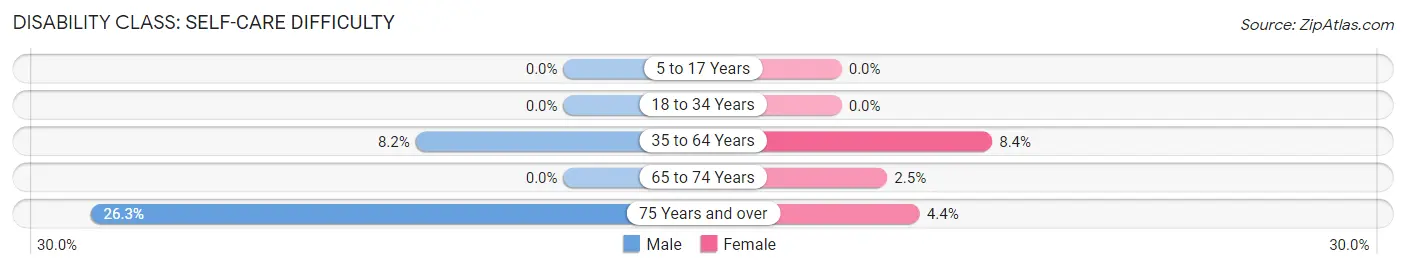
| Age Bracket | Male | Female |
| 5 to 17 Years | 0 (0.0%) | 0 (0.0%) |
| 18 to 34 Years | 0 (0.0%) | 0 (0.0%) |
| 35 to 64 Years | 38 (8.2%) | 45 (8.4%) |
| 65 to 74 Years | 0 (0.0%) | 5 (2.5%) |
| 75 Years and over | 15 (26.3%) | 4 (4.3%) |
Technology Access in Woodville
Computing Device Access in Woodville
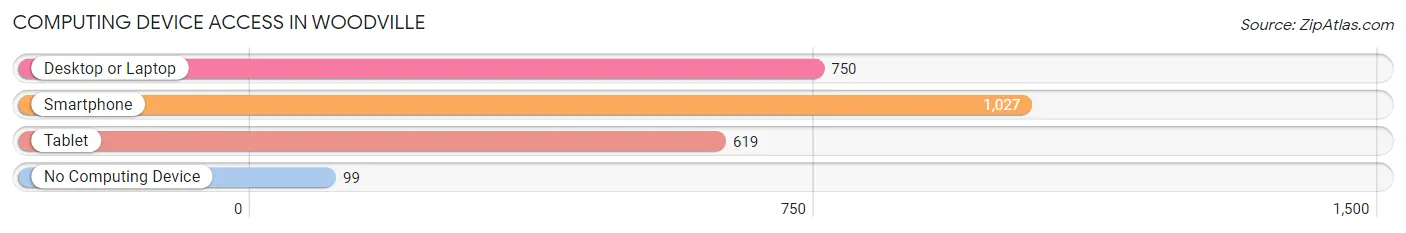
| Device Type | # Households | % Households |
| Desktop or Laptop | 750 | 61.6% |
| Smartphone | 1,027 | 84.3% |
| Tablet | 619 | 50.8% |
| No Computing Device | 99 | 8.1% |
| Total | 1,218 | 100.0% |
Internet Access in Woodville
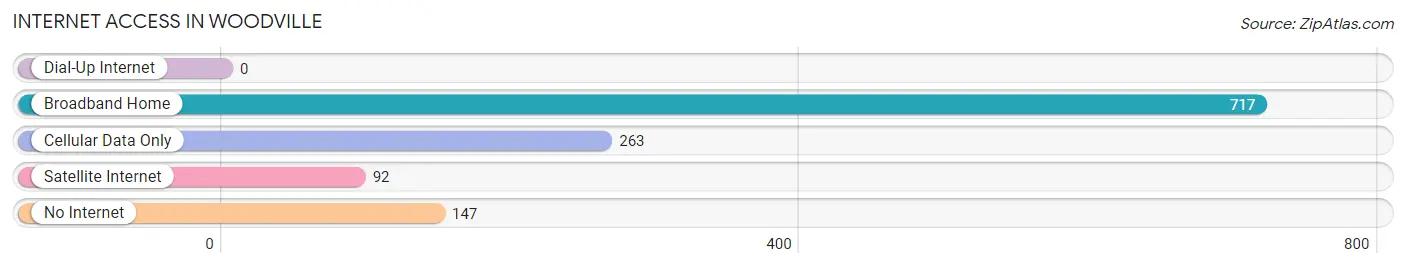
| Internet Type | # Households | % Households |
| Dial-Up Internet | 0 | 0.0% |
| Broadband Home | 717 | 58.9% |
| Cellular Data Only | 263 | 21.6% |
| Satellite Internet | 92 | 7.5% |
| No Internet | 147 | 12.1% |
| Total | 1,218 | 100.0% |
Woodville Summary
Woodville, Texas is a small town located in Tyler County, Texas. It is situated in the Piney Woods region of East Texas, approximately 100 miles northeast of Houston. The town was founded in 1846 and is the county seat of Tyler County. As of the 2010 census, the population of Woodville was 2,496.
History
Woodville was founded in 1846 by a group of settlers from Alabama and Mississippi. The town was named after the local timber industry, which was the main source of income for the early settlers. The town was incorporated in 1854 and quickly became a center of commerce for the surrounding area.
In the late 19th century, Woodville was a major stop on the Texas and New Orleans Railroad. This allowed the town to become a major shipping center for the region. The railroad also brought new settlers to the area, and the population of Woodville grew rapidly.
In the early 20th century, Woodville was a major center of the timber industry. The town was home to several sawmills and lumber companies, and the local economy was heavily dependent on the timber industry.
Geography
Woodville is located in Tyler County, Texas, approximately 100 miles northeast of Houston. The town is situated in the Piney Woods region of East Texas, and is surrounded by dense forests and rolling hills. The town is located at the intersection of State Highway 69 and U.S. Highway 190.
The climate in Woodville is humid subtropical, with hot summers and mild winters. The average annual temperature is 68°F, and the average annual precipitation is 45 inches.
Economy
The economy of Woodville is largely based on the timber industry. The town is home to several sawmills and lumber companies, and the local economy is heavily dependent on the timber industry.
In addition to the timber industry, Woodville is also home to several small businesses, including restaurants, retail stores, and service providers. The town is also home to a small manufacturing sector, which produces a variety of products, including furniture, clothing, and electronics.
Demographics
As of the 2010 census, the population of Woodville was 2,496. The racial makeup of the town was 79.3% White, 17.2% African American, 0.7% Native American, 0.3% Asian, 0.1% Pacific Islander, and 2.4% from other races. The median household income was $31,250, and the median family income was $37,500.
Conclusion
Woodville, Texas is a small town located in Tyler County, Texas. It is situated in the Piney Woods region of East Texas, approximately 100 miles northeast of Houston. The town was founded in 1846 and is the county seat of Tyler County. As of the 2010 census, the population of Woodville was 2,496. The economy of Woodville is largely based on the timber industry, and the town is also home to several small businesses. The racial makeup of the town was 79.3% White, 17.2% African American, 0.7% Native American, 0.3% Asian, 0.1% Pacific Islander, and 2.4% from other races. The median household income was $31,250, and the median family income was $37,500.
Common Questions
What is Per Capita Income in Woodville?
Per Capita income in Woodville is $58,392.
What is the Median Family Income in Woodville?
Median Family Income in Woodville is $62,321.
What is the Median Household income in Woodville?
Median Household Income in Woodville is $42,778.
What is Income or Wage Gap in Woodville?
Income or Wage Gap in Woodville is 55.3%.
Women in Woodville earn 44.7 cents for every dollar earned by a man.
What is Inequality or Gini Index in Woodville?
Inequality or Gini Index in Woodville is 0.73.
What is the Total Population of Woodville?
Total Population of Woodville is 3,081.
What is the Total Male Population of Woodville?
Total Male Population of Woodville is 1,393.
What is the Total Female Population of Woodville?
Total Female Population of Woodville is 1,688.
What is the Ratio of Males per 100 Females in Woodville?
There are 82.52 Males per 100 Females in Woodville.
What is the Ratio of Females per 100 Males in Woodville?
There are 121.18 Females per 100 Males in Woodville.
What is the Median Population Age in Woodville?
Median Population Age in Woodville is 37.0 Years.
What is the Average Family Size in Woodville
Average Family Size in Woodville is 2.9 People.
What is the Average Household Size in Woodville
Average Household Size in Woodville is 2.4 People.
How Large is the Labor Force in Woodville?
There are 1,441 People in the Labor Forcein in Woodville.
What is the Percentage of People in the Labor Force in Woodville?
59.7% of People are in the Labor Force in Woodville.
What is the Unemployment Rate in Woodville?
Unemployment Rate in Woodville is 7.9%.